Substrate Influences Temperature Sensitivity of Dissolved Organic Carbon (DOC) and Nitrogen (DON) Mineralization in Arid Agricultural Soils


Abstract
1. Introduction
2. Material and Methods
2.1. Soil and Water Sampling
2.2. General Soil and Water Characterization
2.3. Soil Phospholipid Fatty Acid (PLFA) Microbial Community Structure
2.4. Rate of 14C-Labelled Substrate Mineralization in Soil
2.5. Effects of Temperature on 14C Mineralization Rate
2.6. Statistical Analysis
3. Results
3.1. General Physical and Chemical Irrigation Water and Soil Properties
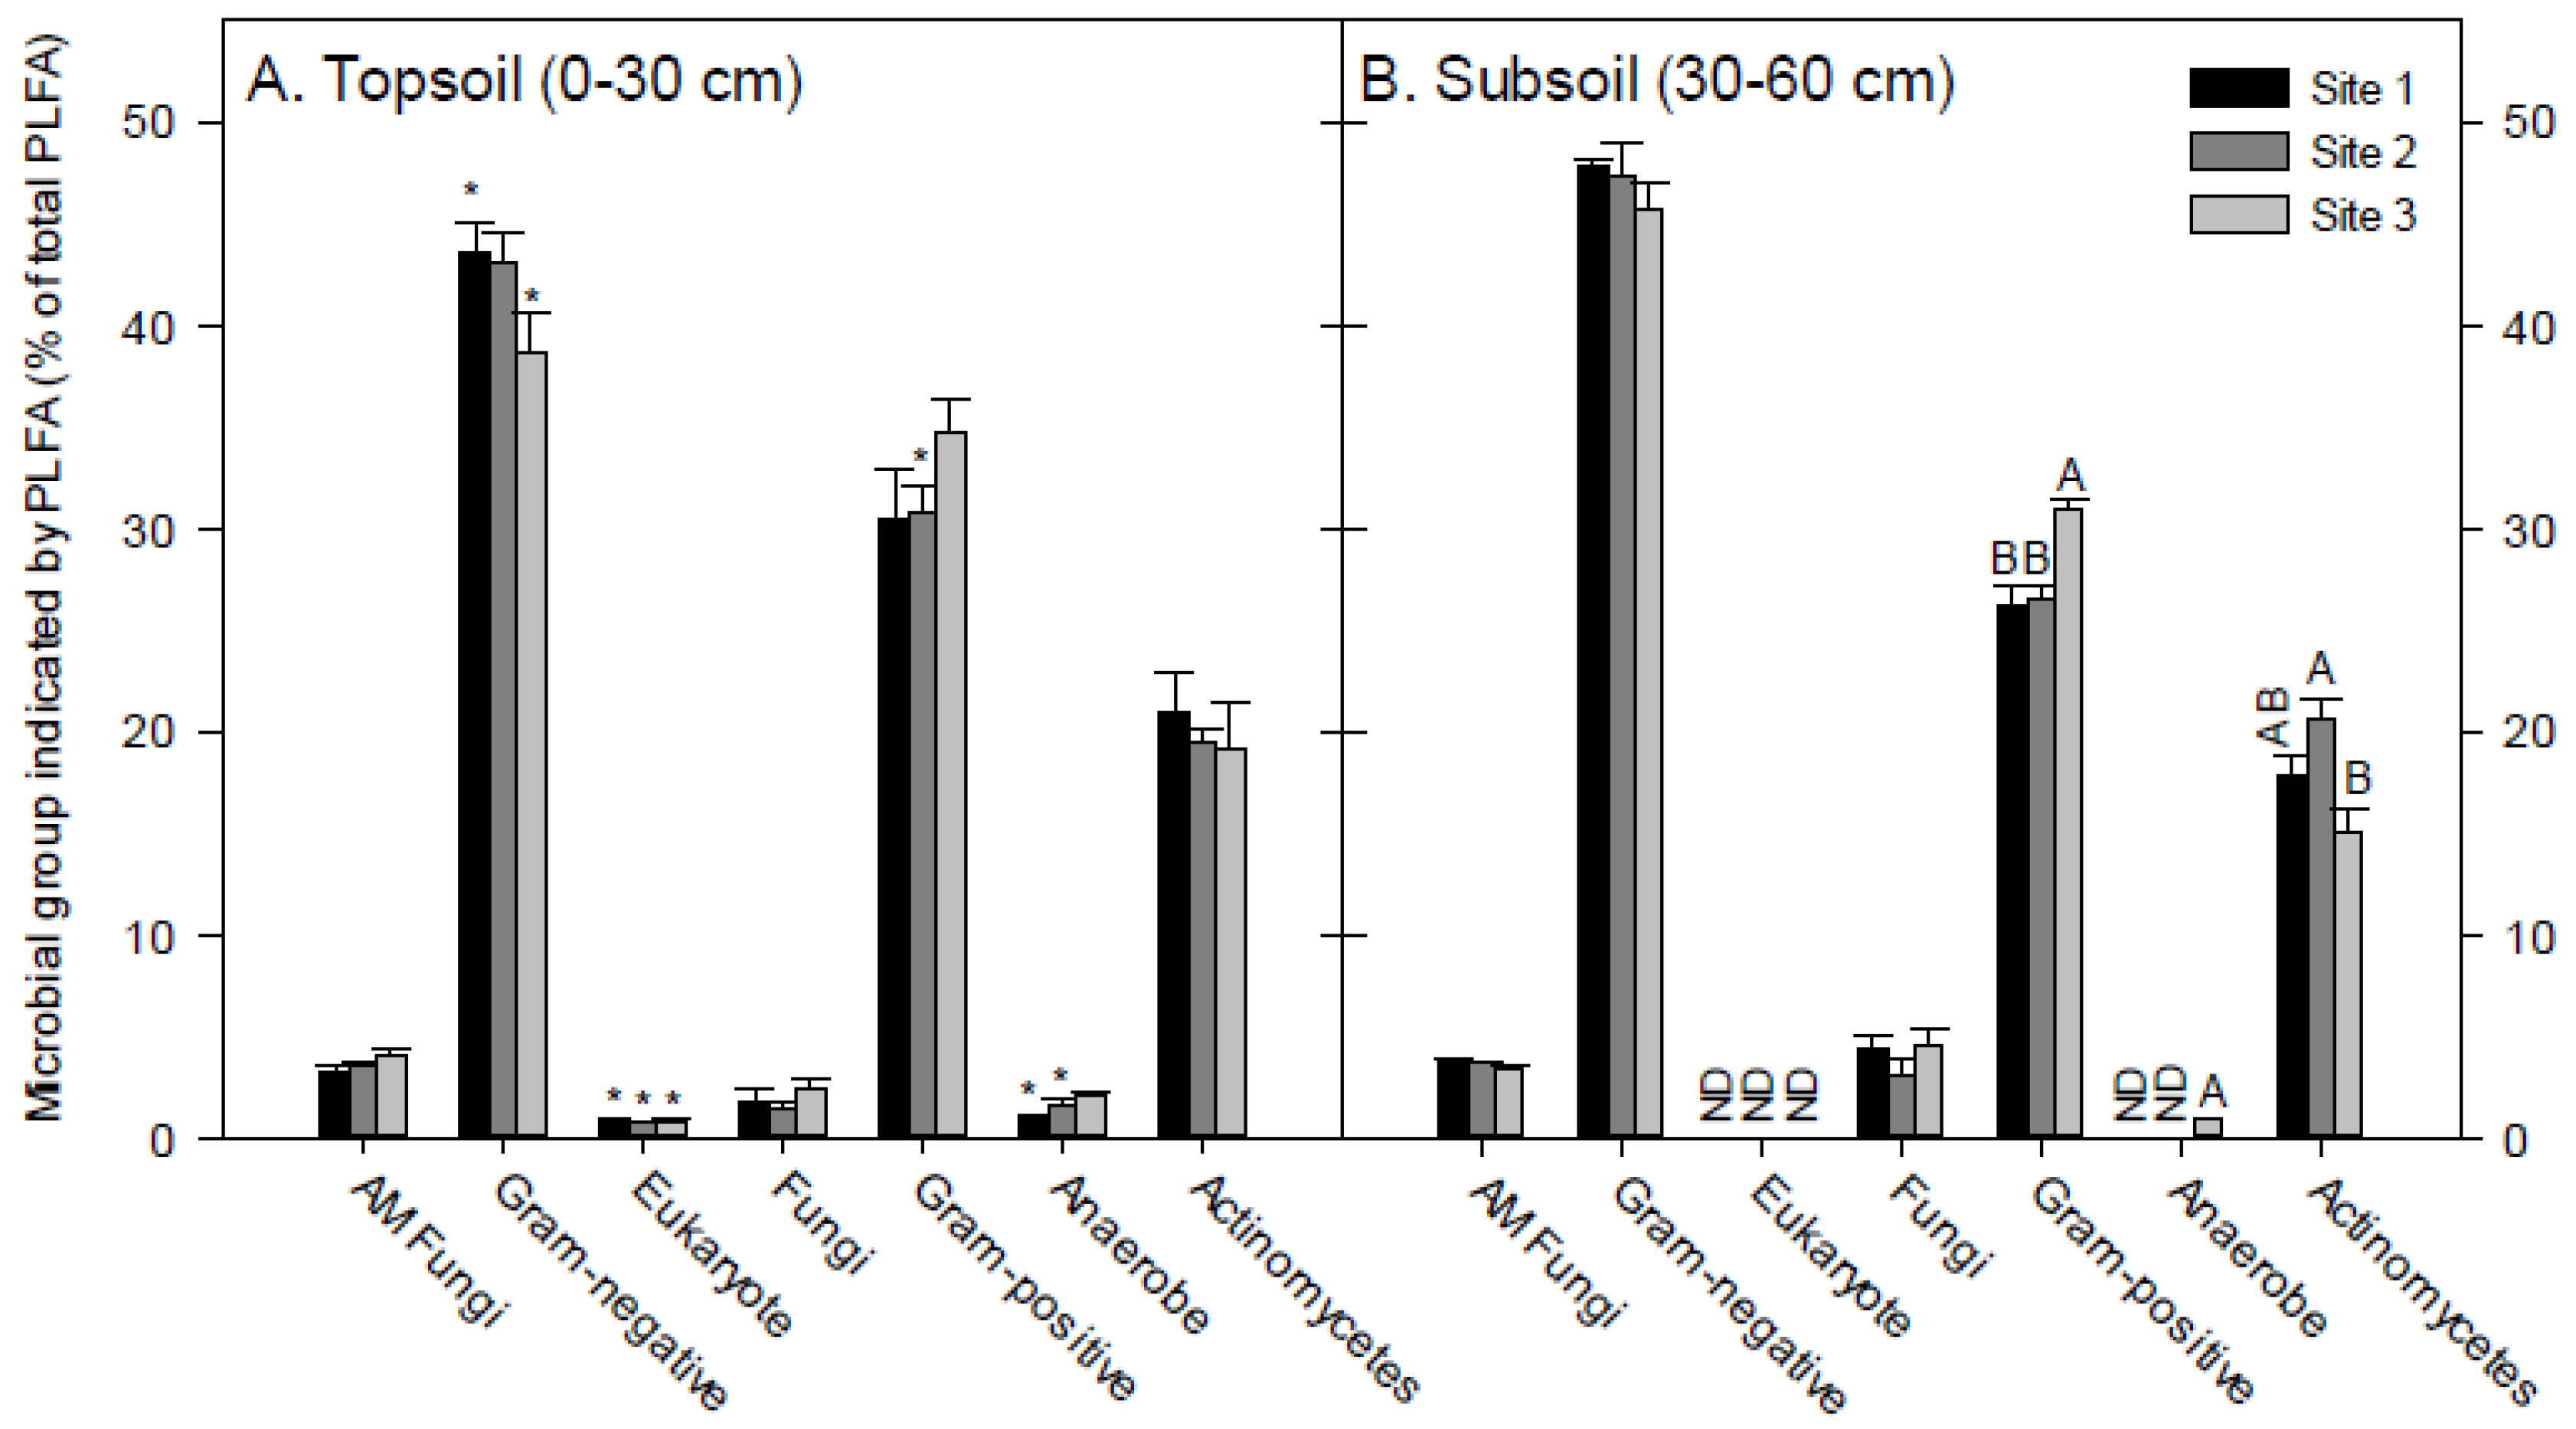
3.2. Soil PLFA Microbial Community Structure
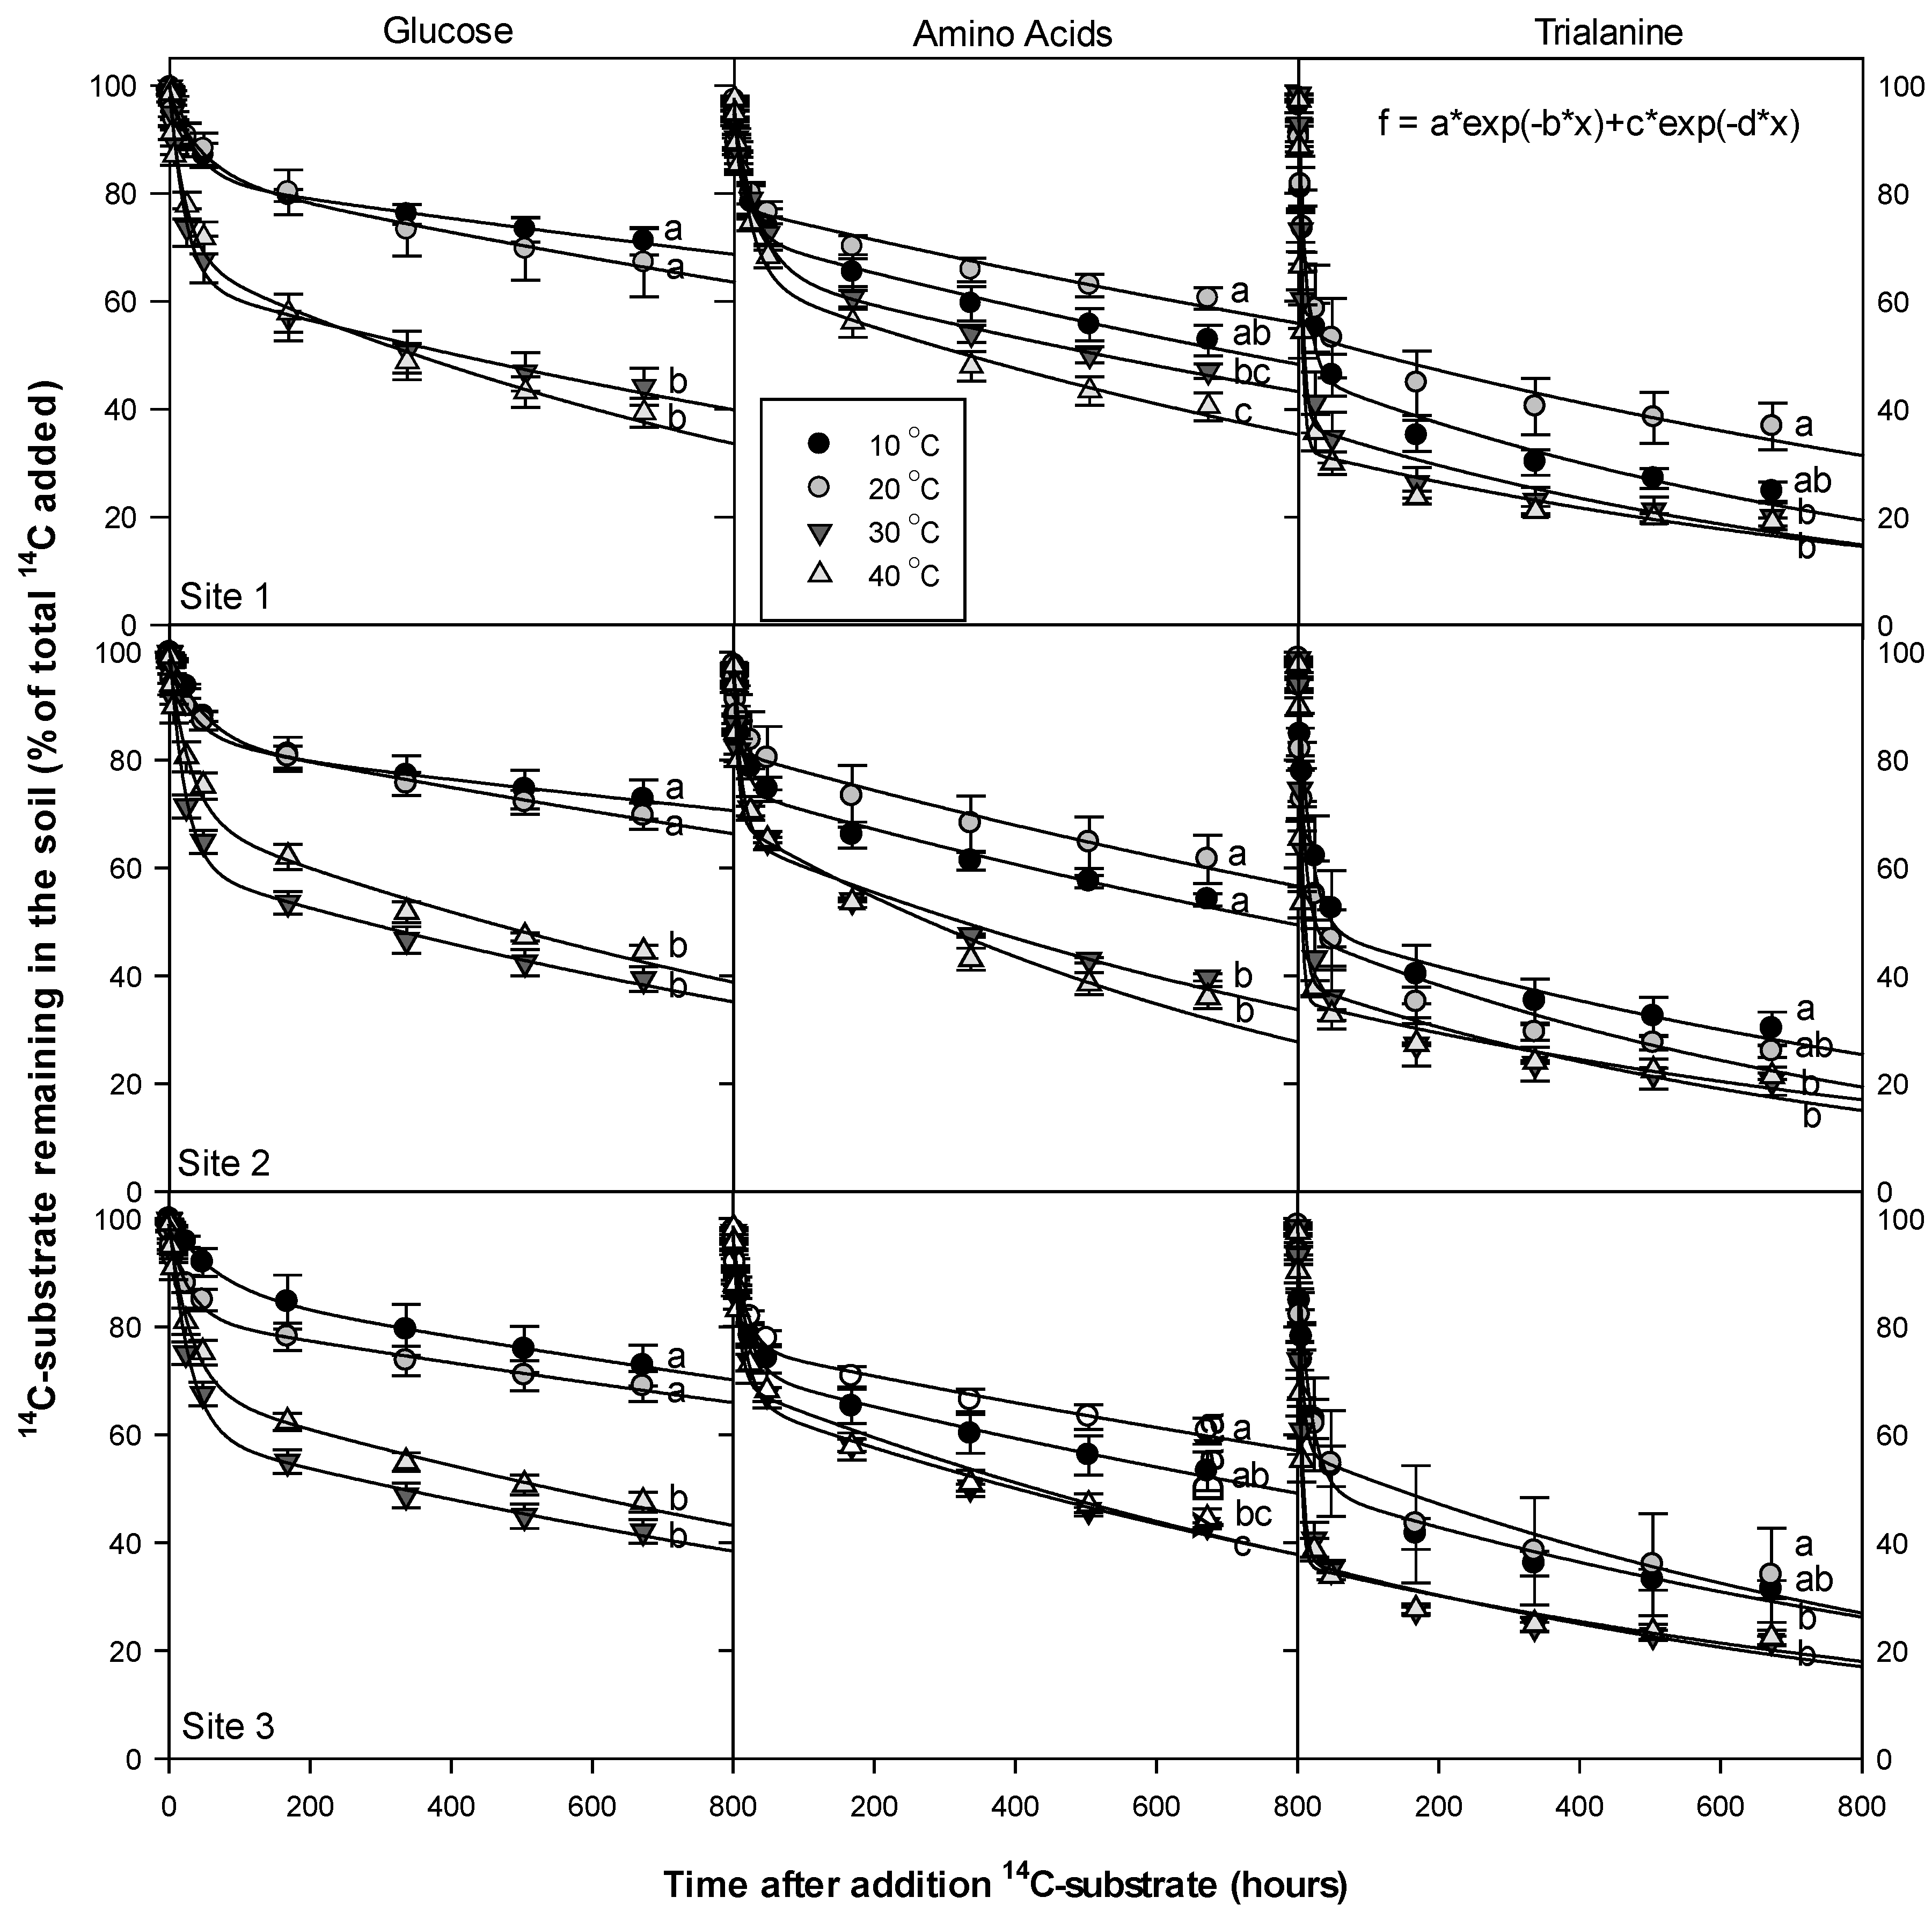
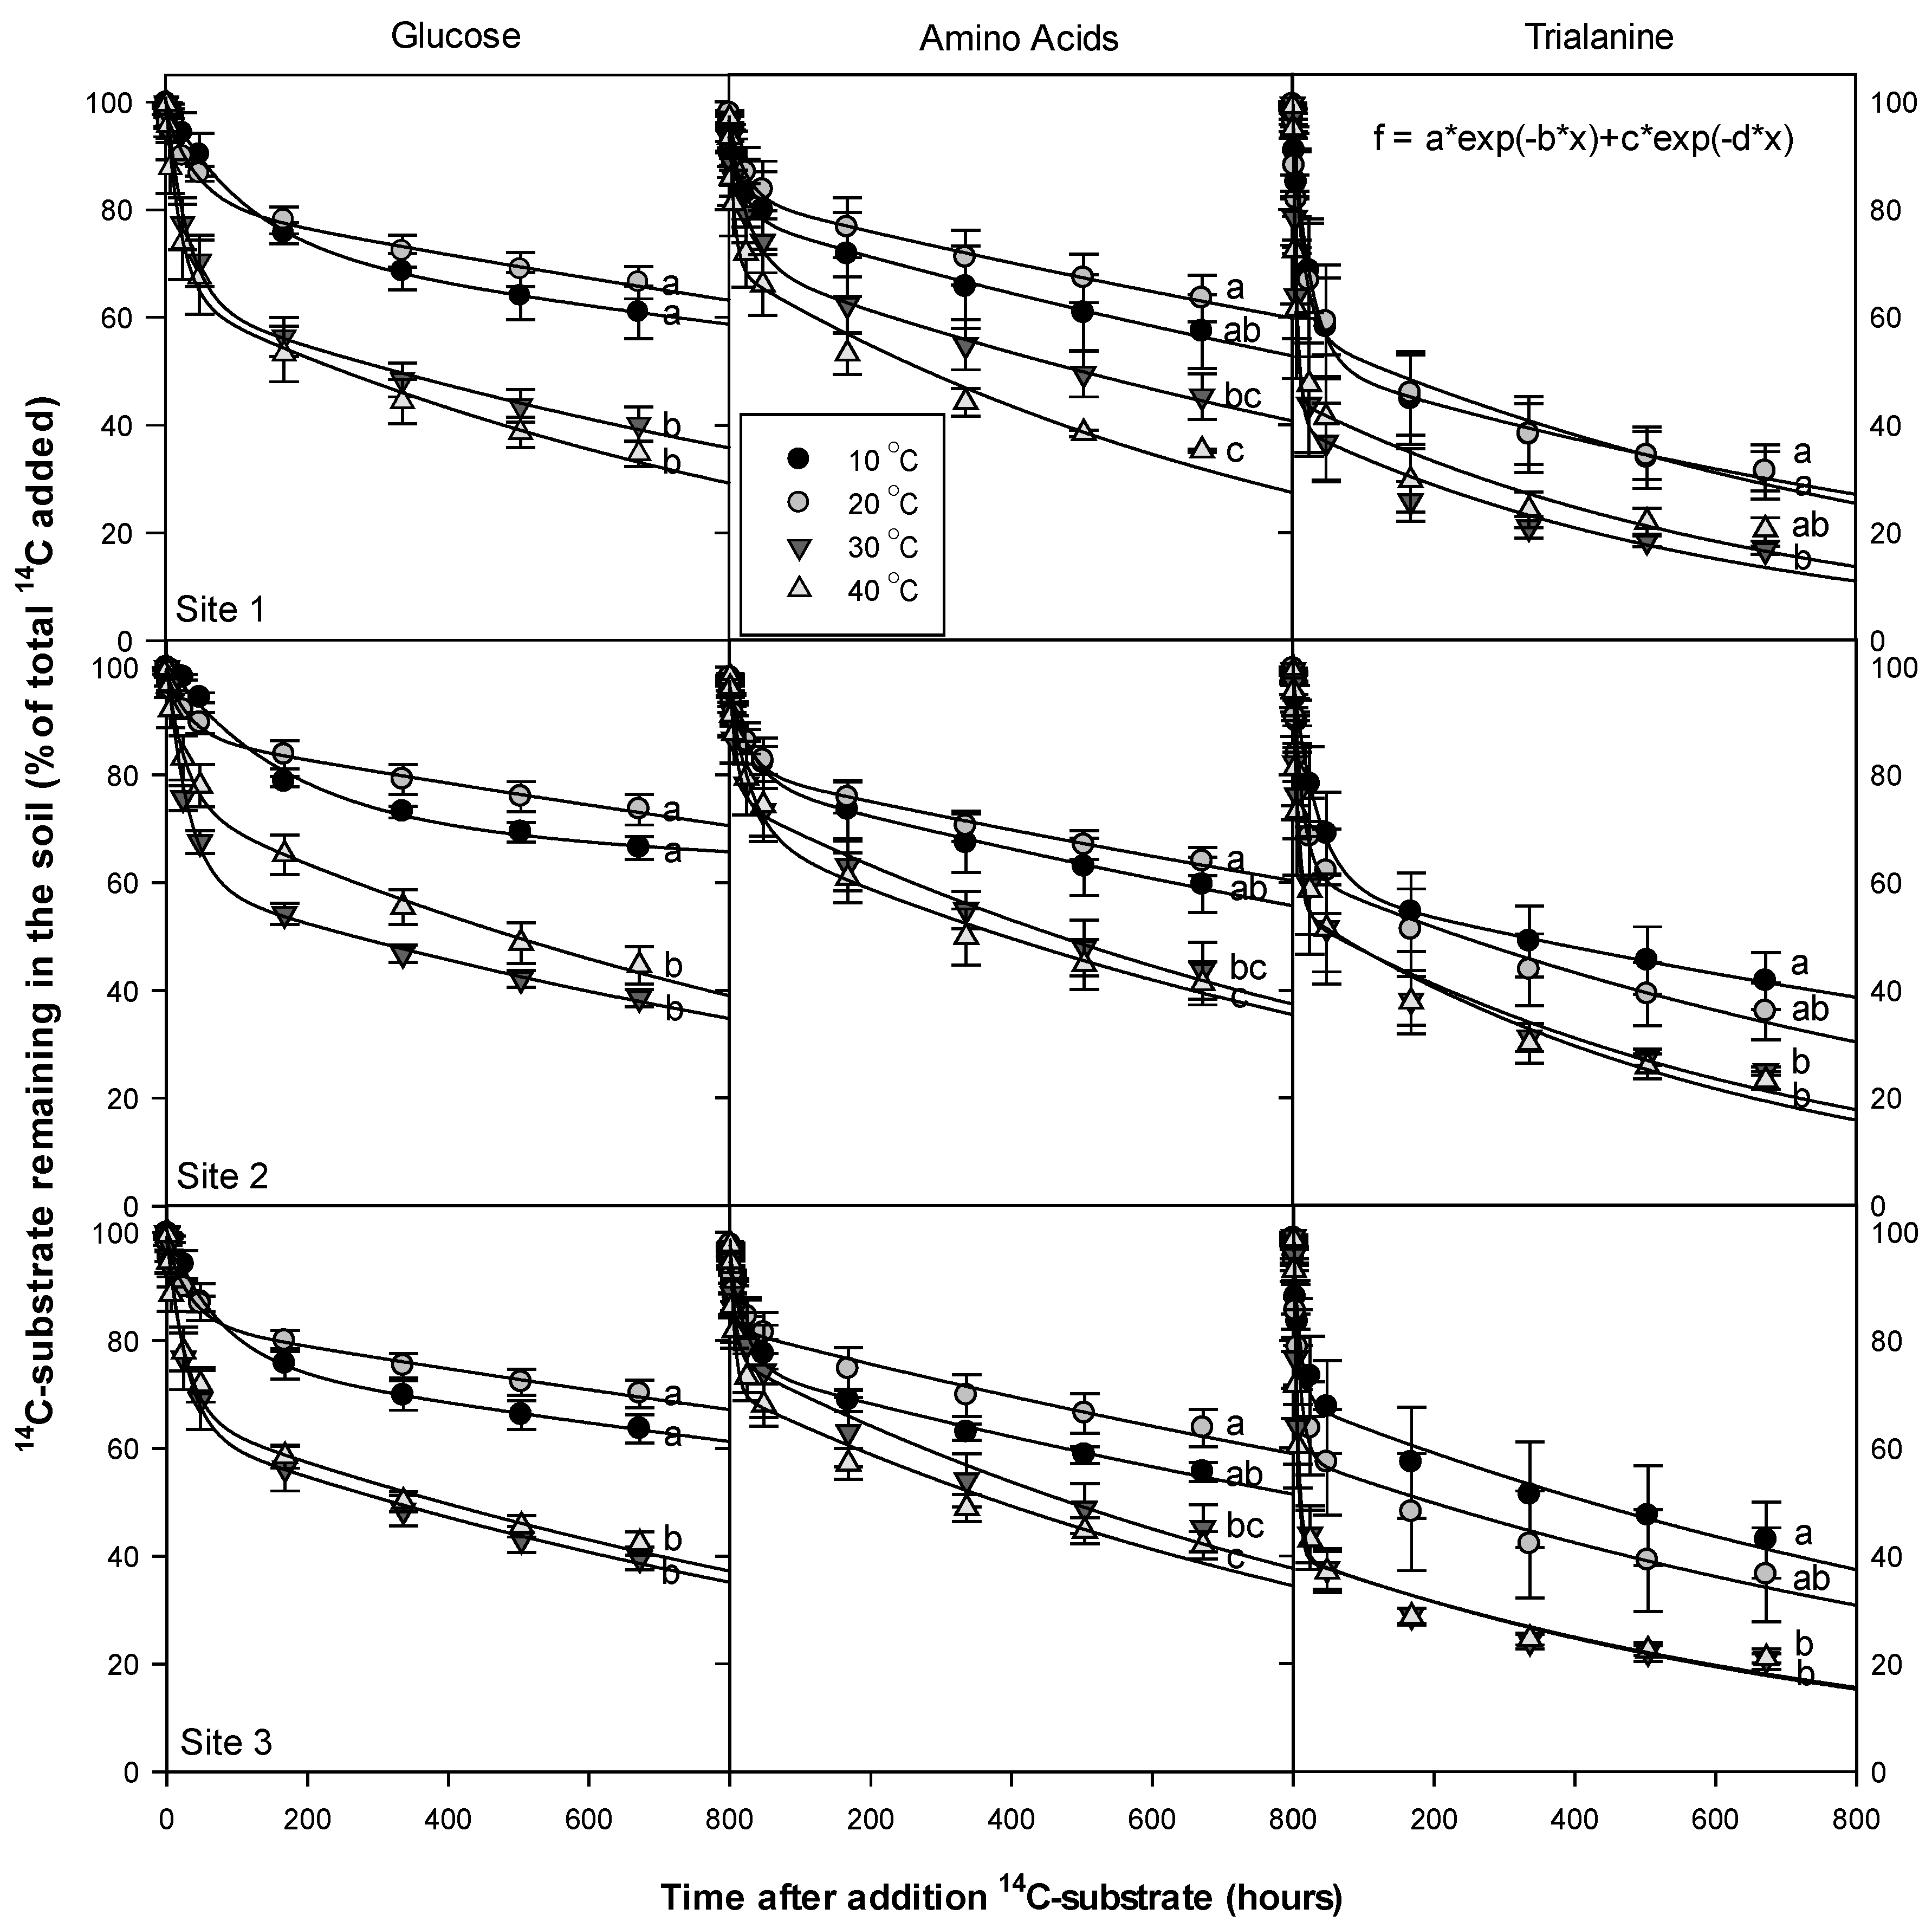
3.3. Dissolved Organic Nitrogen (DON) Compounds’ Mineralization and Half-Life
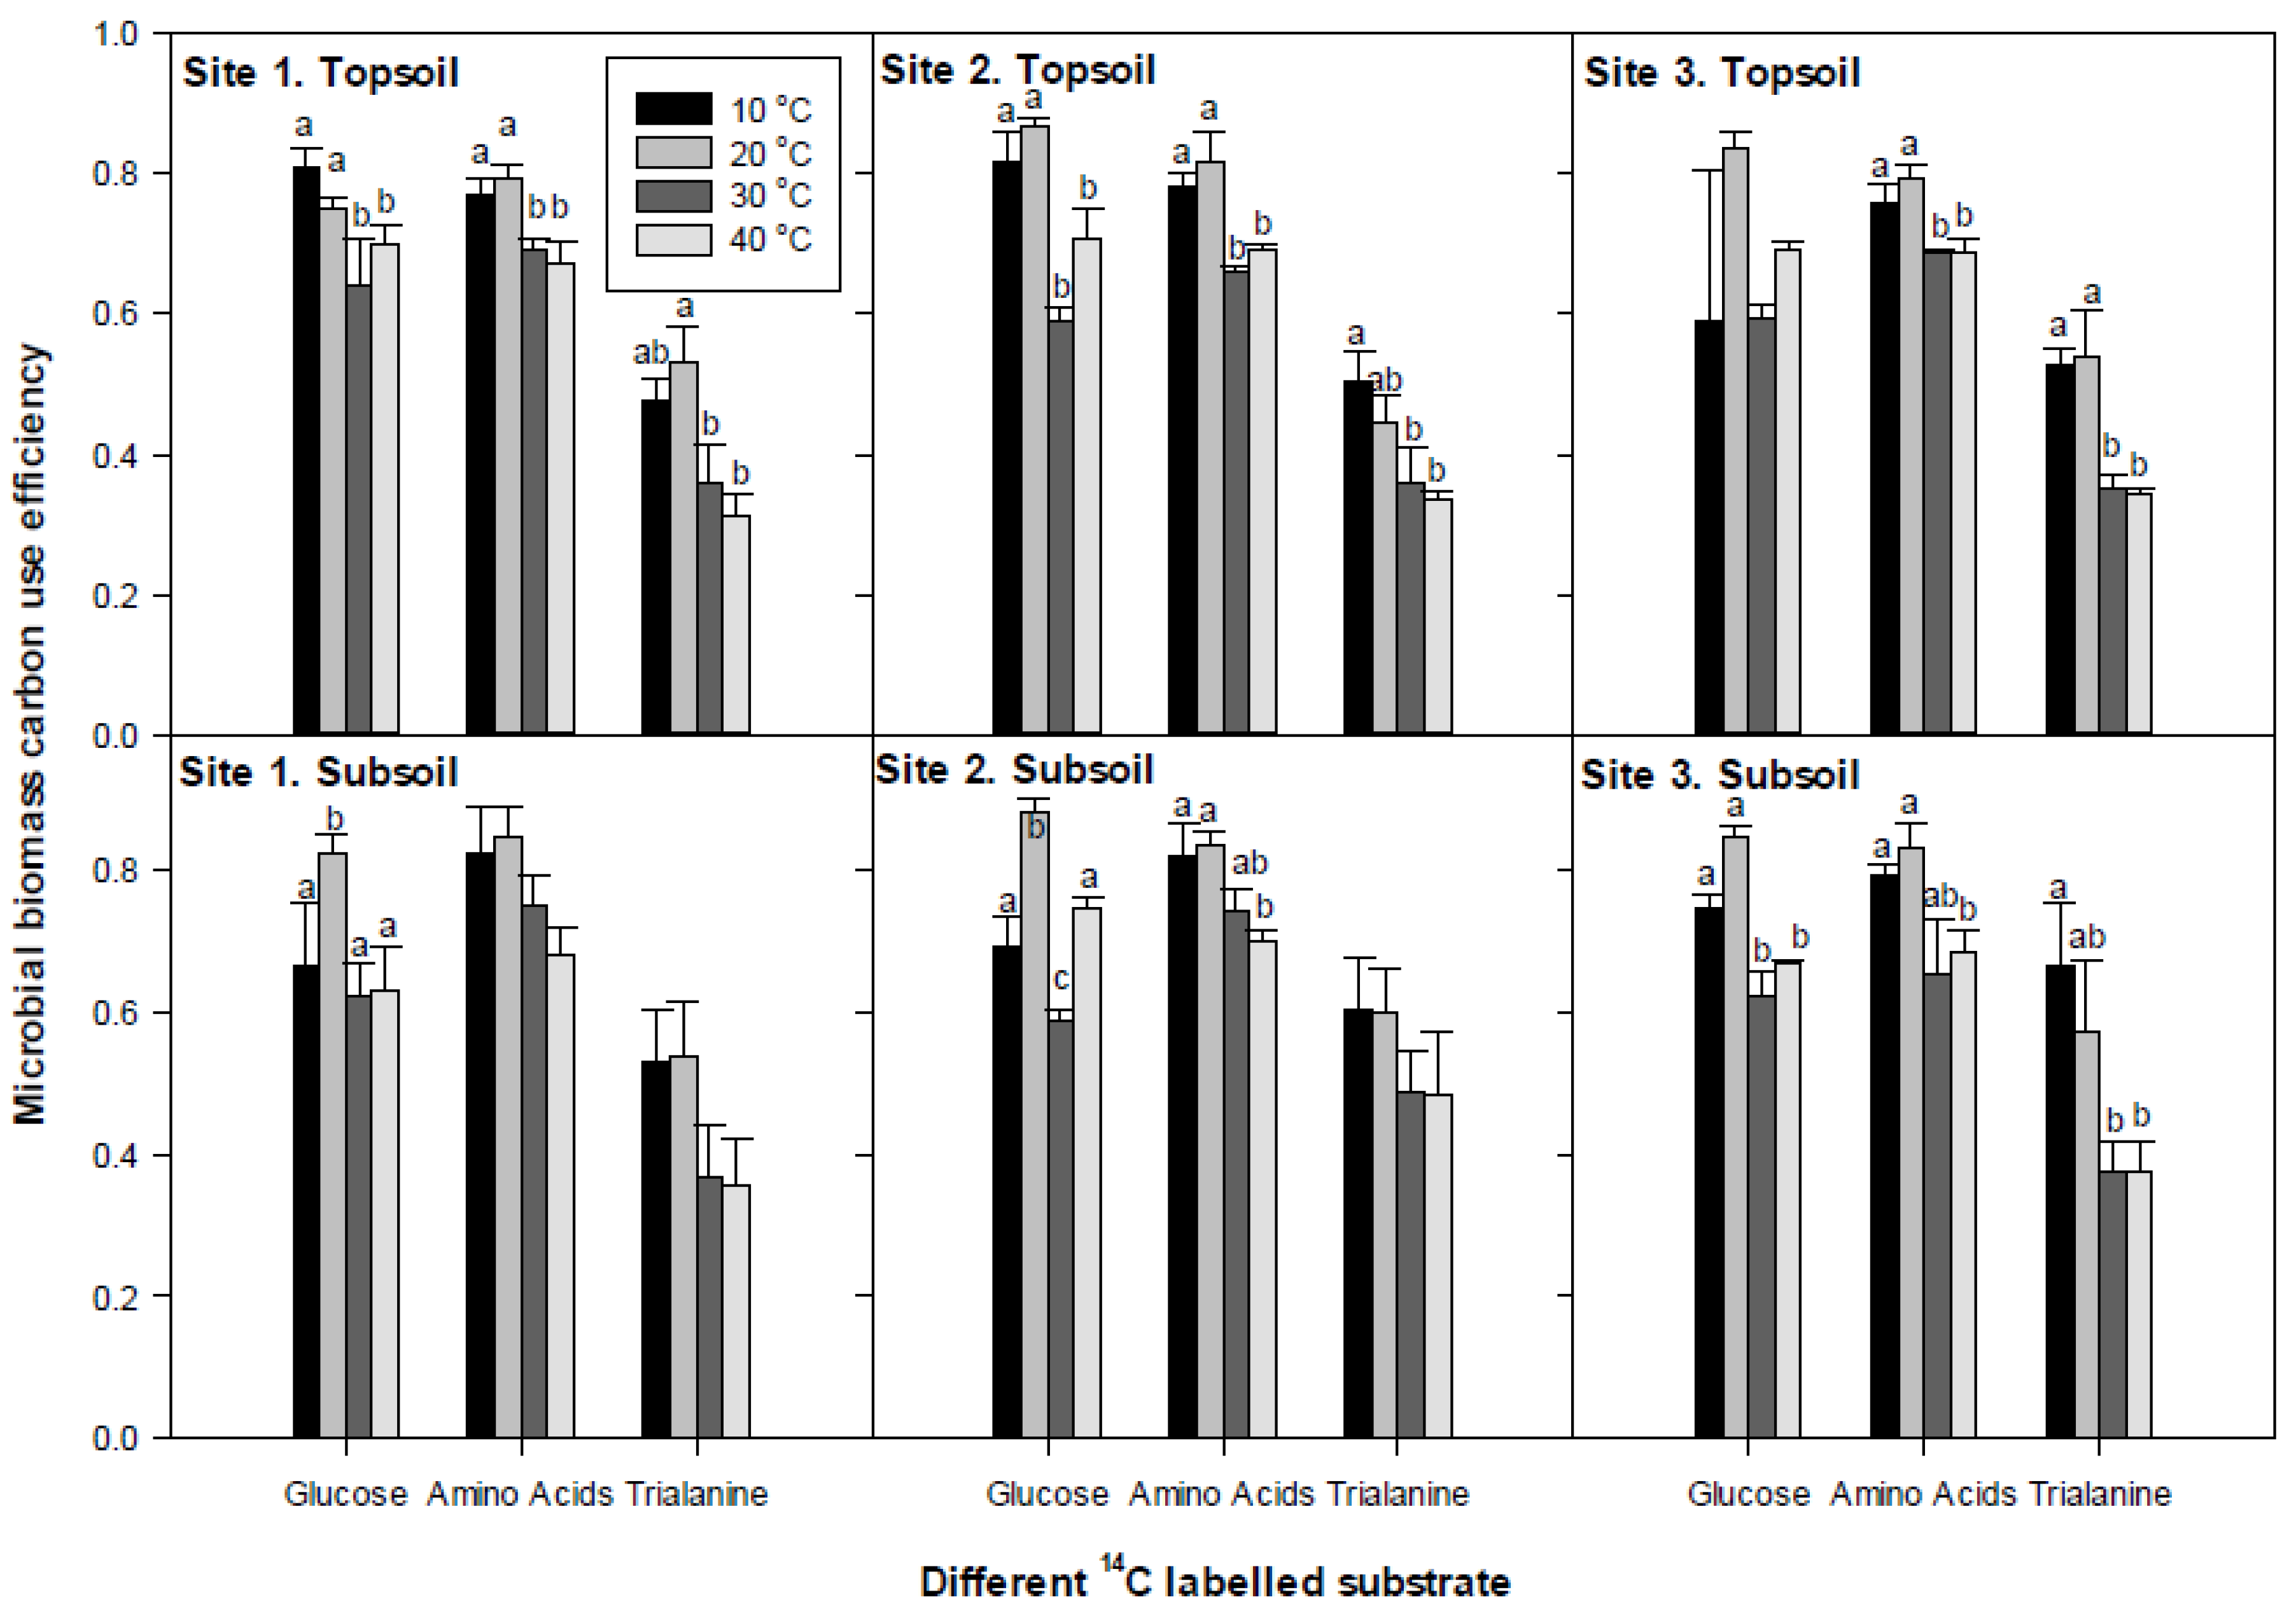
3.4. Microbial Substrate-C Use Efficiency
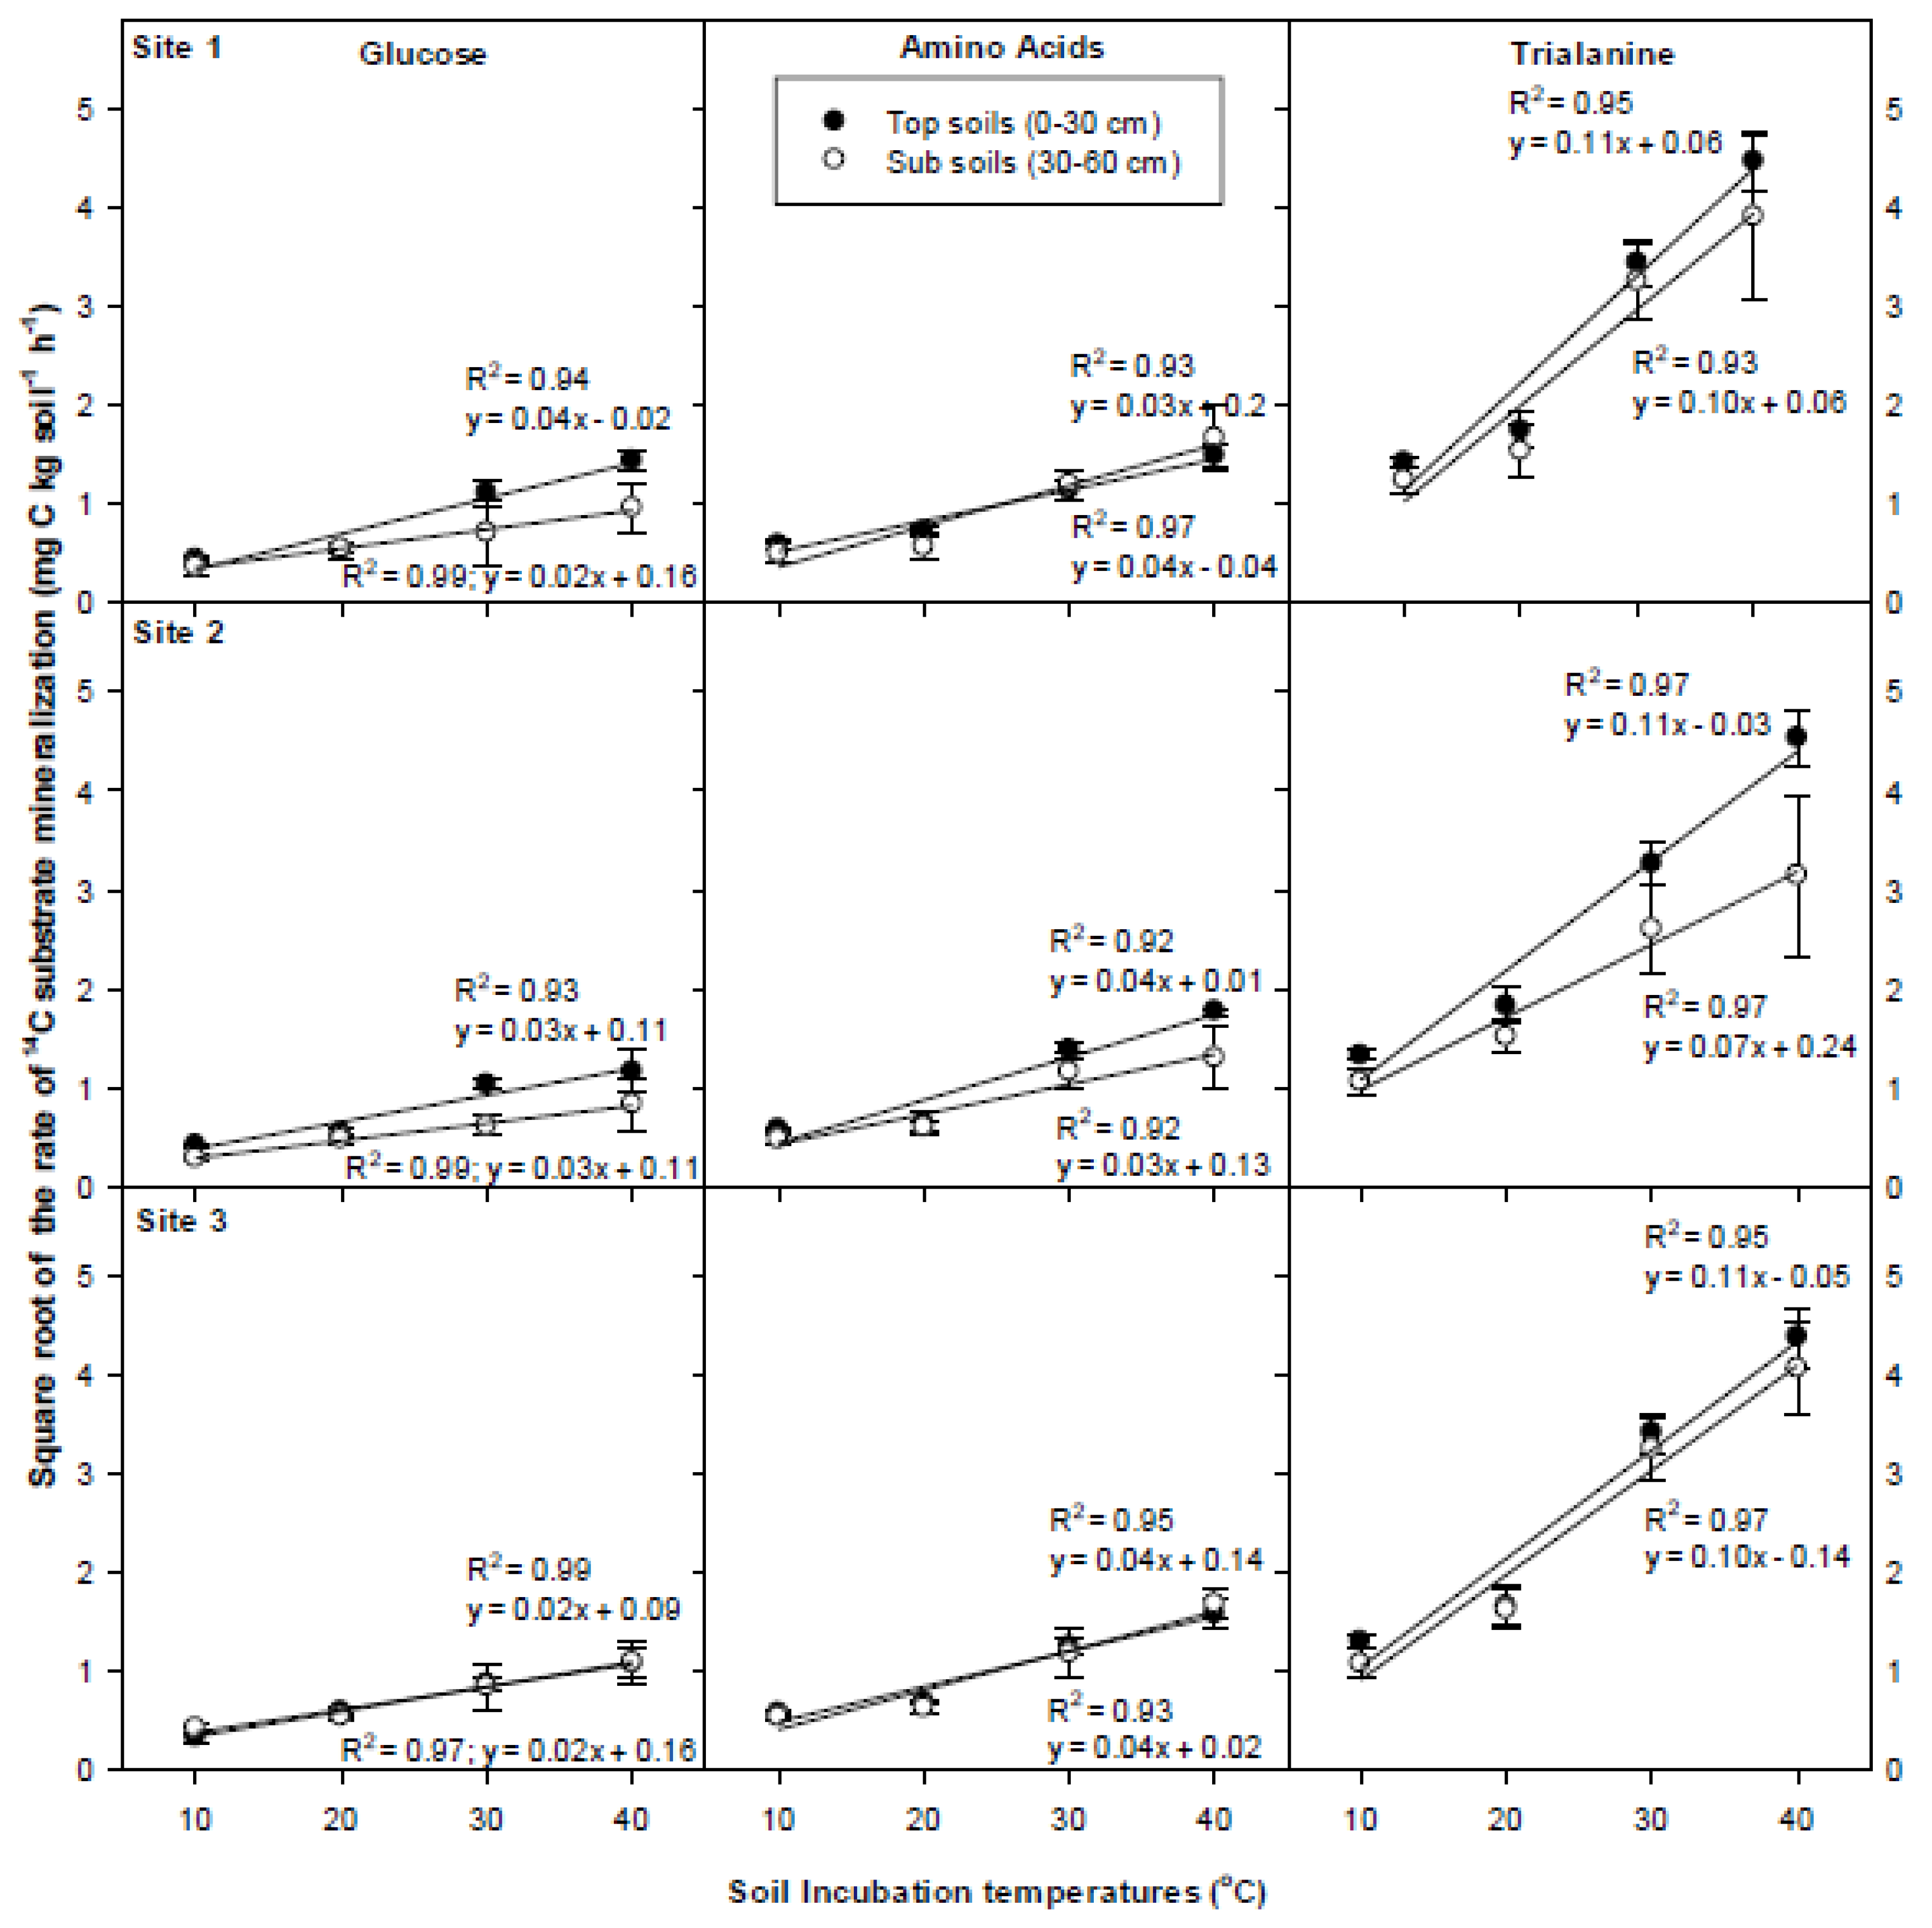
3.5. Temperature Dependency of 14C Respiration Rate
4. Discussion
4.1. DON Compounds Mineralization and Half-Life
4.2. Microbial Biomass C-Use Efficiency (Miceff)
4.3. Temperature Dependency of 14C Respiration Rate
5. Conclusions
Supplementary Materials
Author Contributions
Acknowledgments
Conflicts of Interest
References
- Al-Rawahi, M.N.; Brinkmann, K.; Schlecht, E.; Buerkert, A. Effects of changing water availability on land use in irrigated mountain oases of Al Jabal Al Akhdar, northern Oman. DIE ERDE J. Geogr. Soc. Berl. 2014, 145, 197–211. [Google Scholar] [CrossRef]
- Asano, T.; Levine, A.D. Wastewater reclamation, recycling and reuse: Past, present, and future. Water Sci. Technol. 1996, 33, 1–14. [Google Scholar]
- Pedrero, F.; Kalavrouziotis, I.; Alarcón, J.J.; Koukoulakis, P.; Asano, T. Use of treated municipal wastewater in irrigated agriculture—Review of some practices in Spain and Greece. Agric. Water Manag. 2010, 97, 1233–1241. [Google Scholar] [CrossRef]
- Hussain, G.; Al-Saati, A.J. Wastewater quality and its reuse in agriculture in Saudi Arabia. Desalination 1999, 123, 241–251. [Google Scholar] [CrossRef]
- Al-Kuwaiti, K.A. Efforts Drainage and Irrigation Authority and its Plans to Provide Irrigation Water from Different Sources (in Arabic); Ministry of Agriculture, Al-Hassa Irrigation and Drainage Authority: Al-Ahsa, Saudi Arabia, 2010.
- Aldakheel, Y.Y. Assessing NDVI Spatial Pattern as Related to Irrigation and Soil Salinity Management in Al-Hassa Oasis, Saudi Arabia. J. Indian Soc. Remote Sens. 2011, 39, 171–180. [Google Scholar] [CrossRef]
- Buerkert, A.; Nagieb, M.; Siebert, S.; Khan, I.; Al-Maskri, A. Nutrient cycling and field-based partial nutrient balances in two mountain oases of Oman. Field Crops Res. 2005, 94, 149–164. [Google Scholar] [CrossRef]
- Yang, R.; Su, Y.; Yang, Q. Crop Yields and Soil Nutrients in Response to Long-Term Fertilization in a Desert Oasis. Agron. J. 2015, 107, 83–92. [Google Scholar] [CrossRef]
- Farrell, M.; Hill, P.W.; Farrar, J.; DeLuca, T.H.; Roberts, P.; Kielland, K.; Dahlgren, R.; Murphy, D.V.; Hobbs, P.J.; Bardgett, R.D.; et al. Oligopeptides Represent a Preferred Source of Organic N Uptake: A Global Phenomenon? Ecosystems 2013, 16, 133–145. [Google Scholar] [CrossRef]
- Hill, P.W.; Farrar, J.; Roberts, P.; Farrell, M.; Grant, H.; Newsham, K.K.; Hopkins, D.W.; Bardgett, R.D.; Jones, D.L. Vascular plant success in a warming Antarctic may be due to efficient nitrogen acquisition. Nat. Clim. Chang. 2011, 1, 50–53. [Google Scholar] [CrossRef]
- Hill, P.W.; Marsden, K.A.; Jones, D.L. How significant to plant N nutrition is the direct consumption of soil microbes by roots? New Phytol. 2013, 199, 948–955. [Google Scholar] [CrossRef] [PubMed]
- Jones, D.L.; Farrar, J.F.; Macdonald, A.J.; Kemmitt, S.J.; Murphy, D.V. Dissolved Organic Nitrogen and Mechanisms of Its Uptake by Plants in Agricultural Systems. In Quantifying and Understanding Plant Nitrogen Uptake for Systems Modeling; Liwang, M., Ahuja, L.R., Bruulsema, T., Eds.; CRC Press Taylor and Francis Group: Boca Raton, FL, USA, 2008; pp. 95–126. [Google Scholar]
- Javid, M.; Bahramifar, N.; Younesi, H.; Taghavi, S.M.; Givehchi, R. Dry deposition, seasonal variation and source interpretation of ionic species at Abali, Firouzkouh and Varamin, Tehran Province, Iran. Atmos. Res. 2015, 157, 74–90. [Google Scholar] [CrossRef]
- Li, C.; Li, Y.; Tang, L. The effects of long-term fertilization on the accumulation of organic carbon in the deep soil profile of an oasis farmland. Plant Soil 2013, 369, 645–656. [Google Scholar] [CrossRef]
- Jones, D.L.; Nguyen, C.; Finlay, R.D. Carbon flow in the rhizosphere: Carbon trading at the soil-root interface. Plant Soil 2009, 321, 5–33. [Google Scholar] [CrossRef]
- Ferguson, S.D.; Nowak, R.S. Transitory effects of elevated atmospheric CO2 on fine root dynamics in an arid ecosystem do not increase long-term soil carbon input from fine root litter. New Phytol. 2011, 190, 953–967. [Google Scholar] [CrossRef] [PubMed]
- Sivakumar, M.V.K.; Ruane, A.C.; Camacho, J. Climate Change in the West Asia and North Africa Region. In Climate Change and Food Security in West Asia and North Africa; Springer: Dordrecht, The Netherlands, 2013; pp. 3–26. [Google Scholar]
- Chowdhury, S.; Al-Zahrani, M. Implications of Climate Change on Water Resources in Saudi Arabia. Arab. J. Sci. Eng. 2013, 38, 1959–1971. [Google Scholar] [CrossRef]
- Hijioka, Y.; Lin, E.; Pereira, J.J.; Corlett, R.T.; Cui, X.; Insarov, G.E.; Lasco, R.D.; Lindgren, E.; Surjan, A. Asia. In Climate Change 2014: Impacts, Adaptation, and Vulnerability. Part B: Regional Aspects. Contribution of Working Group II to the Fifth Assessment Report of the Intergovernmental Panel on Climate Change; Field, C.B., V.R. Barros, D.J., Dokken, K.J., Mach, M.D., Mastrandrea, T.E., Bilir, M., Chatterjee, K.L., Ebi, Y.O., Estrada, R.C., Genova, B., et al., Eds.; Cambridge University Press: Cambridge, UK; New York, NY, USA, 2014. [Google Scholar]
- Christou, M.; Avramides, E.J.; Jones, D.L. Dissolved organic nitrogen dynamics in a Mediterranean vineyard soil. Soil Biol. Biochem. 2006, 38, 2265–2277. [Google Scholar] [CrossRef]
- Ge, T.D.; Huang, D.F.; Roberts, P.; Jones, D.L.; Song, S.W. Dynamics of Nitrogen Speciation in Horticultural Soils in Suburbs of Shanghai, China. Pedosphere 2010, 20, 261–272. [Google Scholar] [CrossRef]
- Boddy, E.; Hill, P.W.; Farrar, J.; Jones, D.L. Fast turnover of low molecular weight components of the dissolved organic carbon pool of temperate grassland field soils. Soil Biol. Biochem. 2007, 39, 827–835. [Google Scholar] [CrossRef]
- Roberts, P.; Jones, D.L. Microbial and plant uptake of free amino sugars in grassland soils. Soil Biol. Biochem. 2012, 49, 139–149. [Google Scholar] [CrossRef]
- Li, J.; Li, Z.; Wang, F.; Zou, B.; Chen, Y.; Zhao, J.; Mo, Q.; Li, Y.; Li, X.; Xia, H. Effects of nitrogen and phosphorus addition on soil microbial community in a secondary tropical forest of China. Biol. Fertil. Soils 2014, 51, 207–215. [Google Scholar] [CrossRef]
- Alkolibi, F. Possible effects of global warming on agriculture and water resources in Saudi Arabia: Impacts and responses. Clim. Chang. 2002, 54, 225–245. [Google Scholar] [CrossRef]
- Al-Fredan, M.A. Nitrogen Fixing Legumes in the Plant Communities. Am. J. Environ. Sci. 2011, 7, 166–172. [Google Scholar] [CrossRef]
- Bashour, I.; Sayegh, A. Methods of Analysis for Soils of Arid and Semi-Arid Regions; Food and Agriculture Organization of the United Nations: Rome, Italy, 2007; ISBN 978-95-5-105661-5. [Google Scholar]
- U.S. Environmental Protection Agency (EPA). Method 3051A: Microwave assisted acid digestion of sediments, sludges, soils, and oils. In Test Methods for Evaluating Solid Waste, Physical/Chemical Methods; EPA Publication SW-846 (3rd Edition–Final Update IV); 2007 ISBN Physical/Chemical Methods, SW-846; U.S. Environmental Protection Agency (EPA): Washington, DC, USA, 2007. [Google Scholar]
- Burden, A.; Garbutt, R.A.; Evans, C.D.; Jones, D.L.; Cooper, D.M. Carbon sequestration and biogeochemical cycling in a saltmarsh subject to coastal managed realignment. Estuar. Coast. Shelf Sci. 2013, 120, 12–20. [Google Scholar] [CrossRef]
- Murphy, J.; Riley, J.P. A Modified single solution method for the determination of phosphate in natural waters. Anal. Chim. Acta 1962, 27, 31–36. [Google Scholar] [CrossRef]
- Swain, T.; Hillis, W.E. The phenolic constituents of Prunus domestica. I.—The quantitative analysis of phenolic constituents. J. Sci. Food Agric. 1959, 10, 63–68. [Google Scholar] [CrossRef]
- Miranda, K.M.; Espey, M.G.; Wink, D.A. A Rapid, Simple Spectrophotometric Method for Simultaneous Detection of Nitrate and Nitrite. Nitric Oxide Biol. Chem. 2001, 5, 62–71. [Google Scholar] [CrossRef] [PubMed]
- Mulvaney, R.L. Nitrogen—Inorganic Forms. In Methods of Soil Analysis: Part 3: Chemical Methods; Sparks, D.L., Ed.; Soil Science Society of America, Inc., American Society of Agronomy, Inc.: Madison, WI, USA, 1996; pp. 1123–1184. [Google Scholar]
- Roberts, P.; Jones, D.L. Critical evaluation of methods for determining total protein in soil solution. Soil Biol. Biochem. 2008, 40, 1485–1495. [Google Scholar] [CrossRef]
- Jones, D.L.; Owen, A.G.; Farrar, J.F. Simple method to enable the high resolution determination of total free amino acids in soil solutions and soil extracts. Soil Biol. Biochem. 2002, 34, 1893–1902. [Google Scholar] [CrossRef]
- Buyer, J.S.; Sasser, M. High throughput phospholipid fatty acid analysis of soils. Appl. Soil Ecol. 2012, 61, 127–130. [Google Scholar] [CrossRef]
- Findlay, R.H. Determination of microbial community structure using phospholipid fatty acid profiles. In Molecular Microbial Ecology Manual; Kowalchuk, G.A., Bruijn, F.J.D., Head, I.M., Akkermans, A.D.L., Elsas, J.D.V., Eds.; Kluwer Academic Publishers: Dordrecht, The Netherlands, 2004; pp. 983–1004. [Google Scholar]
- Frostegård, Å.; Bååth, E.; Tunlio, A. Shifts in the structure of soil microbial communities in limed forests as revealed by phospholipid fatty acid analysis. Soil Biol. Biochem. 1993, 25, 723–730. [Google Scholar] [CrossRef]
- Fernandes, M.F.; Saxena, J.; Dick, R.P. Comparison of Whole-Cell Fatty Acid (MIDI) or Phospholipid Fatty Acid (PLFA) Extractants as Biomarkers to Profile Soil Microbial Communities. Microb. Ecol. 2013, 66, 145–157. [Google Scholar] [CrossRef] [PubMed]
- Farrell, M.; Hill, W.; Farrar, J.; Wanniarachchi, D.; Bardgett, D.; Jones, D.L. Rapid peptide metabolism: A major component of soil nitrogen cycling? Glob. Biogeochem. Cycles 2011, 25, 11. [Google Scholar] [CrossRef]
- Glanville, H.C.; Hill, P.W.; Schnepf, A.; Oburger, E.; Jones, D.L. Combined use of empirical data and mathematical modelling to better estimate the microbial turnover of isotopically labelled carbon substrates in soil. Soil Biol. Biochem. 2016, 94, 154–168. [Google Scholar] [CrossRef]
- Jones, D.L.; Olivera-Ardid, S.; Klumpp, E.; Knief, C.; Hill, P.W.; Lehndorff, E.; Bol, M. Moisture activation and carbon use efficiency of soil microbial communities along an aridity gradient in the Atacama Desert. Soil Biol. Biochem. 2018, 117, 68–71. [Google Scholar] [CrossRef]
- Birgander, J.; Reischke, S.; Jones, D.L.; Rousk, J. Temperature adaptation of bacterial growth and 14C-glucose mineralisation in a laboratory study. Soil Biol. Biochem. 2013, 65, 294–303. [Google Scholar] [CrossRef]
- Rousk, J.; Frey, S.D.; Bååth, E. Temperature adaptation of bacterial communities in experimentally warmed forest soils. Glob. Chang. Biol. 2012, 18, 3252–3258. [Google Scholar] [CrossRef] [PubMed]
- Al-Jasser, A.O. Saudi wastewater reuse standards for agricultural irrigation: Riyadh treatment plants effluent compliance. J. King Saud Univ. Eng. Sci. 2011, 23, 1–8. [Google Scholar] [CrossRef]
- Ayers, R.S.; Westcot, D.W. Water Quality for Agriculture; Food and Agriculture Organization of the United Nations: Rome, Italy, 1985; Volume 29, ISBN 92-5-102263-1. [Google Scholar]
- Certini, G.; Scalenghe, R. Soils: Basic Concepts and Future Challenges; Cambridge University Press: Cambridge, UK, 2006. [Google Scholar]
- Boulding, J.R. Description and Sampling of Contaminated Soils: A Field Guide, 2nd ed.; CRC Press: Boca Raton, FL, USA, 1994. [Google Scholar]
- Food and Agriculture Organization of the United Nations (FAO). Near East Fertilizer—Use Manual; Food and Agriculture Organization of the United Nations: Rome, Italy, 2006. [Google Scholar]
- Hill, P.W.; Farrar, J.F.; Jones, D.L. Decoupling of microbial glucose uptake and mineralization in soil. Soil Biol. Biochem. 2008, 40, 616–624. [Google Scholar] [CrossRef]
- Jan, M.T.; Roberts, P.; Tonheim, S.K.; Jones, D.L. Protein breakdown represents a major bottleneck in nitrogen cycling in grassland soils. Soil Biol. Biochem. 2009, 41, 2272–2282. [Google Scholar] [CrossRef]
- Nobel, P.S. Extreme temperatures and thermal tolerances for seedlings of desert succulents. Oecologia 1984, 62, 310–317. [Google Scholar] [CrossRef] [PubMed]
- Garratt, J.R. Extreme Maximum Land Surface Temperatures. J. Appl. Meteorol. 1992, 31, 1096–1105. [Google Scholar] [CrossRef]
- Williams, J.B.; Tieleman, B.I.; Shobrak, M. Lizard Burrows Provide Thermal Refugia for Larks in the Arabian Desert. Condor 1999, 101, 714–717. [Google Scholar] [CrossRef]
- Boddy, E.; Roberts, P.; Hill, P.W.; Farrar, J.; Jones, D.L. Turnover of low molecular weight dissolved organic C (DOC) and microbial C exhibit different temperature sensitivities in Arctic tundra soils. Soil Biol. Biochem. 2008, 40, 1557–1566. [Google Scholar] [CrossRef]
- Jones, D.L.; Kemmitt, S.J.; Wright, D.; Cuttle, S.P.; Bol, R.; Edwards, A.C. Rapid intrinsic rates of amino acid biodegradation in soils are unaffected by agricultural management strategy. Soil Biol. Biochem. 2005, 37, 1267–1275. [Google Scholar] [CrossRef]
- Jones, D.L.; Hill, P.W.; Smith, A.R.; Farrell, M.; Ge, T.; Banning, N.C.; Murphy, D.V. Role of substrate supply on microbial carbon use efficiency and its role in interpreting soil microbial community-level physiological profiles (CLPP). Soil Biol. Biochem. 2018, in press. [Google Scholar]
- Hill, P.W.; Farrell, M.; Roberts, P.; Farrar, J.; Grant, H.; Newsham, K.K.; Hopkins, D.W.; Bardgett, R.D.; Jones, D.L. Soil-and enantiomer-specific metabolism of amino acids and their peptides by Antarctic soil microorganisms. Soil Biol. Biochem. 2011, 43, 2410–2416. [Google Scholar] [CrossRef]
- Rukshana, F.; Butterly, C.R.; Xu, J.M.; Baldock, J.A.; Tang, C. Soil organic carbon contributes to alkalinity priming induced by added organic substrates. Soil Biol. Biochem. 2013, 65, 217–226. [Google Scholar] [CrossRef]
- Manzoni, S.; Taylor, P.; Richter, A.; Porporato, A.; Ågren, G.I. Environmental and stoichiometric controls on microbial carbon-use efficiency in soils. New Phytol. 2012, 196, 79–91. [Google Scholar] [CrossRef] [PubMed]
- Schindlbacher, A.; Schnecker, J.; Takriti, M.; Borken, W.; Wanek, W. Microbial physiology and soil CO2 efflux after 9 years of soil warming in a temperate forest—No indications for thermal adaptations. Glob. Chang. Biol. 2015, 21, 4265–4277. [Google Scholar] [CrossRef] [PubMed]
- Geyer, K.M.; Snowman, E.K.; Grandy, A.S.; Frey, S.D. Microbial carbon use efficiency: Accounting for population, community, and ecosystem-scale controls over the fate of metabolized organic matter. Biogeochemistry 2016, 127, 173–188. [Google Scholar] [CrossRef]
- Agehara, S.; Warncke, D.D. Soil Moisture and Temperature Effects on Nitrogen Release from Organic Nitrogen Sources. Soil Sci. Soc. Am. J. 2005, 69, 1844. [Google Scholar] [CrossRef]


| Water/Irrigation Type | Ground Water | Treated Wastewater | Mixed |
|---|---|---|---|
| Parameters | |||
| pH | 7.27 ± 0.03 a | 7.22 ± 0.05 a | 6.83 ± 0.04 b |
| EC (mS/cm) | 4.92 ± 0.16 b | 2.21 ± 0.03 c | 7.04 ± 0.09 a |
| P (mg/L) | 0.04 ± 0.00 c | 4.99 ± 0.46 a | 2.50 ± 0.11 b |
| Soluble phenolics (mg/L) | 1.74 ± 0.58 | 1.33 ± 0.45 | 3.10 ± 0.54 |
| NO3− (mg N/L) | 7.02 ± 0.05 b | 7.11 ± 0.22 b | 9.68 ± 0.41 a |
| NH4+ (mg N/L) | 0.02 ± 0.01 | 0.02 ± 0.00 | 0.08 ± 0.04 |
| Dissolved organic N (DON) (mg N/L) | 0.41 ± 0.01 b | 0.61 ± 0.09 a | 0.43 ± 0.18 b |
| Dissolved organic C (DOC) (mg C/L) | 1.03 ± 0.30 c | 4.69 ± 0.36 b | 6.44 ± 0.18 a |
| DOC/DON ratio | 2.49 ± 0.70 | 8.13 ± 0.87 | 23.84 ± 11.65 |
| Amino acids (mg N/L) | 0.01 ± 0.00 b | 0.05 ± 0.02 a | 0.03 ± 0.00 a,b |
| Soil/Irrigation Type | Site 1 | Site 2 | Site 3 |
|---|---|---|---|
| Parameter | (0–30 cm) | (0–30 cm) | (0–30 cm) |
| pH | 8.51 ± 0.03 | 8.66 ± 0.02 | 8.56 ± 0.07 |
| Electrical conductivity (mS/cm) | 0.91 ± 0.07 | 0.40 ± 0.02 | 0.67 ± 0.15 |
| Moisture content (%) | 12.8 ± 0.3 b | * 12.7 ± 0.7 b | 18.2 ± 0.6 a |
| Organic matter (%) | * 1.26 ± 0.05 b | 1.56 ± 0.06 a,b | 2.65 ± 0.23 a |
| CaCO3 (%) | 23.5 ± 0.8 b | 27.9 ± 2.1 a | 15.0 ± 2.4 c |
| Soil texture | Sand | Sand | Sandy loam |
| Na (g/kg) | 0.56 ± 0.15 | 0.32 ± 0.06 | 0.49 ± 0.11 |
| Al (g/kg) | * 1.47 ± 0.04 a | 0.60 ± 0.08 b | 1.32 ± 0.31 a,b |
| S (g/kg) | 0.20 ± 0.02 | 0.04 ± 0.02 | 0.09 ± 0.04 |
| Cl (g/kg) | * 0.25 ± 0.02 | 0.21 ± 0.02 | 0.25 ± 0.07 |
| K (g/kg) | * 0.70 ± 0.01 a,b | 0.58 ± 0.04 b | 0.93 ± 0.13 a |
| Ca (g/kg) | * 33.0 ± 0.7 | 37.7 ± 2.3 | 37.6 ± 4.3 |
| Mg (g/kg) | 3.05 ± 0.10 b | 3.46 ± 0.34 b | 9.25 ± 1.17 a |
| Mn (g/kg) | * 0.06 ± 0.00 | 0.05 ± 0.01 | 0.08 ± 0.01 |
| Fe (g/kg) | * 1.93 ± 0.03 b | 1.40 ± 0.11c | 2.64 ± 0.27 a |
| Zn (g/kg) | 0.02 ± 0.00 | 0.02 ± 0.01 | 0.02 ± 0.00 |
| Total C (g C/kg) | 13.2 ± 1.3 b | 21.6 ± 1.9 a | 23.6 ± 2.8 a |
| Total N (g N/kg) | 1.00 ± 0.06 | 0.83 ± 0.04 | 1.19 ± 0.08 |
| Total C:N ratio | 13.6 ± 1.3 | 27.9 ± 5.5 | 20.5 ± 3.0 |
| NO3− (mg N/kg) | * 4.60 ± 0.55 b | 7.67 ± 0.55 a | 4.84 ± 0.45 b |
| NH4+ (mg N/kg) | 1.05 ± 0.13 a | 0.05 ± 0.02 b | 0.11 ± 0.18 b |
| Amino acids (mg N/kg) | * 0.19 ± 0.01 | 0.15 ± 0.02 | 0.17 ± 0.03 |
| Protein (mg N/kg) | 5.28 ± 0.37 | 2.53 ± 0.32 | 4.83 ± 0.59 |
| DON (mg N/kg) | 5.91 ± 0.78 | 6.91 ± 1.12 | 9.64 ± 2.75 |
| DOC (mg C/kg) | 35.0 ± 6.6 | 39.6 ±8.6 | 66.5 ± 23.4 |
| Microbial N (mg N/kg) | 8.88 ± 0.65 b | * 20.2 ± 1.4 a | 18.5 ± 4.8 a |
| Microbial C (mg C/kg) | 109 ±16 | * 172 ± 7 | 127 ± 31 |
| DOC/DON ratio | 5.90 ± 0.84 | * 5.81 ± 0.21 | 12.05 ± 5.97 |
| Phenolics (mg/kg) | * 5.73 ± 0.12 | 6.64 ± 2.02 | * 4.69 ± 1.30 |
| Available P (mg P/kg) | * 10.0 ± 1.8 | 41.5 ± 3.3 | * 35.7 ± 2.0 |
| Soil respiration (µg CO2/g/h) | * 0.12 ± 0.01 | 0.14 ± 0.01 | 0.16 ± 0.01 |
| Soil/Irrigation Type | Site 1 | Site 2 | Site 3 |
|---|---|---|---|
| Parameter | (30–60 cm) | (30–60 cm) | (30–60 cm) |
| pH | 8.51 ± 0.06 | 8.51 ± 0.01 | 8.55 ± 0.07 |
| Electrical conductivity (mS/cm) | 0.95 ± 0.14 | 0.59 ± 0.03 | 0.81 ± 0.15 |
| Moisture content (%) | 13.4 ± 0.4 c | 27.1 ± 1.1 a | 20.3 ± 0.5 b |
| Organic matter (%) | 0.89 ± 0.04 c | 1.80 ± 0.05 b | 2.05 ± 0.23 a |
| CaCO3 (%) | 25.6 ± 1.7 a,b | 35.5 ± 3.3 a | 14.1 ± 2.4 b |
| Soil texture | Sand | Sandy loam | Sandy loam |
| Na (g/kg) | 0.42 ± 0.17 | 0.51 ± 0.06 | 0.53 ± 0.06 |
| Al (g/kg) | 0.68 ± 0.09 | 0.41 ± 0.04 | 0.71 ± 0.20 |
| S (g/kg) | 0.04 ± 0.04 | 0.03 ± 0.01 | 0.08 ± 0.02 |
| Cl (g/kg) | 0.14 ± 0.01 b | 0.18 ± 0.00 a,b | 0.21 ± 0.01 a |
| K (g/kg) | 0.49 ± 0.03 b | 0.50 ± 0.02 b | 0.98 ± 0.08 a |
| Ca (g/kg) | 21.6 ± 1.0 b | 38.5 ± 2.5 a | 37.1 ± 2.4 a |
| Mg (g/kg) | 2.58 ± 0.15 c | 4.32 ± 0.17 b | 8.47 ± 1.44 a |
| Mn (g/kg) | 0.04 ± 0.00 b | 0.05 ± 0.00 b | 0.07 ± 0.01 a |
| Fe (g/kg) | 1.25 ± 0.07 b | 1.36 ± 0.09 b | 2.69 ± 0.23 a |
| Zn (g/kg) | 0.01 ± 0.00 | 0.01 ± 0.00 | 0.01 ± 0.00 |
| Total C (g C/kg) | 10.5 ± 1.4 b | 34.5 ± 3.6 b | 22.8 ± 2.8 a |
| Total N (g N/kg) | 0.81 ± 0.12 | 0.74 ± 0.03 | 1.07 ± 0.08 |
| Total C:N ratio | 13.9 ± 1.0 b | 48.2 ± 5.5 b | 22.1 ± 3.0 b |
| NO3− (mg N/kg) | 0.69 ± 0.09 b | 3.22 ± 0.62 b | 1.04 ± 0.45 b |
| NH4+ (mg N/kg) | 1.29 ± 0.22 a | 0.38 ± 0.11 b | 0.33 ± 0.18 b |
| Amino acids (mg N/kg) | 0.13 ± 0.01 | 0.10 ± 0.01 | 0.12 ± 0.02 |
| Protein (mg N/kg) | 4.07 ± 0.34 | 4.02 ± 0.69 | 4.28 ± 0.25 |
| DON (mg N/kg) | 4.67 ± 0.44 | 6.92 ± 1.69 | 6.30 ± 0.80 |
| DOC (mg C/kg) | 25.1 ±3.7 b | 30.7 ±7.6 a,b | 48.6 ± 2.3 a |
| Microbial N (mg N/kg) | 1.09 ± 0.23 | 5.5 ± 0.7 | 10.5 ± 5.7 |
| Microbial C (mg C/kg) | 59 ± 11 | 92 ± 5 | 74 ± 40 |
| DOC/DON ratio | 5.33 ± 0.29 a | 3.25 ± 0.21 b | 5.70 ± 0.65 a |
| Phenolics (mg/kg) | 4.03 ± 0.06 | 6.55 ± 2.57 | 0.96 ± 0.25 |
| Available P (mg P/kg) | 3.0 ± 0.8 | 19.2 ± 2.5 | 4.9 ± 2.0 |
| Soil respiration (µg CO2/g/h) | 0.09 ± 0.00 b | 0.12 ± 0.02 a,b | 0.15 ± 0.01 a |
| Sites | Temperature (°C) | Top Soils (0–30 cm) | ||
|---|---|---|---|---|
| Glucose (%) | Amino Acids (%) | Trialanine (%) | ||
| Pool a1 | ||||
| Site 1 | 10 | 19.1 ± 2.7 b | 21.9 ± 2.2 b,c | 50.2 ± 3.2 b,c |
| 20 | 17.9 ± 3.6 b | 20.1 ± 1.8 c | 45.6 ± 4.9 c | |
| 30 | 36.6 ± 7.2 a | 29.0 ± 1.2 a,b | 66.3 ± 6.8 a,b | |
| 40 | 29.2 ± 2.7 a,b | 31.2 ± 2.6 a | 70.7 ± 4.5 a | |
| Site 2 | 10 | 18.2 ± 4.0 b,c | 21.0 ± 1.9 b | 48.3 ± 4.3 b |
| 20 | 13.0 ± 1.3 c | 17.8 ± 4.0 b | 54.6 ± 4.9 a,b | |
| 30 | 41.4 ± 2.0 a | 32.6 ± 0.4 a | 66.0 ± 6.9 a | |
| 40 | 28.8 ± 3.8 b | 30.5 ± 0.9 a | 70.0 ± 1.5 a | |
| Site 3 | 10 | 40.8 ± 2.1 | 22.9 ± 2.4 b | 45.0 ± 2.1 b |
| 20 | 16.0 ± 2.1 | 20.0 ± 1.8 b | 46.1 ± 7.3 b | |
| 30 | 41.1 ± 2.1 | 30.2 ± 0.6 a | 66.9 ± 2.6 a | |
| 40 | 30.4 ± 1.0 | 30.9 ± 2.2 a | 68.5 ± 1.5 a | |
| Pool a2 | ||||
| Site 1 | 10 | 81.13 ± 2.66 b | 72.57 ± 2.39 b,c | 45.47 ± 3.05 b,c |
| 20 | 79.15 ± 4.41 b | 77.24 ± 1.88 c | 51.91 ± 5.05 c | |
| 30 | 64.69 ± 6.73 a | 65.61 ± 1.90 a,b | 37.09 ± 5.09 a,b | |
| 40 | 68.47 ± 2.86 a,b | 64.12 ± 3.46 a | 32.23 ± 2.43 a | |
| Site 2 | 10 | 82.03 ± 4.20 b,c | 74.40 ± 1.84 b | 49.27 ± 3.82 b |
| 20 | 84.63 ± 1.59 c | 79.36 ± 3.91 b | 43.74 ± 2.76 a,b | |
| 30 | 60.08 ± 1.85 a | 63.80 ± 1.30 a | 36.52 ± 4.15 a | |
| 40 | 70.72 ± 4.95 b | 68.33 ± 0.67 a | 35.20 ± 1.09 a | |
| Site 3 | 10 | 58.99 ± 21.48 | 71.71 ± 2.98 b | 50.71 ± 2.28 b |
| 20 | 81.60 ± 2.35 | 76.72 ± 1.93 b | 53.69 ± 5.69 b | |
| 30 | 60.05 ± 2.02 | 66.47 ± 0.37 a | 36.36 ± 1.80 a | |
| 40 | 68.54 ± 1.06 | 67.52 ± 1.34 a | 35.73 ± 0.87 a | |
| Sites | Temperature (°C) | Sub Soils (30–60 cm) | ||
|---|---|---|---|---|
| Glucose (%) | Amino Acids (%) | Trialanine (%) | ||
| Pool a1 | ||||
| Site 1 | 10 | 33.7 ± 9.0 | 16.5 ± 5.8 | 46.3 ± 7.1 |
| 20 | 17.0 ± 2.6 | 14.5 ± 4.0 | 46.1 ± 8.0 | |
| 30 | 38.4 ± 5.2 | 23.5 ± 4.4 | 66.6 ± 9.3 | |
| 40 | 37.2 ± 6.2 | 31.0 ± 3.5 | 68.6 ± 9.9 | |
| Site 2 | 10 | 31.0 ± 4.5 b | 17.0 ± 4.2 b | 38.9 ± 7.0 |
| 20 | 11.7 ± 2.0 c | 15.9 ± 2.0 b | 40.1 ± 6.3 | |
| 30 | 42.0 ± 1.7 a | 25.2 ± 3.4 a,b | 51.7 ± 7.4 | |
| 40 | 25.3 ± 1.7 b | 29.5 ± 1.6 a | 52.6 ± 10.6 | |
| Site 3 | 10 | 25.2 ± 1.7 b | 19.4 ± 1.2 | 32.5 ± 8.3 b |
| 20 | 14.8 ± 1.4 c | 16.4 ± 3.4 | 42.1 ± 9.9 a,b | |
| 30 | 38.2 ± 3.9 a | 33.2 ± 7.5 | 65.0 ± 5.4 a | |
| 40 | 33.2 ± 0.8 a,b | 30.3 ± 3.3 | 65.4 ± 5.9 a | |
| Pool a2 | ||||
| Site 1 | 10 | 66.96 ± 8.61 | 78.90 ± 6.76 | 52.32 ± 7.70 |
| 20 | 81.13 ± 2.90 | 82.13 ± 4.87 | 53.82 ± 6.93 | |
| 30 | 63.31 ± 4.51 | 70.71 ± 3.70 | 38.01 ± 6.60 | |
| 40 | 64.01 ± 5.97 | 66.39 ± 3.77 | 37.03 ± 5.19 | |
| Site 2 | 10 | 69.61 ± 4.48 b | 78.77 ± 5.01 b | 59.70 ± 7.56 |
| 20 | 87.28 ± 2.39 c | 80.76 ± 2.57 b | 60.34 ± 6.51 | |
| 30 | 60.06 ± 1.72 a | 72.15 ± 2.85 a,b | 48.57 ± 5.25 | |
| 40 | 75.22 ± 1.25 b | 68.66 ± 1.79 a | 48.54 ± 7.78 | |
| Site 3 | 10 | 75.20 ± 1.72 b | 75.52 ± 1.45 | 65.34 ± 10.05 b |
| 20 | 83.25 ± 1.79 c | 80.98 ± 4.15 | 56.89 ± 10.09 a,b | |
| 30 | 62.94 ± 3.68 a | 63.20 ± 6.87 | 39.23 ± 3.67 a | |
| 40 | 66.97 ± 0.46 a,b | 66.19 ± 2.06 | 39.02 ± 3.74 a | |
| Glucose (h) | Amino Acids (h) | Trialanine (h) | ||
|---|---|---|---|---|
| Half-life (t½) of Pool a1 | ||||
| Topsoil Site 1 | 10 | 33.3 ± 22.5 a,b | 12.9 ± 3.9 a,b | 9.0 ± 2.8 |
| 20 | 71.9 ± 27.6 a | 5.6 ± 0.7 b | 8.6 ± 4.3 | |
| 30 | 11.7 ± 3.7 a,b | 25.0 ± 6.7 a | 4.0 ± 0.4 | |
| 40 | 15.9 ± 1.3 b | 16.3 ± 1.8 a,b | 3.4 ± 0.5 | |
| Topsoil Site 2 | 10 | 35.6 ± 9.2 a | 9.3 ± 3.8 | 13.2 ± 5.7 |
| 20 | 22.4 ± 2.8 a,b | 27.3 ± 21.7 | 10.3 ± 3.4 | |
| 30 | 15.3 ± 1.3 b | 11.0 ± 5.2 | 6.0 ± 2.4 | |
| 40 | 18.5 ± 7.0 a,b | 4.3 ± 0.4 | 2.8 ± 0.3 | |
| Topsoil Site 3 | 10 | 611 ± 560 | 14.1 ± 2.7 | 12.2 ± 2.9 |
| 20 | 20.8 ± 1.0 | 11.2 ± 2.8 | 10.3 ± 6.4 | |
| 30 | 19.7 ± 1.7 | 11.3 ± 2.1 | 4.2 ± 0.8 | |
| 40 | 22.6 ± 6.0 | 9.9 ± 5.0 | 3.2 ± 0.6 | |
| Subsoil Site 1 | 10 | 96.4 ± 41.8 a | 18.5 ± 6.3 | 18.24 ± 4.6 |
| 20 | 30.6 ± 6.9 a,b | 27.5 ± 14.5 | 18.64 ± 8.1 | |
| 30 | 22.5 ± 9.9 b | 26.1 ± 11.0 | 5.95 ± 2.1 | |
| 40 | 18.3 ± 8.1 b | 11.4 ± 6.9 | 12.24 ± 9.6 | |
| Subsoil Site 2 | 10 | 120 ± 20 a | 25.4 ± 4.5 | 26.95 ± 6.0 |
| 20 | 22.8 ± 2.4 b | 17.3 ± 2.1 | 12.20 ± 5.8 | |
| 30 | 20.9 ± 1.7 b | 16.6 ± 6.8 | 11.88 ± 4.3 | |
| 40 | 20.6 ± 7.4 b | 29.1 ± 16.0 | 12.21 ± 4.9 | |
| Subsoil Site 3 | 10 | 60.3 ± 15.2 a | 17.0 ± 6.9 | 11.73 ± 6.8 |
| 20 | 24.1 ± 3.4 b | 9.1 ± 5.0 | 8.39 ± 2.7 | |
| 30 | 22.2 ± 7.1 b | 53.7 ± 38.0 | 5.0 ± 1.4 | |
| 40 | 18.4 ± 6.3 b | 12.8 ± 5.6 | 4.1 ± 1.3 | |
© 2018 by the authors. Licensee MDPI, Basel, Switzerland. This article is an open access article distributed under the terms and conditions of the Creative Commons Attribution (CC BY) license (http://creativecommons.org/licenses/by/4.0/).
Share and Cite
AlMulla, A.A.; Jones, D.; Roberts, P. Substrate Influences Temperature Sensitivity of Dissolved Organic Carbon (DOC) and Nitrogen (DON) Mineralization in Arid Agricultural Soils. Soil Syst. 2018, 2, 28. https://doi.org/10.3390/soilsystems2020028
AlMulla AA, Jones D, Roberts P. Substrate Influences Temperature Sensitivity of Dissolved Organic Carbon (DOC) and Nitrogen (DON) Mineralization in Arid Agricultural Soils. Soil Systems. 2018; 2(2):28. https://doi.org/10.3390/soilsystems2020028
Chicago/Turabian StyleAlMulla, Abdulaziz A., Davey Jones, and Paula Roberts. 2018. "Substrate Influences Temperature Sensitivity of Dissolved Organic Carbon (DOC) and Nitrogen (DON) Mineralization in Arid Agricultural Soils" Soil Systems 2, no. 2: 28. https://doi.org/10.3390/soilsystems2020028
APA StyleAlMulla, A. A., Jones, D., & Roberts, P. (2018). Substrate Influences Temperature Sensitivity of Dissolved Organic Carbon (DOC) and Nitrogen (DON) Mineralization in Arid Agricultural Soils. Soil Systems, 2(2), 28. https://doi.org/10.3390/soilsystems2020028