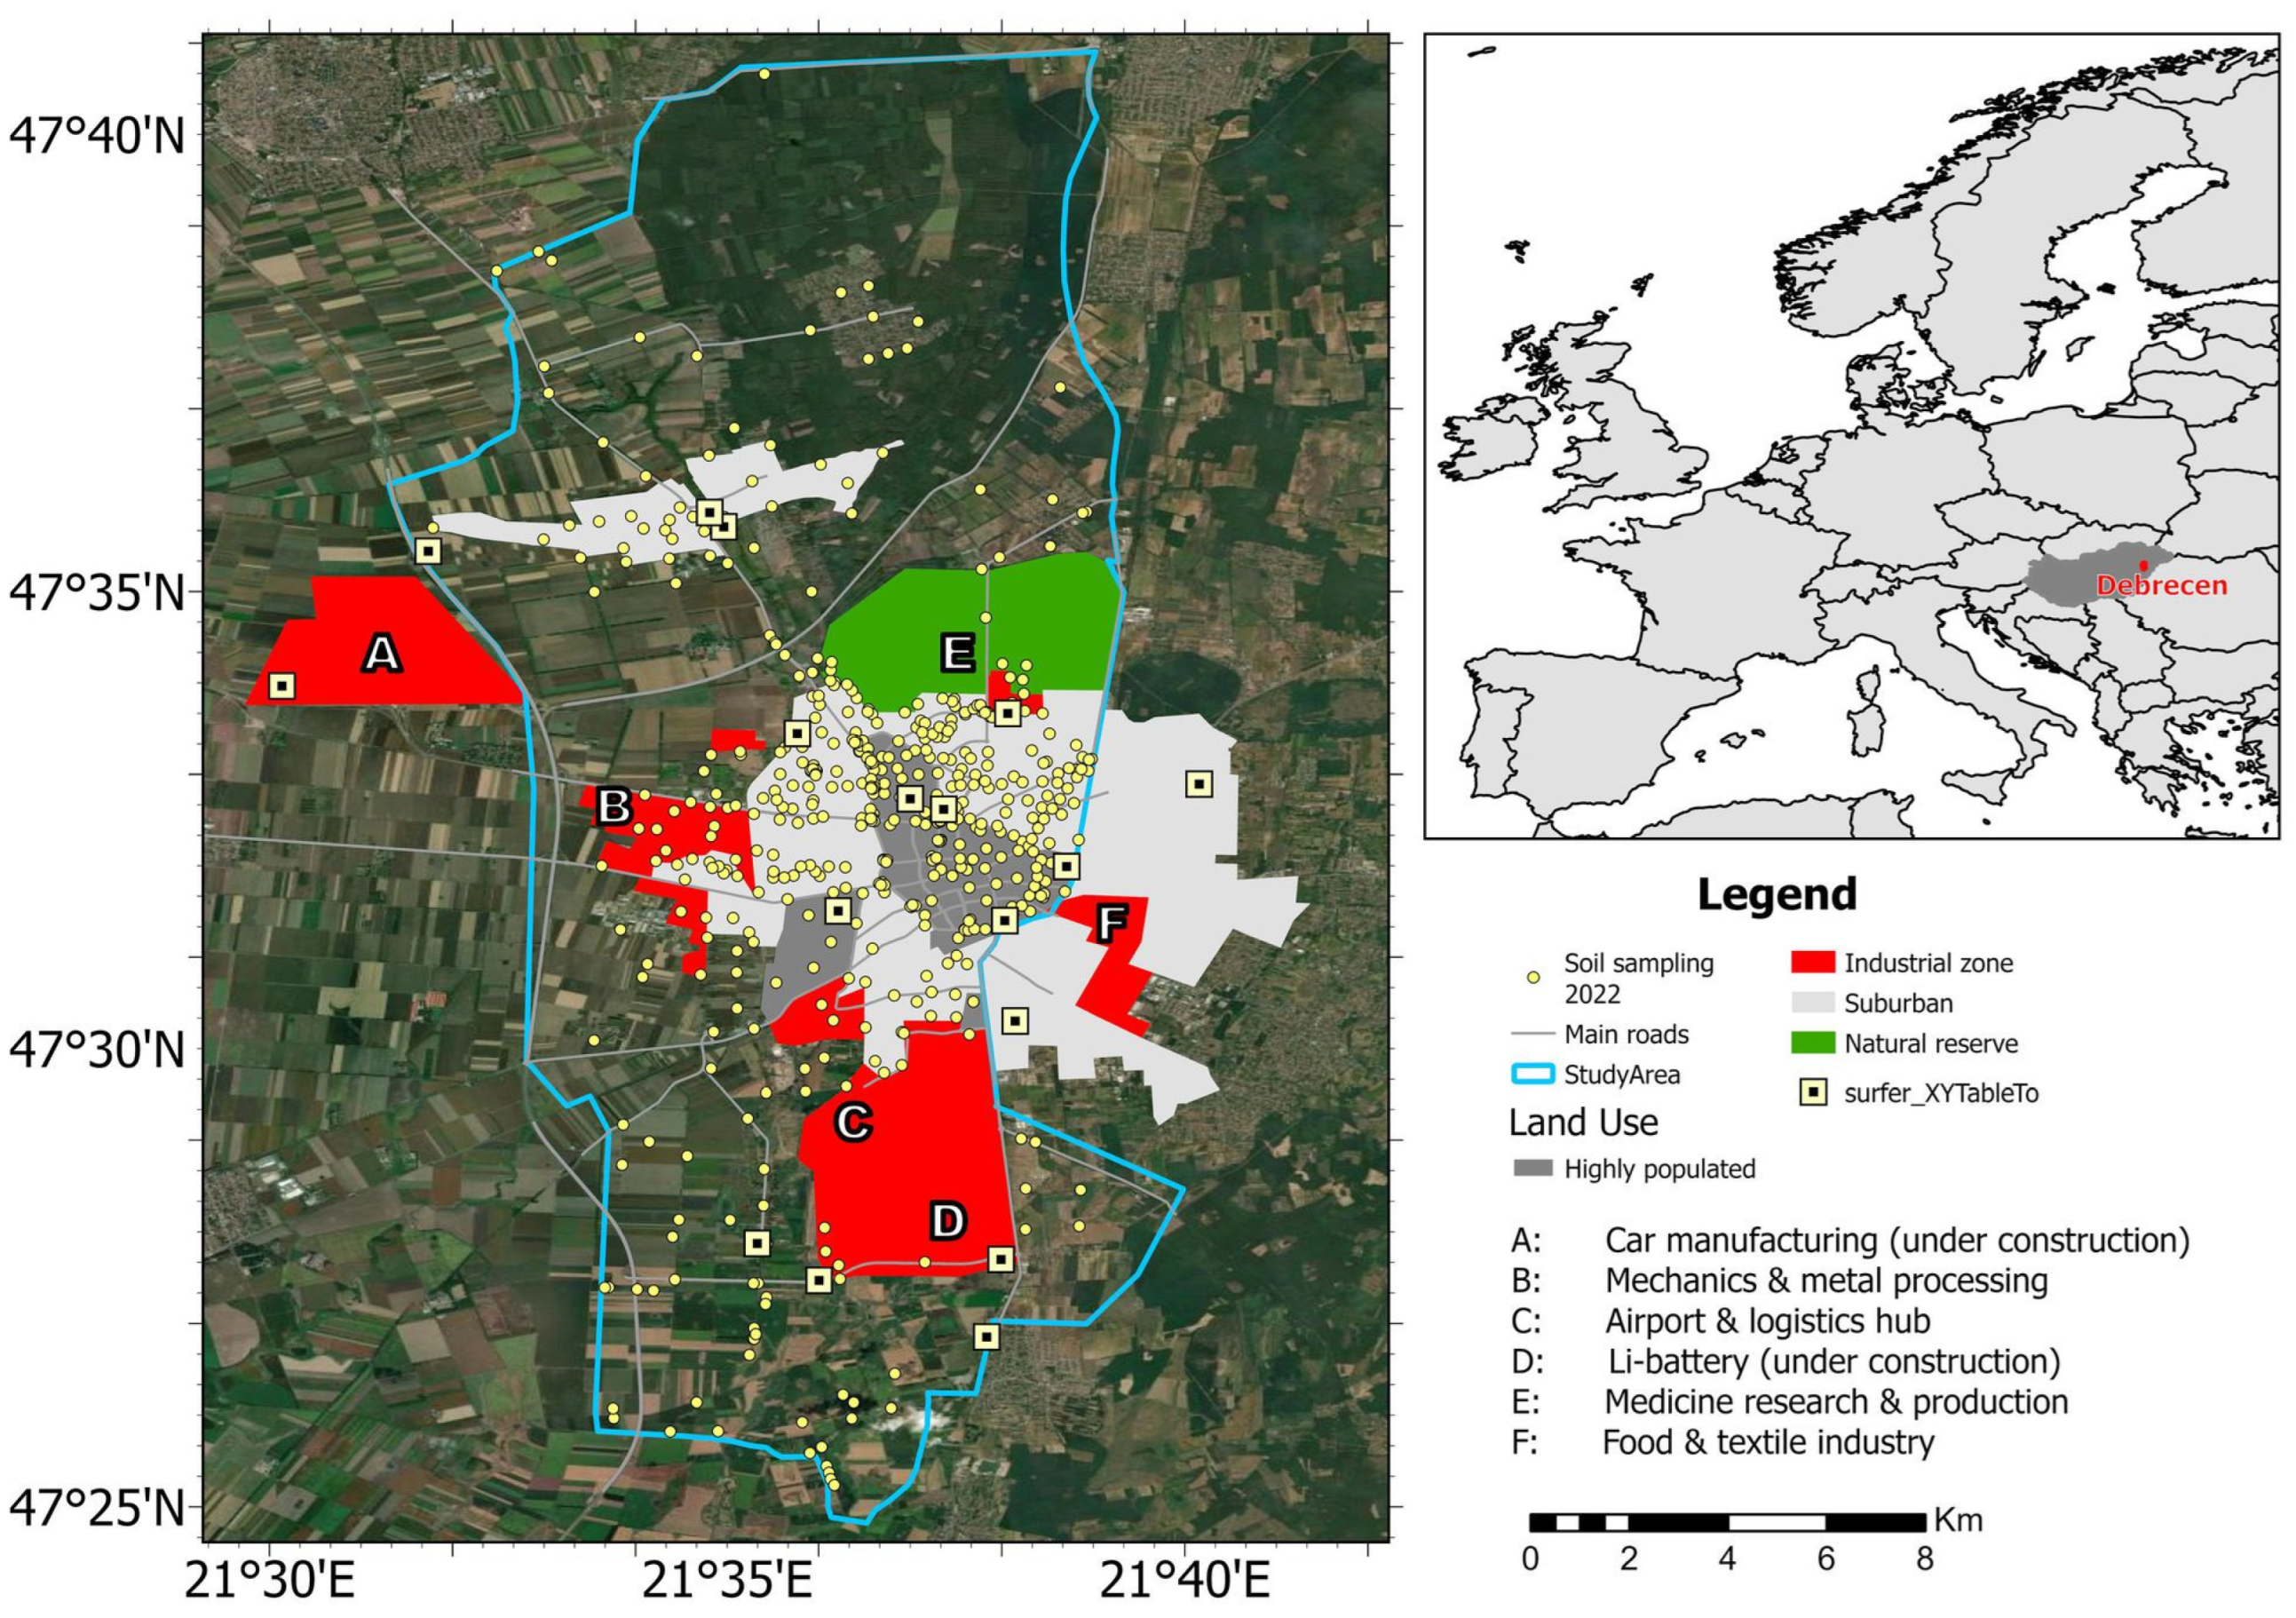
1. Introduction
Heavy metal contamination of urban top soils is a persistent environmental problem worldwide, particularly in rapidly expanding cities such as Debrecen, owing to the persistence, bioaccumulative potential, and toxicity of these elements even at trace concentrations. The accumulation of Pb, Cd, As, Co, Cr, Cu, Ni, and Zn in urban soils is a public health concern because these elements exert adverse effects on child development, chronic organ function, and community health through multiple exposure pathways [
1,
2,
3,
4]. The spatial distribution of these metals exhibits marked heterogeneity, attributable to proximity to emission sources, soil characteristics, and land use; thus, maps based on point estimates alone cannot capture the full range of spatial variability.
Previous characterization [
5] found that heavy metal concentrations in the urban soil of the Debrecen area were governed primarily by transport, industrial activity, and geological background, based on multivariate statistical and geostatistical estimation methods. A simulation-based analysis of threshold exceedance in contaminated soils is needed to determine whether the systematic underestimation of the contamination extent results from the smoothing effect of ordinary kriging, which provides a single best estimate and does not reproduce local variability [
6], or from an insufficient sampling density. Goovaerts [
7] demonstrated that kriging can reduce sample variance by a factor of six in contaminated soils and that the smoothing effect systematically underestimates the spatial extent of contamination and the associated misclassification costs, whereas sequential indicator simulation (SISIM) has been shown to more reliably delineate contaminated areas than kriging-based classification [
8].
In practice, however, health risk assessments for urban soils often do not explicitly account for the underestimation of extreme concentrations inherent in kriging and use deterministic hazard quotient (
) and carcinogenic risk (
) calculations for kriged concentration surfaces [
9,
10]. Machine learning methods are increasingly used in digital soil mapping [
11,
12,
13,
14], but their reliance on variance minimization and the multi-Gaussian condition of hybrid ML-geostatistical approaches, such as regression kriging or XGBoost-SGS, can limit their suitability for regulatory exceedance problems, where the distribution tails carry the decision risk [
15,
16]. Few studies have examined the threshold sensitivity in heavy metal exceedance classification of urban soils, as running conditional simulations at multiple threshold levels is computationally demanding. Two questions remain open: how sensitive are exceedance probability maps to the choice of threshold, and how can metal-specific exceedance probabilities be combined into a single spatially resolved toxicity-weighted priority indicator?
The sequential indicator simulation (SISIM) directly targets threshold exceedances without requiring distributional assumptions on the concentration field [
6,
17]. The method is particularly suited to exceedance mapping for regulatory purposes, where the decision variable is binary [
18,
19], because the object of inference is the exceedance probability itself. In contrast, sequential Gaussian simulation (SGS) assumes multivariate normality, which suppresses the spatial autocorrelation of extreme values [
20]. Heavy metal concentration data with high skewness and high coefficients of variation violate the multi-Gaussian assumption, making the stationarity condition of SGS difficult to justify [
6]. Even if normal score transformation may partially mitigate the problem, the reproduction of both the statistical distribution and the spatial continuity usually invalidates the standard SGS workflow [
15,
16,
17,
18].
We use the term composite exceedance priority class for ordinal classes derived from . This terminology addresses a methodological gap between conventional concentration-based pollution indices and deterministic health-risk metrics such as or : ranks locations by the combined probability of exceeding regulatory thresholds, and the resulting priority classes indicate where confirmatory sampling or management attention should be directed. is an exposure-potential screening index, not a formal health risk assessment in the sense of calculations; it does not estimate dose, exposure duration, or population-level risk and should not be interpreted as such.
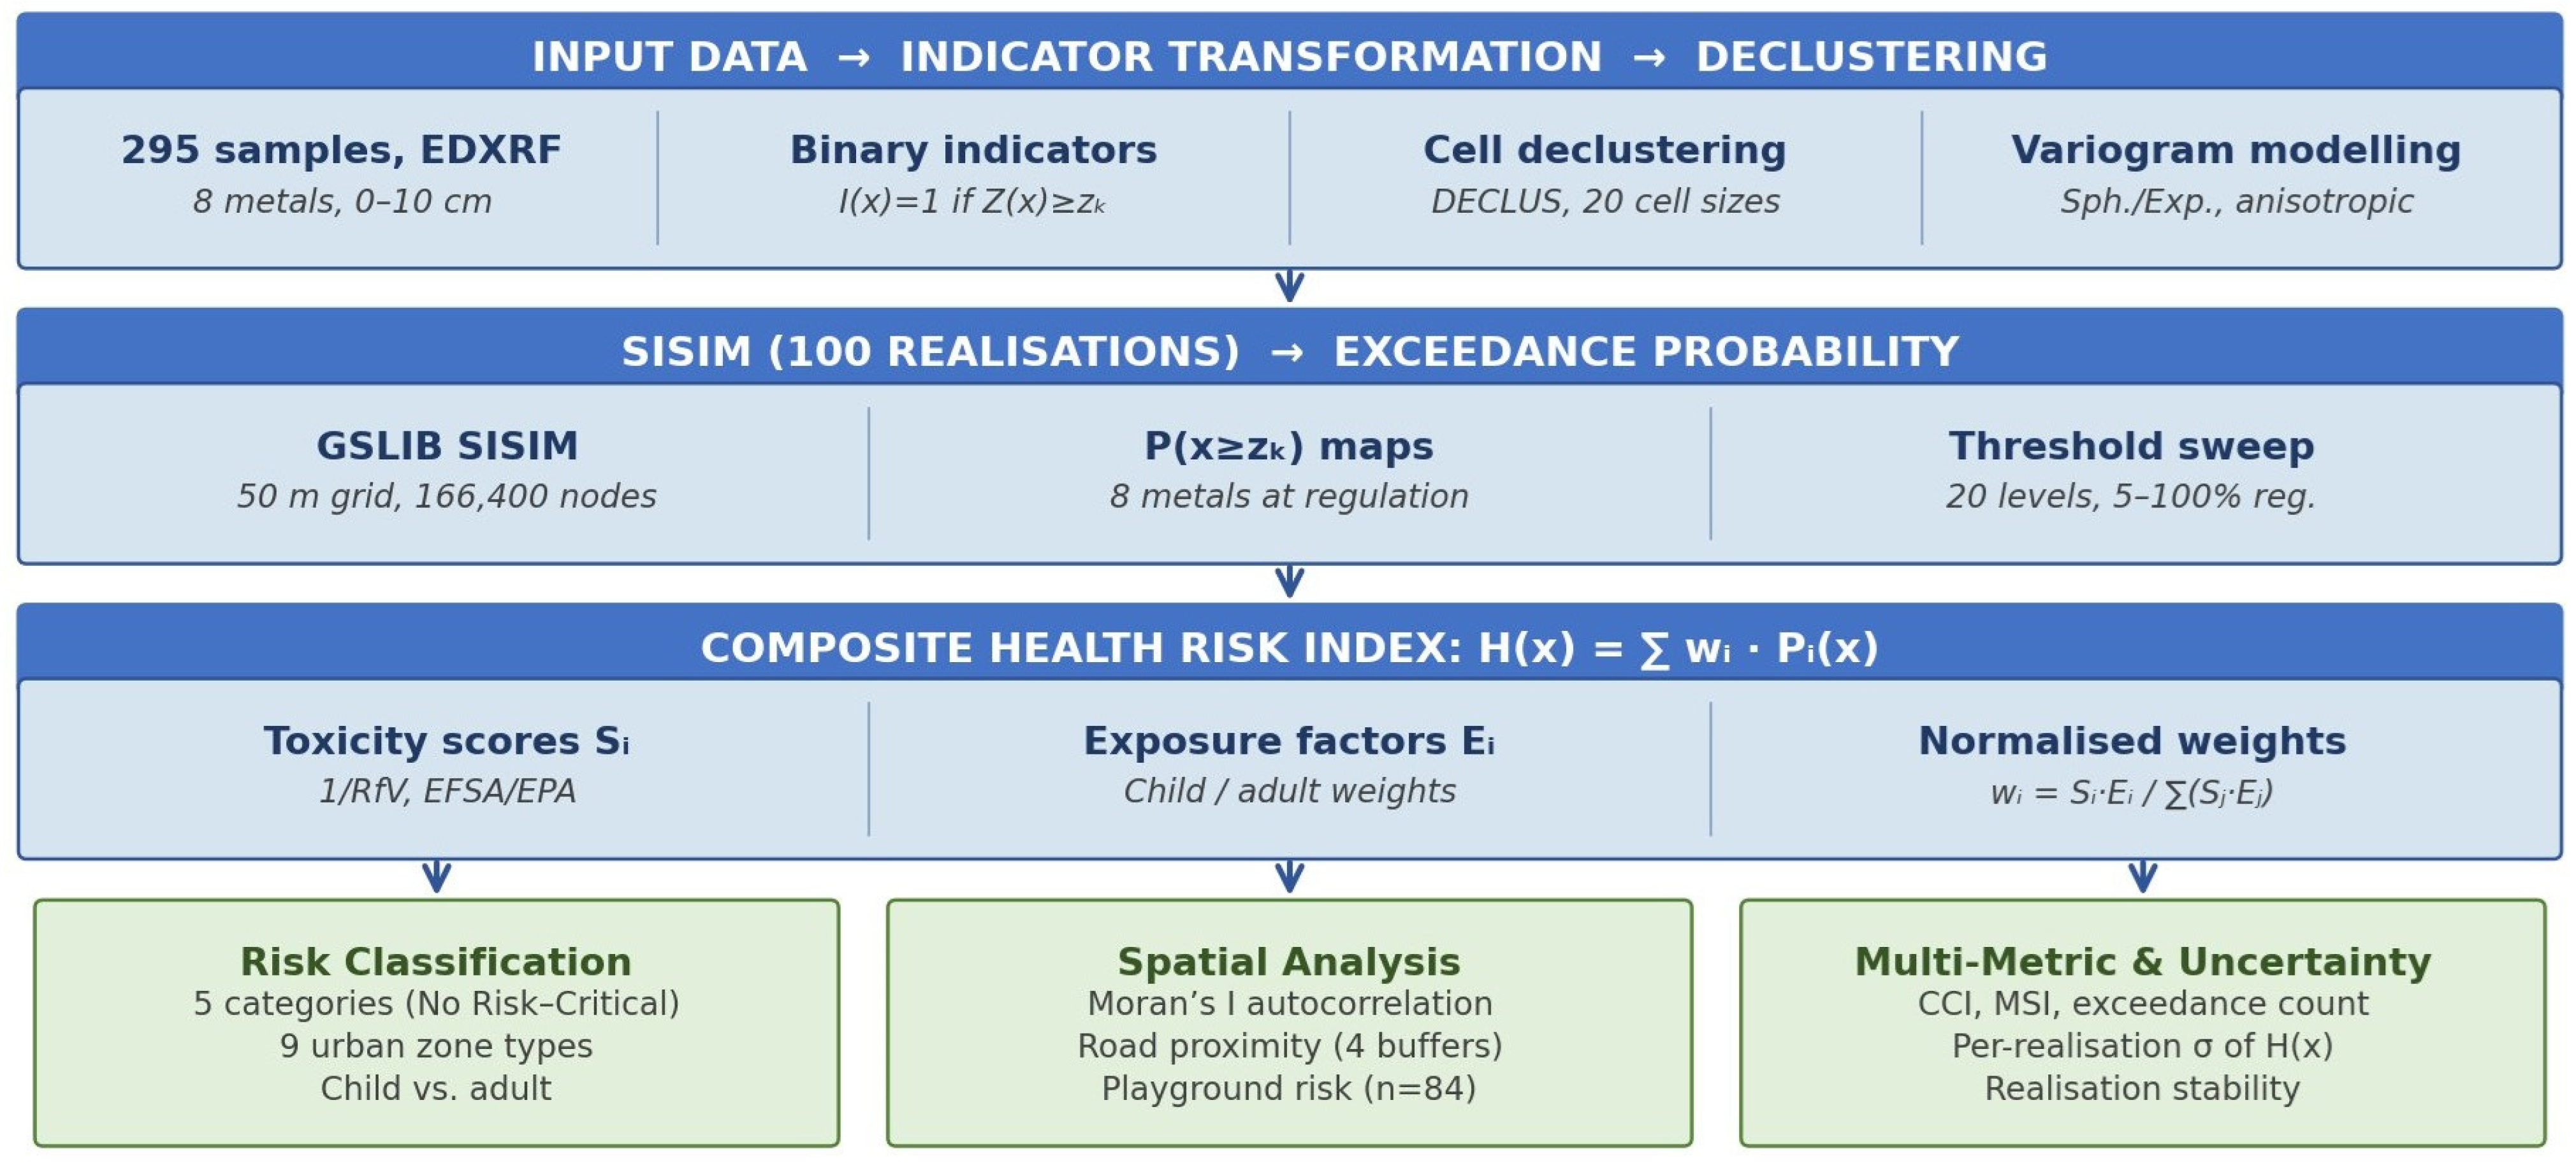
We therefore chose the previously published concentration mapping [
5] as a starting point and converted the exceedance probabilities into a spatially resolved exceedance-priority indicator using stochastic simulation and toxicity-weighted composite indexing. All eight metals were related to the Hungarian regulatory action levels (Government Decree 6/2009), and the metal-specific exceedance probabilities were weighted by EFSA/EPA toxicity profiles and exposure relevance factors, with separate parameterization for children and adults. The specific objectives were as follows: (i) to generate exceedance probability maps for eight heavy metals using SISIM with 100 equiprobable realizations at Hungarian regulatory thresholds; (ii) to test whether a toxicity-weighted composite exceedance index, classified into five priority classes, provides finer spatial discrimination than single-metal exceedance maps; (iii) to evaluate the sensitivity of the exceedance area and composite index to threshold selection at 20 levels (5–100% of the regulatory value); (iv) to characterize spatial priority patterns through zone-specific analysis, spatial autocorrelation testing, road distance analysis, and sensitive receptor priority screening [
21,
22]; and (v) to quantify the realization-based uncertainty of the composite index across SISIM realizations [
18,
20] (
Figure 1).
This study is distinct from the concentration mapping and source attribution of [
5]: it contributes single-threshold exceedance-probability maps at regulatory limits, the toxicity-weighted exceedance-priority index
, a threshold-sensitivity analysis, and an ensemble-convergence analysis. All analytical data are reused from [
5]; no new sampling or laboratory measurement was undertaken for the present work.
3. Results
3.1. Exceedance Probability Maps
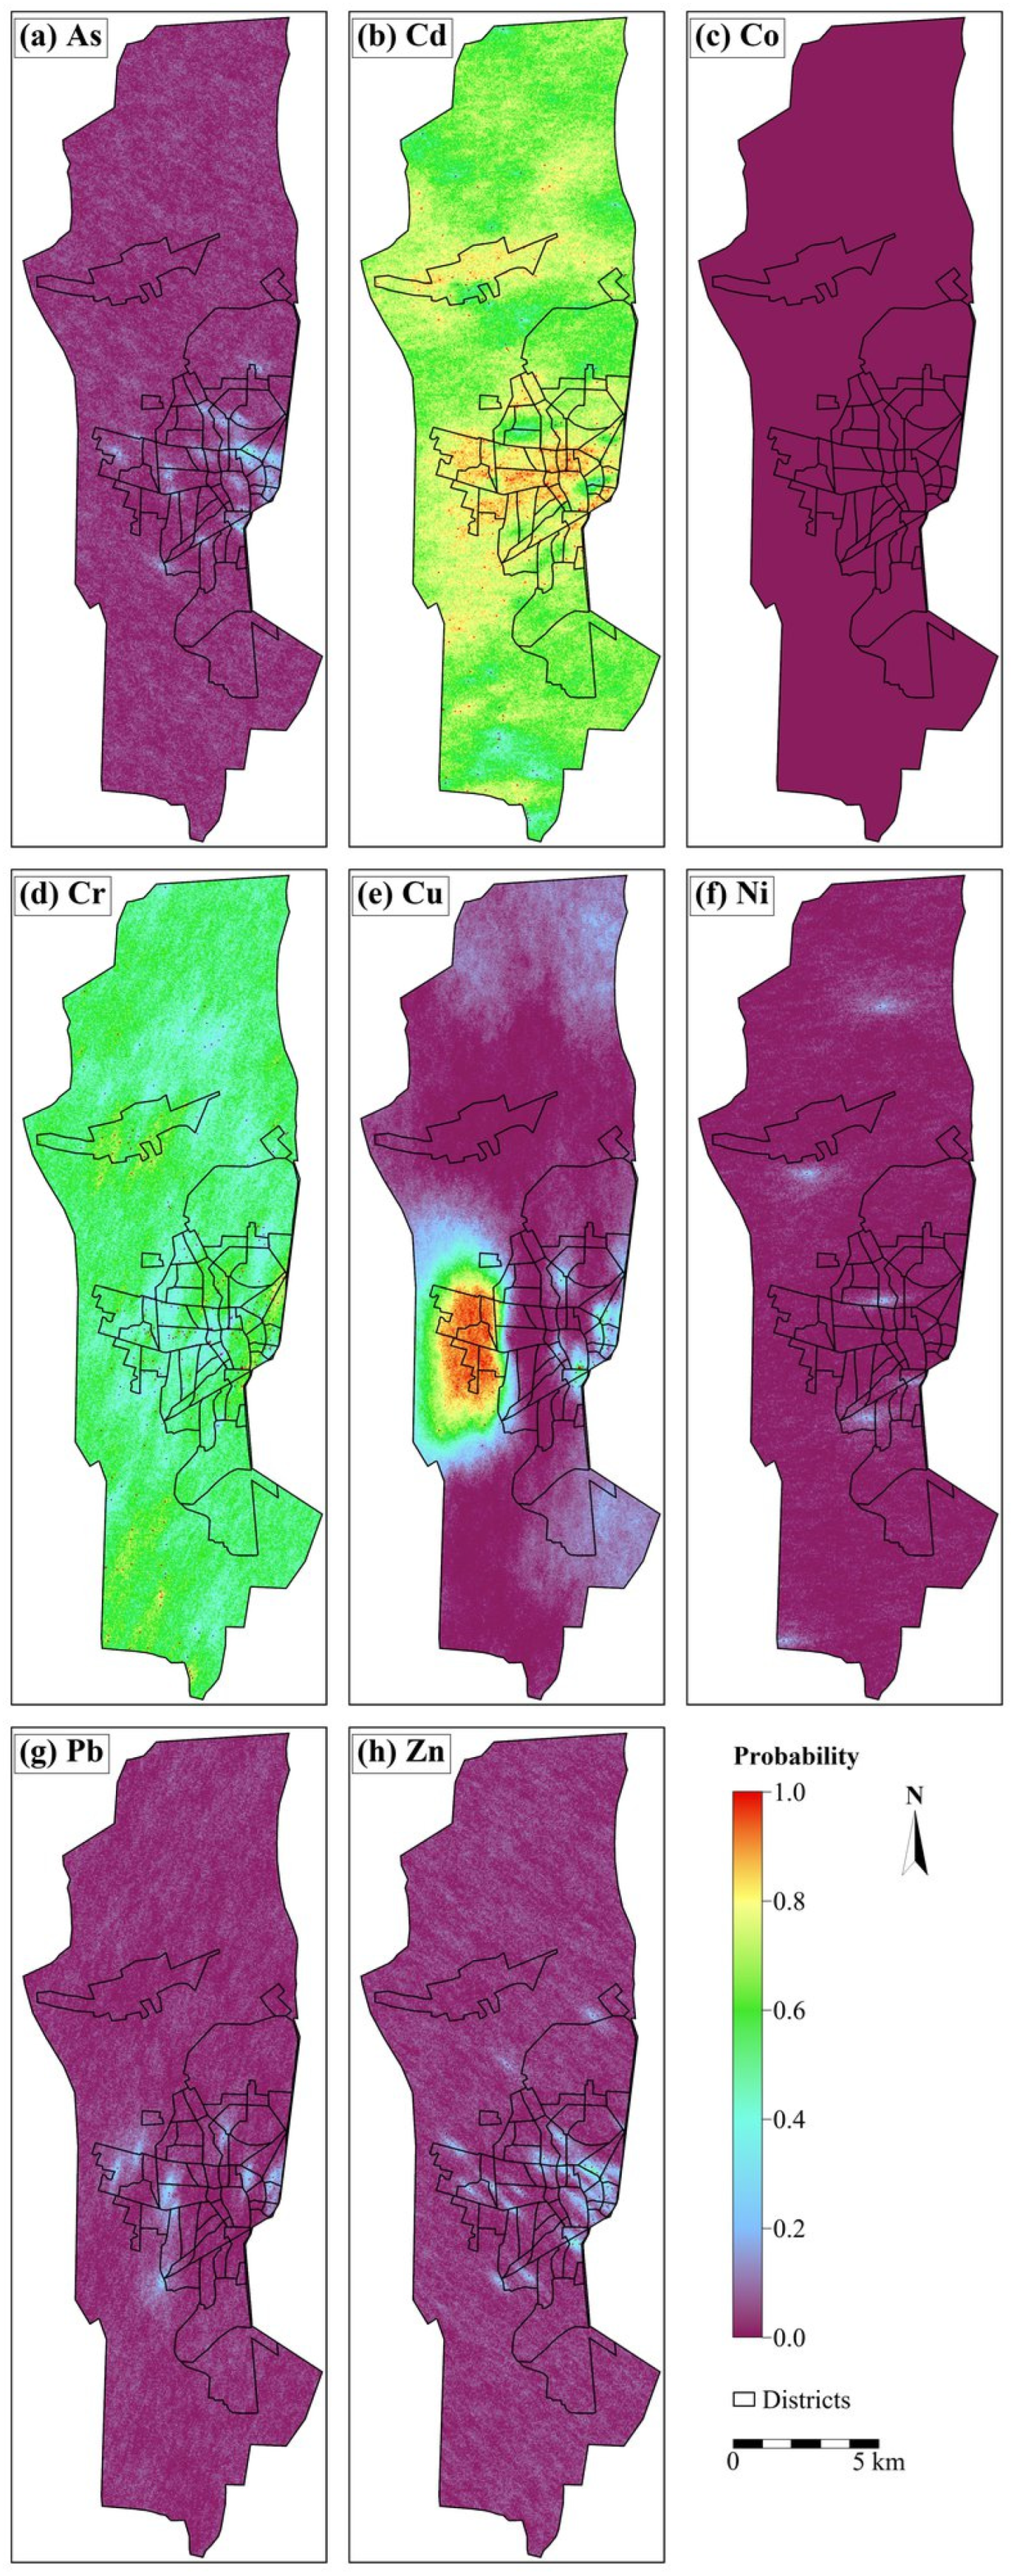
The exceedance probability maps for the eight heavy metals were generated from 100 SISIM realizations on the 50 m simulation grid (
Figure 3). Each map shows the probability that the Hungarian legal action level is exceeded at a given location (
Table 5). All exceedance probabilities are at point support; the 50 m cell size is a computational discretization of the continuous indicator field, not a block-averaged estimate. Block-support exceedance probabilities would be lower owing to the regularization effect [
17,
20].
3.2. Threshold Sensitivity Analysis
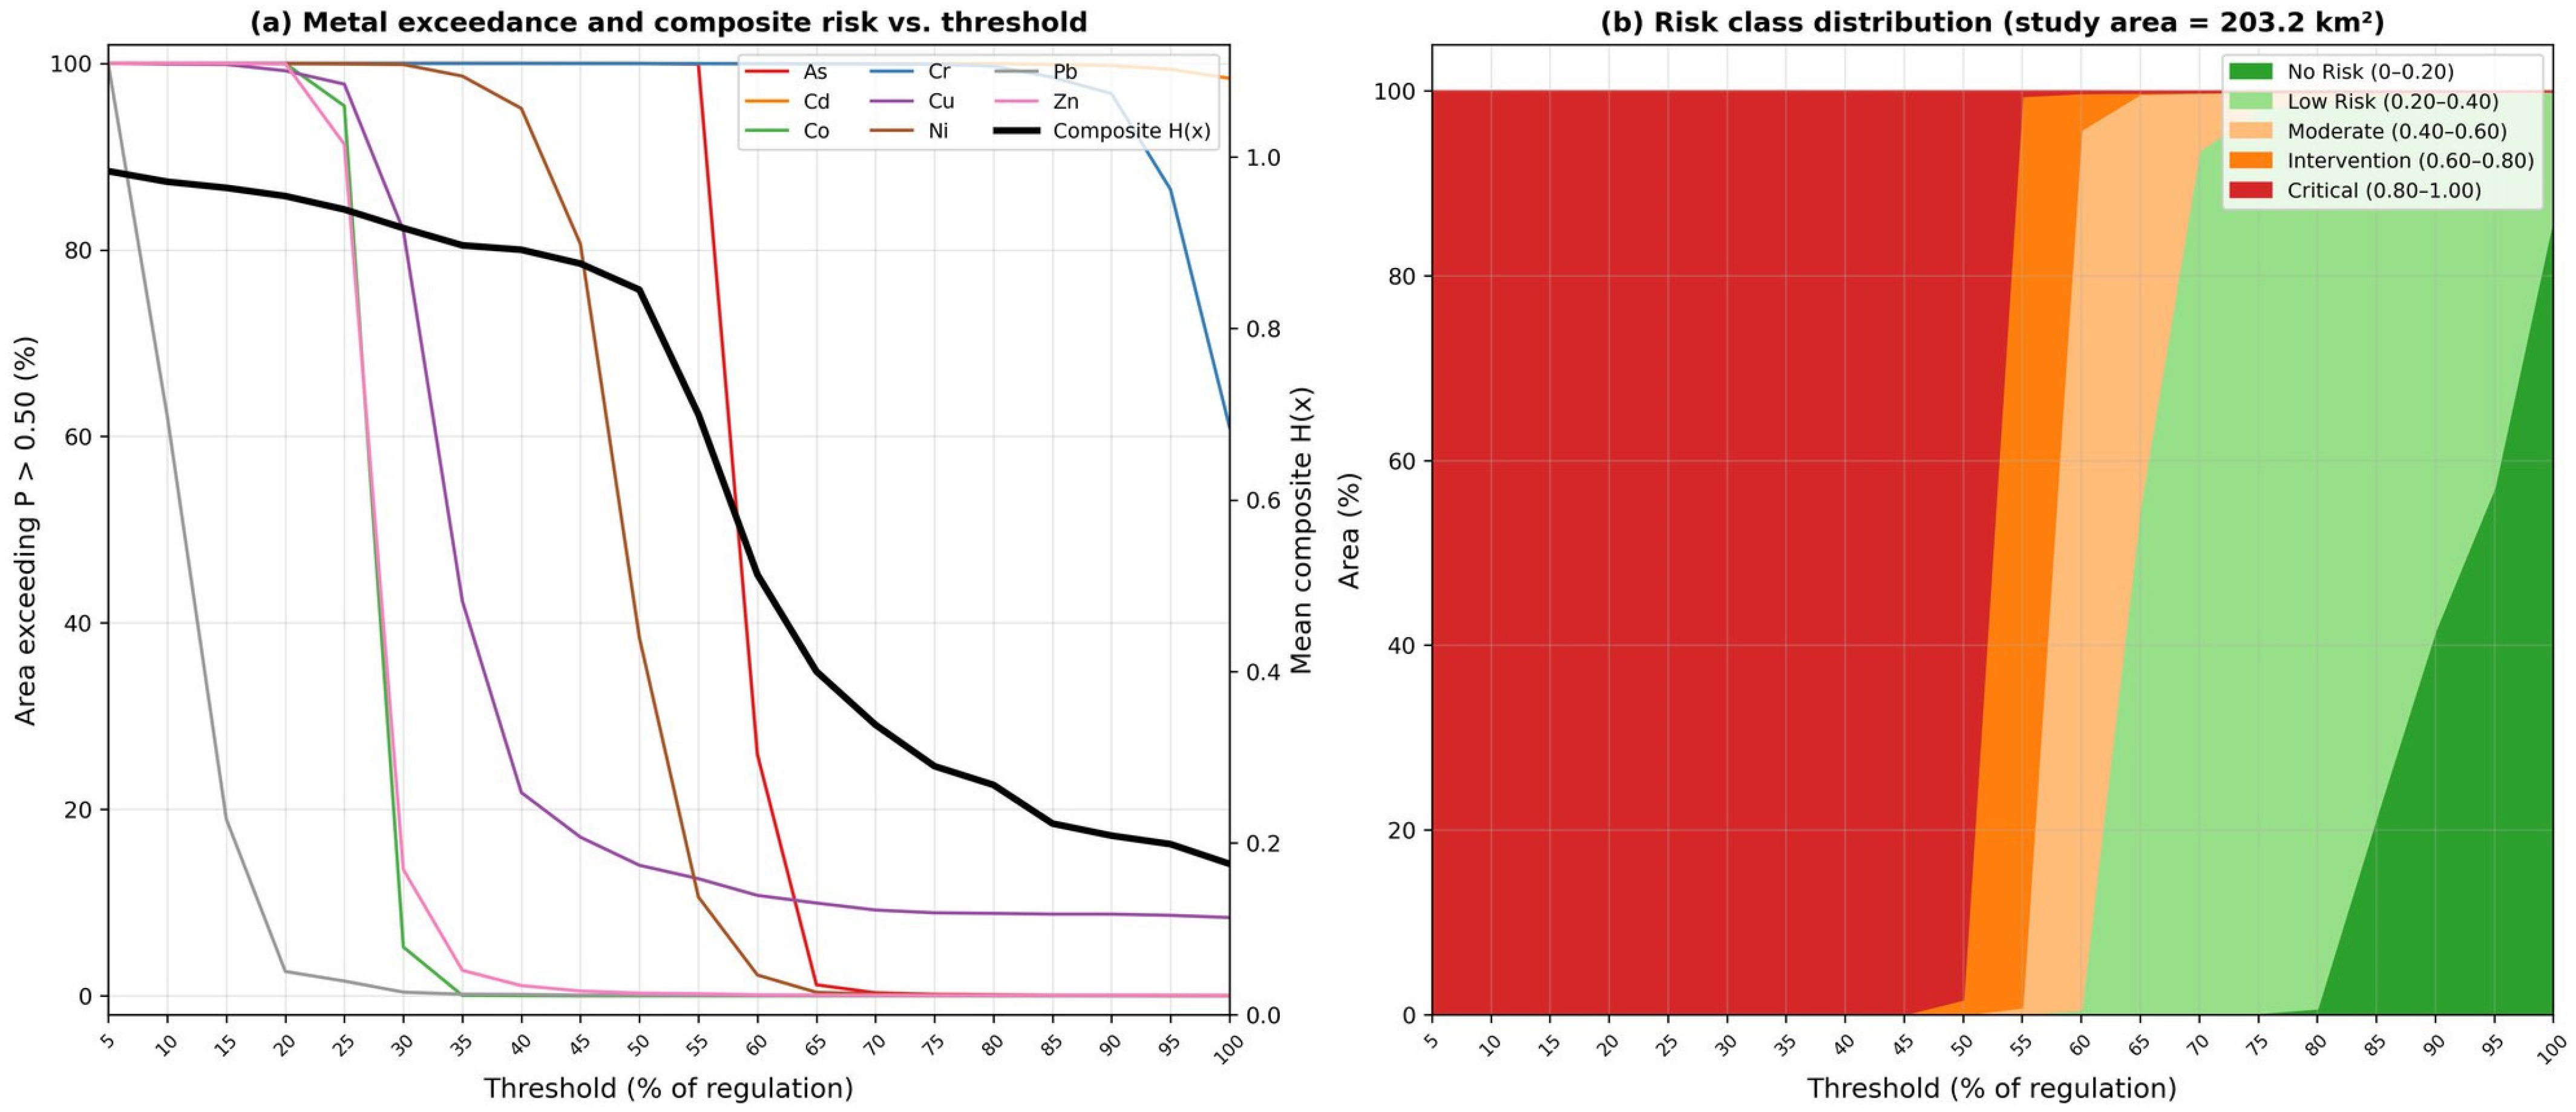
To examine the threshold dependence of the exceedance area, a systematic threshold sensitivity analysis was performed at 20 levels (5–100% of the Hungarian action threshold with a step size of 5 percentage points) (
Figure 4). The results allow the identification of three distinct metal response types.
The exceedance area for Cd remained above 98% over the entire threshold range at . The near-universal exceedance of Cd reflects a regulatory limit (1 mg/kg) set below the median concentration (1.33 mg/kg). The mean exceedance probability for the study area was 0.692, indicating that individual grid cells are not uniformly contaminated, but the proportion of the study area where exceedances were observed in the majority of realizations is nearly universal.
Arsenic, chromium, copper, and zinc are threshold-sensitive metals. The exceedance area decreased markedly with increasing threshold level, following characteristic S-curves with inflection points at metal-specific positions. Arsenic decreases from nearly 100% to nearly 0% between 55% and 70% of the regulatory level (about 8.2–10.5 mg/kg), while chromium decreases more gradually from 100% (at the 50% level) to about 82% (at the 100% level), the latter regenerated at
(
Table S4). The exceedance classification of these metals exhibits pronounced threshold dependence, reflecting the choice between regulatory action limits and lower screening values.
Cobalt showed no exceedance at the regulatory limit. Nickel had rare sample-level exceedance (6/253 samples; 2.4%) but produced a spatially negligible mapped exceedance area at , so neither Co nor Ni materially contributes to at the regulatory thresholds.
The composite decreased monotonically from about 0.94 at 25% of the regulatory limit to about 0.205 at 100%, reflecting the overall threshold sensitivity of the contamination field. The steepest decline occurred between 50% and 80%, where the threshold sensitive metals transitioned from widespread to localized exceedance.
3.3. Composite Exceedance Index and Priority Classification
The composite exceedance index (Equation (6)) was calculated for both children and adults at the regulatory thresholds. The average
for children was 0.205 across the modelled area. The higher composite values were mainly concentrated along major transport corridors, older residential areas, and public playgrounds, consistent with previously identified pollution sources [
5]. For adults, the average
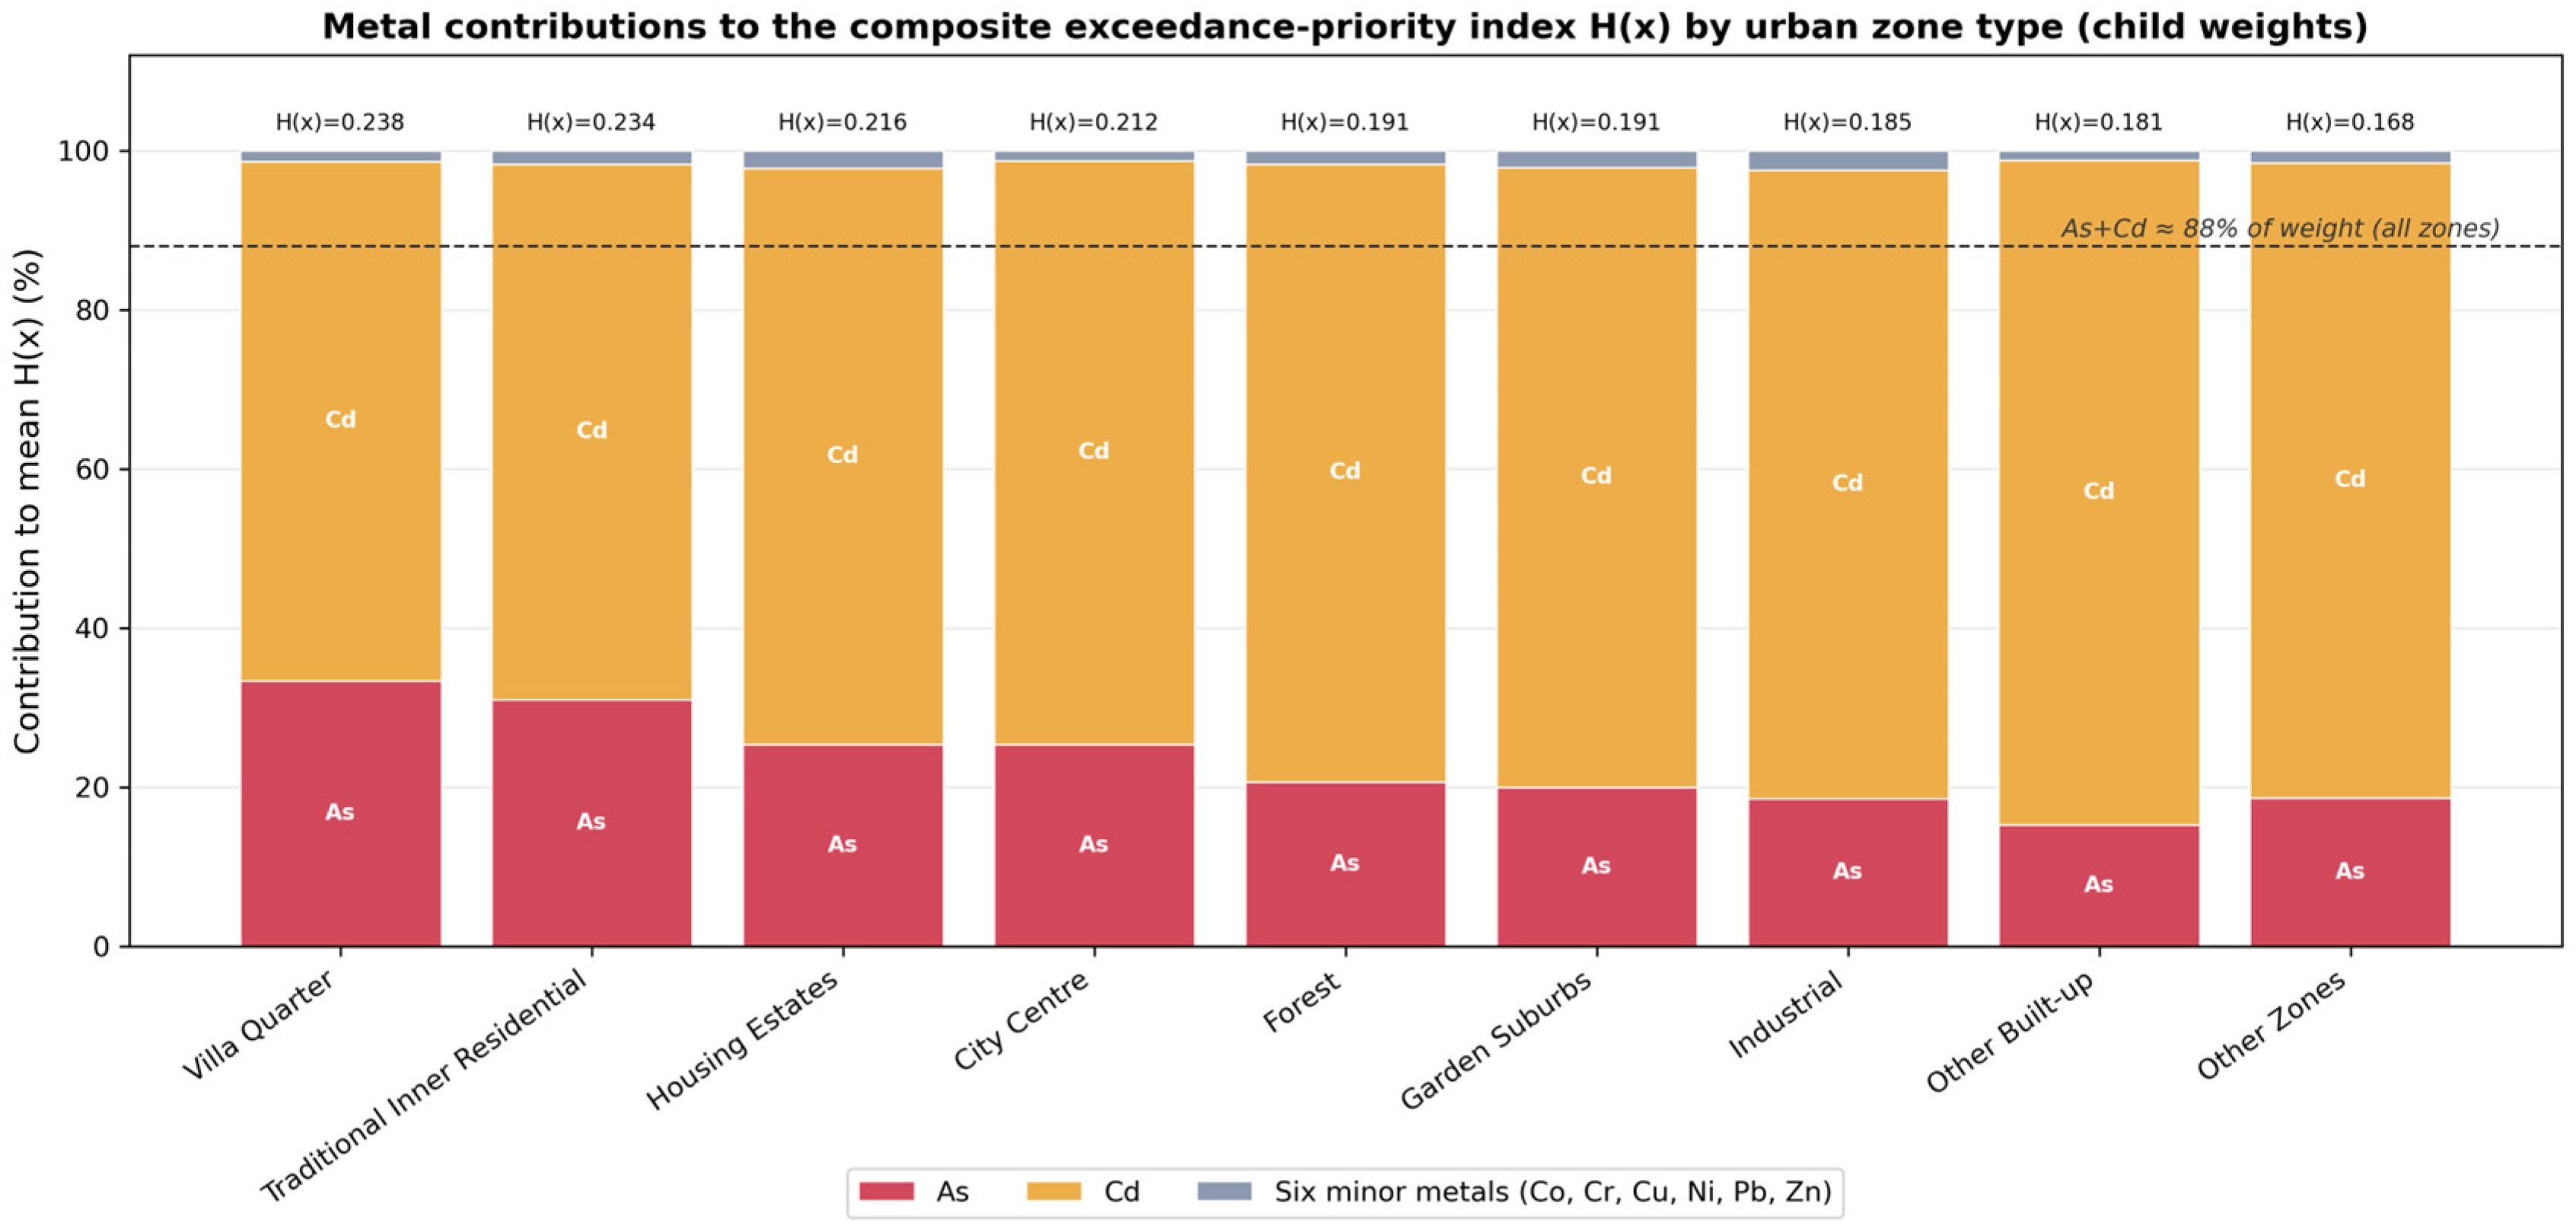
, a difference of less than 2%. These differences presumably reflect the fact that arsenic and cadmium, which dominate the composite index, receive the same normalized weights for children and adults, while lead, which shows the largest child–adult weight difference, has a near-zero exceedance probability and therefore contributes negligibly to H(x) regardless of exposure weighting. Since the child and adult indices are nearly identical, the results below are presented for children only.
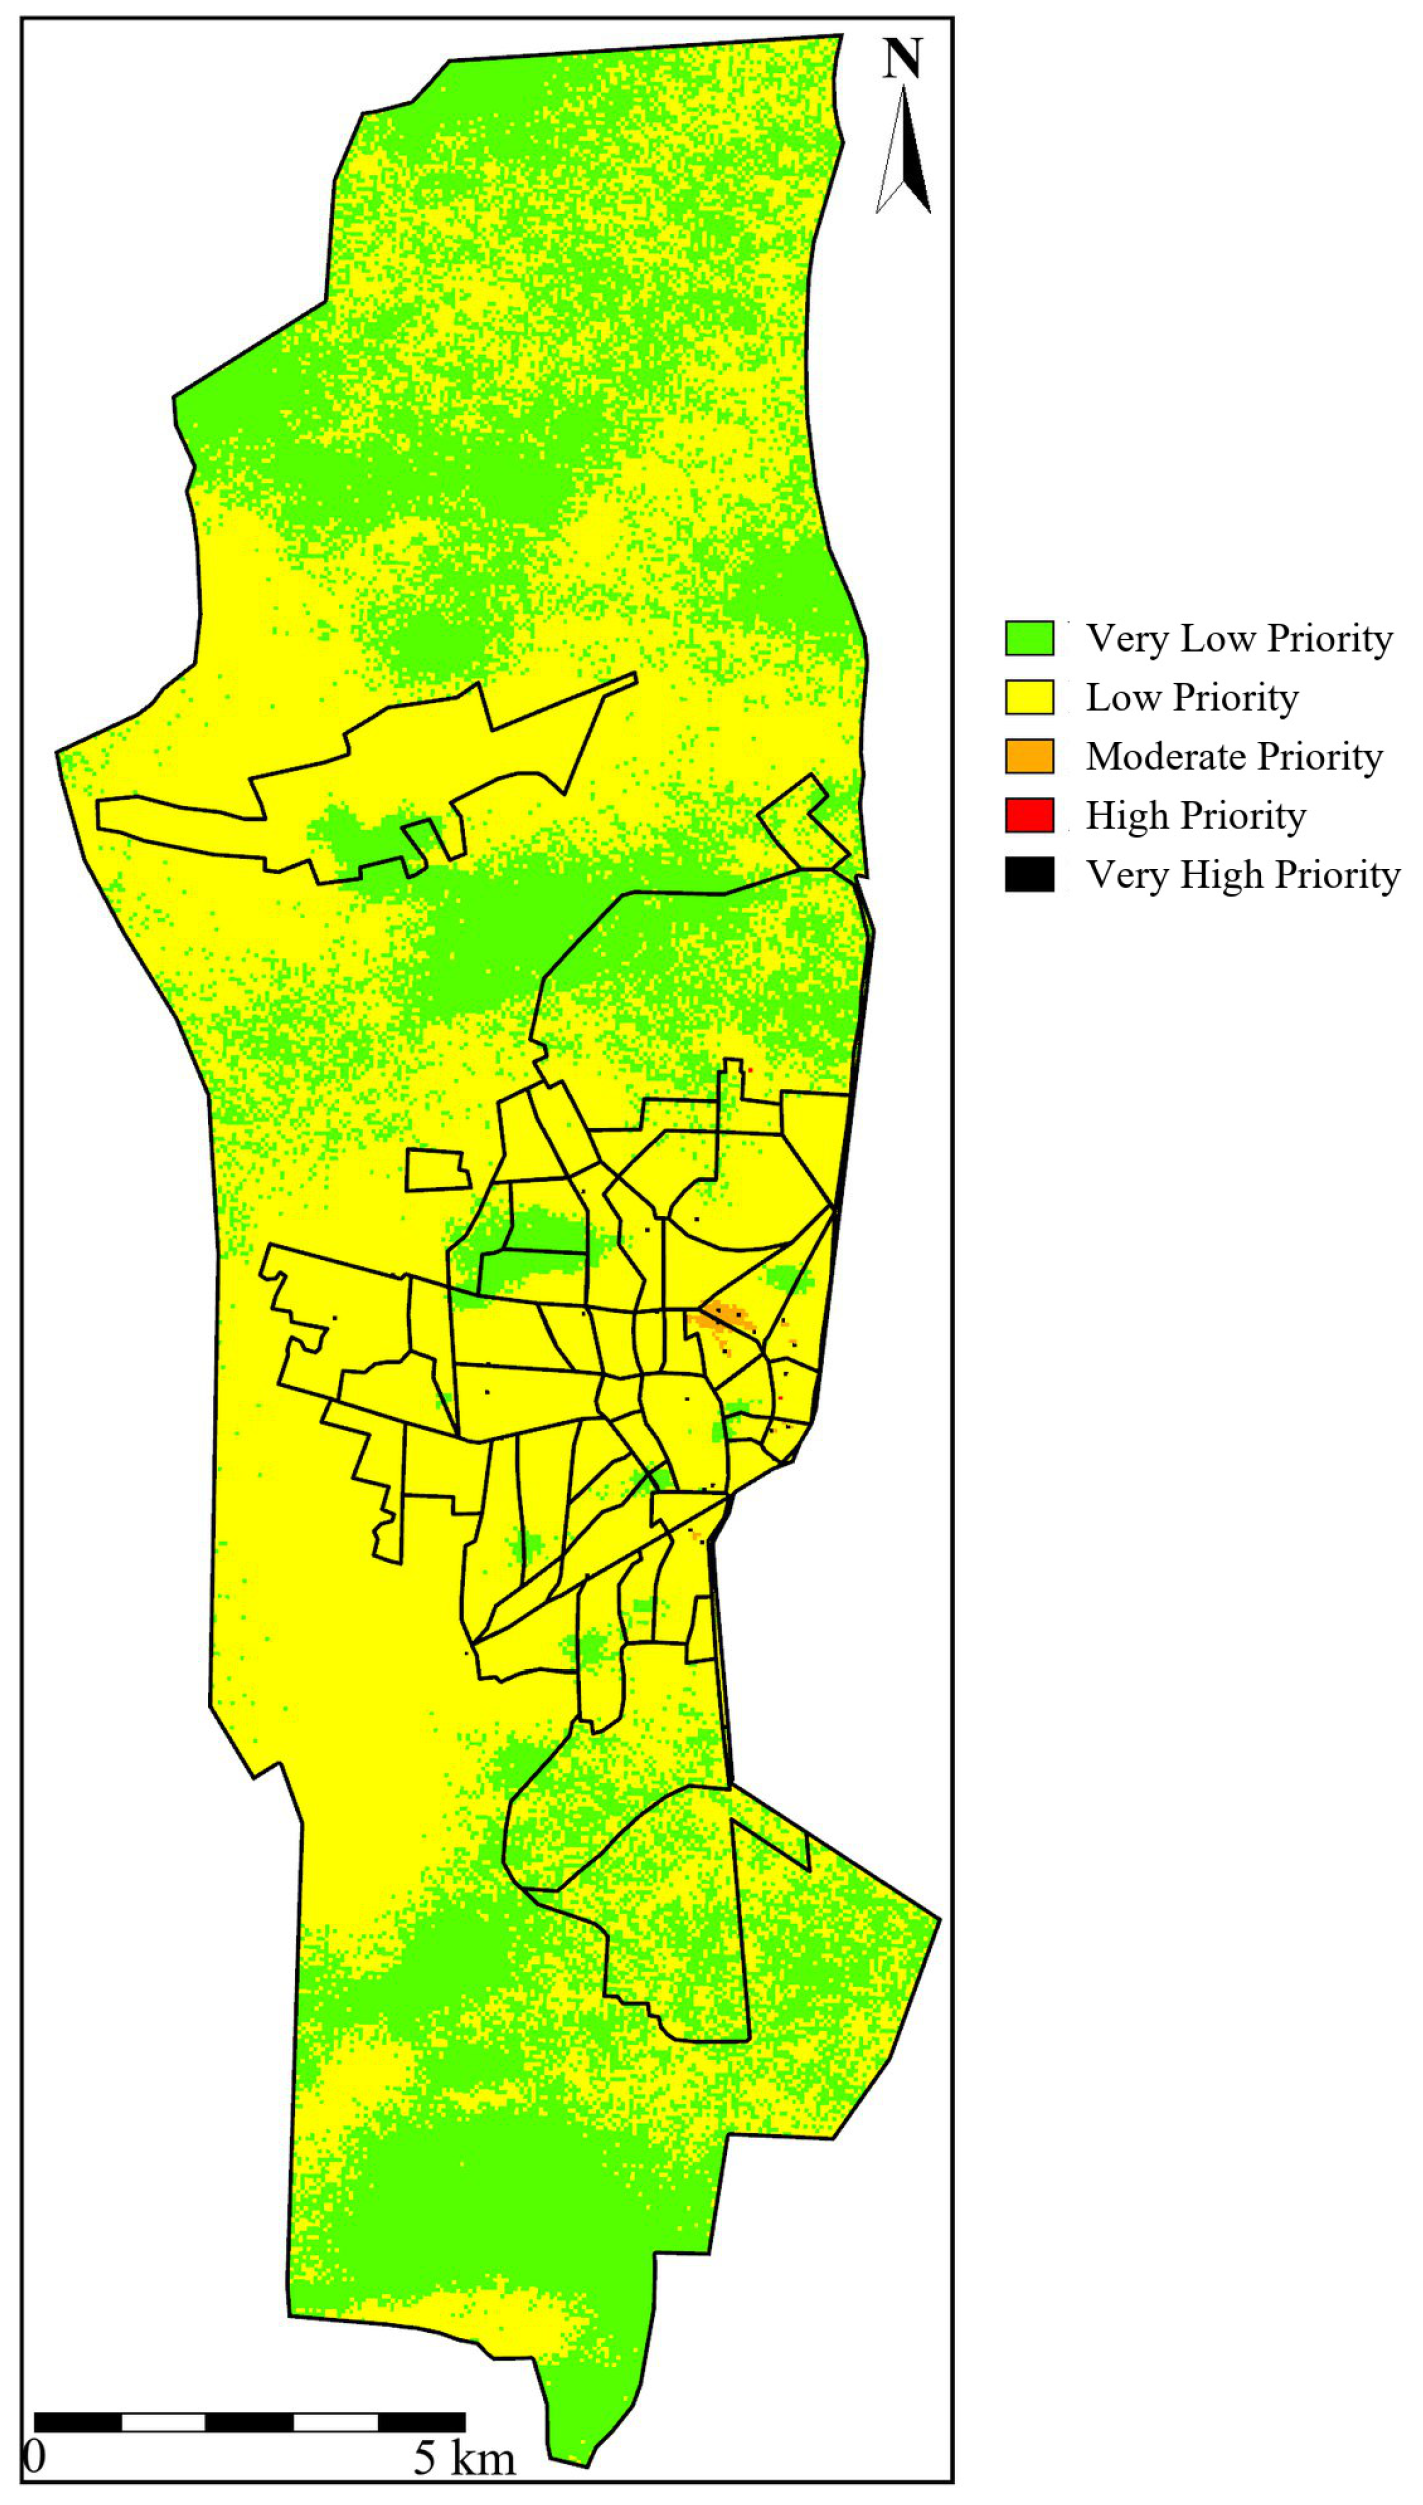
We classified the values of the composite exceedance index
into five priority classes (
Table 6,
Figure 5).
Metal-specific contributions to
by urban area type are shown in
Figure 6.
3.4. Zone-Specific Patterns and Spatial Autocorrelation
The average H(x) varies across the nine urban area types (
Table 7).
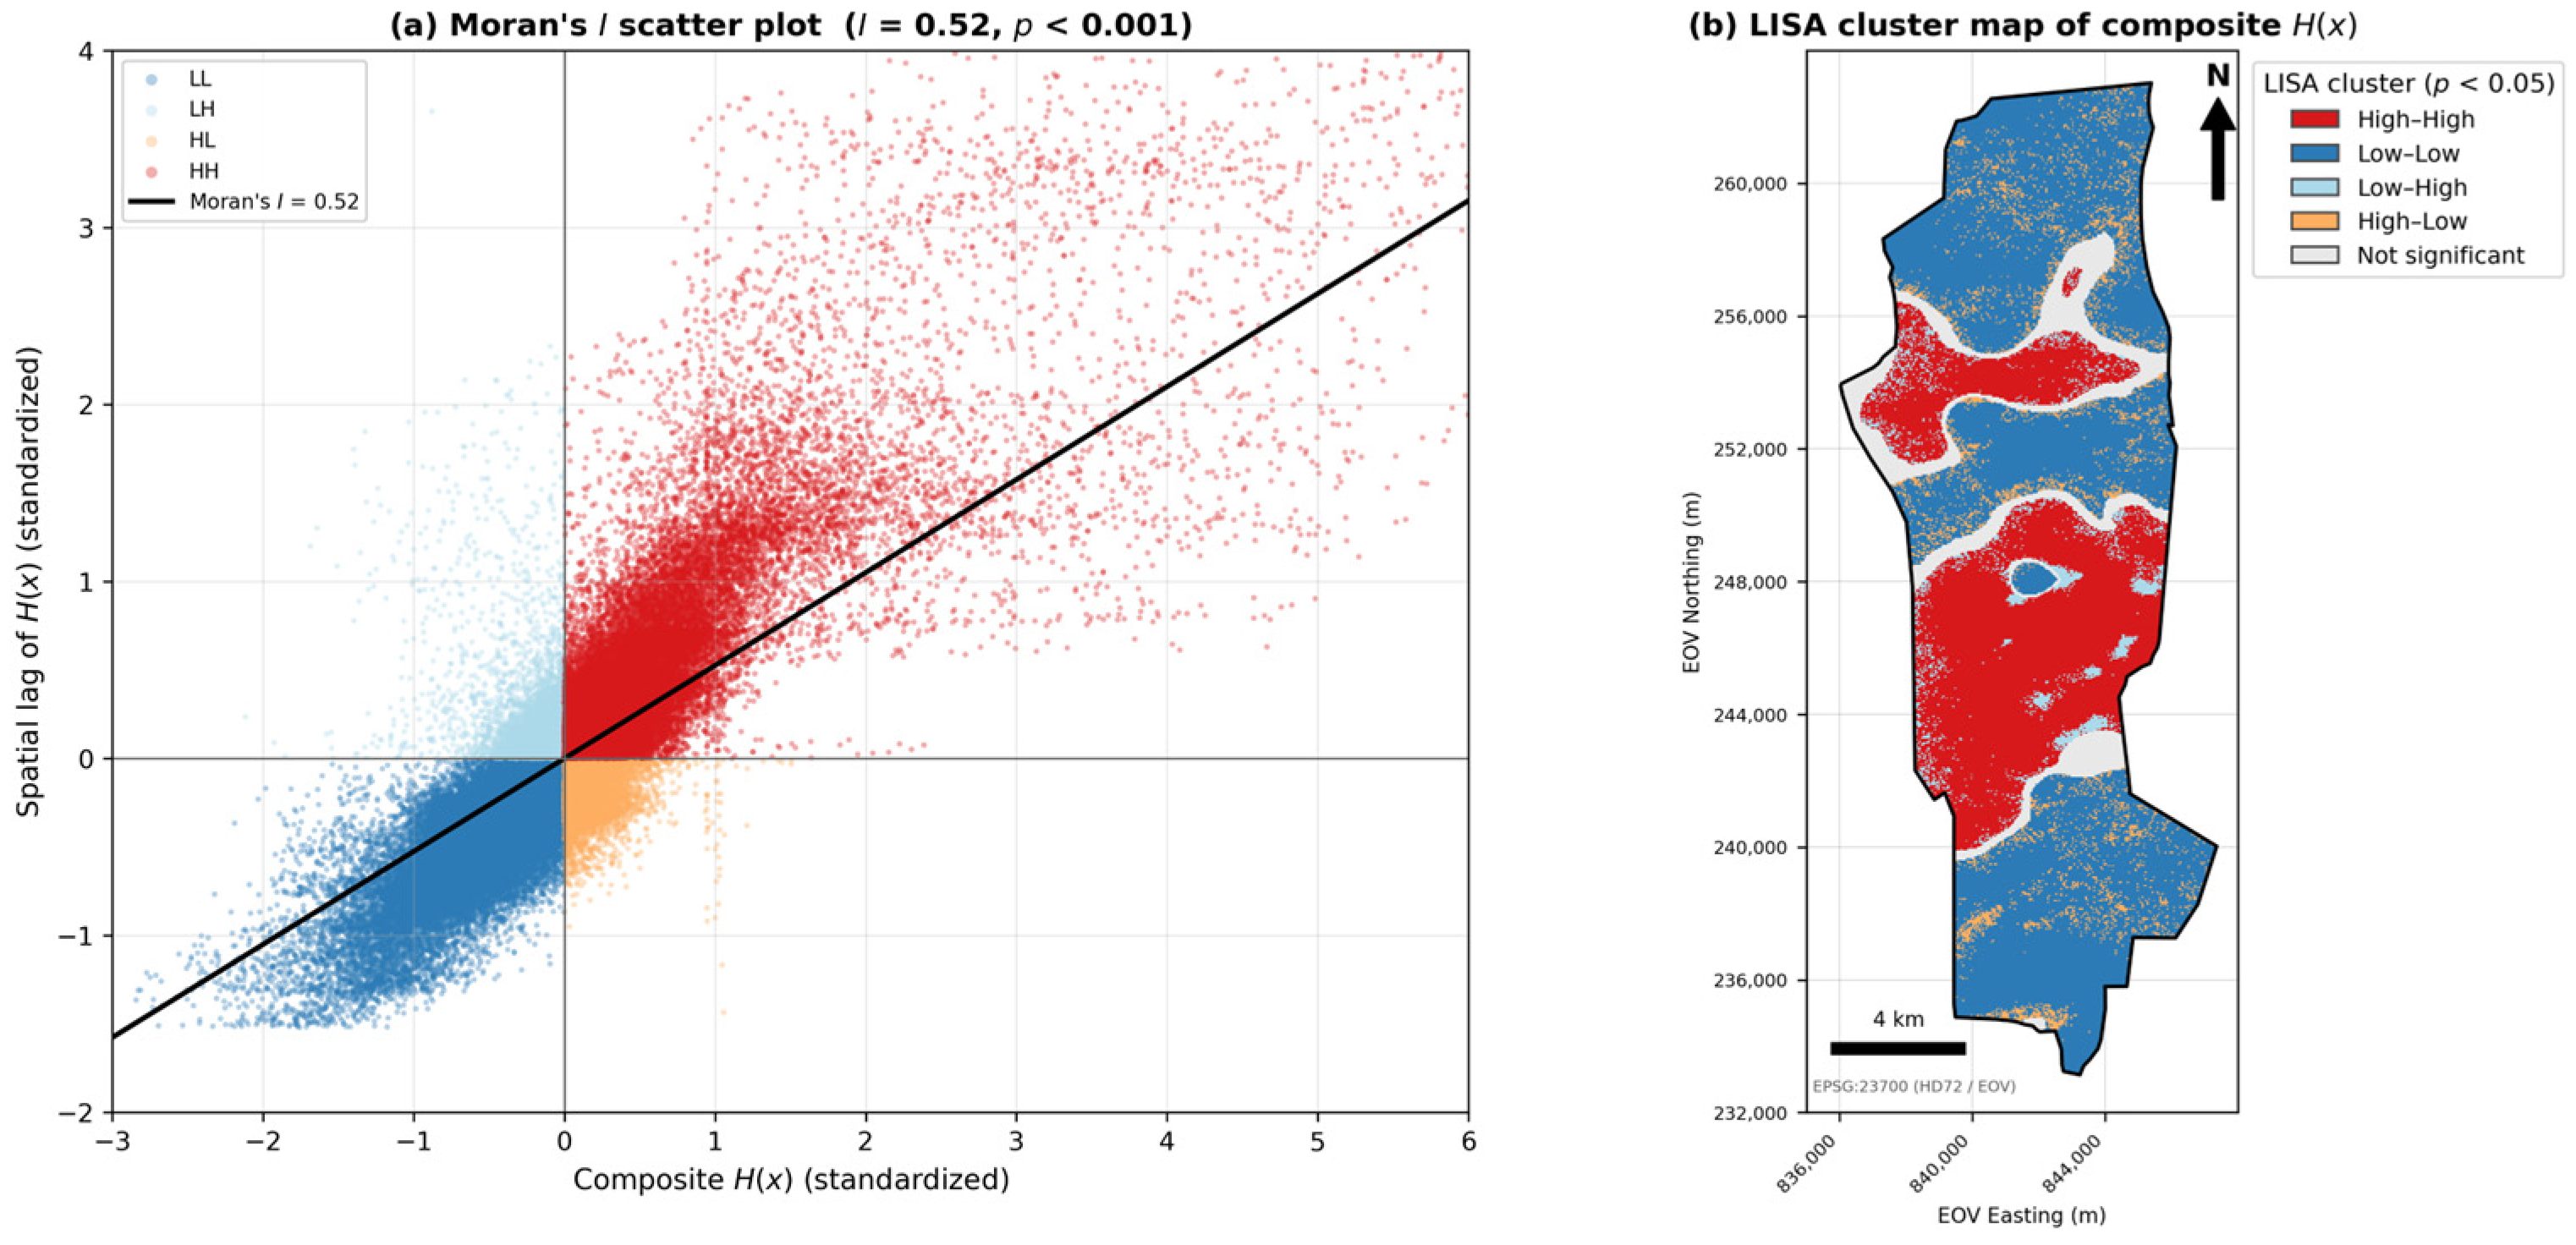
The global Moran’s
for the composite
was 0.52 (
, 999 permutations; row-standardized distance-band weight of ~700 m, corresponding to the mean sample spacing), confirming statistically significant positive spatial autocorrelation; high-priority grid cells cluster together and so do low-priority cells (
Figure 7). The LISA cluster map [
40] identifies a persistent High–High cluster in the east-central residential area, coinciding with the four sensitive receptors flagged in
Section 3.6.
3.5. Road Distance Analysis
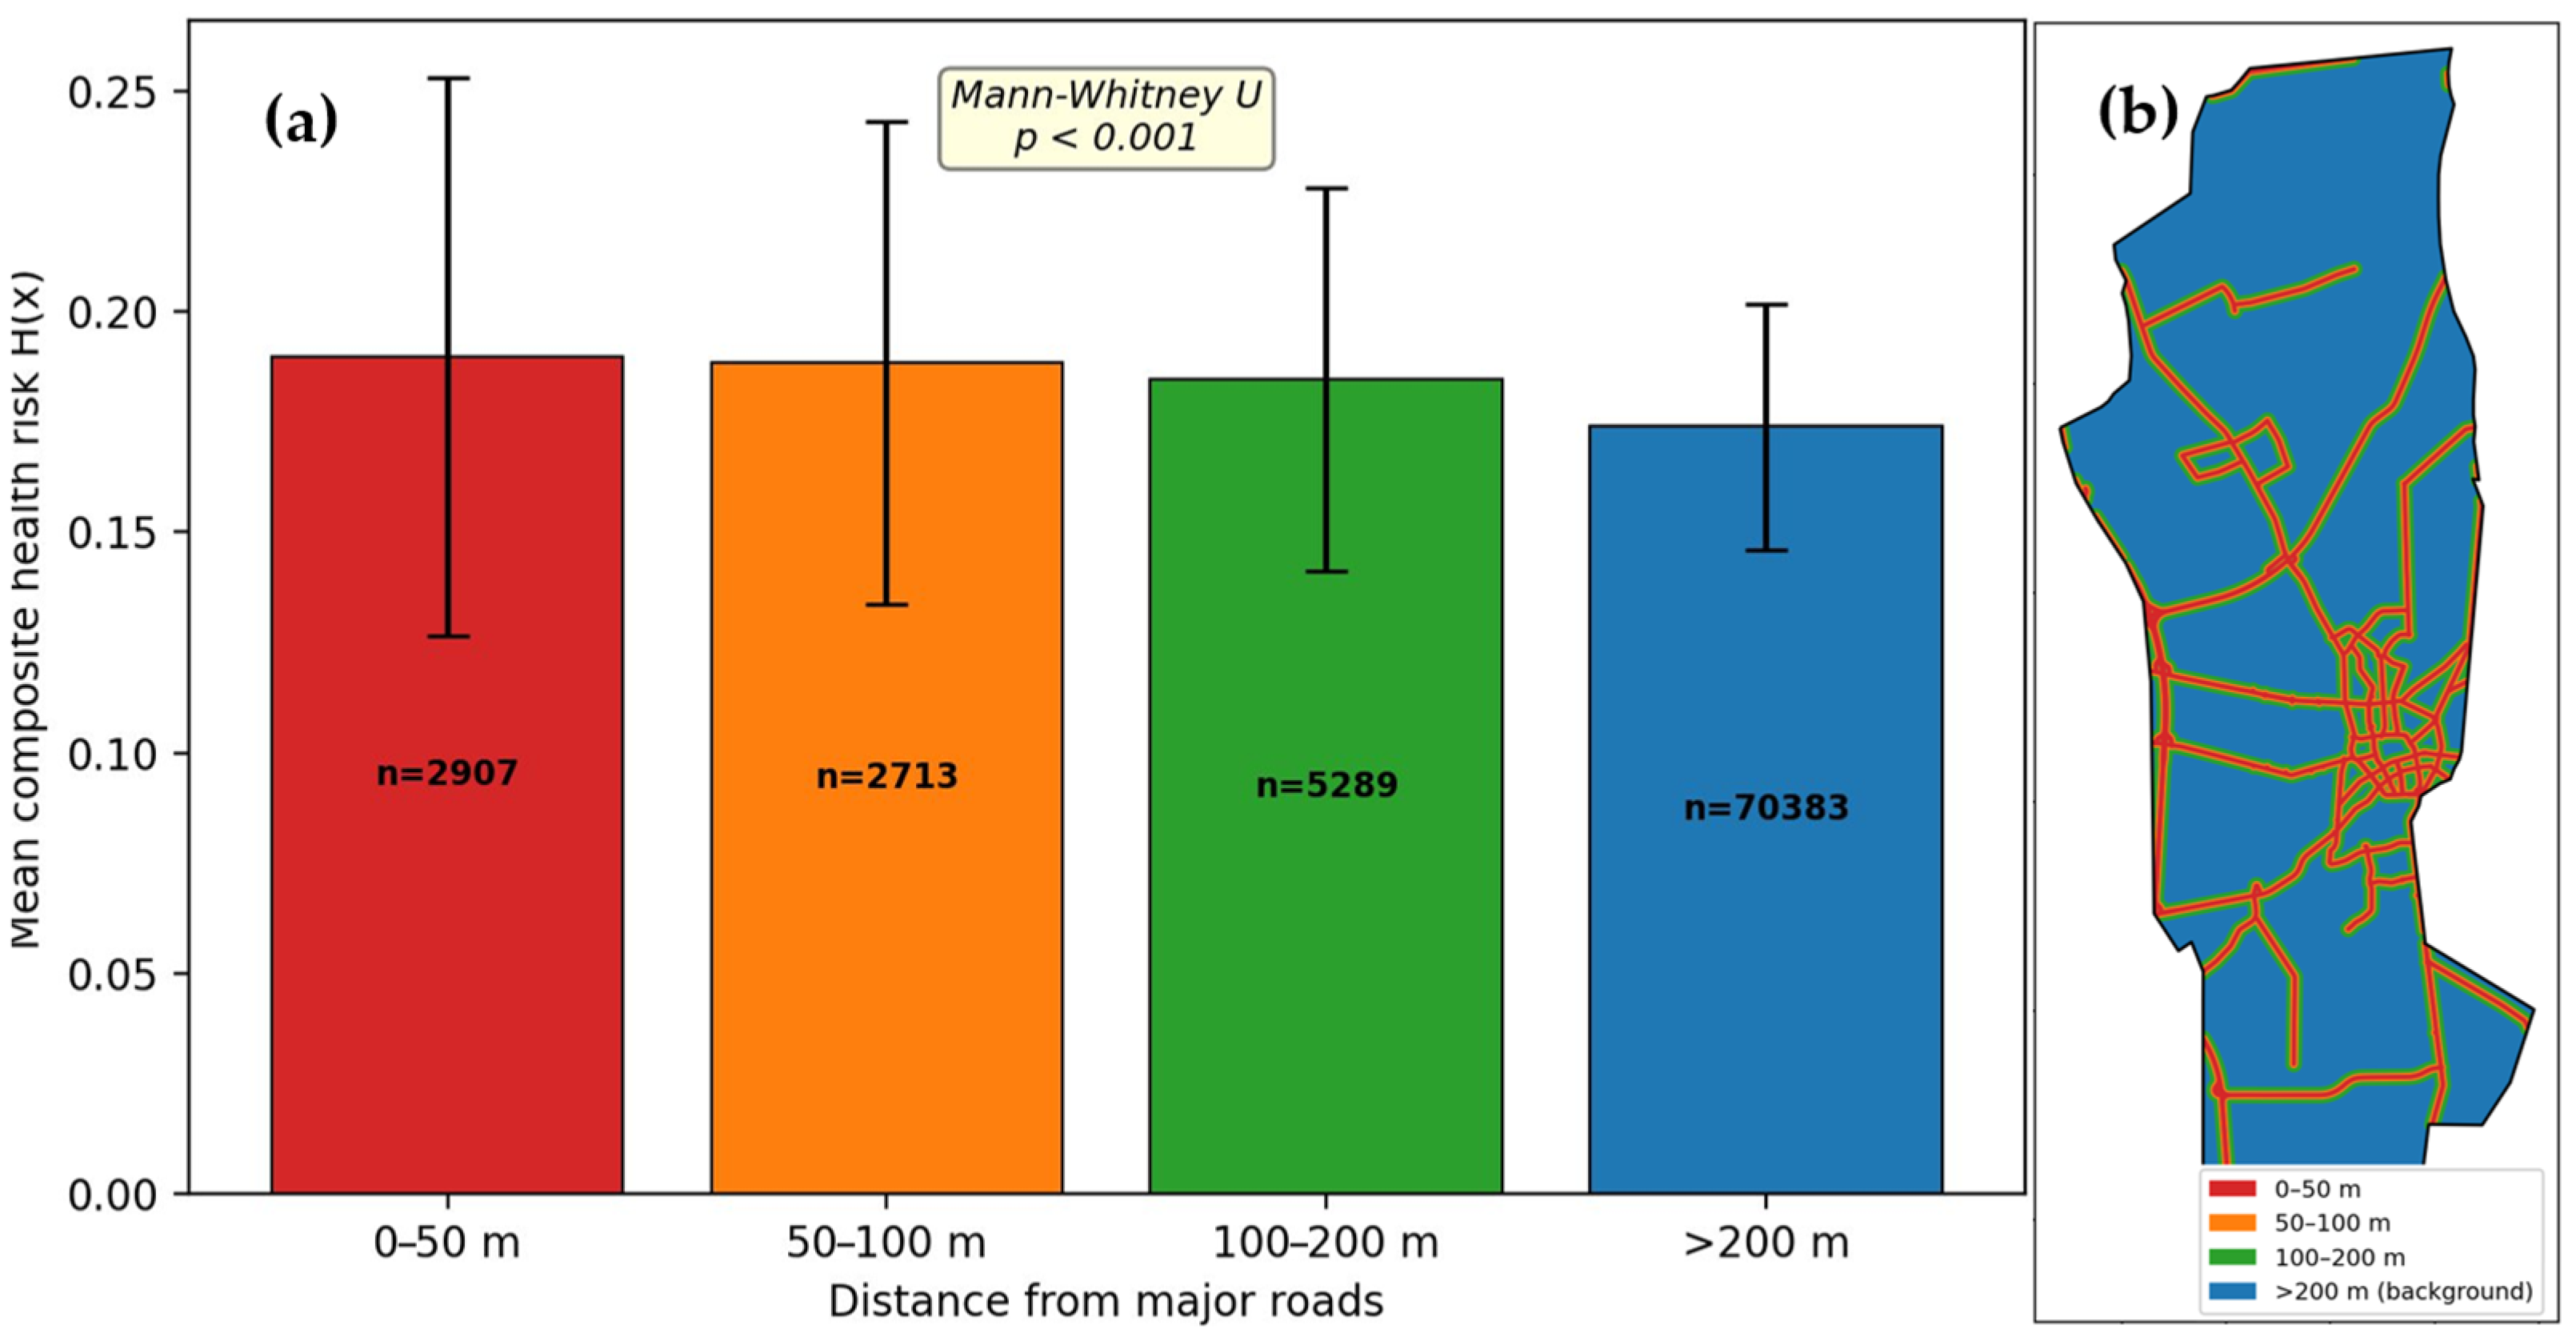
The average
decreased gradually from the primary and secondary roads towards the background (approximately 1000 road segments;
Figure 8,
Table 8).
3.6. Sensitive Receptor Assessment
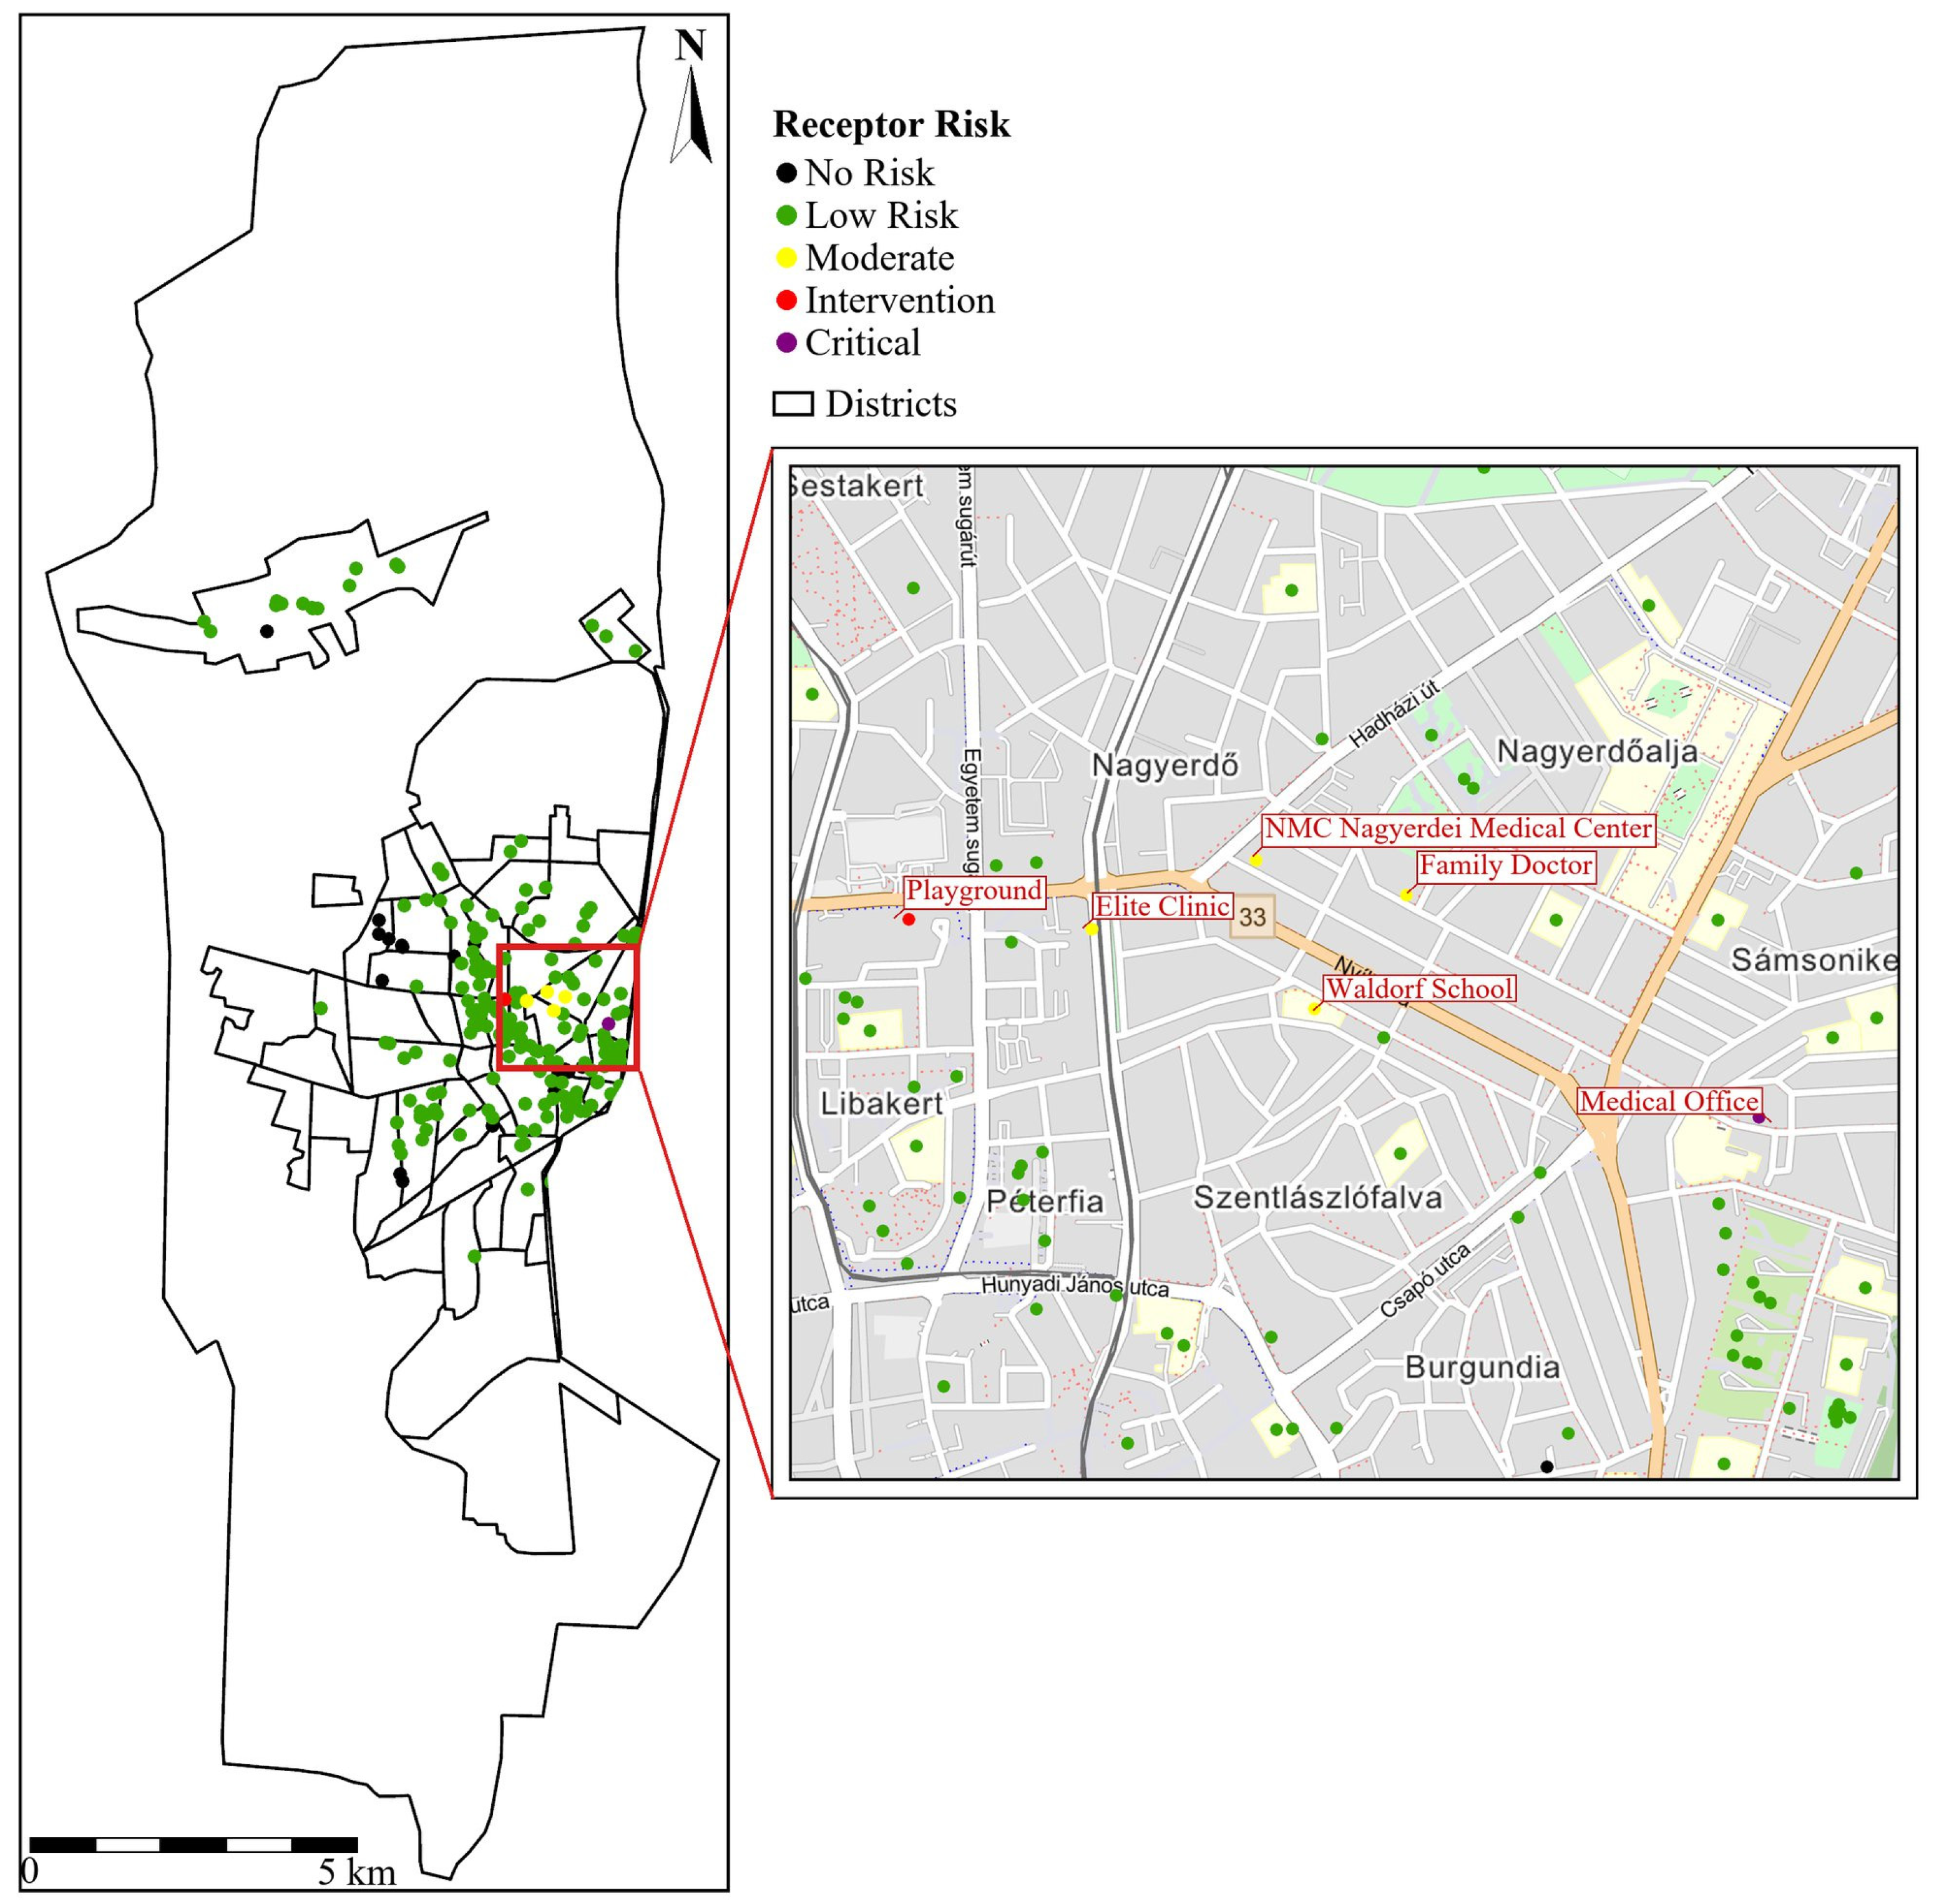
A total of 208 sensitive receptors (84 playgrounds, 65 schools, 28 kindergartens, and 31 childcare and health care facilities) were identified in the study area based on OpenStreetMap (
Figure 9). The composite exceedance index H(x) of each receptor was classified into five priority categories.
The H(x) values of the receptors were at the Very Low Priority () or Low Priority () level, with the exception of four receptors that exceeded the Moderate Priority threshold (): one nursery school (Very High Priority, ), one playground (Very High Priority, ), one childcare facility (Moderate, ), and one school (Waldorf School, Moderate Priority, ). All four high-priority receptors were concentrated in the east-central area of Debrecen.
The elevated H(x) estimated at the highest priority receptor (a nursery school, ) is associated with the combined elevated probabilities of arsenic and cadmium exceedances. Because children are more susceptible to the toxic effects of heavy metals, the four facilities in the urban core warrant confirmatory soil sampling to determine whether these values reflect true contamination or simulation uncertainty, while the vast majority of sensitive receptors require routine monitoring at most.
3.7. Uncertainty, Multivariate Indices and Validation
The unweighted CCI and MSI indices confirmed multi-metal co-occurrence in the urban core and finer spatial differentiation than the toxicity-weighted
; cobalt and nickel did not contribute at the regulatory thresholds. Definitions and statistics for CCI and MSI are provided in
Supplementary Text S2, and the corresponding maps are shown in
Figure S8. Realization-level uncertainty is shown in
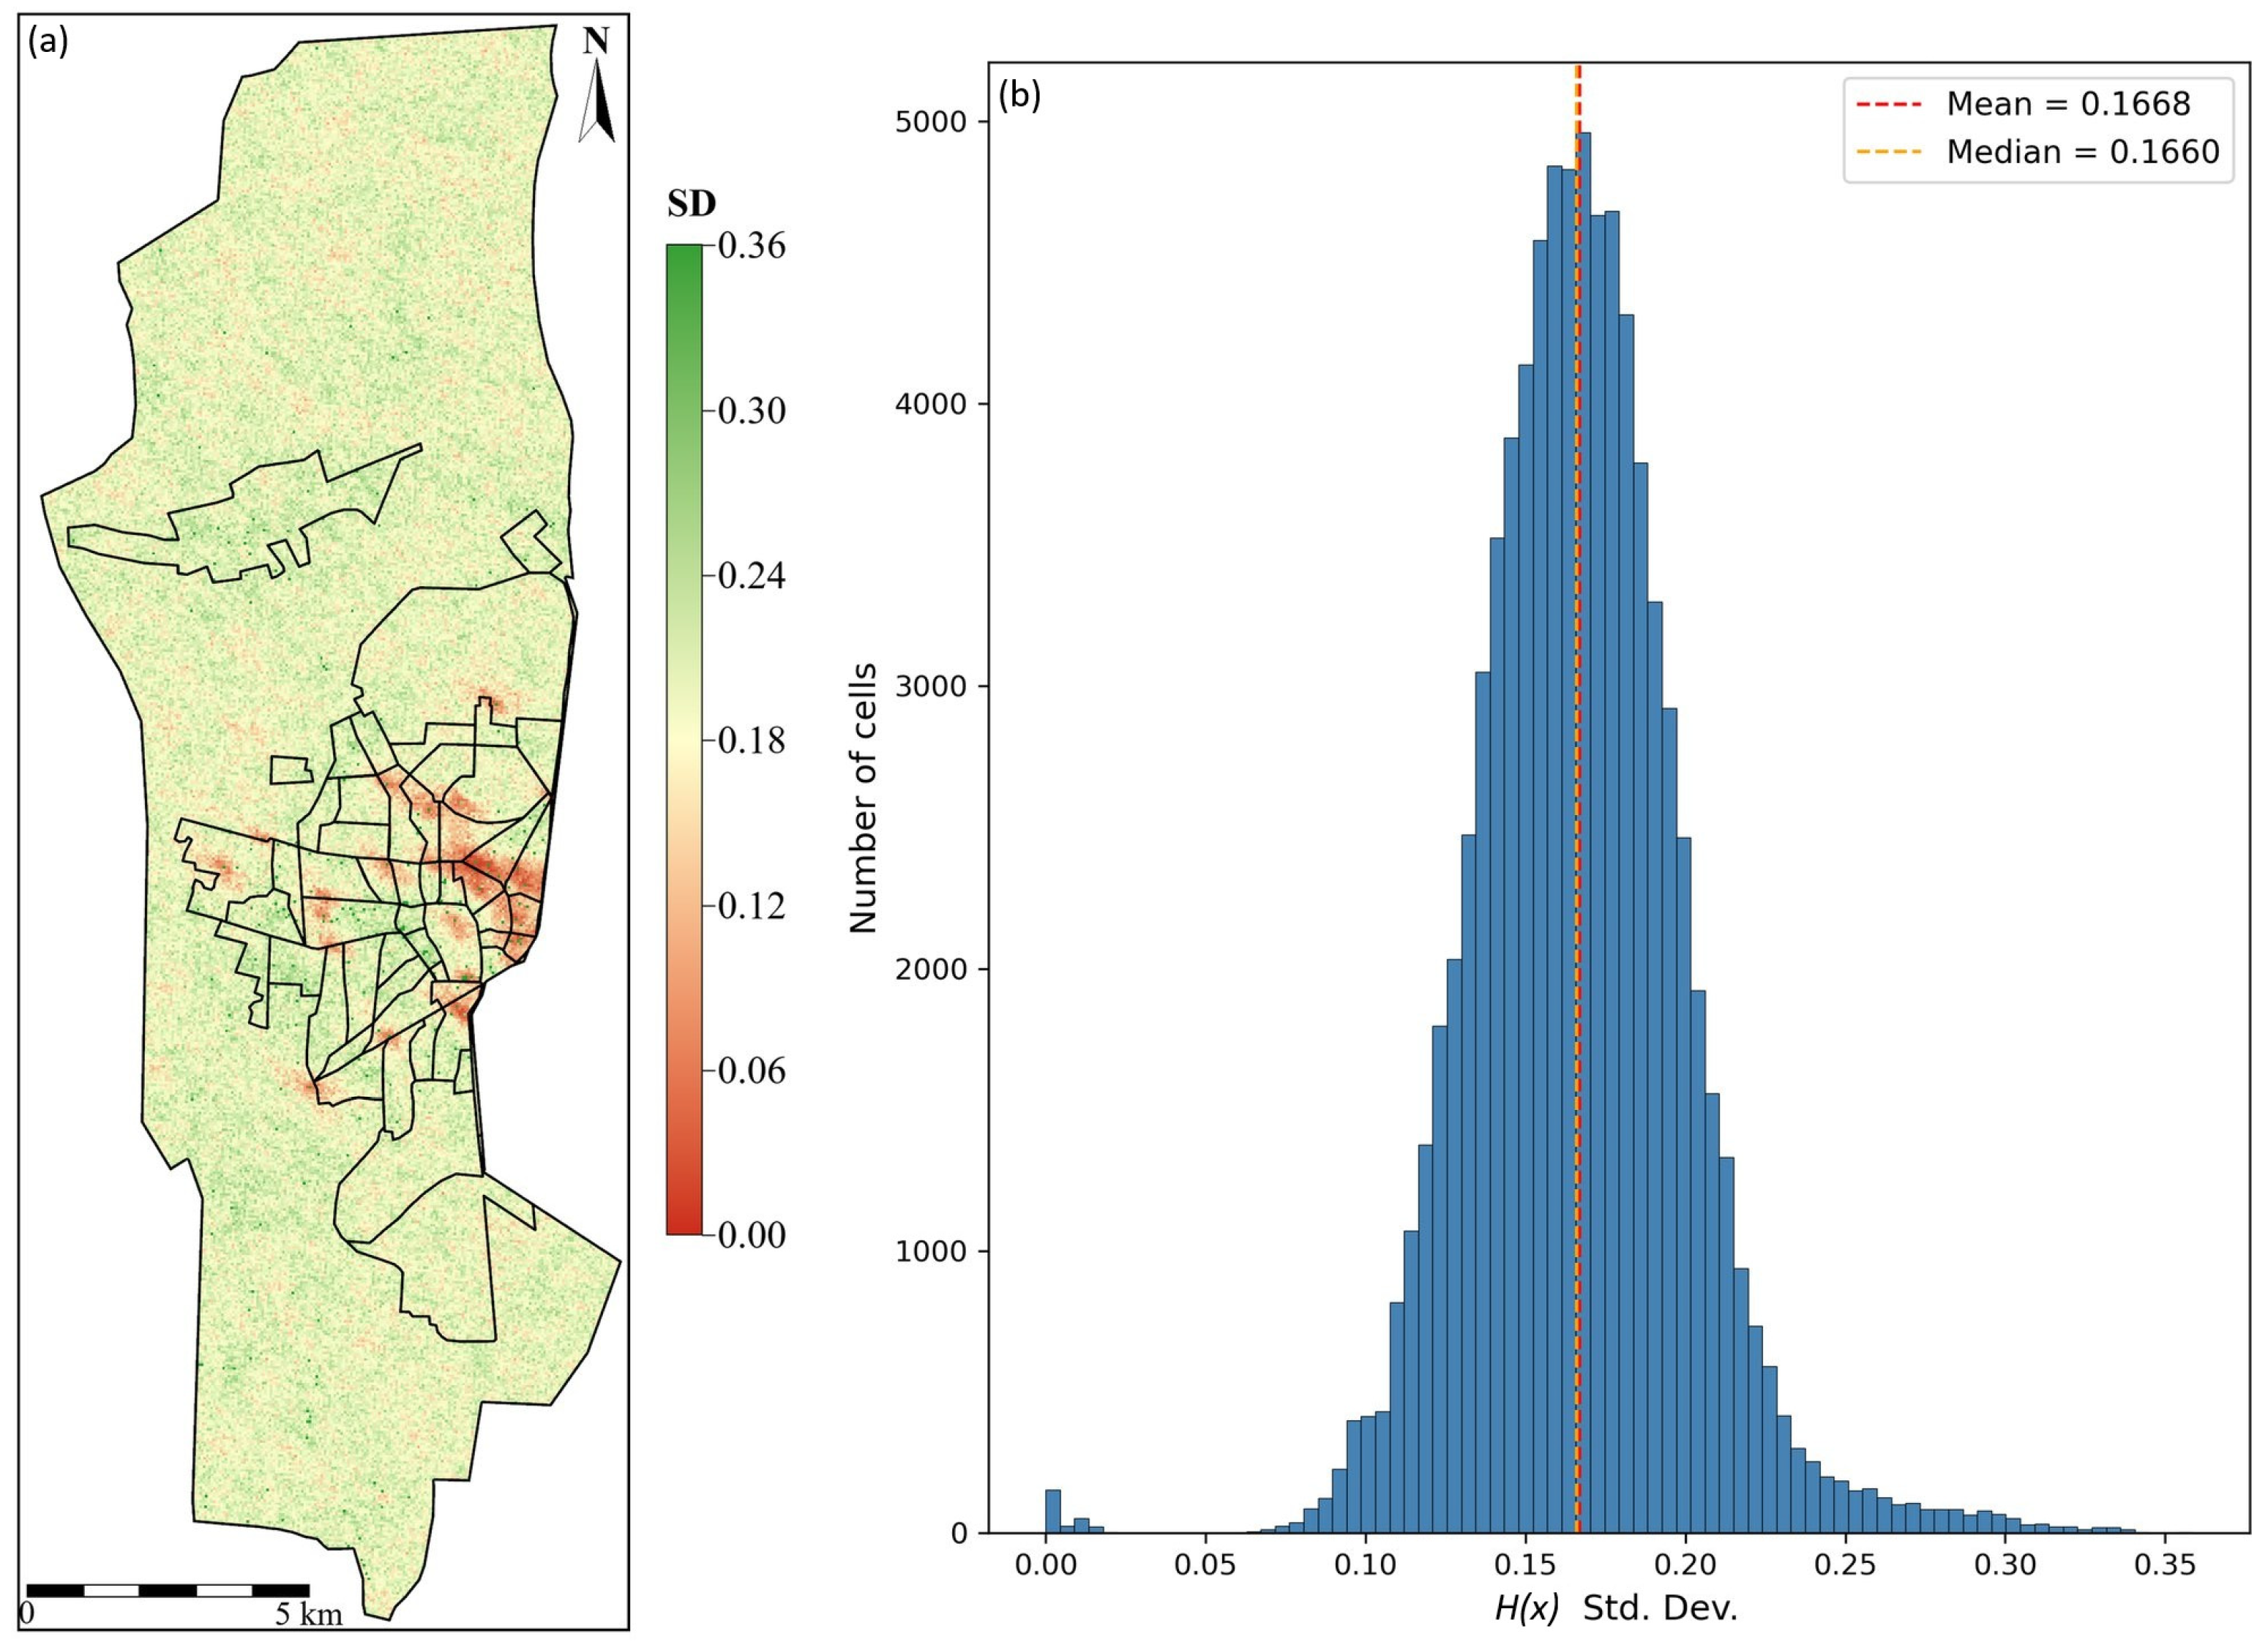
Figure 10.
Internal consistency was checked by comparing the per-realization mean of to the probability-based estimate. The average absolute difference was 0.029 (100 realizations). A comparison of 10-realization debug runs and 100-realization production runs reveals the practical consequence of an insufficient number of realizations. The average exceedance probabilities are stable across ensemble sizes (deviations < 0.01), but the binary classification at is sensitive: the exceedance area for cadmium increased from about 81% (10 realizations) to about 98% (100 realizations), and that for chromium from about 44% to about 61%. This sensitivity arises because grid nodes with a posterior probability near 0.50 lie in the transition zone, where the binary classification oscillates as additional realizations push the ensemble proportion over the decision threshold.
The Monte Carlo sensitivity analysis showed that the spatial ranking of
was robust to simultaneous perturbation of all child exposure relevance factors (
Table S3 and Figure S2, Supplementary Materials). Across 1000 iterations, the median Spearman rank correlation between baseline and perturbed
was 0.989 (
), and the mean absolute
difference was 0.0336. Approximately 25.6% of grid cells changed priority category, but this should be interpreted in relation to the low baseline mean
and the dominant Very Low Priority/Low Priority boundary at
: many cells lie close to this boundary, so small absolute shifts can change class without altering the broader spatial priority pattern.
The SISIM outputs were validated against three criteria. The average simulated exceedance rates for all metals were within 2% of the declustered observed rates. The indicator variograms of 50 randomly selected realizations reproduced the fitted variogram models within acceptable tolerances; a visual comparison of the experimental omnidirectional indicator variograms and the fitted models for all eight metals is provided in
Figure S7 (Supplementary Materials). The spatial patterns of the realizations showed a distribution consistent with known pollution sources and land use.
The stratified 10-fold cross-validation showed a mean accuracy of 0.87 and mean
of 0.68 across the eight metals (
Table S6, Figure S5, Supplementary Materials). Co had perfect accuracy but undefined
because no sample exceeded the 30 mg/kg regulatory threshold. Ni had high accuracy (0.976) but low
(0.514) and zero sensitivity because only 6 of 253 samples exceeded the 40 mg/kg threshold. These results support interpretation of the SISIM outputs as probability surfaces rather than deterministic classifications, especially for rare-exceedance metals.
5. Conclusions
We applied a probabilistic exceedance-prioritization framework integrating SISIM with toxicity-weighted composite exceedance indexing to screen heavy metal exceedance patterns in urban soil in Debrecen, Hungary.
Widespread threshold exceedance was confined to cadmium (approximately 98% of the study area at point support) and chromium (approximately 82%). Arsenic, copper, and zinc showed localized exceedance, cobalt did not exceed the regulatory limit, while nickel exceedance was rare and spatially negligible. Approximately 86% of the study area fell into the Very Low Priority class and 14% into Low Priority; less than 0.1% exceeded Moderate Priority. Four sensitive receptors in the east-central area reached Moderate or Very High Priority and warrant confirmatory sampling before definitive site-level classification.
Threshold sensitivity analysis confirmed that exceedance classification is a function of the chosen regulatory threshold, not a fixed property of the contamination field. Uncertainty was highest in transition zones near the exceedance boundary and the priority-class boundary, where additional sampling would most effectively reduce misclassification. Monte Carlo perturbation of exposure relevance factors confirmed strong spatial rank stability (median Spearman ), indicating that the broad priority pattern is robust even though boundary locations may change class.
The SISIM-based
framework provides a screening bridge between regulatory exceedance probability and site prioritization without recasting
as a formal
-type health-risk estimate. The framework is threshold-agnostic and transferable to other regulatory systems by substituting local metal concentrations, variogram parameters, regulatory thresholds and exposure relevance factors. All scripts, configuration files, and the input dataset are publicly available [
52,
53].