Article

Soil Nematode-Mediated Carbon and Energy Fluxes Along a Continental Gradient in Arid Ecosystems

1
Laboratory of Biotechnology and Valorization of Natural Resources, Department of Biology, Faculty of Sciences, Ibn Zohr University, Agadir 80000, Morocco
2
Faculty of Sciences, Biotechnology and Valorization of Plant Resources: Algae and Plants, Chouaib Doukkali University, El Jadida 24000, Morocco
3
Department of Veterinary Sciences, University of Pisa, Via Delle Piagge 2, 56129 Pisa, Italy
4
Department of Plant Pathology, Washington State University, Pullman, WA 99164, USA
*
Authors to whom correspondence should be addressed.
Soil Syst. 2026, 10(7), 73; https://doi.org/10.3390/soilsystems10070073
Submission received: 6 May 2026 / Revised: 22 June 2026 / Accepted: 25 June 2026 / Published: 30 June 2026

Abstract

Environmental gradients associated with continentality shape terrestrial ecosystems by modifying biodiversity patterns, community structure, and ecosystem functioning. In arid ecosystems, where water and thermal constraints are pronounced, soil organisms represent sensitive indicators of environmental change. Soil nematodes, due to their functional diversity encompassing bacterivores, fungivores, herbivores, omnivores, and predators, constitute effective bioindicators of soil health. We hypothesized that increasing continentality (thermal amplitude) would progressively reduce nematode diversity and functional complexity while altering CUE and metabolic footprints through community compositional shifts. A total of 130 soil samples were collected across three bioclimatic zones (island, coastal, and semi-continental) within the Arganeraie Biosphere Reserve, Morocco, and analyzed for nematode abundance, diversity, trophic structure, ecological indices, and functional traits. Nematode abundance and richness were significantly higher in the island zone compared to the coastal and semi-continental zones, while Shannon diversity did not differ significantly. The island zone exhibited a balanced trophic structure with higher proportions of bacteribores, fungivores, herbivores, and omnivores–predators, than the coastal and semi-continental zones. CUE values were consistently low (<0.5) across all zones, with the widest distribution in the island zone. Thermal amplitude was negatively associated with nematode biomass (R = −0.36), production (R = −0.27), and all trophic footprints, with herbivores showing the steepest decline (R = −0.51). Notably, total energy flux remained relatively stable despite reductions in diversity and trophic complexity, suggesting functional redundancy within dominant bacterivore guilds. These findings support the hypothesis that increasing continentality is associated with reduced nematode diversity and functional complexity, alongside altered carbon processing efficiency. This study underscores the value of integrating trophic, metabolic, and energetic approaches for assessing soil health vulnerability in Mediterranean agroecosystems under climate change.

1. Introduction

Soils are increasingly degraded under the combined pressure of anthropogenic disturbances and climate change, resulting in the progressive loss of their essential functions [1,2]. At the global scale, climate change is intensifying continental gradients, with Mediterranean and arid regions experiencing increased thermal amplitude, reduced precipitation, and more frequent extreme events [1,2]. These changes threaten soil biodiversity and the ecosystem services it supports, including nutrient cycling, carbon sequestration, and plant productivity [3,4], making it critical to understand how soil organisms respond to these interacting stressors in order to predict ecosystem resilience and design sustainable management strategies for degraded lands.
Healthy soils are defined by their capacity to function as living systems driven by biological processes, in which belowground biodiversity plays a central regulatory role [5,6]. Microbial and faunal diversity underpins major soil functions, including nutrient cycling, carbon storage, and plant productivity [3,4]. Among soil organisms, nematodes, representing approximately 80% of multicellular animals, constitute a highly diverse group of invertebrates that occupy all trophic levels of the soil food web [7,8]. Their transparent body structure, broad environmental tolerance, and sensitivity to changes in resource availability make nematode community profiling a rapid, cost-effective, and ecologically informative approach for assessing soil health across diverse land uses [7,9]. Nematodes are classified by diet into bacterivores, fungivores, plant parasites, omnivores, and predators, and by life strategy along a colonizer-to-persister gradient (cp 1 to cp 5), with each group responding differently to variations in food resources [10,11].
Beyond serving as indicators, nematodes actively interact with soil microflora and contribute directly to the carbon cycle: their respiration accounts for roughly 15% of emissions from fossil fuel use and approximately 2.2% of total soil carbon emissions [6,12,13]. As key predators of bacterial and fungal communities, they shape microbial structure, diversity, and activity; mediate carbon transfer across trophic levels; and strengthen energy flow from primary producers to higher trophic organisms [12,14]. As co-evolutionary partners of plants, nematodes also enhance plant health, acting more as allies than as pathogens within the rhizosphere [15], and cascading effects driven by omnivorous nematodes further support the multifunctionality of soil ecosystems [16].
Assessing this functional role relies on two complementary approaches: diversity analysis, which examines the abundance, variety, and composition of nematode communities [10], and functional analysis, which explores traits influencing growth, reproduction, and survival [17], together enabling the detection of subtle shifts in soil health [18].
Ecological indices built on these traits include the maturity index (MI), which captures disturbance effects through life-history traits [7,17]; the enrichment, basal, and channel indices (EI, BI, CI), which integrate life-history and feeding traits to characterize food-web structure [6]; and the nematode metabolic footprint (NMF), which combines life history, feeding behavior, and body size to quantify carbon released during respiration (respiratory C) and carbon allocated to growth and reproduction (production C), linking community composition to carbon cycling and ecosystem services [6,12,18,19]. Complementing these trophic-structure metrics, metabolic rate (F) quantifies the actual energy flux through each trophic level, linking community composition to functions such as nutrient cycling and decomposition [20,21], while carbon use efficiency (CUE), defined as the ratio of carbon production to total carbon uptake, links community-level metabolism to soil organic carbon dynamics [22].
These nematode-mediated processes are themselves shaped by environmental stressors, including temperature extremes, drought, salinity, and nutrient depletion, which are major drivers of global change affecting plant growth, soil microbial communities, and belowground food webs worldwide [23,24]. On the global scale, these stressors constrain plant productivity and alter vegetation composition, with cascading effects on soil carbon inputs and microbial activity [25,26]. Belowground, they disrupt soil microbial communities and food-web stability, modifying nutrient cycling pathways and ecosystem functioning [27,28]. In arid and semi-arid ecosystems, these interactions are particularly acute: high thermal amplitude increases evapotranspiration, reducing soil moisture availability and increasing osmotic stress, while simultaneously altering soil pH and organic matter decomposition rates [29]. These changes cascade through the soil food web, affecting nematode community composition, trophic structure, and metabolic efficiency [30,31]. Continental gradients, which encompass variations in temperature, precipitation, and elevation, integrate many of these stressors and strongly influence soil properties and environmental conditions, posing major challenges for terrestrial biodiversity and ecosystem processes [23,24]. While most studies have addressed these factors in isolation, environmental fluctuations simultaneously affect microbial physiology, carbon dynamics, and community activity [32,33], and nematode diversity, community structure, and distribution respond jointly to temperature, precipitation, humidity, edaphic factors, and altitude [30]. However, the effects of climate variables and continental gradients, in particular on nematode functional traits, remain poorly understood, especially in semi-arid Mediterranean ecosystems.
To investigate how the continental gradient shapes soil nematode communities, we collected soil samples from three zones along a gradient of increasing continentality within the Arganeraie Biosphere Reserve in Morocco. The stratification was grounded in Debrach’s climatic classification [34], which categorizes climate types based on the thermal amplitude index. Two main questions guided our study: (i) How does this gradient drive changes in nematode community diversity and trophic structure? And (ii) how do ecological indices and functional traits, including community-weighted mean body mass, carbon use efficiency, and nematode metabolic footprint, respond to increasing continentality?

2. Materials and Methods

2.1. Site Description and Soil Sampling

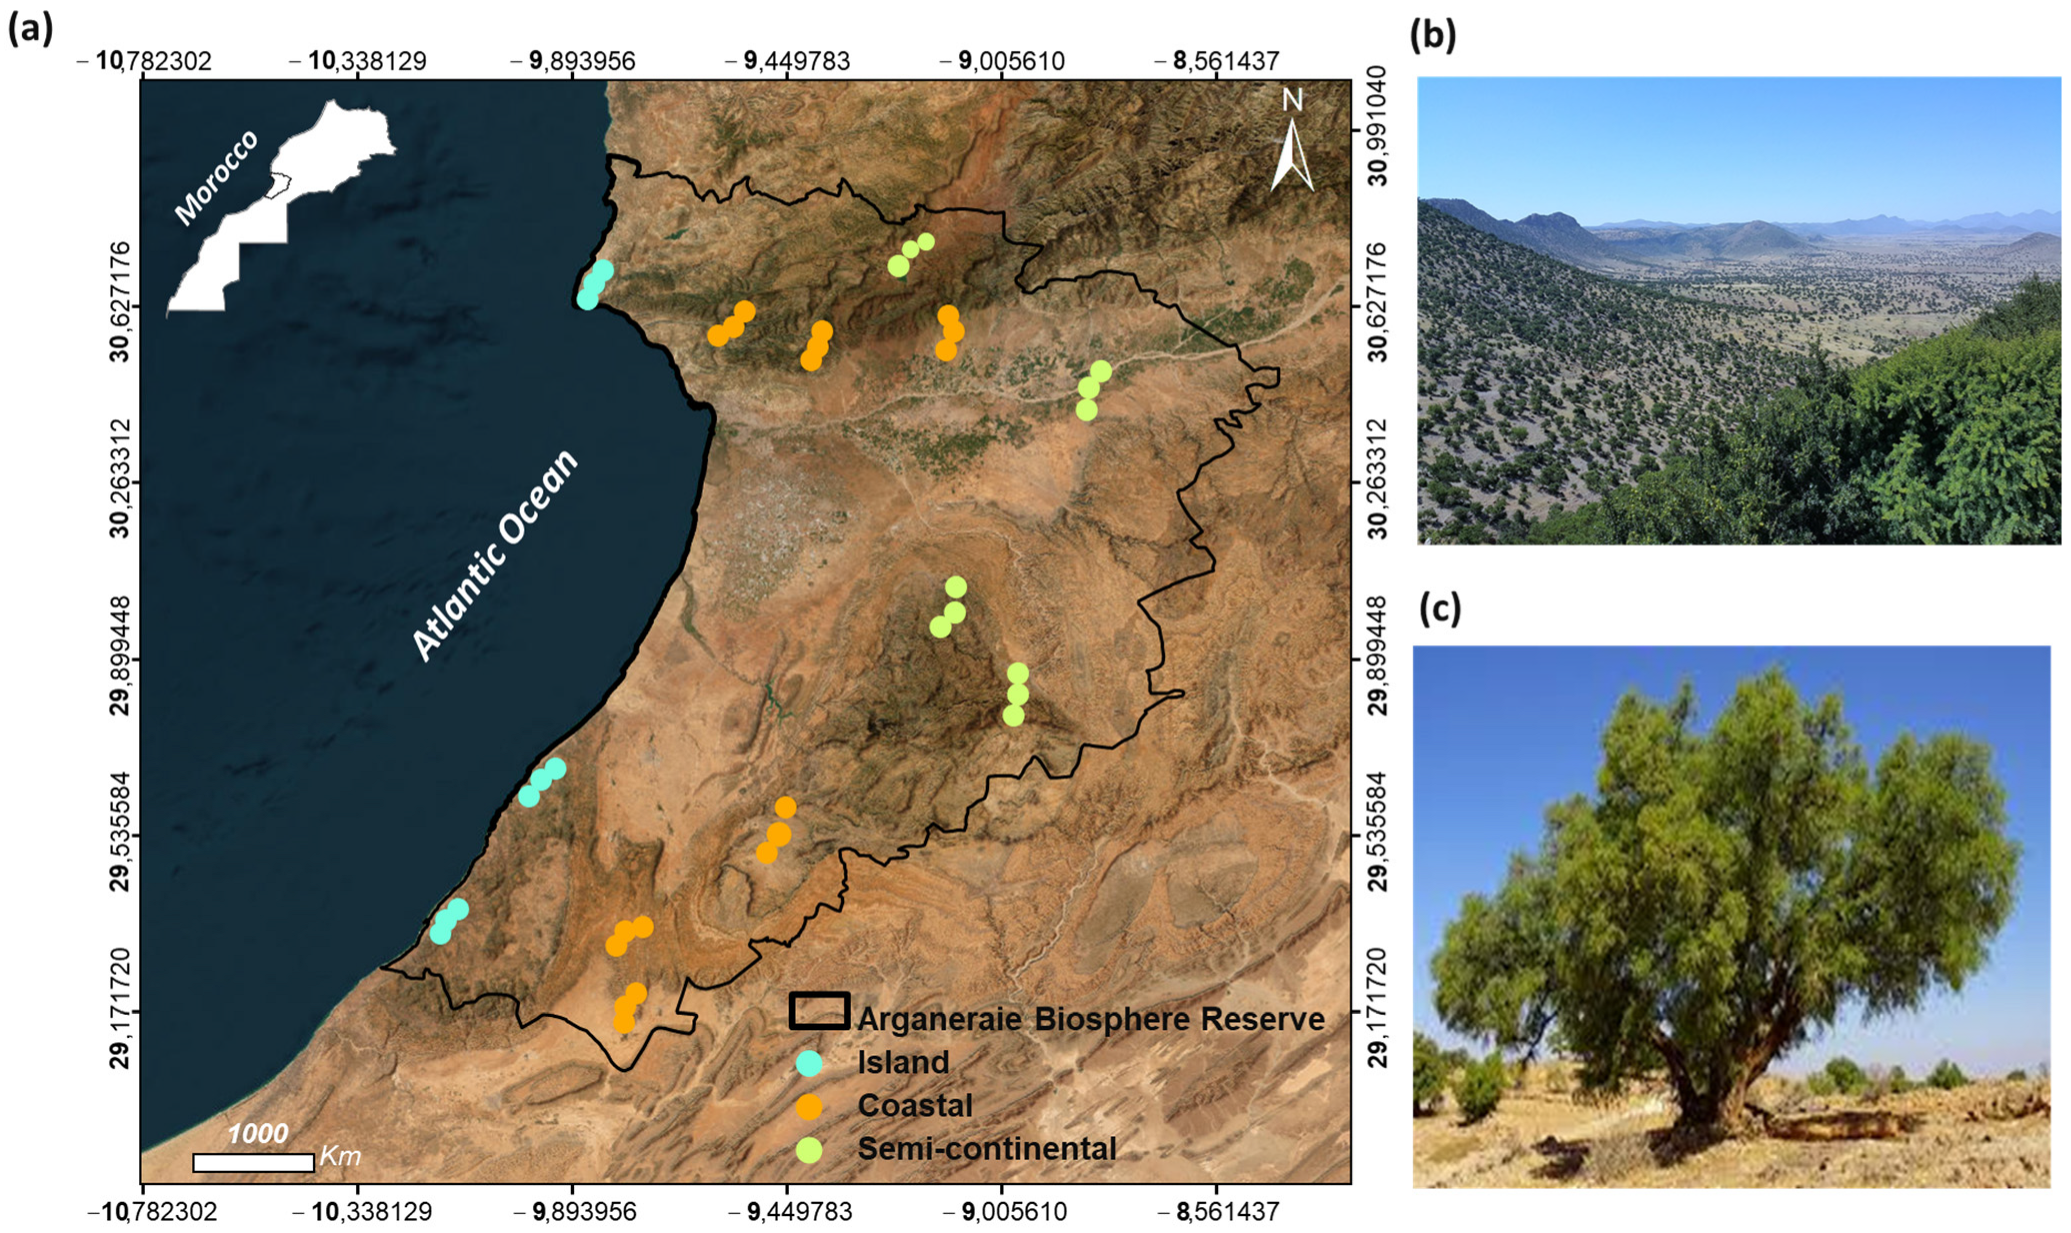
This study was conducted in the Arganeraie Biosphere Reserve (RBA), Morocco’s first biosphere reserve designated by UNESCO in 1998, named after its emblematic endemic tree, the Argan (Sideroxylon spinosum L.). The reserve is located in the central–western Mediterranean region of Morocco (29–31° N, 8–10° W), between the Western High Atlas and the Anti-Atlas mountain ranges, covering approximately 800,000 hectares (Figure 1). The RBA displays strong environmental heterogeneity, with a Mediterranean climate alternating between hot, dry summers and cold, rainy winters [35], thermal amplitudes ranging from 10 to 40 °C, annual precipitation spanning less than 100 mm to 400 mm, and altitudes varying between 250 and 1400 m [36]. This climatic diversity supports an exceptionally rich flora comprising over 1440 plant taxa [37], encompassing Mediterranean, tropical, Saharan, and Macaronesian elements, of which 140 species and subspecies are endemic [38,39,40], and the reserve plays a crucial role in preserving faunal diversity and maintaining key ecosystem functions [38].
To investigate how the continental gradient shapes soil nematode communities, soil samples were collected from three climatically distinct zones within the reserve, stratified according to Debrach’s [34] thermal amplitude index (M − m), defined as the difference between the mean maximum temperature of the hottest month and the mean minimum temperature of the coldest month. This classification distinguishes three climate types: island (M − m < 15 °C), coastal (15 °C < M − m < 25 °C), and semi-continental (25 °C < M − m < 35 °C), whose main climatic characteristics are summarized in Table 1.
Soil samples were collected from the reserve forest between 2021 and 2022 using stratified random sampling along the continental gradient. A total of 130 samples were collected and distributed as follows: 30 samples from the island zones, 60 from the coastal zone, and 40 from the semi-continental zone. At each site, 10 sub-samples were taken in a zigzag pattern [41] at varying depths of 5–25 cm to 5–30 cm, according to the local bedrock depth, and then combined to form a composite sample. The samples were labeled, geotagged, transported to the laboratory, and stored at 4 °C before nematode extraction was conducted within the following week.

2.2. Soil Nematode Community Identification

Nematodes were isolated from 200 cc of fresh soil using the elutriation method [42,43]. The suspension was filtered through a 150 μm sieve and then incubated at room temperature for 48 h before being transferred to a 50 μm sieve. Classification and identification of soil nematodes at the genus level were carried out using dichotomous keys from Bongers [43], Mai and Mullin [44], as well as the Nemaplex website [45].
Identification and counting were performed using an Olympus stereomicroscope and an Olympus CX22 microscope (Olympus Corporation, Tokyo, Japan) at a magnification of ×1000. The identified nematodes were classified into five trophic groups based on head morphology and feeding habits: bacterivores, fungivores, plant parasites, omnivores, and predators [10]. Additionally, based on their life strategies, nematodes were categorized as either colonizers (opportunists, r-strategists) or persisters (competitors, K-strategists), with each category assigned c-p values ranging from 1 to 5 [17].

2.3. Calculation of Nematode Ecological Function Index and Metabolic Footprint

Nematode diversity was assessed using several metrics, including nematode abundance (individuals per 100 g dry soil), the Shannon–Wiener diversity index (H′) [46], which reflects species diversity within the nematode community; the Simpson dominance index (1 − D) [47], associated with species dominance; and species richness, as determined by the Margalef index (MgI) [48]. These were calculated using the following formulas:
H = p i   ( ln p i )
1 D = i = 1 s p i 2    
M g l = G 1 / ln N
where pi was the relative abundance of taxon i of the sample, G was the total number of genera in the community, and N was the total number of the i-th taxon.
The classification from life history strategies led to the creation of MI, which is useful for assessing the evolution and recovery of soil ecosystems in response to external disturbances [7,17]. The maturity index (MI) for free-living nematodes and the plant-parasitic index (PPI), both calculated as
M I   o r   P P I = v i f i    
where vi and fi represent the c-p value and the frequency of the i-th taxon, respectively.
The functional structure of the community was referred to by the nematode channel ratio (NCR), the Wasilewska index (WI), the basal index (BI), the enrichment index (EI), and the structure index (SI) [6], calculated as
N C R = B a / B a + F u
W I = B a + F u / H e    
B I = b / e + s + b × 100
E I = 100 × e / e + b    
S I = 100 × s / s + b    
where b represents (Ba2 + Fu2) × w2; e represents (Ba1 × w1) + (Fu2 × w2); and s represents (Ban × wn + Fun × wn + Prn × wn), where Ba, Fu, and Pr respectively indicate the abundance of bacteria-feeding nematodes, fungivores, and omnivorous predators; w represents the weighting assigned to nematodes in each functional guild, and n indicates the colonizer-persistent assignment of nematode taxa.
The following parameters were calculated to analyze the metabolic footprint of soil nematodes: Community Weighted Mean (CWM in μg) [9,49], nematode biomass (Wt in μg), CUE in metabolic processes [50], nematode metabolic footprint (NMF) [18], and energy flux (Fi in μg C 100 g−1 dry soil d−1) of soil nematodes [51].
W t = L D 2 / 1.6 × 10 6
C W M = i = 1 N p i x i    
C U E = P r o d u c t i o n C i / P r o d u c t i o n C i + R e s p i r a t i o n C i
N M F = N t 0.1 × w t 12 m t + 0.273 × 0.058 w t 0.75
F i = F + L / e α    
L and D represent the individual body length and body width (μm), respectively [49]. pi represents the relative abundance of the i-th taxon or genus, and xi refers to the mean fresh body mass (μg) of genus i [9,49].
Where Production-Ci was the sum of the C production of genus i within the respective trophic groups, and Respiration-Ci represents the C respiration of genus i in those groups, calculated as follows: Pi = ((Ni × 20% × 52% × Wi × 1000)) ÷ mi and Ri = Ni (Wi × 1000)0.75 × 0.273. Where Ni is the abundance of the i-th taxon in 1 g of dry soil, Wt is the body mass of the genera i, and mi is the cp values of each nematode genus i was taken from the publicly available database [45].
The conversion factor of 20% is used to convert the fresh body mass of nematodes to dry mass [52], while 52% represents the proportion of carbon in dry mass [53]. The factor 1000 converts μg to ng, 0.273 is the relative molecular weight of carbon in CO2 (12 ÷ 44 = 0.273), and 0.75 represents a regression factor [18,54]. Fi represents the energy flux through nematode trophic group i, where F, L, and ea represent the energy metabolism of the nematode community for respiration and growth, the energy loss to higher trophic levels, and the assimilation efficiency of a given nematode trophic group, respectively. The energy loss term (L) was computed for each trophic group based on predation by omnivores–carnivores.
For bacterivores, L was calculated as L = DBO × F0 [55], where DBO is the density-dependent feeding preference of omnivores–carnivores for bacterivores, and F0 is the energy flux through omnivores–carnivores. DBO was determined based on the proportional abundance of each prey group: DBO = AB ÷ (AB + AF + AH), where AB, AF, and AH denote the abundance of bacterivores, fungivores, and herbivores, respectively [56]. Assimilation efficiencies (ea) were set at 0.60 for bacterivores, 0.38 for fungivores, 0.25 for plant parasites, and 0.50 for omnivores–carnivores [20,55,57].

2.4. Statistical Analyses

To assess whether the continental gradient truly alters nematode community structure, we performed Permutational Multivariate Analysis of Variance (PERMANOVA) on Bray–Curtis dissimilarities calculated from relative abundances of trophic groups. PERMANOVA tests the null hypothesis that there are no differences in multivariate dispersion among groups, using permutation-based significance testing [58]. Non-metric multidimensional scaling (NMDS) was applied to visualize trophic group compositional patterns across climate zones. NMDS ordination was performed on Bray–Curtis dissimilarities with 100 random starts and a convergence criterion of 0.001. The final stress value (0.040) indicated an excellent fit (<0.05), confirming the reliability of the ordination [59]. Principal component analysis (PCA) was conducted on standardized environmental variables to identify the main environmental gradients and their relationships with nematode community structure. Pearson correlations were calculated between environmental variables and nematode indices to identify significant relationships (p < 0.05). Spearman’s rank correlations were used when normality assumptions were violated. Mantel tests were performed to assess correlations between environmental distance matrices and community dissimilarity matrices.
All statistical analyses were conducted in R version 4.4.1 [60] using the packages vegan (version 2.7.5) [61] for PERMANOVA and NMDS. The nematode indicator joint analysis (NINJA) online tool [62], based on the Nemaplex database (http://nemaplex.ucdavis.edu, accessed on 24 June 2026), was used for functional metabolic footprint characterization.

3. Results

3.1. Diversity, Community Structure, and Trophic Composition of Soil Nematodes Across Climatic Zones

The abundance of nematode trophic groups varied significantly among climatic zones, showing a gradual decrease along the continental gradient from the island to the semi-continental zone (Table 2). Bacterivore nematodes were the most abundant trophic group across all zones, followed by herbivores, fungivores, omnivores, and predators. Bacterivores, herbivores, and fungivores were significantly more abundant in the island zone than in the coastal and semi-continental zones, with very highly significant differences among zones (Table 2; p < 0.001). Omnivores also showed higher abundance in the island zone and declined toward the more continental zones, exhibiting a highly significant difference (p = 0.01; Table 2). Predator abundance followed a similar pattern, being highest in the island zone, intermediate in the coastal zone, and lowest in the semi-continental zone, with significant differences among zones (p = 0.01; Table 2).
Soil nematode communities exhibited significant differences across the three climatic zones (Table 3). Nematode abundance was markedly higher in the island zone (312.47 ± 189.30 individuals/100 g soil) compared to both the semi-continental (125.92 ± 76.56) and coastal zones (82.13 ± 58.25), with significant differences among all three zones (F = 48.31, p < 0.001). Similarly, species richness was significantly greater in the island zone (20.63 ± 4.91) than in the coastal (13.27 ± 4.83) and semi-continental zones (15.13 ± 4.55; F = 34.55, p < 0.001). Conversely, Shannon diversity and Simpson diversity showed no significant differences among zones (p = 0.554 and p = 0.569, respectively), suggesting that while the island zone harbored more individuals and species, the overall diversity evenness was comparable across zones. However, Pielou’s evenness was significantly lower in the island zone (0.71) compared to the coastal (0.81) and semi-continental zones (0.77; F = 18.73, p < 0.001), indicating a more uneven distribution of species abundances in island soils. The Maturity Index was significantly higher in the island zone (2.27) than in the other two zones (2.25 for both; F = 9.61, p = 0.008), while the Plant Parasite Index showed no significant differences (p = 0.136). The nematode channel ratio was significantly higher in the island zone (0.85) compared to the coastal zone (0.78; F = 6.72, p = 0.035), suggesting a greater contribution of the fungal decomposition pathway in island ecosystems.
Ecological indices revealed distinct patterns: the Wasilewska Index was significantly higher in the island zone (272.69) compared to both coastal (119.77) and semi-continental zones (118.05; F = 15.59, p < 0.001). The Basal Index was significantly higher in the island and semi-continental zones (68.32 and 66.40, respectively) compared to the coastal zone (54.91; F = 16.83, p < 0.001). The Structure Index was significantly elevated in the coastal zone (36.04) relative to the island (22.78) and semi-continental zones (23.68; F = 9.84, p = 0.007), while the enrichment index showed no significant differences (p = 0.103).

3.2. Multivariate Patterns in Nematode Community Composition and Trophic Structure

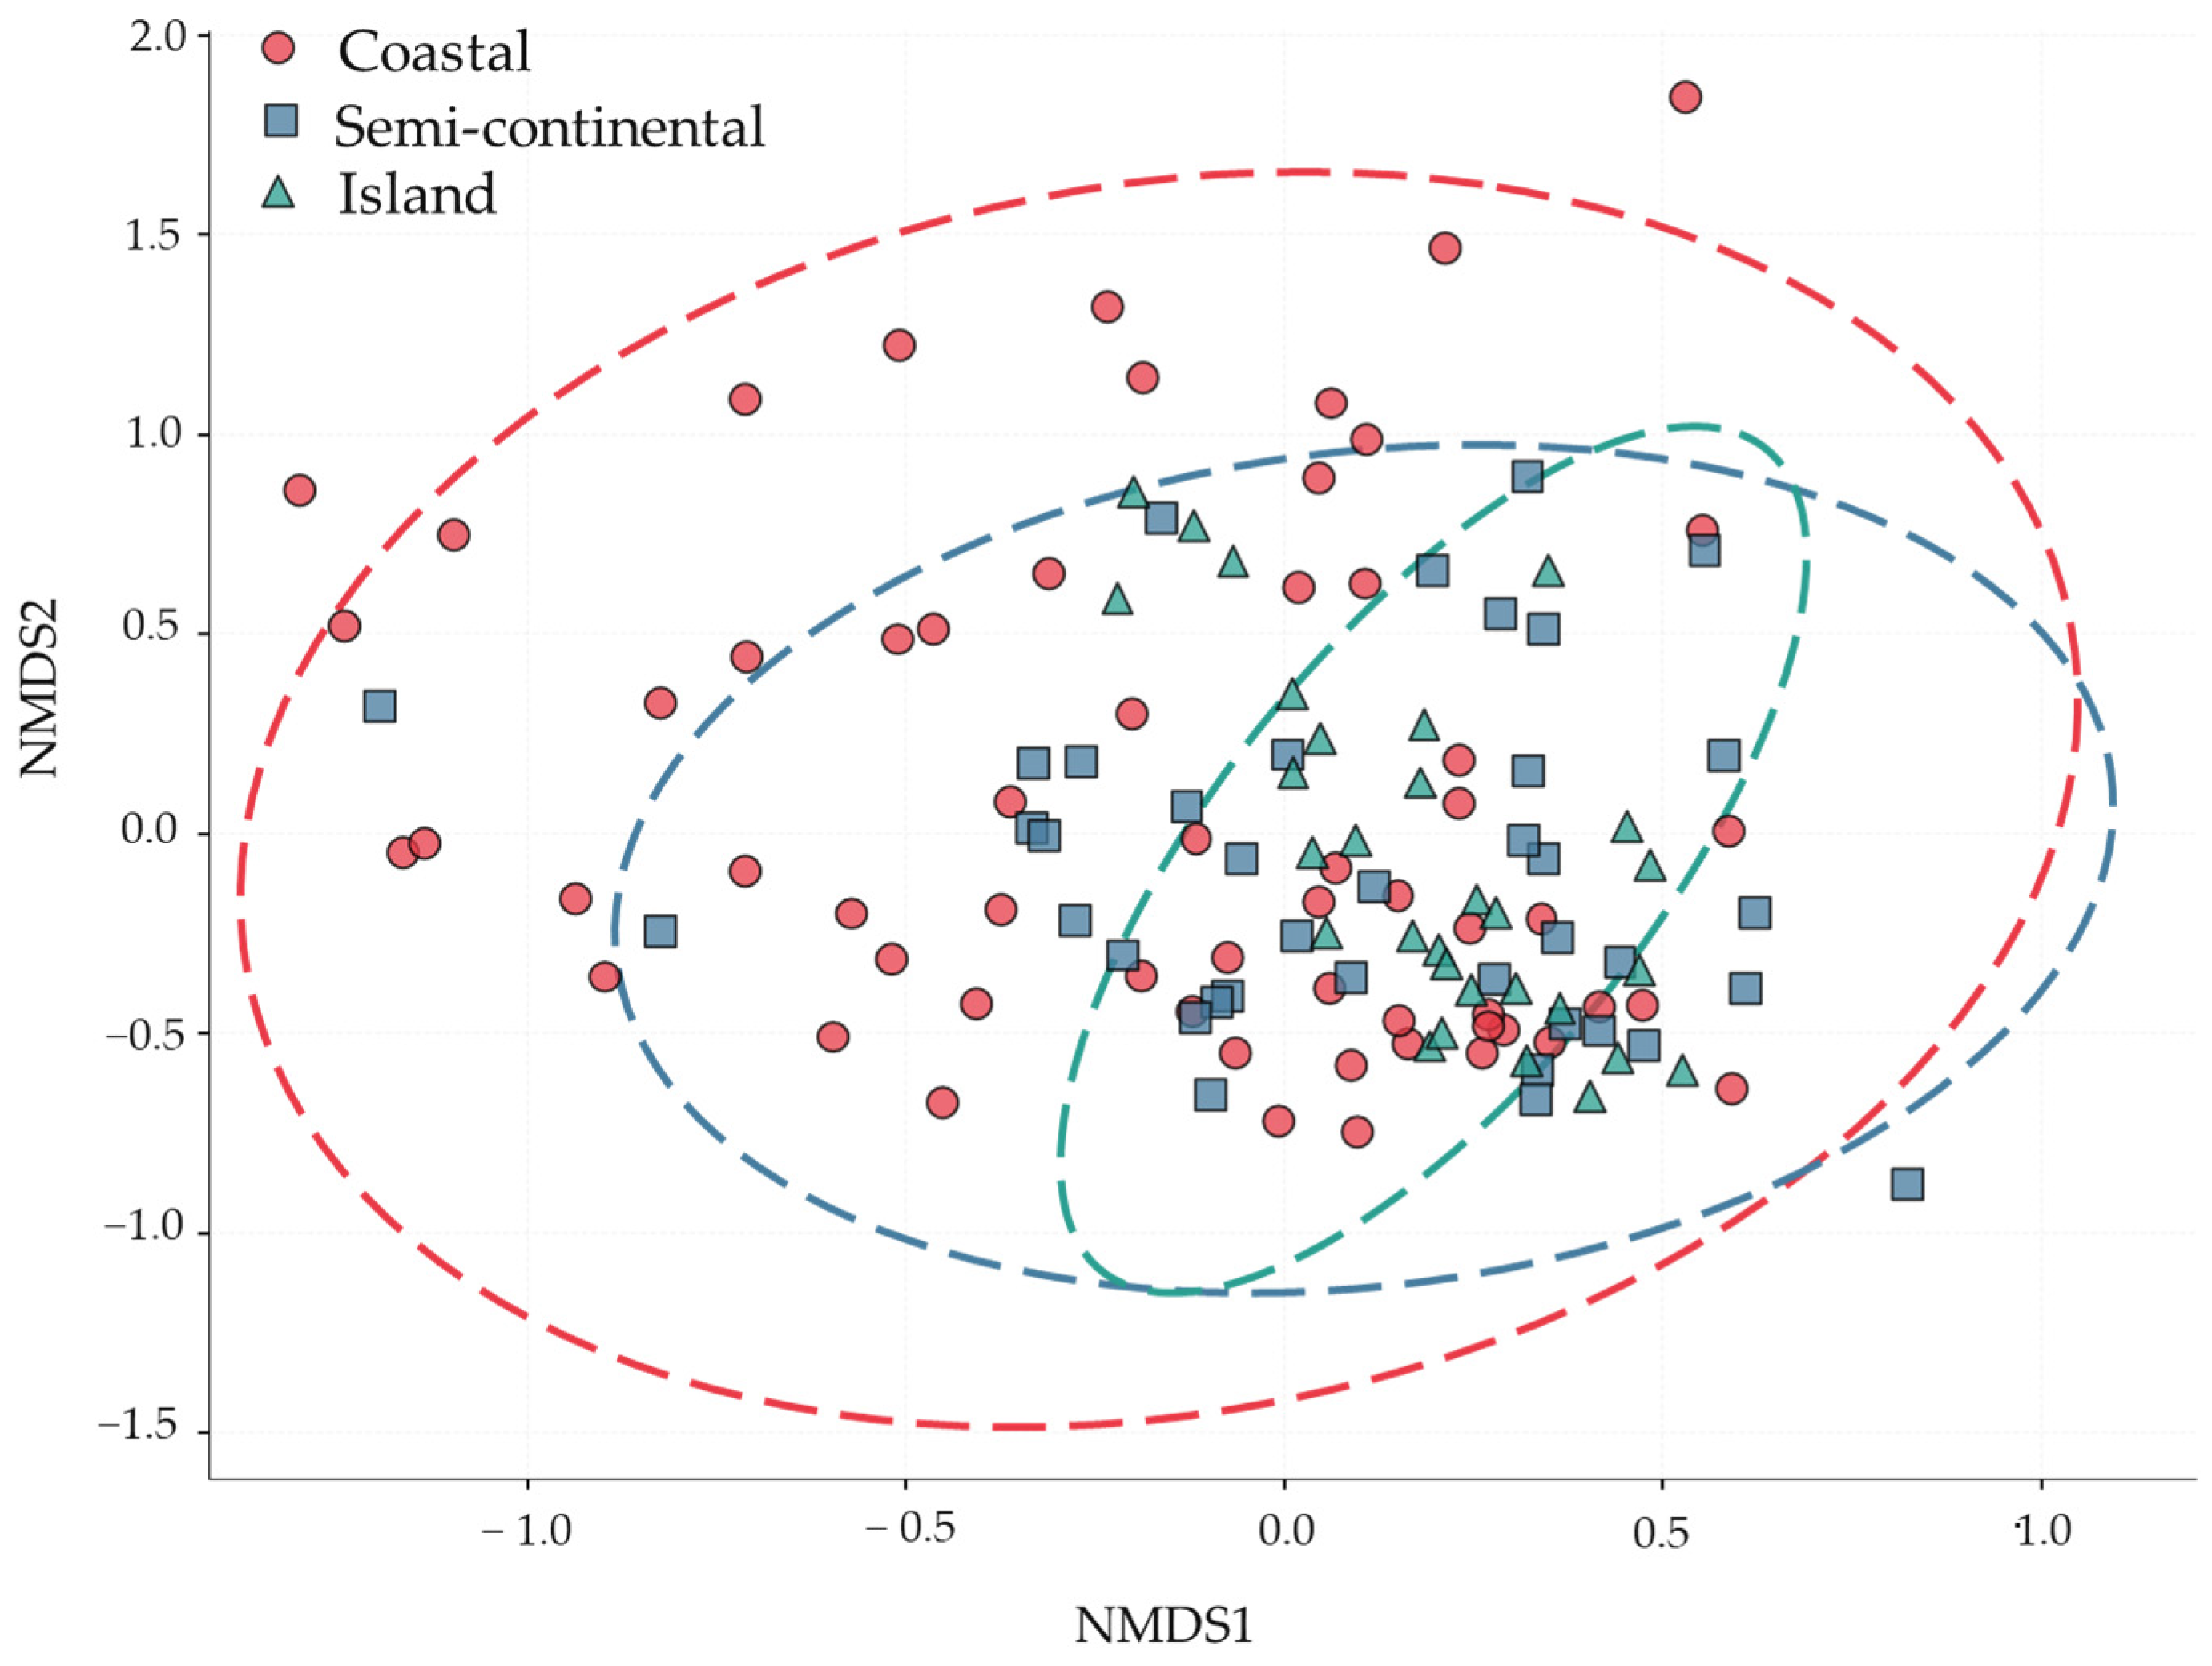
Non-metric multidimensional scaling (NMDS) based on Bray–Curtis dissimilarities revealed a clear separation of nematode trophic communities along the continental gradient (stress = 0.040, indicating a reliable two-dimensional representation; Figure 2). Coastal samples formed a distinct cluster, separate from both the semi-continental and island communities, with minimal overlap between groups. The 95% confidence ellipses further supported this separation, with the coastal zone showing the largest dispersion, suggesting greater within-group variability. The semi-continental and island communities showed partial overlap, pointing to similarities in trophic structure between these two zones. Overall, this ordination indicates that climatic zone is a significant structuring factor for nematode trophic composition.
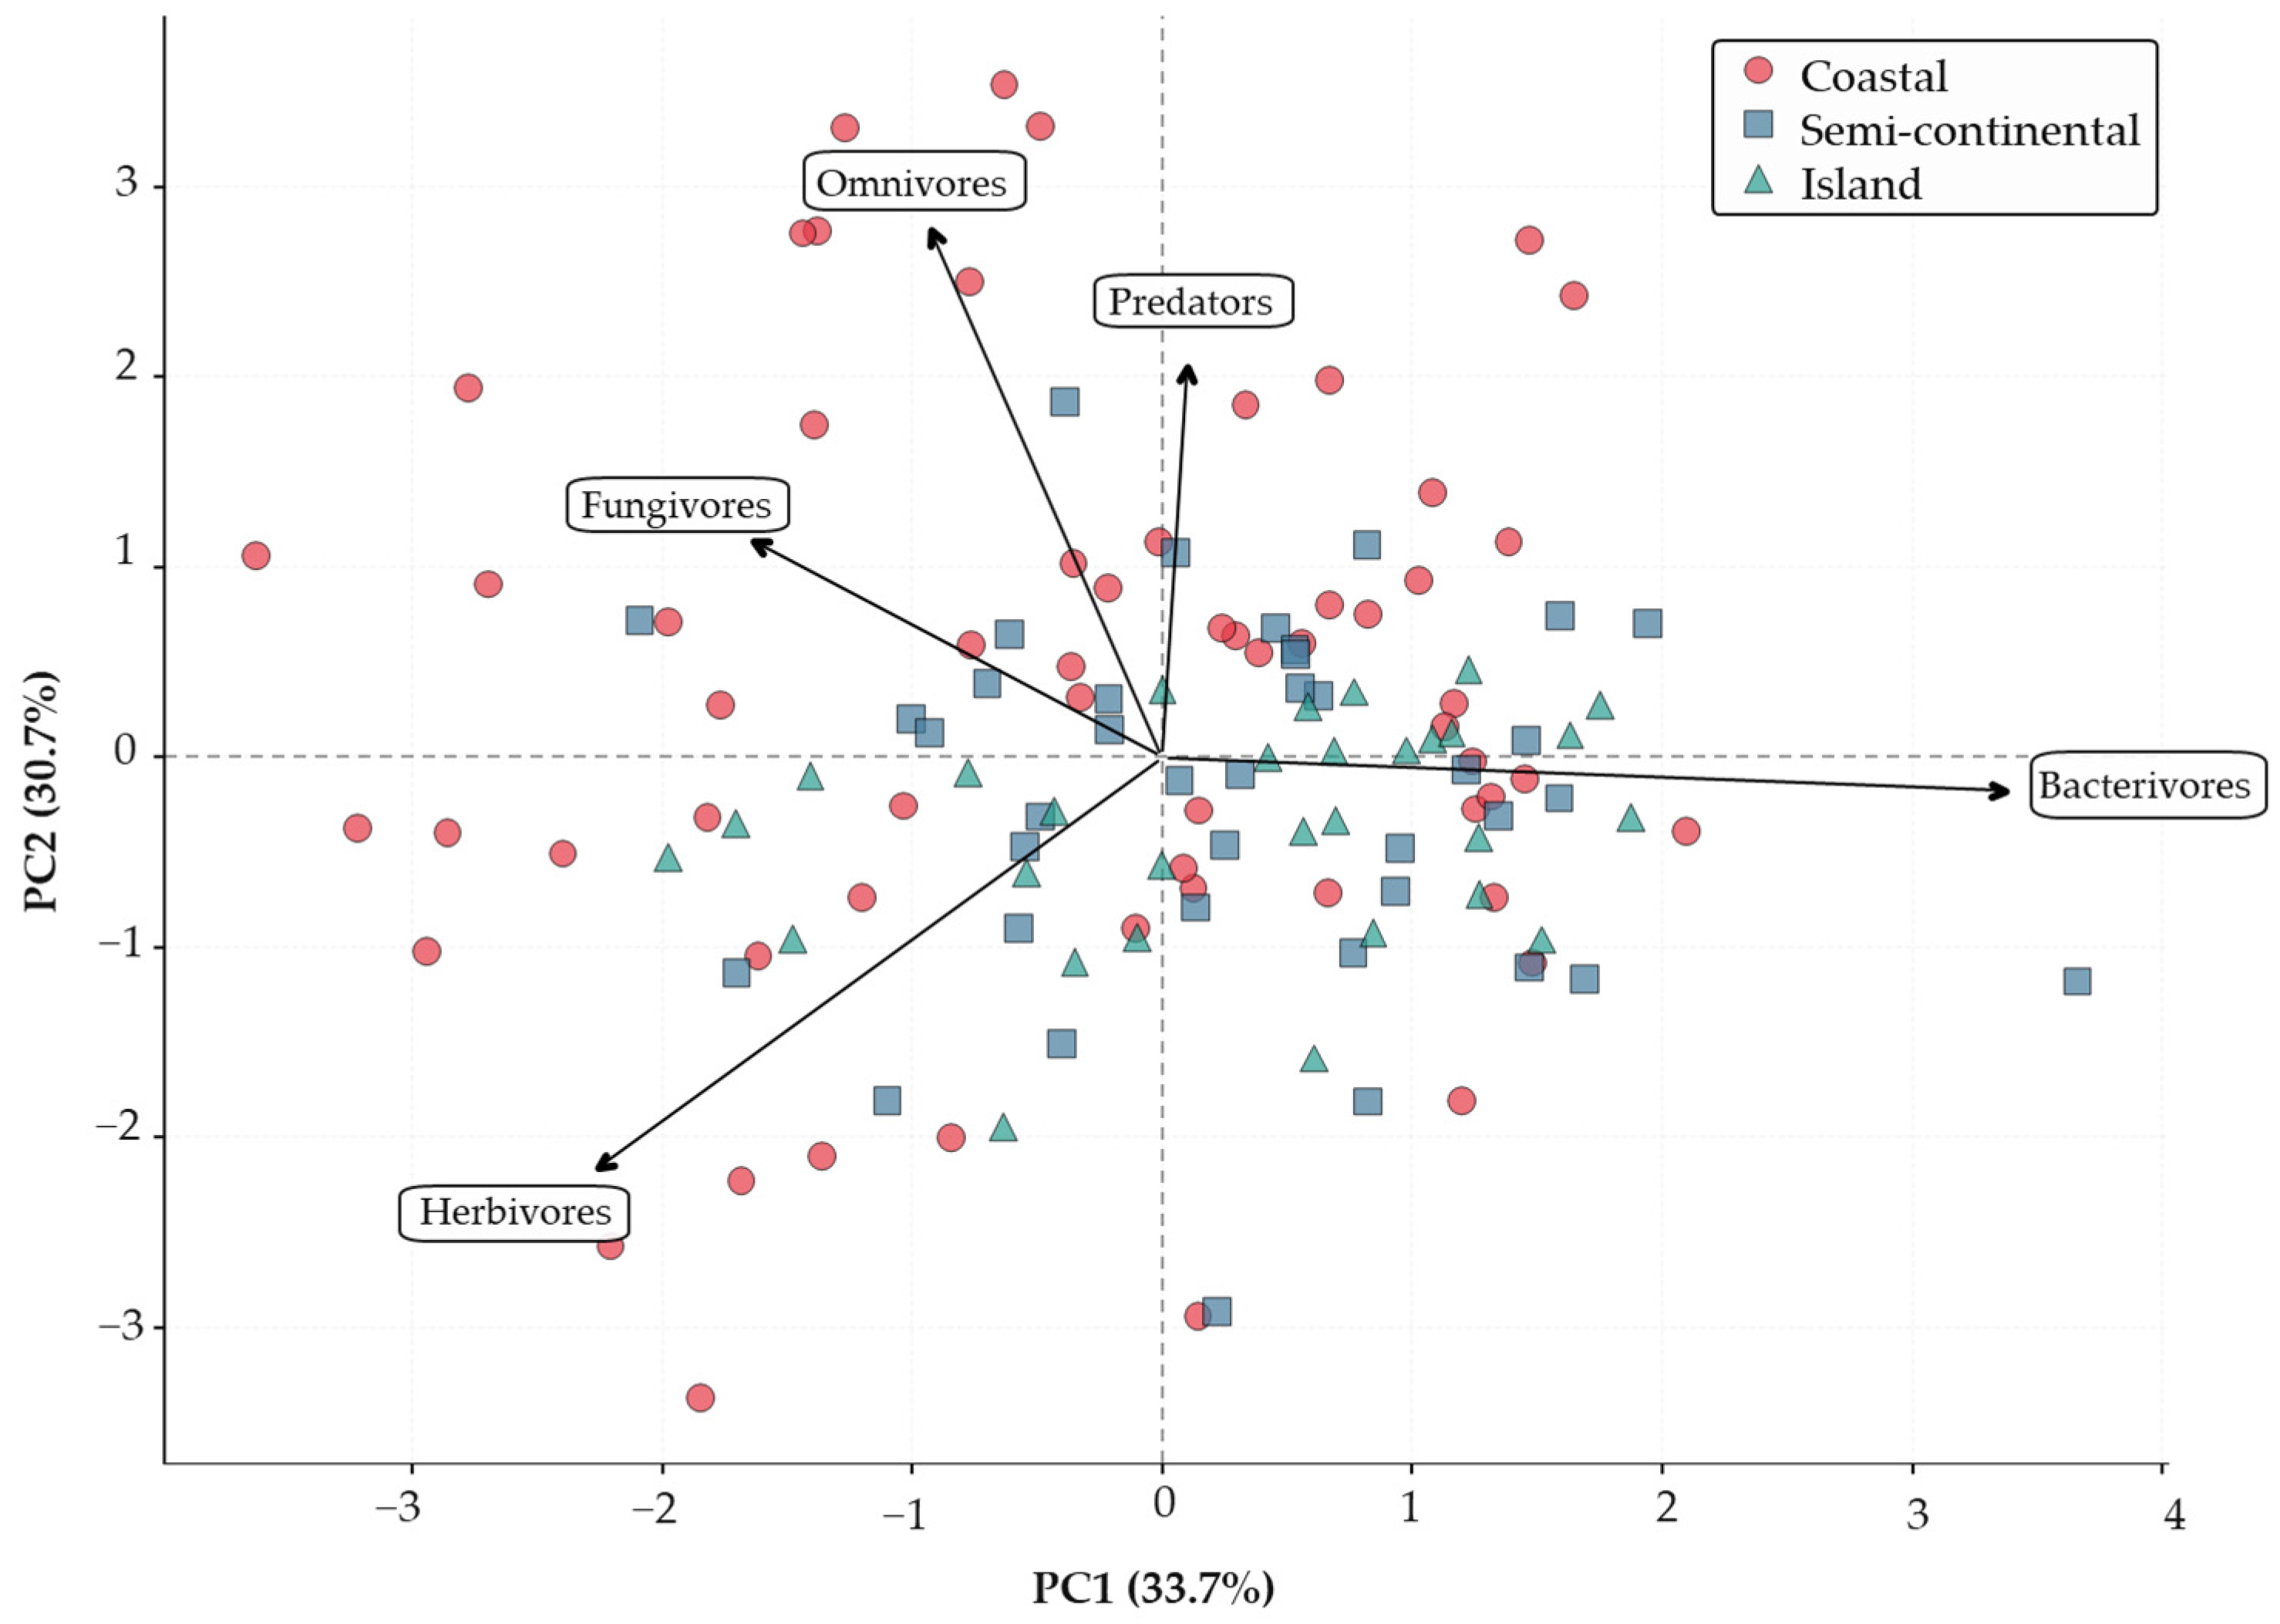
Principal component analysis (PCA) on Hellinger-transformed trophic proportions explained 64.4% of the total variance on the first two axes (PC1 = 33.7%, PC2 = 30.7%; Figure 3). The biplot showed that PC1 primarily separated coastal communities from semi-continental and island communities, driven mainly by higher loadings of fungivores, predators, and omnivores along the positive axis. PC2 was mainly associated with a bacterivore-herbivore gradient. The direction and length of the trophic-group vectors indicate that fungivores and predators contributed most to the discrimination between climatic zones, while bacterivores were relatively ubiquitous across all sites.

3.3. Relationships Between Body Size and Carbon Use Efficiency Along a Gradient of Continentality

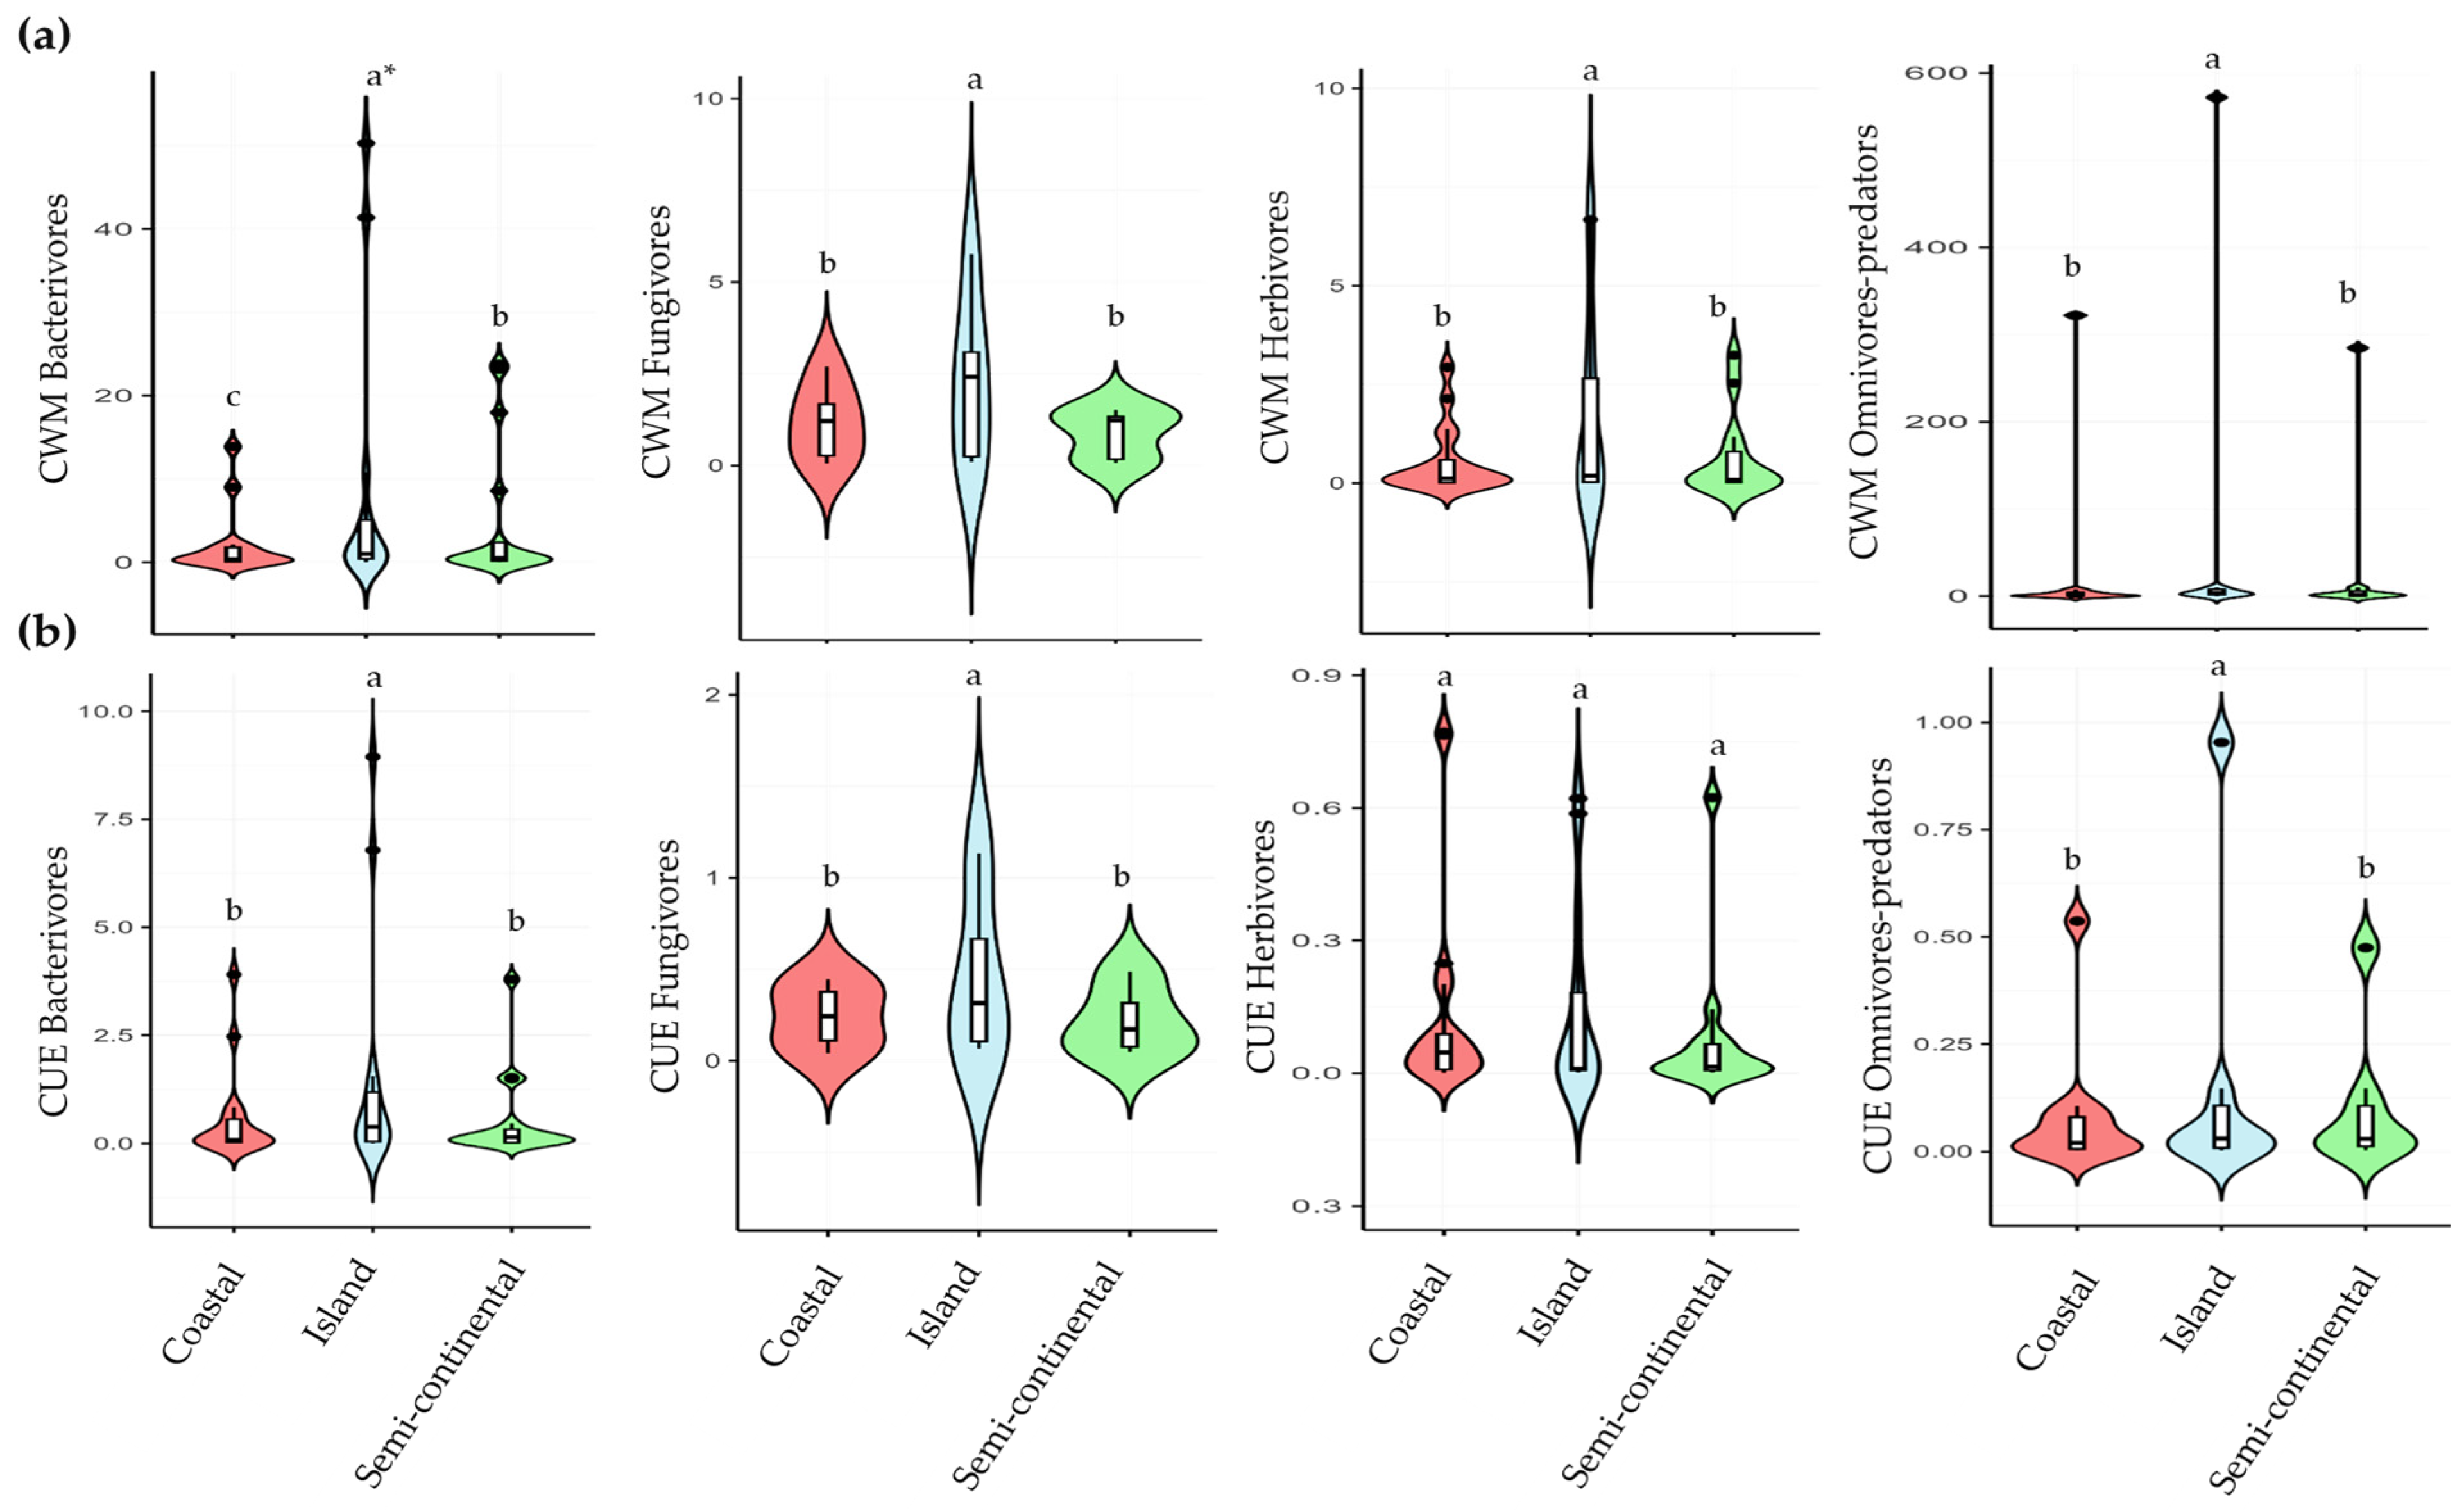
Significant variations in community-weighted mean body mass traits and CUE of trophic groups were observed across climate types (island, coastal, and semi-continental) (Figure 4). The analysis revealed that CWM mass values for bacterivores, fungivores, herbivores, and omnivore-predators were consistently higher in the island climate, with significant differences (p < 0.001), while coastal and semi-continental climates exhibited similar but lower values (Figure 4a). A similar pattern was observed for CUE, which exhibited higher values in the island climate for bacterivores, fungivores, and omnivore-predators (p < 0.001). In contrast, no significant differences in herbivore values were observed between zones (Figure 4b).

3.4. Response of Nematode Communities to Environmental Drivers and Thermal Stress

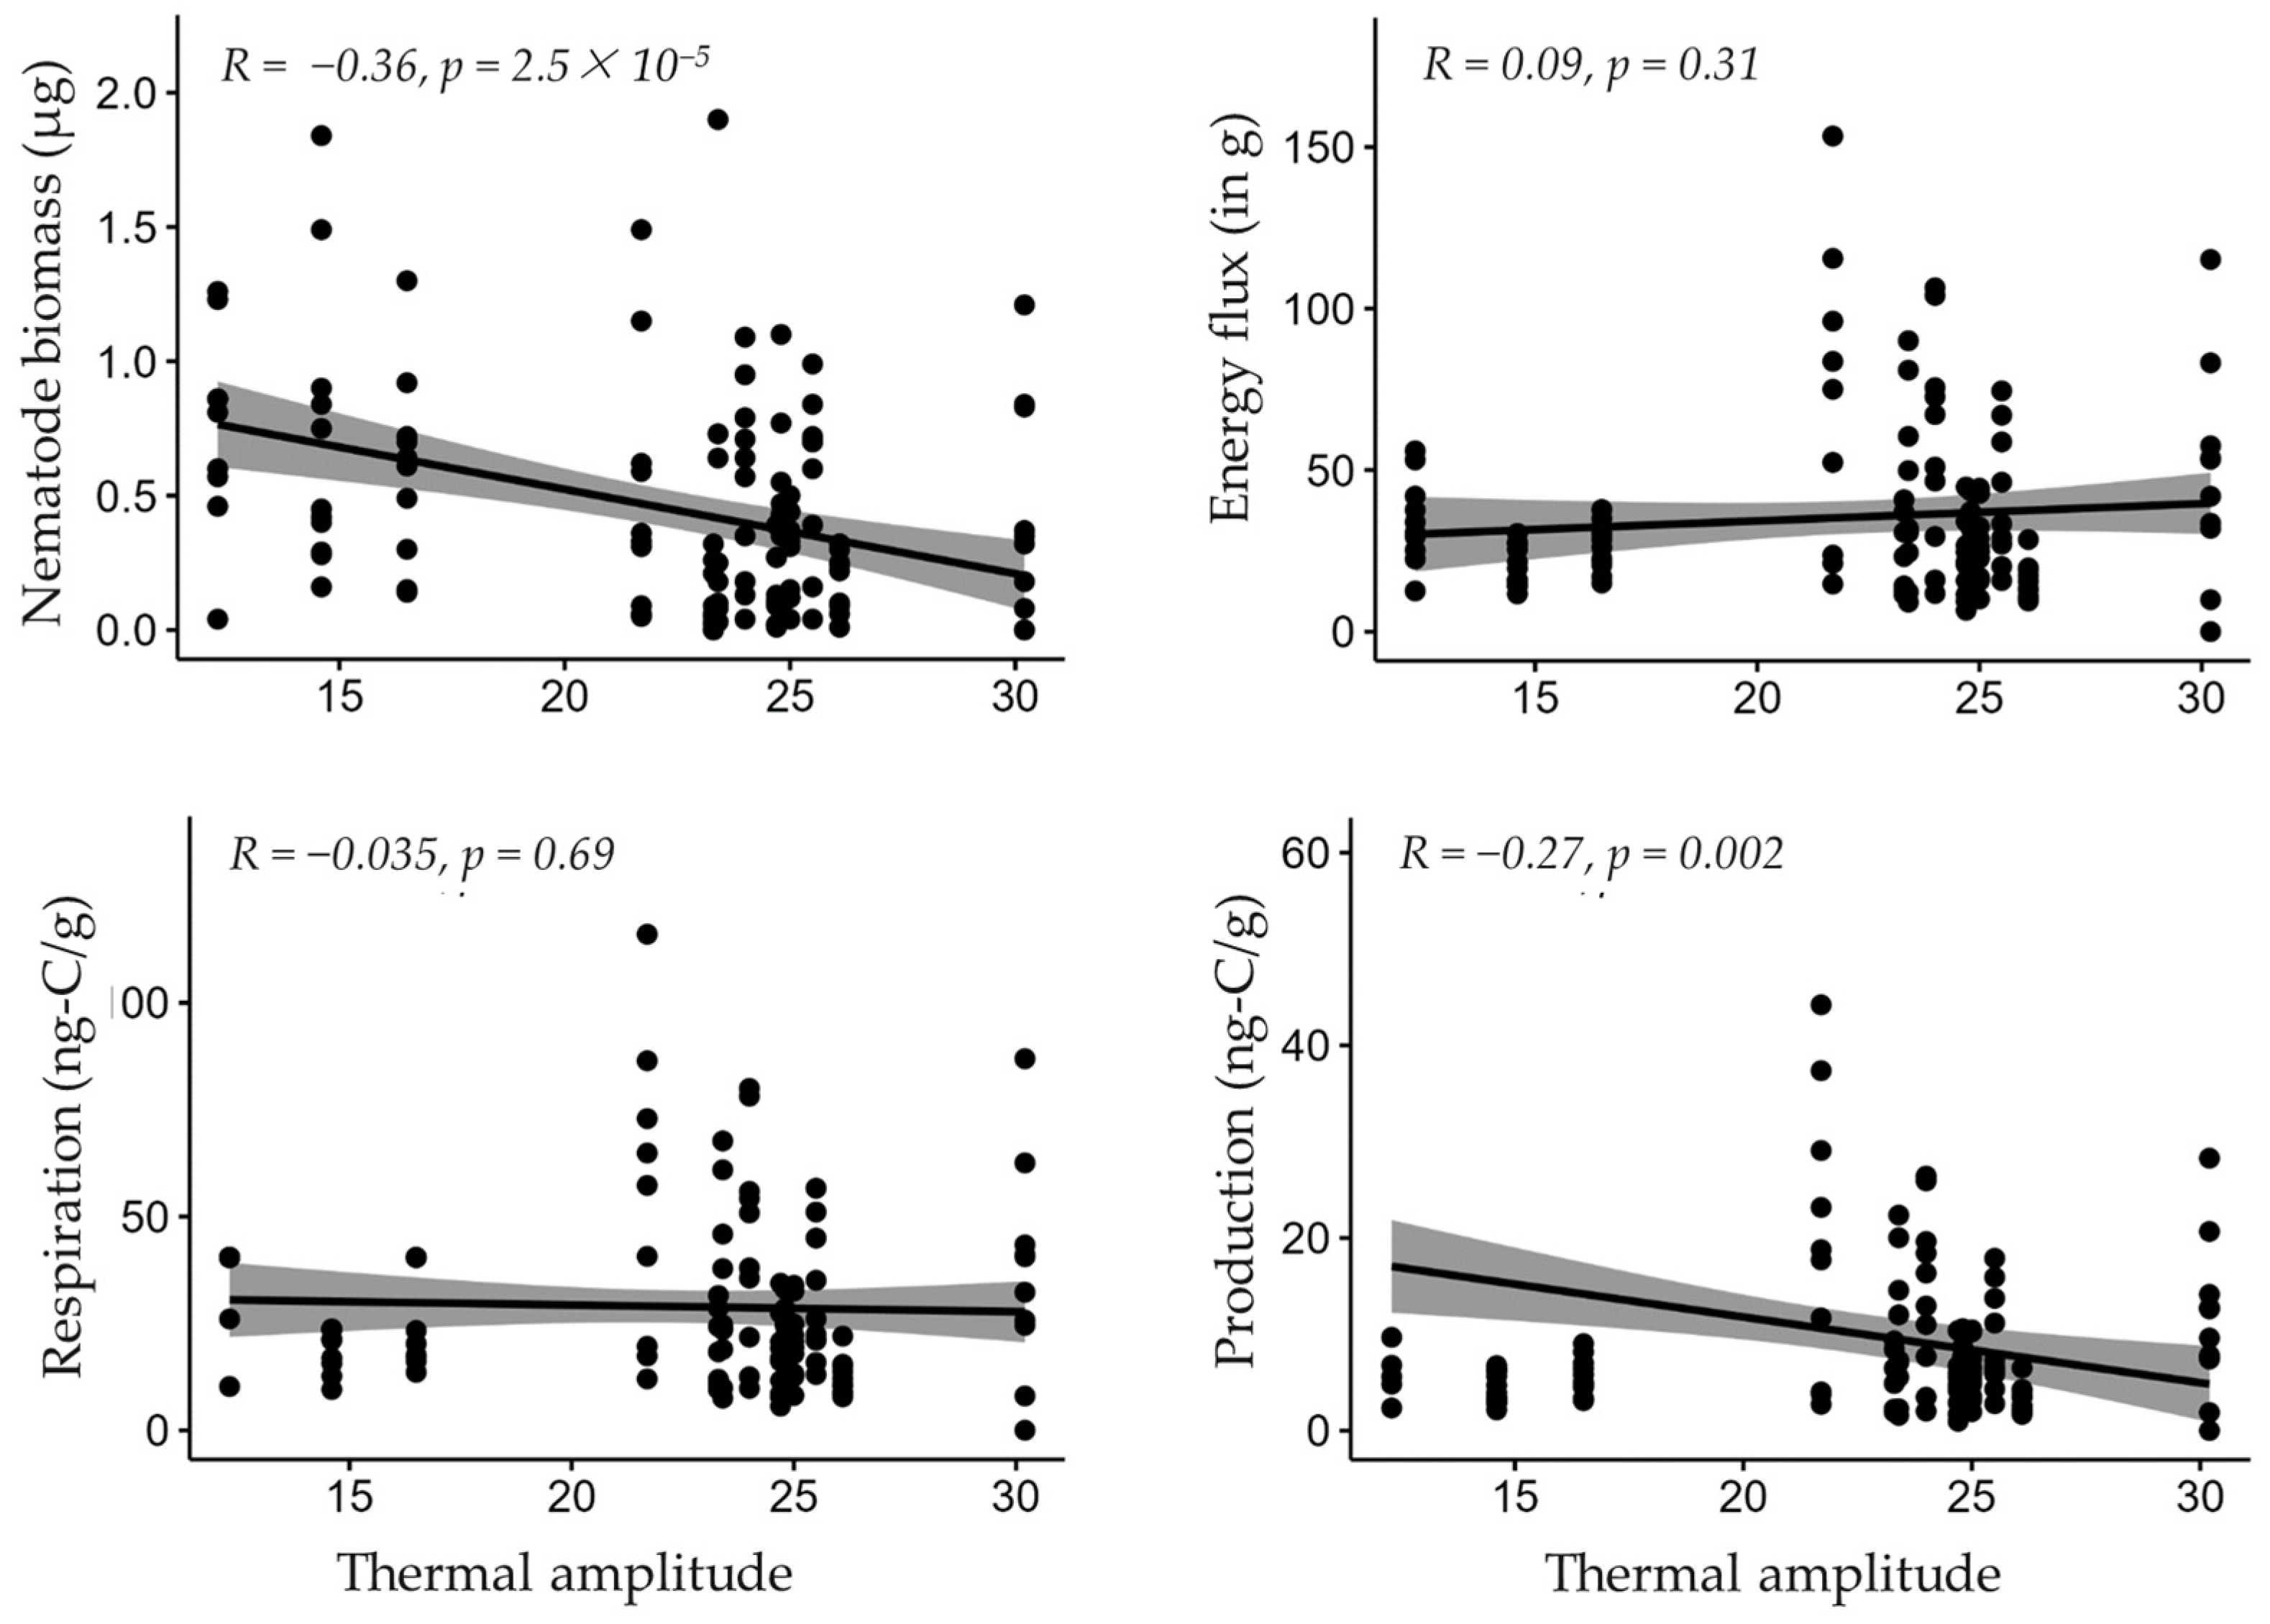
Nematode biomass and energy flux also varied along the continental gradient. Nematode biomass was negatively correlated with continentality, whereas energy flux and respiration showed only weak positive correlations that were not statistically significant (p > 0.05). In contrast, production declined significantly with increasing continentality (Figure 5).
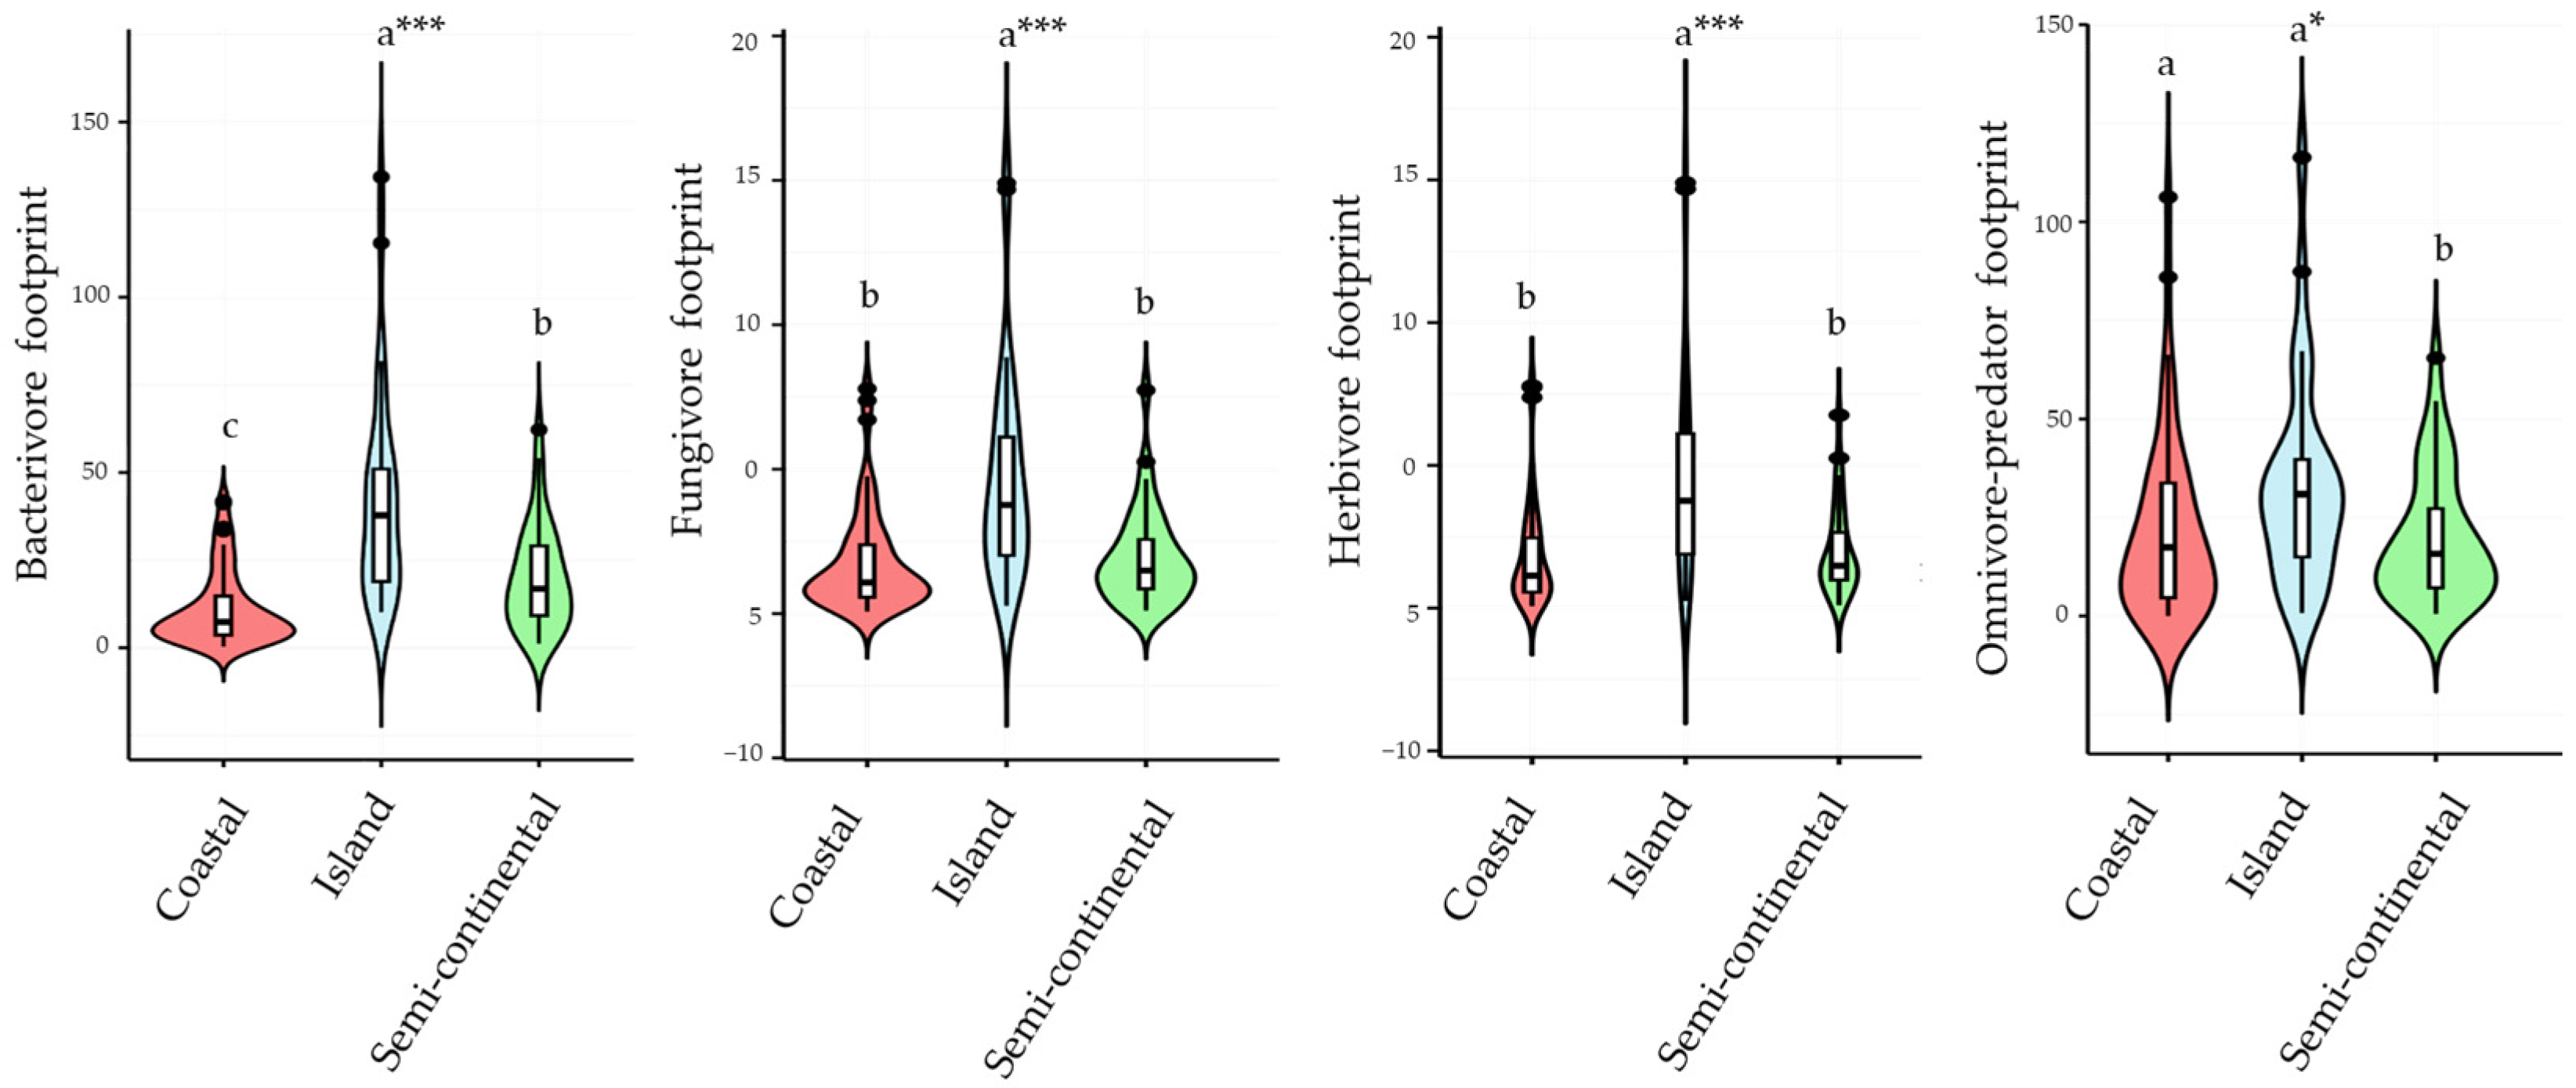
The distribution of trophic footprints across bioclimatic zones, climate zones, and the metabolic footprint of different trophic groups (Figure 6). NMF values for bacterivores, fungivores, and herbivores were consistently higher in the island climate, with significant differences, while coastal and semi-continental climates exhibited similar but lower values (p < 0.001). For omnivores–predators, higher values were observed in island and coastal climates, whereas lower values occurred in the semi-continental climate.
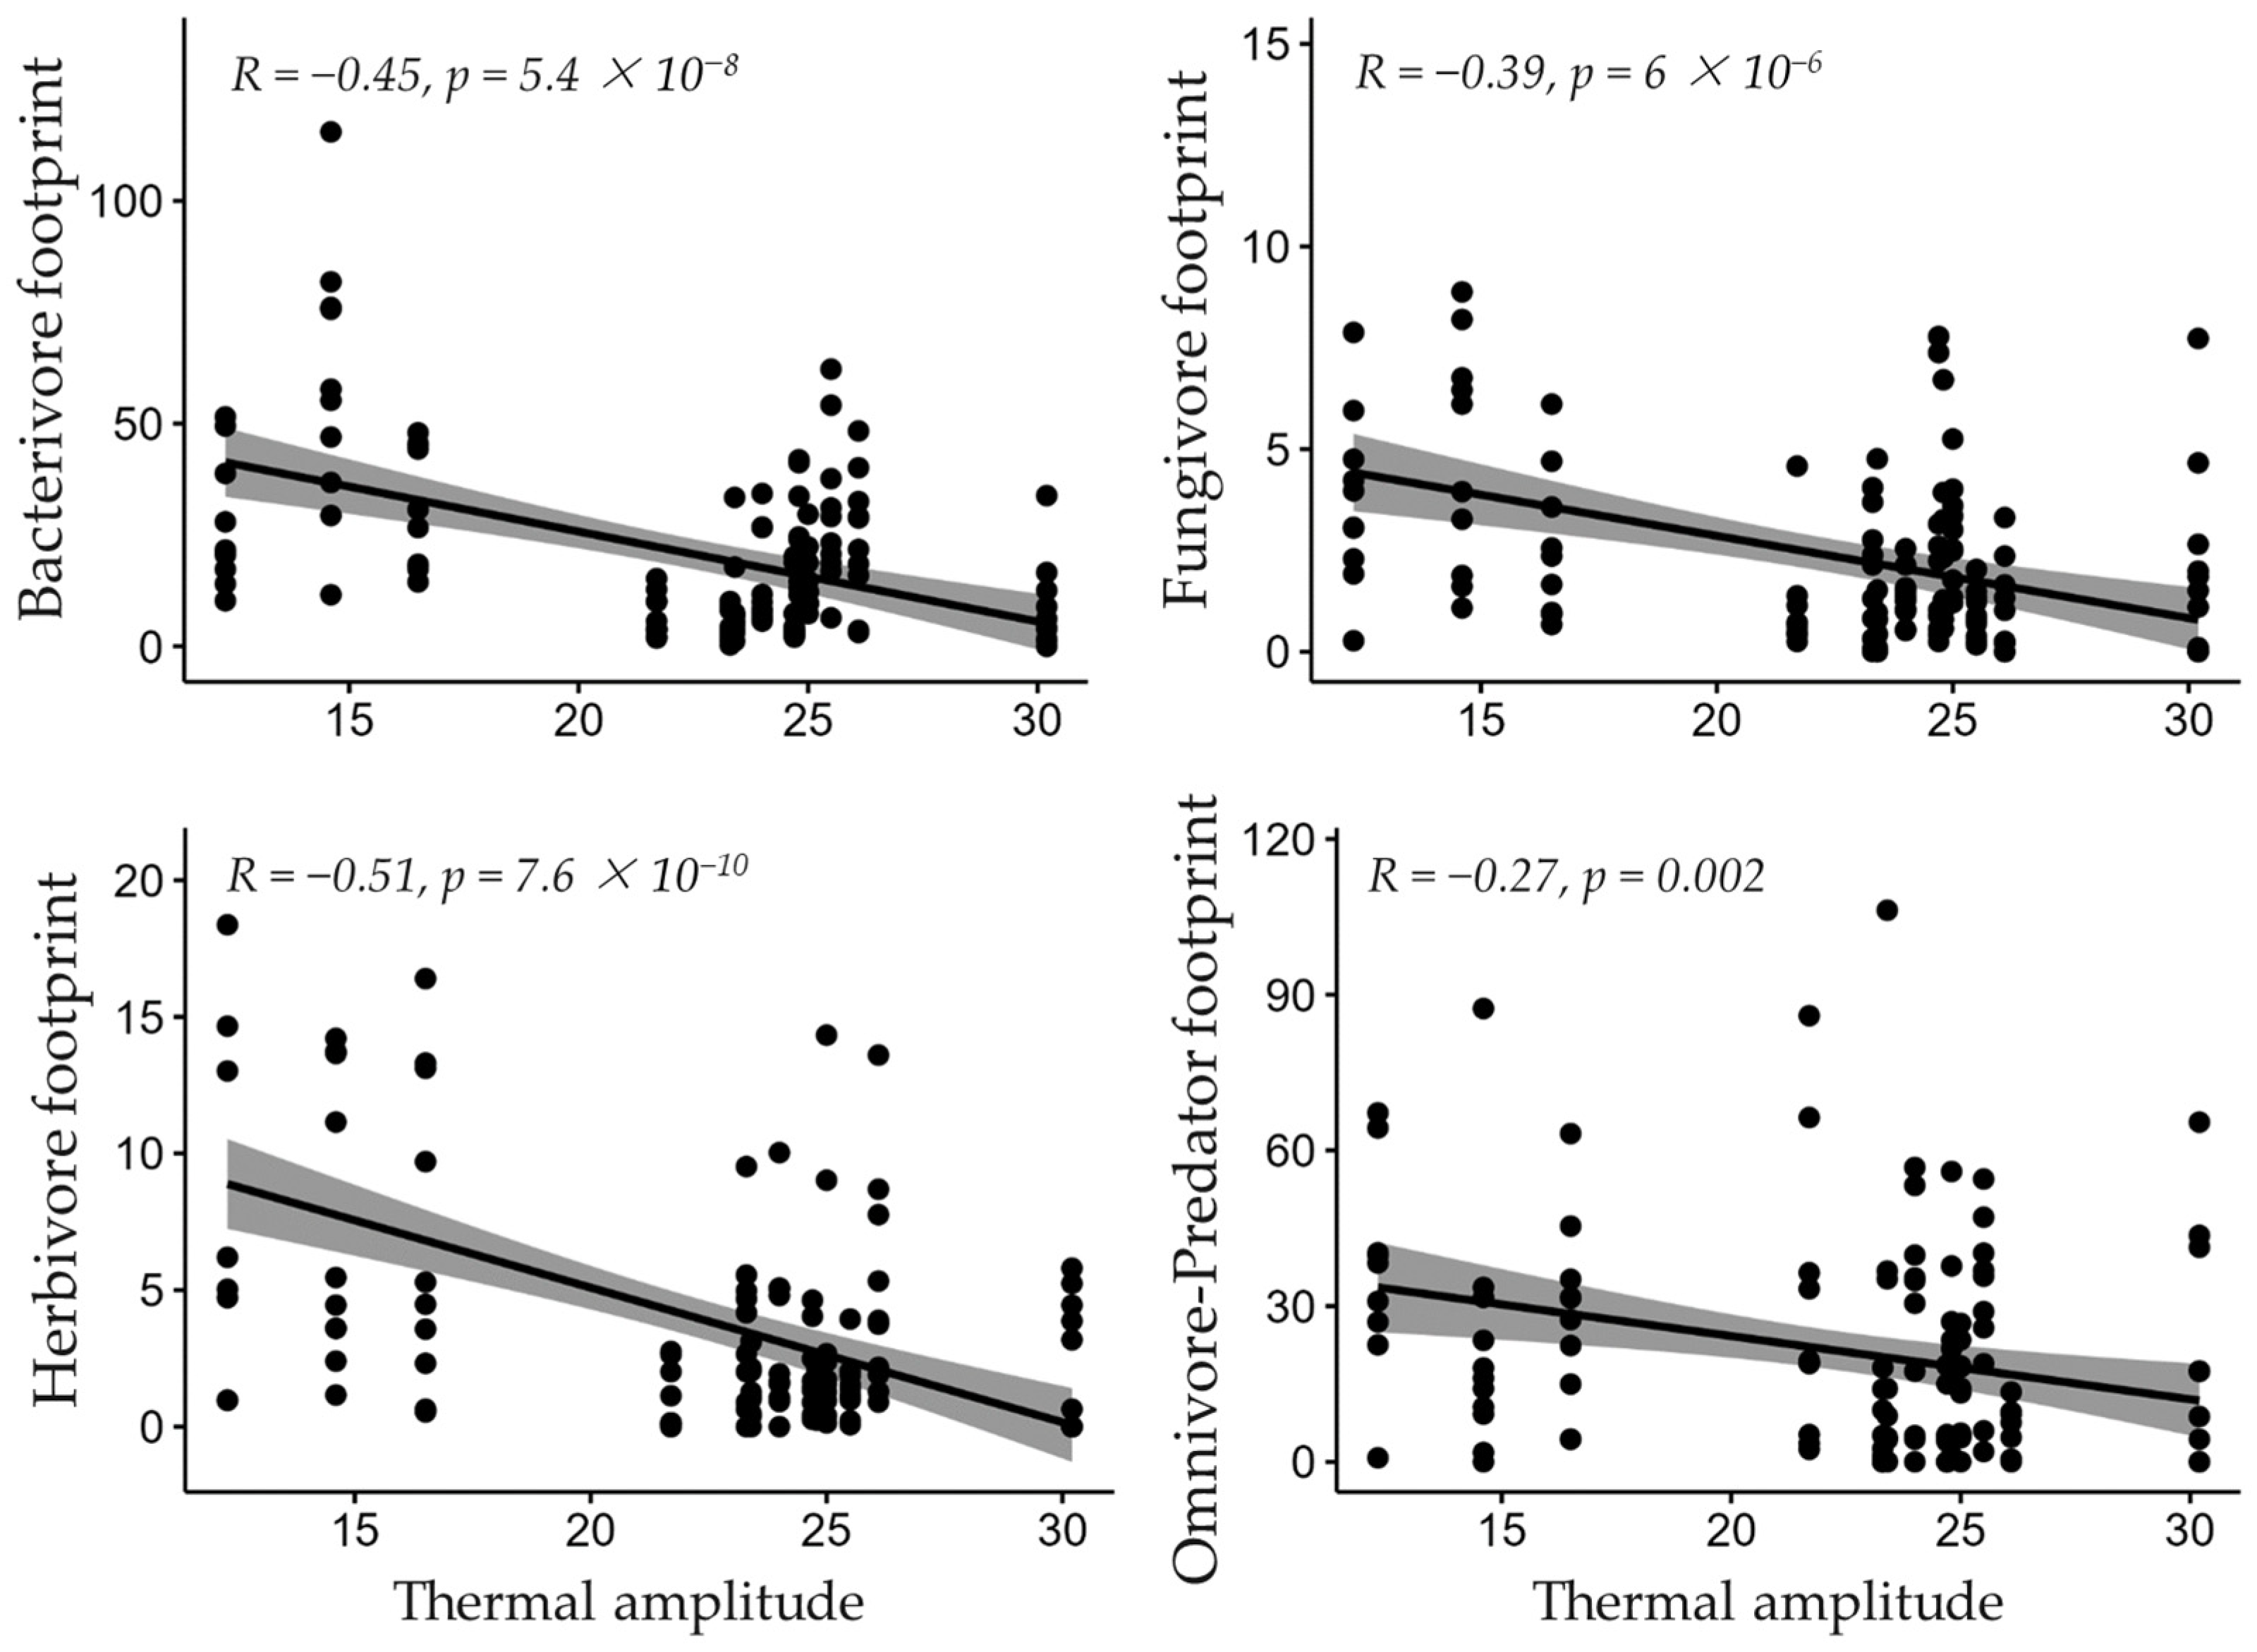
Moderate negative correlations were observed between the metabolic footprint of all four trophic-group footprints, which declined significantly with increasing thermal amplitude (Figure 7). The herbivore footprint showed the strongest negative correlation (R = −0.51), followed by the bacterivore footprint (R = −0.45), the fungivore footprint (R = −0.39), and the omnivore-predator footprint (R = −0.27), all significant at p < 0.001.
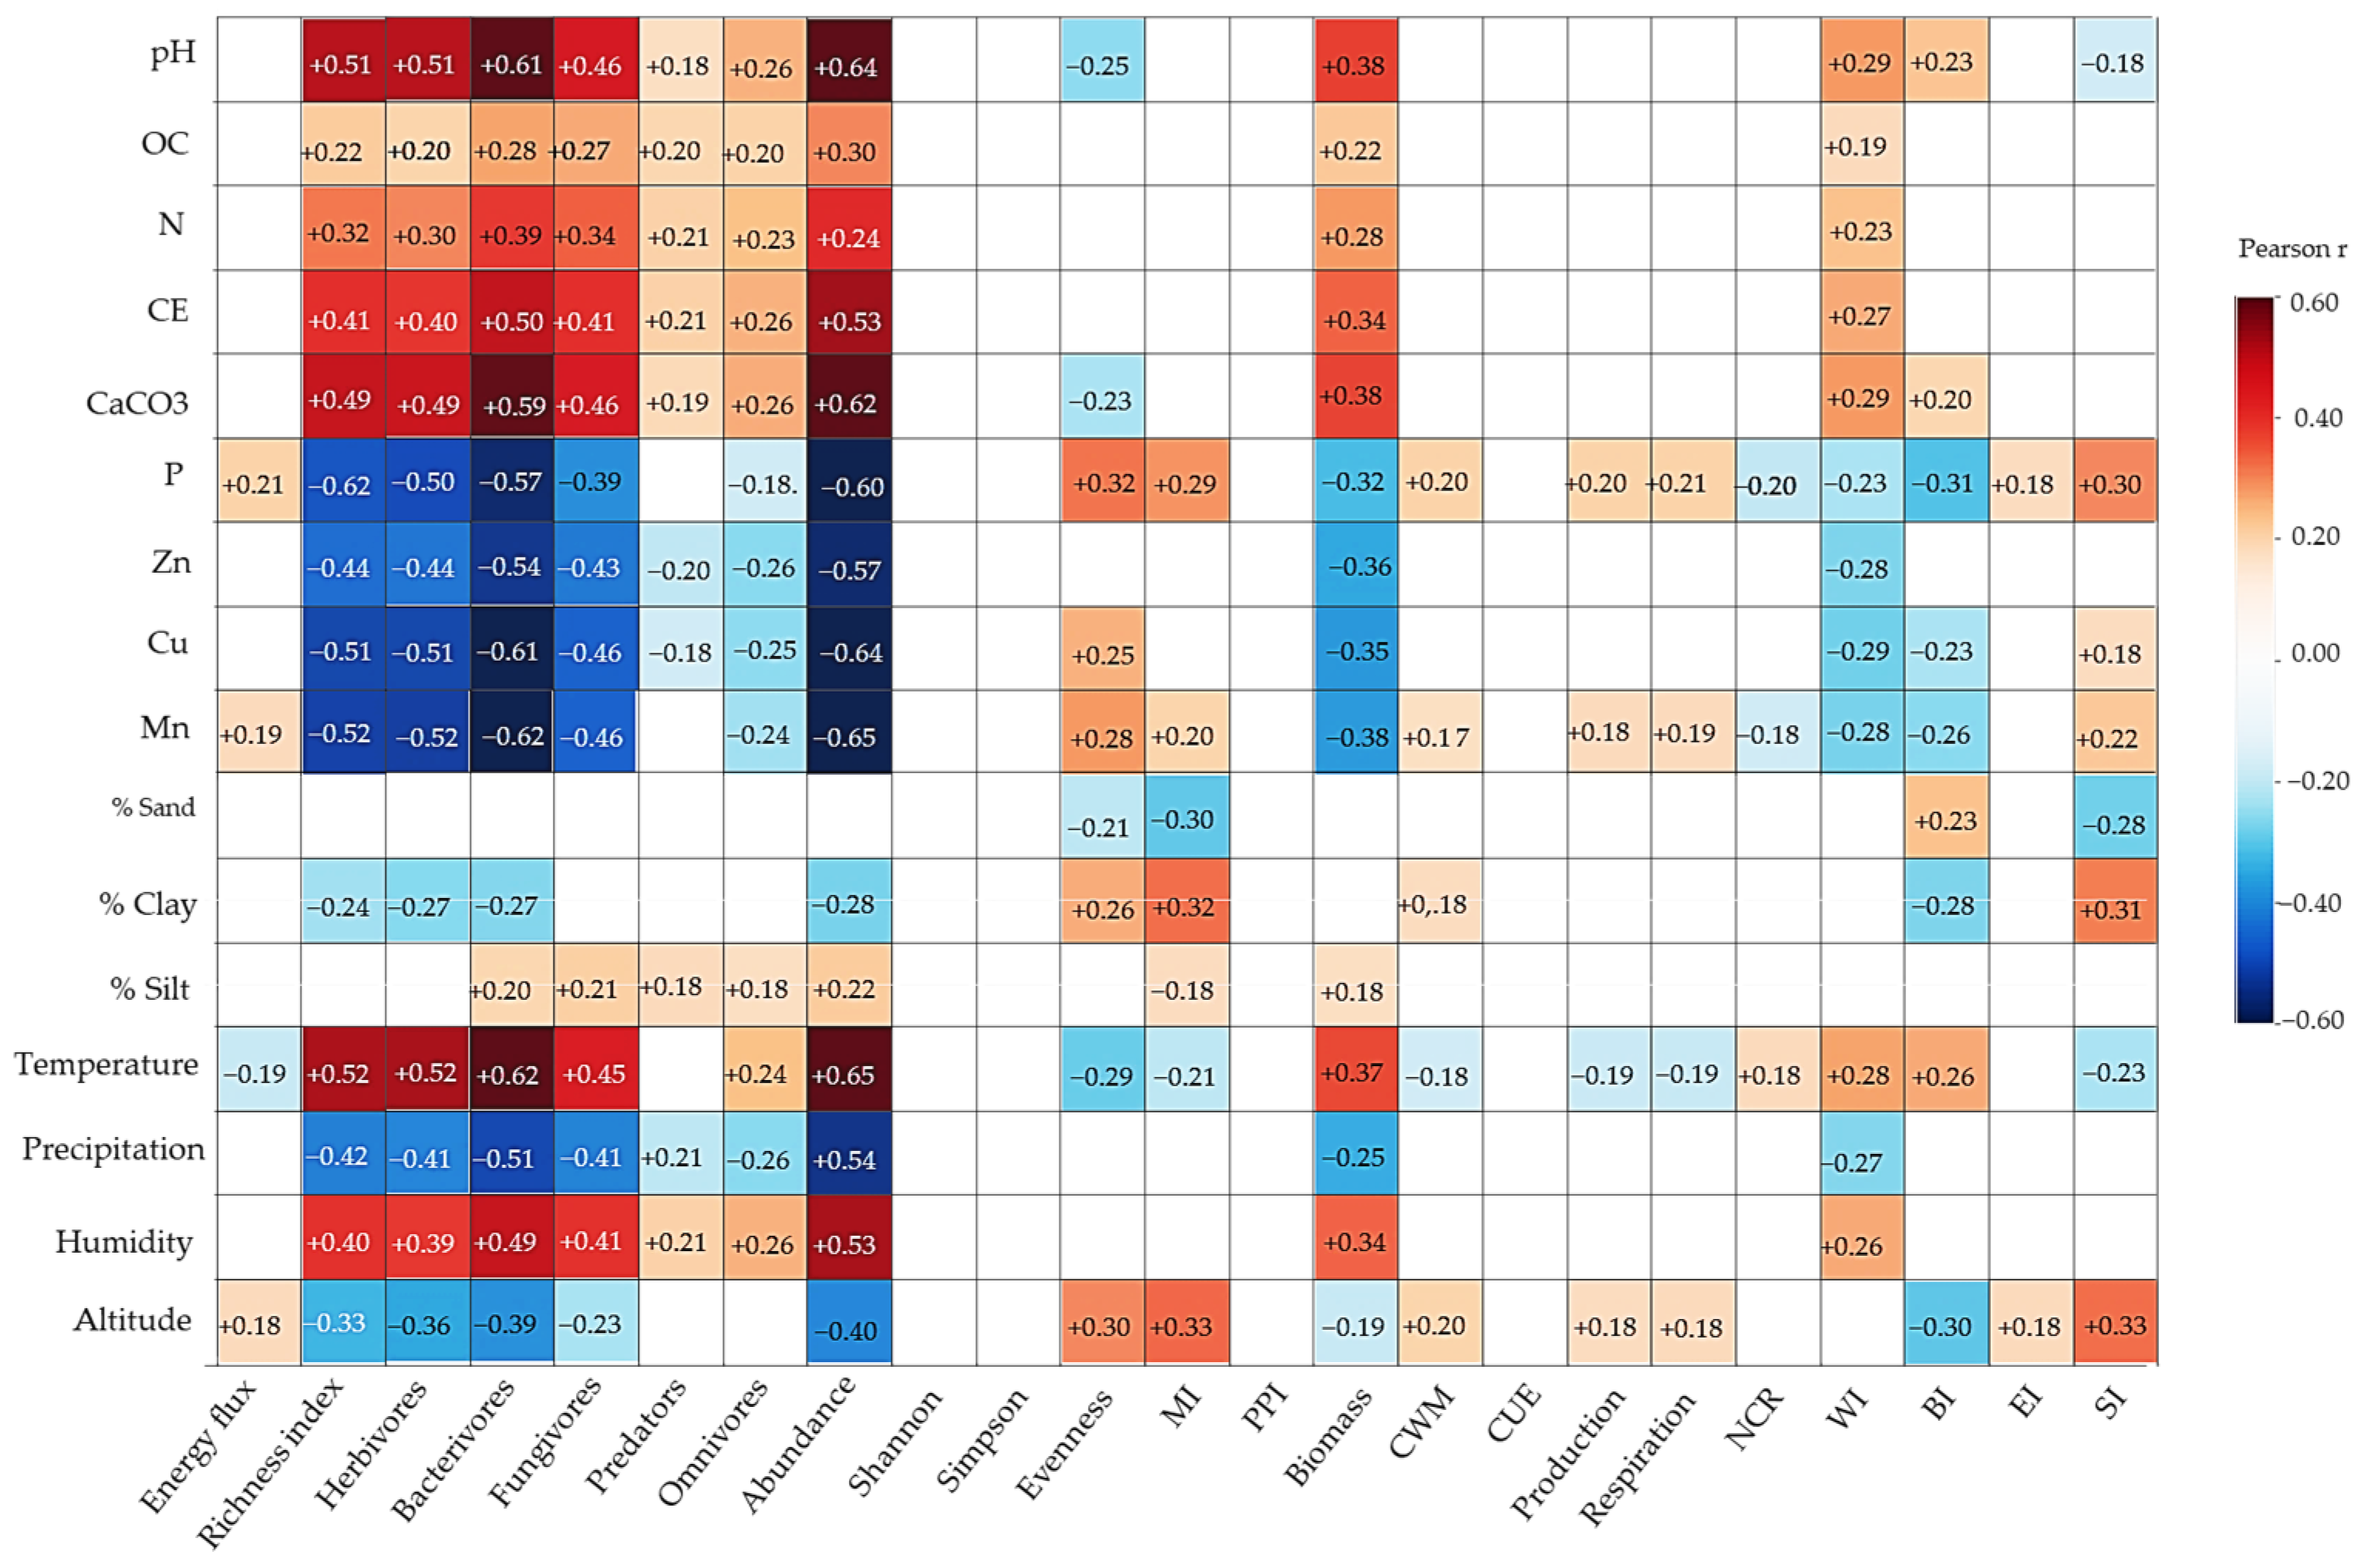
The correlation matrix revealed strong associations between environmental variables and nematode community parameters (Figure 8). Positive correlations dominated between certain soil parameters (pH, CE, CaCO3, temperature, N, and humidity) and nematode abundance-related variables, including total abundance, bacterivores, fungivores, and herbivores, whereas negative correlations prevailed between trace metal concentrations (P, Zn, Cu, Mn), precipitation, and altitude. Notably, Shannon diversity and metabolic traits (CUE, production) showed weak correlations with environmental variables.

4. Discussion

4.1. Diversity, Community Structure, and Trophic Composition of Soil Nematodes Across Climatic Zones

The results of this study provide strong support for our first hypothesis, namely that the continental gradient exerts a significant structuring effect on soil nematode diversity, abundance, and trophic composition within the Arganeraie Biosphere Reserve. The progressive decline in total nematode abundance and genus richness from the island to the semi-continental zone mirrors patterns reported in other Mediterranean and semi-arid systems, where increasing thermal amplitude and reduced soil moisture act as primary environmental filters on belowground invertebrate communities [30]. This is consistent with the broader framework proposed by Verdúet al. [23] and Rongstock et al. [24], who argue that continental gradients function as integrative proxies for multiple co-occurring stressors, including thermal extremes, water deficit, and edaphic instability, whose combined effects on soil biota typically exceed those observed when each factor is examined in isolation.
Notably, while abundance and richness declined markedly with increasing continentality, the Shannon and Simpson diversity indices did not differ significantly among zones. This apparent decoupling suggests a compensatory mechanism in community evenness, whereby the loss of dominant taxa in more continental zones is partially offset by a more balanced relative distribution among the remaining genera. Similar patterns have been documented in arid soils subjected to increasing water stress, where taxonomic loss does not necessarily translate into proportional declines in diversity indices because rare taxa persist while dominant ones decline [29]. This finding reinforces the view that single diversity metrics are insufficient to capture the full ecological response of nematode assemblages to environmental gradients and that diversity and functional analyses must be considered jointly.
The significantly lower Pielou’s evenness in the island zone, despite its higher abundance and richness, indicates that this zone supports a more dominance-structured community, likely reflecting locally favorable conditions that allow a subset of taxa to proliferate disproportionately. This pattern aligns with the productivity–dominance relationship described for nutrient-enriched or climatically buffered soils, in which high resource availability favors rapid population growth of opportunistic colonizer taxa [6,10].
The significantly higher MI in the island zone is consistent with communities possibly shaped by slightly more stable, less disturbed conditions [17,63], and provides direct empirical support for the maturity-index framework, in which the relative abundance of persister taxa serves as an indicator of soil disturbance history. Conversely, the elevated NCR in the island zone points to a fungal-dominated decomposition pathway, in agreement with Ferris et al. [6], who associate high NCR values with slower-turnover, fungal-based energy channels typical of structurally mature soils. The relative shift toward a more bacterial-dominated channel in coastal and semi-continental zones suggests an acceleration of nutrient cycling under increasing thermal stress, consistent with global syntheses showing that bacterial-dominated decomposition pathways tend to prevail under disturbed or resource-pulsed conditions [64,65]. The concurrently higher WI and BI in the island zone further support a community profile characterized by greater opportunistic enrichment alongside a structurally buffered fungal channel, while the significantly elevated SI in the coastal zone suggests that, despite its lower overall abundance, this zone retains a comparatively more structured food web—an apparent paradox that warrants closer examination of fine-scale edaphic heterogeneity in transitional climatic zones.

4.2. Multivariate Patterns in Nematode Community Composition and Trophic Structure

The clear multivariate separation of coastal communities revealed by both NMDS and PCA, together with their greater within-group dispersion, suggests that this zone is characterized by higher spatial heterogeneity in microhabitat conditions. Such transitional zones often exhibit increased environmental variability at fine spatial scales, which can generate higher compositional turnover among samples. The convergence between semi-continental and island communities along PC1, despite their contrasting climatic conditions, may reflect shared functional constraints imposed by either chronic aridity (semi-continental) or comparatively low net productivity, a hypothesis that merits further testing with finer-resolution environmental data.
The PCA loadings, with fungivores, predators, and omnivores driving the separation along PC1 and a bacterivore-herbivore gradient along PC2, indicate that it is primarily the higher trophic levels that discriminate among climatic zones. This is ecologically consistent with the greater sensitivity of K-strategist taxa (c-p 3–5) to environmental instability [17] and reinforces the interpretation that omnivore-predator and fungivore guilds act as the most responsive structural indicators of climatic stress within this reserve, while bacterivores provide comparatively limited discriminatory power despite their numerical dominance.

4.3. Relationships Between Body Size and Carbon Use Efficiency Along a Gradient of Continentality

The consistently higher CWM body mass observed in the island zone across nearly all trophic groups supports a trait-based interpretation in which less stressful environmental conditions favor the persistence of larger-bodied, slower-growing taxa. This pattern is consistent with the broader ecological principle that environmental stress selects for smaller body size and faster life-history strategies, a relationship well documented for both nematodes and other soil invertebrates [9,18]. The decline in CWM body mass with increasing continentality therefore likely reflects a shift in community composition toward smaller, more stress-tolerant colonizer taxa, complementing the MI and NCRbased evidence of reduced community maturity described above.
The parallel decline in CUE for bacterivores, fungivores, and omnivore-predators along the gradient is functionally significant, as CUE directly links nematode community metabolism to soil carbon dynamics [22]. Lower CUE in more continental zones implies that a larger proportion of assimilated carbon is respired rather than allocated to growth and reproduction, consistent with metabolic theory predicting that thermal and water stresses increase maintenance respiration costs relative to net biomass production [66,67]. This mirrors findings from soil microbial studies showing that water-limited and thermally variable conditions reduce microbial CUE through increased osmotic and thermal stress responses [68], suggesting that nematode and microbial carbon-processing efficiencies may respond in a functionally coupled manner across this gradient—an avenue meriting explicit testing in future work given the tight trophic linkage between nematodes and their microbial prey [14]. The absence of a significant CUE response in herbivores, in contrast to other trophic groups, may reflect their direct dependence on plant-derived carbon resources rather than on microbial intermediaries, rendering their metabolic efficiency comparatively decoupled from the soil microclimatic conditions that primarily affect microbial-feeding guilds.

4.4. Response of Nematode Communities to Environmental Drivers and Thermal Stress

The decline in nematode biomass and production with increasing continentality, contrasted with the comparatively stable energy flux and respiration, indicates that thermal stress disproportionately constrains carbon allocation to growth and reproduction rather than overall metabolic activity. This pattern is consistent with the metabolic footprint results: NMF values for bacterivores, fungivores, and herbivores were consistently higher in the island zone, indicating that this zone functions as a disproportionately important locus of nematode-mediated carbon flux, in line with global assessments identifying climatically stable, moisture-buffered soils as hotspots of nematode contribution to soil respiration [12].
The moderate-to-strong negative correlations between trophic-group footprints and thermal amplitude suggest that, despite their numerical dominance across all zones, these groups are functionally the most sensitive to increasing thermal stress. This finding has important implications: it indicates that shifts in nematode-mediated carbon cycling under climate change may be driven less by the loss of rare, specialized taxa than by reduced metabolic performance within the numerically dominant, broadly distributed functional groups, a mechanism increasingly recognized as central to ecosystem-level responses to climate stress [20,21].
The correlation analysis further identifies pH, electrical conductivity, CaCO3 content, temperature, and humidity as the dominant correlates of nematode abundance and trophic composition, in agreement with prior work on nematode community drivers in arid and semi-arid soils [41,69]. The negative associations with trace metals and altitude support a multifactorial control model in which climatic and edaphic variables interact synergistically to shape belowground biodiversity, consistent with global-scale evidence that soil abiotic properties and climate jointly constrain microbial and faunal community assembly [25,26]. The comparatively weak correlation between Shannon diversity, CUE, production, and the measured environmental variables is noteworthy and suggests that taxonomic diversity metrics and functional/metabolic traits may be governed by partially distinct sets of drivers—possibly related to unmeasured factors such as organic matter quality, microbial biomass, or fine-scale resource heterogeneity [14,28]. This divergence reinforces the value of combining taxonomic and trait-based approaches when assessing soil health, since reliance on diversity indices alone may fail to detect functionally significant shifts in carbon-cycling capacity.

5. Conclusions

This study reveals that the continental gradient in the Arganeraie Biosphere Reserve is associated with marked shifts in soil nematode community structure and functional attributes. Island climates are linked to higher abundance, richness, and trophic complexity, while coastal and semi-continental zones exhibit simplified, bacterivore-dominated communities with constrained functional diversity. Thermal amplitude is associated with reduced biomass, production, and metabolic footprints across all trophic groups. The stability of energy flux despite diversity losses appears consistent with functional redundancy within dominant bacterivore guilds, though this should not be interpreted as resilience given the absence of perturbation-recovery experiments.
Several limitations warrant consideration. The cross-sectional design precludes assessment of temporal dynamics and seasonal variability that may substantially alter community composition in arid Mediterranean ecosystems. Resilience was not directly measured; the study relies on spatial proxies to infer stress responses, and statements regarding buffering capacity remain speculative. The correlative nature of the analyses prevents definitive attribution to specific drivers, as unmeasured variables—including organic matter quality, microbial biomass, and land-use history—may contribute substantially to observed variation. Additionally, the spatial scale was confined to a single reserve, limiting generalizability to broader Mediterranean contexts.

Author Contributions

Conceptualization, A.B., E.H.M., A.E.M., F.M. and M.A.H.; methodology, A.B., T.O., A.I., M.B., S.L., E.E. and H.I.; software, A.B. and I.F.A.; investigation, A.B. and E.H.M.; writing—original draft preparation, A.B. and H.B.; writing—review and editing, H.B., S.S., E.H.M.; validation, T.O., A.I., M.B., S.L., E.E. and H.I.; visualization, E.H.M.; supervision, E.H.M. All authors have read and agreed to the published version of the manuscript.

Funding

This work was supported by the Partnership for Research and Innovation in the Mediterranean Area (“the PRIMA Foundation”) through the “Soil Health and Agriculture Resilience through an Integrated Geographical Information Systems of Mediterranean Drylands” project (grant agreement number 2211) (SHARInG-MeD).

Data Availability Statement

Data is contained within the article. The original contributions presented in this study are included in the article. Further inquiries can be directed to the corresponding authors.

Conflicts of Interest

The authors declare no conflicts of interest.

References

  1. Reed, D.C.; Algar, C.K.; Huber, J.A.; Dick, G.J. Gene-centric approach to integrating environmental genomics and biogeochemical models. Proc. Natl. Acad. Sci. USA 2014, 111, 1879–1884. [Google Scholar] [CrossRef] [PubMed]
  2. Olsson, P.A.; Hammer, E.C.; Pallon, J.; van Aarle, I.M.; Wallander, H. Elemental composition in vesicles of an arbuscular mycorrhizal fungus, as revealed by PIXE analysis. Fungal Biol. 2011, 115, 643–648. [Google Scholar] [CrossRef] [PubMed]
  3. Lu, X.; Kelsey, K.C.; Yan, Y.; Sun, J.; Wang, X.; Cheng, G.; Neff, J.C. Effects of grazing on ecosystem structure and function of alpine grasslands in Qinghai–Tibetan Plateau: A synthesis. Ecosphere 2017, 8, e01656. [Google Scholar] [CrossRef]
  4. Hu, J.; Wu, J.; Ma, M.; Nielsen, U.N.; Wang, J.; Du, G. Nematode communities response to long-term grazing disturbance on Tibetan plateau. Eur. J. Soil Boil. 2015, 69, 24–32. [Google Scholar] [CrossRef]
  5. Doran, J.W.; Sarrantonio, M.; Liebig, M.A. Soil Health and Sustainability. In Advances in Agronomy; Academic Press, Inc.: San Diego, CA, USA, 1996; Volume 56, pp. 1–54. [Google Scholar]
  6. Ferris, H.; Bongers, T.; de Goede, R.G.M. A framework for soil food web diagnostics: Extension of the nematode faunal analysis concept. Appl. Soil Ecol. 2001, 18, 13–29. [Google Scholar] [CrossRef]
  7. Bongers, T.; Ferris, H. Nematode community structure as a bioindicator in environmental monitoring. Trends Ecol. Evol. 1999, 14, 224–228. [Google Scholar] [CrossRef] [PubMed]
  8. Hugot, J.P.; Baujard, P.; Morand, S. Biodiversity in helminths and nematodes as a field of study: An overview. Nematology 2001, 3, 199–208. [Google Scholar] [CrossRef]
  9. Andriuzzi, W.S.; Wall, D.H. Responses of belowground communities to large aboveground herbivores: Meta-analysis reveals biome-dependent patterns and critical research gaps. Glob. Change Biol. 2017, 26, 3857–3868. [Google Scholar] [CrossRef] [PubMed]
  10. Yeates, G.W.; Bongers, T.; de Goede, R.G.M.; Freckman, D.W.; Georgieva, S.S. Feeding habits in soil nematode families and genera—An outline for soil ecologists. J. Nematol. 1993, 25, 315–331. [Google Scholar] [CrossRef] [PubMed]
  11. Yeates, G.W.; Wardle, D.A.; Watson, R.N. Responses of soil nematode populations to increasing amounts of nitrogen and phosphorus fertilizers in a ryegrass/white clover pasture. Biol. Fertil. Soils 1999, 29, 329–337. [Google Scholar] [CrossRef]
  12. van den Hoogen, J.; Geisen, S.; Routh, D.; Ferris, H.; Traunspurger, W.; Wardle, D.A.; de Goede, R.G.M.; Adams, B.J.; Ahmad, W.; Andriuzzi, W.S. Soil nematode abundance and functional group composition at a global scale. Nature 2019, 572, 194–198. [Google Scholar] [CrossRef] [PubMed]
  13. Schlüter, S.; Gil, E.; Doniger, T.; Applebaum, I.; Steinberger, Y. Abundance and community composition of free-living nematodes as a function of soil structure under different vineyard managements. Appl. Soil Ecol. 2022, 170, 104291. [Google Scholar] [CrossRef]
  14. Trap, J.; Bonkowski, M.; Plassard, C.; Villenave, C.; Blanchart, E. Ecological importance of soil bacterivores for ecosystem functions. Plant Soil 2016, 398, 1–24. [Google Scholar] [CrossRef]
  15. Li, G.; Liu, T.; Whalen, J.K.; Wei, Z. Nematodes: An overlooked tiny engineer of plant health. Trends Plant Sci. 2024, 29, 52–64. [Google Scholar] [CrossRef] [PubMed]
  16. Zhu, B.; Whalen, J.K.; Wu, J.; Yang, J.; Mao, X.; Wan, B.; Tian, S.; Hu, F.; Chen, X.; Liu, M. Soil food web structure coordinated by soil omnivores sustains soil multifunctionality in moderate vermicompost amended fields. Soil Biol. Biochem. 2024, 192, 109391. [Google Scholar] [CrossRef]
  17. Bongers, T. The maturity index: An ecological measure of environmental disturbance based on nematode species composition. Oecologia 1990, 83, 14–19. [Google Scholar] [CrossRef] [PubMed]
  18. Ferris, H. Form and function: Metabolic footprints of nematodes in the soil food web. Eur. J. Soil Biol. 2010, 46, 97–104. [Google Scholar] [CrossRef]
  19. Kergunteuil, A.; Campos-Herrera, R.; Sánchez-Moreno, S.; Vittoz, P.; Rasmann, S. The abundance, diversity, and metabolic footprint of soil nematodes is highest in high elevation alpine grasslands. Front. Ecol. Evol. 2016, 4, 84. [Google Scholar] [CrossRef]
  20. Barnes, A.D.; Jochum, M.; Lefcheck, J.S.; Eisenhauer, N.; Scherber, C.; O’Connor, M.I.; de Ruiter, P.C.; Brose, U. Energy flux: The link between multitrophic biodiversity and ecosystem functioning. Trends Ecol. Evol. 2018, 33, 186–197. [Google Scholar] [CrossRef] [PubMed]
  21. Oxtoby, L.E.; Budge, S.M.; Iken, K.; O’Brien, D.M.; Wooller, M.J. Feeding ecologies of key bivalve and polychaete species in the Bering Sea as elucidated by fatty acid and compound-specific stable isotope analyses. Mar. Ecol. Prog. Ser. 2016, 557, 161–175. [Google Scholar] [CrossRef]
  22. Zhou, J.; Luo, Y.; Chen, J. Dilemmas in linking microbial carbon use efficiency with soil organic carbon dynamics. Glob. Change Biol. 2025, 31, e70058. [Google Scholar] [CrossRef]
  23. Verdú, M.; Bochet, E.; Espigares, T.; Margalef-Marrase, J.; Niclau, J.M.; Yue, Y.; Azorín-Molina, C.; Garcia-Fayos, P. Climate change may affect the signal of plant facilitation in Mediterranean drylands. Oikos 2024, 202, e11217. [Google Scholar] [CrossRef]
  24. Rongstock, R.; Li, H.; Lehmann, A.; Wulf, A.; Rillig, M.C. Global change factors differ in effect when acting alone and in a multi-factor background. Nat. Commun. 2026, 17, 1–12. [Google Scholar] [CrossRef] [PubMed]
  25. Delgado-Baquerizo, M.; Reich, P.B.; Trivedi, C.; Eldridge, D.J.; Abades, S.; Alfaro, F.D.; Bastida, F.; Berhe, A.A.; Cutler, N.A.; Gallardo, A. Multiple elements of soil biodiversity drive ecosystem functions across biomes. Nat. Ecol. Evol. 2020, 4, 210–220. [Google Scholar] [CrossRef] [PubMed]
  26. Crowther, T.W.; van den Hoogen, J.; Wan, J.; Mayes, M.A.; Keiser, A.D.; Mo, L.; Averill, C.; Maynard, D.S. The global soil community and its influence on biogeochemistry. Science 2019, 365, 480–485. [Google Scholar] [CrossRef] [PubMed]
  27. Thakur, M.P.; Geisen, S. Trophic regulations of the soil microbiome. Trends Microbiol. 2023, 31, 79–89. [Google Scholar] [CrossRef] [PubMed]
  28. Eisenhauer, N.; Lanoue, A.; Strecker, T.; Scheu, S.; Steinauer, K.; Thakur, M.P.; Mommer, L. Root biomass and exudates link plant diversity to soil microbial biomass and activity. Sci. Rep. 2017, 7, 44641. [Google Scholar] [CrossRef] [PubMed]
  29. Bakonyi, G.; Nagy, P.; Kovács-Láng, E.; Kovács, E.; Barcza, Z.; Reiczigel, J.; Röpcke, I. Soil nematode community structure as affected by temperature and moisture in a temperate semiarid shrubland. Appl. Soil Ecol. 2007, 37, 31–40. [Google Scholar] [CrossRef]
  30. Ferris, H.; Sánchez-Moreno, S.; Brennan, E.B. Structure, functions and interguild relationships of the soil nematode assemblage in organic vegetable production. Appl. Soil Ecol. 2012, 61, 16–25. [Google Scholar] [CrossRef]
  31. Zhang, Z.Y.; Zhang, X.K.; Xu, M.G.; Zhang, S.Q.; Huang, S.M.; Liang, W.J. Responses of soil micro-food web to long-term fertilization in a wheat–maize rotation system. Appl. Soil Ecol. 2016, 98, 56–64. [Google Scholar]
  32. Zheng, Q.; Hu, Y.; Zhang, S.; Noll, L.; Böckker, H.T.S.; Richter, A. Growth explains microbial carbon use efficiency across soils differing in land use and geology. Soil Biol. Biochem. 2019, 135, 86–93. [Google Scholar] [CrossRef]
  33. Conesa, H.M.; María-Cervantes, A.; Álvarez-Rogel, J.; González-Alcaraz, M.N. Influence of soil properties on trace element availability and plant accumulation in a Mediterranean salt marsh polluted by mining wastes: Implications for phytomanagement. Sci. Total Environ. 2011, 409, 4470–4479. [Google Scholar] [CrossRef] [PubMed]
  34. Debrach, J. Essai de classification des climats du Maroc. Bull. ÉCon. Soc. Maroc. 1952, 16, 1–22. [Google Scholar]
  35. Emberger, L. Une classification biogéographique des climats. Rec. Trav. Lab. Bot. Géol. Zool. Fac. Sci. Univ. Montp. 1955, 7, 3–43. [Google Scholar]
  36. Aouragh, M.; El Fahime, E.; Boumezzough, A. Étude de la biodiversité floristique dans la réserve de biosphère de l’Arganeraie (Maroc). Bull. Inst. Sci. Rabat 2012, 34, 1–12. [Google Scholar]
  37. Médail, F.; Quézel, P. Biodiversity hotspots in the Mediterranean Basin: Setting global conservation priorities. Conserv. Biol. 1999, 13, 1510–1513. [Google Scholar] [CrossRef]
  38. Msanda, F.; El Aboudi, A.; Peltier, J.P. Biodiversité et biogéographie de l’arganeraie marocaine. Cah. Agric. 2005, 14, 357–364. [Google Scholar]
  39. Peltier, J.P. La Végétation du Bassin Versant de l’oued Sous (Maroc). Ph.D. Thesis, Université de Montpellier, Montpellier, France, 1982. [Google Scholar]
  40. M’Hirit, O.; Benzyane, M.; Benchekroun, F.; El Yousfi, S.M.; Badaoui, M.E. L’arganier: Un Écosystème Endémique et une Ressource Forestière et Pastorale Remarquable; Mardaga: Bruxelles, Belgium, 1998. [Google Scholar]
  41. ISO 23611-4:2007; Soil Quality—Sampling of Soil Invertebrates—Part 4: Sampling, Extraction and Identification of Soil Nematodes. International Organization for Standardization: Geneva, Switzerland, 2007.
  42. Oostenbrink, M. Estimating nematode populations by some selected methods. In Nematology; Sasser, J.N., Jenkins, W.R., Eds.; University of North Carolina Press: Chapel Hill, NC, USA, 1960; pp. 85–102. [Google Scholar]
  43. Bongers, T. De Nematoden van Nederland; Stichting Uitgeverij Koninklijke Nederlandse Natuurhistorische Vereniging: Utrecht, The Netherlands, 1988. [Google Scholar]
  44. Mai, W.F.; Mullin, P.G. Plant-Parasitic Nematodes: A Pictorial Key to Genera, 6th ed.; Cornell University Press: Ithaca, NY, USA, 2018. [Google Scholar]
  45. Nemaplex. Nematode-Plant Expert Information System. Available online: http://nemaplex.ucdavis.edu (accessed on 15 June 2023).
  46. Shannon, C.E.; Weaver, W. The Mathematical Theory of Communication; University of Illinois Press: Urbana, IL, USA, 1948. [Google Scholar]
  47. Simpson, E.H. Measurement of diversity. Nature 1949, 163, 688. [Google Scholar] [CrossRef]
  48. Margalef, R. On certain unifying principles in ecology. Am. Nat. 1963, 97, 357–374. [Google Scholar] [CrossRef] [PubMed]
  49. Garnier, E.; Lavorel, S.; Ansquer, P.; Castro, H.; Cruz, P.; Dolezal, J.; Eriksson, O.; Freitas, H.; Golodets, C.; Grigulis, K. Assessing the effects of land-use change on plant traits, communities and ecosystem functioning in grasslands: A standardized methodology and lessons from an application to 11 European sites. Ann. Bot. 2007, 93, 597–614. [Google Scholar] [CrossRef] [PubMed]
  50. Luo, J.M.; Zhang, X.K.; Kou, X.C.; Xie, H.T.; Bao, X.L.; Mahamood, M.; Liang, W.J. Effects of residue mulching amounts on metabolic footprints based on production and respiration of soil nematodes in a long-term no-tillage system. Land Degrad. Dev. 2021, 32, 2383–2392. [Google Scholar] [CrossRef]
  51. Bhusal, D.R.; Tsiafouli, M.A.; Sgardelis, S.P. Temperature-based bioclimatic parameters can predict nematode metabolic footprints. Oecologia 2015, 179, 187–199. [Google Scholar] [CrossRef] [PubMed]
  52. Persson, T.; Bååth, E.; Clarholm, M.; Lundkvist, H.; Söderström, B.E.; Sohlenius, B. Trophic Structure, Biomass Dynamics and Carbon Metabolism of Soil Organisms in a Scots Pine Forest. Ecol. Bull. 1980, 32, 419–459. [Google Scholar]
  53. Persson, T. Influence of Soil Animals on Nitrogen Mineralization in a Northern Scots Pine Forest. In Proceedings of the 8th International Colloquium of Soil Zoology, Louvaine-la Neuve, Belgium, 30 August–2 September 1983. [Google Scholar]
  54. Atkinson, D. Temperature and organism size—A biological law for ectotherms? Adv. Ecol. Res. 1994, 25, 1–58. [Google Scholar] [CrossRef]
  55. Barnes, A.D.; Jochum, M.; Mumme, S.; Haneda, N.F.; Farajallah, A.; Widarto, T.H.; Brose, U. Consequences of tropical land use for multitrophic biodi-versity and ecosystem functioning. Nat. Commun. 2014, 5, 5351. [Google Scholar] [CrossRef] [PubMed]
  56. Cui, S.; Liang, S.; Zhang, X.; Li, Y.; Liang, W.; Sun, L.; Wang, J.; Bezemer, T.M.; Li, Q. Long-term fertilization management affects the C utilization from crop residues by the soil micro-food web. Plant Soil 2018, 429, 335–348. [Google Scholar] [CrossRef]
  57. de Ruiter, P.C.; Neutel, A.M.; Moore, J.C. Energetics, patterns of interaction strengths, and stability in real ecosystems. Science 1995, 269, 1257–1260. [Google Scholar] [CrossRef] [PubMed]
  58. Anderson, M.J. A new method for non-parametric multivariate analysis of variance. Austral Ecol. 2001, 26, 32–46. [Google Scholar] [CrossRef]
  59. Clarke, K.R. Non-parametric multivariate analyses of changes in community structure. Aust. J. Ecol. 1993, 18, 117–143. [Google Scholar] [CrossRef]
  60. R Core Team. R: A Language and Environment for Statistical Computing; R Foundation for Statistical Computing: Vienna, Austria, 2023. [Google Scholar]
  61. Oksanen, J.; Simpson, G.L.; Blanchet, F.G.; Kindt, R.; Legendre, P.; Minchin, P.R.; O’Hara, R.B.; Solymos, P.; Stevens, M.H.H.; Szoecs, E. vegan: Community Ecology Package; R package version 2.6-4, 2022. Available online: https://CRAN.R-project.org/package=vegan (accessed on 20 June 2023).
  62. NINJA. Nematode INdicator Joint Analysis. Available online: https://shiny.wur.nl/ninja/ (accessed on 15 June 2023).
  63. Bongers, T. The Maturity Index, the evolution of nematode life history traits, adaptive radiation and cp-scaling. Plant Soil 1999, 212, 13–22. [Google Scholar] [CrossRef]
  64. Wardle, D.A.; Bardgett, R.D.; Klironomos, J.N.; Setälä, H.; van der Putten, W.H.; Wall, D.H. Ecological linkages between aboveground and belowground biota. Science 2004, 304, 1629–1633. [Google Scholar] [CrossRef] [PubMed]
  65. de Vries, F.T.; Hoffland, E.; van Eekeren, N.; Brussaard, L.; Bloem, J. Fungal/bacterial ratios in grasslands with contrasting nitrogen management. Soil Biol. Biochem. 2012, 50, 1–8. [Google Scholar] [CrossRef]
  66. Brown, J.H.; Gillooly, J.F.; Allen, A.P.; Savage, V.M.; West, G.B. Toward a metabolic theory of ecology. Ecology 2004, 85, 1771–1789. [Google Scholar] [CrossRef]
  67. Schimel, J.P.; Bennett, J. Nitrogen mineralization: Challenges of a changing paradigm. Ecology 2007, 88, 591–602. [Google Scholar] [CrossRef]
  68. Malik, A.A.; Chowdhury, S.; Schlager, V.; Oliver, A.; Puissant, J.; Vazquez, P.G.; Jehmlich, N.; von Bergen, M.; Griffiths, R.I.; Gleixner, G. Soil fungal:bacterial ratios are linked to altered carbon cycling. Front. Microbiol. 2018, 9, 1234. [Google Scholar] [CrossRef] [PubMed]
  69. Braimi, A.; Benjlil, H.; Alaoui, I.F.; Obidari, T.; Idhmida, A.; Ait Hamza, M.; Mayad, E.H. Environmental factors shaping soil nematode community structure in the Arganeraie biosphere reserve—Insights from arid and semi-arid ecosystems. Pedosphere 2025. [Google Scholar] [CrossRef]
Figure 1. (a) Location map of the Arganeraie Biosphere Reserve in west−central Morocco and distribution of sampling points along the thermal amplitude gradient—(b) arganeraie biosphere ecosystem, (c) argan tree (Sideroxylon spinosum L).
Soilsystems 10 00073 g001
Figure 2. Non-metric multidimensional scaling (NMDS) of Bray–Curtis dissimilarities of nematode trophic communities along the continental gradient (stress = 0.040).
Soilsystems 10 00073 g002
Figure 3. Principal component analysis (PCA) of nematode trophic-group composition across the three climatic zones.
Soilsystems 10 00073 g003
Figure 4. The effects of different habitats (island, coastal, and semi-continental) along the continental gradient on (a) the community-weighted mean (CWM) mass and (b) carbon use efficiency (CUE) of trophic groups. Significant differences, as determined by Tukey’s honest significant difference test (* p < 0.001), are denoted by different lowercase letters.
Soilsystems 10 00073 g004
Figure 5. Pearson correlation coefficients between nematode biomass, energy flux, respiration, and soil nematode Production, and the thermal amplitude gradient. The correlation values and their significance levels are displayed above each plot.
Soilsystems 10 00073 g005
Figure 6. The effects of different habitats (island, coastal, and semi-continental) along the continental gradient on nematode trophic group footprints. Significant differences, as determined by Tukey’s honest significant difference test (* p < 0.05 and *** p < 0.001), are denoted by different lowercase letters.
Soilsystems 10 00073 g006
Figure 7. Pearson correlation coefficients between nematode trophic group footprints and the thermal amplitude gradient. The correlation values and their significance levels are displayed above each plot.
Soilsystems 10 00073 g007
Figure 8. Correlation matrix (Pearson’s r) between environmental variables (OC, organic carbon; N, nitrogen; CE, conductivity; CaCO3, calcium carbonate; P, phosphorus; Zn, zinc; Cu, copper; Mn, Manganese)and nematode community parameters (MI, maturity index; PPI, plant-parasitic index; CWM, community-weighted mean mass; CUE, carbon use efficiency; NCR, nematode channel ratio; WI, Wasilewska index; BI, basal index; EI, enrichment index; SI, structure index).
Soilsystems 10 00073 g008
Table 1. Location and climatic characteristics of sampling habitats.
Island Coastal Semi-Continental
Elevation 232632808
Mean annual precipitation (mm)21612092
Mean annual temperature (°C)141719
Thermal amplitude<15 °C15–25 °C25–35 °C
Humidity (g/100 g)4.333.162.3
Soil textureSlit-ClaySiltSilt-sand
Table 2. Nematode abundance based on feeding habits across habitat climates.
Trophic GroupIsland (n = 30)Coastal (n = 60)Semi-Continental (n = 40)Dfp
Mean±SDMean±SDMean±SD
Bacterivores213.33 a27.9548.33 b5.6779.9 b8.6234.785.99 × 10−14 ***
Fungivores36 a5.0613.03 b1.8714.32 b2.325.602.35 × 10−7 ***
Herbivores48.4 a6.6911.42 b1.420.92 b4.0828.561.08 × 10−9 ***
Omnivores12.97 a1.68.22 b1.27.08 b1.026.690.035 *
Predators1.77 a0.551.13 ab0.270.55 b0.166.190.045 *
Each climate zone has 10 replicates per site. Different lowercase letters indicate significant differences (Tukey’s HSD test: * p < 0.05; *** p < 0.001).
Table 3. Diversity and nematofaunal indices across habitat climates.
IndexIsland (n = 30)Coastal (n = 60)Semi-Continental (n = 40)Dfp
Mean±SDMean±SDMean±SD
Abundance312.47 a189.3082.13 c58.25122.77 b76.5648.31<0.001 ***
Richness20.63 a4.9113.27 b4.8315.13 b4.5534.55<0.001 ***
Shannon (H′)2.04 a0.281.95 b0.401.96 b0.331.180.554 ns
Simpson (1 − D)0.79 a0.070.80 b0.090.79 b0.071.130.569 ns
Evenness (J)0.71 b0.080.81 a0.10 0.77 b0.1118.73<0.001 ***
Maturity Index (MI)2.27 a0.162.25 b0.142.25 b0.209.610.008 **
Plant Parasite Idx (PPI)3.000.322.620.962.841.153.990.136 ns
Nematode Channel Ratio (NCR)0.850.070.780.160.840.146.720.035 *
Wasilewska Index (WI)272.69 b292.44119.77 a216.46118.05 b151.1615.59<0.001 ***
Basal Index (BI)68.32 a10.2154.91 b19.1166.40 a14.4716.83<0.001 ***
Enrichment Index (EI)14.555.8218.9711.4515.6011.554.090.103 ns
Structure Index (SI)22.78 b10.9136.04 a22.8223.68 b14.709.840.007 **
Each climate zone has 10 replicates per site. Different lowercase letters indicate significant differences (Tukey’s HSD test: * p < 0.05, ** p < 0.01, *** p < 0.001; ns: not significant).
Disclaimer/Publisher’s Note: The statements, opinions and data contained in all publications are solely those of the individual author(s) and contributor(s) and not of MDPI and/or the editor(s). MDPI and/or the editor(s) disclaim responsibility for any injury to people or property resulting from any ideas, methods, instructions or products referred to in the content.