1. Introduction
Green roofs are implemented as a nature-based solution to mitigate urban environmental problems such as stormwater runoff, overheating of buildings, biodiversity loss in densely built areas, and to reduce the urban heat island effect [
1,
2]. The performance of green roofs and the ecosystem functions they can support strongly depend on the properties of the substrate, which control plant establishment, water storage, and nutrient cycling [
3].
Green roof substrates are usually engineered mixtures of lightweight mineral components (including expanded clay, perlite, pumice, zeolite, crushed bricks), sand to create the appropriate air regime and organic amendments that improve water-holding capacity and nutrient supply (coconut fiber, peat, various composts) [
3], and amendments from recycled materials such as biochar; sometimes the substrates are made based on the regional soil [
4]. Optimal substrates must combine low bulk density with sufficient water availability, aeration, and long-term structural stability to sustain vegetation under shallow rooting conditions and frequent droughts. However, conventional substrates often rely heavily on peat [
4] as the main organic component because of its high water retention, low density, and availability in regions where green roofs are built. The use of peat, in turn, can increase CO
2 efflux from green roofs, prompting policies to phase out peat in horticulture and related applications. Thus, there is a demand for more sustainable organic materials that can partly or fully replace peat in green roof substrates without reducing plant performance.
Among potential organic components for sustainable green roof substrates, vermicompost has emerged as an attractive alternative to peat. Vermicompost differs substantially from peat in its high contents of plant-available nutrients (derived from mineralized organic matter), beneficial microbial communities (enriched by earthworm gut activity), and plant growth-promoting compounds, such as phytohormones (auxins, cytokinins, gibberellins) and enzymes produced during vermicomposting [
4,
5]. Experiments with the addition of green-waste compost to extensive green roofs have shown that 10% of the compost in commercial substrates (based on crushed brick) can improve the growth of
Allium schoenoprasum,
Limonium latifolium,
Melica ciliata, and
Nepeta × faassenii [
6]. In another study with the application (rate 0, 20, 40, 60, 80, and 100%) of commercial compost produced from municipal yard waste to a heat-expanded shale and sand base for an intensive green roof, the maximum performance and yield of peppers was revealed for 60 or 80% addition [
7]. At the same time, excessive vermicompost rates may increase nutrient leaching, indicating the need to optimize its proportion in green roof substrates. Although vermicompost and compost amendments have been shown to improve plant growth in green roofs, the optimal proportion and performance of vermicompost in substrate blends remains unclear, especially when the substrate must balance plant nutrition with nutrient leaching, water retention, and physical structure. Consequently, vermicompost-based and peat-based substrates represent contrasting substrate environments in which amendment effects may differ considerably.
Biochar has been tested as an amendment to green roof substrates [
8]. Due to its porous structure and high specific surface area, biochar can increase water-holding capacity, decrease bulk density, and reduce nitrogen and phosphorus leaching from substrates [
9] under intensive irrigation or rainfall. It was shown that the addition of green waste biochar to a Scoria-based substrate at 40 vol % increased the water-holding capacity, yielding a 16% increase in plant-available water at a 30% dosage, and a considerable reduction in bulk density [
10]. The addition of mixed conifer wood biochar (25 t ha
−1) to a commercial green roof substrate composed of porous aggregate, composted organic matter, and fine sand enhanced plant growth and reproduction, and water retention capacity [
11]. In contrast, the application of hardwood mixture biochar to a commercial substrate based on proprietary aggregate at 10 wt % did not have a considerable effect on water retention [
12], indicating that the effect of biochar amendments varies across experiments and depends on the type of biochar added and the initial substrate. In addition to reducing bulk density and retaining nutrients [
12], biochar can alter microbial communities and soil biochemical processes in green roof substrates [
13]. Experimental studies with sludge-derived biochar (application rates of 5–20% to natural soil used as green roof substrate) increased the fungal biomass by 300–600% and of eukaryotes by 200–380%. Biochar additions also increased soil microbial taxon richness and altered the microbial community structure [
13]. The general direction of changes observed after biochar addition to soil or substrate depends on the biochar type, substrate composition, and the plant species present [
14]. The study comparing traditional peat-based substrates with mixtures of peat, vermicompost, and biochar in various proportions showed that geranium and petunia can be cultivated on a peat-based substrate containing up to 12% of biochar and/or up to 30% vermicompost. Plants in these substrates showed a similar or enhanced physiological response to those grown in the control using commercial peat-based substrate [
15]. However, the effects of interactive contrasts between biochar types and vermicompost-peat gradients on the early establishment of plant communities, nutrient dynamics, and microbial activity in substrates remain underexplored, particularly at low addition rates and across realistic green roof substrate compositions.
Recent studies focused on green roof substrates have two important knowledge gaps. First, most studies test either peat-based or mineral-dominated substrates with single organic additions, while systematic comparisons of vermicompost-based vs. peat-based mixtures under green roof conditions remain scarce. Second, although biochar is increasingly studied as a green roof amendment, experiments typically use one biochar type and focus on water retention, runoff quality, or plant yield [
16], rather than simultaneously assessing plant and substrate traits. Only a few studies have considered biochars derived from different feedstocks in the context of green roofs [
17], and these have mostly addressed digestate or wood-derived biochar rather than straw- or bark-based materials. Thus, the central question of the study is how different biochar feedstocks interact with contrasting green roof substrate mixtures ranging from vermicompost-dominated to peat-dominated systems.
This study first aimed to compare the effects of four substrate base compositions relevant to extensive green roofs in a temperate climate, ranging from vermicompost-dominated to peat-dominated mixtures, on plant growth under controlled greenhouse conditions. Second, we aimed to evaluate two contrasting biochar feedstocks (straw- and pine-bark-derived biochar) added at the same rate to each substrate base, allowing direct assessment of feedstock-dependent effects on substrate chemical and biological properties, which in turn could affect plant community development. Compared with previous studies, we made the first systematic factorial comparison of two contrasting biochars (straw vs. pine bark) across a complete vermicompost-to-peat substrate gradient. Additionally, we simultaneously quantify effects on plant establishment (grass mixture), nutrient mobilization (NO3/PO4), and microbial function (microbial biomass, CO2 emissions, activities of C-cycle enzymes) under controlled conditions that mimic early green roof establishment.
The following hypotheses were tested: (i) Biochar effects on plant establishment depend on substrate composition, with peat- and vermicompost-based substrates differing in their biomass and carbon accumulation responses to biochar addition; (ii) straw-derived and pine-bark-derived biochar would have different impacts on nutrient availability, plant N uptake, and microbial activity due to their contrasting chemical composition and surface properties; (iii) Substrate composition is the primary driver of microbial biomass and activity, while biochar acts as a secondary modifier whose effects depend on the specific substrate–biochar combination.
2. Materials and Methods
2.1. Experimental Design
The experiment was conducted in 2025 at Tula State University. Twelve substrates were created for testing, and all components were taken by volume (
Table 1). The dominant organic compound in the substrate was either vermicompost or fen peat, and mixtures having either vermicompost + fen peat or fen peat + high-moor peat were prepared (
Table 1). These substrates were selected due to the commercial availability of components, low weight, and varying organic matter quality, with the C/N ratio increasing from vermicompost-based mixtures to fen- and high-moor peat-based mixtures (
Table A1). In addition, substrates differed in the composition of their mineral fractions, which likely influenced physical characteristics such as porosity, bulk density, and water retention and may have contributed to the observed biological responses. Therefore, the results that we present reflect integrated effects of full substrate formulations rather than the influence of organic matter composition alone. Biochar was added to enhance nutrient retention in the substrates. Four substrate mixtures were combined with three biochar treatments (control, straw biochar, pine bark biochar), yielding 12 treatment combinations, each replicated 4 times (n = 48 pots). Biochars were prepared from maize straw or pine bark (1–2 cm fraction) at 350 °C for 3 h. Raman spectra of biochar (Spectrometer EnSpectr M532, “Spektr-M LLC”, Chernogolovka, Russia) were acquired using a 532 nm excitation source with a laser current of 30 mA and a voltage of 4 V (≈50% laser power). The integration time was 10 s per acquisition, with 5 accumulations averaged for each spectrum. The detector gain was set to 1.3 with an offset of 2.542. Spectra were recorded over the range of approximately 120–3680 cm
−1. Cosmic ray removal and automatic baseline correction were applied during post-processing. No active cooling was used during measurements. Signal intensity was automatically adjusted, and background subtraction was enabled. The specific surface area of the biochar was determined using methylene blue [
18]. The final concentration of adsorbed methylene blue was measured spectrophotometrically (590 nm, Aquilon SF-103 spectrophotometer, “Aquilon”, Podolsk, Russia). Specific surface area of straw-derived biochar was 230 ± 10 m
2 g
−1, and for the pine bark-derived biochar was 218 ± 7 m
2 g
−1.
Each substrate was placed in 1 L pots (diameter was 11.5 cm and height were 9.6 cm) and moistened to 60% of its maximum water-holding capacity. Each pot was supplemented with 2 g of seed from a mixture of 15% perennial ryegrass (Lolium perenne), 15% annual ryegrass (Lolium multiflorum), 25% wheatgrass (Triticum aestivum), 20% festulopium (Festulolium hercynicum), 15% meadow fescue (Festuca pratensis), and 10% red fescue (Festuca rubra). The grass seed mixture represents realistic early-stage green roof vegetation development, in which multiple species establish simultaneously from seed rain. These species were chosen to create a functionally diverse grass cover, namely: perennial and annual ryegrass provide rapid germination and early biomass accumulation; wheatgrass contributes strong rooting and stress tolerance; festulolium combines rapid establishment with improved adaptability; meadow fescue offers moderate vigor and persistence; and red fescue provides tolerance to low fertility and drought with strong belowground allocation. Although the component grasses differ in germination and early growth dynamics, these differences were common to all treatments and therefore do not confound the treatment comparisons. The experiment was conducted in a greenhouse at 20 °C for 30 days with a 16 h light/8 h dark photoperiod. Supplemental lighting (high-pressure sodium lamps, ~400 µmol m−2 s−1 PAR) was provided for 16 h daily to ensure a minimum daily light integral of 12–16 mol m−2 d−1, typical for grass seedling growth under controlled conditions. Pots were arranged in a completely randomized design, and pots remained in fixed positions throughout the experiment. Watering was performed every 2 days using the balance method. After 30 days, destructive sampling was performed, and plant biomass was separated into belowground and aboveground biomass.
2.2. Analyses of Substrate and Plant Biomass Properties
The carbon (C) and nitrogen (N) contents of the organic components of the substrates and of plant biomass were measured using dry combustion (Vario Max CN analyzer, Elementar, Langenselbold, Germany). pH was measured in water (component:water ratio = 1:5) using a Hanna pH meter (Hanna Instruments, Vöhringen, Germany); the substrate’s water-holding capacity was measured by weight, separately for each substrate [
19]. The substrates were analyzed for ammonium nitrogen and nitrate content by spectroscopy [
20] (Spectrophotometer, Akvilon 103, Podolsk, Russia), available phosphate content (CAL extraction, following spectroscopic measurements at 880 nm [
21]) (Spectrophotometer, Akvilon 103, Podolsk, Russia). Microbial biomass was measured by the substrate-induced respiration method, and microbial respiration was measured by incubation for 5 days at 22 °C; the stable values were taken [
22]. The metabolic quotient (qCO
2) was calculated as the ratio of respiration to microbial biomass to indicate stress conditions for microorganisms. Activities of cellulase and catalase were measured using spectrophotometric methods [
23] (Spectrophotometer, Akvilon 103, Podolsk, Russia).
2.3. Statistical Analyses
Statistical analyses followed a structured approach: two-way ANOVA was used for hypothesis testing, planned contrasts were used to directly evaluate H1–H3, and PCA was applied as an exploratory tool to visualize overall patterns. All statistical analyses were performed using R software (version 4.3 R Core Team, 2024). The significance level was set at α = 0.05 for all tests.
A two-way Analysis of Variance (ANOVA) was conducted for each response variable to evaluate the main effects of substrate type (four levels: vermicompost, vermi + fen peat, fen peat, mixed peat) and biochar treatment (three levels: control, straw biochar, pine bark biochar), as well as their interaction (Substrate × Biochar). ANOVA assumptions were assessed by examining model residuals. Normality of ANOVA residuals was tested using the Shapiro–Wilk test, and homogeneity of variance was assessed using Levene’s test on residuals grouped by treatment combination. Box–Cox transformation was applied to the following response variables to meet the ANOVA assumptions: NH4 (λ = −0.3), PO4 (λ = 0.1), CO2 (λ = 1.4), NO3 (λ = 0), Cellulase activity (λ = −0.3). Welch’s ANOVA following Games-Howell Post hoc Test was applied to Roots C, qCO2, Catalase activity, and Shoots C because assumptions of the ANOVA model were still violated after transformation. For the variables where ANOVA assumptions were met after transformation and where no interaction (Substrate × Biochar) was revealed, the Tukey test was performed at p < 0.05. For the variables in which the interaction (Substrate × Biochar) was significant, interaction plots were generated to illustrate the significant interaction effects (p < 0.01). Intersecting lines indicate substrate-specific responses of biochars.
Following ANOVA, planned contrasts were used to test three a priori hypotheses without inflation of Type I error, as contrasts are orthogonal and hypothesis-driven. Contrasts were defined according to the experimental design, with 12 treatment combinations (4 substrates × 3 biochar treatments).
The following hypotheses were tested:
H1. Biochar effects on plant biomass and carbon accumulation are substrate-type dependent, with stronger effects in peat-based substrates compared to vermicompost-based substrates. This was tested using three contrasts: (i) biochar effect (Control vs. biochar treatments combined) within vermicompost-based substrates (vermicompost and vermi + fen peat), (ii) biochar effect within peat-based substrates (fen peat and mixed peat), and (iii) interaction contrast to test whether the biochar effect differed between substrate types. Variables tested: shoot biomass, root biomass, shoot-to-root ratio, and root C content.
H2. Straw and pine bark biochars differ in their effects on nutrient availability, plant nitrogen uptake, and microbial activity due to their contrasting chemical composition and surface properties. This was tested using three contrasts: (i) straw vs. pine bark biochar in vermicompost-based substrates, (ii) straw vs. pine bark biochar in peat-based substrates, and (iii) overall straw vs. pine bark effect averaged across substrate types. Variables tested: NH4, NO3, PO4, root N content, MBC, and CO2.
H3. Vermicompost-based substrates have higher microbial biomass, respiration, and enzymatic activities than peat-based substrates, and biochar additions modulate these differences depending on substrate type and biochar source. This was tested using three contrasts: (i) substrate type effect (vermicompost-based vs. peat-based) in control treatments only, (ii) substrate type effect in biochar-amended treatments only, and (iii) interaction contrast testing whether biochar modulates the substrate type effect. Variables tested: MBC, CO2, qCO2, catalase, and cellulase activities.
For each contrast, the contrast estimate, standard error, t-statistic, degrees of freedom, and p-value were calculated using the mean squared error (MSE) from the ANOVA model. Contrast analysis was performed on the same data (original or transformed (Box–Cox transformation)) used for ANOVA to ensure residuals met statistical assumptions. The transformed variables were: shoot-to-root ratio, NO3, PO4, catalase, and cellulase activities and CO2. Significant contrasts (p < 0.05) were interpreted in the context of the respective hypotheses.
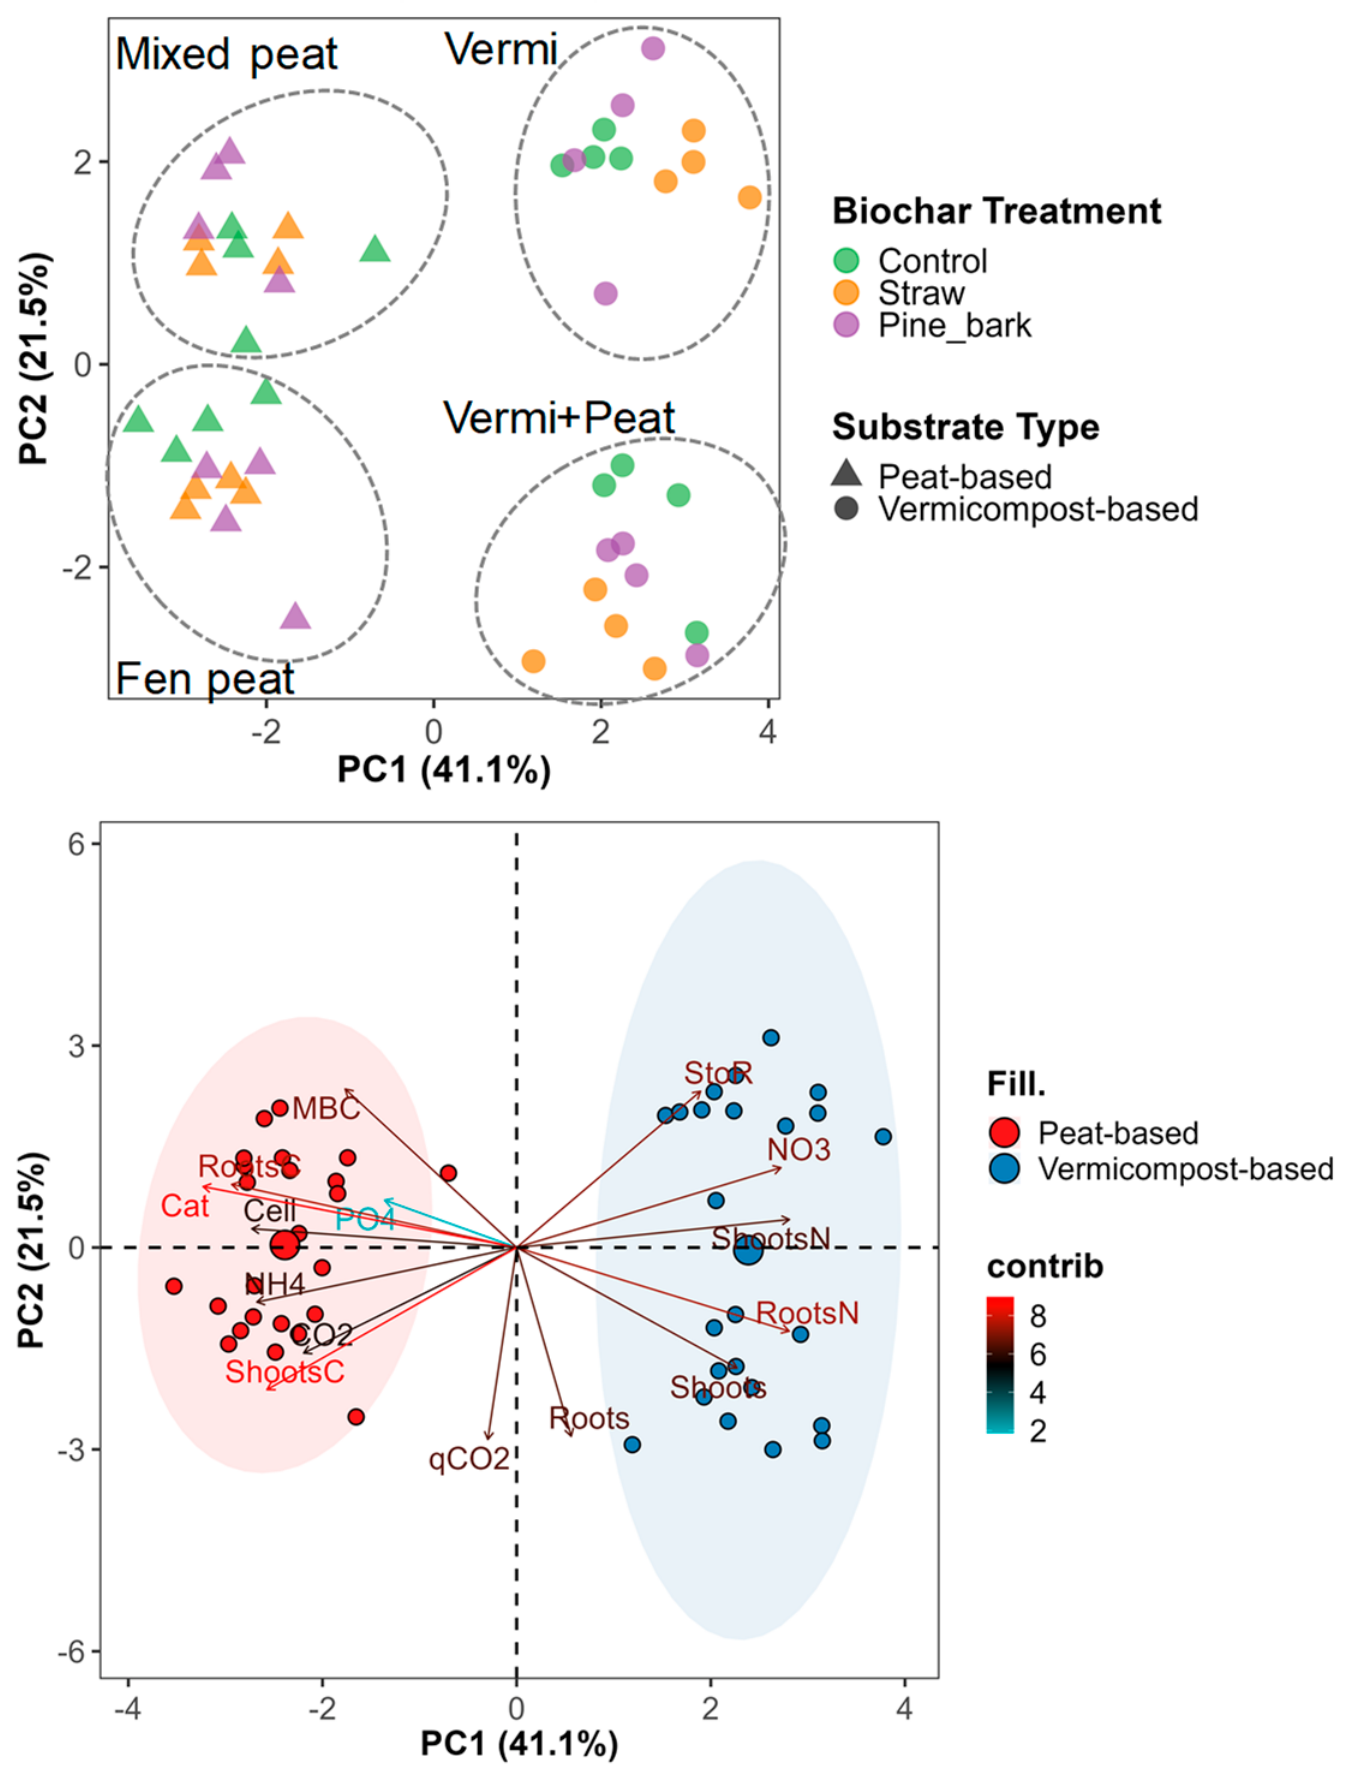
Principal Component Analysis (PCA) was performed on all 16 response variables to explore multivariate patterns, and determine whether substrates could be grouped by base type (vermicompost-based vs. peat-based) or biochar treatment, and identify which variables contributed most to the observed differences. Prior to PCA, all variables were standardized (z-score transformation: mean = 0 and standard deviation = 1) to account for different measurement scales and units. Data suitability for PCA was assessed using the Kaiser-Meyer-Olkin (KMO) measure of sampling adequacy (acceptable if KMO > 0.6) and Bartlett’s test of sphericity (significant if p < 0.05, indicating sufficient correlation among variables). PCA was conducted using the prcomp() function in R (stats package) on centered and scaled data. The number of principal components (PCs) to retain was determined using a scree plot and the Kaiser criterion (eigenvalues > 1), typically explaining ~60–80% of the cumulative variance. Here, PC1 + PC2 explained 63%. Variable loadings on PC1 and PC2 were examined to identify the main contributors to each axis. PCA results were visualized using biplots, with samples colored by substrate type and shaped by biochar treatment to visualize grouping patterns. Confidence ellipses (95% confidence level) were added to biplots to show within-group variation. Statistical differences between groups on principal component scores were tested using t-tests (for substrate type on PC1) and one-way ANOVA (for biochar treatment on PC2). PCA visualizations were created using the ggplot2 packages in R.
4. Discussion
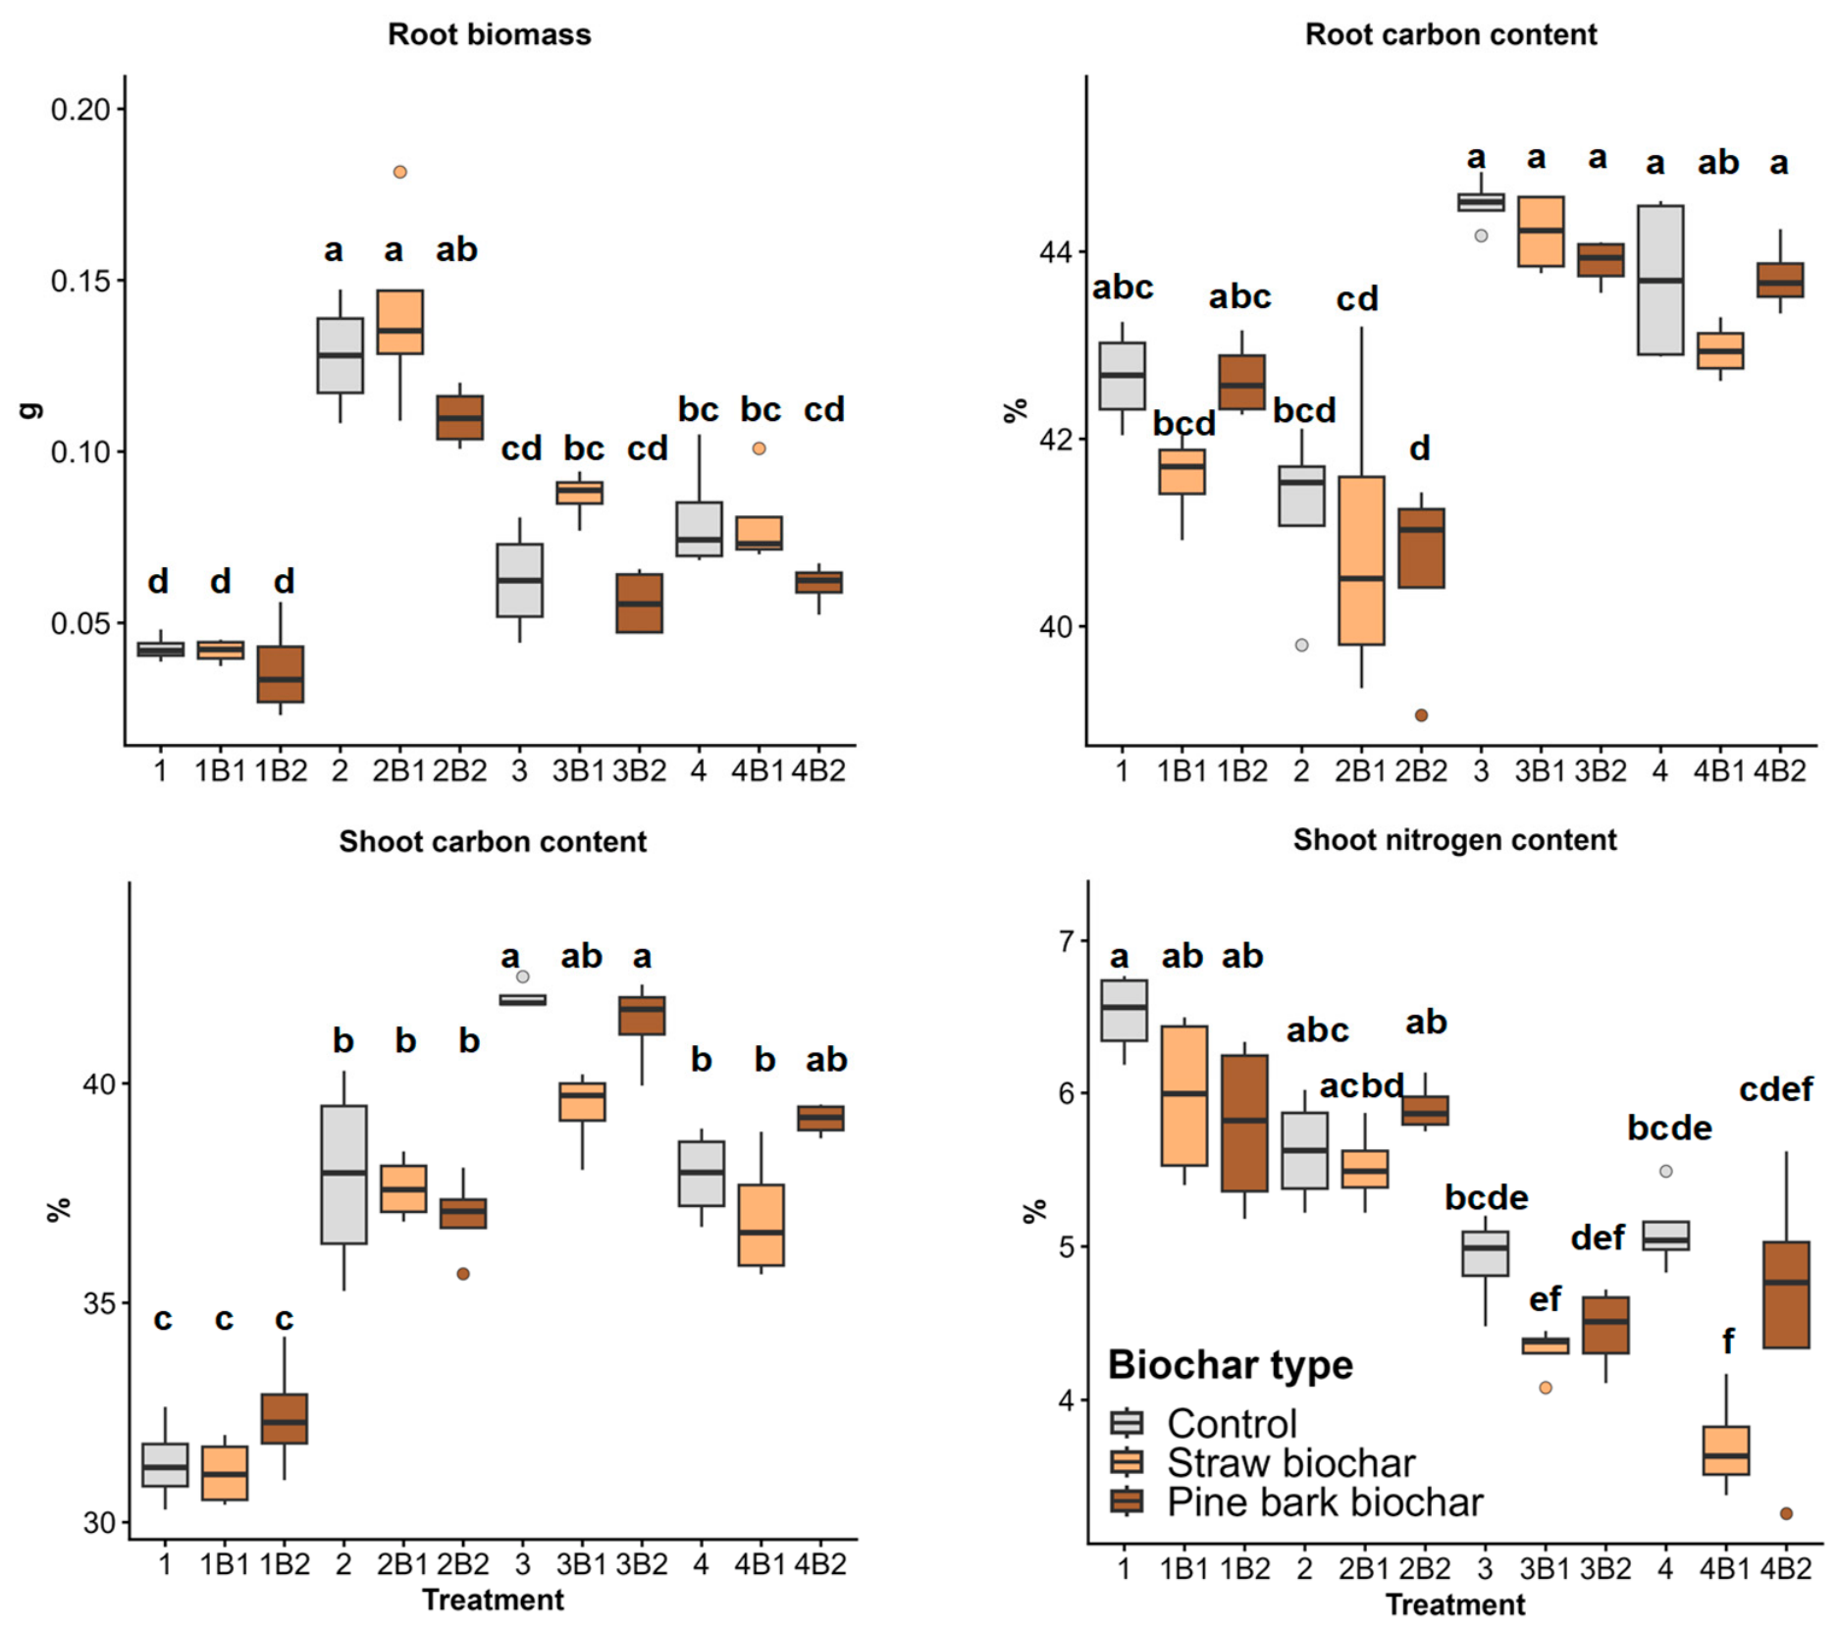
The present study demonstrated that substrate type was the primary driver of plant, nutrient, and microbial responses, while biochar effects were largely dependent on substrate composition. Vermicompost-based substrates provided greater root growth and N for plant growth (
Figure 1), which correlated with the PCA results. These observations could also be explained by increased mineralization of organic N in vermicompost, driven by active earthworms and enzymes [
24]. However, these responses should not be attributed solely to the dominant organic component. The substrates also differed in mineral composition and associated physicochemical properties, which may have influenced nutrient availability, aeration, and water retention. Therefore, the observed plant responses reflect the combined effects of complete substrate composition rather than isolated effects of vermicompost or peat alone. The greater N availability observed in vermicompost-containing substrates is consistent with previous studies reporting enhanced plant growth and nutrient uptake following the incorporation of compost or vermicompost into green roof substrates. Similar positive effects of compost-based amendments on plant establishment have been reported for both extensive and intensive green roof systems [
6,
7].
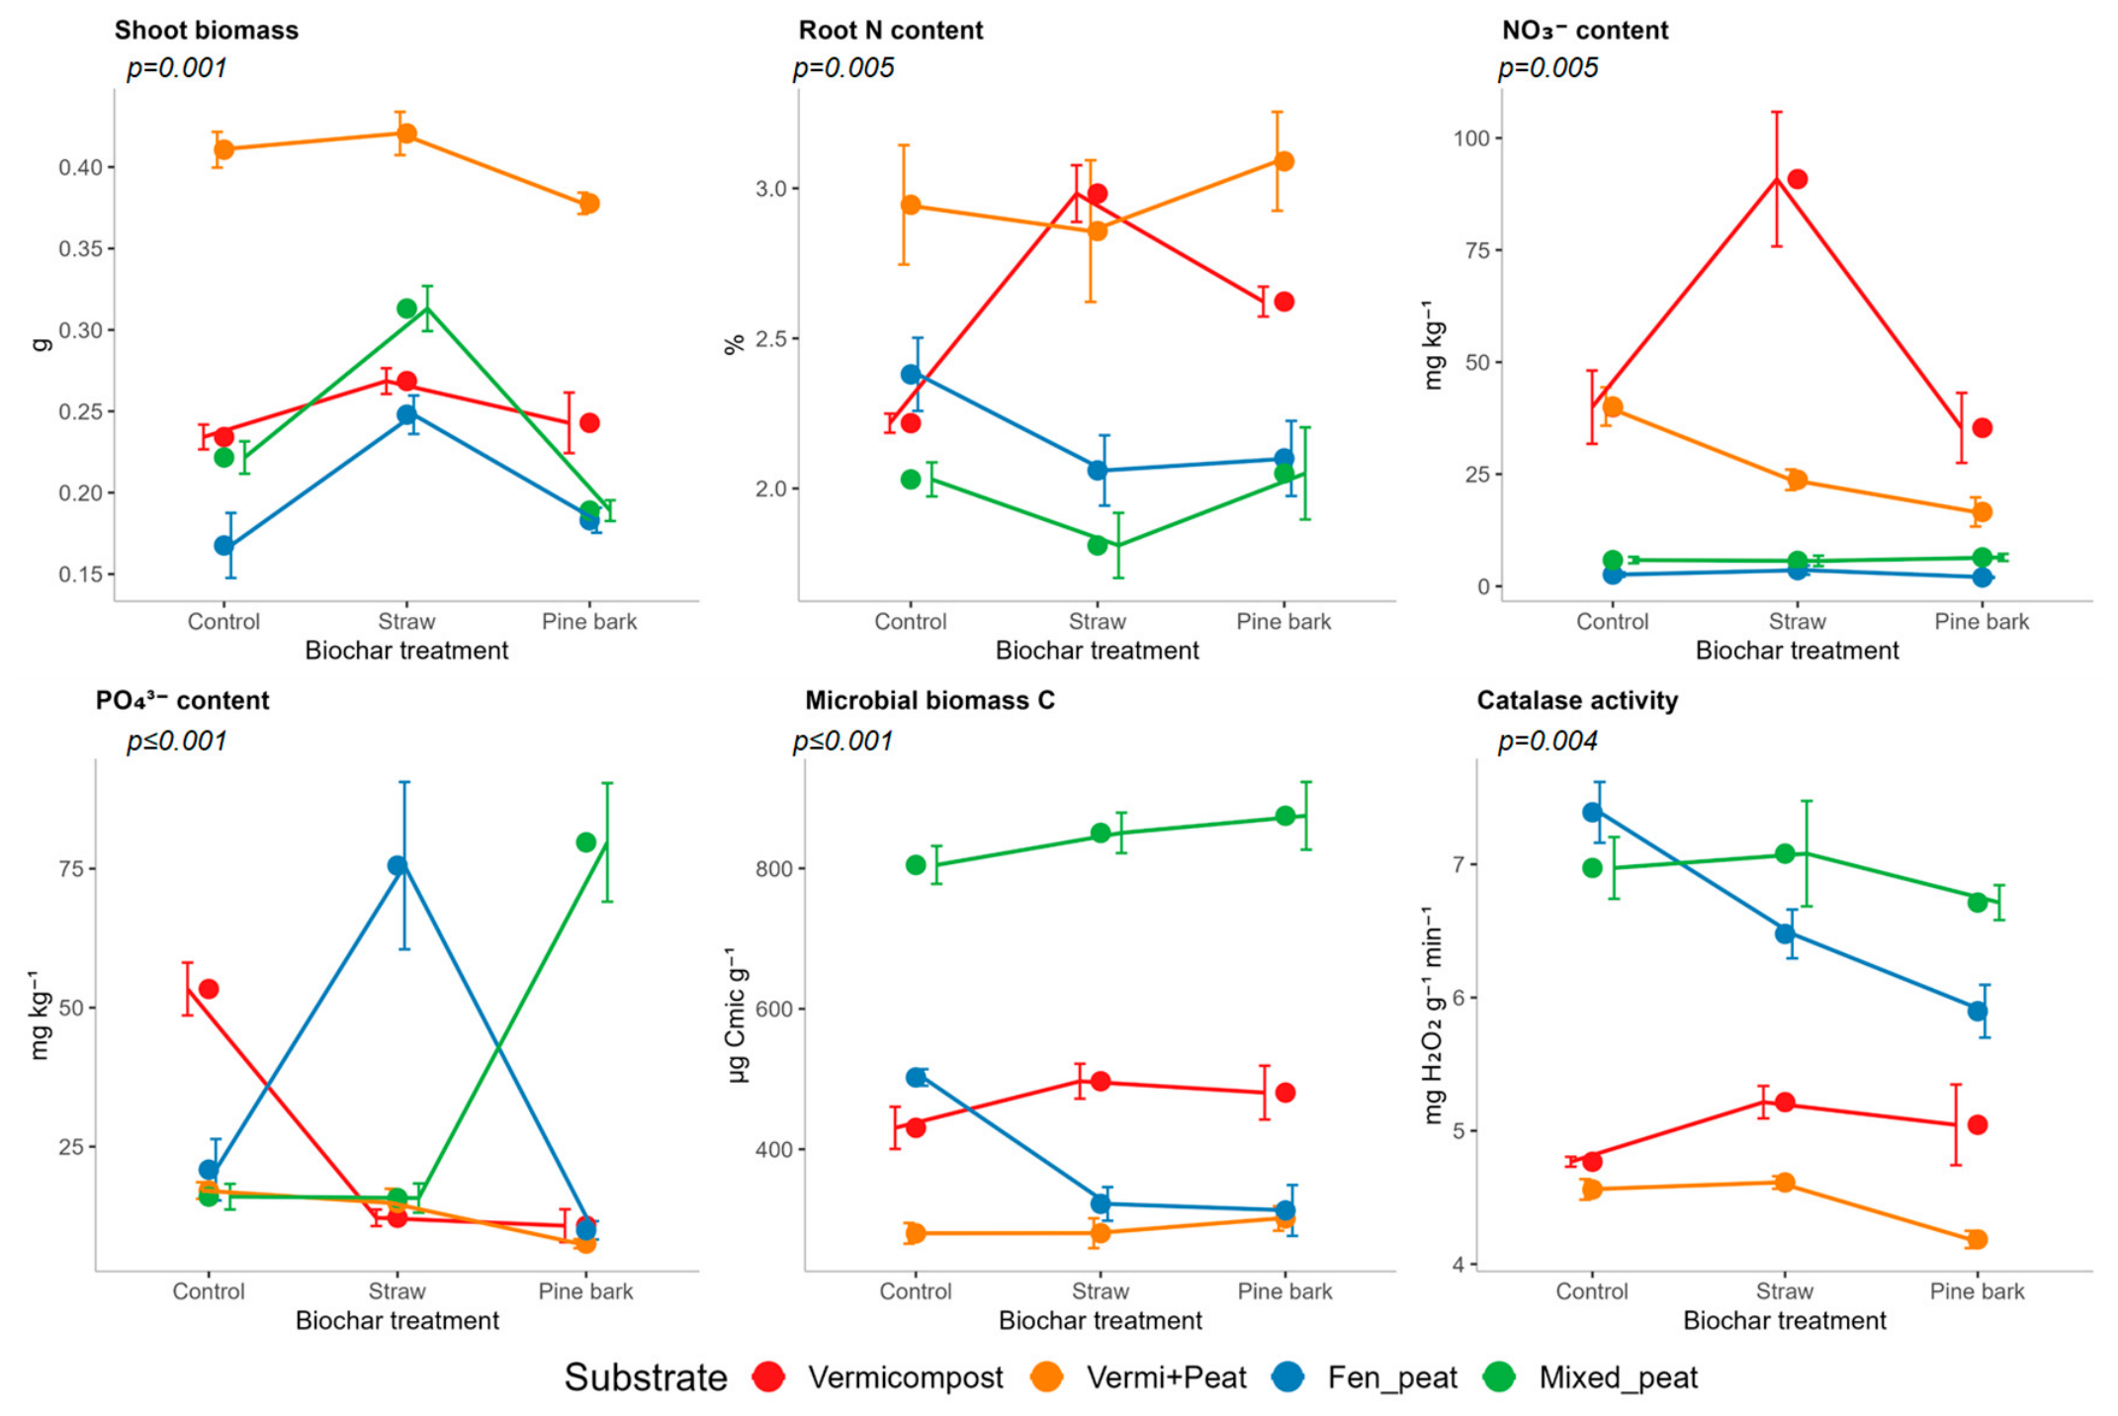
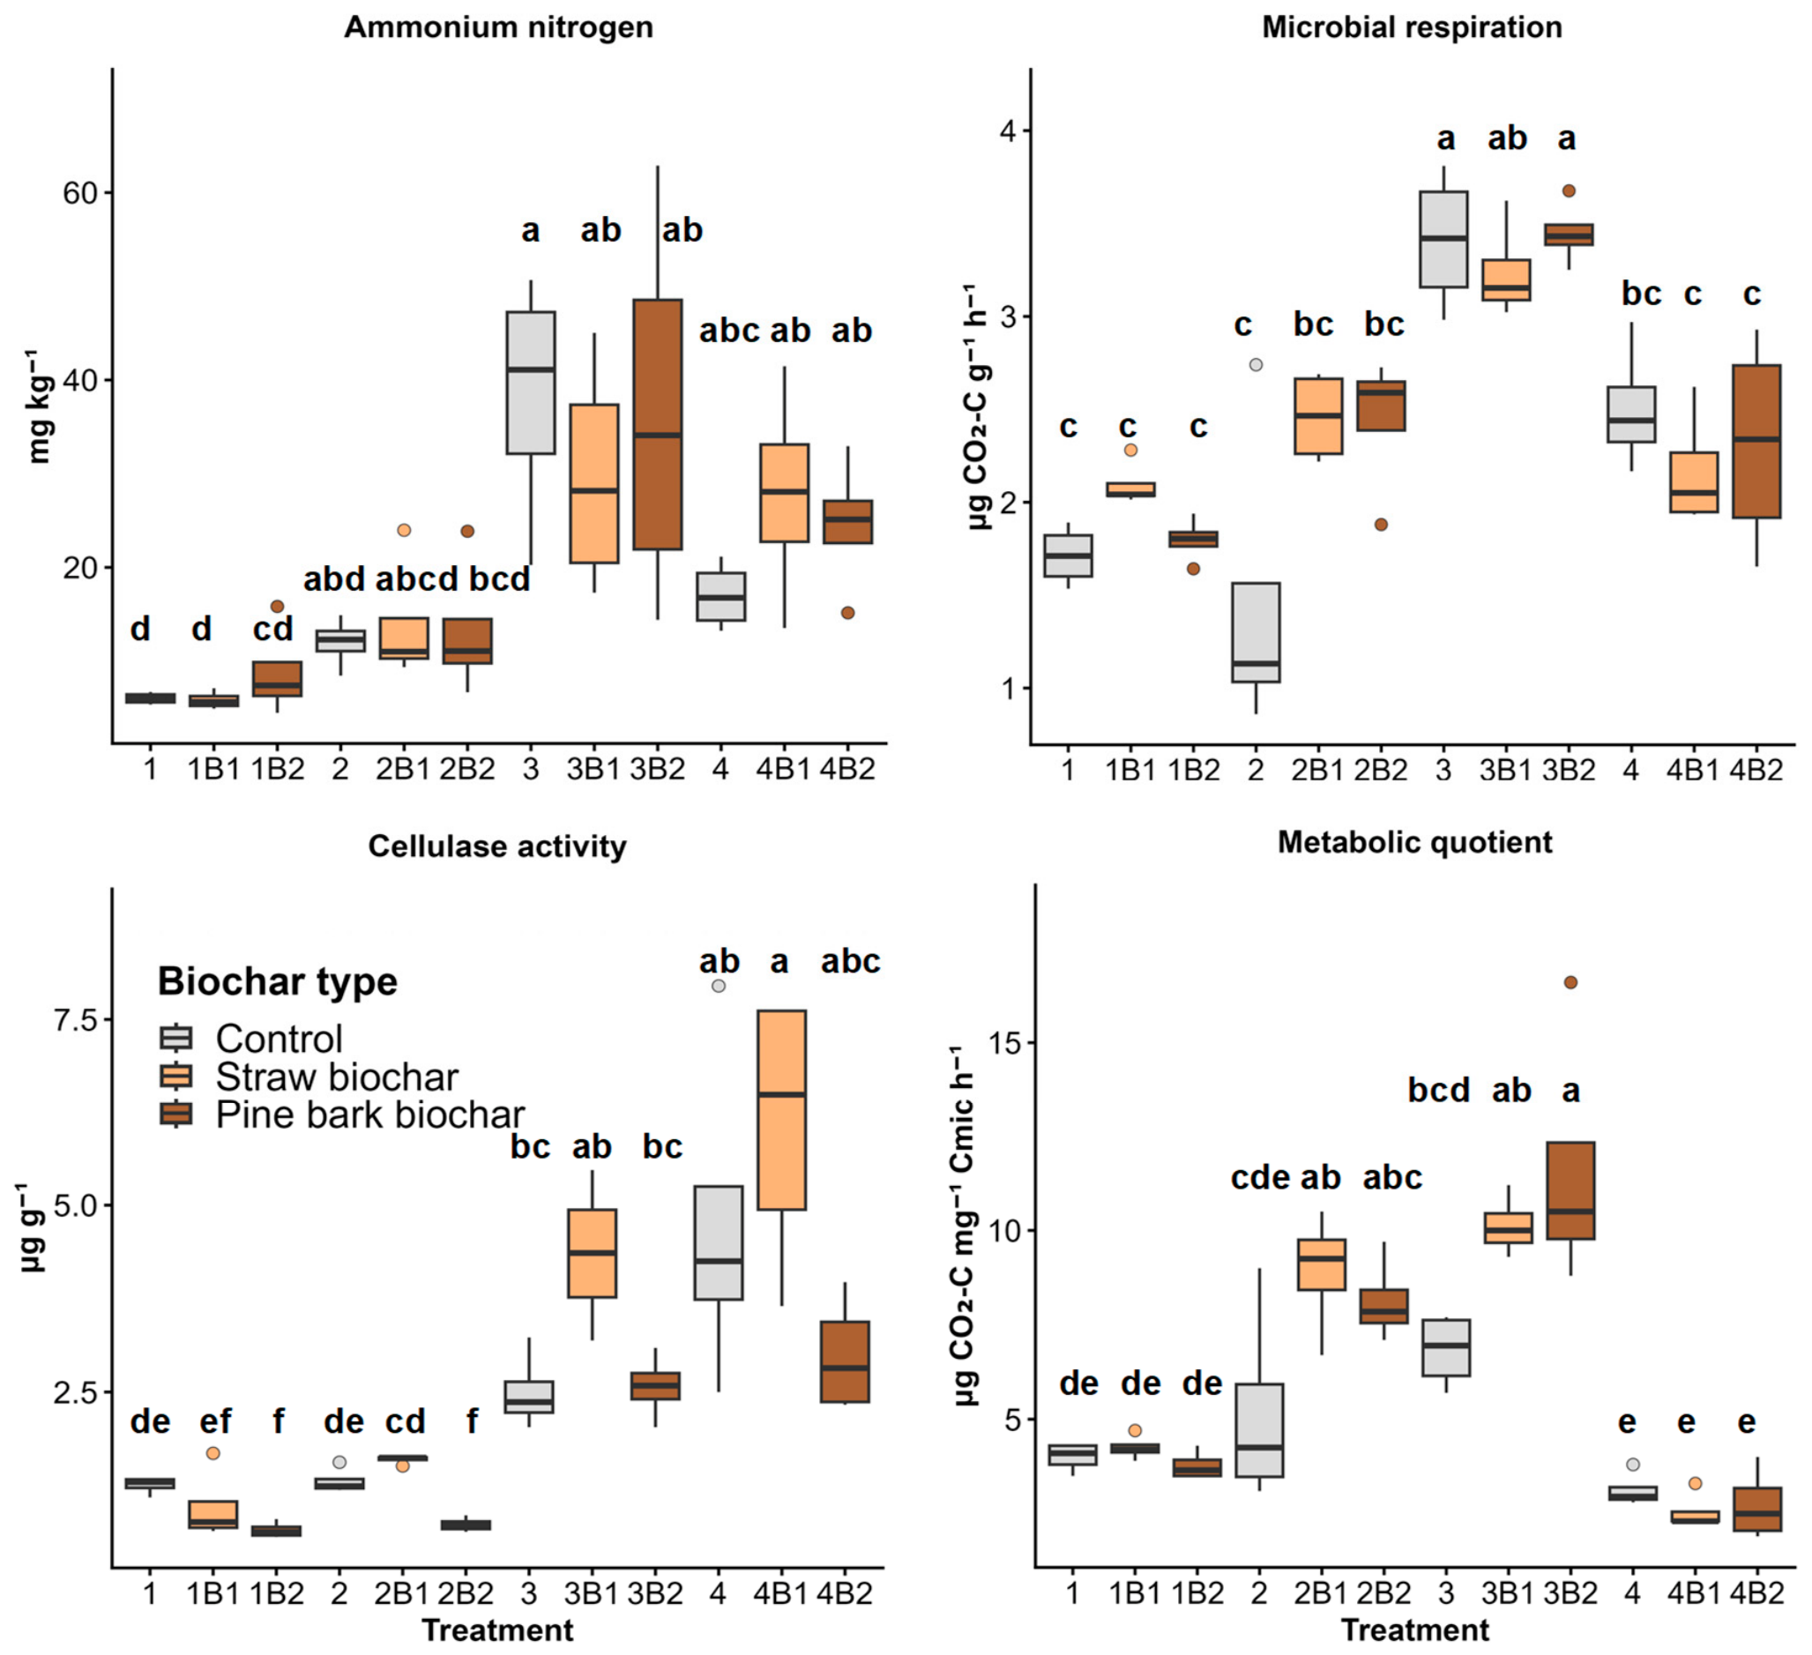
In contrast, the mixed peat substrate had the highest MBC and metabolic efficiency values (
Figure 2 and
Figure 3), which could reflect optimal moisture, aeration, and available C conditions for the microbial communities. The substrate-specific effect of pine bark biochar on PO
4 availability was particularly noticeable (
Figure 3): mixed peat showed a sharp release of PO
4 (3.75 times higher than control) probably due to organic acids desorbing Al/Fe-P at an optimal pH of ~6.5 [
8,
25]. In the vermicompost substrate, the PO
4 decreased, possibly due to the high adsorption capacity of biochar and possible precipitation of PO
4 with Ca/Mg or organic compounds. Fen peat + straw biochar also showed the highest available phosphate values, likely due to mobilization processes and or original PO
4 input with the biochar. This contrast suggested a possible dual role of biochar in our experiment: PO
4 mobilization from peat matrices vs. adsorption in organically rich environments. Similar substrate-specific effects were observed for NO
3 content: straw biochar increased NO
3 in vermicompost substrate. The same biochar, added to vermicompost + fen peat, caused metabolic stress, as indicated by qCO
2 values, and likely intensified competition for available N between plants and microorganisms. The PCA supported these patterns by showing a clear separation between vermicompost- and peat-based substrates, while the absence of distinct biochar clustering further emphasized the dominant role of substrate composition.
Plant responses were analyzed using planned contrasts (H1) to compare biochar effects within substrate types and to test differences between peat- and vermicompost-based substrates. Hypothesis H1b (on the effect of substrate and biochar on biomass/growth) was rejected, because the maximum of shoot biomass was reported for vermicompost + peat (with or without straw biochar addition), where the combination of high N (Roots N 3.1%) and improved aeration overcame the structural deficiency of pure vermicompost. H1c was confirmed, because the significant substrate-biochar interaction for shoot biomass demonstrated that the biochar effect (straw/pine bark) was stronger in peat substrates than in vermicompost, explaining 42% of the variability. Overall, H1 of planned contrasts was partially supported: biochar effects on plant biomass and carbon accumulation were clearly substrate-dependent, but the expected consistently stronger effects in peat-based substrates were not observed across all treatments.
Nutrient availability and plant uptake responses were analyzed using planned contrasts (H2) comparing straw and pine bark biochar across substrate types and their overall effects. The addition of straw biochar to vermicompost-based substrates increased NO
3 content compared to additions of bark biochar into peat substrates, which confirmed Hypothesis H2a. These results could be explained by the low adsorption of NH
4 on straw biochar, which increased organic nitrogen mineralization. Straw biochar had a greater overall effect on plant nutrition parameters, as supported by H2c: the maximum NO
3 content was observed in the vermicompost + straw biochar treatment. At the same time, the maximum PO
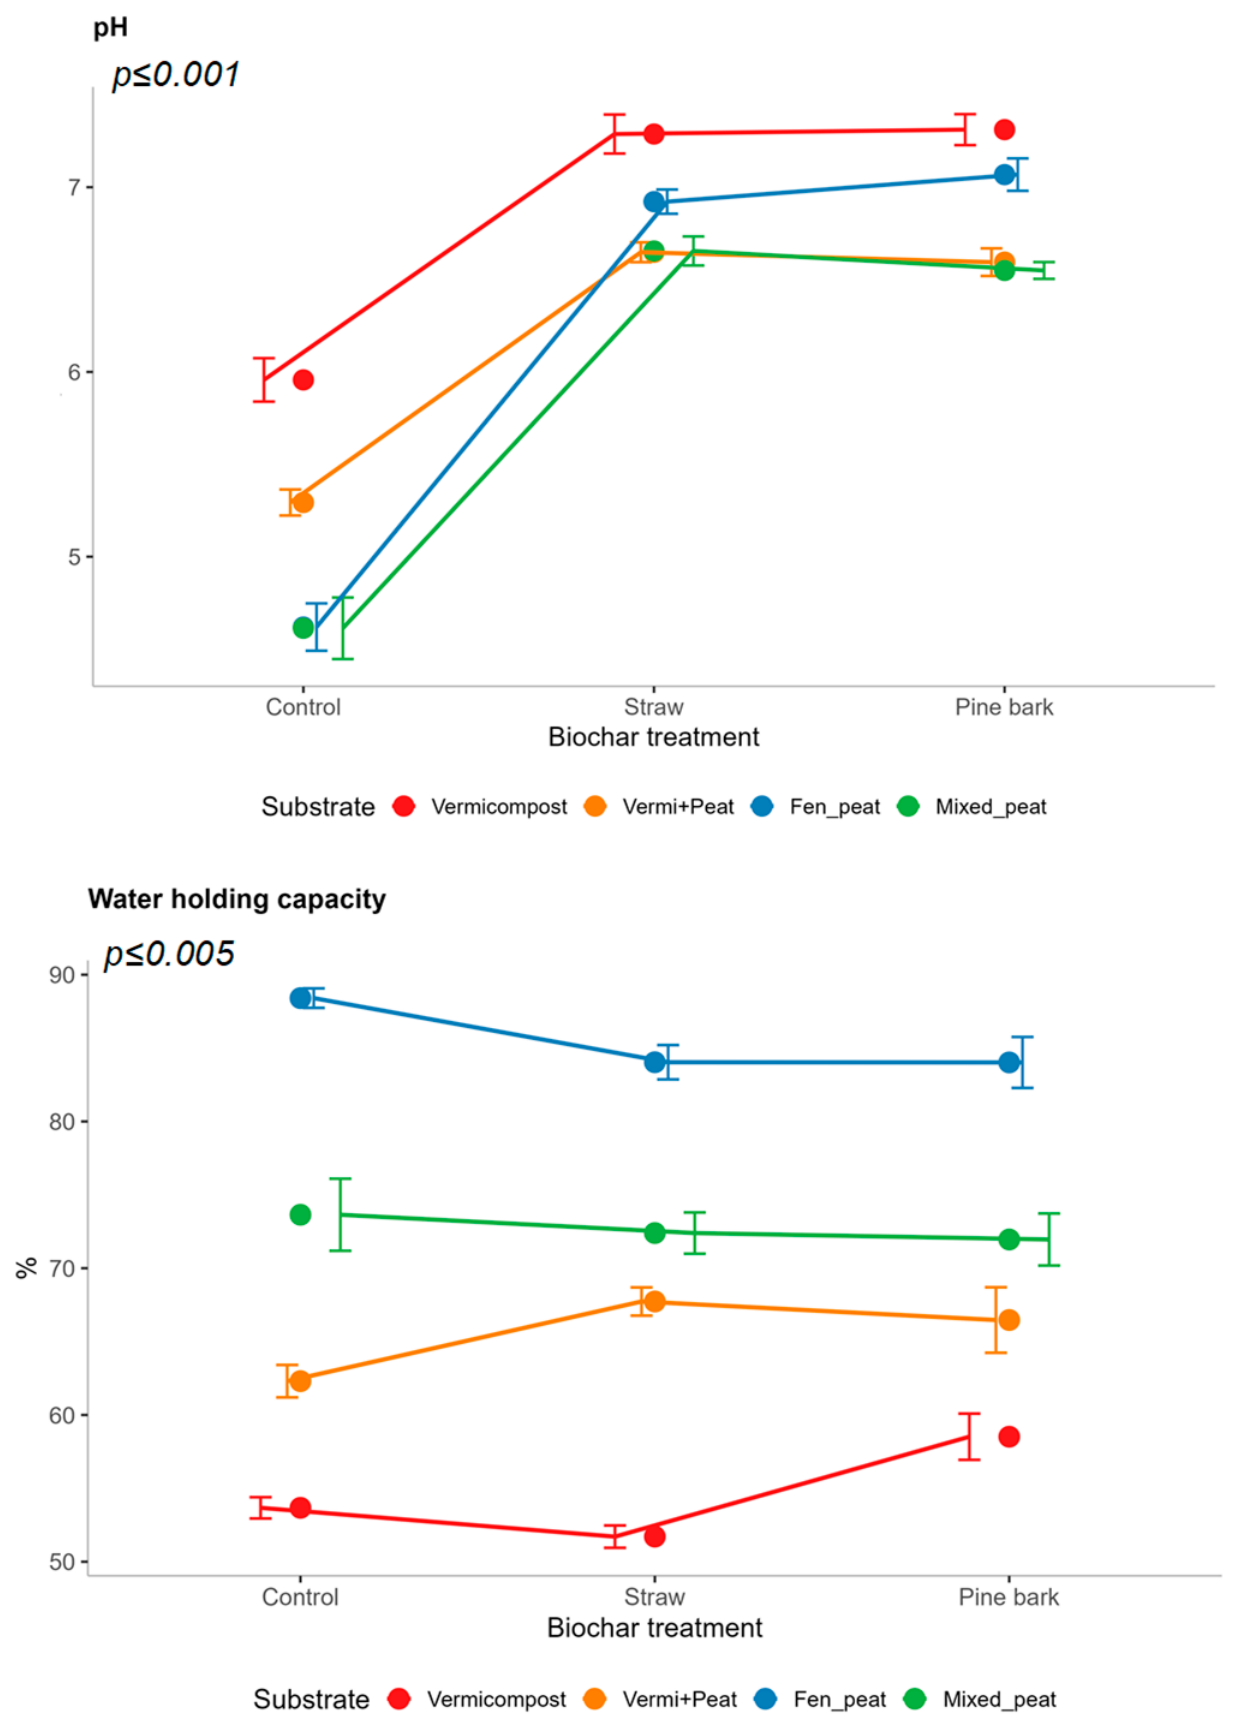
4 was found in mixed peat + pine bark biochar, which a pH shift upon biochar addition can explain. Straw biochar in vermicompost substrates increased pH from 5.5–6 (control) to 6.5–7.5, which is the optimal range for nitrogen mineralization processes. Pine bark biochar added to mixed substrates increased the pH to 6.5, which is more favorable for P cycling [
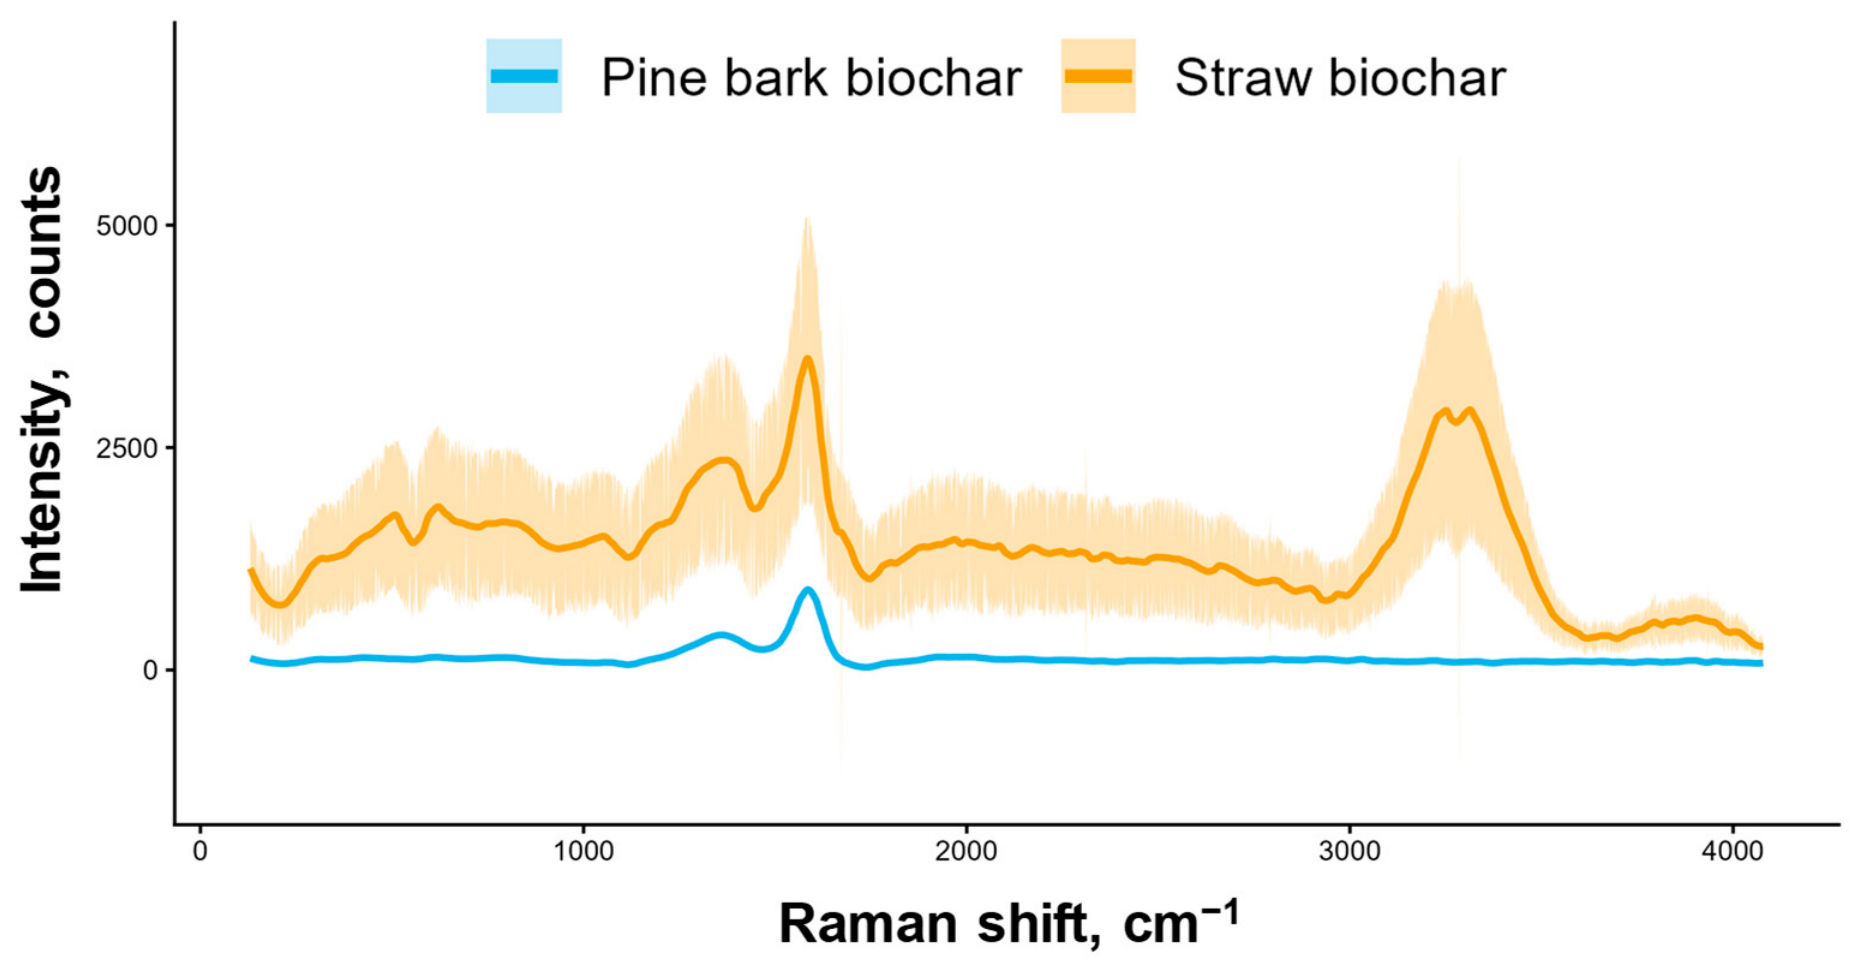
26]. Its structure can explain these differences in the effect of biochar type: the Raman spectra of both biochars had characteristic D (~1350 cm
−1) and G (~1580 cm
−1) bands (
Figure A2). A higher I
D/I
G ratio for the straw biochar (I
D/I
G ≈ 1.0–1.3) indicated an elevated degree of structural defects and the presence of oxygen-containing functional groups, which could enhance its sorption properties. However, this structure is more reactive and may have short-term toxic effects on microorganisms. In contrast, the pine bark biochar, with its lower I
D/I
G ratio (I
D/I
G ≈ 0.7–0.9), is characterized by a more ordered, graphite-like structure and fewer defects and functional groups, resulting in lower sorption activity but higher chemical stability and lower toxicity (
Figure A2). Thus, H2 from planned contrasts was supported, as straw- and pine-bark-derived biochars showed distinct effects on nutrient availability and plant nutrient uptake across substrate types.
Microbial responses were analyzed using three planned contrasts defined in Hypothesis 3 (H3): (i) substrate type differences under control conditions, (ii) substrate type differences under biochar-amended conditions, and (iii) the interaction contrast testing whether biochar modifies substrate effects on microbial functioning. Results are presented according to these three contrasts. Cascading effects of substrate properties on microbial community functioning were revealed. MBC content in peat-based control substrates was higher than those in vermicompost-based substrates (H3a), due to the presence of readily available organic matter in peat, which was also reflected in CO
2 emission values. Peat-based substrates with the addition of biochar showed higher MBC values than vermicompost-based substrates, when comparing pure substrates only (vermicompost vs. peat) and mixed substrates. Therefore, hypothesis H3b was not supported. These results are explained by a greater shift in the initial pH (
Figure A1) of peat-based substrates and a higher content of available organic matter, which could stimulate microbial communities [
27].
Interaction contrast showed that the effects of biochar depended on substrate type. CO
2 emission after the addition of biochar to peat substrates was suppressed. In contrast, it was stimulated for the vermicompost-based substrates, which could be attributed to the labile portion of C added with the biochar, thereby priming the decomposition of the original more available vermicompost substrates [
28]. Cellulase activity was also higher in peat-based substrates added with straw biochar than in vermicompost substrates, reflecting accelerated substrate decomposition in the presence of more complex biochar or possible stimulation of microbial communities by metabolites contained in the biochar [
29]. Previously, it was shown that straw biochar can increase fungal abundance, induce the production of ligninase and N-cycling enzymes [
30], and, based on our results, probably also cellulase activity. In contrast, the suppression of cellulase activity was observed upon the addition of pine bark biochar, which is linked to compositional differences in biochar, such as aromaticity and C/N ratio [
31]. An increase in qCO
2 suggested the development of stress conditions for the communities or altered microbial metabolic strategies. Similar qCO
2 patterns have been interpreted in the literature as shifts between more conservative (K-like) and fast-growing (r-like) microbial strategies [
32].
Biochar had a stronger effect on microorganisms in peat substrates (H3c). qCO
2 in fen peat + pine bark biochar was higher compared to the control, whereas this indicator was 2.5 times lower in the vermicompost + straw treatment. These effects could be explained by the presence of toxic phenols/PAHs, especially in bark biochar, which could block microbial respiration in O
2-limited peat pores, although these compounds were not directly measured in this study. In vermicompost substrates, the presence of high organic matter with a narrow C:N ratio (i.e., high N content) may have mitigated the stress caused by biochar addition, since microorganisms can more readily utilize it. Pine bark biochar also reduced catalase activity in all substrates, most strongly in peat-based substrates. These results might be related to (1) phenolic compounds from lignin, which inhibit the Fe-center of the enzyme; (2) a sharp pH increase in acidic peat upon biochar addition (
Figure A1); and (3) anaerobic microzones in biochar pores, which can also inhibit enzyme activity. Overall, H3 was partially supported: substrate type consistently influenced microbial biomass and activity, whereas the effects of biochar depended on substrate context and varied across microbial indicators.
These results provide initial evidence of substrate–biochar matching in green roof construction. Short-term testing suggests vermicompost supplemented with straw biochar may suit plant species requiring high N and root growth, delivering elevated NO3 content and root N accumulation alongside stable microbial communities. Similarly, mixed peat with pine bark biochar at a pH of 6.5–7.1 appears promising for P-demanding species, supporting PO4 release, microbial growth, and low qCO2 indicative of metabolic efficiency, though PO4 leaching risk exists in humid climates. However, fen peat + straw biochar warrants caution due to elevated CO2 emissions, high qCO2, which signals microbial stress, and reduced plant biomass observed here. These patterns from 30-day greenhouse testing require long-term field validation, including assessments of nutrient leaching, substrate stability, and green roof environmental exposure, to confirm practical suitability.