Article

Characterization of Soil Organic Matter in Agricultural Soils Under Various Tillage Practices Using Fluorescence Spectroscopy


by
Angélica Vázquez-Ortega
1,*,
Matthew Franks
2 and
Katarina Kieffer
1
1
School of Earth, Environment and Society, Bowling Green State University, 190 Overman Hall, Bowling Green, OH 43403, USA
2
Ohio Natural Resources Conservation Service, 200 N High St Rm 522, Columbus, OH 43215, USA
*
Author to whom correspondence should be addressed.
Soil Syst. 2026, 10(5), 56; https://doi.org/10.3390/soilsystems10050056
Submission received: 7 January 2026 / Revised: 24 April 2026 / Accepted: 27 April 2026 / Published: 7 May 2026

Abstract

Conventional tillage, a soil preparation practice used to produce a fine seedbed, can disturb the soil profile by promoting soil compaction and soil organic matter (SOM) degradation. In contrast, conservation tillage, such as no-till, has the potential to sustain or increase SOM. This study aimed to (1) quantify soil organic carbon (SOC) content under conservation tillage and conventional tillage practices, (2) describe the degree of aromaticity of bioavailable SOC using fluorescence spectroscopy, and (3) correlate SOC quantity with nitrogen and phosphorus retention in soils. Fluorescence spectroscopy is a sensitive and non-destructive tool that allows for the assessment of bioavailable SOC quality related to the molecular structure, degree of aromaticity (cyclic molecules with carbon double bonds), and recalcitrance (difficulty of decomposition) of organic compounds. This study employed fluorescence excitation–emission matrices combined with parallel factor analysis (EEM-PARAFAC) to identify humic-like, fulvic-like, and protein-like substances. Data on agricultural management practices were collected from spring 2014 until fall 2017. We obtained soil samples (fall 2017) from farms in the Western Lake Erie Basin, Ohio, and performed geochemical characterization in the bulk soil and aqueous extraction. Our results showed that no-till and minimal tillage fields consistently had greater SOC and fluorescence intensity in the humic-like acids region when compared to conventional tilled fields (no-till: 34,000 mg TOC kg−1; tilled six times: 16,000 mg TOC kg−1). No-till enhanced SOC stabilization. In addition, conservation tillage practices retained the largest total nitrogen (no-till: 2800 mg TN kg−1; tilled six times: 1350 mg TN kg−1) and total phosphorus (no-till: 470 mg TP kg−1; tilled six times: 250 mg TP kg−1) concentrations at all studied depths (0–30 cm) when compared to conventional tilled fields. Conservation tillage promotes the accumulation of highly aromatic organic compounds favoring high cation exchange capacity, and NO3 and PO43− retention and plant bioavailability.

1. Introduction

Climate change driven by anthropogenic carbon emissions is a pressing issue, with global land use changes contributing significantly: during 2007–2016 1.3 ± 0.7 Gt C was released annually into the atmosphere from land-use change, primarily due to agricultural activities and deforestation [1,2]. The implementation of agricultural best management practices (BMPs) such as conservation tillage, cover crops, nutrient management, and crop rotation has the potential to offset annual global carbon emissions by 0.4 to 1.2 Gt C (5–15%) [3]. Field studies have suggested that emissions from corn, soybean, and winter wheat production using conventional tillage operations may be 20% greater compared to no-till or minimal tillage [4]. The addition of cover crops may further sequester 0.12 ± 0.03 Pg C y−1 [5]. In addition to sequestering carbon, a primary soil health benefit of reduced till systems and cover crops is the buildup of C-rich soil organic matter (SOM) [6].
SOM includes living organisms and decaying plant and animal residues, some of which remain unchanged and serve as a direct source of energy and nutrients and others of which are transformed through microbial decomposition into stable molecules. These transformed, stabilized products are conventionally called humus and further divided into fulvic and humic substances based on the conventional alkaline extraction method [7,8]. This method led to the theory that organic matter forms a condensed polymer structure as organic compounds are degraded and decomposed by abiotic and biotic processes [9]. However, research has demonstrated that humic substances (HS) are not arranged as a large and complex polymer: based on characterization obtained from state-of-the-art analytical instrumentation, the molecular structure of SOM could be redefined as an association of organic molecules linked together via non-covalent or near-covalent bonds, including hydrogen bonds, cation bridging, and electrostatic interactions [10,11].
SOM plays a crucial role in soil’s productivity and biological, chemical, and physical health [12,13,14]. SOM increases the stability and strength of soil aggregates, reduces soil compaction, and increases water infiltration [15]. SOM provides nutrients for growing crops [3], as well as retains toxic metals and organic pollutants due to functional groups such as carboxyl (COOH) and hydroxyl (OH) that, under most soil pH conditions, promote adsorptions [16,17,18]. Additionally, these active sites increase soil cation exchange capacity (CEC) and the soil’s capacity to supply essential nutrients over time to plants. Soil macroinvertebrates, fungi, and bacterial communities benefit from highly stable SOM in agricultural soils, as this provides a steady source of food and energy, supporting their metabolic pathways [19,20].
The quantity and composition of SOM in soils is affected by agricultural management practices [21,22]. Thus, identifying BMPs, such as no-till, that promote SOM stabilization is important for enhancing soil resilience and facilitating nutrient and water bioavailability to crops [3]. Long-term impacts of no-till management (40+ years) on soil properties in Northeast Ohio resulted in higher SOC and water-stable aggregation, lower soil bulk density, and greater available water capacity content when compared to plowing tillage under corn-soybean rotation [23]. Additionally, continuous no-till systems with a corn–soybean rotation were found to produce higher yields per hectare in contrast to chisel plus disk tillage, with yield differences attributed to better water supply in no-till fields due to more mesopores and thus better hydraulic conductivity [24].
The quality of SOM (its composition and chemical structure) is also affected by management practices. Spectroscopic methods, including gas chromatography–mass spectrometry (GC-MS), Raman, nuclear magnetic resonance (NMR), and Fourier-transform infrared (FTIR) are commonly used to characterize SOM structure [25,26,27,28]. Using FTIR, Laudicina et al. [27] found that conventional tillage decreases SOM hydrophobicity (aromaticity) when compared to conservation tillage, attributing this to more SOM mineralization under conventional tillage. SOM composition can also be altered through the application of organic soil amendments (e.g., cattle manure, cow slurries, and crop residues) [29], and spectroscopic analyses (FTIR, Raman, and NMR) have revealed that cattle manure amendments contain aliphatic and aromatic moieties that are more resistant to biodegradation over long application periods (22 years).
Faster, non-destructive spectroscopic techniques such as ultraviolet–visible (UV-vis) and fluorescence spectroscopies can also be used to measure the aromaticity of SOM [18,28,30,31,32]. These techniques are rapid, require minimal sample preparation, and produce information pertaining to SOM structure and degree of humification [33]. Fluorescence spectroscopy allows for the creation of excitation–emission matrices (EEMs), which categorize the composition of DOM into five distinct regions based on peak intensity: simple aromatic proteins such as tyrosine (Regions I and II), fulvic-like acids (Region III), soluble microbial byproduct-like material (Region IV), and humic-like acids (Region V): [34]. Parallel factor analysis (PARAFAC) can be used to model SOM components for a set of EEMs, allowing for comparison of component scores—representing relative loadings or concentrations of SOM components—within a dataset [35,36].
Understanding how agricultural practices, such as conventional and conservation tillage [37] influence the quantity and quality of SOM, and how SOM influences nutrient retention, which ultimately improves crop yields and minimizes nutrient loss into waterways, is essential for improving production efficiency and reducing agricultural impact on the environment. A few studies have used EEM-PARAFAC as a novel technique to characterize bioavailable SOM in agroecosystems; however, the application of this technique has been limited in Northwest Ohio [38]. Therefore, this study aimed to (1) quantify soil organic carbon (SOC) under various tillage management practices, (2) describe the degree of aromaticity and recalcitrance of bioavailable SOC using fluorescence spectroscopy, and (3) correlate SOC quantity with nitrogen and phosphorus retention in soils. Employing rapid, simple procedures such as fluorescence spectroscopy to characterize SOM quality in farm soils can provide useful information to farmers about the effectiveness of agricultural management practices on soil health and further implications for crop yields.

2. Materials and Methods

2.1. Study Fields

Data from eight farm fields located in the Western Lake Erie Basin (WLEB) were identified and secured for this study. The fields were part of the United States Department of Agricultural Research Service (USDA-ARS) edge-of-field network and designed to quantify the effects of agricultural production and best management practices on soil and water quality managed by the Columbus, OH division [39]. Fields 1, 2, and 8 are in shallow soils derived from wave-planed ground moraine and lake deposits overlaying Silurian aged, carbonated bedrock [40]. Their dominant soil series is Hoytville, and these soils tend to be poorly drained (Table S1, Supplementary Material A) [41]. These fields are located within the Maumee River watershed. Fields 3 and 4 are in shallow soils, composed mainly of lake deposits overlaying Mississippian aged sandstone, shale, and siltstone bedrock [40]. Their dominant soil series is Haskins, and these soils tend to also be poorly drained (Table S1, Supplementary Material A). These fields are located within the Sandusky River watershed. Fields 5 and 6 are also located in the Sandusky River watershed, and their dominant soil series is Luray. Field 7 is located within the Maumee River watershed and its dominant soil series is Mermill. The soil taxonomic classifications for all fields are included in Table S1 (Supplementary Material A).
Corn, soybean, and wheat were rotated in all fields using various degrees of tillage practices, including no-till, conservation tillage (30% soil surface with crop residue), and conventional tillage (Table 1). Table 1 summarizes farm fields management practices over a period of four years (2014–2017), including times tilled, fertilization, and pesticide application. Information regarding crop rotations and crop yields is also included. An Excel file including detailed information on the dates that fields were tilled, planted, harvested, rates for seeds per ha, yield per ha, pesticide application, and fertilizer application is accessible in Supplementary Material B; data was provided by the farmers based on their records. The Excel files also include field size (in hectares), tilling method, and types of fertilizer and pesticides. In summary, Fields 1 and 2 were not tilled, and the main fertilizer was urea-ammonium nitrate. Fields 3 and 4 were tilled using a disc plough, a disc harrow, vertical tillage, and a phoenix harrow. Variable nitrogen, phosphorus, potassium ratios (N:P:K ratios) were applied via broadcast and 2 × 2 placement in Field 3 and 4. The 2 × 2 placement refers to starter fertilizer applied 5 cm below and 5 cm to the side of the planted seed. Fields 5 and 6 were tilled using disc ripper and field cultivator methods. Fertilizers, including urea, monoammonium phosphate (MAP), ammonium sulfate (AMS), and variable N:P:K ratios, were broadcast. Finally, Fields 7 and 8 were tilled using a disc harrow, a disc chisel, vertical tillage, and field cultivator methods. After plowing, Fields 7 and 8 were left with 30% residue coverage on the soil. This is a common agricultural conservation practice. Fertilization doses over 2014–2017 are included in Supplementary Material B. Urea-ammonium nitrate, potash, and several N:P:K ratios were applied to these fields. A PDF file is provided in Supplementary Material C that describes the tillage methods used in these farm fields. It is important to emphasize that, as these fields were being actively farmed and not structured as a controlled experiment, the tillage treatments are pseudo-replicates due to environmental, management, and/or spatial conditions varying between fields.

2.2. Sample Collection and Preparation

Soil cores were collected in the fall of 2017 at approximately one location for every two hectares. Information on field size and number of collected soil cores is included in Supplementary Material B. At each sampling location five, one-meter-deep cores (or depth of resistance) were collected. The sampling locations per field varied from 5 to 8. The collected soil cores were stored at 4 °C until processing and analysis. Processing involved a 3-step procedure. First, the cores were divided into 0–5 cm, 5–15 cm, and 15–30 cm depths. Second, the five soil cores, which represented one location in a field, were composited by depth. Therefore, each sample is the composite of 5 soil cores of the corresponding depth. Samples were oven-dried at 70 °C in paper bags, sieved through a 2 mm mesh, pulverized using a Wiley Hammer Mill, Thomas Scientific, Swedesboro, NJ, USA, and stored in Whirl-Pak bags, Whirl-Pak, Pleasant Prairie, WI, USA. The composited samples included in this study were once again combined, resulting in one sample per field per depth (three samples per field, or 24 total samples for the 8 fields). However, all analyses were conducted in analytical triplicates as a function of all depths.

2.3. Sample Characterization

2.3.1. Soil Carbon, Phosphorus, and Nitrogen Analyses

Soil total carbon (TC), total inorganic carbon (TIC), and total organic carbon (TOC) were determined using high temperature oxidation, followed by infrared detection of CO2 (Shimadzu TOC-VCSH, Kyoto, Japan, equipped with a solid sample module, SSM-5000A). The calibration curve was prepared using a soil certified reference material (Leco, St. Joseph, MI, USA, 3.82% Carbon). Total soil phosphorus was determined using the alkaline persulfate digestion method, followed by colorimetric detection using a Seal AQ2 Discrete Analyzer, Mequon, WI, USA [42]. A certified soil standard (Nutrients in Soil, RTC SQC-014, MilliporeSigma, Darmstadt, Germany) was subjected to the same digestion procedure, and the measured value was within 1% of the certified value. Total nitrogen in the soil matrix was determined using the USEPA 353.2 method, in which nitrate was reduced by copperized cadmium to nitrite and measured spectrophotometrically at 520 nm. Soil pH was measured using a 1:1 ratio (soil to distilled water).

2.3.2. Soil FTIR Analysis

Fourier-transform infrared (FTIR) spectra of solid samples were obtained using a Thermo Fisher Scientific Nicolet iS5, Waltham, MA, USA, operated by OMNIC 9 software. Spectra were corrected against an ambient air background spectrum, with a range from 4000 to 400 cm−1, 0.5 cm−1 resolution, and 16 repeats. Functional groups were identified in transmission for all spectra.

2.3.3. Soil Aqueous Extraction

Soil samples were subjected to an aqueous extraction to determine dissolved organic carbon, phosphate and nitrate concentrations, and dissolved organic carbon quality. The aqueous extraction was achieved by placing 1 g of soil in a centrifuge tube and bringing to 10 g using nanopure water (18 MΩ) at pH 6.5. The centrifuge tubes were placed in an orbital shaker for 1 h at room temperature. Once shaken, the tubes were centrifuged at 10,000 rpm (15,182 relative centrifugal force) for 30 min to separate the supernatant and the residual. The supernatant was filtered through a 0.45 µm nylon membrane and decanted into a test tube. Triplicate runs were made for each sample, and the average results were used to yield calculations. Blanks were also carried out in triplicate, following the same extraction scheme. Dissolved organic carbon (DOC) was determined using high temperature oxidation followed by infrared detection of CO2 equipped with a liquid auto sampler (Shimadzu ASI-L). The calibration curve was prepared using an Organic Carbon Standard (RICCA, Arlington, TX, USA 2000 ppm). Phosphate (PO43−-P) and nitrate (NO3-N) were determined by colorimetric methods using a Seal AQ2 Discrete Analyzer. The DOC quality was analyzed using fluorescence spectroscopy (Aqualog-UV-800-C, Horiba Scientific, Kyoto, Japan). The molecular structure, molecular weight, degree of aromaticity (cyclic molecules with carbon double bonds), and recalcitrance (difficulty of decomposition) of the organic compounds all refer to organic carbon quality. Excitation–emission matrix (EEM) fluorescence spectra were obtained with the Aqualog instrument equipped with a 150-W Xe-arc lamp source. The EEM spectrum was acquired with excitation (Ex) from 200 to 450 nm and emission (Em) from 250 to 650 nm in 5 nm increments. Spectra were collected with Ex and Em slits at 5 and 2 nm band widths, respectively, and an integration time of 0.1 s. EEM contour plots were produced by MATLAB R2010a, MathWorks, Natick, MA, USA (numerical computing program) and the fluorescence index (FI) and humification index (HIX) were calculated. EEM peaks have been associated with simple aromatic proteins such as tyrosine (Regions I and II), fulvic-like acids (Region III), soluble microbial byproduct-like material (Region IV), and humic-like acids (Region V). FI is an indicator of SOM sources and is the ratio between fluorescence intensities at emission wavelengths of 450–500 nm and an excitation wavelength of 370 nm [43,44]. HIX is an indicator of humification (increasing aromaticity, decreasing H/C ratio) and is defined as the ratio of emissions at 300–345 nm to emissions at 435–480 nm, at an excitation wavelength of 254 nm [45].

2.4. Data Analysis

DOC, PO43−-P, and NO3-N concentrations (mg kg−1) in the aqueous extractions were corrected by subtracting the respective concentrations from the blank samples. Statistical analyses were conducted using R statistical software within RStudio (v1.2), Posit PBC, Boston, MA, USA [46,47]. Correlation coefficients between aqueous DOC vs. PO43−-P and DOC vs. NO3-N and bulk TOC vs. TP and TOC vs. TN were determined by the Pearson product–moment correlation. Significant differences between the means of the two sets of data were tested using the Student’s t-distribution.
Parallel factor analysis (PARAFAC) is a statistical analytic model that decomposes the three-dimensional signal of the EEM dataset into trilinear terms and a residual array [48]. Solo software 9.1 by Eigenvector Research Inc., Manson, WA, USA, was used to run PARAFAC decomposition and identify shared components within the EEM spectra for the different DOM fractions. UV region wavelengths, Ramen, and Rayleigh scattering were removed prior to modeling. After residuals were examined for outliers, model validation was based on non-negativity constraints, core consistency values > 50%, split half analysis, and goodness-of-fit values > 97%. After model validation, the components were compared to published PARAFAC models using the Open Fluor database (Copyright© Lablicate GmbH 2024). Model components were compared using a threshold of ≥0.95 for Tucker’s congruence coefficient (TCC) as a means of assessing goodness of fit, and comparisons generated insight into component origins and composition [35,49]. Mean sample scores for each component were compared by field and then by treatment (no-till fields 1 and 2, tilled fields 3–8) using one-way ANOVA after confirming that the data met normality assumptions [50].

3. Results

3.1. Solid Phase Characterization

3.1.1. Soil Carbon, Phosphorus, and Nitrogen

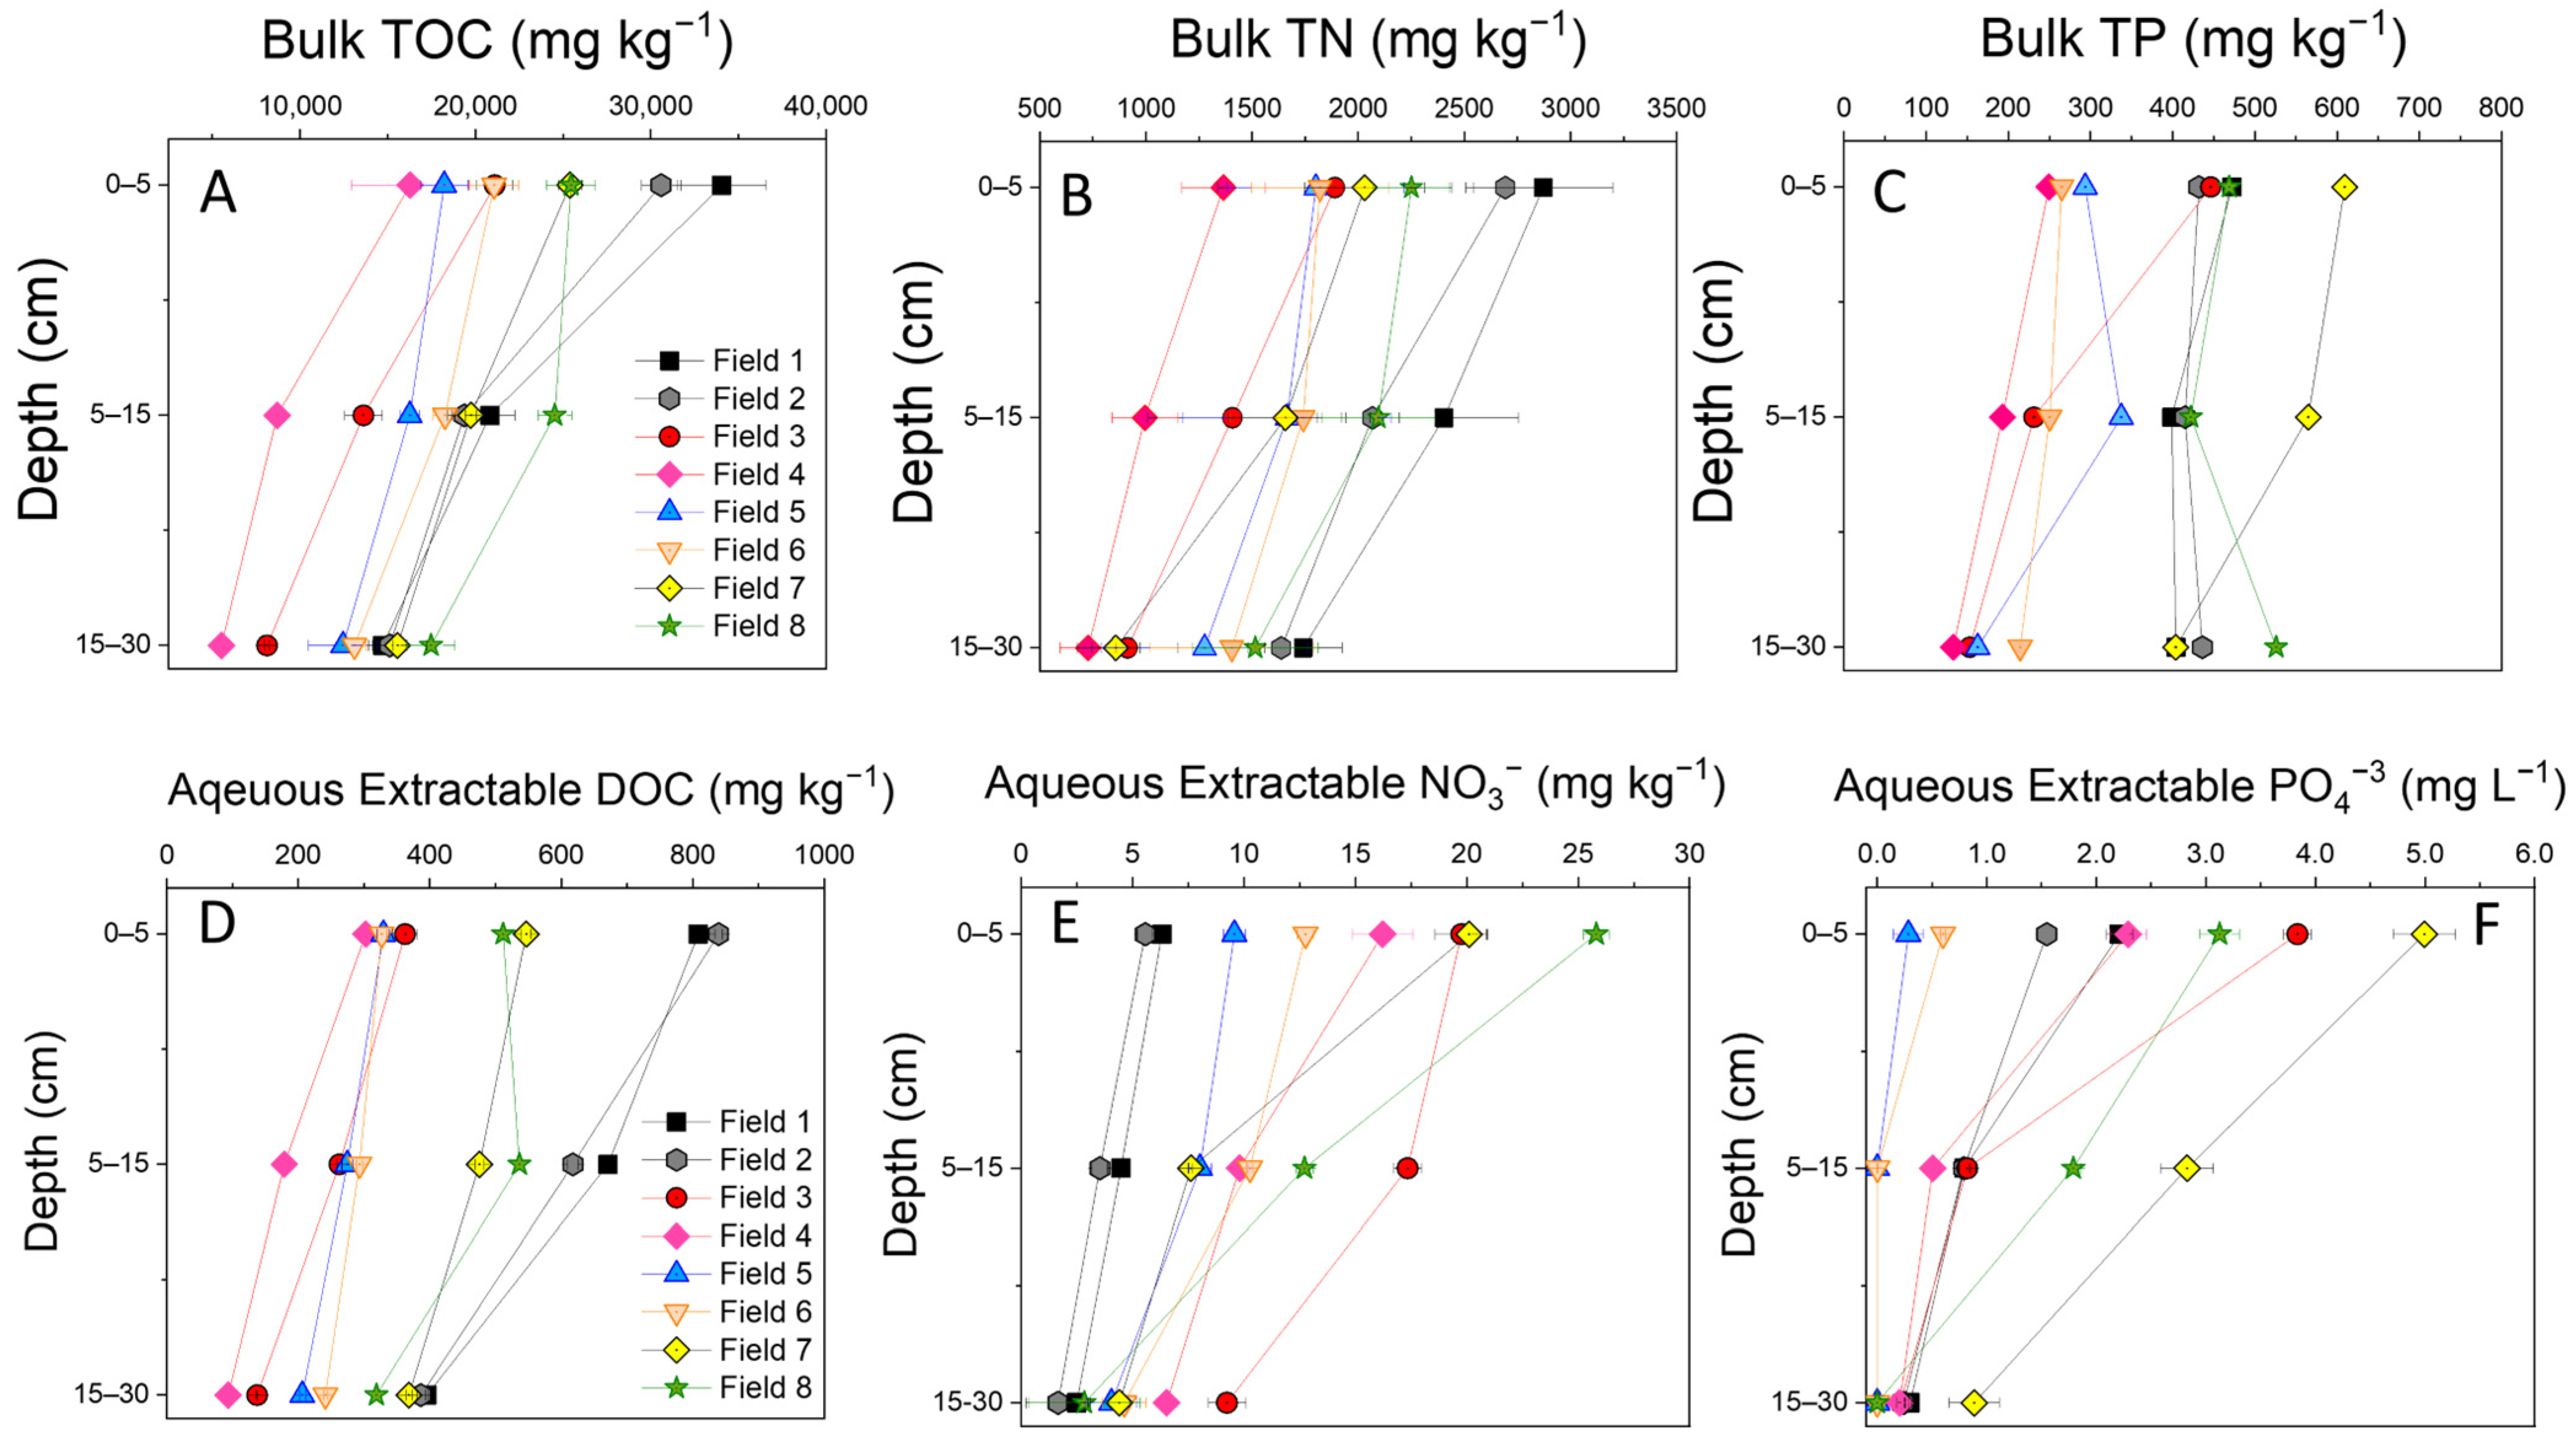
The TOC, TN, and TP concentrations in bulk soils ranged from 5506 to 34,061 mg kg−1, 727 to 2871 mg kg−1, and 130 to 609 mg kg−1 as a function of depth in all study fields, respectively (Figure 1A–C). Overall, TOC and TN concentrations decreased as a function of depth. However, the distribution of TP as a function of depth did not follow a consistent trend. Among all fields investigated, Field 1 (no-till) contained the greatest TOC concentration (34,061 ± 2511 mg kg−1) and TN (2871 ± 329 mg kg−1) in the upper 5 cm, as well as the greatest concentrations at 30 cm depth. Field 7 (30% soil surface with crop residue) contained the greatest concentration of TP (609 mg kg−1) in the upper 5 cm (609 mg kg−1) among all study fields. In most instances, Fields 1, 2, 7, and 8 [Fields 1 and 2: no-till; Fields 7 and 8: 30% soil surface with crop residue] consistently contained the greatest bulk TOC, TN, and TP concentrations in the upper 5 cm. Field 4 (tilled six times) contained the least bulk TOC, TN, and TP across all investigated fields. The fields managed under conservation practices (Fields 1, 2, 7, and 8) consistently had a larger content of TOC and TN at 15–30 cm depth. With respect to TP, the fields managed under conventional practices (Fields 3, 4, 5, and 6) had the lowest content at 15–30 cm depth. Bulk TOC was positively correlated with TN in all investigated fields, with correlation coefficients ranging from 0.95 to 0.99 (p-values ≤ 0.05) (Table 2). In general, TOC was positively correlated with TP, except for Fields 2 (r = 0.07) and 8 (r = −0.84). Bulk soil TOC vs. TP correlation coefficients for Fields 1, 3, 4, 6, and 7 were significantly positively correlated, ranging from 0.92 to 0.99 (p-values ≤ 0.05). Average soil pH values in all investigated fields as a function of depth ranged from 5.9 ± 0.5 to 7.1 ± 0.5 (Table S2, Supplementary Material A) where Field 2 had the lowest pH and Field 4 had the highest pH.

3.1.2. Soil FTIR Analysis

The FTIR characterization of bulk soil samples confirmed the presence of functional groups commonly present in soil organic matter (Table S3; Figure S1). All samples shared similar spectral signatures, with indicators of free O-H compounds, N-H groups, carboxylates, esters, and phenols characteristic of humic and fulvic acids, and both aromatic and aliphatic carbon signatures associated with soil organic horizons [51,52].

3.2. Aqueous Extraction Characterization

3.2.1. Soil Aqueous Extraction

High concentrations of aqueous extractable DOC (302 to 840 mg kg−1), NO3−1-N (5.6 to 25.8 mg kg−1), and PO43−-P (0.28 to 5.0 mg kg−1) were obtained in the upper 5 cm and decreased with depth (Figure 1D–F, respectively). Aqueous extractable DOC reflected the bulk soil TOC concentrations. Fields 1, 2, 7, and 8 [Fields 1 and 2: no-till; Fields 7 and 8: 30% soil surface with crop residue] yielded the greatest aqueous extractable DOC that is consistent with the high TOC in the bulk soil. Contrasting to TN in bulk soils, the least aqueous extractable NO3-N concentrations were observed in Fields 1 and 2 (no-till). The greatest aqueous extractable NO3-N was observed in the upper 5 cm in Field 8. The aqueous extractable PO43−-P in Field 7 was consistently greater when compared to all fields and depths. This is consistent with the greatest TP concentration in the bulk soil at Field 7. The least aqueous extractable PO43−-P was obtained from Fields 5 and 6. Similar to the bulk TOC vs. TN correlation trends, aqueous extractable DOC vs. NO3-N showed positive correlations across all study fields (correlation coefficients ranging from 0.57 to 0.99; Table 2), and these correlations were statistically significant (p-values ≤ 0.05) (except Fields 7 and 8). Aqueous extractable DOC vs. PO43−-P showed positive correlations across all study fields (ranging from 0.63 to 0.98), but none of the correlations were statistically significant.

3.2.2. Fluorescence Spectroscopy

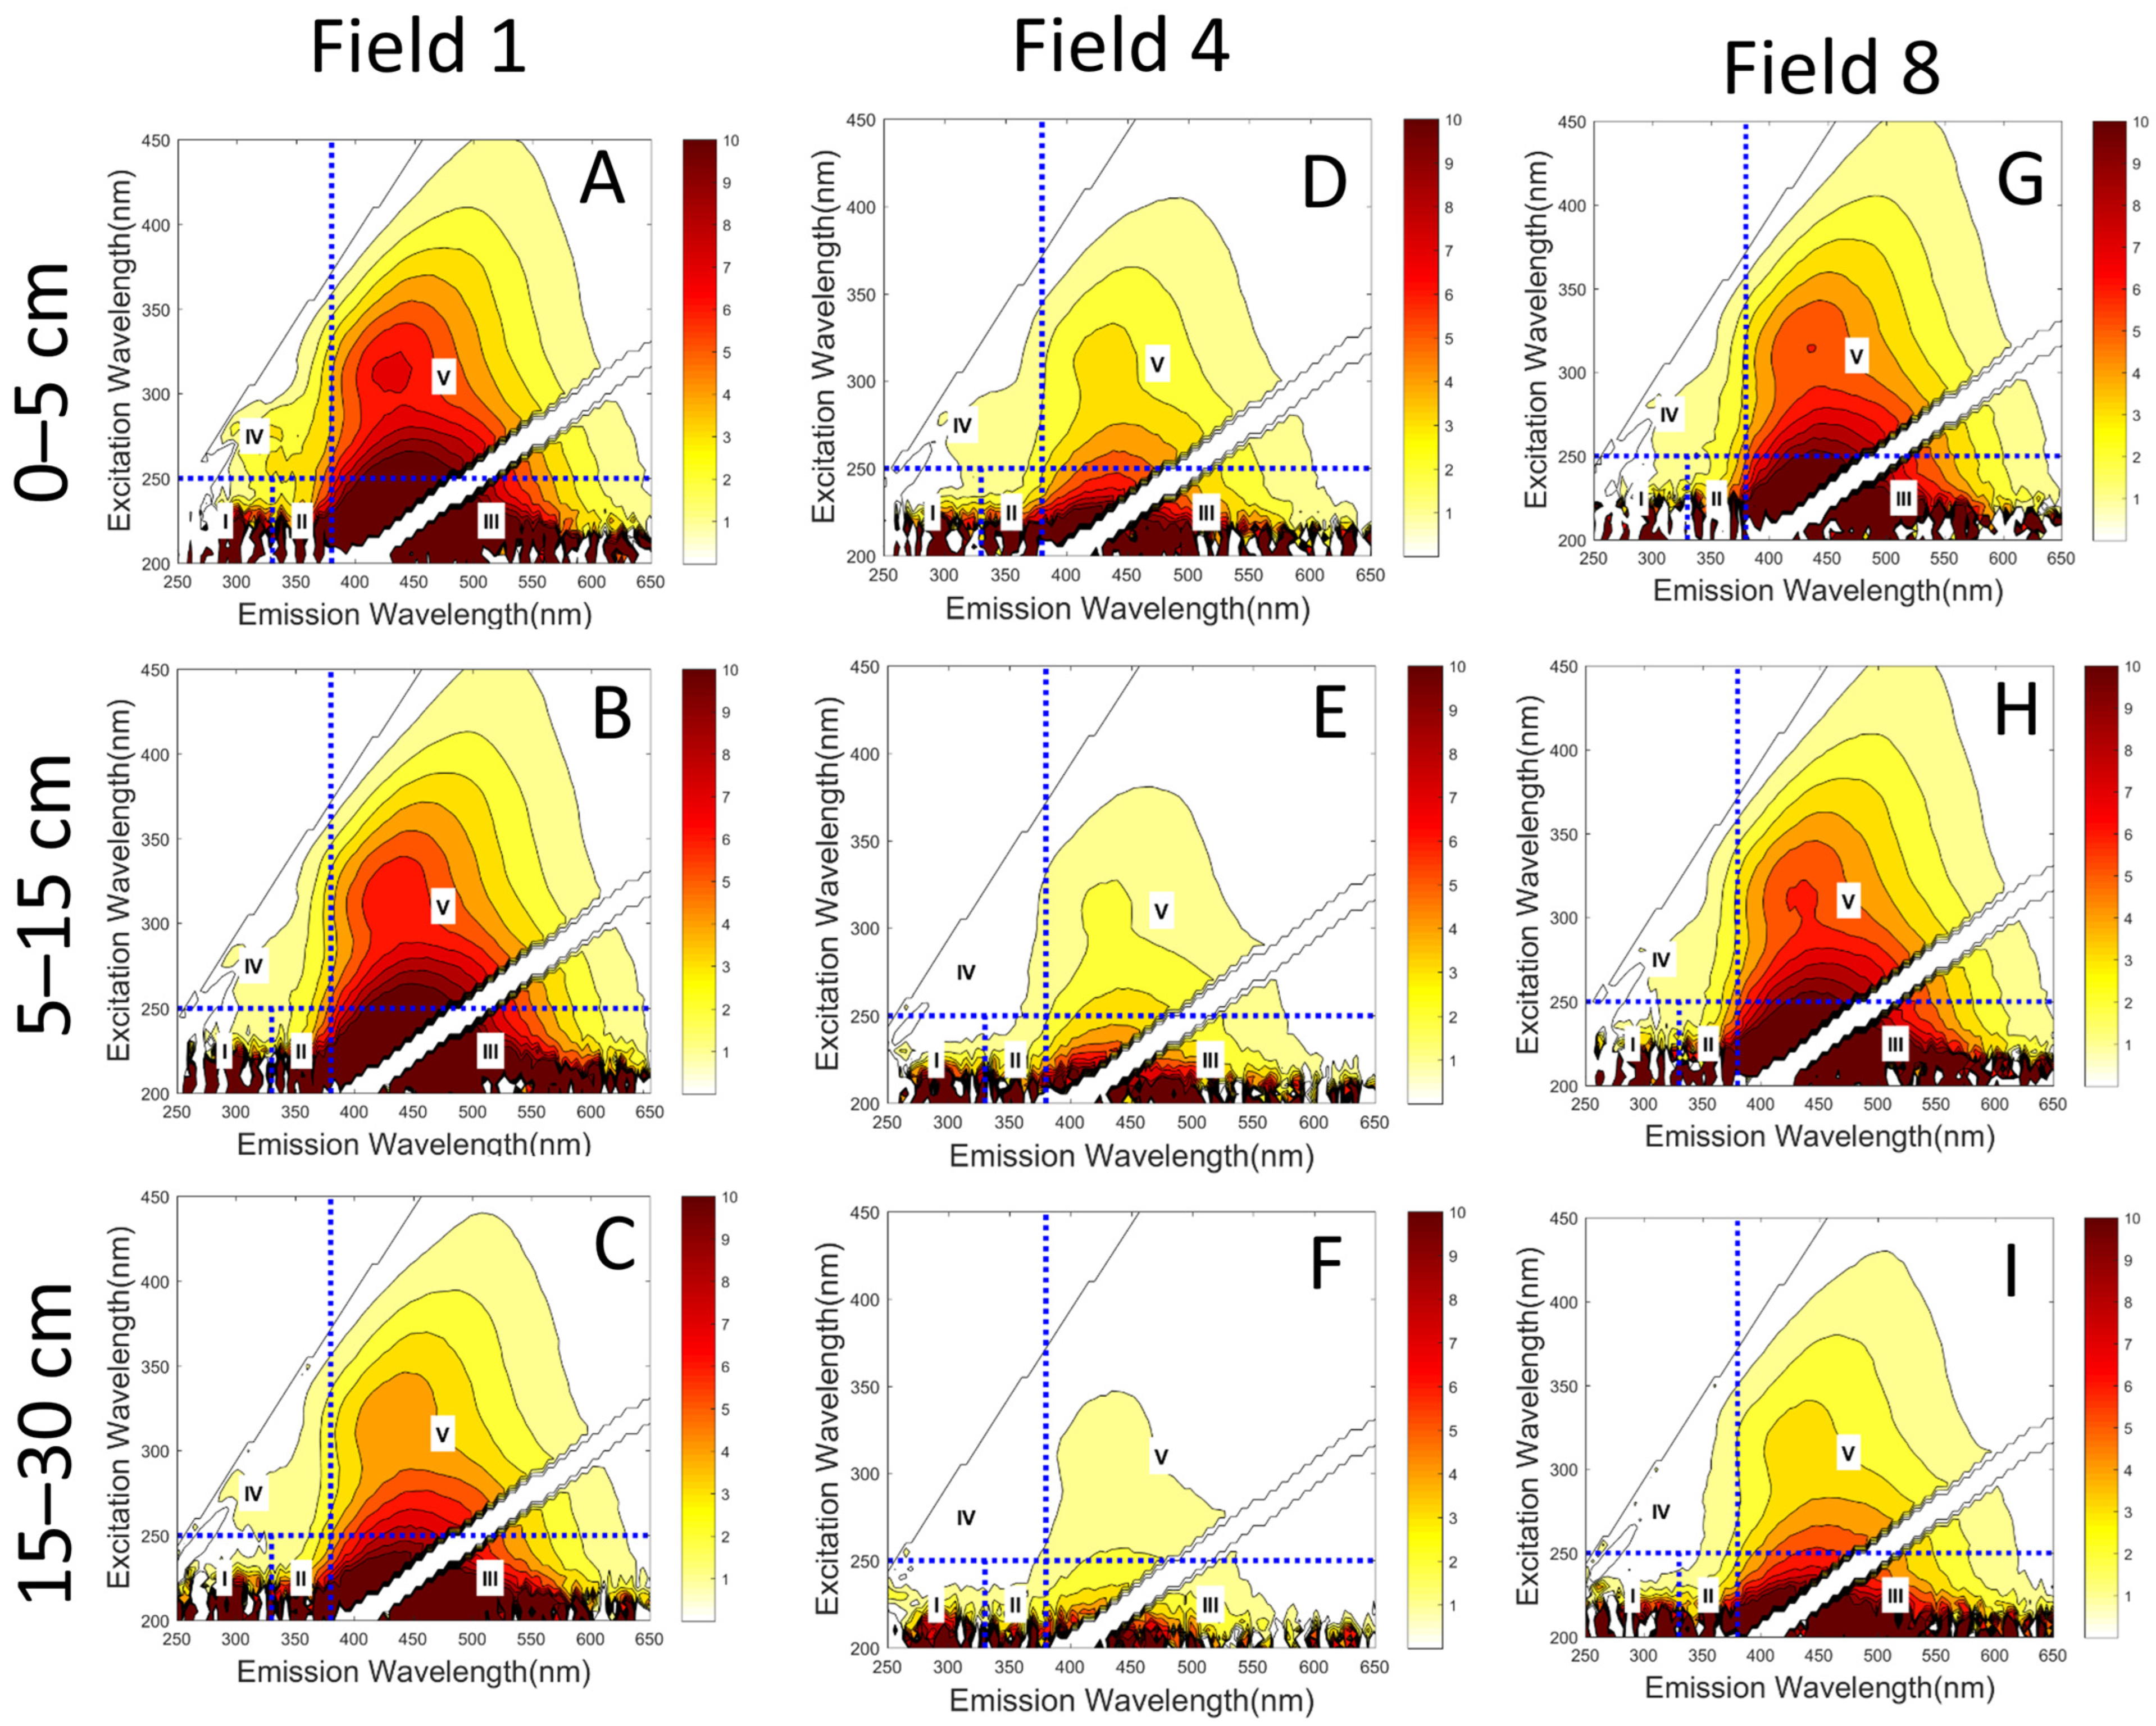
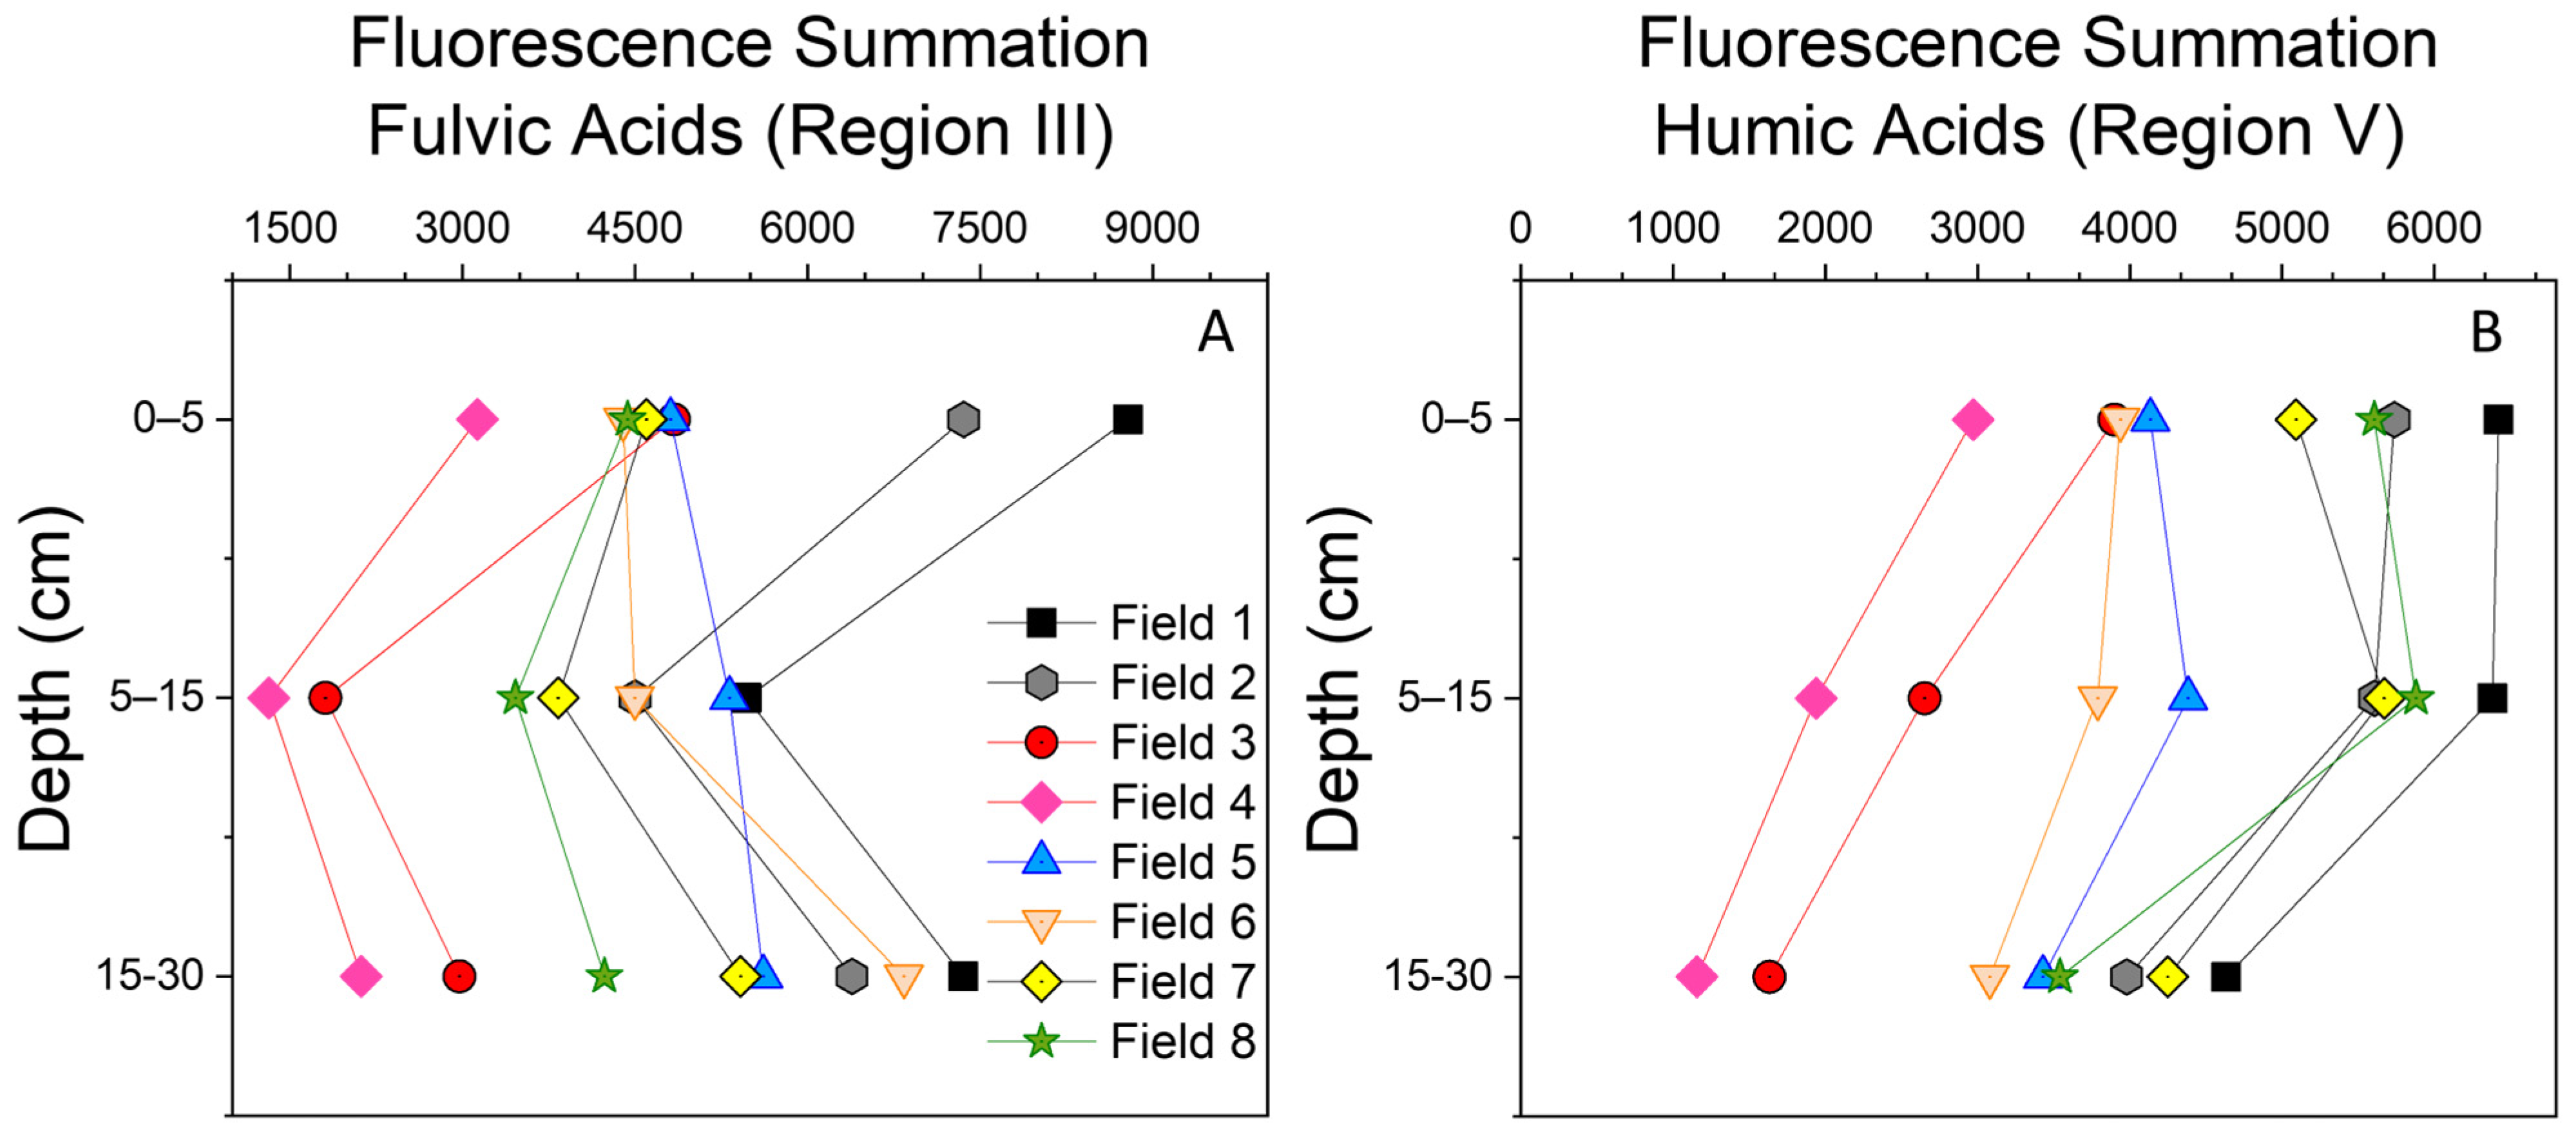
In most fields, the fluorescence intensity in Region III (fulvic acid-like) decreased from 0–5 cm to 5–15 cm depths and then increased at 15–30 cm depths (Figure 2 and Figure 3A). In general, the fluorescence intensity in Region V (humic-like acid) decreased as a function of depth across all fields (Figure 2 and Figure 3B). This trend is similar to the bulk TOC and TN patterns, in which greater concentrations were observed in the upper 5 cm and then decreased as a function of depth (Figure 1A,B). Field 1 (no-till) had the greatest fluorescence intensity in Regions III and V across all depths (Figure 2 and Figure 3). Fields 2, 7, and 8 (no-till and 30% soil surface with crop residue) had the second greatest fluorescence intensity in Region V. The least fluorescence intensity in Region V was observed in Fields 3 and 4 (tilled six times). The fluorescence intensity in Region V for Fields 5 and 6 (tilled six times) was intermediate. The best-fitting PARAFAC model had three components and explained 99.364% of the variability in the data (Figure S3). The model had a core consistency of 95% and was validated with split half analysis of 91%. Open Fluor comparisons and descriptions of component characteristics for the three model components are detailed in Table 3. The identified components consisted of terrestrial humic-like freshly produced (C1), aromatic terrestrial fulvic-like (C2), and fulvic- an humic-like acid (aged organic material, C3). While no significant differences were found between mean scores by field for any component, mean sample scores for all three components were significantly different when divided by tillage practice (Table 4). The mean scores for C1, C2, and C3 were larger for the no-till fields and significantly different. There were no significant differences between average HIX or FI values by field, or when comparing till (fields 3–8) vs. no-till (fields 1–2) (Table 4). Values for mean HIX ranged from 3.67 in Field 4 to 6.43 in Field 5; mean FI values ranged from 1.17 in Field 8 to 1.26 in Field 4 (Figure S2).

4. Discussion

4.1. Tilling Effects on Soil Organic Matter

Overall, organic carbon content in both bulk soil and aqueous extractions decreased as a function of depth (Figure 1). No-till fields (Fields 1, 2), which can enhance soil aggregation and soil organic carbon stabilization [65], contained the greatest TOC concentrations, while the 30% crop residue fields (Fields 7, 8) contained intermediate TOC concentrations. In contrast, conventional tilled fields (Fields 3, 4, 5, 6), which break down soil aggregates and enhance plant residue degradation [66], contained the least TOC concentrations. Research on long-term no-tillage (17 year) has indicated a significant accumulation of SOC when compared to conventional tillage [67]. SOC fractions, in the upper 5 cm depth, including particulate organic matter C, DOC, and microbial biomass C were reported to be 155%, 232%, and 63% greater, respectively, compared to the conventional tillage treatment. FTIR characterization revealed no differences in the presence/absence of functional groups between fields or depths; the results were consistent with common fulvic and humic functional groups in soils [51,52]. However, a comparison of fluorescence intensities between sites revealed differences in the relative composition of SOM. No-till (Fields 1, 2) and 30% crop residue sites (Fields 7, 8) consistently had greater fluorescence intensity summations for humic-like acids (Region V) when compared to conventionally tilled fields (Fields 3, 4, 5, 6) (Figure 2B). Additionally, no-till sites (Fields 1, 2) had higher relative abundances of all PARAFAC components—all of which had humic-like characteristics—compared to tilled sites (Table 3 and Table 4). A study conducted in Georgia, USA found that in soils managed under no-till and conventional-till practices, no-till fields had a larger amount of bound amino acids in humic acids [68]. High TOC concentrations and humic-like SOM in soils at Fields 1, 2, 7, and 8 could play crucial roles in soil organic matter stabilization by increasing soil aggregates stability and strength, reducing soil compaction, increasing soil water content, water infiltration, and nutrient retention [3,12,13,14,15,18,69,70,71,72,73,74]. Phenolic and carboxyl functional groups within humic substances can complex with cations to form cationic bridges, increasing soil aggregation [75]. The association of humic substances with the soil matrix can offer physical protection against chemical and biological degradation [75].
The detrimental effects that conventional tillage has on SOM, as observed by a decrease in the TOC concentration, humic-like acid signatures, and component sample scores (Fields 3, 4, 5, 6), has been well documented [76,77,78]. Several studies have reported that no-till and residue retention tilling methods resulted in an increase of soil organic carbon, when compared to conventional tilling [76,77]. In the upper 5 cm, no-till and 30% crop residue fields (Fields 1, 2, 7, 8) consistently had greater TOC than the conventionally tilled fields (Fields 3, 4, 5, 6) (Figure 1). SOM under conventional tillage practices tends to be less aromatic and has a lower molecular weight, when compared to conservation tilling methods [79]. Our results agree with Wilson and Xenopoulos [79], who found that the humic-like acids (Region V) fluorescence intensity in the upper 5 cm for the no-till and 30% crop residue fields (Fields 1, 2, 7, 8) was consistently greater than that in Fields 3, 4, 5, and 6 (conventionally tilled) (Figure 2), and the humic-like PARAFAC component scores were higher in no-till and 30% crop residue fields compared to conventionally tilled fields. In no-till fields, high SOM content and degree of aromaticity can result in the formation of stable soil aggregates [80]. Sithole et al. [81] reported that aggregate-associated C in no-till fields was larger in macroaggregates than in conventional tillage, and Machedo et al. found that aggregates collected from fields managed under no-till retained their aromatic and aliphatic chemical structures [82].

4.2. Fluorescence Spectroscopy as an Additional Tool for Basic Soil Testing

This study employed fluorescence spectroscopy as a tool to characterize extractable organic matter from farm soils (Figure 3). The volume required for the analysis was 3 mL and the excitation–emission matrix fluorescence spectra per sample were obtained in less than 60 s. This technique contrasts with other procedures that are time-consuming and expensive, including DOM isolation, concentration, fractionation, purification, freeze-drying, and often re-dissolution of the humic substances [33]. Several studies have shown that fluorescence spectroscopy provides similar information about DOM aromatic moieties and degree of humification as UV–vis, FTIR, Raman, NMR, and laser-induced fluorescence [25,33,83,84,85]. Our results showed that no-till (Fields 1 and 2) and 30% crop residue (Fields 7 and 8) fields consistently had greater fluorescence intensity in the fulvic- and humic-like acids region when compared to conventional tilled fields. PARAFAC modeling adds statistical power to fluorescence characterization, allowing for comparison of relative abundance of SOM components within and between samples, as well as characterization through comparisons with published data in Open Fluor [36]. No-till fields showed statistically higher sample scores across all modeled components, implying higher concentrations of humic-like, terrestrially derived SOM components (C1), humic and fulvic aromatic groups (C2), and SOM with fulvic and humic groups characteristic of older organic material (C3), compared to tilled fields (Table 3 and Table 4).
Implementing the use of fluorescence spectroscopy as a tool to characterize the degree of aromaticity (e.g., humic-like acid character) in farm soils can be useful for identifying how agricultural management practices are affecting soil health. Highly aromatic SOM enhances long-term carbon sequestration and storage, improves soil structure, and increases nutrient retention [86]. This rapid and simple procedure could be included with basic soil test packages offered by agricultural testing laboratories. Research has shown that the implementation of no-till and residue retention tilling can increase soil carbon, CEC, and nutrient bioavailability [65,76,77]. If farmers implement no-till and conservation tillage and are interested in quantifying the organic carbon concentration and describing the degree of aromaticity, this information could potentially be obtained from basic soil testing.

4.3. Soil Organic Matter Influence on Nutrient Retention

In general, fields managed under conservation tillage practices retained the highest bulk SOC, TN, and TP concentrations at all studied depths (0–30 cm) (Figure 1). Our results are consistent with several studies that have found positive correlations between SOC and TP/TN sorption [87,88,89]. For instance, bulk soil TOC vs. TN and TOC vs. TP showed positive correlations in most studied fields (Table 2). Aqueous extractable NO3-N and PO43−-P also showed positive correlations with DOC (Table 2). The farm fields studied were subjected to various tillage regimes and methods (Supplementary Material B and C). Fields 3/4, 5/6, and 7/8 were managed using disc plough, disc ripper, and disc chisel machinery, respectively. The operating depth for this equipment ranged from 15 to 30 cm (6 to 12 inches); therefore, one would expect homogeneous nutrient distribution. However, all fields showed stratified TOC and TN content, TP to a lesser extent, irrespective of the tillage methods used. The nutrient stratification could be attributed to the soil management practices in which the fields were tilled, planted, and heavily fertilized. Intense fertilization was conducted before and after planting corn crops (Supplementary Material B). In addition, decomposed SOM, low molecular weight acids excreted from root systems, and nutrient complexes could translocate downward in the soil profile (0–30 cm depth) resulting in the stratified nutrient distribution (high to low content as depth increases) [90]. The highest soil phosphorus solubility and bioavailability is at pH 6.5–7 [91], and the studied farm soils have a pH range of 5.9 to 7.1, indicating high plant bioavailability and potential translocation downward in the soil profile.
Our results suggest that SOM plays a key role in the retention and sequestration of nutrients in farm soils. It is also recognized that SOM provides a reservoir of nutrients for biological processes [92]. Research has stipulated that phosphorus adsorption, and availability is primarily controlled by interactions with SOM, Fe-, Mn-, and Al-(oxy)hydroxide minerals [93,94]. Primary SOM functional groups involved in nutrient adsorption are carboxyl (COOH), hydroxyl (OH), and phenol (benzene-OH) [18,94,95]. A quaternary bonding mechanism can explain the sorption of P in our farm soils, in which organic matter is associated with Al-, Fe-, Mn-(oxy)hydroxides minerals and phosphate is interacting with carboxyl and hydroxyl functional groups in the SOM via cation bridging (e.g., Ca+2) [94]. These functional groups are constituents in fulvic-like and humic-like acids [96,97] and as observed in our study, soils managed under conservation tillage (Fields 1, 2, 7, and 8) showed a higher degree of fulvic- and humic-like character. The high degree of aromaticity in the no-till (Fields 1, 2) and 30% crop residue (Fields 7, 8) soils could be controlling P sorption in these soils to a larger extent.

4.4. Agricultural and Environmental Implications and Study Limitations

Healthy soils have the capability to provide nutrients and water to plants, and buffer detrimental effects on plants during drought and flooding conditions [12,98]. From an agricultural point of view, optimal SOM concentrations with greater aromaticity (e.g., humic-like acid character), such as those observed at Fields 1, 2, 7, and 8, could favor high CEC, NO3 and PO43− retention and bioavailability [99,100]. Leaching experiments have revealed that high SOM content significantly (p-value < 0.01) reduced the release of nitrate from soils [101]. The PO43− and NO3 that are bound to organic matter functional groups (e.g., carboxyl and phenol moieties) are more likely to be retained in the soil than inorganic phosphate dissolved in the soil solution [102] but can be mineralized by microbes and plants more easily than that bound to metal oxides [103]. Additionally, SOM chemistry affects the microbial community structure and metabolic potential [104], and these activities can in turn influence P and N assimilation [105]. Thus, fields with greater organic matter content should be expected to have greater rates of recycling of phosphate, with microbes mineralizing and immobilizing phosphate quickly. This rapid recycling will help retain phosphate in the field, but in a speciation that is readily accessible to plants.
From an environmental point of view, a greater extent of NO3 and PO43− retention due to high SOM stabilization in farm soils could reduce their loss into waterways. In the last decade, nutrient-rich waters flowing into the Western Lake Erie Basin (WLEB) in Ohio have contributed to large, toxic, and long-lasting harmful algal blooms (HABs). Both phosphate and nitrate have been positively correlated with increased HAB biomass and toxicity in Lake Erie, respectively [106]. HABs can induce hypoxic episodes, high turbidity, and negatively affect aquatic organisms, especially vulnerable benthic dwellers [107,108,109,110,111]. A HAB event in August 2014 in the WLEB led the City of Toledo in Ohio to issue a do-not-drink and do-not-boil advisory, affecting nearly half a million citizens and costing the city of Toledo nearly $2.5 million in losses [112]. The export of NO3 and PO43− away from agricultural fields is one of the main contributors to the detrimental effects on water quality in receiving streams and groundwater supplies in the region [112,113]. The use of effective agricultural BMPs (e.g., no-till and conservation tillage) has the potential to ameliorate HAB occurrences. This study has reported the benefits of no-till and minimal tillage practices with respect to a high SOM accumulation in farm soils and the fact that the OC had a higher degree of humic-like acids. Our results suggest that conservation tillage practices can retain N and P to a greater extent than conventional tillage practices, potentially reducing nutrient export into waterways.
The generalizability of our findings is limited due to the use of pseudo-replicates. Soil samples collected at each field under various tillage treatments offer high-precision measurements for that specific experimental unit but restrict true independence among samples within the same tillage treatments. The statistical significance and variance among treatments must consider the limitation of using pseudo-replicates. The results presented in this study were obtained from averaging the subsamples for each field, and all fields were in northwestern Ohio with similar climate conditions. True replication in agricultural research is challenging, especially when working directly with farmers, due to the challenge of finding farm fields with the same management plan. To lessen this limitation, future research could be conducted in research facilities where plots subjected to different tillage practices are in proximity. However, this will restrict collaboration with regional farmers and investigating the effects of tilling in real-life scenarios.

5. Conclusions

This study showed that no-till and conservation tillage increased bulk TOC content, and that SOM organic compounds had a greater degree of humification, positively impacting soil health. Fields under conservation tillage reported strong positive correlations between TOC vs. TN and TOC vs. TP benefiting nutrient retention, potentially increasing their bioavailability. We demonstrated that the EEM-PARAFAC technique is sensitive enough to capture differences in the chemical composition of DOC. Extracted DOC from the conservation tillage fields had stronger fulvic- and humic-like acid signatures proving that this simple technique could be incorporated into basic soil tests. If farmers want to participate in agricultural carbon sequestration and obtain carbon credit markets incentivized by private and/or governmental agencies, the EEM-PARAFAC technique could potentially provide evidence of the relative abundance of organic compounds and their recalcitrant nature. To confirm our findings, future experimental designs could include randomized complete block design and/or complete randomization, attained by dividing the field into homogeneous blocks to manage known variation or assigning treatments to random plots. This replication scheme would ensure statistical reliability, reduce experimental errors, and confirm that results are not due to chance.

Supplementary Materials

The following supporting information can be downloaded at: https://www.mdpi.com/article/10.3390/soilsystems10050056/s1, Supplementary Material A: Figures S1–S3; Tables S1–S3; Supplementary Material B, and Supplementary Material C.

Author Contributions

Conceptualization, A.V.-O.; data curation, A.V.-O., M.F. and K.K.; formal analysis, M.F. and K.K.; funding acquisition, A.V.-O.; investigation, M.F. and K.K.; methodology, A.V.-O. and K.K.; project administration and supervision, A.V.-O.; visualization, A.V.-O. and M.F.; writing—original draft, M.F.; writing—review and editing, A.V.-O. and K.K. All authors have read and agreed to the published version of the manuscript.

Funding

This research was supported by the “Building Strength” grant programs, internal grants at Bowling Green State University (BGSU).

Data Availability Statement

The original contributions presented in this study are included in the article. Further inquiries can be directed to the corresponding authors.

Acknowledgments

We want to thank Kevin King of the USDA-ARS, Soil Drainage Research Unit in Columbus, OH, for providing the soil samples.

Conflicts of Interest

The authors have no competing interests to declare that are relevant to the content of this article. All authors certify that they have no affiliations with or involvement in any organization or entity that has financial or non-financial interest in the subject matter or materials discussed in this manuscript. The authors have no financial or proprietary interest in any material discussed in this article.

References

  1. Le Quéré, C.; Andrew, R.M.; Canadell, J.G.; Sitch, S.; Korsbakken, J.I.; Peters, G.P.; Manning, A.C.; Boden, T.A.; Tans, P.P.; Houghton, R.A.; et al. Global Carbon Budget 2016. Earth Syst. Sci. Data 2016, 8, 605–649. [Google Scholar] [CrossRef]
  2. Edenhofer, O.; Sokona, Y.; Minx, J.C.; Farahani, E.; Kadner, S.; Seyboth, K.; Adler, A.; Baum, I.; Brunner, S.; Eickemeier, P.; et al. Climate Change 2014: Mitigation of Climate Change. Contribution of Working Group III to the Fifth Assessment Report of the Intergovernmental Panel on Climate Change; Cambridge University Press: Cambridge, UK; New York, NY, USA, 2014. [Google Scholar]
  3. Lal, R. Soil Carbon Sequestration Impacts on Global Climate Change and Food Security. Science 2004, 304, 1623–1627. [Google Scholar] [CrossRef]
  4. West, T.O.; Marland, G. A Synthesis of Carbon Sequestration, Carbon Emissions, and Net Carbon Flux in Agriculture: Comparing Tillage Practices in the United States. Agric. Ecosyst. Environ. 2002, 91, 217–232. [Google Scholar] [CrossRef]
  5. Poeplau, C.; Don, A. Carbon Sequestration in Agricultural Soils via Cultivation of Cover Crops—A Meta-Analysis. Agric. Ecosyst. Environ. 2015, 200, 33–41. [Google Scholar] [CrossRef]
  6. Arshad, M.A.; Schnitzer, M.; Angers, D.A.; Ripmeester, J.A. Effects of till vs No-till on the Quality of Soil Organic Matter. Soil Biol. Biochem. 1990, 22, 595–599. [Google Scholar] [CrossRef]
  7. Lamar, R.T.; Olk, D.C.; Mayhew, L.; Bloom, P.R. A New Standardized Method for Quantification of Humic and Fulvic Acids in Humic Ores and Commercial Products. J. AOAC Int. 2014, 97, 721–730. [Google Scholar] [CrossRef] [PubMed]
  8. Stevenson, F.J. Humus Chemistry: Genesis, Composition, Reactions, 2nd ed.; Wiley: Hoboken, NJ, USA, 1994; Available online: https://www.wiley.com/en-us/Humus+Chemistry%3A+Genesis%2C+Composition%2C+Reactions%2C+2nd+Edition-p-9780471594741 (accessed on 15 January 2026).
  9. Kononova, M. Soil Organic Matter, Its Nature, Its Role in Soil Formation and in Soil Fertility; Pergamon Press: Oxford, UK, 1961. [Google Scholar]
  10. Piccolo, A.; Conte, P.; Cozzolino, A. Differences in High Perfomance Size Exclusion Chromatography Between Humic Substances and Macromolecular Polymers; Royal Society of Chemistry: Cambridge, UK, 2000; pp. 111–124. [Google Scholar]
  11. Piccolo, A. The Supramolecular Structure of Humic Substances: A Novel Understanding of Humus Chemistry and Implications in Soil Science. Adv. Agron. 2002, 75, 57–134. [Google Scholar] [CrossRef]
  12. Lal, R. Enhancing Crop Yields in the Developing Countries through Restoration of the Soil Organic Carbon Pool in Agricultural Lands. Land Degrad. Dev. 2006, 17, 197–209. [Google Scholar] [CrossRef]
  13. Busari, M.A.; Kukal, S.S.; Kaur, A.; Bhatt, R.; Dulazi, A.A. Conservation Tillage Impacts on Soil, Crop and the Environment. Int. Soil Water Conserv. Res. 2015, 3, 119–129. [Google Scholar] [CrossRef]
  14. Turmel, M.-S.; Speratti, A.; Baudron, F.; Verhulst, N.; Govaerts, B. Crop Residue Management and Soil Health: A Systems Analysis. Agric. Syst. 2015, 134, 6–16. [Google Scholar] [CrossRef]
  15. Karami, A.; Homaee, M.; Afzalinia, S.; Ruhipour, H.; Basirat, S. Organic Resource Management: Impacts on Soil Aggregate Stability and Other Soil Physico-Chemical Properties. Agric. Ecosyst. Environ. 2012, 148, 22–28. [Google Scholar] [CrossRef]
  16. Yang, Y.; Zhang, N.; Xue, M.; Tao, S. Impact of Soil Organic Matter on the Distribution of Polycyclic Aromatic Hydrocarbons (PAHs) in Soils. Environ. Pollut. 2010, 158, 2170–2174. [Google Scholar] [CrossRef] [PubMed]
  17. Diagboya, P.N.; Olu-Owolabi, B.I.; Adebowale, K.O. Effects of Time, Soil Organic Matter, and Iron Oxides on the Relative Retention and Redistribution of Lead, Cadmium, and Copper on Soils. Environ. Sci. Pollut. Res. 2015, 22, 10331–10339. [Google Scholar] [CrossRef] [PubMed]
  18. McCauley, A.; Jones, C.; Olson-Rutz, K. Soil pH and Organic Matter. Nutr. Manag. Modul. 2009, 8, 1–12. [Google Scholar]
  19. Six, J.; Bossuyt, H.; Degryze, S.; Denef, K. A History of Research on the Link between (Micro)Aggregates, Soil Biota, and Soil Organic Matter Dynamics. Soil Tillage Res. 2004, 79, 7–31. [Google Scholar] [CrossRef]
  20. Schimel, J.; Schaeffer, S.M. Microbial Control over Carbon Cycling in Soil. Front. Microbiol. 2012, 3, 348. [Google Scholar] [CrossRef]
  21. Ogle, S.M.; Breidt, F.J.; Paustian, K. Agricultural Management Impacts on Soil Organic Carbon Storage under Moist and Dry Climatic Conditions of Temperate and Tropical Regions. Biogeochemistry 2005, 72, 87–121. [Google Scholar] [CrossRef]
  22. Liu, X.; Herbert, S.J.; Hashemi, A.M.; Zhang, X.; Ding, G. Effects of Agricultural Management on Soil Organic Matter and Carbon Transformation—A Review. Plant Soil Environ. 2006, 52, 531–543. [Google Scholar] [CrossRef]
  23. Kumar, S.; Kadono, A.; Lal, R.; Dick, W. Long-Term No-Till Impacts on Organic Carbon and Properties of Two Contrasting Soils and Corn Yields in Ohio. Soil Sci. Soc. Am. J. 2012, 76, 1798–1809. [Google Scholar] [CrossRef]
  24. Díaz-Zorita, M.; Grove, J.H.; Murdock, L.; Herbeck, J.; Perfect, E. Soil Structural Disturbance Effects on Crop Yields and Soil Properties in a No-Till Production System. Agron. J. 2004, 96, 1651–1659. [Google Scholar] [CrossRef]
  25. Kögel-Knabner, I. 13C and 15N NMR Spectroscopy as a Tool in Soil Organic Matter Studies. Geoderma 1997, 80, 243–270. [Google Scholar] [CrossRef]
  26. Lützow, M.V.; Kögel-Knabner, I.; Ekschmitt, K.; Matzner, E.; Guggenberger, G.; Marschner, B.; Flessa, H. Stabilization of Organic Matter in Temperate Soils: Mechanisms and Their Relevance under Different Soil Conditions—A Review. Eur. J. Soil Sci. 2006, 57, 426–445. [Google Scholar] [CrossRef]
  27. Laudicina, V.A.; Novara, A.; Barbera, V.; Egli, M.; Badalucco, L. Long-Term Tillage and Cropping System Effects on Chemical and Biochemical Characteristics of Soil Organic Matter in a Mediterranean Semiarid Environment. Land Degrad. Dev. 2015, 26, 45–53. [Google Scholar] [CrossRef]
  28. Xing, Z.; Du, C.; Tian, K.; Ma, F.; Shen, Y.; Zhou, J. Application of FTIR-PAS and Raman Spectroscopies for the Determination of Organic Matter in Farmland Soils. Talanta 2016, 158, 262–269. [Google Scholar] [CrossRef]
  29. Francioso, O.; Ciavatta, C.; Sànchez-Cortés, S.; Tugnoli, V.; Sitti, L.; Gessa, C. Spectroscopic Characterization of Soil Organic Matter in Long-Term Amendment Trials. Soil Sci. 2000, 165, 495. [Google Scholar] [CrossRef]
  30. Ohno, T.; Amirbahman, A.; Bro, R. Parallel Factor Analysis of Excitation–Emission Matrix Fluorescence Spectra of Water Soluble Soil Organic Matter as Basis for the Determination of Conditional Metal Binding Parameters. Environ. Sci. Technol. 2008, 42, 186–192. [Google Scholar] [CrossRef] [PubMed]
  31. Hernandez-Ruiz, S.; Abrell, L.; Wickramasekara, S.; Chefetz, B.; Chorover, J. Quantifying PPCP Interaction with Dissolved Organic Matter in Aqueous Solution: Combined Use of Fluorescence Quenching and Tandem Mass Spectrometry. Water Res. 2012, 46, 943–954. [Google Scholar] [CrossRef]
  32. Vázquez-Ortega, A.; Hernandez-Ruiz, S.; Amistadi, M.K.; Rasmussen, C.; Chorover, J. Fractionation of Dissolved Organic Matter by (Oxy)Hydroxide-Coated Sands: Competitive Sorbate Displacement during Reactive Transport. Vadose Zone J. 2014, 13, 1–13. [Google Scholar] [CrossRef]
  33. Kalbitz, K.; Geyer, S.; Geyer, W. A Comparative Characterization of Dissolved Organic Matter by Means of Original Aqueous Samples and Isolated Humic Substances. Chemosphere 2000, 40, 1305–1312. [Google Scholar] [CrossRef]
  34. Chen, W.; Westerhoff, P.; Leenheer, J.A.; Booksh, K. Fluorescence Excitation−Emission Matrix Regional Integration to Quantify Spectra for Dissolved Organic Matter. Environ. Sci. Technol. 2003, 37, 5701–5710. [Google Scholar] [CrossRef]
  35. Murphy, K.R.; Stedmon, C.A.; Graeber, D.; Bro, R. Fluorescence Spectroscopy and Multi-Way Techniques. PARAFAC. Anal. Methods 2013, 5, 6557–6566. [Google Scholar] [CrossRef]
  36. Wells, M.J.M.; Funk, D.; Mullins, G.A.; Bell, K.Y. Application of a Fluorescence EEM-PARAFAC Model for Direct and Indirect Potable Water Reuse Monitoring: Multi-Stage Ozone–Biofiltration without Reverse Osmosis at Gwinnett County, Georgia, USA. Sci. Total Environ. 2023, 886, 163937. [Google Scholar] [CrossRef]
  37. Daughtry, C.S.T.; Hunt, E.R.; Doraiswamy, P.C.; McMurtrey, J.E.; Russ, A.L. Remote Sensing of Crop Residue Cover and Soil Tillage Intensity. In Proceedings of the 2003 IEEE International Geoscience and Remote Sensing Symposium, Toulouse, France, 21–25 July 2003; Volume 4, pp. 2192–2194. [Google Scholar]
  38. Kieffer, K.E. Characterizing the Molecular Composition of Extractable Humic Material in an Organically Managed Farm Soil Using Humeomics and Spectroscopic Techniques; Bowling Green State University: Toledo, OH, USA, 2024. [Google Scholar]
  39. Williams, M.R.; King, K.W.; Ford, W.; Fausey, N.R. Edge-of-Field Research to Quantify the Impacts of Agricultural Practices on Water Quality in Ohio. J. Soil Water Conserv. 2016, 71, 9A–12A. [Google Scholar] [CrossRef]
  40. Ohio Division of Geological Survey (ODNR) (2006) Bedrock Geologic Map of Ohio 2017. Available online: https://dam.assets.ohio.gov/image/upload/ohiodnr.gov/documents/geology/MiscMap_BedrockGeology_2017.pdf (accessed on 5 May 2024).
  41. Web Soil Survey. Available online: https://websoilsurvey.sc.egov.usda.gov/App/HomePage.htm (accessed on 5 May 2024).
  42. Patton, C.; Kryskalla, J. Methods of Analysis by the US Geological Survey National Water Quality Laboratory: Evaluation of Alkaline Persulfate Digestion as an Alternative to Kjeldahl Digestion for the Determination of Total and Dissolved Nitrogen and Phosphorus in Water; Water Resources Investigations Report 03-4174; US Geological Survey, Branch of Information Services, Federal Center: Denver, CO, USA, 2003; p. 33.
  43. Cory, R.M.; Miller, M.P.; McKnight, D.M.; Guerard, J.J.; Miller, P.L. Effect of Instrument-Specific Response on the Analysis of Fulvic Acid Fluorescence Spectra. Limnol. Oceanogr. Methods 2010, 8, 67–78. [Google Scholar] [CrossRef]
  44. McKnight, D.M.; Boyer, E.W.; Westerhoff, P.K.; Doran, P.T.; Kulbe, T.; Andersen, D.T. Spectrofluorometric Characterization of Dissolved Organic Matter for Indication of Precursor Organic Material and Aromaticity. Limnol. Oceanogr. 2001, 46, 38–48. [Google Scholar] [CrossRef]
  45. Ohno, T. Fluorescence Inner-Filtering Correction for Determining the Humification Index of Dissolved Organic Matter. Environ. Sci. Technol. 2002, 36, 742–746. [Google Scholar] [CrossRef]
  46. R Core Team. R: A Language and Environment for Statistical Computing, R Core Team: Vienna, Austria, 2024.
  47. Posit Team. RStudio: Integrated Development Environment for R 2026, Posit Software, PBC: Boston, MA, USA, 2026.
  48. Stedmon, C.A.; Bro, R. Characterizing Dissolved Organic Matter Fluorescence with Parallel Factor Analysis: A Tutorial. Limnol. Oceanogr. Methods 2008, 6, 572–579. [Google Scholar] [CrossRef]
  49. Murphy, K.R.; Stedmon, C.A.; Wenig, P.; Bro, R. OpenFluor—An Online Spectral Library of Auto-Fluorescence by Organic Compounds in the Environment. Anal. Methods 2014, 6, 658–661. [Google Scholar] [CrossRef]
  50. RStudio Team. RStudio 2025, Posit Software, PBC: Boston, MA, USA, 2025.
  51. Margenot, A.J.; Parikh, S.J.; Calderón, F.J. Fourier-Transform Infrared Spectroscopy for Soil Organic Matter Analysis. Soil Sci. Soc. Am. J. 2023, 87, 1503–1528. [Google Scholar] [CrossRef]
  52. Tatzber, M.; Stemmer, M.; Spiegel, H.; Katzlberger, C.; Haberhauer, G.; Mentler, A.; Gerzabek, M.H. FTIR-Spectroscopic Characterization of Humic Acids and Humin Fractions Obtained by Advanced NaOH, Na4P2O7, and Na2CO3 Extraction Procedures. J. Plant Nutr. Soil Sci. 2007, 170, 522–529. [Google Scholar] [CrossRef]
  53. Yamashita, Y.; Kojima, D.; Yoshida, N.; Shibata, H. Relationships between Dissolved Black Carbon and Dissolved Organic Matter in Streams. Chemosphere 2021, 271, 129824. [Google Scholar] [CrossRef]
  54. Shutova, Y.; Baker, A.; Bridgeman, J.; Henderson, R.K. Spectroscopic Characterisation of Dissolved Organic Matter Changes in Drinking Water Treatment: From PARAFAC Analysis to Online Monitoring Wavelengths. Water Res. 2014, 54, 159–169. [Google Scholar] [CrossRef]
  55. Wu, H.; Xu, X.; Fu, P.; Cheng, W.; Fu, C. Responses of Soil WEOM Quantity and Quality to Freeze–Thaw and Litter Manipulation with Contrasting Soil Water Content: A Laboratory Experiment. CATENA 2021, 198, 105058. [Google Scholar] [CrossRef]
  56. Hong, H.; Wu, S.; Wang, Q.; Dai, M.; Qian, L.; Zhu, H.; Li, J.; Zhang, J.; Liu, J.; Li, J.; et al. Fluorescent Dissolved Organic Matter Facilitates the Phytoavailability of Copper in the Coastal Wetlands Influenced by Artificial Topography. Sci. Total Environ. 2021, 790, 147855. [Google Scholar] [CrossRef] [PubMed]
  57. Chen, M.; Jung, J.; Lee, Y.K.; Hur, J. Surface Accumulation of Low Molecular Weight Dissolved Organic Matter in Surface Waters and Horizontal Off-Shelf Spreading of Nutrients and Humic-like Fluorescence in the Chukchi Sea of the Arctic Ocean. Sci. Total Environ. 2018, 639, 624–632. [Google Scholar] [CrossRef]
  58. Yamashita, Y.; Maie, N.; Briceño, H.; Jaffé, R. Optical Characterization of Dissolved Organic Matter in Tropical Rivers of the Guayana Shield, Venezuela. J. Geophys. Res. Biogeosci. 2010, 115, G00F10. [Google Scholar] [CrossRef]
  59. Dainard, P.G.; Guéguen, C.; Yamamoto-Kawai, M.; Williams, W.J.; Hutchings, J.K. Interannual Variability in the Absorption and Fluorescence Characteristics of Dissolved Organic Matter in the Canada Basin Polar Mixed Waters. J. Geophys. Res. Ocean. 2019, 124, 5258–5269. [Google Scholar] [CrossRef]
  60. Hassan, M.; Talbot, J.; Arsenault, J.; Martinez-Cruz, K.; Sepulveda-Jauregui, A.; Hoyos-Santillan, J.; Lapierre, J.-F. Linking Dissolved Organic Matter to CO2 and CH4 Concentrations in Canadian and Chilean Peatland Pools. Glob. Biogeochem. Cycles 2023, 37, e2023GB007715. [Google Scholar] [CrossRef]
  61. Søndergaard, M.; Stedmon, C.A.; Borch, N.H. Fate of Terrigenous Dissolved Organic Matter (DOM) in Estuaries: Aggregation and Bioavailability. Ophelia 2003, 57, 161–176. [Google Scholar] [CrossRef]
  62. Gao, Z.; Guéguen, C. Size Distribution of Absorbing and Fluorescing DOM in Beaufort Sea, Canada Basin. Deep Sea Res. Part I Oceanogr. Res. Pap. 2017, 121, 30–37. [Google Scholar] [CrossRef]
  63. Devresse, Q.; Becker, K.W.; Dilmahamod, A.F.; Ortega-Retuerta, E.; Engel, A. Dissolved Organic Matter Fluorescence as a Tracer of Upwelling and Microbial Activities in Two Cyclonic Eddies in the Eastern Tropical North Atlantic. J. Geophys. Res. Ocean. 2023, 128, e2023JC019821. [Google Scholar] [CrossRef]
  64. Yang, L.; Chen, L.; Zhuang, W.-E.; Zhu, Z. Unveiling Changes in the Complexation of Dissolved Organic Matter with Pb(II) by Photochemical and Microbial Degradation Using Fluorescence EEMs-PARAFAC. Environ. Pollut. 2024, 341, 122982. [Google Scholar] [CrossRef] [PubMed]
  65. Sheehy, J.; Regina, K.; Alakukku, L.; Six, J. Impact of No-till and Reduced Tillage on Aggregation and Aggregate-Associated Carbon in Northern European Agroecosystems. Soil Tillage Res. 2015, 150, 107–113. [Google Scholar] [CrossRef]
  66. Gupta, V.; Sharma, A.; Kumar, J.; Abrol, V.; Singh, B.; Singh, M. Effects of Integrated Nutrient Management on Growth and Yield of Maize (Zea mays L.)—Gobhi Sarson (Brassica napus L.) Cropping System in Sub-Tropical Region under Foothills of North-West Himalayas. Bangladesh J. Bot. 2014, 43, 147–155. [Google Scholar] [CrossRef]
  67. Liu, E.; Teclemariam, S.G.; Yan, C.; Yu, J.; Gu, R.; Liu, S.; He, W.; Liu, Q. Long-Term Effects of No-Tillage Management Practice on Soil Organic Carbon and Its Fractions in the Northern China. Geoderma 2014, 213, 379–384. [Google Scholar] [CrossRef]
  68. Szajdak, L.; Jezierski, A.; Cabrera, M.L. Impact of Conventional and No-Tillage Management on Soil Amino Acids, Stable and Transient Radicals and Properties of Humic and Fulvic Acids. Org. Geochem. 2003, 34, 693–700. [Google Scholar] [CrossRef]
  69. Oades, J.M. The Retention of Organic Matter in Soils. Biogeochemistry 1988, 5, 35–70. [Google Scholar] [CrossRef]
  70. Oades, J.M.; Gillman, G.; Hue, N.; Vannoordwiik, M.; Robertson, G.; Wada, K. Interactions of Soil Organic-Matter and Variable-Charge Clays. In Dynamics of Soil Organic Matter in Tropical Ecosystems; University of Hawaii Press: Honolulu, HI, USA, 1989; pp. 69–95. [Google Scholar]
  71. Soane, B.D. The Role of Organic Matter in Soil Compactibility: A Review of Some Practical Aspects. Soil Tillage Res. 1990, 16, 179–201. [Google Scholar] [CrossRef]
  72. Romig, D.E.; Garlynd, M.J.; Harris, R.F.; McSweeney, K. How Farmers Assess Soil Health and Quality. J. Soil Water Conserv. 1995, 50, 229–236. [Google Scholar] [CrossRef]
  73. Reeves, D.W. The Role of Soil Organic Matter in Maintaining Soil Quality in Continuous Cropping Systems. Soil Tillage Res. 1997, 43, 131–167. [Google Scholar] [CrossRef]
  74. Doran, J.W.; Zeiss, M.R. Soil Health and Sustainability: Managing the Biotic Component of Soil Quality. Appl. Soil Ecol. 2000, 15, 3–11. [Google Scholar] [CrossRef]
  75. Bronick, C.J.; Lal, R. Soil Structure and Management: A Review. Geoderma 2005, 124, 3–22. [Google Scholar] [CrossRef]
  76. Van Eerd, L.L.; Congreves, K.A.; Hayes, A.; Verhallen, A.; Hooker, D.C. Long-Term Tillage and Crop Rotation Effects on Soil Quality, Organic Carbon, and Total Nitrogen. Can. J. Soil Sci. 2014, 94, 303–315. [Google Scholar] [CrossRef]
  77. Meena, J.R.; Behera, U.K.; Chakraborty, D.; Sharma, A.R. Tillage and Residue Management Effect on Soil Properties, Crop Performance and Energy Relations in Greengram (Vigna radiata L.) under Maize-Based Cropping Systems. Int. Soil Water Conserv. Res. 2015, 3, 261–272. [Google Scholar] [CrossRef]
  78. Mbuthia, L.W.; Acosta-Martínez, V.; DeBruyn, J.; Schaeffer, S.; Tyler, D.; Odoi, E.; Mpheshea, M.; Walker, F.; Eash, N. Long Term Tillage, Cover Crop, and Fertilization Effects on Microbial Community Structure, Activity: Implications for Soil Quality. Soil Biol. Biochem. 2015, 89, 24–34. [Google Scholar] [CrossRef]
  79. Wilson, H.F.; Xenopoulos, M.A. Effects of Agricultural Land Use on the Composition of Fluvial Dissolved Organic Matter. Nat. Geosci. 2009, 2, 37–41. [Google Scholar] [CrossRef]
  80. Six, J.; Elliott, E.T.; Paustian, K. Soil Macroaggregate Turnover and Microaggregate Formation: A Mechanism for C Sequestration under No-Tillage Agriculture. Soil Biol. Biochem. 2000, 32, 2099–2103. [Google Scholar] [CrossRef]
  81. Sithole, N.J.; Magwaza, L.S.; Thibaud, G.R. Long-Term Impact of No-till Conservation Agriculture and N-Fertilizer on Soil Aggregate Stability, Infiltration and Distribution of C in Different Size Fractions. Soil Tillage Res. 2019, 190, 147–156. [Google Scholar] [CrossRef]
  82. Machado, W.; Franchini, J.C.; de Fátima Guimarães, M.; Filho, J.T. Spectroscopic Characterization of Humic and Fulvic Acids in Soil Aggregates, Brazil. Heliyon 2020, 6, e04078. [Google Scholar] [CrossRef]
  83. Gerzabek, M.H.; Antil, R.S.; Kögel-Knabner, I.; Knicker, H.; Kirchmann, H.; Haberhauer, G. How Are Soil Use and Management Reflected by Soil Organic Matter Characteristics: A Spectroscopic Approach. Eur. J. Soil Sci. 2006, 57, 485–494. [Google Scholar] [CrossRef]
  84. Milori, D.M.B.P.; Galeti, H.V.A.; Martin-Neto, L.; Dieckow, J.; González-Pérez, M.; Bayer, C.; Salton, J. Organic Matter Study of Whole Soil Samples Using Laser-Induced Fluorescence Spectroscopy. Soil Sci. Soc. Am. J. 2006, 70, 57–63. [Google Scholar] [CrossRef]
  85. Minor, E.C.; Swenson, M.M.; Mattson, B.M.; Oyler, A.R. Structural Characterization of Dissolved Organic Matter: A Review of Current Techniques for Isolation and Analysis. Environ. Sci. Process. Impacts 2014, 16, 2064–2079. [Google Scholar] [CrossRef]
  86. Almendros, G.; González-Pérez, J.A. Soil Organic Carbon Sequestration Mechanisms and the Chemical Nature of Soil Organic Matter—A Review. Sustainability 2025, 17, 6689. [Google Scholar] [CrossRef]
  87. Gonzalez-Pradas, E.; Villafranca-Sanchez, M.; Socias-Viciana, M. Phosphate and Nitrate Sorption on Calcareous Soils from Spain. Arid Soil Res. Rehabil. 1993, 7, 181–190. [Google Scholar] [CrossRef]
  88. Axt, J.R.; Walbridge, M.R. Phosphate Removal Capacity of Palustrine Forested Wetlands and Adjacent Uplands in Virginia. Soil Sci. Soc. Am. J. 1999, 63, 1019–1031. [Google Scholar] [CrossRef]
  89. Remya, N.; Kumar, M.; Mohan, S.; Azzam, R. Influence of Organic Matter and Solute Concentration on Nitrate Sorption in Batch and Diffusion-Cell Experiments. Bioresour. Technol. 2011, 102, 5283–5289. [Google Scholar] [CrossRef]
  90. Kooch, Y.; Ehsani, S.; Akbarinia, M. Stratification of Soil Organic Matter and Biota Dynamics in Natural and Anthropogenic Ecosystems. Soil Tillage Res. 2020, 200, 104621. [Google Scholar] [CrossRef]
  91. Penn, C.J.; Camberato, J.J. A Critical Review on Soil Chemical Processes That Control How Soil pH Affects Phosphorus Availability to Plants. Agriculture 2019, 9, 120. [Google Scholar] [CrossRef]
  92. Krull, E.S.; Skjemstad, J.O.; Baldock, J.A. Functions of Soil Organic Matter and the Effect on Soil Properties; Grains Research & Development Corporation (GRDC) Project No. CSO 00029: Residue Management, Soil Organic Carbon and Crop Performance; CSIRO Land & Water: Glen Osmond, SA, USA, 2004.
  93. Ouvrard, S.; Simonnot, M.-O.; Sardin, M. Reactive Behavior of Natural Manganese Oxides toward the Adsorption of Phosphate and Arsenate. Ind. Eng. Chem. Res. 2002, 41, 2785–2791. [Google Scholar] [CrossRef]
  94. Fink, J.R.; Inda, A.V.; Tiecher, T.; Barrón, V. Iron Oxides and Organic Matter on Soil Phosphorus Availability. Ciênc. Agrotec. 2016, 40, 369–379. [Google Scholar] [CrossRef]
  95. Sollins, P.; Homann, P.; Caldwell, B.A. Stabilization and Destabilization of Soil Organic Matter: Mechanisms and Controls. Geoderma 1996, 74, 65–105. [Google Scholar] [CrossRef]
  96. Tsutsuki, K.; Kuwatsuka, S. Chemical Studies on Soil Humic Acids. Soil Sci. Plant Nutr. 1978, 24, 547–560. [Google Scholar] [CrossRef]
  97. Leenheer, J.A.; Wershaw, R.L.; Reddy, M.M. Strong-Acid, Carboxyl-Group Structures in Fulvic Acid from the Suwannee River, Georgia. 2. Major Structures. Environ. Sci. Technol. 1995, 29, 399–405. [Google Scholar] [CrossRef] [PubMed]
  98. Moebius-Clune, B.; Moebius-Clune, D.; Gugino, B.; Idowu, O.; Schindelbeck, R.; Ristow, A.; van Es, H.; Thies, J.; Shayler, H.; McBride, M.; et al. Comprehensive Assessment of Soil Health, 3rd ed.; Cornell University: Ithaca, NY, USA, 2016. [Google Scholar]
  99. Helling, C.; Chesters, G.; Corey, R. Contribution of Organic Matter and Clay to Soil Cation-Exchange Capacity as Affected by the pH of the Saturating Solution. Soil Sci. Soc. Am. J. 1964, 28, 517–520. [Google Scholar] [CrossRef]
  100. Bünemann, E.K.; Bongiorno, G.; Bai, Z.; Creamer, R.E.; De Deyn, G.; de Goede, R.; Fleskens, L.; Geissen, V.; Kuyper, T.W.; Mäder, P.; et al. Soil Quality—A Critical Review. Soil Biol. Biochem. 2018, 120, 105–125. [Google Scholar] [CrossRef]
  101. Kanthle, A.K.; Lenka, N.K.; Lenka, S.; Tedia, K. Biochar Impact on Nitrate Leaching as Influenced by Native Soil Organic Carbon in an Inceptisol of Central India. Soil Tillage Res. 2016, 157, 65–72. [Google Scholar] [CrossRef]
  102. Sharpley, A.; Moyer, B. Phosphorus Forms in Manure and Compost and Their Release during Simulated Rainfall. J. Environ. Qual. 2000, 29, 1462–1469. [Google Scholar] [CrossRef]
  103. Oehl, F.; Frossard, E.; Fliessbach, A.; Dubois, D.; Oberson, A. Basal Organic Phosphorus Mineralization in Soils under Different Farming Systems. Soil Biol. Biochem. 2004, 36, 667–675. [Google Scholar] [CrossRef]
  104. Wu, X.; Wu, L.; Liu, Y.; Zhang, P.; Li, Q.; Zhou, J.; Hess, N.J.; Hazen, T.C.; Yang, W.; Chakraborty, R. Microbial Interactions With Dissolved Organic Matter Drive Carbon Dynamics and Community Succession. Front. Microbiol. 2018, 9, 1234. [Google Scholar] [CrossRef] [PubMed]
  105. Lin, X.; Tfaily, M.M.; Green, S.J.; Steinweg, J.M.; Chanton, P.; Imvittaya, A.; Chanton, J.P.; Cooper, W.; Schadt, C.; Kostka, J.E. Microbial Metabolic Potential for Carbon Degradation and Nutrient (Nitrogen and Phosphorus) Acquisition in an Ombrotrophic Peatland. Appl. Environ. Microbiol. 2014, 80, 3531–3540. [Google Scholar] [CrossRef]
  106. Gobler, C.J.; Burkholder, J.M.; Davis, T.W.; Harke, M.J.; Johengen, T.; Stow, C.A.; Van de Waal, D.B. The Dual Role of Nitrogen Supply in Controlling the Growth and Toxicity of Cyanobacterial Blooms. Harmful Algae 2016, 54, 87–97. [Google Scholar] [CrossRef]
  107. Baker, D.B.; Confesor, R.; Ewing, D.E.; Johnson, L.T.; Kramer, J.W.; Merryfield, B.J. Phosphorus Loading to Lake Erie from the Maumee, Sandusky and Cuyahoga Rivers: The Importance of Bioavailability. J. Great Lakes Res. 2014, 40, 502–517. [Google Scholar] [CrossRef]
  108. Keitzer, S.C.; Ludsin, S.A.; Sowa, S.P.; Annis, G.; Arnold, J.G.; Daggupati, P.; Froehlich, A.M.; Herbert, M.E.; Johnson, M.-V.V.; Sasson, A.M.; et al. Thinking Outside of the Lake: Can Controls on Nutrient Inputs into Lake Erie Benefit Stream Conservation in Its Watershed? J. Great Lakes Res. 2016, 42, 1322–1331. [Google Scholar] [CrossRef]
  109. Maccoux, M.J.; Dove, A.; Backus, S.M.; Dolan, D.M. Total and Soluble Reactive Phosphorus Loadings to Lake Erie: A Detailed Accounting by Year, Basin, Country, and Tributary. J. Great Lakes Res. 2016, 42, 1151–1165. [Google Scholar] [CrossRef]
  110. Miller, T.R.; Beversdorf, L.J.; Weirich, C.A.; Bartlett, S.L. Cyanobacterial Toxins of the Laurentian Great Lakes, Their Toxicological Effects, and Numerical Limits in Drinking Water. Mar. Drugs 2017, 15, 160. [Google Scholar] [CrossRef] [PubMed]
  111. World Health Organization. Management of Cyanobacteria in Drinking Water Supplies: Information for Regulators and Water Suppliers; World Health Organization: Geneva, Switzerland, 2011; p. 12. [Google Scholar]
  112. Bullerjahn, G.S.; McKay, R.M.; Davis, T.W.; Baker, D.B.; Boyer, G.L.; D’Anglada, L.V.; Doucette, G.J.; Ho, J.C.; Irwin, E.G.; Kling, C.L.; et al. Global Solutions to Regional Problems: Collecting Global Expertise to Address the Problem of Harmful Cyanobacterial Blooms. A Lake Erie Case Study. Harmful Algae 2016, 54, 223–238. [Google Scholar] [CrossRef]
  113. Verhamme, E.M.; Redder, T.M.; Schlea, D.A.; Grush, J.; Bratton, J.F.; DePinto, J.V. Development of the Western Lake Erie Ecosystem Model (WLEEM): Application to Connect Phosphorus Loads to Cyanobacteria Biomass. J. Great Lakes Res. 2016, 42, 1193–1205. [Google Scholar] [CrossRef]
Figure 1. Bulk soil total organic carbon (TOC) (A), total nitrogen (TN) (B), total phosphorus (TP) (C), soil aqueous extractable dissolved organic carbon (DOC) (D), nitrate (NO3-N) (E), and phosphate (PO43−-P) (F) concentrations mg kg−1 as a function of depth for all study fields.
Soilsystems 10 00056 g001
Figure 2. Fluorescence intensities sum for the fulvic (Region III) (A) and humic-like (Region V) (B) acids as a function of depth for all study fields.
Soilsystems 10 00056 g002
Figure 3. EEM spectra for Fields 1 (no-till, AC), 4 (conventional tillage, DF) and 8 (conservation tillage, GI) as a function of depth. EEMs are divided into five regions aromatic protein (Regions I and II), fulvic-like (Region III), microbial by-product-like (Region IV), and humic-like (Region V). The blue dashed lines represent the division of the different regions. The Rayleigh scattering was removed from the plot.
Soilsystems 10 00056 g003
Table 1. Farm management for the study fields from 2014 to 2017: data voluntarily provided by farmers. The data includes the number of tillage events, fertilizer and herbicide applications, the number of years with cover crops, crop rotations, and crop yields. Crops include soybean (SB), corn (C), and wheat (W).
Field IDTillageFertilizerHerbicideYears of Cover CropsCrop RotationYield (kg ha−1)
10480SB/C/SB/C3677/8737/4532/7927
20480SB/C/SB/C3677/8737/4532/9490
3611No Data3C/SB/W/C10,921/4013/6794/12,992
4611No Data3C/SB/W/C10,921/4103/6794/12,992
56761SB/SB/C/SB4372/3699/12,867/3632
661460C/SB/C/SB10,042/3363/12,427/3901
781532SB/C/SB/C4372/14,543/4204/9729
8101631SB/C/SB/C4036/14,543/4137/11,298
Table 2. Bulk soil and aqueous extraction correlation coefficients between OC vs. N and OC vs. P. Paired-samples t-test for comparing means, with a one-tailed p-value. The asterisk represents significant differences between the two groups, tested using the t-test, with a significance level of 0.05; p-values larger than 0.05 have no asterisk.
Bulk SoilAqueous Extraction
Field IDTOC vs. TN
(mg kg−1)
TOC vs. TP
(mg kg−1)
DOC vs. NO3-N
(mg kg−1)
DOC vs. PO43−-P
(mg kg−1)
10.95 *0.93 *0.97 *0.79
20.99 *0.070.99 *0.98
30.99 *0.98 *0.94 *0.82
40.99 *0.97 *0.96 *0.92
50.99 *0.830.99 *0.69
60.98 *0.99 *0.99 *0.63
70.96 *0.92 *0.810.97
80.99 *−0.84 *0.570.73
Table 3. PARAFAC components, excitation and emission maxima, and descriptions associated with previously published studies in Open Fluor.
Component Maximum Excitation (nm) Maximum Emission (nm) Number of Open Fluor Matches 1 Description 2
C1 <245, 310 418 98 Humic-like, terrestrial, peaks A + M, hydrophilic substances > hydrophobic acids, freshly produced organics
C2 280 513 5 Humic acid -like, aromatic soil fulvic peak
C3 <245, 375 488 3 Fulvic acid like, humic acid-like, hydrophobic base > hydrophobic acids, Peak A + C, older organics
1 https://openfluor.lablicate.com; accessed on 30 October 2025. 2 References for C1: [53,54,55,56,57,58]. References for C2: [59,60,61]. References for C3: [62,63,64].
Table 4. Mean, standard deviations, and one-way analyses of variance of modeled PARAFAC component scores, humification index (HIX) and fluorescence index (FI). * indicates a significant result.
Measure No-TillTillFp Value
MSDMSD
Component 1 106.6922.2868.3223.6812.130.0021 *
Component 2 59.239.7342.3916.45.570.0276 *
Component 3 50.519.1133.9412.888.410.0083 *
HIX5.621.235.441.250.0850.774
FI1.190.00711.20.0510.330.574
Disclaimer/Publisher’s Note: The statements, opinions and data contained in all publications are solely those of the individual author(s) and contributor(s) and not of MDPI and/or the editor(s). MDPI and/or the editor(s) disclaim responsibility for any injury to people or property resulting from any ideas, methods, instructions or products referred to in the content.