Article

Iron Pools, Microbial Communities, and Greenhouse Gas Production in Subaqueous Ecosystems: Implications for Biogeochemical Cycling


by
Roberta Pastorelli
1,*,†,
Alessandra Lagomarsino
1,†,
Chiara Ferronato
2,†,
Arturo Fabiani
1,
Sara Del Duca
3,
Stefano Mocali
1,
Livia Vittori Antisari
2 and
Gilmo Vianello
4
1
Research Centre for Agriculture and Environment, Consiglio per la Ricerca in Agricoltura e l’Analisi dell’Economia Agraria (CREA), 50125 Firenze, Italy
2
Department of Agricultural and Food Sciences, Alma Mater Studiorum—University of Bologna, 40126 Bologna, Italy
3
Research Centre for Genomics and Bioinformatics, Consiglio per la Ricerca in Agricoltura e l’Analisi dell’Economia Agraria (CREA), 29017 Fiorenzuola d’Arda, Italy
4
National Academy of Agriculture, 40121 Bologna, Italy
*
Author to whom correspondence should be addressed.
These authors contributed equally to this work.
Soil Syst. 2026, 10(3), 43; https://doi.org/10.3390/soilsystems10030043
Submission received: 8 January 2026 / Revised: 3 March 2026 / Accepted: 11 March 2026 / Published: 17 March 2026
(This article belongs to the Special Issue Microbial Community Structure and Function in Soils)

Abstract

In permanently submerged coastal wetlands, interactions between biogeochemical processes and microbial communities strongly influence greenhouse gas (GHG) fluxes. To improve our understanding of how redox-driven processes shape GHG dynamics in these ecosystems, we investigated the relationships among iron (Fe) pools, microbial dynamics, and the potential GHG production in subaqueous soils from an interdunal wetland in San Vitale Park (Italy), permanently submerged and affected by seasonal oscillations of the saline water table. Two subaqueous soil columns (WAS-2 and WAS-4), collected from similar settings, were analyzed. Surface layers of WAS-4 showed higher salinity and carbonate content, whereas WAS-2 was characterized by overall higher Fe concentrations. Distinct vertical distributions of organic matter and sulfur (S) were shown along depth. Laboratory incubations revealed that nitrous oxide (N2O) production was up to ten times higher in WAS-2 than in WAS-4, with peaks in the top 13–14 cm, consistent with more active nitrification-denitrification in surface layers. Methane (CH4) and carbon dioxide (CO2) fluxes decreased with depth, reflecting reduced availability of labile carbon. Methanomicrobiales dominated CH4-producing layers, indicating hydrogenotrophic methanogenesis, while amoA-carrying Nitrosomonadales and Thaumarchaeota, occurred in shallow, organic-rich layers where ammonia supported nitrification and denitrification. Denitrifiers mainly belonged to α- and β-Proteobacteria, consistent with their direct contribution to N2O peaks. Spearman’s correlations showed N2O positively correlated to sulfur and labile carbon (C), supporting denitrification under moderately reducing conditions. CH4 and CO2 positively correlated with organic C (Corg), total nitrogen (TN), and reactive Fe forms, reflecting redox-mediated microbial respiration and methanogenesis. Trace elements (B, Cr, Cu, Ni) acted as micronutrients or inhibitors depending on concentration. Canonical correspondence analysis indicated depth-structured links among gas fluxes, soil chemistry (Corg, TN, S/C, CaCO3, P), and microbial distributions: surface layers, rich in labile C and nutrients, supported active bacteria and archaea involved in decomposition, nitrification, and denitrification, whereas deeper layers hosted oligotrophic archaea adapted to inorganic substrates. Overall, Fe pools appeared to be associated with soil processes relevant to GHG dynamics, although the extent of their regulatory role remains uncertain due to potential alterations of redox-sensitive Fe fractions during sample handling. These results contribute to broader efforts to predict GHG emissions in submerged wetland soils by linking redox stratification, inorganic chemistry, and microbial functional groups.

1. Introduction

Iron (Fe) pools, microbial community dynamics, and greenhouse gas (GHG) emissions are closely interconnected components that play critical roles in biogeochemical cycles within subaqueous ecosystems such as wetlands and estuaries. These environments are ecologically vital, supporting biodiversity, improving water quality, mitigating floods, and offering habitats, among other functions [1,2,3]. At the same time, these ecosystems are extremely sensitive and vulnerable to changes and disturbances [4]. They are often characterized by fluctuating redox conditions due to variable water saturation, which drives the transformation of Fe into different chemical forms and influences microbial activity [5]. Iron, as a redox-sensitive element, readily switches between Fe(III) under oxic conditions and Fe(II) under reducing conditions, mediating numerous processes, including nutrient cycling, organic matter decomposition, and the formation of electron acceptors for microbial metabolism [6,7].
Microbial communities, particularly bacteria and archaea, are central to these biogeochemical processes [8]. Functional groups such as nitrifiers and denitrifiers participate in nitrogen (N) cycling, producing or consuming nitrous oxide (N2O), a potent GHG [9,10]. Nitrifiers, mainly ammonia-oxidizing bacteria (AOB) and archaea (AOA), oxidize ammonium generating nitrate (NO3) and, as a by-product, N2O, especially when oxygen availability fluctuates or becomes limiting [11]. Denitrifiers reduce nitrate and nitrite to gaseous forms (NO, N2O, N2) in oxygen-limited, carbon (C)-rich microenvironments, and their activity is highly sensitive to redox conditions and organic matter availability [11,12]. Thus, shifts in hydrology, oxygen penetration, and electron donor availability in subaqueous soils can strongly influence the relative contributions of nitrification and denitrification to N2O emissions [13]. Similarly, methanogenic archaea contribute to methane (CH4) production under anaerobic conditions [14] while methanotrophic bacteria can oxidize CH4, lowering its release to the atmosphere while increasing carbon dioxide (CO2) emissions [15]. These are linked to organic matter mineralization and influenced by microbial metabolism and redox transformations, including those involving Fe [16].
The pools of Fe are pivotal in shaping microbial community structure and function. Under anoxic conditions, ferric iron (Fe3+) is reduced to ferrous iron (Fe2+), serving as an electron acceptor for microbial respiration. Conversely, during aerobic phases, Fe(II) can oxidize, forming insoluble iron oxides that influence nutrient availability and microbial habitat structure [17]. These dynamic redox shifts create complex feedback loops between Fe pools, microbial activity, and GHG fluxes. Despite their importance, the interplay between these factors in subaqueous environments remains poorly understood. In fact, although Fe-mediated redox processes and microbial controls on GHG emissions have been widely investigated in wetlands and tidal marshes, depth-resolved coupling of operational Fe pools, microbial functional groups, and potential GHG production remains limited in permanently submerged, non-tidal Mediterranean subaqueous soils. In particular, few studies have examined how vertical redox stratification in Sulfic Psammowassents might shape microbial communities and modulate CH4 and N2O production potential. This study addresses this gap by integrating Fe operational pools, microbial fingerprinting, and incubation-based GHG production along soil depth in two contrasting subaqueous cores differing in salinity and carbonate content.
The San Vitale Park in Ravenna, Northern Italy, is a coastal region characterized by wetlands, dunes, and interdunal systems, forming a dynamic transition between aquatic and terrestrial ecosystems [18]. Its diverse hydrological and pedological gradients provide a unique natural laboratory for studying complex and biogeochemical processes in wetland subaqueous ecosystems. In particular, it offers an opportunity to explore the interplay between redox-sensitive elements, microbial diversity and activity [19,20], and GHG production.
This study aims to elucidate the relationships between Fe pools, microbial community composition, and potential GHG production in wetland and estuarine soils of the San Vitale Park as study area. This work is guided by the hypothesis that depth and Fe pools influence microbial metabolic pathways, thereby modulating the potential production of CO2, CH4 and N2O across soil horizons. Specifically, we hypothesized that reducing conditions and the accumulation of reactive Fe forms will favor methanogenic activity and CH4 release, whereas intermediate redox states will enhance nitrification–denitrification thus promoting N2O production.
The study investigates: (i) the distribution of bacterial and archaeal communities across soil horizons and their functional roles in nitrification, denitrification, and methanogenesis; (ii) the variations in N2O, CH4, and CO2 production across soil horizons and different redox conditions, based on controlled laboratory incubations; (iii) the influence of Fe pools on microbial activity and GHG dynamics.
The insights gained from this work will advance our knowledge of C and N cycling and their implications for climate change mitigation strategies.

2. Materials and Methods

2.1. The Study Area and Soil Sampling

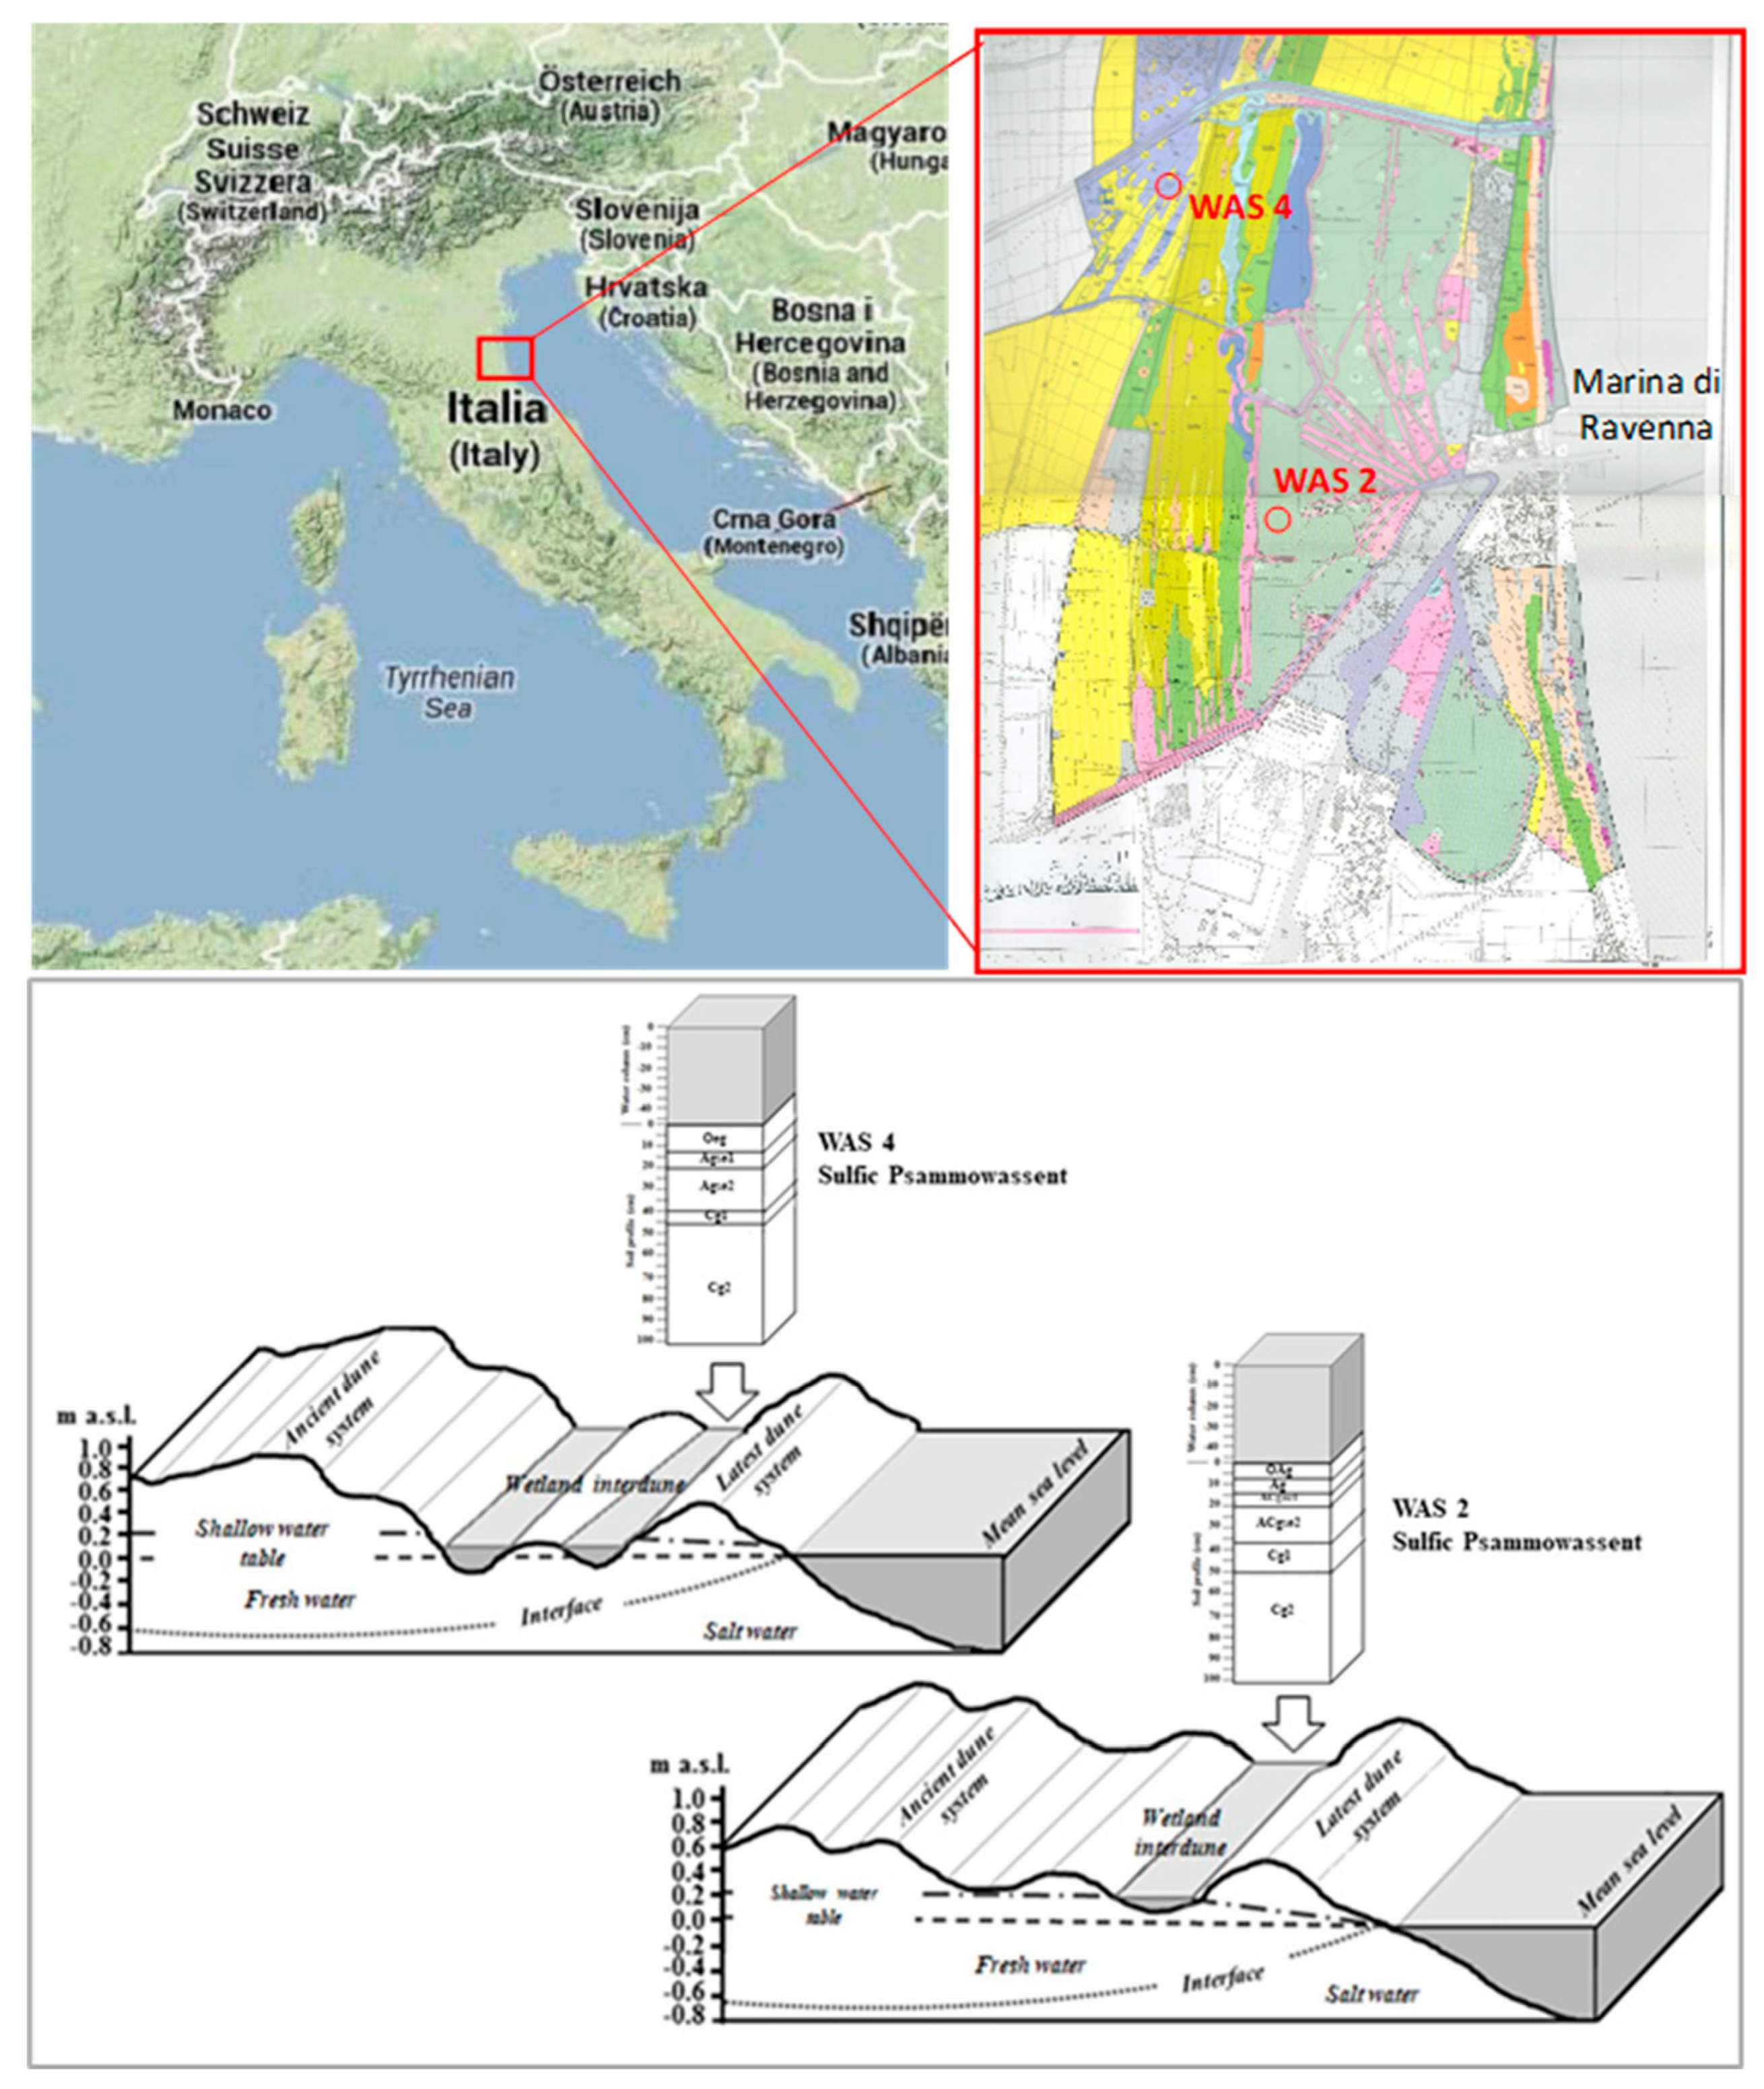
Two subaqueous soil columns (Figure 1 and Figure S1) were collected from the southern (WAS-2; UTM 33T: 0280287mE, 4929140mN) and northern (WAS-4; UTM 33T: 0280235mE, 4932688mN) areas of San Vitale Park, a 1222-hectare protected area within the EU’s Natura 2000 network, located in the Po Estuary Regional Park (Northern Italy). The soils in San Vitale Park have developed through processes of alluvial deposition and wetland formation, driven by the historical coastline evolution [21]. In recent times, soil formation has been further shaped by natural factors such as subsidence and saline intrusion, as well as anthropogenic activities like freshwater management [18]. The park experiences a coastal Mediterranean climate with approximately 600 mm of annual rainfall and an average temperature of 13 °C [22]. Groundwater levels and saline intrusion are influenced by rainfall, temperature, and evapotranspiration [23,24]. Overuse of the freshwater aquifer for agriculture has intensified saline intrusion and subsidence [25].
WAS-2 and WAS-4 occur in similar permanently submerged interdune wetlands not affected by tidal fluctuations but by seasonal oscillations of the saline water table. Water column depth ranges from 45 to 65 cm. Dissolved oxygen in the upper water layer (within 5 cm of the surface) ranges from 87 to 89 mg L−1, while at depth (within 5 cm of the bottom) it decreases to ~75 mg L−1. Salinity averages 18.4 ppt near the surface and increases to ~19 ppt toward the sediment–water interface. The sampling sites share a similar geomorphological setting and support comparable wetland vegetation dominated by Juncus spp. and halophyte species such as Arthocnemus fruticosum.
According to Soil Taxonomy [26], both profiles classify as Wassents, as they maintain a positive water potential at the soil surface for more than 21 h a day−1 throughout the year. Their permanent submergence and the absence of tidal dynamics instead promote seasonal redox transitions driven by saline water table fluctuations, potentially generating moderate vertical redox gradients rather than full oxic–anoxic alternation.
The soil columns were sampled using a Beeker vibracore sampler (Eijkelkamp, Giesbeek, The Netherlands) equipped with a 6 cm diameter polyethylene tube, following the protocol of McVey et al. [27]. To prevent oxygen infiltration, cores were immediately sealed with airtight stoppers and stored at 4 °C until laboratory analysis. Soil profiles were extracted, and each genetic horizon was described according to McVey et al. [27] (Table S1). Both profiles were classified as Psammowassent (subaqueous Entisols with less than 35% rock fragments and loamy fine sand texture in all layers) using the USDA Soil Taxonomy Keys [28].

2.2. Physicochemical Characterization of Soil Profiles

Physicochemical characterization was conducted on a single soil sample from each column and at each depth. Specifically, soil particle size distribution was determined by the pipette method [29]. Total electrical conductivity (EC; conductimeter Orion, Seoul, Republic of Korea) and pH (pH meter, Crison Instruments, Barcellona, Spain) measures of all samples were performed on 1:2.5 (w:v) soil:distilled water suspension. Organic carbon (Corg) and total nitrogen (TN) were measured by Duma’s combustion with an EA 1110 Thermo Fisher (Waltham, MA, USA) CHN elemental analyzer, after removing carbonates with 2 M HCl. Total carbonates (CaCO3) were quantified by volumetric method, according to [30].
Pseudo-total macro- and micronutrients concentrations were determined by Inductive Coupled Plasma–Optic Emission Spectroscopy (ICP-OES, Ametek, Meerbusch, Germany). Samples were digested with aqua regia (6 mL HCl and 2 mL HNO3 suprapure, Fluka, Buchs, Switzerland) in microwave oven (Millestone, 1200, Shelton, CT, USA) according to Vittori Antisari et al. [31] and detected with ICP-OES. Total sulfur (S) was determined after acid digestion (aqua regia) and ICP-OES analysis. This method quantifies total S without distinguishing between sulfate, sulfide-bound, or organically bound S fractions. Qualitative information on S redox conditions was obtained through standard pedological descriptors. Specifically, Table S1 includes the “odor (intensity/kind)” parameter as a Soil Survey-based proxy of sulfidic conditions. Additionally, USDA indicators on oxidized pH (initial and after 16 weeks) were added to evaluate the potential behavior of sulfidic materials upon exposure. These descriptors provide only qualitative context on S-redox conditions but cannot resolve specific S species [28]. Water exchanging organic C (WEOC) was extracted from 10 g of soil by shaking for 16 h with 100 mL of deionized water, centrifuged at 10,000 rpm for 15 min, filtered by Whatman 42 (Sartorius, Göttingen, Germania). The WOEC content was determined by TOC analyzer (TOC-UV series, Shimadzu Instruments, Columbia, MD, USA).
Iron pools were investigated through sequential extraction in wet and air-dry samples respectively. Wet samples were wet-sieved at 2 mm, centrifuged, and extracted on the same day to minimize oxidation of redox-sensitive Fe phases. Extractions were carried out according to the official methods for chemical soil analysis [32]. In particular, Fe was extracted with sodium pyrophosphate (Na4O7P2, pH 7) in order to detect the Fe linked to the humic compounds and with ammonium oxalate (C2H8N2O4, pH 3) in order to detect amorphous and poorly crystalline Fe. Citrate–bicarbonate–dithionite extraction was performed to quantify the total free pedogenetic Fe oxides. In both cases the Fe content was detected with ICP-OES. The Fe fractions were used as qualitative proxies of redox status, as shifts among more or less reducible Fe phases can reflect changes in soil redox conditions in waterlogged environments [33]. The extraction scheme does not selectively quantify Fe associated with sulfide minerals (e.g., FeS or FeS2). Therefore, potential Fe–S interactions are inferred indirectly from total S content and Fe pool distributions rather than from direct sulfide mineral quantification.

2.3. Potential GHGs Production Measurement

Potential GHG production was tested by incubating WAS-2 and WAS-4 soil samples (one soil sample for each column and at each depth) in 120 mL flasks sealed with silicone gas-tight caps. After 1 day equilibration at 28 °C, fresh samples were incubated at field anoxic conditions with site water using a 1:1 soil:water ratio (v:v). CH4, CO2, and N2O production was measured after 24, 72, 168 and 336 h. To this aim, headspace gas samples (25 mL) were collected with airtight syringes and injected into a pre-evacuated 12 mL glass Exetainer® vials (Labco Ltd., Lampeter, UK) with a septa screw cap (Labco Ltd., Lampeter, UK). GHG concentrations were analyzed using a GC-2014 (Shimadzu Scientific, Kyoto, Japan) gas chromatograph with detectors for N2O (ECD), CO2 (TCD), and CH4 (FID). Concentrations were converted to mass-per-volume using the Ideal Gas Law and expressed as mg g−1 based on flask headspace and soil sample weights. Cumulative emissions were calculated by summing concentrations across time points.

2.4. Microbial Characterization of Soil Profiles

Microbial community composition and structure were assessed using polymerase chain reaction-denaturing gradient gel electrophoresis (PCR-DGGE) targeting the V6–V8 and V3–V4 regions of bacterial and archaeal 16S rRNA gene, respectively. Functional groups involved in the N cycle were investigated by analyzing marker genes: amoA (ammonia monooxygenase, for bacterial- or archaeal-nitrifiers) and nirK and nirS (nitrite reductases, for denitrifiers). DNA was extracted from 0.5 g of one soil sample for each column and at each depth using the Fast DNA Spin Kit for soil (MP Biomedicals, Irvine, CA, USA) following the manufacturer’s guidelines.
PCR reactions were conducted in a MJ Research PTC-200TM thermocycler (BioRad, Hercules, CA, USA) in a 25-μL mixture using specific primer pairs conditions (Table S3). Three independent PCR amplifications were carried out, and the amplified products were pooled to reduce biases, loaded on polyacrylamide gels (acrylamide/bis 37.5:1) with a denaturing gradient obtained with a 100% denaturant solution consisting of 40% (v/v) deionised formamide and 7 M urea. Electrophoresis was carried out using an INGENY phour U–2 System (Ingeny International, Goes, The Netherlands) in 1X TAE buffer at constant voltage (80 V) and temperature (60 °C). Gels were stained with SYBR®GOLD (Molecular Probes, Eugene, OR, USA), and gel images were digitally captured under UV light using the Chemidoc XRS apparatus (BioRad, Hercules, CA, USA).
DGGE bands were excised, eluted from gels as described by Pastorelli et al. [34] and sequenced. Before sequencing, the selected bands were reamplified and checked on DGGE. Bands were sequenced by Macrogen Service (Macrogen Ltd., Seoul, Republic of Korea). The nucleotide sequences were deposited in the GenBank database under the accession numbers KY606752-KY606765 and KY606697-KY606751.

2.5. Statistical Analysis

Significant differences in soil samples from the two soil cores and at varying depth were analyzed with one-way analysis of variance (ANOVA), followed by Fisher’s LSD post hoc test (p < 0.05). Due to sampling design, the two soil columns cannot be treated as true replicates, as they represent distinct environmental conditions rather than samples of the same condition. Likewise, depth intervals within each column could not be analyzed as nested subsamples. For these reasons, multifactorial or nested statistical models were not applicable. Spearman’s correlation was applied to identify significant relationships among cumulate GHG emissions and soil variables using PAST software v4.03 [35]. DGGE banding patterns were normalized and analyzed with GelCompare II software v 4.6 (Applied Maths, Sint-Martens-Latem, Belgium), generating binary matrices based on band presence/absence and position. One-way analysis of similarities (ANOSIM) assessed differences in profiling between cores and depths. The matrices were imported into PAST for canonical correspondence analysis (CCA) to examine potential associations between microbial community structures (filled symbols) and soil variables (vectors), with significance determined through 999 permutation tests. Nucleotide sequence chromatograms were edited using Chromas Lite v2.01 (Technelysium Pty Ltd.; Tewantin, Old, Australia) to resolve ambiguities and converted to FASTA format. BLASTN and BLASTX identified closely related nucleotide or protein sequences in GenBank, respectively, and microbial taxonomy was assigned based on sequence similarity thresholds according to Webster et al. [36].

3. Results

3.1. Soil Characterization

Table 1 and Table S2 give an overall idea of the main soil characteristics, while in Supplementary Materials morphological features are reported (Table S1). Generally, soils had a loamy sand to sandy texture and the carbonate content range between 12 and 20%, with exception of the Oe and Ag1 soil horizon of WAS-4, which showed carbonate enrichment up to 30% (Table 1). Soil pH increases from neutral to alkaline along soil profile, while EC showed the opposite behavior, decreasing along soil depth, probably due to salt deposition in the soil surface. In fact, the main soil macro-elements linked to the saline water, such as P, K, S, and Na, also showed the same trend, highlighting the effect of shallowed saline water on the soil characteristics (Table 1). The organic C content and TN distribution was similar to that of terrestrial soil with a good organic endowment. WAS-4 showed higher content than WAS-2 in the topsoil (34 and 20 g kg−1 respectively), but in both soils, organic C decrease to 1% below 50 cm c.a. (Table 1).
In WAS-2 dried soils, most of Fe forms decreased with depth (Table 2), whereas the values of the index (d-o)/t-Fe (the ratio of dithionite-extractable Fe minus oxalate-extractable Fe to total Fe) became negative in the deepest layer, indicating that oxalate-extractable Fe exceeded dithionite-extractable Fe, pointing to a dominance of poorly crystalline or amorphous Fe forms at depth. In WAS-4 Fe concentration was overall much lower than in WAS-2, and the pattern with depth more was irregular. Similar trends were observed in wet soils, although not all layers were analyzed.
Indicators of S oxidation (oxidized pH) and the pedological odor descriptor (Table S1) showed consistent depth patterns. Horizons with slight and strong sulfurous odor displayed the largest declines in oxidized pH after 16 weeks, indicating the presence of reduced S compounds susceptible to acid generation upon oxidation. Layers with no sulfurous odor showed minimal pH change, suggesting limited sulfidic material.

3.2. Potential GHGs Production

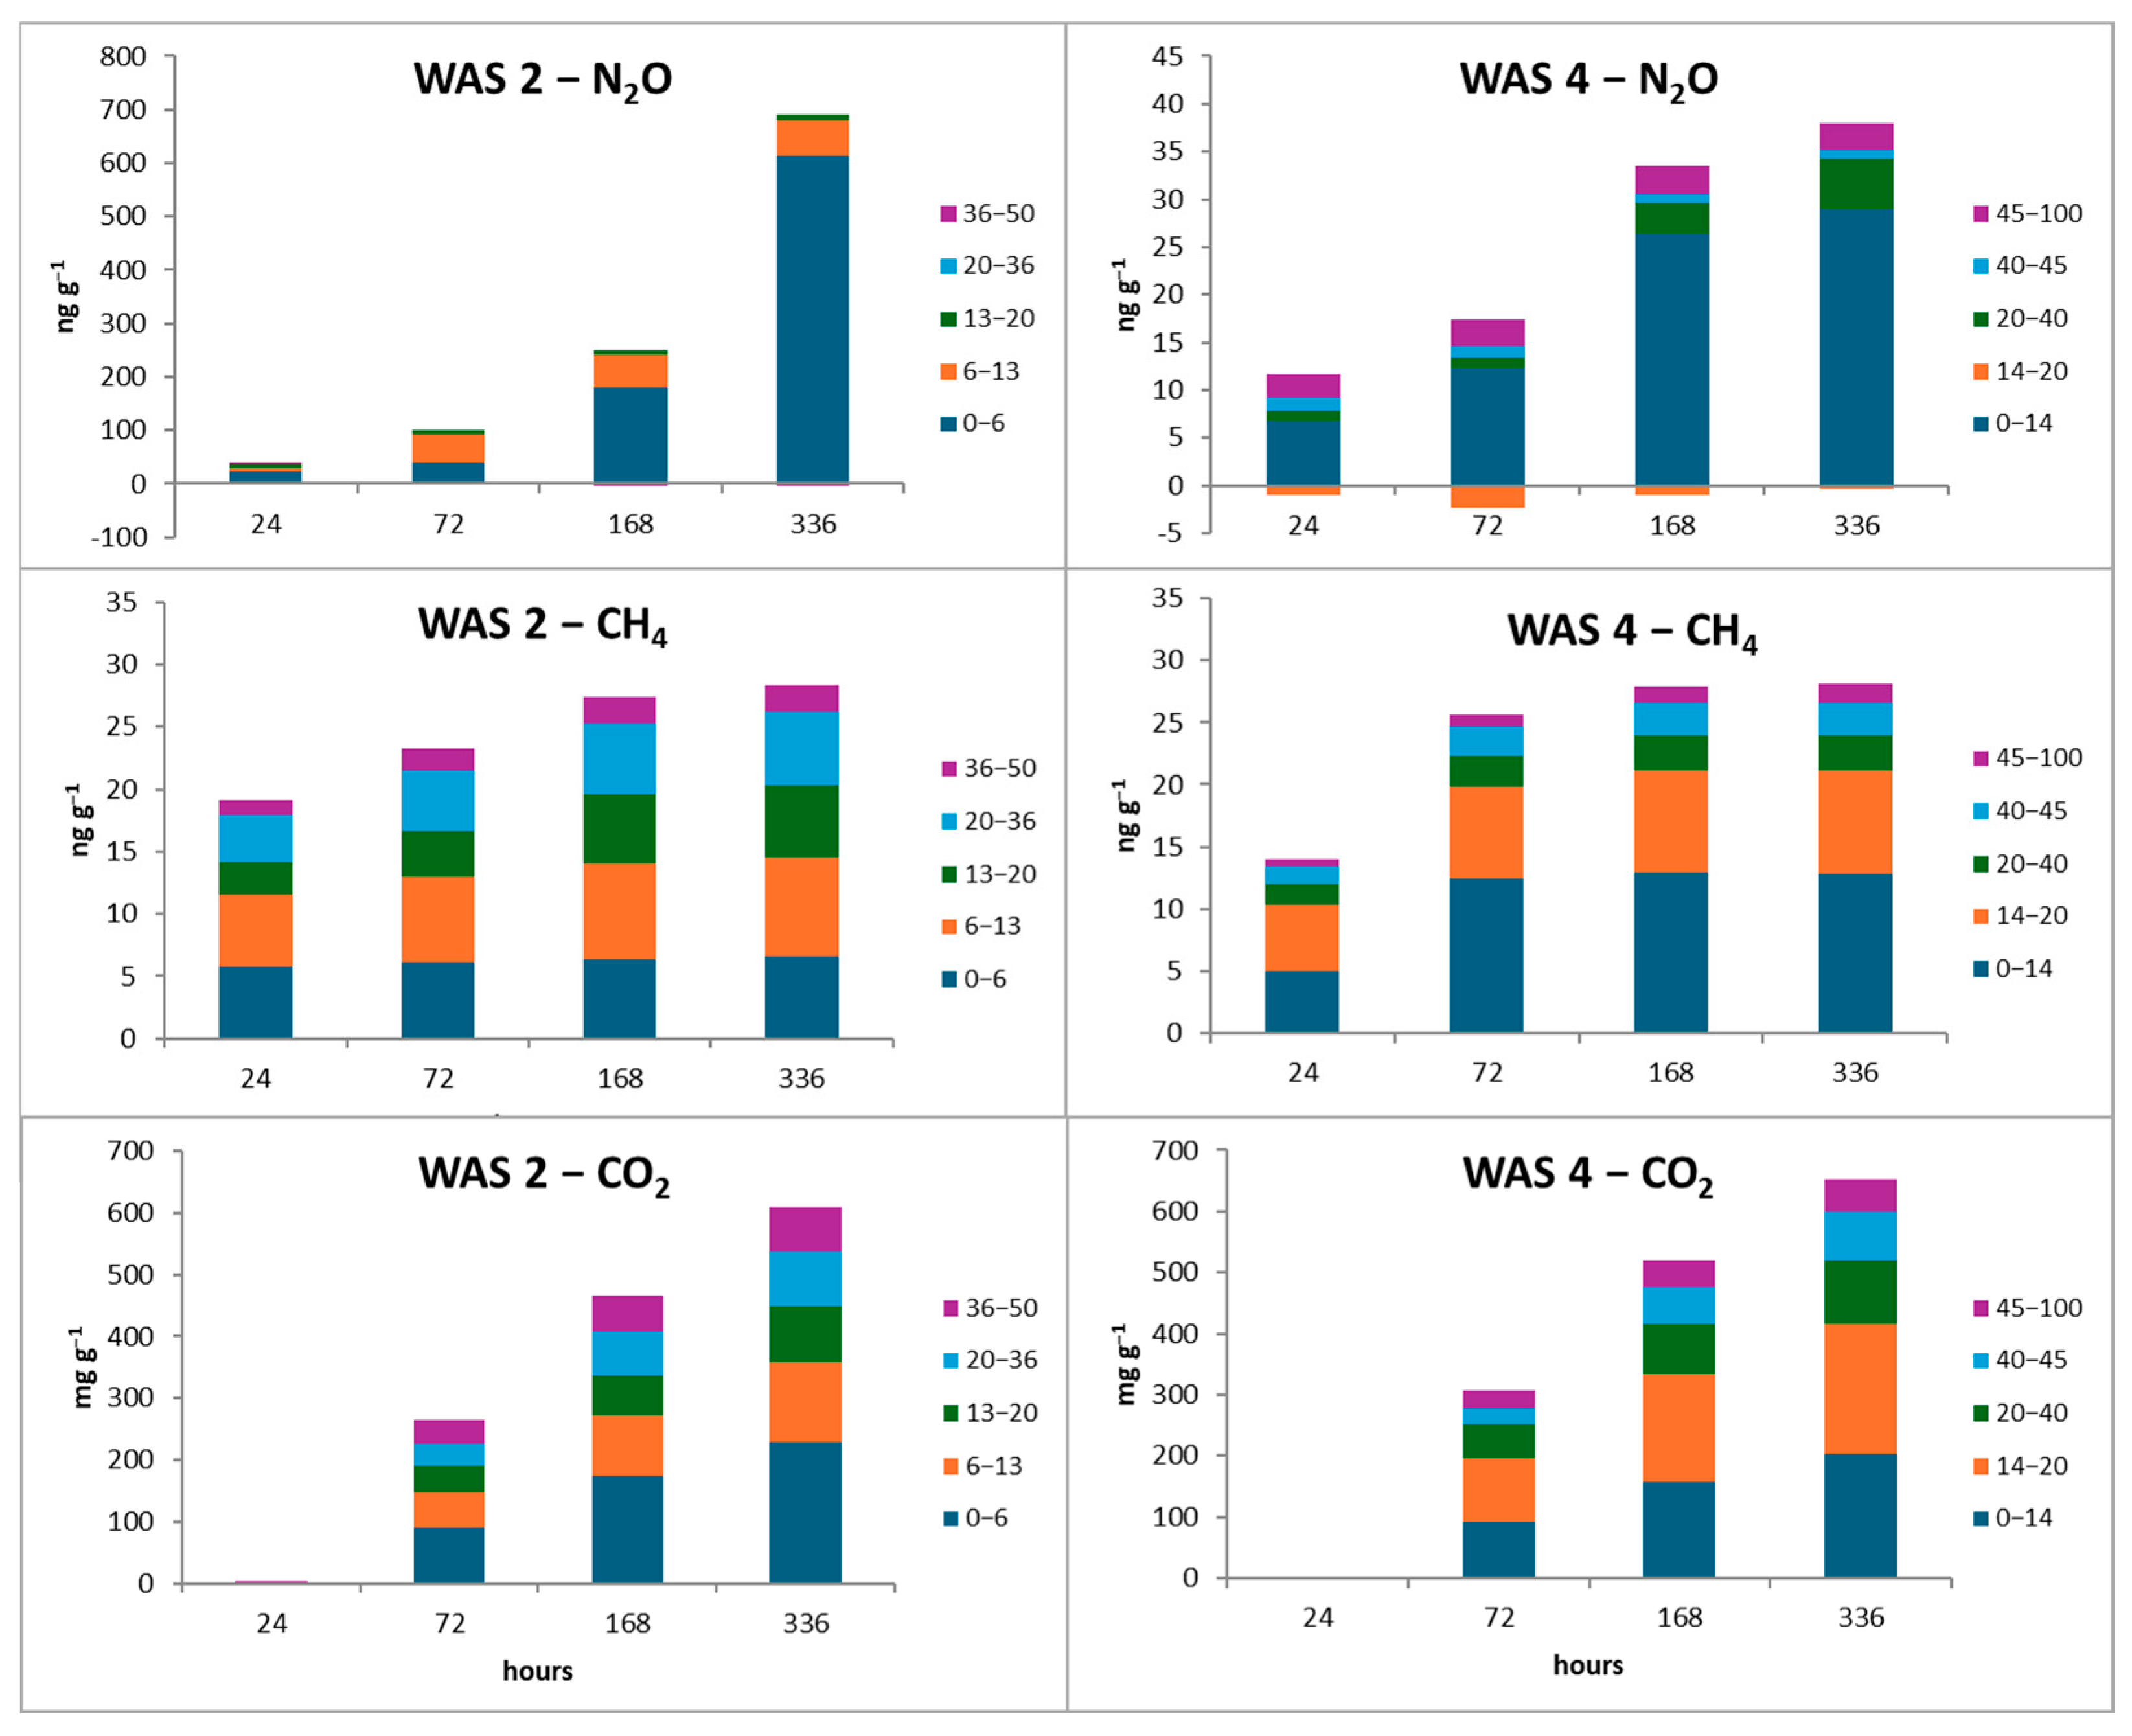
In general, N2O production was about tenfold higher in WAS-2 than in WAS-4 (Figure 2, top; Table S4), with the highest levels observed within the top 13–14 cm of soil. N2O production remained consistently high throughout the incubation period.
CH4 production was similar in the two soil columns, reaching a plateau after 7 days of incubation (Figure 2, middle; Table S4). For both sites, CH4 production reached the maximum value in the first 14 cm and decreased minimum values in the deeper horizons. CH4 production tended towards a plateau after 7 days of incubation. A similar depth-dependent trend was evident for CO2 production (Figure 2, bottom; Table S4), especially in WAS-2, where a clear stratification among soil layers was observed.

3.3. Soil Bacterial Community

DGGE generated fingerprints with numerous well-distributed bands across the gels for both soil cores and depths for most microbial groups, except for bacterial-amoA, which showed few bands limited to the top two soil layers (Figures S2, S3, S5, S8 and S10). ANOSIM analysis revealed significant stratification by soil depth for all microbial communities, excluding bacterial-amoA (Table 3).
Fourteen dominant bands excised from archaeal DGGE were identified as species within the Methanomicrobiales order of the Euryarchaeota phylum, associated with CH4 production (Table S5; Figure S4). Notably, one band, W2-met3, linked to Methanolinea mesophila, was detected at all soil depths. Using specific primers for the bacterial-amoA gene, dominant bands were identified as Nitrosomonadales species (Table S5; Figure S6). For archaeal amoA, BLASTN analysis indicated high similarity to uncultured archaeon in soil and sediment, while BLASTX analysis linked these bands to the hypothetical ammonia monooxygenase subunit A in Thaumarchaeota genera (Nitrososphaera, Nitrosopumilus, and Nitrosocosmicus) (Table S5; Figure S7). The number of the dominant nirK-amplified fragments decreased with soil depth and were attributed mainly to species within the α-Proteobacteria class (Table S5; Figure S9). In contrast, no nirS products were observed in the deepest layers and sequenced bands primarily corresponded to species within the β-Proteobacteria class (Table S5; Figure S11).

3.4. Correlation Analyses

Spearman’s correlations coefficients (R) revealed significant relationships (Table 4) between the potential productions of GHG (N2O, CH4, and CO2) and various soil properties and different forms of Fe (in dry and wet conditions).
N2O production was strongly positively correlated to S and WEOC, whereas CH4 and CO2 emissions to Corg, TN, S, and WEOC. All three GHG productions were negatively correlated with soil depth, and in the case of CH4 and CO2 also with nickel (Ni) (Table 4). Regarding correlation with the different Fe forms, CH4 showed positive correlations with dithionite-extractable Fe (d-Fe) and oxalate-extractable Fe (o-Fe) fractions, while CO2 production showed strong positive correlations with amorphous (amo-Fe), poorly crystalline (p-Fe), and crystalline (cry-Fe) iron species (Table 5).
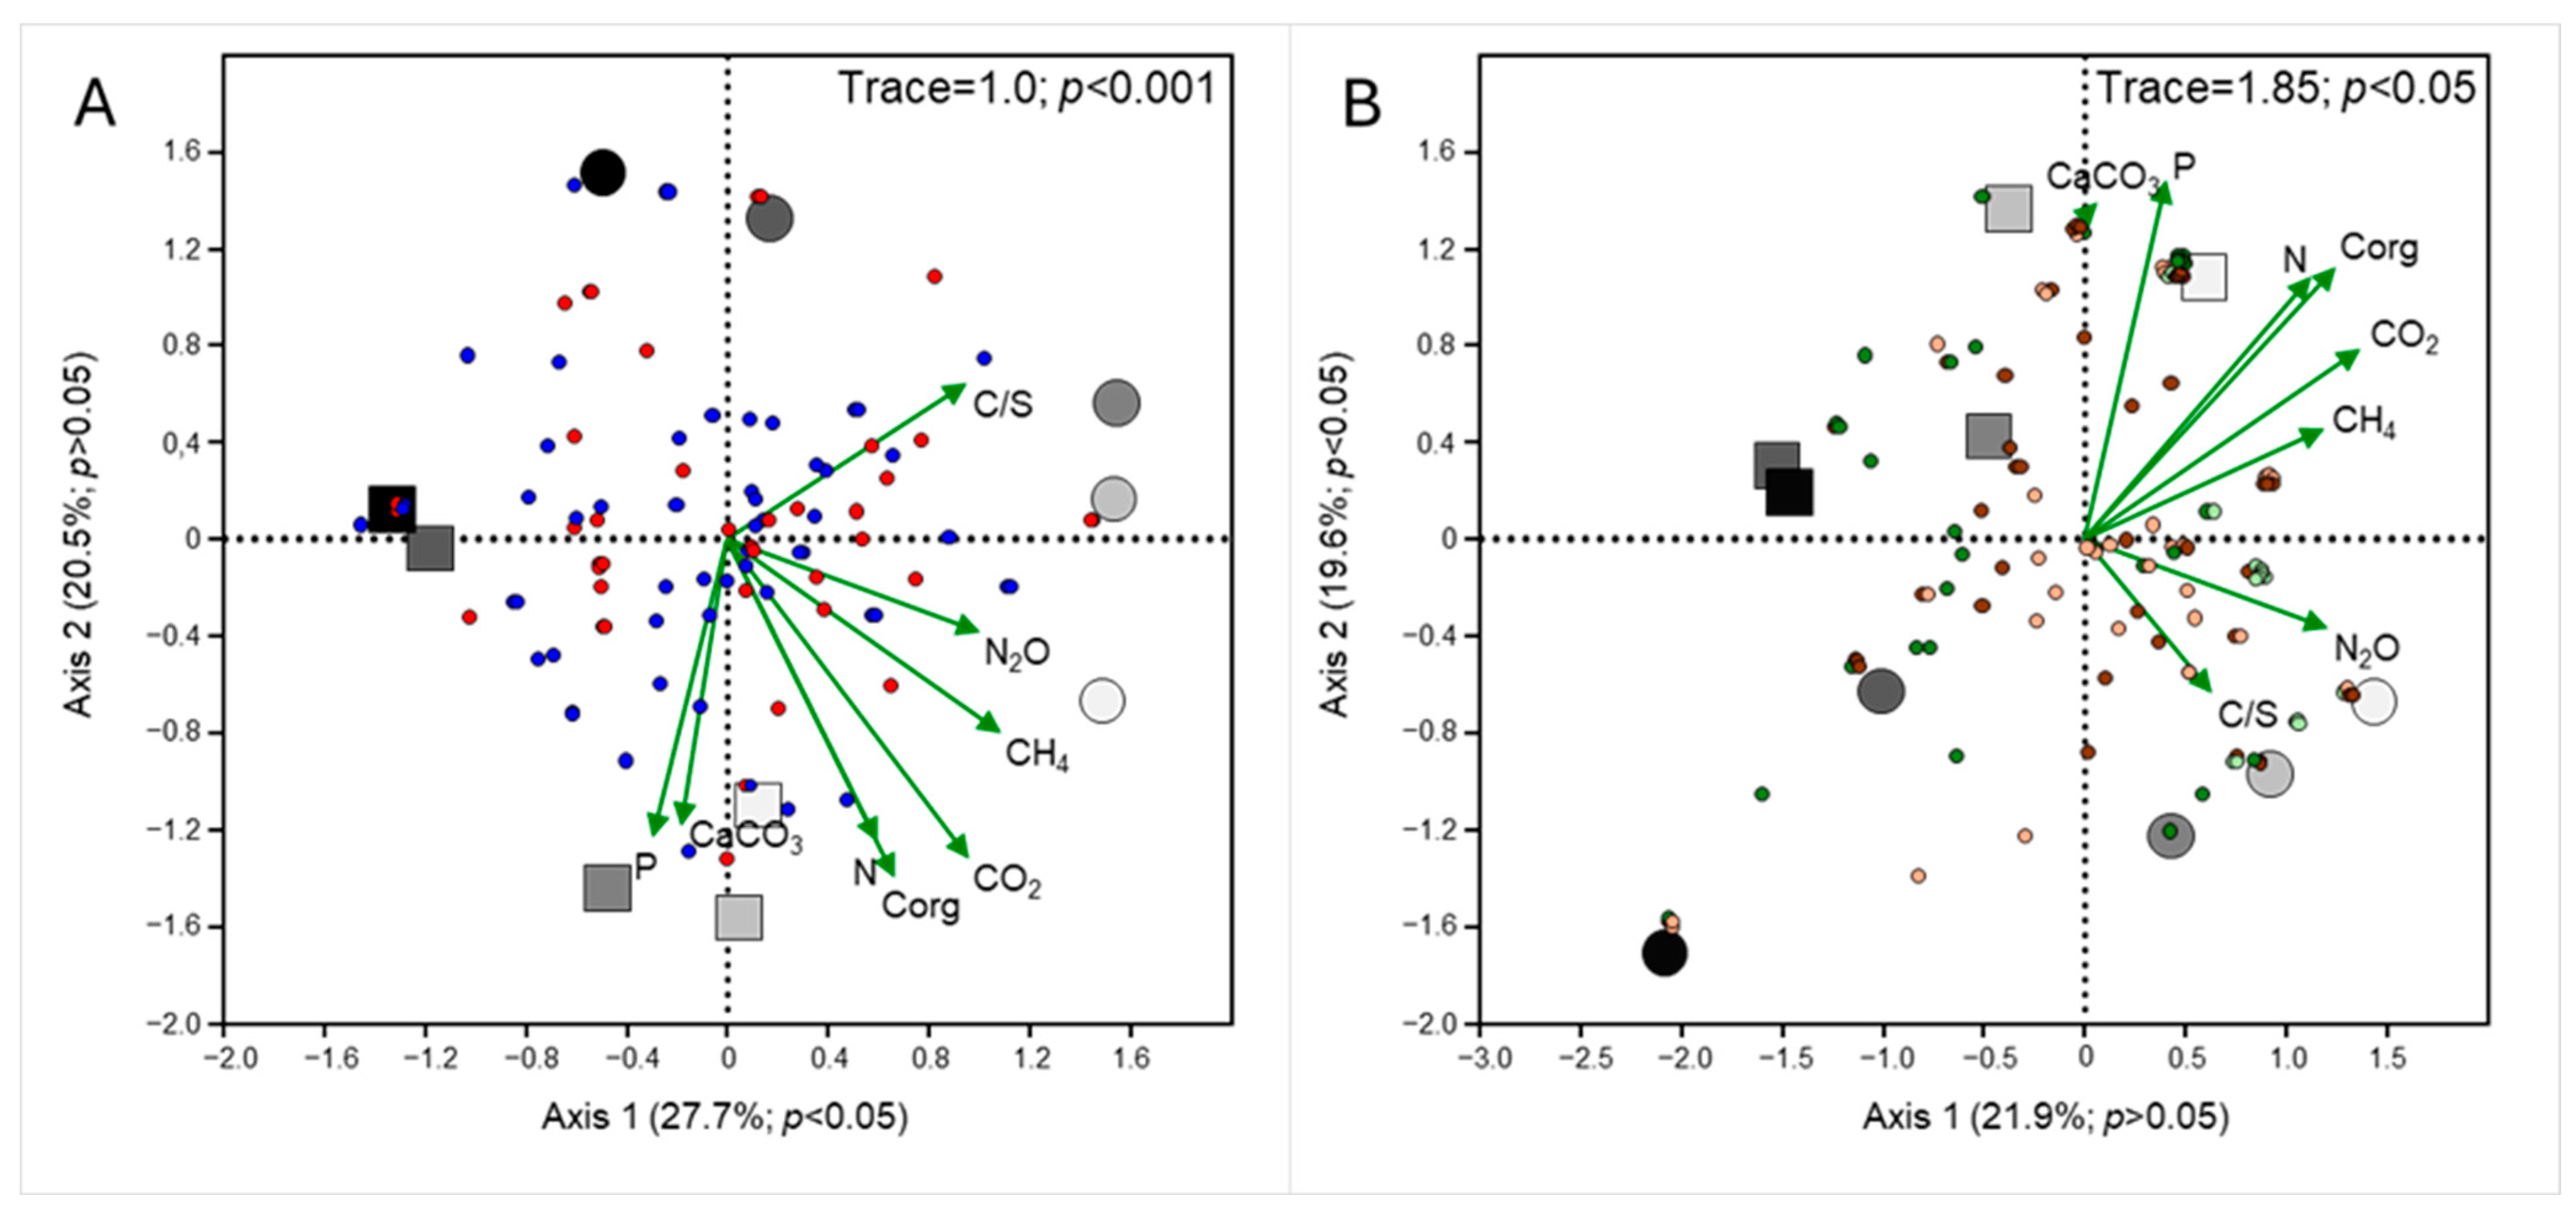
The results of the CCA revealed strong associations between environmental variables, microbial community distributions, and gas emissions across soil depths (Figure 3).
Regarding the analysis of bacterial and archaeal communities (Figure 3A), Axis 1 captured the largest proportion of the explained variance and was statistically significant (p = 0.027), representing a meaningful gradient, likely driven by variations in key environmental factors. This axis primarily reflected differences in gas fluxes, such as N2O and CH4 production, as well as nutrient cycling processes, including C/S ratio. Axis 2 was associated with variations in Corg and nutrient availability (N and P).
The analysis of microbial communities involved in N-cycle revealed similar trends. Axis 1, although not statistically significant (p = 0.19), represented the largest gradient and was associated with gas fluxes and organic matter content (Corg and N). Axis 2, which explained a significant (p = 0.048) high proportion of variance, was strongly influenced by CaCO3 and P.

4. Discussion

Our results indicate depth-related variations in operationally defined Fe pools consistent with redox stratification typical of permanently submerged soils [37]. In reducing environments, Fe(III) oxides may be transformed into more reactive or amorphous forms, influencing nutrient availability and microbial metabolism. In sulfidic subaqueous environments, Fe–S interactions (e.g., FeS formation) may further regulate the availability of reactive Fe and shape redox dynamics [38]. However, as specific sulfide-bound Fe was not quantified in this study, these processes can only be inferred indirectly.
In WAS-2, most of Fe forms decreased with depth, suggesting a progressive transformation or depletion of reactive Fe forms, potentially associated with sustained reducing conditions. In contrast, in WAS-4 Fe concentration showed a more irregular pattern, suggesting localized redox environments rather than uniform downward depletion.
The correlation analyses showed that potential N2O production was positively associated with S and WEOC. In addition, the analyses highlighted the critical role of labile C and nutrient availability in stimulating microbial processes, particularly nitrification and denitrification, which are the primary pathways for N2O production. The increased microbial activity observed by other authors in nutrient-rich or disturbed ecosystems, such as agricultural soils, aligns with these results [39]. Conversely, the negative correlations between potential N2O production and soil depth suggest that the microbial processes responsible for its generation were mainly concentrated in the upper soil layers, where oxygen fluctuations and organic matter availability are higher. In contrast, deeper layers, which are more stable and nutrient-poor, exhibited limited N2O production. The depth patterns observed are consistent with general expectations for vertically stratified redox environments, with upper soil layers typically providing conditions that could support coupled nitrification-denitrification [40,41], whereas in deeper layers NO3 il likely limited and NH4+ generally dominate [42], thereby constraining denitrification-derived N2O. Nevertheless, in the absence of direct measurements of NO3 and NH4+, the specific pathways contributing to N2O production cannot be precisely identified and should therefore be regarded as hypotheses rather than mechanistic conclusions. Notably, there was no significant correlation between N2O and Fe pools, suggesting that Fe dynamics may not directly regulate the microbial processes responsible for N2O generation [43].
Potential CH4 production was closely linked to Corg, TN, and WEOC. These results reflect the dependence of methanogenic archaea on organic substrates and N, which are more abundant in shallow layers. The positive correlations with S and chromium (Cr) suggest that these elements may further support methanogenesis. In contrast, negative correlation with depth, Ni, and boron (B) imply that specific chemical or physical conditions in deeper layers or potential toxicity of certain trace elements, can limit CH4 production. Interestingly, potential CH4 production was also influenced by Fe pools. In our dry soils, the positive correlations between CH4 and Fe forms often associated with poorly crystalline or amorphous Fe oxides (d-Fe and o-Fe) suggest that these pools influence redox dynamics in ways that facilitate methanogenesis. Similar trends were found in wet soils, where the reduction of Fe likely fosters anaerobic conditions favorable to CH4 formation. Derived Fe indices, such as the dithionite-to-total Fe ratio (d/t-Fe) and oxalate-to-dithionite Fe ratio (o/d-Fe), further underscore the role of reactive Fe species in mediating electron transfer during methanogenesis [44,45]. In addition, crystalline Fe-oxide phases such as magnetite and hematite can themselves enhance CH4 production by acting as solid electron shuttles, stimulating methanogenesis through redox-mediated electron transfer mechanisms [46,47] consistent with our positive correlations between CH4 and reactive Fe pools (d-Fe, o-Fe, cry-Fe, amo-Fe).
Fe cycling can interact with methanogenesis in multiple ways, in fact Fe(III) reduction may compete with methanogenesis for electron donors, potentially suppressing CH4 formation [44], while in other contexts Fe(III) or Fe(II) cycling can support anaerobic oxidation of methane [45]. In addition, although the Fe-S interactions were not directly quantified, the FeS/FeS2 formation and competition between sulfate-reducing bacteria and methanogens may also influence CH4 production by diverting electron donors away from methanogens [48].
Potential CO2 production exhibited strong positive correlations with Corg, TN, WEOC, and trace elements like S and copper (Cu), indicating that ecosystems rich in organic inputs act as hotspots for microbial respiration and organic matter decomposition. The negative correlation with soil depth reflected reduced substrate availability and microbial activity in deeper layers, where organic matter is less accessible. The influence of trace elements was contrasting: S and Cu showed positive correlations with potential CO2 production, whereas Ni exhibited a negative correlation. Although only total S was quantified, the vertical pattern of sulfurous odor, absent or slight in surface horizons and strongest at mid-depths in both columns, may suggest zones where reduced S-compounds are more likely to accumulate under moderately reducing conditions. Such environments typically support sulfate-reducing or sulfur-transforming pathways that generate CO2 and can compete with methanogenesis for electron donors [37]. Conversely, Cu and Ni likely play opposing roles in enzymatic processes, with Cu promoting and Ni inhibiting microbial respiration rates. Significant positive correlations were found with most Fe fractions under both dry and wet conditions highlighting the importance of Fe in enhancing microbial activity in both aerobic and anaerobic environments. Spearman’s correlation results suggested that amo-Fe, p-Fe, and cry-Fe iron species may facilitate microbial respiration and organic matter decomposition through redox interactions. Many anaerobic Fe(III)-reducing microorganisms use Fe(III) as terminal electron acceptor, coupling its reduction to the oxidation of organic matter, thereby promoting CH4 and CO2 production in anoxic soils [49]. Furthermore, Fe oxides also participate in abiotic redox reactions, including the formation of reactive oxygen species through Fenton-type processes, which can accelerate the oxidative breakdown of organic substrates [50]. These biotic and abiotic redox pathways often operate simultaneously within soils and sediments, as Fe(II)-Fe(III) cycling influences mineral transformations, microbial electron flow, and C mineralization dynamics [51]. Ecosystems rich in reactive Fe forms, such as wetlands, rice paddies, and floodplains, are significant sources of CH4 and CO2, introducing materials that modify Fe pools (e.g., amendment with biochar with Fe-binding properties [52] could mitigate GHG emissions in these ecosystems.
The vertical microbial patterns align with the expected redox gradients and support the proposed mechanisms linking Fe and S pools with N2O, CH4, and CO2 production across horizons. Consistently, the results of the CCA also revealed that soil horizons play a significant role in creating distinct niches for bacterial and archaeal taxa, in agreement with previous studies [53,54].
Shallow layers exhibited higher microbial activity, likely driven by the abundance of labile organic matter and nutrients [53,55]. These organic-rich layers favored bacteria and archaea involved in organic matter decomposition, nitrification, and methanogenesis. Methanogenic archaea, such as Methanomicrobiales, were prominent contributors to CH4 production in anoxic microsites [56]. Bacterial communities, including heterotrophic decomposers like Proteobacteria and nitrifiers such as Nitrosomonadales, may also be active, driving CO2 production through organic matter degradation [57]. In contrast, deeper soil layers showed a shift toward microbial communities dominated by archaea, for example ammonia-oxidizing archaea (Thaumarchaeota), which are adapted to nutrient-poor, carbonate-rich environments [58]. These microbes, along with S-oxidizing bacteria, relied on inorganic substrates like ammonia and sulfides as energy sources, reflecting the reduced availability of organic matter at depth. Sporadic bacterial and archaeal taxa were present in either surface or deep layers but likely played less significant roles [59].
Similarly, within the microbial communities involved in N-cycle, a clear separation between the shallow, organic-rich layers from deeper, inorganic-dominated layers was evident. Shallow layers supported nitrifiers, including ammonia-oxidizing bacteria (Nitrosomonas) and archaea (Nitrososphaera), which thrived in organic-rich conditions where substrates like ammonia were abundant. These microbes contributed to NO3 production, fueling denitrification processes. Denitrifiers, identified by the presence of nirK and nirS genes, were strongly linked to N2O production in surface soils. These findings are consistent with results obtained by Spearman’s correlation, suggesting that higher availability of organic matter supports anaerobic metabolism in denitrifiers. In deeper layers, denitrifiers persisted under more anoxic and reduced conditions, but their activity was likely limited by reduced NO3 availability. This finding is in line with research by Philippot et al. [60], which demonstrated the influence of soil oxygen levels and organic carbon availability on denitrifying communities responsible for N2O production. Additionally, other studies have shown that nirS-dentrifiers generally prefer consistently lower oxygen environments, while nirK-dentrifiers are less sensitive to oxygen presence [61,62].
Nitrifying archaea, primarily attributed to Nitrososphaerales and Nitropulus taxa, were distributed throughout the depth, exhibiting a clear distinction between the superficial and deep layers. This suggested a broader adaptability to varying oxygen and reductive conditions compared to their bacterial counterparts [63]. Their broader distribution highlights their potential role in N2O production across the soil profile rather than being confined to the surface layers. In contrast, the limited presence of nitrifying bacteria in deeper soils resonates with insights from Prosser and Nicol [64], who emphasized their sensitivity to declining oxygen levels with soil depth.
The CCA analyses also highlighted site-specific differences in microbial distribution and activity. In WAS-2, shallow layers appeared more biologically active, likely supporting diverse bacterial communities thriving on the higher organic matter and nutrient availability, resulting in elevated CO2, N2O, and CH4 production. In contrast, the shallow layers of WAS-4 exhibited lower microbial activity, potentially due to reduced organic inputs. Deeper layers of both columns reflected shifts toward archaeal communities more adapted to oligotrophic, nutrient-poor conditions, with reduced gas fluxes and reliance on inorganic substrates.

5. Conclusions

This study highlights the interplay between redox-sensitive elements, nutrient availability, and microbial processes driving GHG emissions in submerged soils. We provide depth-resolved evidence, within permanently submerged, non-tidal Mediterranean subaqueous soils, linking operational Fe pools, microbial functional groups, and potential N2O, CH4/CO2 production, a coupling that has been largely unexplored in these systems.
Although DGGE is a lower-resolution technique compared to high-throughput sequencing (NGS), it can still provide a low-cost and useful overview of the main microbial community patterns in these soils. Depth stratification shaped microbial community functions, with surface soils driving dynamic nutrient cycling and potential GHG production, while deeper soils supported specialized, low-activity communities focused on inorganic transformations and nutrient stabilization. Organic matter was identified as primary driver of potential N2O, CH4 and CO2 productions, emphasizing the role of labile substrates and nutrient dynamics in fueling microbial activity. Trace elements, including B, Cr, Cu, and Ni exhibited dual roles, acting as essential nutrients or potential toxins depending on their concentration.
Iron pools were associated with microbial processes such as methanogenesis and respiration, suggesting that reactive Fe forms (d-Fe and o-Fe) enhanced CH4 and CO2 emissions under anaerobic conditions, while crystalline Fe forms limited these processes. However, because the characterization of redox-sensitive Fe pools may have been influenced by sample oxidation (e.g., air drying), these relationships should be interpreted cautiously and not taken as definitive evidence that Fe acts as a key regulator under field conditions.
In shallow layers, bacteria dominate, driving rapid decomposition and nutrient cycling. In contrast, deeper soil layers, with limited organic resources and oligotrophic conditions, support specialized microbial communities like archaea, which rely on inorganic substrates for energy and ammonia, while denitrifiers are more active in oxygen-limited zones rich in organic matter, contributing to N2O production.
The management of submerged zones in estuarine ecosystems may offer opportunities to mitigate GHG emissions. Strategies such as water level control, organic amendments, and biochar application can potentially regulate Fe-associated pathways, suppress methanogenesis, and enhance C sequestration without increasing N2O emissions. However, based on our findings, the extent to which these strategies can be transferred to other coastal or estuarine environments is constrained by the limited spatial replication of this study and by the reliance on laboratory-based GHG measurements. The environmental heterogeneity among estuarine systems and the fact that laboratory incubations do not fully reproduce field conditions, suggest that the results presented here should be considered preliminary, requiring broader validation through studies encompassing multiple estuarine settings, in situ GHG flux measurements, and long-term evaluations of management outcomes.

Supplementary Materials

The following supporting information can be downloaded at: https://www.mdpi.com/article/10.3390/soilsystems10030043/s1. Table S1: Pedological characterization of WAS-2 and WAS-4 soil horizons; Table S2: Water exchanging organic carbon (WEOC) and micro-elements determined from WAS-2 and WAS-4 soil horizons; Table S3: Primer pairs used for PCR-DGGE of the different functional microbial groups assessed at different depths in submerged soils; Table S4. Cumulated values of N2O, CH4 and CO2 potential production obtained with a 14-day laboratory incubation of WAS-2 and WAS-4 soil columns from San Vitale Park; Table S5: Results of BLASTN and BLASTX search on sequenced DGGE bands; Figure S1. Overview of the soil sampling procedure. The images show the soil sampling site within the study area of San Vitale Park., a vertical soil profile at the sampling point, and the subsequent processing of the soil core both in the field and in the laboratory; Figure S2: DGGE profiles of bacterial 16S rDNA PCR products obtained from soil sampled; Figure S3: DGGE profiles of archaeal 16S rDNA PCR products obtained from soil sampled; Figure S4: Neighbor-joining tree built using 16S rDNA-PCR products sequenced and sequences of uncultured and cultured archaea of equivalent length, retrieved from the GenBank database (their accession numbers are given); Figure S5: DGGE profiles of bacterial (A) and archaeal (B) amoA gene PCR products obtained from soil sampled; Figure S6: Neighbor-joining tree built using amoA-PCR products sequenced and sequences of uncultured and cultured bacteria of equivalent length, retrieved from the GenBank database (their accession numbers are given); Figure S7: Neighbor-joining tree built using amoA-PCR products sequenced and sequences of uncultured and cultured archaea of equivalent length, retrieved from the GenBank database (their accession numbers are given); Figure S8: DGGE profiles of bacterial nirK PCR products obtained from soil sampled; Figure S9: Neighbor-joining tree built using nirK-PCR products sequenced and sequences of uncultured and cultured bacteria of equivalent length, retrieved from the GenBank database (their accession numbers are given); Figure S10: DGGE profiles of bacterial nirS PCR products obtained from soil sampled; Figure S11: Neighbor-joining tree built using nirS-PCR products sequenced and sequences of uncultured and cultured bacteria of equivalent length, retrieved from the GenBank database (their accession numbers are given). References [65,66,67,68] are cited in the Supplementary mMaterials.

Author Contributions

Conceptualization, R.P., C.F., A.L., S.M., L.V.A. and G.V.; methodology, R.P., C.F., A.L. and S.M.; formal analysis, R.P., C.F., A.L. and S.D.D.; investigation, R.P., C.F., A.L. and A.F.; resources, G.V.; data curation, R.P., C.F. and A.L.; writing—original draft preparation, R.P., C.F. and A.L.; visualization, R.P., C.F. and A.L. All authors have read and agreed to the published version of the manuscript.

Funding

This research received no external funding.

Data Availability Statement

Data that support the findings of this study are available on reasonable request from the corresponding author.

Acknowledgments

This article is dedicated to the memory of Carolina Chiellini, for her contribution to the early stages of this research. She left us too soon, but her presence remains alive in our hearts.

Conflicts of Interest

The authors declare no conflicts of interest.

References

  1. Barbier, E.B.; Hacker, S.D.; Kennedy, C.; Koch, E.W.; Stier, A.C.; Silliman, B.R. The value of estuarine and coastal ecosystem services. Ecol. Monogr. 2011, 81, 169–193. [Google Scholar] [CrossRef]
  2. De Groot, R.; Brander, L.; van der Ploeg, S.; Costanza, R.; Bernard, F.; Braat, L.; Christie, M.; Crossman, N.; Ghermandi, A.; Hein, L.; et al. Global estimates of the value of ecosystems and their services in monetary units. Ecosyst. Serv. 2012, 1, 50–61. [Google Scholar] [CrossRef]
  3. Ramesh Reddy, K.; DeLaume, D. Biochemistry of Wetlands. Science and Applications; Taylor & Francis: Abingdon, UK, 2008. [Google Scholar]
  4. Liu, M.; Hou, L.; Yang, Y.; Zhou, L.; Meadows, M.E. The case for a critical zone science approach to research on estuarine and coastal wetlands in the Anthropocene. Estuaries Coasts 2021, 44, 911–920. [Google Scholar] [CrossRef]
  5. Zhang, Z.; Furman, A. Soil redox dynamics under dynamic hydrologic regimes—A review. Sci. Total Environ. 2021, 763, 143026. [Google Scholar] [CrossRef] [PubMed]
  6. Gutknecht, J.L.; Goodman, R.M.; Balser, T.C. Linking soil process and microbial ecology in freshwater wetland ecosystems. Plant Soil 2006, 289, 17–34. [Google Scholar] [CrossRef]
  7. Sharma, N.; Wang, Z.; Catalano, J.G.; Giammar, D.E. Dynamic responses of trace metal bioaccessibility to fluctuating redox conditions in wetland soils and stream sediments. ACS Earth Space Chem. 2022, 6, 1331–1344. [Google Scholar] [CrossRef]
  8. Crowther, T.W.; Van den Hoogen, J.; Wan, J.; Mayes, M.A.; Keiser, A.D.; Mo, L.; Averill, C.; Maynard, D.S. The global soil community and its influence on biogeochemistry. Science 2019, 365, eaav0550. [Google Scholar] [CrossRef]
  9. Hayatsu, M.; Tago, K.; Saito, M. Various players in the nitrogen cycle, diversity and functions of the microorganisms involved in nitrification and denitrification. Soil Sci. Plant Nutr. 2008, 54, 33–45. [Google Scholar] [CrossRef]
  10. Aryal, B.; Gurung, R.; Camargo, A.F.; Fongaro, G.; Treichel, H.; Mainali, B.; Angove, M.J.; Ngo, H.H.; Guo, W. Nitrous oxide emission in altered nitrogen cycle and implications for climate change. Environ. Pollut. 2022, 314, 120272. [Google Scholar] [CrossRef] [PubMed]
  11. Lagomarsino, A.; Pastorelli, R. Role of microbial communities in methane and nitrous oxide fluxes and the impact of soil management. In Assessing the Microbiological Health of Ecosystems, 1st ed.; Hurst, C.J., Ed.; John Wiley & Sons Ltd.: Hoboken, NJ, USA, 2007; pp. 159–183. [Google Scholar]
  12. Zumft, W.G. Cell biology and molecular basis of denitrification. Microbiol. Mol. Biol. Rev. 1997, 61, 533–616. [Google Scholar]
  13. Jiang, Y.; Yin, G.; Li, Y.; Hou, L.; Liu, M.; Chen, C.; Zheng, D.; Wu, H.; Gao, D.; Zheng, Y.; et al. Saltwater incursion regulates N2O emission pathways and potential nitrification and denitrification in intertidal wetland. Biol. Fertil. Soils 2023, 59, 541–553. [Google Scholar] [CrossRef]
  14. Liu, D.Y.; Ding, W.X.; Jia, Z.J.; Cai, Z.C. Relation between methanogenic archaea and methane production potential in selected natural wetland ecosystems across. China Biogeosci. 2011, 8, 329–338. [Google Scholar] [CrossRef]
  15. Ho, A.; Angel, R.; Veraart, A.J.; Daebeler, A.; Jia, Z.; Kim, S.Y.; Kerckof, F.M.; Boon, N.; Bodelier, P.L.E. Biotic interactions in microbial communities as modulators of biogeochemical processes: Methanotrophy as a model system. Front. Microbiol. 2016, 7, 1285. [Google Scholar] [CrossRef]
  16. Lamers, L.P.; Van Diggelen, J.M.; Op den Camp, H.J.; Visser, E.J.; Lucassen, E.C.; Vile, M.A.; Jetten, M.S.M.; Smolders, A.J.P.; Roelofs, J.G.M. Microbial transformations of nitrogen; sulfur, and iron dictate vegetation composition in wetlands: A review. Front. Microbiol. 2012, 3, 156. [Google Scholar] [CrossRef]
  17. Bryce, C.; Blackwell, N.; Schmidt, C.; Otte, J.; Huang, Y.M.; Kleindienst, S.; Tomaszewski, E.; Shad, M.; Warter, V.; Peng, C.; et al. Microbial anaerobic Fe (II) oxidation–ecology, mechanisms and environmental implications. Environ. Microbiol. 2018, 20, 3462–3483. [Google Scholar] [CrossRef] [PubMed]
  18. Ferronato, C.; Falsone, G.; Natale, M.; Zannoni, D.; Buscaroli, A.; Vianello, G.; Antisari Vittori, L. Chemical and pedological features of subaqueous and hydromorphic soils along a hydrosequence within a coastal system (San Vitale Park; Northern Italy). Geoderma 2016, 265, 141–151. [Google Scholar] [CrossRef]
  19. Marinari, S.; Carbone, S.; Vittori Antisari, L.; Grego, S.; Vianello, G. Microbial activity and functional diversity in Psamment soils in a forested coastal dune-swale system. Geoderma 2012, 173–174, 249–257. [Google Scholar] [CrossRef]
  20. Papp, R.; Vittori Antisari, L.; Vianello, G.; Marabottini, R.; Marinari, S. Soil microbial activity in hydromorphic-subaqueous ecosystems: Processes and functional biodiveristy. EQA-Int. J. Environ. Qual. 2015, 18, 11–19. [Google Scholar]
  21. Bondesan, M.; Favero, V.; Viñals, M.J. New evidence on the evolution of the Po-delta coastal plain during the Holocene. Quat. Int. 1995, 29, 105–110. [Google Scholar] [CrossRef]
  22. Buscaroli, A.; Gherardi, M.; Vianello, G.; Vittori Antisari, L.; Zannoni, D. Soil survey and classification in a complex territorial system: Ravenna (Italy). EQA-Int. J. Environ. Qual. 2009, 2, 15–28. [Google Scholar]
  23. Amorosi, A.; Centineo, M.C.; Colalongo, M.L.; Fiorini, F. Millennial-scale depositional cycles from the Holocene of the Po Plain Italy. Mar. Geol. 2005, 222, 7–18. [Google Scholar] [CrossRef]
  24. Castiglioni, G.B.; Biancotti, A.; Bondesan, M.; Cortemiglia, G.C.; Elmi, C.; Favero, V.; Gasperi, G.; Marchetti, G.; Orombelli, G.; Pellegrini, G.B.; et al. Geomorphological map of the Po Plain, Italy, at a scale of 1:250 000. Earth Surf. Process Landf. 1999, 24, 1115–1120. [Google Scholar]
  25. Buscaroli, A.; Zannoni, D. Influence of ground water on soil salinity in the San Vitale Pinewood (Ravenna—Italy). Agrochimica 2010, 5, 303–320. [Google Scholar]
  26. Soil Survey Staff. Keys to Soil Taxonomy, 12th ed.; United States Department of Agriculture: Washington, DC, USA; Natural Resource Conservation Service: Washington, DC, USA, 2012. [Google Scholar]
  27. McVey, S.; Schoeneberger, P.J.; Turenne, J.; Payne, M.; Wysocki, D.A. Subaqueous soils (SAS) description. In Field Book for Describing and Sampling Soils; National Soil Survey Center Natural Resources Conservation Service U.S. Department of Agriculture: Washington, DC, USA, 2012. [Google Scholar]
  28. Soil Survey Staff. Keys to Soil Taxonomy, 11th ed.; United States Department of Agriculture: Washington, DC, USA; Natural Resources Conservation Service: Washington, DC, USA, 2010. [Google Scholar]
  29. Gee, G.W.; Bauder, J.W. Methods of Soil Analysis, Part 1—Physical and Mineralogical Methods; SSSA Book Series; Soil Science Society of America, American Society of Agronomy: Madison, WI, USA, 1986. [Google Scholar]
  30. Loeppert, R.H.; Suarez, D.L. Carbonate and gypsum. In Methods of Soil Analysis: Part 3 Chemical Methods, 1st ed.; Sparks, D.L., Page, A.L., Helmke, P.A., Loeppert, R.H., Soltanpour, P.N., Tabatabai, M.A., Johnston, C.T., Sumner, M.E., Eds.; SSSA Book Series; John Wiley & Sons, Inc.: Hoboken, NJ, USA, 1996; Volume 5, pp. 437–474. [Google Scholar]
  31. Vittori Antisari, L.; Dell’Abate, M.T.; Buscaroli, A.; Gherardi, M.; Nisini, L.; Vianello, G. Role of soil organic matter characteristics in a pedological survey: “Bosco Frattona” natural reserve. Geoderma 2010, 156, 302–315. [Google Scholar] [CrossRef]
  32. Colombo, C.; Miano, T. Metodi di Analisi Chimica del Suolo, 3rd ed.; Pubblicità & Stampa: Modugno, Italy, 2015. [Google Scholar]
  33. Clarkson, M.O.; Poulton, S.W.; Guilbaud, R.; Wood, R.A. Assessing the utility of Fe/Al and Fe-speciation to record water column redox conditions in carbonate-rich sediments. Chem. Geol. 2014, 382, 111–122. [Google Scholar] [CrossRef]
  34. Pastorelli, R.; Landi, S.; Trabelsi, D.; Piccolo, R.; Mengoni, A.; Bazzicalupo, M.; Pagliai, M. Effects of soil management on structure and activity of denitrifying bacterial communities. Appl. Soil Ecol. 2011, 49, 46–58. [Google Scholar] [CrossRef]
  35. Hammer, Ø.; Harper, D.A.; Ryan, P.D. Past: Paleontological statistics software package for education and data analysis. Palaeontol. Electron. 2001, 4, 9. [Google Scholar]
  36. Webster, N.S.; Taylor, M.W.; Behnam, F.; Lucker, S.; Rattei, T.; Whalan, S.; Horn, M.; Wagner, M. Deep sequencing reveals exceptional diversity and modes of transmission for bacterial sponge symbionts. Environ. Microbiol. 2010, 12, 2070–2082. [Google Scholar] [CrossRef]
  37. Marschner, P. Processes in submerged soils–linking redox potential; soil organic matter turnover and plants to nutrient cycling. Plant Soil 2021, 464, 1–12. [Google Scholar]
  38. Rickard, D.; Luther, G.W. Chemistry of iron sulfides. Chem. Rev. 2007, 107, 514–562. [Google Scholar] [CrossRef] [PubMed]
  39. Gao, B.; Xiao, D.; Yang, K.; Sun, M.; Luo, S.; Zhang, W.; Wang, K. Increased vegetation disturbance intensity reduces soil nutrients while enhancing microbial network interactions. Front. Microbiol. 2025, 16, 1634424. [Google Scholar] [CrossRef]
  40. Zhang, J.; Kolstad, E.L.; Zhang, W.; Vogeler, I.; Petersen, S.O. Modeling coupled nitrification–denitrification in soil with an organic hotspot. Biogeosciences 2023, 20, 3895–3917. [Google Scholar] [CrossRef]
  41. Verhoeven, E.; Decock, C.; Barthel, M.; Bertora, C.; Sacco, D.; Romani, M.; Sleutel, S.; Six, J. Nitrification and coupled nitrification-denitrification at shallow depths are responsible for early season N2O emissions under alternate wetting and drying management in an Italian rice paddy system. Soil Biol. Biochem. 2018, 120, 58–69. [Google Scholar] [CrossRef]
  42. Huang, W.; Chen, Q.; Ren, K.; Chen, K. Vertical distribution and retention mechanism of nitrogen and phosphorus in soils with different macrophytes of a natural river mouth wetland. Environ. Monit. Assess. 2015, 187, 97. [Google Scholar] [CrossRef]
  43. Visser, A.N.; Wankel, S.D.; Niklaus, P.A.; Byrne, J.M.; Kappler, A.A.; Lehmann, M.F. Impact of reactive surfaces on the abiotic reaction between nitrite and ferrous iron and associated nitrogen and oxygen isotope dynamics. Biogeosciences 2020, 17, 4355–4374. [Google Scholar] [CrossRef]
  44. Zhang, Y.; Huang, M.; Yu, K.; Xie, Y.; Wang, Y.; Wu, J.; Zheng, F.; Wu, S.; Li, S.; Sardans, J.; et al. Decreased CH4 emissions associated with methanogenic and methanotrophic communities and their interactions following Fe (III) fertiliser application in rice paddies. Geoderma 2023, 431, 116375. [Google Scholar] [CrossRef]
  45. Luo, D.; Meng, X.; Zheng, N.; Li, Y.; Yao, H.; Chapman, S.J. The anaerobic oxidation of methane in paddy soil by ferric iron and nitrate, and the microbial communities involved. Sci. Total Environ. 2021, 788, 147773. [Google Scholar] [CrossRef]
  46. Aromokeye, D.A.; Oni, O.E.; Tebben, J.; Yin, X.; Richter-Heitmann, T.; Wendt, J.; Nimzyk, R.; Littmann, S.; Tienken, D.; Kulkarni, A.C.; et al. Crystalline iron oxides stimulate methanogenic benzoate degradation in marine sediment-derived enrichment cultures. ISME J. 2021, 15, 965–980. [Google Scholar] [CrossRef]
  47. Zheng, S.; Wang, B.; Liu, F.; Wang, O. Magnetite production and transformation in the methanogenic consortia from coastal riverine sediments. J. Microbiol. 2017, 55, 862–870. [Google Scholar] [CrossRef] [PubMed]
  48. Spietz, R.L.; Payne, D.; Szilagyi, R.; Boyd, E.S. Reductive biomining of pyrite by methanogens. Trends Microbiol. 2022, 30, 1072–1083. [Google Scholar] [CrossRef]
  49. Laufer, K.; Byrne, J.M.; Glombitza, C.; Schmidt, C.; Jørgensen, B.B.; Kappler, A. Anaerobic microbial Fe (II) oxidation and Fe (III) reduction in coastal marine sediments controlled by organic carbon content. Environ. Microbiol. 2016, 18, 3159–3174. [Google Scholar] [CrossRef] [PubMed]
  50. Miller, C.J.; Wadley, S.; Waite, T.D. Fenton, photo-Fenton and Fenton-like processes. In Advanced Oxidation Processes for Water Treatment: Fundamentals and Applications; Stefan, M.I., Ed.; IWA Publishing: London, UK, 2017; p. 297. [Google Scholar]
  51. Kappler, A.; Emerson, D.; Gralnick, J.A.; Roden, E.E.; Muehe, E.M. Geomicrobiology of iron. In Ehrlich’s Geomicrobiology, 6th ed.; Ehrlich, H.L., Newman, D.K., Kappler, A., Eds.; CRC Press: Boca Raton, FL, USA, 2015; Volume 6, p. 635. [Google Scholar]
  52. Sang, Y.; Azimzadeh, B.; Olsen, J.; Rappaport, J.; Maguffin, S.C.; Martínez, C.E.; Reid, M.C. Systematic evaluation of methods for iron-impregnation of biochar and effects on arsenic in flooded soils. Environ. Sci. Pollut. Res. 2024, 31, 34144–34158. [Google Scholar] [CrossRef]
  53. Fierer, N.; Schimel, J.P.; Holden, P.A. Influence of drying–rewetting frequency on soil bacterial community structure. Microb. Ecol. 2003, 45, 63–71. [Google Scholar] [CrossRef]
  54. Naylor, D.; McClure, R.; Jansson, J. Trends in microbial community composition and function by soil depth. Microorganisms 2022, 10, 540. [Google Scholar] [CrossRef] [PubMed]
  55. Wan, L.; Cao, L.; Song, C.; Cao, X.; Zhou, Y. Regulation of the nutrient cycle pathway and the microbial loop structure by different types of dissolved organic matter decomposition in lakes. Environ. Sci. Technol. 2022, 57, 297–309. [Google Scholar] [CrossRef]
  56. Angel, R.; Claus, P.; Conrad, R. Methanogenic archaea are globally ubiquitous in aerated soils and become active under wet anoxic conditions. ISME J. 2011, 6, 847–862. [Google Scholar] [CrossRef]
  57. Wang, C.; Wu, R.; Song, Y.; Guo, J.; Liu, R.; Cui, Y. Differences in nitrification and ammonium-oxidising prokaryotes in the process of wetland restoration. J. Environ. Sci. Health A 2020, 56, 136–144. [Google Scholar] [CrossRef]
  58. Eilers, K.G.; Debenport, S.; Anderson, S.; Fierer, N. Digging deeper to find unique microbial communities: The strong effect of depth on the structure of bacterial and archaeal communities in soil. Soil Biol. Biochem. 2012, 50, 58–65. [Google Scholar] [CrossRef]
  59. Zhou, J.; Ning, D. Stochastic community assembly: Does it matter in microbial ecology? Microbiol. Mol. Biol. Rev. 2017, 81, e00002-17. [Google Scholar] [CrossRef] [PubMed]
  60. Philippot, L.; Hallin, S.; Schloter, M. Ecology of denitrifying prokaryotes in agricultural soil. Adv. Agron. 2007, 96, 249–305. [Google Scholar]
  61. Graham, D.W.; Trippett, C.; Dodds, W.K.; O’Brien, J.M.; Banner, E.B.; Head, I.M.; Smith, M.S.; Yang, R.K.; Knapp, C.W. Correlations between in situ denitrification activity and nir-gene abundances in pristine and impacted prairie streams. Environ. Pollut. 2010, 158, 3225–3229. [Google Scholar] [CrossRef]
  62. An, T.; Wang, F.; Ren, L.; Ma, S.; Li, S.; Liu, L.; Wang, J. Ratio of nitrate to ammonium mainly drives soil bacterial dynamics involved in nitrate reduction processes. Appl. Soil Ecol. 2022, 169, 104164. [Google Scholar] [CrossRef]
  63. Wright, C.L.; Lehtovirta-Morley, L.E. Nitrification and beyond metabolic versatility of ammonia oxidising archaea. ISME J. 2023, 17, 1358–1368. [Google Scholar] [CrossRef] [PubMed]
  64. Prosser, J.I.; Nicol, G.W. Archaeal and bacterial ammonia-oxidisers in soil, the quest for niche specialisation and differentiation. Trends Microbiol. 2012, 20, 523–531. [Google Scholar] [CrossRef] [PubMed]
  65. Nübel, U.; Engelen, B.; Felske, A.; Snaidr, J.; Wieshuber, A.; Amann, R.I.; Ludwig, W.; Backhaus, H. Sequence heterogeneities of genes encoding 16S rRNAs in Paenibacillus polymyxa detected by temperature gradient gel electrophoresis. J. Bacteriol. 1996, 178, 5636–5643. [Google Scholar] [CrossRef]
  66. Watanabe, T.; Asakawa, S.; Nakamura, A.; Nagaoka, K.; Kimura, M. DGGE method for analyzing 16S rDNA of methanogenic archaeal community in paddy field soil. FEMS Microbiol. Let. 2004, 232, 153–163. [Google Scholar] [CrossRef]
  67. Xu, M.; Schnorr, J.; Keibler, B.; Simon, H.M. Comparative analysis of 16S rRNA and amoA genes from archaea selected with organic and inorganic amendments in enrichment culture. Appl. Environ. Microbiol. 2012, 78, 2137–2146. [Google Scholar] [CrossRef]
  68. Throbäck, I.N.; Enwall, K.; Jarvis, Å.; Hallin, S. Reassessing PCR primers targeting nirS, nirK and nosZ genes for community surveys of denitrifying bacteria with DGGE. FEMS Microbiol. Ecol. 2004, 49, 401–417. [Google Scholar] [CrossRef] [PubMed]
Figure 1. Localization and depth profile of the collected soil columns within the study area of San Vitale Park.
Soilsystems 10 00043 g001
Figure 2. Cumulated fluxes of N2O (top), CH4 (middle) and CO2 (bottom) determined under controlled laboratory conditions from WAS-2 (left) and WAS-4 (right) soil columns from San Vitale Park.
Soilsystems 10 00043 g002
Figure 3. Canonical correspondence analysis (CCA) ordination diagram of microbial communities and environmental variables defined by the first and second axes. The percentage of explained variation and significance for each axis are indicated, with global significance displayed in the top-right of the diagram. Plot (A) is based on DGGE banding patterns of bacterial (blue dots) and archaeal (red dots) 16S rDNA; plot (B) is based on DGGE banding patterns of bacterial (light green dots) and archaeal (dark green dots) amoA, nirK (dark brown dots), and nirS (light brown dots) genes. Soil microbial communities from the two cores are represented by circles (WAS-2) and squares (WAS-4), with increasing gray intensity indicating greater soil depth. Green vectors represent organic C (Corg); total N content (N); total P content (P); C/S ratio, carbonates (CaCO3), N2O, CH4, and CO2 fluxes.
Soilsystems 10 00043 g003
Table 1. Main chemical characteristics of WAS-2 and WAS-4 soil horizons.
ColumnSoilDepthMasterTextpHECCaCO3CorgTNC/SKPSMgNaAlCaFeMn
Classification(cm) (dS m−1)(g kg−1)
WAS-2Sulfic
Psammowassent
0–6OAgLS6.54.4122.820.61.96.33.80.33.38.83.012.340.811.40.4
6–13AgLS6.73.1122.021.21.95.74.30.33.79.23.014.241.312.40.4
13–20ACgse1SL6.22.4123.813.71.58.82.40.21.64.91.37.920.76.90.2
20–36ACgsse2LS7.42.5164.03.80.65.83.70.30.78.91.512.448.511.70.5
36–50CgS8.42.2160.91.20.311.83.50.30.18.81.311.949.113.20.4
WAS-4Sulfic
Psammowassent
0–14OegSL6.921.5280.453.86.26.32.31.48.613.431.74.394.544.71.6
14–20Agse1SL7.016.2337.333.83.66.22.20.85.511.819.85.7101.234.71.6
20–40Agse2LS7.111.5194.717.11.65.31.40.53.210.17.66.581.015.61.2
40–45Cg1S7.96.8122.03.40.22.20.90.31.59.53.77.244.211.20.4
45–100Cg2Sn.d.n.d.108.71.80.01.60.80.41.110.32.27.539.711.70.4
Horizon master: g = gleying. Field texture class (Text): LS = loamy sand; SL = sandy loam; S = sandy; EC = electrical conductivity; Corg = total organic carbon; TN = total nitrogen; WEOC = water exchanging organic carbon.
Table 2. Iron speciation of WAS-2 and WAS-4 soil horizons, expressed as concentrations (mg kg−1) of the different fractions measured under both dry and wet conditions.
ColumnDepth (cm)Dry Soils
t-Fed-Feo-Fep-Fed/t-Fe(d-o)/t-Feo/d-FeCry-FeAmo-FeCom-Fe
WAS-20–644.6833.629.603.490.750.540.2924.026.123.49
6–1334.6627.309.654.340.790.510.3517.655.314.34
13–2015.607.265.101.380.470.140.702.163.711.38
20–3611.190.980.830.260.090.010.840.160.560.26
36–5011.700.560.650.120.05−0.011.15−0.090.520.12
WAS-40–1412.432.041.600.260.160.040.780.441.340.26
14–206.952.021.860.230.290.020.920.151.630.23
20–4011.662.362.020.160.200.030.860.331.860.16
40–45n.d.n.d.n.d.n.d.n.d.n.d.n.d.n.d.n.d.n.d.
45–10013.182.562.520.170.190.000.980.042.350.17
ColumnDepth (cm)Wet Soils
t-Fed-Feo-Fep-Fed/t-Fe(d-o)/t-Feo/d-FeCry-FeAmo-FeCom-Fe
WAS-20–644.6845.3017.357.77n.d.n.d.0.38n.d.9.577.77
6–1334.6623.059.706.15n.d.n.d.0.42n.d.3.556.15
13–2015.605.595.322.37n.d.n.d.0.950.272.952.37
20–3611.190.930.660.39n.d.n.d.0.710.270.270.39
36–5011.70n.d.n.d.n.d.n.d.n.d.n.d.n.d.n.d.n.d.
WAS-40–1412.432.041.610.370.160.030.790.431.250.37
14–206.951.500.930.240.220.080.620.570.700.24
20–4011.661.701.360.420.150.030.800.340.940.42
40–45n.d.n.d.n.d.n.d.n.d.n.d.n.d.n.d.n.d.n.d.
45–10013.182.53n.d.0.530.190.19n.d.n.d.n.d.0.53
t-Fe = total iron; d-Fe = dithionite extractable iron; o-Fe = oxalate-extractable iron; Fe; p-Fe, poor crystalline iron; amo-Fe = amorphous iron; cry-Fe = crystalline iron; com-Fe = combined iron.
Table 3. ANOSIM global test based on the Dice similarity matrices of DGGE profiles for each microbial group analyzed (bacteria, archaea, bacterial- and archaeal-nitrifiers, nirK- and nirS-denitrifiers).
BacteriaArchaeaBact-amoAArch-amoAnirKnirS
R0.6570.79310.6720.6570.580
p0.00010.00010.3330.0040.00010.0101
Table 4. Spearman’s correlation coefficients (R) between potential N2O, CH4, and CO2 production, and depth and soil chemical factors, across soil cores. Only significant correlations are shown, significant levels denoted as p < 0.05 (*), p < 0.01 (**), p < 0.001 (***).
DepthCorgTNSBCrCuNiWEOC
N2O−0.74 * 0.65 * 0.57 *
CH4−0.86 **0.94 ***0.94 ***0.84 **0.94 ***−0.66 *0.83 **−0.78 **
CO2−0.89 ***0.90 ***0.92 ***0.85 **0.90 *** 0.73 *−0.75 *
Corg = total organic carbon; TN = total nitrogen; WEOC = water exchanging organic carbon.
Table 5. Spearman’s correlation coefficients (R) between potential N2O, CH4, and CO2 production, and Fe pools factors, across soil depths. Only significant correlations are shown, significant levels denoted as p < 0.05 (*), p < 0.01 (**).
Dry SoilsWet Soils
t-Fed-Feo-Fep-Fed/t-Fe(d-o)/t-Feo/d-FeCry-FeAmo-FeCom-Fet-Fed-Feo-FeAmo-Fe
N2O
CH4 0.83 *0.76 * 0.74 *0.86 *−074 **0.81 *0.78 * 0.79 *0.79 *0.79 *
CO20.74 *0.86 **0.83 *0.86 **0.86 **0.93 **−0.86 **0.88 **0.81 *0.86 **0.74 *0.89 *0.89 *0.89 *
t-Fe = total iron; d-Fe = dithionite extractable iron; o-Fe = oxalate-extractable iron; p-Fe = poor crystalline iron; amo-Fe = amorphous iron; cry-Fe = crystalline iron; com-Fe = combined iron.
Disclaimer/Publisher’s Note: The statements, opinions and data contained in all publications are solely those of the individual author(s) and contributor(s) and not of MDPI and/or the editor(s). MDPI and/or the editor(s) disclaim responsibility for any injury to people or property resulting from any ideas, methods, instructions or products referred to in the content.