Article

Tillage Intensity Shapes Soil Carbon Stabilization Pathways Differently in Contrasting Soil Textures: 11-Year Field Experiments


Biotechnical Faculty, University of Ljubljana, Jamnikarjeva 101, 1000 Ljubljana, Slovenia
*
Author to whom correspondence should be addressed.
Soil Syst. 2026, 10(3), 35; https://doi.org/10.3390/soilsystems10030035
Submission received: 9 January 2026 / Revised: 12 February 2026 / Accepted: 18 February 2026 / Published: 25 February 2026

Abstract

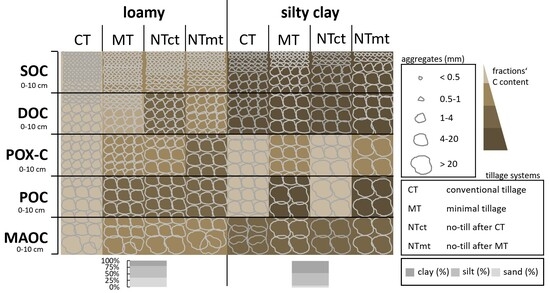
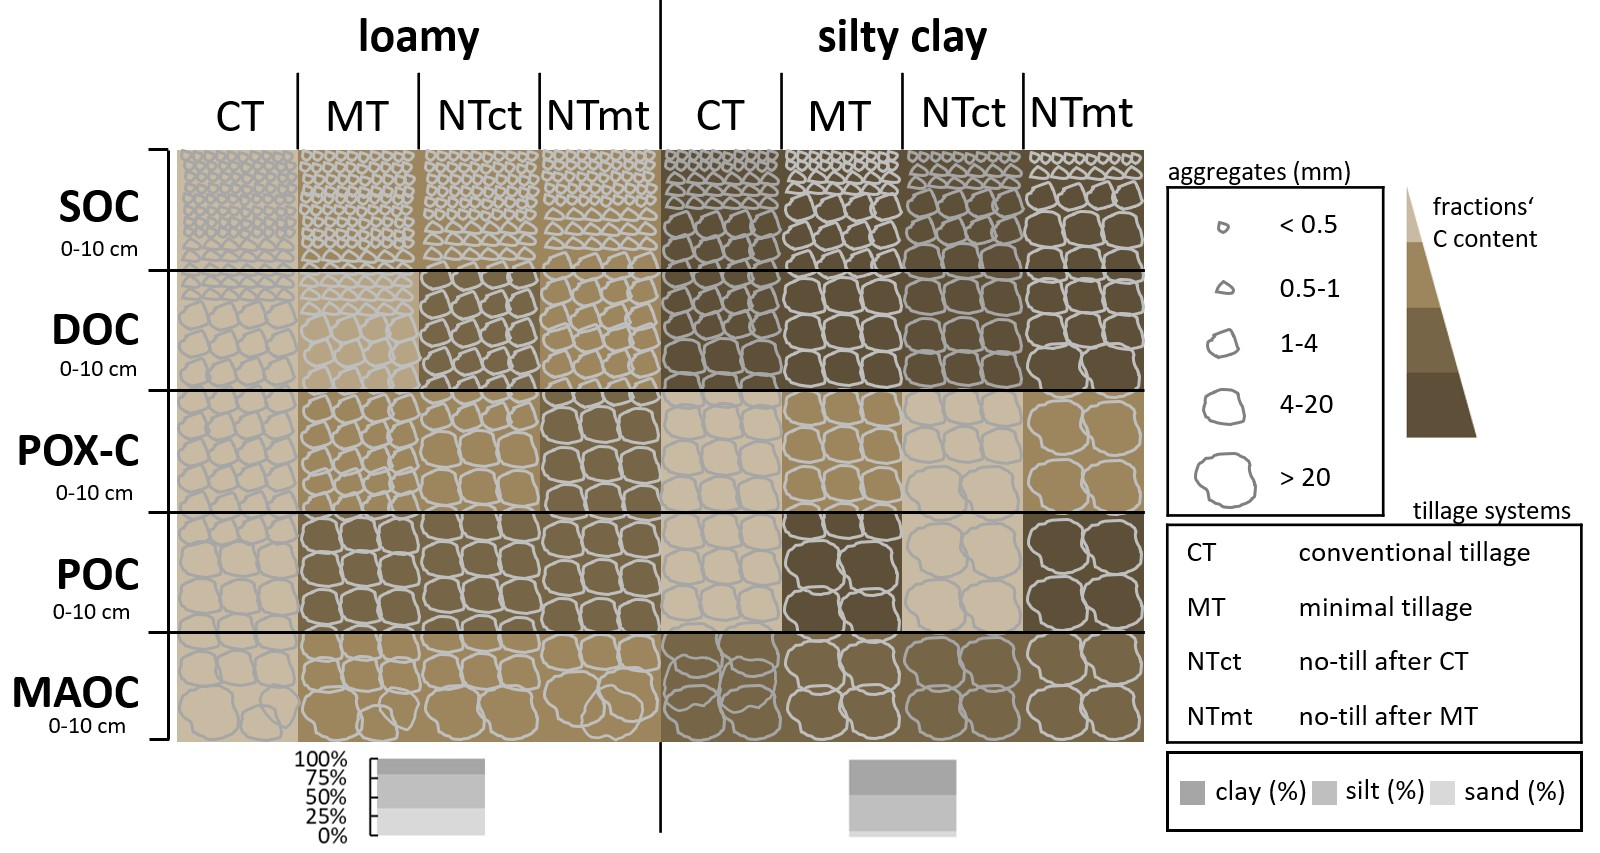
Soil texture-dependent responses and time-scales of soil quality change, especially soil carbon, remain poorly understood. We addressed this gap using a dual time-scale design of long-term field experiments: 11 years of minimum (MT) versus ploughing tillage (CT), both followed by 5-year transitions to no-till (NT) in contrasting textures (loamy vs. silty clay) in NE Slovenia. In loamy soils, reduced tillage in the 0–10 cm layer increased soil organic carbon by 40–48%, dissolved organic carbon by 36–64%, permanganate oxidizable carbon by 67–84%, particulate organic carbon by 76–95%, and mineral-associated organic carbon (MAOC < 50 μm) by 28–34%. In silty clay soils, high clay content masked tillage effects, though labile pools showed stratification. MAOC < 20 μm remained stable across treatments and textures (2.0–2.5%), except under CT in loamy soil (1.73%), indicating enhanced decomposition. In loamy soils CT increased by 0.5–1 and 1–2 mm and decreased >20 mm and in silty clay soils increased <0.5, 1–2 and 2–4 mm aggregate formations. The MWD, GMD, Dm indices correlated strongly with C fractions, confirming physical protection mechanisms. Our dual time-scale approach reveals labile C pools and aggregate recovery respond within 5 years of NT, while texture modulates response magnitude and detectability.

Graphical Abstract

1. Introduction

Soil management practices that enhance aggregation aim to increase plant productivity and organic carbon (C) inputs while reducing disturbance and losses through decomposition and erosion [1,2,3]. Well-structured soil improves air–water relationships, nutrient cycling, biological activity and the formation of organo-mineral complexes, ultimately reducing erosion and improving water quality [4]. Aggregate formation and structural improvement are promoted by management strategies that minimize disturbance, enhance fertility, increase organic inputs, maintain continuous plant cover and limit SOC decomposition [5].
Tillage practices play a central role in regulating soil structure. No-tillage (NT) systems generally improve aggregate stability, soil aggregation and aggregate-associated SOC due to reduced soil disturbance and the retention of crop residues, compared with conventional tillage (CT) [6]. However, the magnitude of these effects varies with climate, experimental duration, agronomic practices and inherent soil properties [7]. Reduced disturbance under NT enhances microbial activity and SOC accumulation, promoting the gradual formation of macroaggregates [8,9] and increasing SOC levels that contribute to aggregate stabilization [10].
Tillage also strongly influences the distribution and stabilization of particulate organic matter (POM). Under CT, repeated mechanical disruption reduces the formation and protection of POM within microaggregates, accelerating decomposition once macroaggregates disintegrate. In contrast, NT slows aggregate turnover and enhances POM stabilization [11]. Beyond the labile POM pool, mineral-associated organic carbon (MAOC) is also affected; MAOC increases by 7–13% in the 0–10 cm layer under NT and chisel systems relative to CT [3]. Some studies attribute SOC gains after transitioning from CT to NT primarily to increases in the labile POC fraction [12]. Furthermore, NT promotes larger macroaggregates (5–2 mm), increases aggregate stability and enhances SOC, DOC and POC, especially in large macroaggregates [13].
Several structural indices have been used to quantify tillage effects. The mean weight diameter (MWD) increases significantly under NT in the 0–10 cm layer [14], while the geometric mean diameter (GMD) shows similar responses [15]. A meta-analysis confirmed that conservation tillage significantly increases MWD, GMD and water-stable aggregates (WSAs), with stronger effects in long-term trials [16]. The Dm index has been used to compare structural responses to different implements, with minimum tillage showing the lowest Dm values [17]. Dm is well suited to describe dry aggregate size distribution (DASD) across soil types, while the Rosin–Rammler parameter (Dn) is more appropriate for comparing management practices within a single soil type [18].
Soil texture also modulates aggregation and SOC stabilization. Organic matter associated with clay minerals enhances aggregate cohesion and resistance to slaking [19]. Higher clay content promotes macroaggregation and protects intra-aggregate POM [20], whereas low-clay soils exhibit weaker macroaggregation and faster POM decomposition.
Despite extensive research on the effects of conservation tillage on soil organic carbon (SOC) and soil quality, important knowledge gaps remain. Conservation and reduced tillage practices have been widely investigated for their potential to increase SOC and mitigate degradation relative to conventional ploughing, but many studies focus on only two systems or time points, limiting insights into transitional trajectories versus long-term equilibria in SOC dynamics over multi-decadal time-scales [21,22]. While soil texture is recognized as a key modulator of SOC stabilization—with finer textures generally enhancing aggregation and carbon protection—few field studies explicitly compare tillage responses across contrasting soil textures within a single climatic zone and consistent management history [23,24]. Moreover, although SOC fractions such as particulate organic carbon (POC) and labile pools are increasingly used as sensitive indicators of management change, the relative sensitivity of different SOC fractions to tillage intensity and texture remains poorly quantified in field settings, constraining our capacity to predict system responses and choose effective monitoring indicators [25].
These knowledge gaps challenge accurate prediction of SOC trajectory under reduced tillage and hinder soil management optimization, especially across diverse soil types. The present study addresses this by combining an 11-year minimum and conventional tillage experiment with 5-year no-till transitions in two contrasting soil textures, enabling clearer separation of transitional and longer-term SOC responses across labile and stable carbon pools.
We hypothesized the following: (i) conservation tillage would enhance SOC fractions and structural stability in both contrasting soil textures, but with greater magnitude and detectability in lower-clay soils due to reduced baseline protection; (ii) transitional responses (5-year NT) would be evident in labile C pools (POX-C, POC) and aggregate properties, while long-term effects (11-year MT) would manifest in more stable fractions (MAOC); and (iii) structural improvements would correlate with C fraction changes, with relationships varying by texture.
We tested these hypotheses using a dual time-scale design combining 11 years of MT with 5-year NT transitions (from both CT and MT baselines) in contrasting textures.

2. Materials and Methods

2.1. Site Description

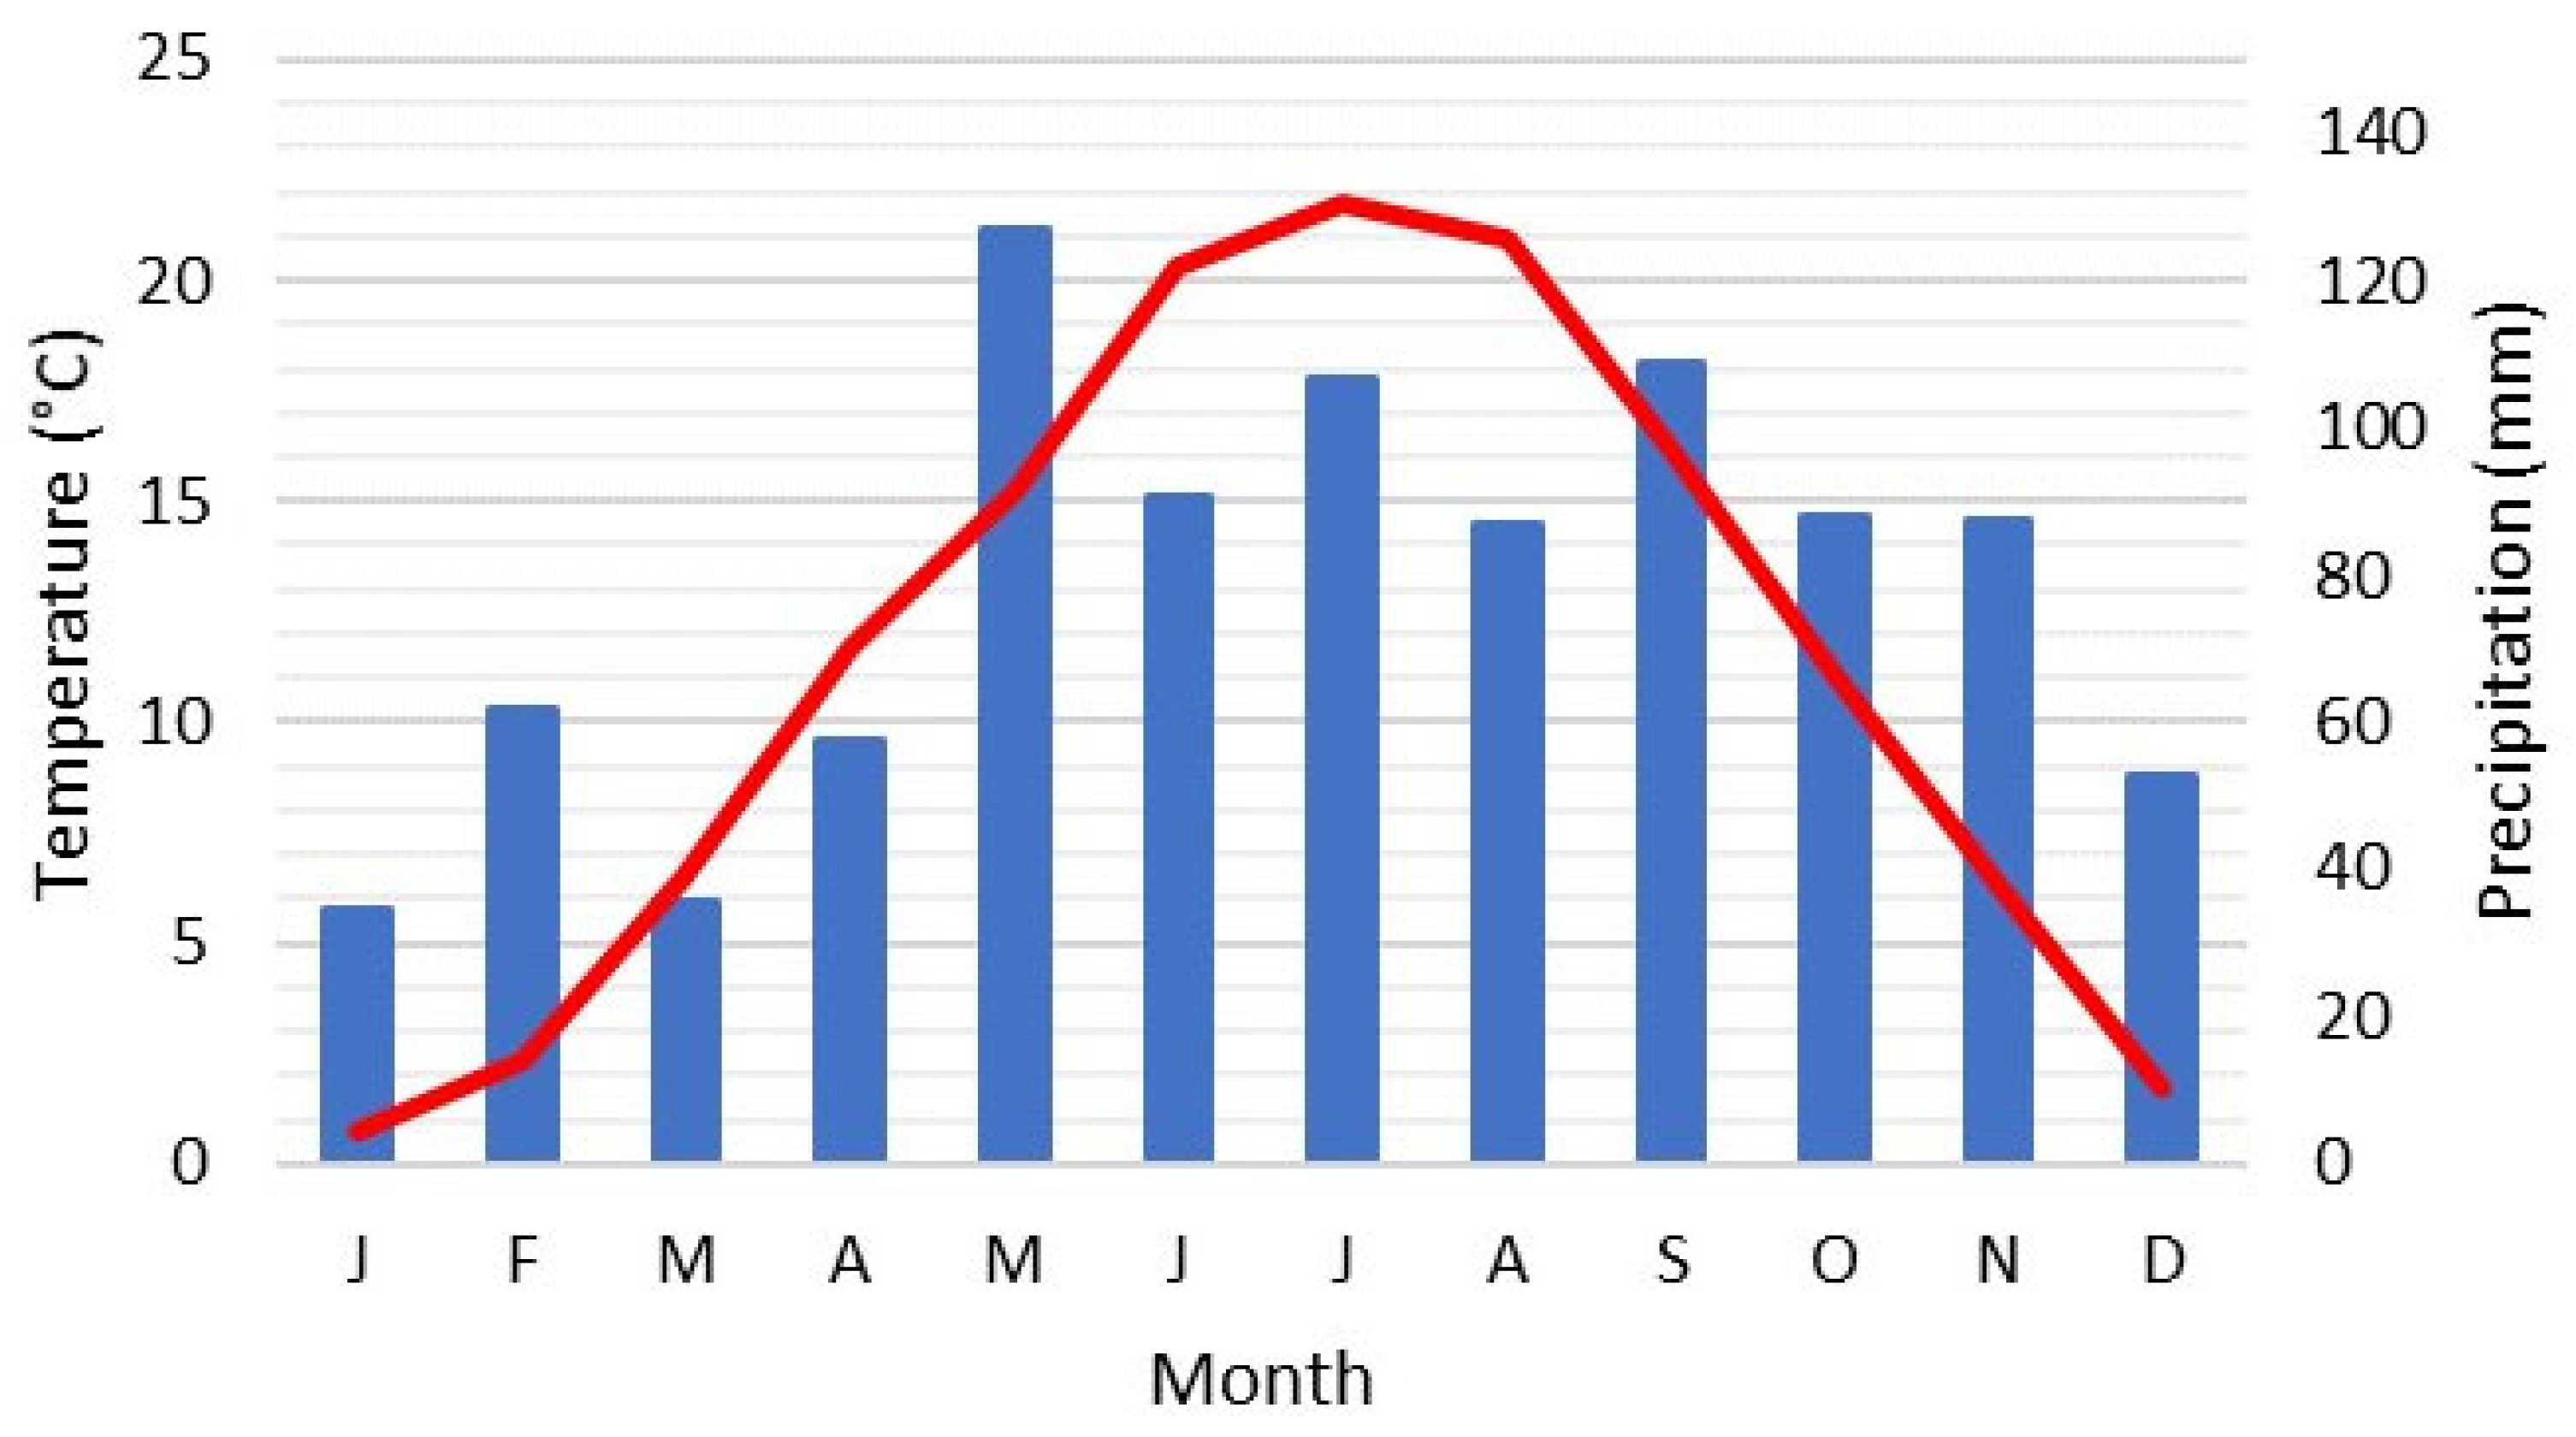
The study was conducted at two sites located approximately 3 km apart in the Podravska region of northeastern Slovenia, near the town of Ptuj. The loamy site (L site) is situated in Moškanjci (46°24′31.2″ N, 16°0′5.1″ E) at an elevation of 212 m, while the silty clay site (SC site) is located in Mezgovci (46°26′04.2″ N, 15°58′28.6″ E) at 215 m. Both sites share similar climatic conditions, belonging to the Alpine South (ALS6) climatic zone [26]. During the experimental period (2011-2021), the average annual temperature was 11.2 °C and the average annual precipitation was 938 mm [27] (Figure 1).
The soil at the L site is developed on gravel and sand deposits of the Drava River and is classified by the World Reference Base (WRB) as Dystric Cambisol (Loamic, Humic). It is shallow to moderately deep, with a clay content of 18–22%. In contrast, the SC site comprises deep alluvial soils of the Pesnica River valley with a silty clay texture (51–55% clay), classified by the WRB as Gleyic Cambisol (Clayic, Humic) [28].
At both sites, two contrasting tillage systems differing in soil disturbance intensity were initially applied: conventional moldboard ploughing (CT) to a depth of 25 cm followed by seedbed preparation (leaving no crop residues on the surface) and minimum tillage (MT), implemented as shallow “composting tillage” using a four-row Vario-Disc (EversAgro, Almelo, The Netherlands) to a depth of 10 cm, maintaining at least 30% soil cover by residues from the previous crop. These treatments were continuously applied from 2011 onward. In 2017, each field was split, and a no-till system (NT; direct seeding) was introduced. This resulted in four current treatments: conventional tillage (CT), minimum tillage (MT), no-till following long-term CT (NTct) and no-till following long-term MT (NTmt).
Typical 5-year crop rotation included soybean–winter wheat with hairy vetch as a cover crop after wheat harvest–maize–winter barley and soybean–maize. Prior to the start of the experiment, meliorative liming was conducted in 2011 using limestone (0–8 mm) with a Total Neutralizing Power of 97% relative to pure CaCO3 [29] and with a reactivity of 45.7% [30]. Application rates were 12.5 t ha−1 at the L site and 15 t ha−1 at the SC site. Mineral fertilization and plant protection were managed according to local farmer practice for each crop, and no organic fertilizers were applied.

2.2. Soil Sampling

Soil sampling was conducted at both sites in mid-October in 2021, prior to maize harvest, at depths of 0–10 cm and 10–20 cm. Ploughing (CT) had been performed 10 months earlier (December 2020) and minimum tillage (MT) in early April 2021. Soil samples of each of the four tillage treatments were taken from five repetitions (plots) at the L site and three at the SC site across each treatment (each plot was ca. 20 m apart). We used a root auger (Eijkelkamp, Giesbeek, The Netherlands) yielding undisturbed soil cores of 700 cm3. Each core was carefully divided into two halves: one half was air-dried at 40 °C, ground, and sieved through a 2 mm mesh [31] for physico-chemical analyses, while the other half was used for determining the dry aggregate size distribution (DASD). Dry sieving was chosen over wet sieving to allow subsequent chemical analyses on dry aggregates. Additional samples for bulk density determination were collected using a core sampler with Kopecky cylinders [32].
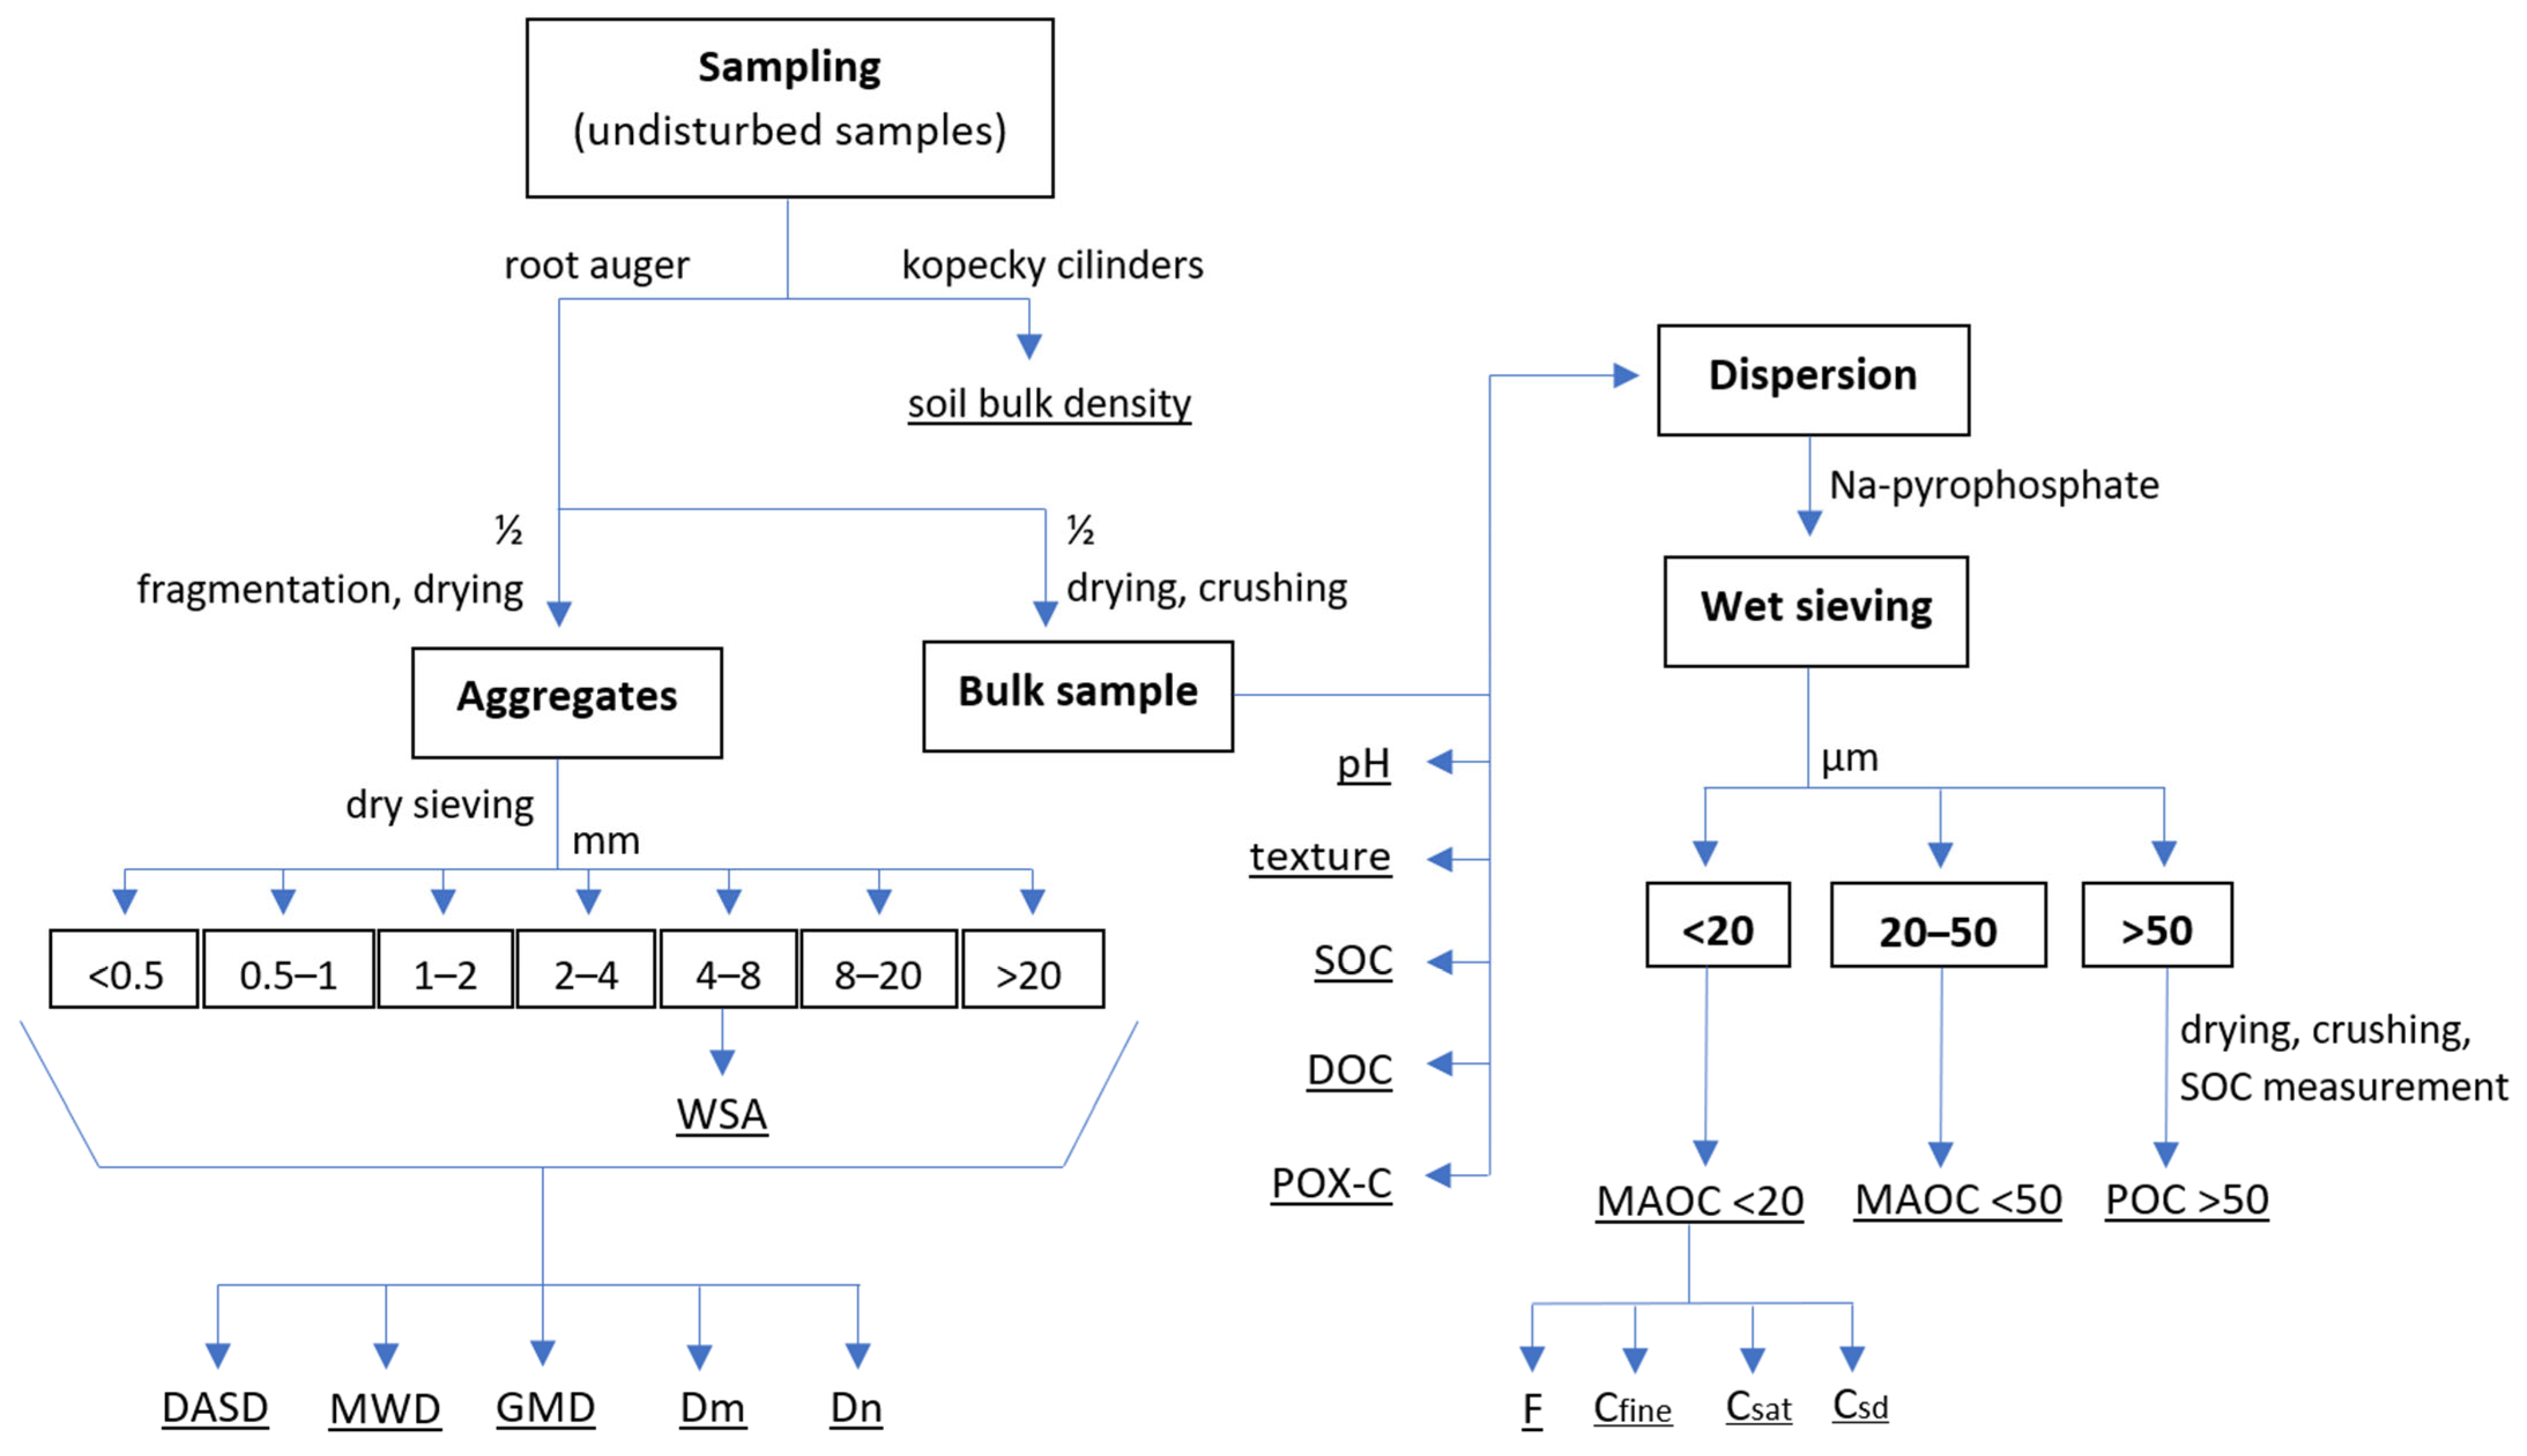
A schematic overview of sample preparation and subsequent analyses is presented in Figure 2.

2.3. Detailed Methodology of Sample Preparation and Analyses

2.3.1. Physico-Chemical Analyses

Particle size distribution was determined using the sieving and pipette method [33], while total organic carbon (SOC) was measured by dry combustion [34]. Dissolved organic carbon (DOC) was extracted with 0.01 M CaCl2 at a soil-to-solution ratio of 1:10 [35], and permanganate-oxidizable organic carbon (POX-C) was quantified using sodium permanganate solution [36]. Particulate organic carbon (POC; >50 µm) and mineral-associated organic carbon (MAOC; <50 µm and <20 µm) were separated from the bulk sample by wet sieving through 50 and 20 µm meshes [33,37,38]. SOC in each fraction was determined by dry combustion [34], and all organic C contents were converted to t ha−1 considering sampling depth and soil bulk density.
Following SOC determination in the <20 µm fraction (i.e., % MAOC in the fine fraction), the proportion of organic carbon in the fine fraction of the bulk sample (F; <20 µm; Equation (3)) was calculated, and fine-fraction carbon saturation (Csat) was estimated using Hassink’s equation [39]:
C s a t t   h a 1 = 4.09 + 0.37 × f i n e   f r a c t i o n % × B D
where Csat is the C saturation (t ha−1), fine fraction (%) is the proportion of <20 µm particles (%) and BD is soil bulk density (t m−3) in the 0–10 cm layer.
The potential deficit for binding organic carbon in the fine fraction (Csd) was calculated using Csat, and organic C in the soil fraction < 20 µm was measured by dry combustion (Cfine, t ha−1):
C s d t   h a 1 = C s a t C f i n e
The proportion of MAOC (F) of total organic carbon (SOC) was calculated as a ratio between measured MAOC (t ha−1) and SOC (= MAOC + POC) (t ha−1):
F = M A O C t   h a 1 M A O C + P O C ( t   h a 1 )

2.3.2. Aggregation, Structure Stability and Indices

To determine the dry aggregate size distribution (DASD), the remaining half of each undisturbed sample was processed by drying and sieving [40]. The dried samples were sieved using a Retsch (VERDER Group, Haan, Germany) AS 200 Control sieve shaker, separating aggregates into six size classes (20, 8, 4, 2, 1, and 0.5 mm). Each size class was weighed, and the proportion of each class relative to the bulk sample (%) was calculated.
Aggregates in the 4–8 mm size class were capillary-moistened with deionized water on tissue paper for 10 min to prevent slaking [41] and subsequently analyzed for water-stable aggregates (WSAs) using the wet sieving method with an Eijkelkamp apparatus [42]. The 4–8 mm fraction was chosen because the stability of aggregates larger than 2 mm is strongly influenced by root and hyphal growth and is therefore sensitive to agricultural management practices [43].
Water-stable aggregates (WSAs) were calculated [42] with sand correction:
W S A % = w N a O H s a n d 0.15 N a O H w e i g h t   o f   d r y   s o i l s a n d 0.15 N a O H × 100
where wNaOH is the weight of soil obtained in the dispersing solution and weight of dry soil is the weight of sample weighed into the sieve in grams. In the equation, the material on the sieve after wet sieving (sand in g) and dry weight of dispersing solution (0.15 g in 75 mL) are considered.
For investigating impacts of different tillage intensities on DASD, we calculated mean weight diameter (MWD), geometric mean diameter (GMD), mass fractal dimension (Dm), and the Rosin–Rammler regression index (Dn).
Mean weight diameter (MWD) was calculated as follows [44]:
M W D   ( m m ) = i = 1 i = n x ¯ i   ×   w i
where n is the total number of size classes, wi is the proportion of the total aggregates in the ith size class, and x ¯ i is the mean diameter of the ith size class sieve.
Geometric mean diameter (GMD) was calculated as follows [45]:
G M D   ( m m ) = e x p i = 1 n w i × l o g x ¯ i i = 1 n w i
where n is the total number of size classes, wi is the total weight of the aggregates in the ith size class, and x ¯ i is the mean diameter of the aggregates in the ith size class.
The mass fractal dimension (Dm) quantifies the structure and stability of soil aggregates by describing how aggregate mass scales with size. A Dm value of 3 indicates a fully space-filled soil with minimal porosity, whereas Dm < 3 reflects a more porous structure. Lower Dm values correspond to aggregates that are more porous, with mass increasing more slowly as size increases. The mass fractal dimension was calculated following the Tyler and Wheatcraft equation [46]:
M r < R i / M t o t = R i / R m a x 3 D m   D m = 3   l o g ( M r < R i / M t o t ) l o g ( R i / R m a x )
where r is the grain size, M(r < Ri) is the cumulative mass of aggregates of <Ri, Mtot is the total mass of soil, Ri is the aggregate size class, and Rmax is the maximum aggregate size.
The Rosin–Rammler index (Dn) characterizes soil fragmentation based on the slope of the exponential decay curve of aggregate size distribution. Values of Dn between 1 and 3 indicate a relatively uniform distribution of aggregate sizes, whereas Dn ≤ 1 reflects a more exponential distribution with a wider range of sizes. It was originally developed to describe the particle size distribution of powders and fragmented solids; Dn was calculated following Rosin and Rammler equation [47]:
y = F x = 1 e x / c n
where F(x) is the cumulative undersize distribution function, x is particle size, c is the particle size corresponding to 63.2% cumulative distribution undersize, and n is a characteristic constant of the material under analysis and gives a measure of steepness (slope) of the cumulative curve.

2.4. Statistical Analysis

Statistical analyses were performed using R software (version 4.4.1) [48] to evaluate the effects of location, tillage treatment, and soil depth on the measured soil parameters. Homogeneity of variances was assessed using Levene’s test (car package).
For data meeting the assumptions of normality, linear mixed-effects models (LMMs) were fitted using the lmer function from the lme4 package. The models included location, treatment, and depth as fixed effects, with block nested within location as a random effect. The significance of fixed effects was evaluated using Type III ANOVA with the Satterthwaite approximation (lmerTest package, Denmark). Residuals were checked for normality and homoscedasticity through visual inspection (residual and Q–Q plots) and the Shapiro–Wilk test. When necessary, data were transformed (logarithmic, square-root, or inverse) to meet the model’s assumptions.
If normality could not be achieved after transformation, data were analyzed using a nonparametric aligned rank transform (ART) ANOVA (ARTool package, USA), which allows factorial analysis of nonparametric data. Post hoc pairwise comparisons were performed using estimated marginal means (EMMs) via the emmeans package, with Sidak-adjusted contrasts to test for significant differences among factor levels or interactions.
For within-site analyses, the same approach was applied without the location factor, considering only treatment and depth as fixed effects and block as a random effect. When the treatment × depth interaction was not significant, main effects were interpreted independently. Relationships between structural indices and physical soil parameters were assessed using Spearman correlation analysis.

3. Results

3.1. Soil Properties

Basic soil properties for both sites and depths are presented in Table 1. The sites differed fundamentally in texture: the L site contained 18-22% clay while the SC site contained 47–55% clay. Correspondingly, the SC site had lower bulk density (1.06–1.20 vs. 1.20–1.43 t m−3) and higher SOC (2.4–3.1% vs. 1.4–2.0%) than the L site. These contrasting properties provided an ideal comparison for evaluating texture-dependent tillage responses.

3.2. Dry Aggregate Size Distribution and Aggregate Stability

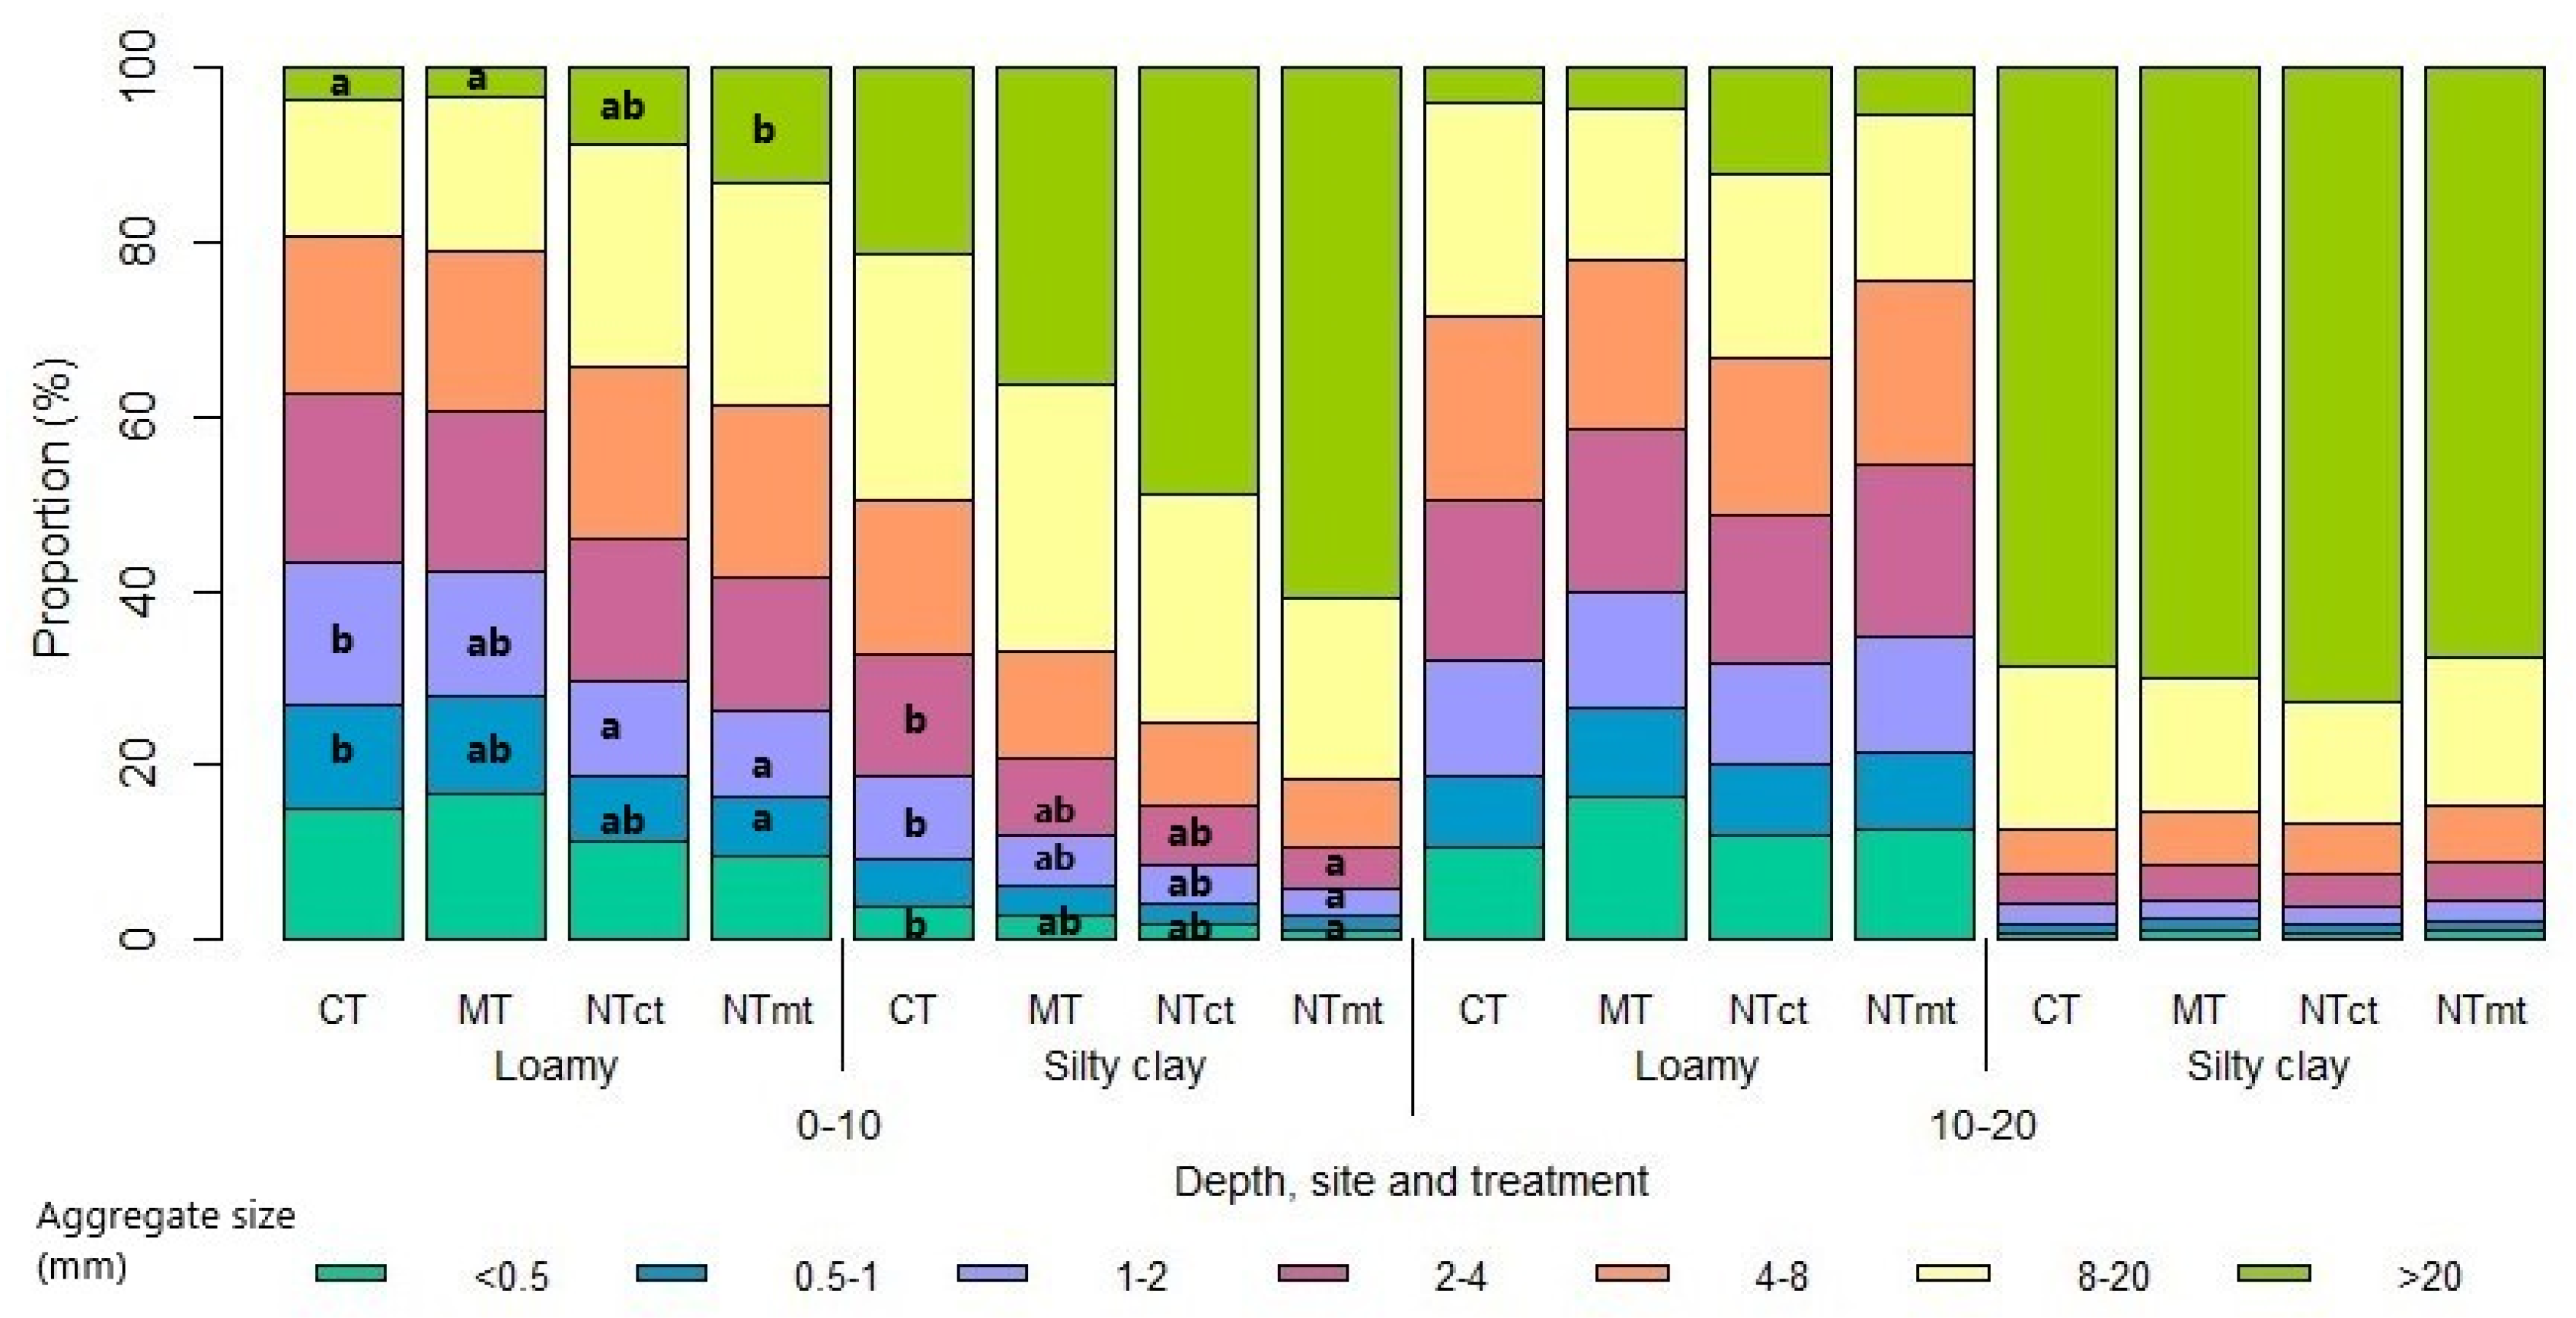
In the upper 10 cm, tillage intensity influenced aggregate size distribution at both sites (Figure 3). At the L site, NTmt showed significantly more aggregates >20 mm and fewer smaller aggregates (0.5–1 and 1–2 mm) than CT. At the SC site, significant differences occurred only in smaller aggregates (<0.5, 1–2, and 2–4 mm), with NTmt showing lower proportions than CT. No treatment differences occurred at 10–20 cm.
At the SC site, differences in the topsoil were reflected only in the mean weight diameter (MWD), which was 42% lower under CT compared with NTmt. The mass fractal dimension (Dm) showed a significant difference only between depths in the CT treatment, with Dm being 21% higher in the upper 10 cm compared with 10–20 cm (Table 2).
Among all structural indices, MWD, GMD, and Dm were the most sensitive to tillage intensity at both sites, which differed in texture and SOC content. MWD and GMD were significantly lower at the L site compared with the SC site, whereas Dm was significantly higher at the L site than at the SC site (Table 2).

3.3. Soil Organic Carbon Fractions Distribution

Tillage intensity effects on C fractions showed clear texture-dependent patterns. In loamy soil, all C fractions responded significantly to tillage in the upper 10 cm, with conservation tillage increasing C stocks through both labile and stable pools. In silty clay soil, inherent protection from high clay content moderated tillage effects, though vertical stratification patterns remained detectable.
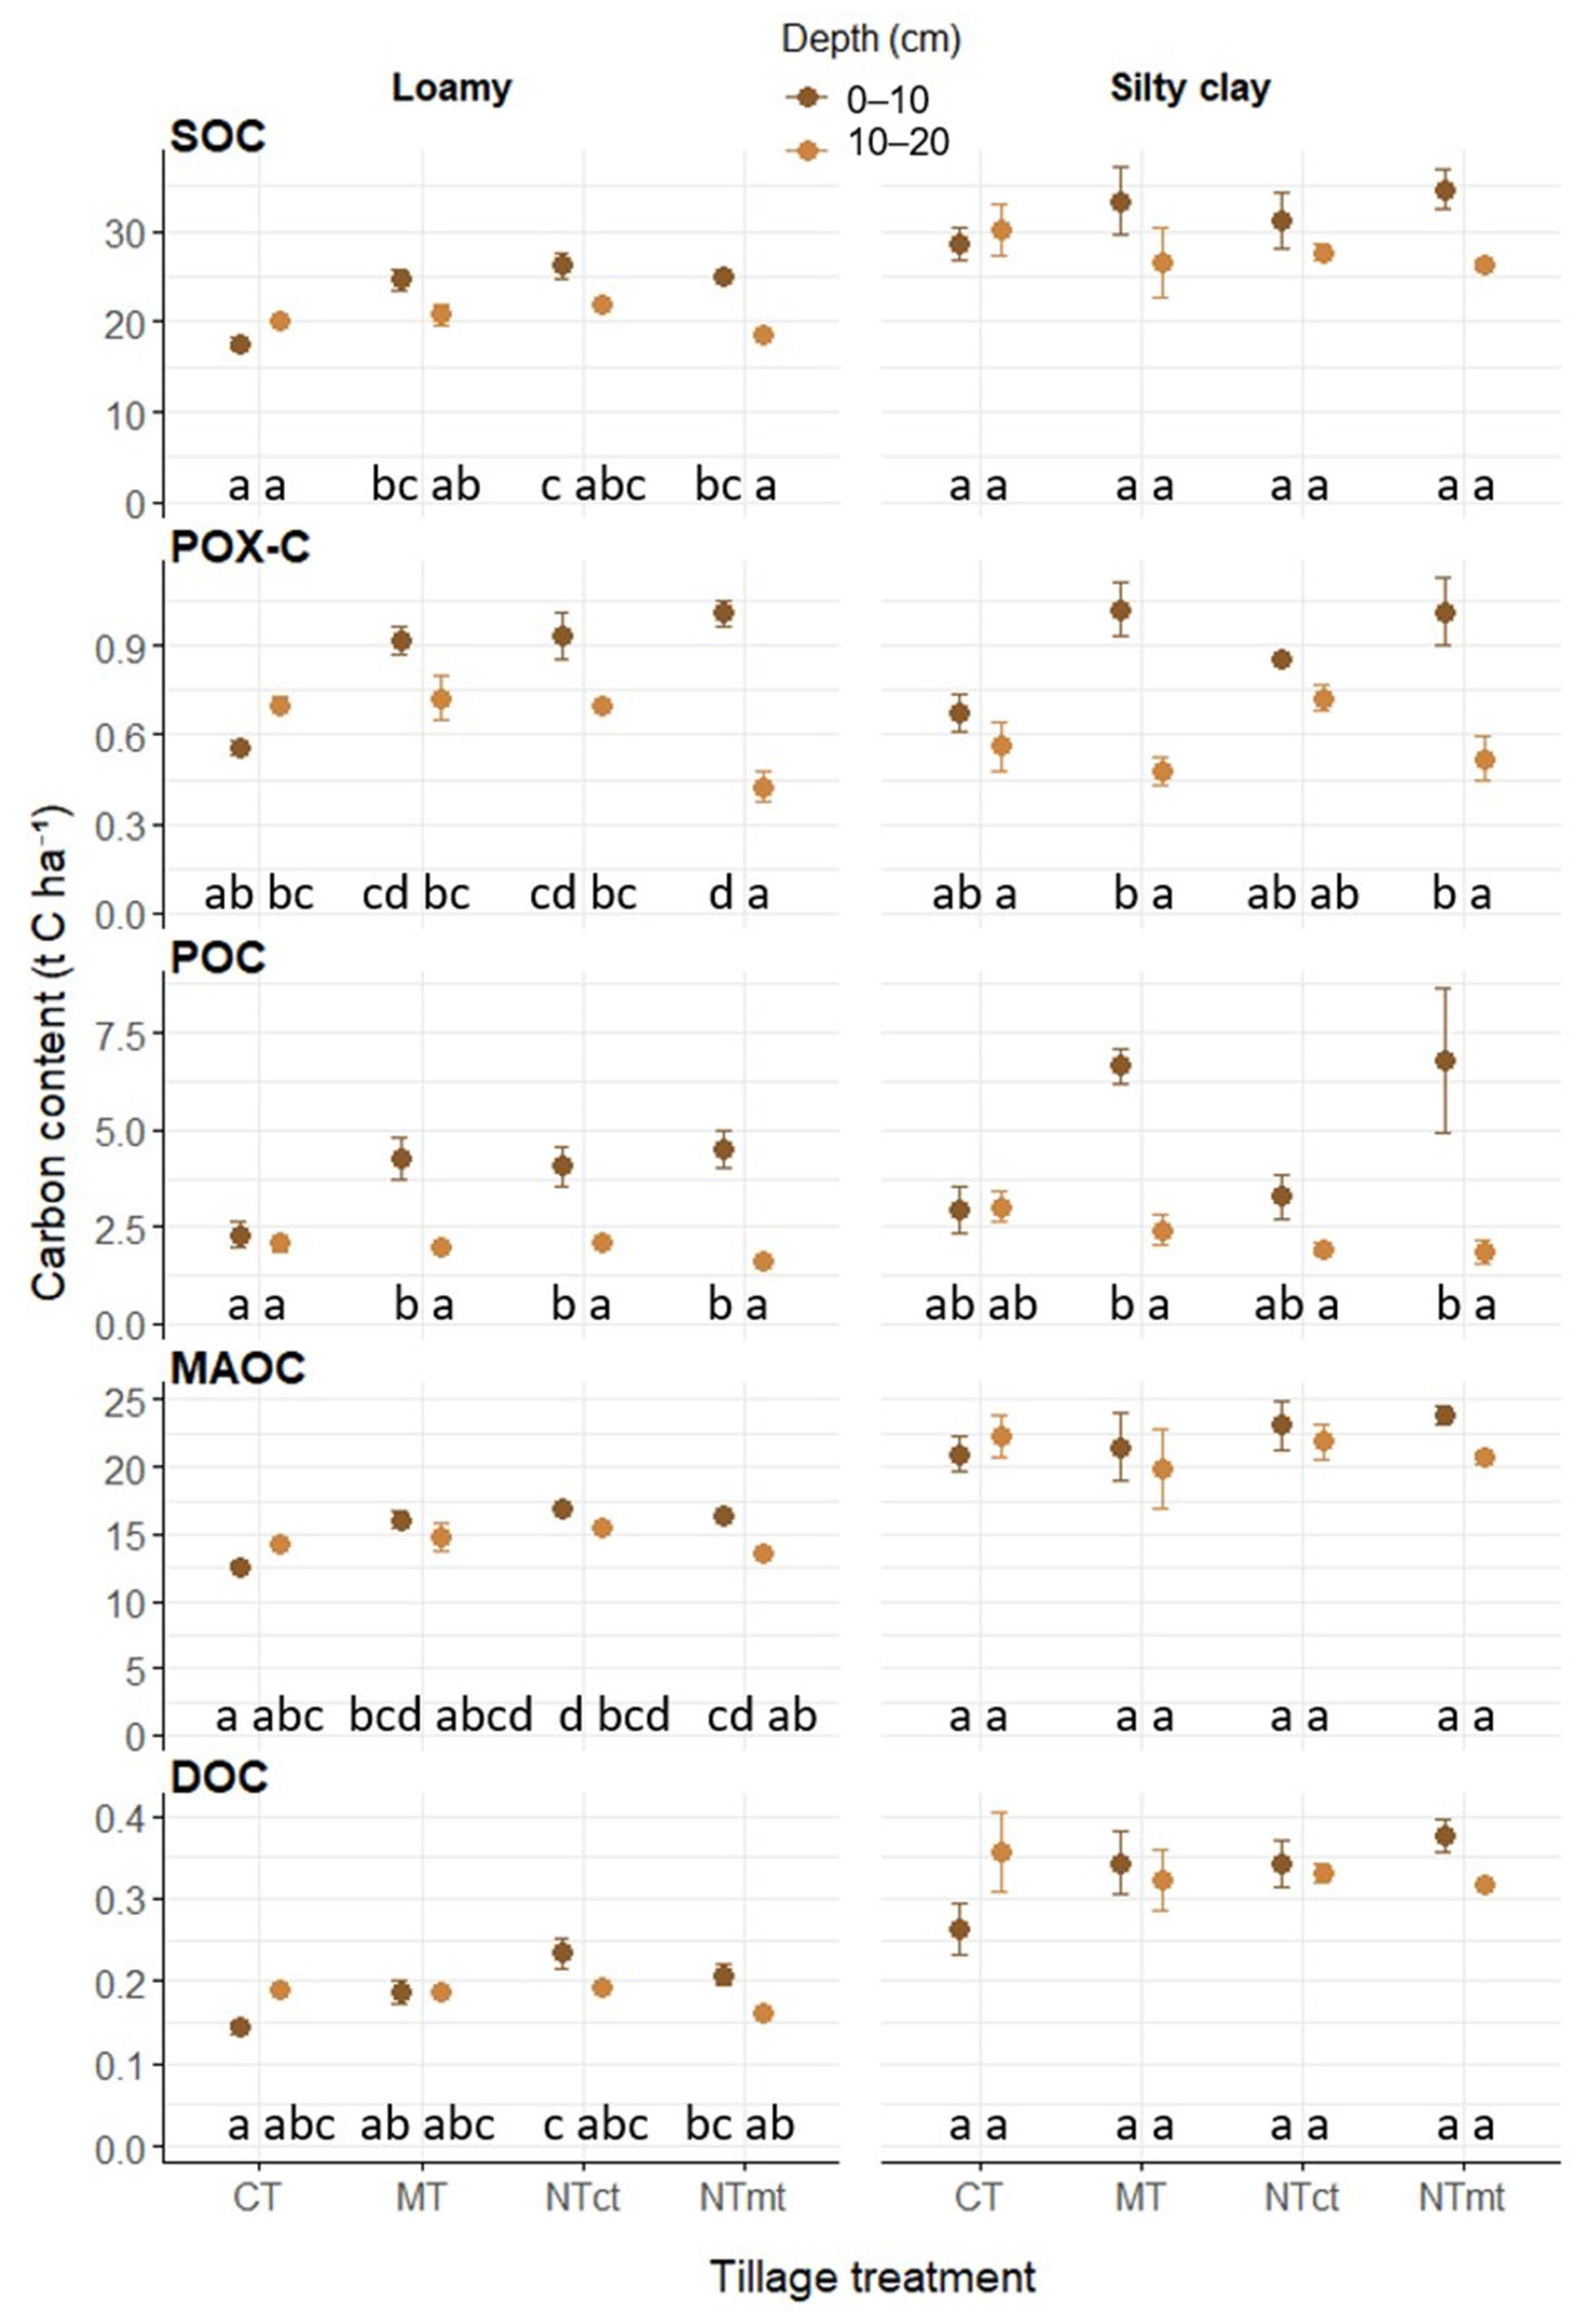
Organic carbon (C) fraction contents were generally higher at the SC site than at the L site, but the effects of tillage intensity were more pronounced at the L site, particularly in the top 10 cm (Figure 4). At the L site, SOC exhibited significant stratification, with higher SOC under lower-intensity tillage (MT, NTct and NTmt). SOC in CT was 28%, 32%, and 30% lower than in MT, NTct, and NTmt, respectively, in the top 10 cm, while no significant differences were observed at the SC site.
At the L site, MAOC also showed stratification under NTmt. In the top 10 cm, MAOC in CT was 22%, 25%, and 23% lower than in MT, NTct, and NTmt, respectively; no differences were detected at 10–20 cm. No significant differences in MAOC were observed at the SC site (Figure 4).
POC contents were significantly stratified by depth at both sites, except in CT at the L site and in CT and NTct at the SC site. Tillage effects on POC were evident in the top 10 cm at the L site, where CT contained 46%, 43%, and 49% less POC than MT, NTct, and NTmt, respectively (Figure 4).
POX-C exhibited significant stratification at the L site under NTmt and at the SC site under MT and NTmt, with higher contents in the upper layers. Tillage significantly influenced POX-C; at the L site, CT had 40%, 41%, and 46% lower POX-C than MT, NTct, and NTmt, respectively. At 10–20 cm, POX-C was lower in NTmt compared with other treatments (Figure 4).
DOC at the L site was significantly lower under CT in the top 10 cm compared with NTct (−26%) and NTmt (−13%), whereas no significant differences were observed at the SC site (Figure 4).

3.4. Carbon Saturation on Fine Soil Fraction (<20 µm)

The saturation of the fine fraction (<20 µm) (Csat) and the potential of the fine fraction to sequester carbon (Csd, i.e., SOC deficit) were calculated for the top 10 cm (Table 3). Both sites exhibited positive Csd values, with greater potential at the SC site, although no significant differences were observed among tillage treatments. At the L site, Csd under CT was 60% higher than under MT, indicating a larger deficit of MAOC.
Tillage influenced the proportion of MAOC relative to total SOC, expressed as MAOC/(MAOC + POC) (F), but only at the SC site, where F was 20% lower under MT compared with CT (Table 3). The MAOC content in the fine fraction (% MAOC < 20 µm) was generally similar across sites. At the L site, however, CT in the 0–10 cm layer had a 25% and 21% lower MAOC than MT and NTct, respectively, with the lowest value (1.73%) observed under CT, indicating higher mineralization in ploughed, lighter soils. In all other cases, fine-fraction MAOC ranged from 2.08 to 2.45%, regardless of soil texture (Table 3).

3.5. Correlation Between Aggregate Distribution, Structural Stability Indices and Organic Carbon Fractions

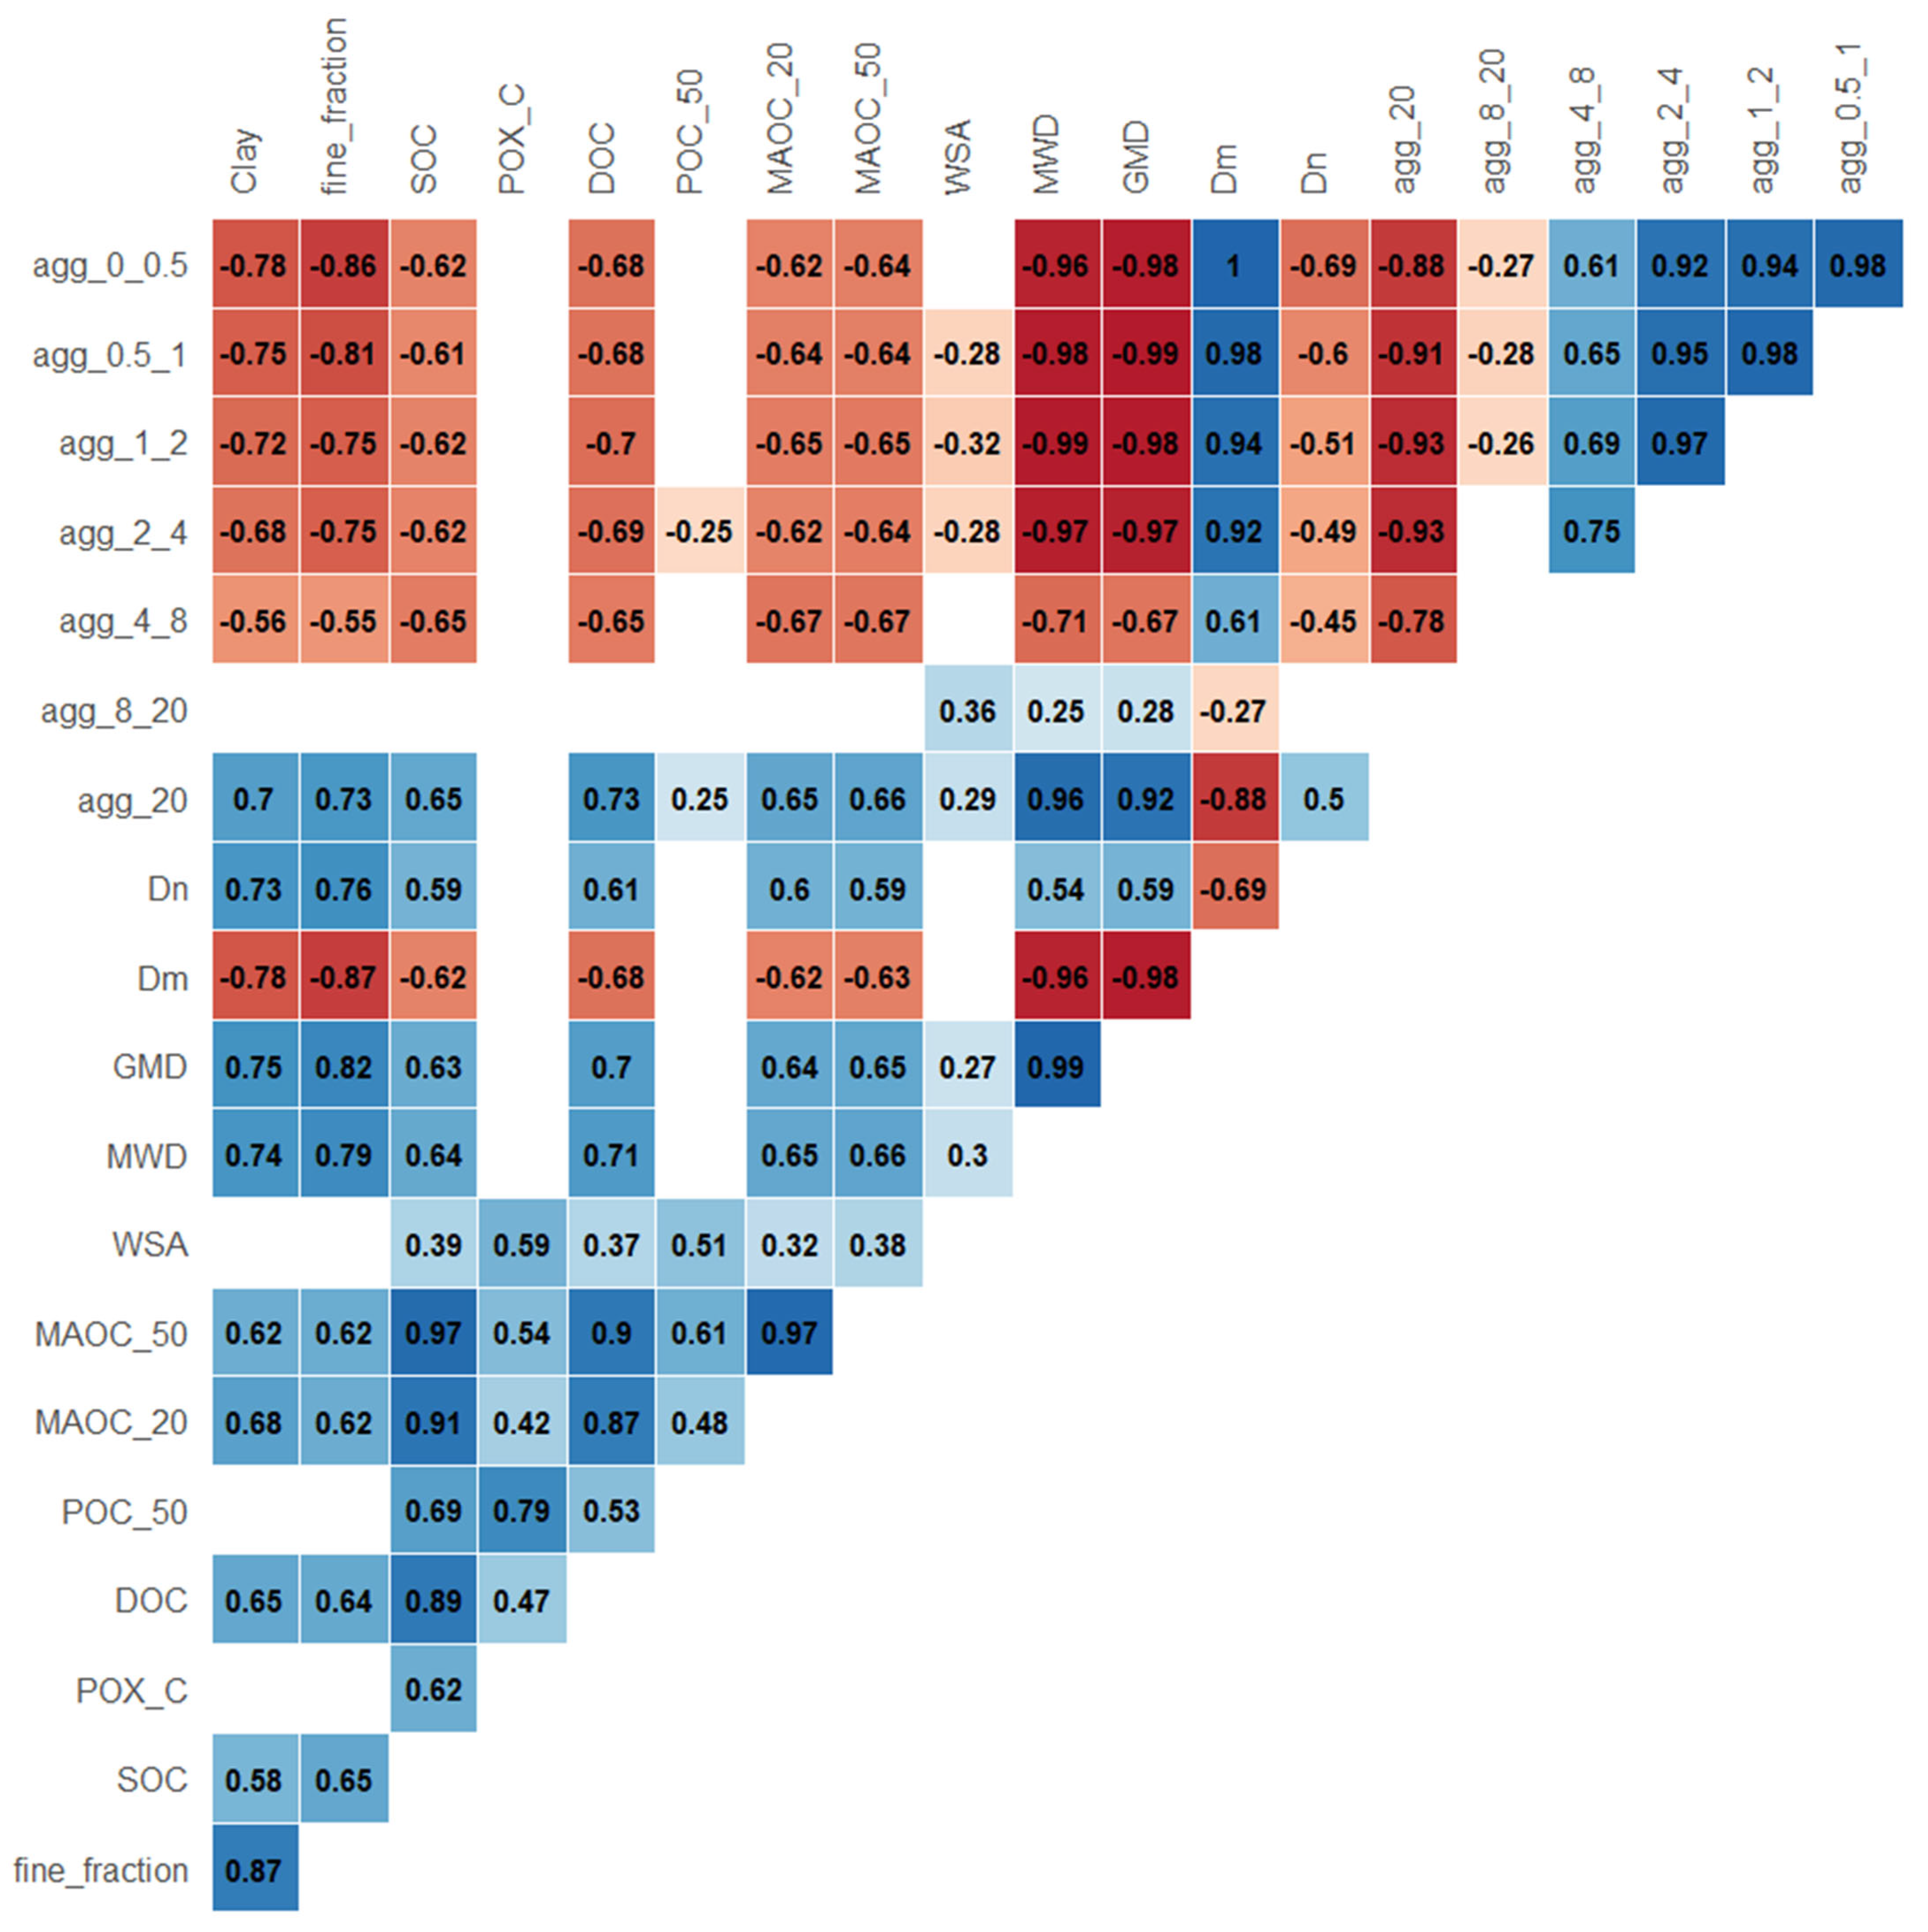
Spearman correlation analysis (p < 0.05) between organic C fractions, aggregate size classes, and structural stability indices is presented in Figure 5. Smaller aggregates (0–0.5, 0.5–1, 1–2, 2–4, and 4–8 mm) were negatively correlated with clay, fine fraction, and organic C fractions (SOC, DOC, MAOC < 20 µm, and MAOC < 50 µm), whereas 8–20 mm aggregates showed no significant correlations. The largest aggregates (>20 mm) were positively correlated with clay, fine fraction, and SOC, POC, MAOC < 20 µm, and MAOC < 50 µm.
Structural stability indices were strongly associated with organic C fractions. Dm was negatively correlated with DOC, MAOC < 20 µm, and MAOC < 50 µm (rS = −0.68, −0.62, −0.63), while GMD and MWD showed strong positive correlations with the same fractions (GMD: rS = 0.69, 0.64, 0.65; MWD: rS = 0.71, 0.65, 0.66). The Dn index also correlated positively with DOC, MAOC < 20 µm, and MAOC < 50 µm (rS = 0.61, 0.60, 0.59).
Water-stable aggregates (WSAs) correlated moderately with POX-C and POC (rS = 0.59 and 0.51) and weakly with DOC, MAOC < 20 µm, and MAOC < 50 µm (rS = 0.37, 0.32, 0.38). Strong positive correlations were observed among organic C fractions, notably DOC with MAOC < 20 µm and MAOC <50 µm (rS = 0.87, 0.90), and between POX-C and POC (rS = 0.80) (Figure 5).

4. Discussion

4.1. Dual Time-Scale Responses to Tillage Reduction

Our experimental design uniquely separates transitional (5-year NT) from long-term (11-year MT) tillage effects, revealing differential response rates among C pools and aggregate properties. The rapid response of labile fractions (POX-C and POC) to 5-year NT conversion indicates that some soil health improvements emerge relatively quickly after reducing disturbance. In contrast, MAOC accumulation appeared more gradual, with 11-year MT showing clearer differentiation from CT than 5-year NT transitions. This temporal pattern aligns with the hierarchical aggregate formation model [8], where microaggregate-protected C accumulates more slowly than free particulate matter. However, the 5-year NT period was sufficient to shift aggregate size distribution toward larger classes, suggesting that physical structure recovery may proceed faster than complete C saturation of newly formed aggregates. Importantly, the NTmt treatment (5 years of NT after 11 years of MT) consistently showed equal or superior performance to long-term MT alone, suggesting that eliminating even shallow tillage provides additional benefits. This supports a progressive model of soil health improvement where each reduction in disturbance intensity yields measurable gains.

4.2. Organic C Fractions

In light soils, after 11 years of MT and 5 years of NT, SOC in the top 10 cm was significantly higher under MT, NTct, and NTmt compared with CT, consistent with previous studies showing lower SOC under intensive tillage, particularly in the upper soil layers [22,49,50]. MAOC followed a similar pattern, with higher concentrations under reduced tillage. This increase likely reflects enhanced organo-mineral associations and the formation of micro- and macroaggregates that provide physical protection for organic matter [8]. Under CT, MAOC was uniform with depth, presumably due to plough-induced homogenization, whereas reduced tillage resulted in lower MAOC at 10–20 cm than at 0–10 cm, indicating enrichment of MAOC and POC in the upper soil layer from surface residues, root exudates, and microbial inputs [51]. Reduced tillage may also slow decomposition by maintaining a higher proportion of macroaggregates [52].
In heavier soils (SC), SOC was higher than in L soils regardless of tillage, reflecting stronger physical protection from degradation. This is supported by larger aggregates (Figure 3), higher MWD and GMD, lower Dm (Table 2), and strong correlations between SOC and structural indices (Figure 5). Lower clay soils are better aerated, accelerating organic matter decomposition [53]. In the top 10 cm, MAOC comprised 61–76% of total SOC, highlighting its dominant role in SOC stabilization. Reduced tillage decreased the MAOC relative proportion in the topsoil, retaining more POC, while the opposite trend was observed at 10–20 cm (Figure 4), and MAOC as a percentage of SOC generally increased with depth [54].
DOC was higher under reduced tillage, likely due to increased surface residues and microbial activity [55], and correlated strongly with MAOC < 20 µm and <50 µm (rS = 0.87 and 0.90), suggesting that DOC is closely associated with mineral-bound C [56]. POX-C, a labile and partially stabilized SOC fraction [57,58], was higher in the upper layers under reduced tillage, whereas CT showed lower POX-C due to enhanced decomposition. Labile fractions are better protected within aggregates under reduced tillage, allowing SOC accumulation [59]. The strong correlation between POX-C and POC (rS = 0.80; Figure 5) confirms that POX-C responds to soil management and can track SOC dynamics across soils of contrasting texture [13,60].

4.3. SOC Saturation in Fine Fraction (<20 µm)

The proportion of MAOC/(MAOC+POC) (F) in the 0–10 cm layer was highest under CT at both sites, likely due to lower surface plant residues (less POC) caused by ploughing and soil mixing. SOC stocks followed the order CT (28.7) < NTct (31.2) < MT (33.4) < NTmt (34.7 t C ha−1), reflecting the accumulation of POC under less intensive tillage (Figure 4).
The potential for binding organic C to the fine fraction (Csd) in the top 10 cm was not reached at either site. Conservation tillage effects on C sequestration were detectable only at the loamy site (L), where Csd was significantly higher under CT than MT and NT treatments. This is likely because surface residues in reduced tillage (MT and NT) must first decompose before forming MAOC [61], whereas mechanical mixing in CT enhances degradation. Less intensive tillage promotes aggregate preservation and formation, stabilizing SOC and increasing SOC stocks [8].
At the heavier SC site, differences in Csd among tillage treatments were not significant, as decomposition is slower even under CT, and aggregates are larger and more stable, with higher MWD and GMD compared to site L.
The proportion of MAOC in the fine fraction (%) was similar at both sites, ranging from 2.1 to 2.5%, except at site L in CT (1.7%), where Csd was higher. This narrow range suggests that the fine fraction may approach its effective MAOC capacity; however, this should be interpreted cautiously. Apparent plateaus in MAOC may reflect an input-dependent equilibrium rather than true mineral C saturation, as mineral surfaces may not be fully occupied but balanced with current organic matter inputs [62]. Observed patterns could also result from kinetic limitations in organo-mineral associations [63] or transient conditions influenced by residue quantity and quality, altering partitioning between particulate and mineral-associated C [64,65]. While fine-fraction MAOC similarity suggests strong mineral control, further evidence, such as mineral surface area or mineralogical analyses, is needed to confirm true C saturation [66].
The contrasting responses between sites highlight a fundamental trade-off in detectability versus baseline protection. Loamy soils showed clearer tillage effects because lower clay content provides less inherent SOC stabilization, making management-induced changes more apparent. Conversely, silty clay soils exhibited smaller relative changes because high clay content already provides substantial protection even under CT. This has important implications for monitoring programmes: lighter soils may be better sentinels for detecting early management effects, while heavier soils may require longer observation periods or more sensitive indicators (e.g., labile fractions and aggregate-scale analyses) to detect improvements.

4.4. Aggregation and Structural Indices

The effects of tillage intensity were evident in the distribution of structural aggregates determined by dry sieving (DASD). In the upper 10 cm, no-till systems (NTct and NTmt) contained more large aggregates and fewer small aggregates than CT, indicating that reduced tillage preserves existing aggregates, promotes the formation of new aggregates, and enhances structural stability. Tillage type is thus a key factor in macroaggregate formation [67,68].
For smaller aggregates, where stabilization is primarily mediated by polysaccharide–clay interactions, tillage effects were also observed in the top layer at both sites. Intensive tillage increased the proportion of smaller aggregates (<0.5, 0.5–1, 1–2, and 2–4 mm) due to crushing and faster turnover of macroaggregates, resulting in fewer macroaggregates and fewer newly formed microaggregates in CT [52].
Structural indices varied in their sensitivity to tillage and texture, reflecting differences in how physical organization relates to soil carbon (C) dynamics. Mean weight diameter (MWD) and geometric mean diameter (GMD) are widely used indices of soil aggregate stability; larger values indicate greater proportions of macroaggregates and improved structural stability, often associated with higher SOC content and enhanced C protection via physical encapsulation within aggregates [13,69]. In our study, both MWD and GMD were consistently higher in the heavier, silty clay soil, and MWD increased significantly under NTmt relative to CT, confirming that reduced disturbance promotes larger, more stable aggregate structures—linked to higher dissolved organic carbon and mineral-associated carbon fractions.
The mass fractal dimension (Dm) further complements traditional indices by quantifying the degree of fragmentation within aggregate size distributions: higher Dm values reflect a greater prevalence of smaller fragments and reduced structural coherence, whereas lower Dm values suggest stronger macroaggregate stability [17]. In our silty clay soil, the Dm was lower under reduced tillage, capturing structural improvements not fully resolved by MWD/GMD alone. Moreover, the Dm distinguished vertical differences under CT that aligned with lower water-stable aggregate (WSA) values and greater structural susceptibility to mechanical disturbance. Other studies similarly find that fractal dimensions can reveal subtle shifts in structural organization and disturbance effects that are not always apparent from MWD or GMD alone [13].
The Rosin–Rammler index, like the Dm, captures the distribution of aggregate sizes in a more mechanistic way, linking the physics of breakage and formation to management practices, though it is less widely applied than MWD/GMD. Together, these indices correlate with SOC pools, but their sensitivity varies by soil type, disturbance history, and the scale of structural change being monitored [69].
Based on our findings and the literature, we recommend a tiered approach for monitoring structure-related C dynamics:
-
Use MWD and GMD as baseline indicators in most field studies, particularly where monitoring aims to link physical aggregation to bulk SOC and management effects. These indices are widely accepted, straightforward to interpret, and show consistent relationships with SOC across studies [69].
-
Include mass fractal dimension (Dm) especially in fine-textured soils or long-term experiments, where subtle shifts in fragmentation and depth profiles may not be detected by MWD/GMD alone. Dm has been shown to provide additional insights into soil structure responses to disturbance and organic inputs [13,17].
-
Consider the Rosin–Rammler index when a more detailed mechanistic understanding of size distribution is required, such as in modelling soil structural turnover under contrasting management regimes.
-
Combine structural indices with SOC fractions, such as labile pools and mineral-associated organic carbon, to link physical changes to carbon dynamics more precisely—this integrated approach enhances sensitivity and interpretability for monitoring programmes.
This multi-indicator strategy improves detection of management effects across soil textures and temporal scales and provides a robust framework for comparing structural changes in other contexts.

4.5. Rethinking Carbon Saturation in Agricultural Soils

The remarkably consistent MAOC concentrations in fine fractions (2.0–2.5%) across treatments and textures—except CT in loamy soil (1.73%)—raise important questions about C saturation dynamics. Traditional saturation models [39,62] suggest that mineral surfaces have finite capacity, but our results indicate that apparent plateaus may reflect input–output equilibria rather than true saturation [63,64]. Three mechanisms could explain these patterns: (i) current organic matter inputs maintain steady-state MAOC levels that are below true mineral capacity; (ii) kinetic limitations slow MAOC formation such that systems remain in transient states for decades; or (iii) decomposition rates at the steady state balance new MAOC formations, creating apparent saturation. The deviation in CT loamy soil is particularly informative. Lower MAOC combined with higher Csd suggests that tillage-accelerated decomposition depleted mineral-associated C below the system’s equilibrium level. This demonstrates that management can push soils below their “practical” C saturation threshold, even if absolute mineral capacity remains higher. To distinguish among these scenarios, future research should combine mineralogical analyses (specific surface area and mineral composition) with isotopic approaches to quantify MAOC turnover rates. Understanding whether observed MAOC levels reflect approaching saturation or steady-state equilibrium is critical for predicting long-term C sequestration potential under different management scenarios.

4.6. Study Limitations and Perspectives for Future Research

While this study reveals clear tillage- and texture-dependent patterns in soil structure and carbon fractions, several limitations should be considered. Biomass inputs, residue quantity and quality, and root-derived carbon were not quantified, yet these factors strongly influence aggregation processes and the partitioning of SOC between particulate and mineral-associated pools [70,71]. Biological drivers of aggregation, including microbial biomass, fungal hyphae, and extracellular polysaccharides, were not directly measured and were inferred indirectly from carbon fractions and structural indices, although they are known to play a central role in aggregate formation and stabilization under reduced tillage [72]. In addition, decomposition rates and carbon turnover were not explicitly assessed, limiting the ability to distinguish between changes in organic matter inputs and stabilization efficiency [73]. Finally, rhizosphere processes and root distribution, which can substantially affect aggregate stability and MAOC formation, particularly in surface soils under conservation tillage, were not evaluated [74]. Future studies integrating biomass inputs, microbial indicators, and turnover measurements would strengthen mechanistic understanding of tillage effects on soil carbon dynamics.

4.7. Soil Management Recommendations

From a soil management perspective, our results confirm that reducing tillage intensity is an effective strategy for improving soil structure and carbon (C) stabilization across contrasting soil textures, but the rate, detectability, and dominant mechanisms of response differ substantially between lighter and heavier soils. These differences have important implications for both farm-level decision-making and soil monitoring programmes.
In lighter, loamy soils, reduced tillage (MT and NT) rapidly increased SOC, labile C pools (POX-C and POC), and aggregate stability, reflecting lower inherent physical protection and greater sensitivity to management change. Similar rapid responses in coarse-textured or low-clay soils have been widely reported, as reduced disturbance promotes surface residue retention, macroaggregate formation, and physical protection of particulate organic matter [8,75]. These soils therefore represent high-leverage targets for conservation tillage adoption, where measurable benefits to soil health and C stocks can be demonstrated within relatively short timeframes (5–10 years), supporting early adoption incentives and farmer engagement.
In contrast, heavier, silty clay soils exhibited higher baseline SOC and aggregate stability regardless of tillage, consistent with the strong role of clay in protecting organic matter through organo-mineral associations and stable aggregation [39,62]. In these soils, bulk SOC responded weakly to tillage, while changes were more evident in structural indices (MWD and Dm) and stratification patterns. This implies that conservation tillage in fine-textured soils should be viewed primarily as a long-term stabilization and risk-mitigation strategy, reducing structural degradation and preventing C losses rather than delivering rapid gains [22].
Importantly, the superior performance of the NTmt system demonstrates that progressive reductions in tillage intensity yield cumulative benefits. This supports a stepwise transition strategy, where replacing shallow tillage with NT further enhances aggregate stability and labile C retention [76]. Such gradual transitions may be more practical and resilient for farmers than abrupt system changes, particularly in regions where no-till adoption is constrained by associated technological changes, e.g., crop rotation, residue management, or by pedo-climatic limitations.
Based on our findings and the existing literature, we recommend the following:
-
Adopt reduced or no-till systems as a core strategy for SOC preservation, particularly in lighter soils where rapid improvements in aggregation and labile C pools can be expected [8].
-
In fine-textured soils, prioritize disturbance avoidance over short-term SOC gains, recognizing that benefits may manifest primarily through improved structural resilience and reduced vulnerability to erosion and compaction rather than immediate increases in SOC stocks.
-
Use sensitive indicators for monitoring, especially in heavier soils, including labile C fractions (POX-C and POC), aggregate size distribution, and mass fractal dimension, rather than relying solely on bulk SOC [73].
-
Promote incremental tillage reduction pathways (e.g., CT → MT → NT), as even small reductions in disturbance intensity can generate measurable improvements in soil structure and carbon dynamics [76].
Overall, our results highlight that soil texture must be explicitly considered when designing conservation tillage strategies, evaluating outcomes, and setting realistic expectations for carbon sequestration. Aligning management goals with soil-specific response patterns will improve the effectiveness of conservation practices and the reliability of soil health assessments across agroecosystems.

5. Conclusions

This study confirms that conservation tillage enhances soil carbon stabilization and structural integrity across contrasting soil textures, while demonstrating that both the magnitude and detectability of responses are governed by inherent textural protection and time-scale. As hypothesized, reductions in tillage intensity produced rapid improvements in labile carbon pools and aggregate structure, whereas responses of more stable mineral-associated carbon were slower and more strongly expressed after long-term management changes. Soil structure and carbon fractions were tightly coupled, supporting the hypothesis that physical aggregation under reduced disturbance is a key mechanism of carbon stabilization, with texture modulating these relationships. Importantly, the combined long-term and transitional design reveals that incremental reductions in soil disturbance generate cumulative benefits, rather than a single threshold response, e.g., SOC. Together, these findings demonstrate that soil texture and management history must be explicitly considered when evaluating conservation tillage outcomes and when selecting indicators to assess soil carbon dynamics.

Author Contributions

Conceptualization, R.M.; methodology, R.M. and S.M.; validation, S.M., H.G. and R.M.; formal analysis, S.M.; investigation, S.M., H.G. and R.M.; writing—original draft preparation, S.M. and R.M.; writing—review and editing, S.M. and R.M.; visualization, S.M.; supervision, R.M. All authors have read and agreed to the published version of the manuscript.

Funding

This research was funded by the Slovenian Research and Innovation Agency (ARIS) through a PhD studentship (PhD grant to Sara Mavsar). The APC was funded by ARIS Program Agroecosystems (P4-0085).

Institutional Review Board Statement

Not applicable.

Informed Consent Statement

Not applicable.

Data Availability Statement

The raw data supporting the conclusions of this article will be made available by the authors on request.

Acknowledgments

The authors would like to acknowledge farms Majerič and Korošec for enabling experimentation on their fields, helping conduct experiments and providing practical advice, and companies IGM Zagorje, Agromag and MRebernik, who helped by providing limestone, seeds and advice about use of machinery and pharmaceuticals. We would also like to acknowledge the Slovenian Research and Innovation Agency (ARIS) and the Biotechnical Faculty, University of Ljubljana.

Conflicts of Interest

The authors declare no conflicts of interest.

Abbreviations

The following abbreviations are used in this manuscript:
Cfinesoil organic carbon in fine fraction (<20 µm) (=MAOC < 20 µm)
Csatsoil organic carbon saturation of the fine fraction (<20 µm)
Csdpotential deficit for binding organic carbon in fine fraction (<20 µm)
CTconventional ploughing
Dmmass fractal dimension
DnRosin–Rammler index
DOCdissolved organic carbon
Fproportion of mineral-associated organic carbon (<50 µm) (MAOC <50 µm)
Fine fractionsoil mineral fraction of clay and fine silt (<20 µm)
GMD (mm)geometric mean diameter (mm)
L siteloamy texture site
MAOC in fine fraction 20 µm (%)percentage of mineral-associated organic carbon per unit of fine fraction (<20 µm)
MAOC < 20 µmmineral associated organic carbon in clay and fine silt (<20 µm)
MAOC < 50 µmmineral-associated organic carbon in clay and silt (<50 µm)
MTnon-inversion shallow tillage
MWD (mm)mean weight diameter (mm)
NTno tillage
NTctno tillage following conventional ploughing
NTmtno tillage following non-inversion shallow tillage
POCparticulate organic carbon
POX-Cpermanganate oxidizable carbon
rScoefficient of correlation by Spearman
SC sitesilty clay texture site
SOCsoil organic carbon
WRBWorld Reference Base
WSA (%)water-stable aggregate (%)

References

  1. Wolschick, N.H.; Barbosa, F.T.; Bertol, I.; Bagio, B.; Kaufmann, D.S. Long-Term Effect of Soil Use and Management on Organic Carbon and Aggregate Stability. Rev. Bras. Cienc. Solo 2018, 42, e0170393. [Google Scholar] [CrossRef]
  2. Hussain, S.; Hussain, S.; Guo, R.; Sarwar, M.; Ren, X.; Krstic, D.; Aslam, Z.; Zulifqar, U.; Rauf, A.; Hano, C.; et al. Carbon Sequestration to Avoid Soil Degradation: A Review on the Role of Conservation Tillage. Plants 2021, 10, 2001. [Google Scholar] [CrossRef] [PubMed]
  3. Liang, X.; Yu, S.; Ju, Y.; Wang, Y.; Yin, D. Integrated Management Practices Foster Soil Health, Productivity, and Agroecosystem Resilience. Agronomy 2025, 15, 1816. [Google Scholar] [CrossRef]
  4. Bronick, C.J.; Lal, R. Soil structure and management: A review. Geoderma 2005, 124, 3–22. [Google Scholar] [CrossRef]
  5. Liu, X.; Wu, X.; Liang, G.; Zheng, F.; Zhang, M.; Li, S. A global meta-analysis of the impacts of no-tillage on soil aggregation and aggregate-associated organic carbon. Land Degrad. Dev. 2021, 32, 5292–5305. [Google Scholar] [CrossRef]
  6. Topa, D.; Cara, I.G.; Jităreanu, G. Long term impact of different tillage systems on carbon pools and stocks, soil bulk density, aggregation and nutrients: A field meta-analysis. Catena 2021, 199, 105102. [Google Scholar] [CrossRef]
  7. Edlinger, A.; Garland, G.; Banerjee, S.; Degrune, F.; García-Palacios, P.; Herzog, C.; Pescador, D.S.; Romdhane, S.; Ryo, M.; Saghaï, A.; et al. The impact of agricultural management on soil aggregation and carbon storage is regulated by climatic thresholds across a 3000 km European gradient. Glob. Change Biol. 2023, 29, 3177–3192. [Google Scholar] [CrossRef]
  8. Six, J.; Elliott, E.T.; Paustian, K. Soil macroaggregate turnover and microaggregate formation: A mechanism for C sequestration under no-tillage agriculture. Soil Biol. Biochem. 2000, 32, 2099–2103. [Google Scholar] [CrossRef]
  9. Barreto, R.C.; Madari, B.E.; Maddock, J.E.L.; Machado, P.L.O.A.; Torres, E.; Franchini, J.; Costa, A.R. The impact of soil management on aggregation, carbon stabilization and carbon loss as CO2 in the surface layer of a Rhodic Ferralsol in Southern Brazil. Agric. Ecosyst. Environ. 2009, 132, 243–251. [Google Scholar] [CrossRef]
  10. Paustian, K.; Six, J.; Elliott, E.T.; Hunt, H.W. Management options for reducing CO2 emissions from agricultural soils. Biogeochemistry 2000, 48, 147–163. [Google Scholar] [CrossRef]
  11. Six, J.; Elliott, E.T.; Paustian, K.; Doran, J.W. Aggregation and Soil Organic Matter Accumulation in Cultivated and Native Grassland Soils. Soil Sci. Soc. Am. J. 1998, 62, 1367–1377. [Google Scholar] [CrossRef]
  12. Tan, Z.; Lal, R.; Owens, L.; Izaurralde, R.C. Distribution of light and heavy fractions of soil organic carbon as related to land use and tillage practice. Soil Tillage Res. 2007, 92, 53–59. [Google Scholar] [CrossRef]
  13. Shen, X.; Wang, L.; Yang, Q.; Xiu, W.; Li, G.; Zhao, J.; Zhang, G. Dynamics of soil organic carbon and labile carbon fractions in soil aggregates affected by different tillage managements. Sustainability 2021, 13, 1541. [Google Scholar] [CrossRef]
  14. Zhou, H.; Li, B.; Lu, Y. Micromorphological analysis of soil structure under no tillage management in the black soil zone of Northeast China. J. Mt. Sci. 2009, 6, 173–180. [Google Scholar] [CrossRef]
  15. Shu, X.; Zhu, A.N.; Zhang, J.B.; Yang, W.L.; Xin, X.L.; Zhang, X.F. Changes in soil organic carbon and aggregate stability after conversion to conservation tillage for seven years in the Huang-Huai-Hai Plain of China. J. Integr. Agric. 2015, 14, 1202–1211. [Google Scholar] [CrossRef]
  16. Li, Y.; Li, Z.; Cui, S.; Jagadamma, S.; Zhang, Q. Residue retention and minimum tillage improve physical environment of the soil in croplands: A global meta-analysis. Soil Tillage Res. 2019, 194, 104292. [Google Scholar] [CrossRef]
  17. Tagar, A.A.; Adamowski, J.; Memon, M.S.; Do, M.C.; Mashori, A.S.; Soomro, A.S.; Bhayo, W.A. Soil fragmentation and aggregate stability as affected by conventional tillage implements and relations with fractal dimensions. Soil Tillage Res. 2020, 197, 104494. [Google Scholar] [CrossRef]
  18. Perfect, E.; Kay, B.D.; Ferguson, J.A.; Da Silva, A.P.; Denholm, K.A. Comparison of functions for characterizing the dry aggregate size distribution of tilled soil. Soil Tillage Res. 1993, 28, 123–139. [Google Scholar] [CrossRef]
  19. Chenu, C.; Le Bissonnais, Y.; Arrouays, D. Organic Matter Influence on Clay Wettability and Soil Aggregate Stability. Soil Sci. Soc. Am. J. 2000, 64, 1479–1486. [Google Scholar] [CrossRef]
  20. Kölbl, A.; Kögel-Knabner, I. Content and composition of free and occluded particulate organic matter in a differently textured arable Cambisol as revealed by solid-state 13C NMR spectroscopy. J. Plant Nutr. Soil Sci. 2004, 167, 45–53. [Google Scholar] [CrossRef]
  21. Hermle, S.; Anken, T.; Leifeld, J.; Weisskopf, P. The effect of the tillage system on soil organic carbon content under moist, cold-temperate conditions. Soil Tillage Res. 2008, 98, 94–105. [Google Scholar] [CrossRef]
  22. Haddaway, N.R.; Hedlund, K.; Jackson, L.E.; Kätterer, T.; Lugato, E.; Thomsen, I.K.; Jørgensen, H.B.; Isberg, P.E. How does tillage intensity affect soil organic carbon? A systematic review. Environ. Evid. 2017, 6, 30. [Google Scholar] [CrossRef]
  23. Simon, B.; Dekemati, I.; Ibrahim, H.T.M.; Modiba, M.M.; Birkás, M.; Grósz, J.; Kulhanek, M.; Neugschwandtner, R.W.; Hofer, A.; Wagner, V.; et al. Impact of tillage practices and soil texture on soil health and earthworms in the Pannonian region: A comparative study from Austria and Hungary. Appl. Soil Ecol. 2025, 206, 105863. [Google Scholar] [CrossRef]
  24. Minase, N.A.; Masafu, M.M.; Geda, A.E.; Wolde, A.T. Impact of tillage type and soil texture to soil organic carbon storage: The case of Ethiopian smallholder farms. Afr. J. Agric. Res. 2016, 11, 1126–1133. [Google Scholar] [CrossRef]
  25. Duval, M.E.; Galantini, J.A.; Iglesias, J.O.; Canelo, S.; Martinez, J.M.; Wall, L. Analysis of organic fractions as indicators of soil quality under natural and cultivated systems. Soil Tillage Res. 2013, 131, 11–19. [Google Scholar] [CrossRef]
  26. Metzger, M.J. The Environmental Stratification of Europe, [Dataset]; University of Edinburgh: Edinburgh, UK, 2018. [Google Scholar] [CrossRef]
  27. Arso Meteo Portal. Available online: https://meteo.arso.gov.si/ (accessed on 24 November 2025).
  28. IUSS Working Group WRB. World Reference Base for Soil Resources. International Soil Classification System for Naming Soils and Creating Legends for Soil Maps, 4th ed.; International Union of Soil Sciences (IUSS): Vienna, Austria, 2022; 236p, Available online: https://www.isric.org/explore/wrb (accessed on 10 September 2025).
  29. EN 12945+A1:2016; Liming Materials—Determination of Neutralizing Value—Titrimetric Methods. European Committee for Standardization (CEN): Brussels, Belgium, 2016.
  30. EN 13971:2020; Carbonate and Silicate Liming Materials—Determination of Reactivity—Potentiometric Titration Method with Hydrochloric Acid. European Committee for Standardization (CEN): Brussels, Belgium, 2020.
  31. ISO 11464:2006; Soil Quality—Pretreatment of Samples for Physico-Chemical Analysis. ISO: Geneva, Switzerland, 2006.
  32. ISO 11272:2017; Soil Quality—Determination of Dry Bulk Density. ISO: Geneva, Switzerland, 2017.
  33. ISO 11277:2020; Soil Quality—Determination of Particle Size Distribution in Mineral Soil Material—Method by Sieving and Sedimentation. ISO: Geneva, Switzerland, 2020.
  34. ISO 10694:1995; Soil Quality—Determination of Organic and Total Carbon After Dry Combustion (Elementary Analysis). ISO: Geneva, Switzerland, 1995.
  35. ISO 14255:1999; Soil Quality—Determination of Nitrate Nitrogen, Ammonium Nitrogen and Total Soluble Nitrogen in Air-Dry Soils Using Calcium Chloride Solution as Extractant. ISO: Geneva, Switzerland, 1999.
  36. Weil, R.R.; Islam, K.R.; Stine, M.A.; Gruver, J.B.; Samson-Liebig, S.E. Estimating active carbon for soil quality assessment: A simplified method for laboratory and field use. Am. J. Altern. Agric. 2003, 18, 3–17. [Google Scholar] [CrossRef]
  37. Jagadamma, S.; Mayes, M.A.; Zinn, Y.L.; Gísladóttir, G.; Russell, A.E. Sorption of organic carbon compounds to the fine fraction of surface and subsurface soils. Geoderma 2014, 213, 79–86. [Google Scholar] [CrossRef]
  38. Tivet, F.; De Moraes Sá, J.C.; Lal, R.; Borszowskei, P.R.; Briedis, C.; dos Santos, J.B.; Sá, M.F.M.; da Cruz Hartman, D.; Eurich, G.; Farias, A.; et al. Soil organic carbon fraction losses upon continuous plow-based tillage and its restoration by diverse biomass-C inputs under no-till in sub-tropical and tropical regions of Brazil. Geoderma 2013, 209–210, 214–225. [Google Scholar] [CrossRef]
  39. Hassink, J. A Model of the Physical Protection of Organic Matter in Soils The capacity of soils to preserve organic C and N by their association with clay and silt particles. Plant Soil 1997, 191, 77–87. [Google Scholar] [CrossRef]
  40. Díaz-Zorita, M.; Grove, J.H.; Perfect, E. Sieving duration and sieve loading impacts on dry soil fragment size distributions. Soil Tillage Res. 2007, 94, 15–20. [Google Scholar] [CrossRef]
  41. Adhikary, N.; Amin, S. Soil Organic Matter Fractionation and Its Effect on Aggregate Stability; Khulna University: Khulna, Bangladesh, 2007; 72p. [Google Scholar] [CrossRef]
  42. Kemper, W.D.; Rosenau, R.C. Aggregate stability and size distribution. Methods of Soil Analysis; Part 1—Physical and Mineralogical Methods. Am. Soc. Agronomy 1986, 9, 425–442. [Google Scholar] [CrossRef]
  43. Tisdall, J.M.; Oades, J.M. Organic matter and water-stable aggregates in soils. J. Soil Sci. 1982, 33, 141–163. [Google Scholar] [CrossRef]
  44. Van Bavel, C.H.M. Mean weight-diameter of soil aggregation as a statistical index of aggregation. Soil Sci. Soc. Am. J. 1949, 14, 20–23. [Google Scholar] [CrossRef]
  45. Mazurak, A.P. Effect of gaseous phase on water-stable synthetic aggregates. Soil Sci. 1950, 69, 135–148. [Google Scholar] [CrossRef]
  46. Tyler, S.W.; Wheatcraft, S.W. Fractal scaling of soil-particle size distributions: Analysis and limitations. Soil Sci. Soc. Am. J. 1992, 56, 362–369. [Google Scholar] [CrossRef]
  47. Rosin, P.; Rammler, E. The Laws Governing the Fineness of powdered coal. J. Inst. Fuel 1933, 7, 29–36. [Google Scholar]
  48. R Development Core Team. R: A Language and Environment for Statistical Computing; R Foundation for Statistical Computing: Vienna, Austria, 2020; Available online: https://www.r-project.org/ (accessed on 10 September 2025).
  49. Hernanz, J.L.; López, R.; Navarrete, L.; Sánchez-Girón, V. Long-term effects of tillage systems and rotations on soil structural stability and organic carbon stratification in semiarid central Spain. Soil Tillage Res. 2002, 66, 129–141. [Google Scholar] [CrossRef]
  50. Mondal, S.; Chakraborty, D.; Bandyopadhyay, K.; Aggarwal, P.; Rana, D.S. A global analysis of the impact of zero-tillage on soil physical condition, organic carbon content, and plant root response. Land Degrad. Dev. 2020, 31, 557–567. [Google Scholar] [CrossRef]
  51. Liao, J.; Yang, X.; Dou, Y.; Wang, B.; Xue, Z.; Sun, H.; Yang, Y.; An, S. Divergent contribution of particulate and mineral-associated organic matter to soil carbon in grassland. J. Environ. Manag. 2023, 344, 118536. [Google Scholar] [CrossRef]
  52. Six, J.; Elliott, E.T.; Paustian, K. Aggregate and Soil Organic Matter Dynamics under Conventional and No-Tillage Systems. Soil Sci. Soc. Am. J. 1999, 63, 1350–1358. [Google Scholar] [CrossRef]
  53. Sissoko, A.; Kpomblekou-A, K. Carbon decomposition in broiler litter-amended soils. Soil Biol. Biochem. 2010, 42, 543–550. [Google Scholar] [CrossRef]
  54. Li, Y.; Wei, X.; Yan, J.; Du, Z.; Lv, Y.; Zhou, H. Divergent Stabilization Characteristics of Soil Organic Carbon between Topsoil and Subsoil Under Different Land Use Types. Catena 2025, 252, 108838. [Google Scholar] [CrossRef]
  55. Bu, R.; Ren, T.; Lei, M.; Liu, B.; Li, X.; Cong, R. Tillage and straw-returning practices effect on soil dissolved organic matter, aggregate fraction and bacteria community under rice-rapeseed rotation system. Agric. Ecosyst. Environ. 2020, 287, 106681. [Google Scholar] [CrossRef]
  56. Kalbitz, K.; Schwesig, D.; Rethemeyer, J.; Matzner, E. Stabilization of dissolved organic matter by sorption to the mineral soil. Soil Biol. Biochem. 2005, 37, 1319–1331. [Google Scholar] [CrossRef]
  57. Culman, S.W.; Snapp, S.S.; Freeman, M.A.; Schipanski, M.E.; Beniston, J.; Lal, R.; Drinkwater, L.E.; Franzluebbers, A.J.; Glover, J.D.; Grandy, A.S.; et al. Permanganate Oxidizable Carbon Reflects a Processed Soil Fraction that is Sensitive to Management. Soil Sci. Soc. Am. J. 2012, 76, 494–504. [Google Scholar] [CrossRef]
  58. De Moraes Sá, J.C.; Tivet, F.; Lal, R.; Briedis, C.; Hartman, D.C.; dos Santos, J.Z.; dos Santos, J.B. Long-term tillage systems impacts on soil C dynamics, soil resilience and agronomic productivity of a Brazilian Oxisol. Soil Tillage Res. 2014, 136, 38–50. [Google Scholar] [CrossRef]
  59. Jastrow, J.D.; Amonette, J.E.; Bailey, V.L. Mechanisms controlling soil carbon turnover and their potential application for enhancing carbon sequestration. Clim. Change 2007, 80, 5–23. [Google Scholar] [CrossRef]
  60. Bongiorno, G.; Bünemann, E.K.; Oguejiofor, C.U.; Meier, J.; Gort, G.; Comans, R.; Mäder, P.; Brussaard, L.; de Goede, R. Sensitivity of labile carbon fractions to tillage and organic matter management and their potential as comprehensive soil quality indicators across pedoclimatic conditions in Europe. Ecol. Indic. 2019, 99, 38–50. [Google Scholar] [CrossRef]
  61. Niu, Y.; Li, Y.; Lou, M.; Cheng, Z.; Ma, R.; Guo, H.; Zhou, J.; Jia, H.; Fan, L.; Wang, T. Microbial transformation mechanisms of particulate organic carbon to mineral-associated organic carbon at the chemical molecular level: Highlighting the effects of ambient temperature and soil moisture. Soil Biol. Biochem. 2024, 195, 109454. [Google Scholar] [CrossRef]
  62. Six, J.; Conant, R.T.; Paul, E.A.; Paustian, K. Stabilization mechanisms of SOM implications for C saturation of soils. Plant Soil 2002, 241, 155–176. [Google Scholar] [CrossRef]
  63. Stewart, C.E.; Paustian, K.; Conant, R.T.; Plante, A.F.; Six, J. Soil carbon saturation: Concept, evidence and evaluation. Biogeochemistry 2007, 86, 19–31. [Google Scholar] [CrossRef]
  64. Cotrufo, M.F.; Ranalli, M.G.; Haddix, M.L.; Six, J.; Lugato, E. Soil carbon storage informed by particulate and mineral-associated organic matter. Nat. Geosci. 2019, 12, 989–994. [Google Scholar] [CrossRef]
  65. Castellano, M.J.; Mueller, K.E.; Olk, D.C.; Sawyer, J.E.; Six, J. Integrating plant litter quality, soil organic matter stabilization, and the carbon saturation concept. Glob. Change Biol. 2015, 21, 3200–3209. [Google Scholar] [CrossRef]
  66. Heckman, K.A.; Possinger, A.R.; Badgley, B.D.; Bowman, M.M.; Gallo, A.C.; Hatten, J.A.; Nave, L.E.; SanClements, M.D.; Swanston, C.W.; Weighlein, T.L.; et al. Moisture-driven divergence in mineral-associated soil carbon persistence. Proc. Natl. Acad. Sci. USA 2023, 120, e2210044120. [Google Scholar] [CrossRef]
  67. Dai, J.; Hu, J.; Zhu, A.; Bai, J.; Wang, J.; Lin, X. No tillage enhances arbuscular mycorrhizal fungal population, glomalin-related soil protein content, and organic carbon accumulation in soil macroaggregates. J. Soils Sediments 2015, 15, 1055–1062. [Google Scholar] [CrossRef]
  68. Ruis, S.J.; Blanco-Canqui, H. How does no-till affect soil-profile distribution of roots? Can. J. Soil Sci. 2024, 104, 350–361. [Google Scholar] [CrossRef]
  69. Mikha, M.M.; Green, T.R.; Untiedt, T.J.; Hergret, G.W. Land management affects soil structural stability: Multi-index principal component analyses of treatment interactions. Soil Tillage Res. 2024, 235, 105890. [Google Scholar] [CrossRef]
  70. Six, J.; Bossuyt, H.; Degryze, S.; Denef, K. A history of research on the link between (micro)aggregates, soil biota, and soil organic matter dynamics. Soil Tillage Res. 2004, 79, 7–31. [Google Scholar] [CrossRef]
  71. Cotrufo, M.F.; Wallenstein, M.D.; Boot, C.M.; Denef, K.; Paul, E. The Microbial Efficiency-Matrix Stabilization (MEMS) framework integrates plant litter decomposition with soil organic matter stabilization: Do labile plant inputs form stable soil organic matter? Glob. Change Biol. 2013, 19, 988–995. [Google Scholar] [CrossRef] [PubMed]
  72. Lehmann, J.; Hansel, C.M.; Kaiser, C.; Kleber, M.; Maher, K.; Manzoni, S.; Nunan, N.; Reichstein, M.; Schimel, J.P.; Torn, M.S.; et al. Persistence of soil organic carbon caused by functional complexity. Nat. Geosci. 2020, 13, 529–534. [Google Scholar] [CrossRef]
  73. Poeplau, C.; Katterer, T.; Leblans, N.I.W.; Sigurdsson, B.D. Sensitivity of soil carbon fractions and their specific stabilization mechanisms to extreme soil warming in a subarctic grassland. Glob. Change Biol. 2017, 23, 1316–1327. [Google Scholar] [CrossRef] [PubMed]
  74. Rasse, D.P.; Rumpel, C.; Dignac, M.F. Is soil carbon mostly root carbon? Mechanisms for a specific stabilisation. Plant Soil 2005, 269, 341–356. [Google Scholar] [CrossRef]
  75. Franzluebbers, A.J. Soil organic matter stratification ratio as an indicator of soil quality. Soil Tillage Res. 2002, 66, 95–106. [Google Scholar] [CrossRef]
  76. Derpsch, R.; Friedrich, T.; Kassam, A.; Hongwen, L. Current status od adoption of no-till farming in the world and some of its main benefits. Int. J. Agric. Biol. Eng. 2010, 3, 1–25. [Google Scholar] [CrossRef]
Figure 1. Climatogram of experimental sites for the period 2011–2021, red line represents temperature and blue bars precipitation (data from the nearest meteo station Maribor airport, Arso meteo portal, 2025).
Soilsystems 10 00035 g001
Figure 2. Schematic overview of sample preparation and analyses.
Soilsystems 10 00035 g002
Figure 3. Dry aggregate size distribution by mass (DASD) for different aggregate size classes under different tillage treatments (CT—ploughing, MT—minimum tillage, NTct—no-till after CT, NTmt—no-till after MT) at both sites (L—loamy and SC—silty clay) at 0–10 and 10–20 cm. Different letters indicate a significant difference in the mass fraction of aggregates between the treatments at the same site and depth (p < 0.05); only significant differences are shown.
Soilsystems 10 00035 g003
Figure 4. Soil organic carbon (SOC, t ha−1), mineral-associated organic carbon (MAOC <50 µm, t ha−1), particulate organic carbon (POC, t ha−1), permanganate-oxidizable organic carbon (POX-C, t ha−1) and dissolved organic carbon (DOC, t ha−1) for both sites (L—loamy and SC—silty clay) in different tillage treatments (CT—ploughing, MT—minimum tillage, NTct—no-till after CT, NTmt—no-till after MT) and depths (0–10 cm and 10–20 cm). Different letters indicate a significant difference (p < 0.05) in C fraction between the treatments and depths at the same site. Presented are means and standard errors.
Soilsystems 10 00035 g004
Figure 5. Correlation matrix (n = 64) for aggregate stability indices and organic carbon fractions. The numbers indicate the Spearman correlation coefficient (rS), which is highlighted by the colour scale. Blank areas indicate non-significant correlations (p > 0.05).
Soilsystems 10 00035 g005
Table 1. Physical properties of the bulk samples from October 2021 (texture (%), fine fraction < 20 µm (%), dry bulk density (t m−3) and SOC (%)) at both sites (L and SC) with different tillage treatments (CT, MT, NTct and NTmt) and depths (0–10 cm and 10–20 cm). The values are mean values ± SEM. Different lower-case letters within each column indicate a significant difference (p < 0.05) between treatments at the same site, upper-case letters indicate a significant difference between treatments and depths at both sites (p < 0.05).
Site, Treatment and Depth (cm)Texture (%)Fine Fraction
<20 µm (%)
Dry Bulk Density
(t m−3)
SOC
(%)
SandSiltClay
LCT0–1036.0 ± 1.7 Ca44.1 ± 1.5 Aa20.0 ± 0.3 Aab47.4 ± 3.2 Ba1.20 ± 0.05 ABCDa1.5 ± 0.1 ABa
10–2036.5 ± 2.0 Ca43.0 ± 1.4 Aa20.6 ± 0.6 Aab47.5 ± 3.4 Ba1.36 ± 0.04 CDEab1.5 ± 0.1 ABa
MT0–1041.0 ± 2.7 Ca40.6 ± 2.5 Aa18.4 ± 0.5 Aa43.7 ± 3.8 Ba1.30 ± 0.03 ABCDEab1.9 ± 0.1 ABCDbc
10–2041.3 ± 3.2 Ca38.7 ± 2.7 Aa20.1 ± 0.6 Aab43.7 ± 4.5 Ba1.43 ± 0.06 Eab1.4 ± 0.1 ABa
NTct0–1036.8 ± 1.5 Ca43.5 ± 1.4 Aa19.6 ± 0.7 Aab46.8 ± 2.1 Ba1.34 ± 0.04 BCDEab2.0 ± 0.2 BCDc
10–2037.0 ± 1.2 Ca42.0 ± 1.0 Aa21.0 ± 0.3 Ab46.9 ± 1.8 Ba1.38 ± 0.06 DEab1.6 ± 0.1 ABab
NTmt0–1037.0 ± 2.5 Ca43.8 ± 3.1 Aa19.3 ± 0.6 Aab46.5 ± 3.0 Ba1.37 ± 0.03 DEab1.8 ± 0.2 ABCbc
10–2036.2 ± 2.2 Ca42.3 ± 2.3 Aa21.6 ± 0.3 Ab47.7 ± 2.9 Ba1.31 ± 0.07 ABCDEab1.4 ± 0.1 Aa
SCCT0–107.9 ± 0.6 Ab44.8 ± 0.8 Aa47.4 ± 1.4 Ca81.4 ± 1.5 Aa1.11 ± 0.05 ABCa2.6 ± 0.2 DEFa
10–207.8 ± 0.6 Ab44.3 ± 1.6 Aa47.8 ± 1.0 Ca82.3 ± 0.8 Aa1.20 ± 0.09 ABCDEa2.5 ± 0.3 CDEFa
MT0–1011.8 ± 2.3 ABa45.4 ± 1.6 Aa42.8 ± 2.0 Ba76.8 ± 3.5 Aa1.06 ± 0.02 Aa3.1 ± 0.6 Fa
10–2013.6 ± 2.5 Ba40.7 ± 1.1 Aa45.7 ± 1.4 BCa77.6 ± 4.7 Aa1.10 ± 0.03 ABa2.4 ± 0.5 CDEa
NTct0–109.9 ± 1.2 ABa45.8 ± 1.0 Aa44.3 ± 1.1 BCa80.7 ± 0.4 Aa1.15 ± 0.04 ABCDa2.7 ± 0.3 EFa
10–209.4 ± 0.5 ABa45.3 ± 1.6 Aa45.3 ± 1.1 BCa80.3 ± 1.0 Aa1.12 ± 0.02 ABCa2.5 ± 0.2 CDEa
NTmt0–108.4 ± 0.2 ABa45.9 ± 2.5 Aa45.7 ± 2.7 BCa80.5 ± 2.2 Aa1.17 ± 0.02 ABCDa3.0 ± 0.2 EFa
10–208.8 ± 0.9 ABa43.6 ± 1.2 Aa47.6 ± 2.0 Ca80.7 ± 2.2 Aa1.11 ± 0.02 ABCa2.4 ± 0.0 CDEa
SOC—soil organic carbon; site L—loamy; site SC—silty clay; tillage treatments: CT—ploughing, MT—minimum tillage, NTct—no-till after CT, NTmt—no-till after MT.
Table 2. Structural indices (WSA, MWD, GMD, Dm and Dn) at both sites (L and SC) with different tillage treatments (CT, MT, NTct and NTmt) and depths (0–10 cm and 10–20 cm). The values are mean values ± SEM. Different lower-case letters in each column indicate a significant difference between treatments, at the same site and depth (p < 0.05), upper-case letters indicate significant differences between treatments, sites and depths (p < 0.05).
Site, Treatment and Depth (cm)WSAMWDGMDDmDn
(%)(mm)(mm)
LCT0–1087.26 ± 3.43 Aa5.12 ± 1.06 Aa2.49 ± 0.51 Aa2.48 ± 0.03 Da0.85 ± 0.04 Aa
10–2095.31 ± 1.68 Aa6.50 ± 1.06 ABa3.48 ± 0.58 ABa2.39 ± 0.02 Da0.88 ± 0.03 Aa
MT0–1094.74 ± 1.87 Aa5.26 ± 1.70 Aa2.62 ± 1.01 Aa2.51 ± 0.04 Da0.79 ± 0.04 Aa
10–2094.40 ± 1.44 Aa5.61 ± 1.90 ABa2.78 ± 1.05 Aa2.50 ± 0.04 Da0.80 ± 0.06 Aa
NTct0–1097.87 ± 1.25 Aa7.68 ± 1.43 ABa3.97 ± 0.87 ABa2.41 ± 0.03 Da0.79 ± 0.04 Aa
10–2093.56 ± 2.10 Aa7.82 ± 1.83 ABa3.86 ± 1.05 ABa2.42 ± 0.02 Da0.78 ± 0.05 Aa
NTmt0–1098.76 ± 0.23 Aa8.72 ± 1.57 ABa4.61 ± 1.01 ABa2.36 ± 0.03 Da0.81 ± 0.03 Aa
10–2095.49 ± 0.85 Aa6.16 ± 1.30 ABa3.16 ± 0.76 ABa2.43 ± 0.03 Da0.86 ± 0.04 Aa
SCCT0–1094.15 ± 4.25 Aa10.98 ± 3.14 BCa6.95 ± 2.34 BCa2.11 ± 0.06 Cb1.04 ± 0.05 Aa
10–2095.25 ± 0.22 Aa20.26 ± 1.39 DEb16.81 ± 2.07 Ca1.74 ± 0.05 ABa0.95 ± 0.04 Aa
MT0–1099.35 ± 0.19 Aa14.47 ± 3.49 CDab10.34 ± 3.96 Ca1.98 ± 0.13 BCab0.99 ± 0.03 Aa
10–2095.79 ± 0.76 Aa20.16 ± 1.60 DEb16.50 ± 2.17 Ca1.77 ± 0.06 ABab1.02 ± 0.10 Aa
NTct0–1098.99 ± 0.64 Aa16.76 ± 0.43 CDEab12.17 ± 0.32 Ca1.91 ± 0.04 ABCab0.99 ± 0.05 Aa
10–2095.81 ± 0.14 Aa20.65 ± 1.15 Eb17.30 ± 1.51 Ca1.70 ± 0.04 Aa1.03 ± 0.02 Aa
NTmt0–1099.46 ± 0.16 Aa18.78 ± 1.25 DEb14.82 ± 1.58 Ca1.79 ± 0.03 ABab1.02 ± 0.06 Aa
10–2095.55 ± 0.24 Aa19.83 ± 2.00 DEb16.34 ± 2.74 Ca1.74 ± 0.08 ABa0.99 ± 0.02 Aa
WSA—water-stable aggregate; MWD—mean weight diameter; GMD—geometric mean diameter; Dm—mass fractal dimension; Dn—Rosin–Rammler index; site L—loamy; site SC—silty clay; tillage treatments: CT—ploughing, MT—minimum tillage, NTct—no-till after CT, NTmt—no-till after MT.
Table 3. MAOC < 20 µm (Cfine) (t ha−1), Csat (t ha−1), Csd (t ha−1), F and MAOC in fine fraction < 20 µm (%) at both sites (L and SC) under different tillage treatments (CT, MT, NTct and NTmt) and at 0–10 cm depth. The values are mean values ± SEM. Different lower-case letters within each column indicate a significant difference (p < 0.05) between treatments at the same site and upper-case letters indicate a significant difference between treatments at both sites.
Site and TreatmentMAOC < 20 µm (Cfine)CsatCsdFMAOC in Fine Fraction < 20 µm (%)
(t ha−1)
LCT10.58 ± 0.33 Aa21.62 ± 0.59 Aa11.04 ± 0.56 ABb0.71 ± 0.02 ABCa1.73 ± 0.04 Aa
MT13.35 ± 0.56 ABb20.26 ± 0.70 Aa6.91 ± 1.17 Aa0.66 ± 0.02 ABCa2.33 ± 0.13 Bb
NTct13.80 ± 0.30 ABb21.39 ± 0.39 Aa7.59 ± 0.50 Aab0.66 ± 0.02 ABCa2.20 ± 0.09 ABb
NTmt13.39 ± 0.38 ABb21.30 ± 0.55 Aa7.90 ± 0.93 Aab0.64 ± 0.02 ABa2.12 ± 0.12 ABab
SCCT18.22 ± 1.09 Ca34.20 ± 0.38 Ba15.98 ± 1.34 Ba0.76 ± 0.02 Cb2.08 ± 0.05 ABa
MT17.23 ± 1.78 BCa32.49 ± 0.92 Ba15.26 ± 0.86 Ba0.61 ± 0.00 Aa2.45 ± 0.20 Ba
NTct19.56 ± 1.53 Ca33.96 ± 0.10 Ba14.40 ± 1.58 Ba0.74 ± 0.01 BCb2.20 ± 0.11 ABa
NTmt19.38 ± 0.25 Ca33.88 ± 0.57 Ba14.50 ± 0.66 Ba0.64 ± 0.05 ABCab2.28 ± 0.10 ABa
MAOC < 20 µm (Cfine)—organic carbon content in fine fraction < 20 µm; Csat—organic C sequestration potential in fine fraction; Csd—organic C sequestration deficit; F—MAOC proportion of total organic carbon (SOC), MAOC/(MAOC+POC); MAOC in fine fraction < 20 µm—proportion of MAOC in the fine fraction < 20 µm; site L—loamy and site SC—silty clay; tillage treatments: CT—ploughing, MT—minimum tillage, NTct—no-till after CT, NTmt—no-till after MT.
Disclaimer/Publisher’s Note: The statements, opinions and data contained in all publications are solely those of the individual author(s) and contributor(s) and not of MDPI and/or the editor(s). MDPI and/or the editor(s) disclaim responsibility for any injury to people or property resulting from any ideas, methods, instructions or products referred to in the content.