1. Introduction
When a charged particle passes close to a conducting material with a periodic structure, such as a grating, Smith–Purcell radiation (SPR) is produced [
1]. SPR is considered useful as a non-destructive beam monitor because it can be obtained without interfering with the beam, the periodic length of a grating can select the frequency range of the radiation and the frequency is dispersed depending on the observation angle [
2].
In the surface current (SC) model, the radiation is treated as being caused by induced charge moving on the surface of the perfectly conducting grating [
3]. The SC model is widely used to evaluate the intensity distribution of Smith–Purcell radiation [
4], since it can offer an analytical expression for radiated intensity which provides a more physically intuitive aspect and simpler method of computation than those in modal expansion theories. However, our earlier measurements for coherent Smith–Purcell radiation (CSPR) did not match the predictions based on the SC model. The original SC model does not consider that the electric field generated by charged particles is blocked by the grating itself and thus only partially induces surface charge (shading effect). In our previous paper, we proposed a modification to the surface current model to take into account the shading effect and presented measurement results of CSPR in the terahertz frequency region [
5]. It was shown that the modified model can explain the measurement results qualitatively in terms of polarization and the azimuthal angle distribution of the CSPR. In this paper, we further investigated the radiation property by preparing two gratings with different blaze angles and comparing the measured characteristics of CSPR with the modified SC model calculation.
2. Surface Current Model with Shading Effect
The SC model allows for a relatively easy approach in its mathematical treatment and offers a good physical insight into the emission process [
6]. However, the model includes some assumptions, particularly with respect to the generation of surface charges, and it neglects the effects of the shaded areas of the grating.
In the SC model, the surface charge density
ρ induced on the grating is determined by the component of the electric field perpendicular to the surface. This field is calculated using the Liénard–Wiechert potentials, which describe the electromagnetic field produced by a relativistic electron and are evaluated at the retarded time corresponding to the electron’s position and the observation point on the grating [
7]. When a relativistic electron passes near the grating surface, the physical structure of the grating can obstruct the electric field, creating shadowed regions where the field cannot directly reach. This phenomenon, referred to as the shading effect, alters the distribution of the induced surface charge and thereby influences the characteristics of SPR. To calculate the SPR intensity based on the SC model, we developed an approach using numerical calculations [
5]. The SPR distribution is calculated by numerically integrating the surface current on the grating surface. The influence of the shading effect can be evaluated by calculating the surface current taking into account the condition where the electric field of the electron corresponding to the retarded time is geometrically blocked. This makes it possible to compare calculations with and without the shading effect.
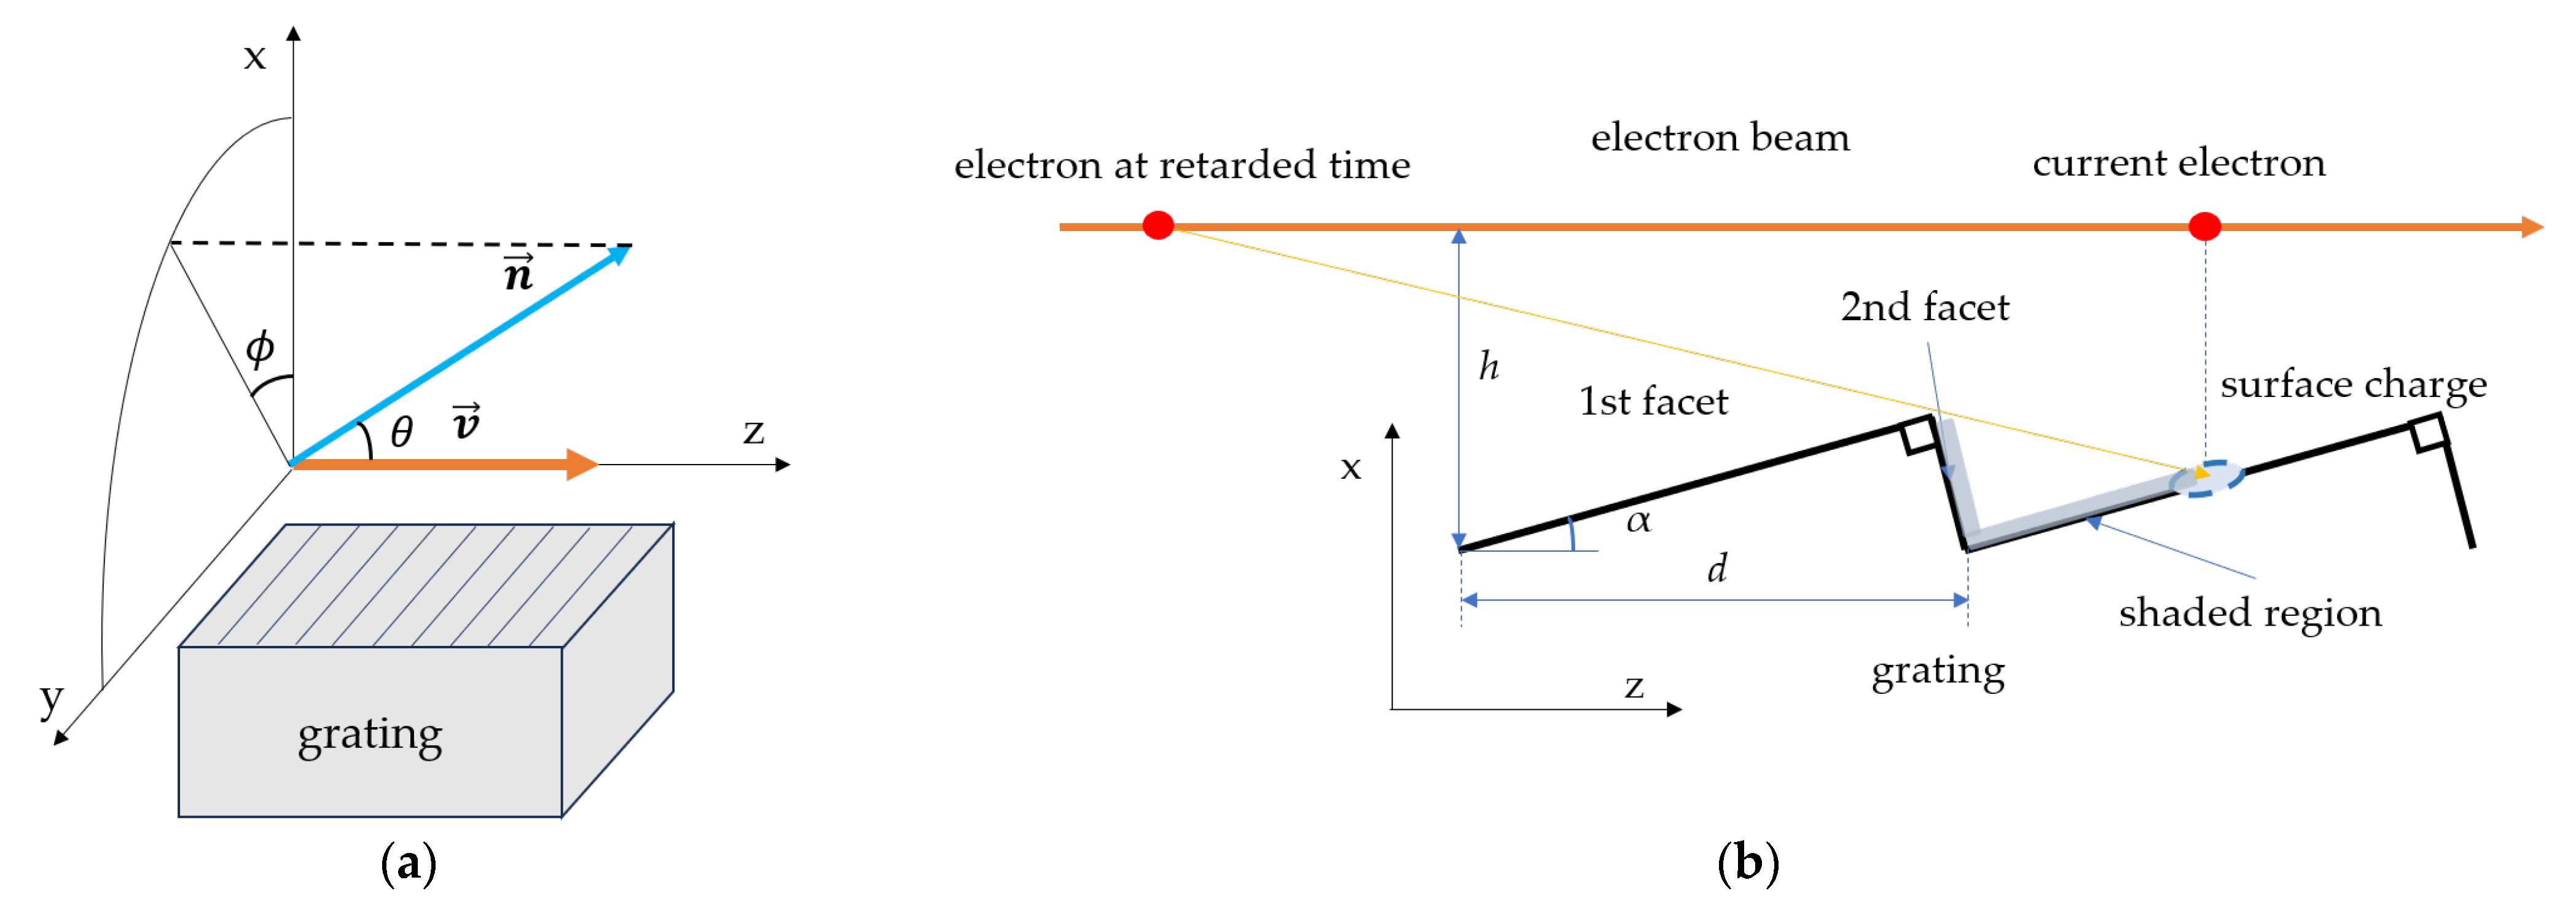
Figure 1 shows the coordinate system and grating geometry, where α is the blaze angle of the grating,
d is the periodic length of the grating,
h is the distance from the bottom of the grating groove to the beam (impact parameter),
is the unit vector of the observation direction and φ and θ are the azimuthal angle and the observation angle with respect to the
z-axis, respectively.
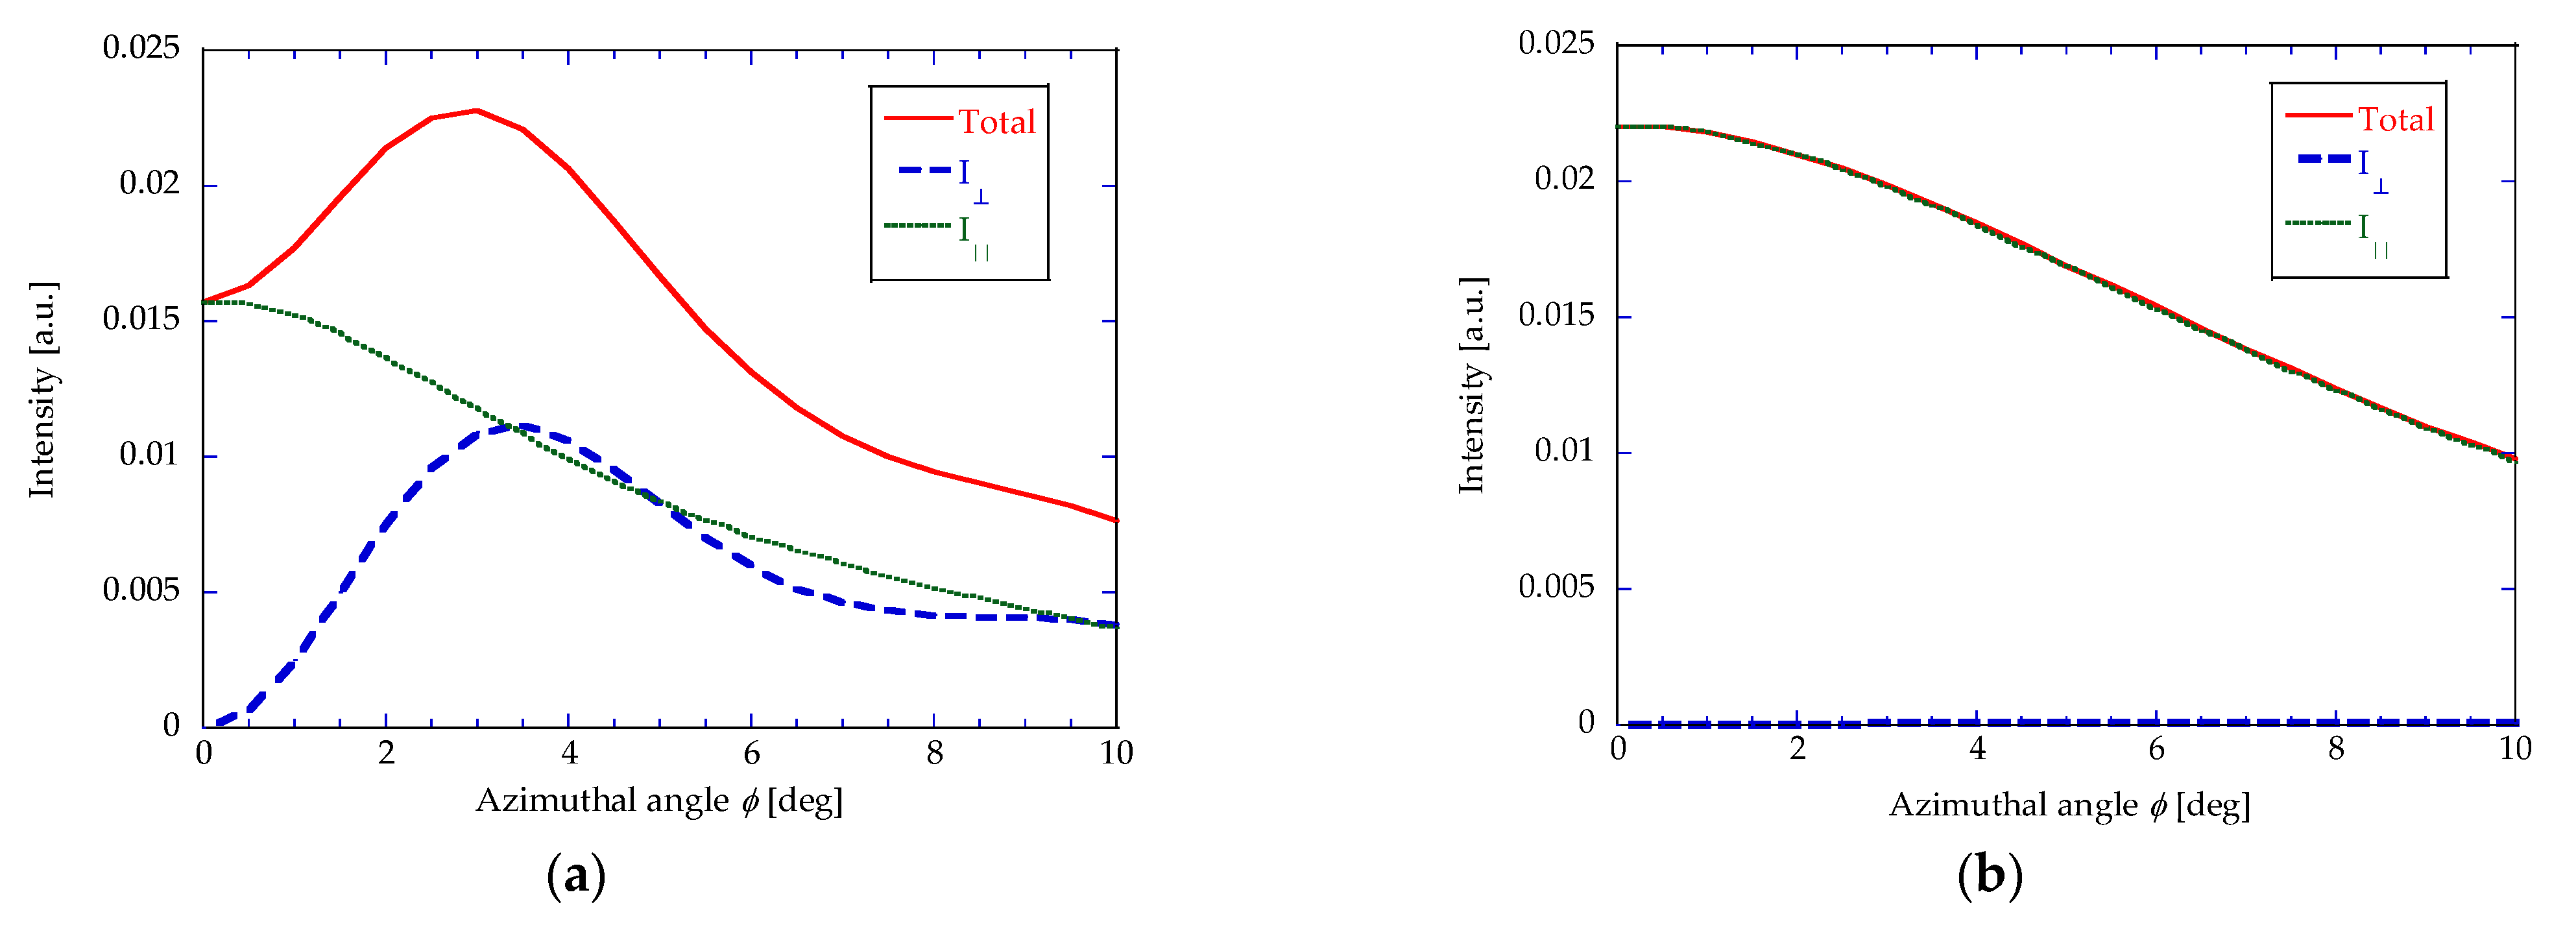
Taking the shading effect into account, almost no surface charge is induced in the shaded regions of the grating, resulting in a surface charge distribution that differs significantly from that of the original model. Consequently, it was found that the contribution from the second facet is significantly eliminated under our experimental conditions (
Table 1 and
Table 2). In the original SC model, both facets contribute to radiation, and thus the resulting azimuthal angular distribution shows a double-peak structure with a local minimum at
ϕ = 0, as shown in
Figure 2a. In contrast, our estimation with the shading effect exhibits the distribution of a single-peak structure with a maximum at
ϕ = 0.
Figure 2 shows the SPR intensity with respect to the azimuthal angle
ϕ for both cases. This change is closely related to the polarization components of the emitted radiation. As described in [
5], the electric field component on the vector
and
plane is defined as
, while the electric field component perpendicular to
is defined as
. This
corresponds to the y component, which is parallel to the grating groove, when
degrees.
Figure 2 shows the azimuthal distribution of the SPR intensity (
and
) for the polarized components corresponding to
and
, respectively. In the original SC model, both the
and
components are present. Near
ϕ = 0, the oppositely oriented electric field components cancel each other out, so the radiated intensity distribution peaks at
ϕ ≠ 0. However, when the shading effect is considered, the absence of surface charge on the shaded facet strongly suppresses the
component under our experimental conditions. As a result, the emitted radiation becomes predominantly
, which inherently exhibits a single-peak azimuthal distribution centered at
ϕ = 0, as shown in
Figure 2b.
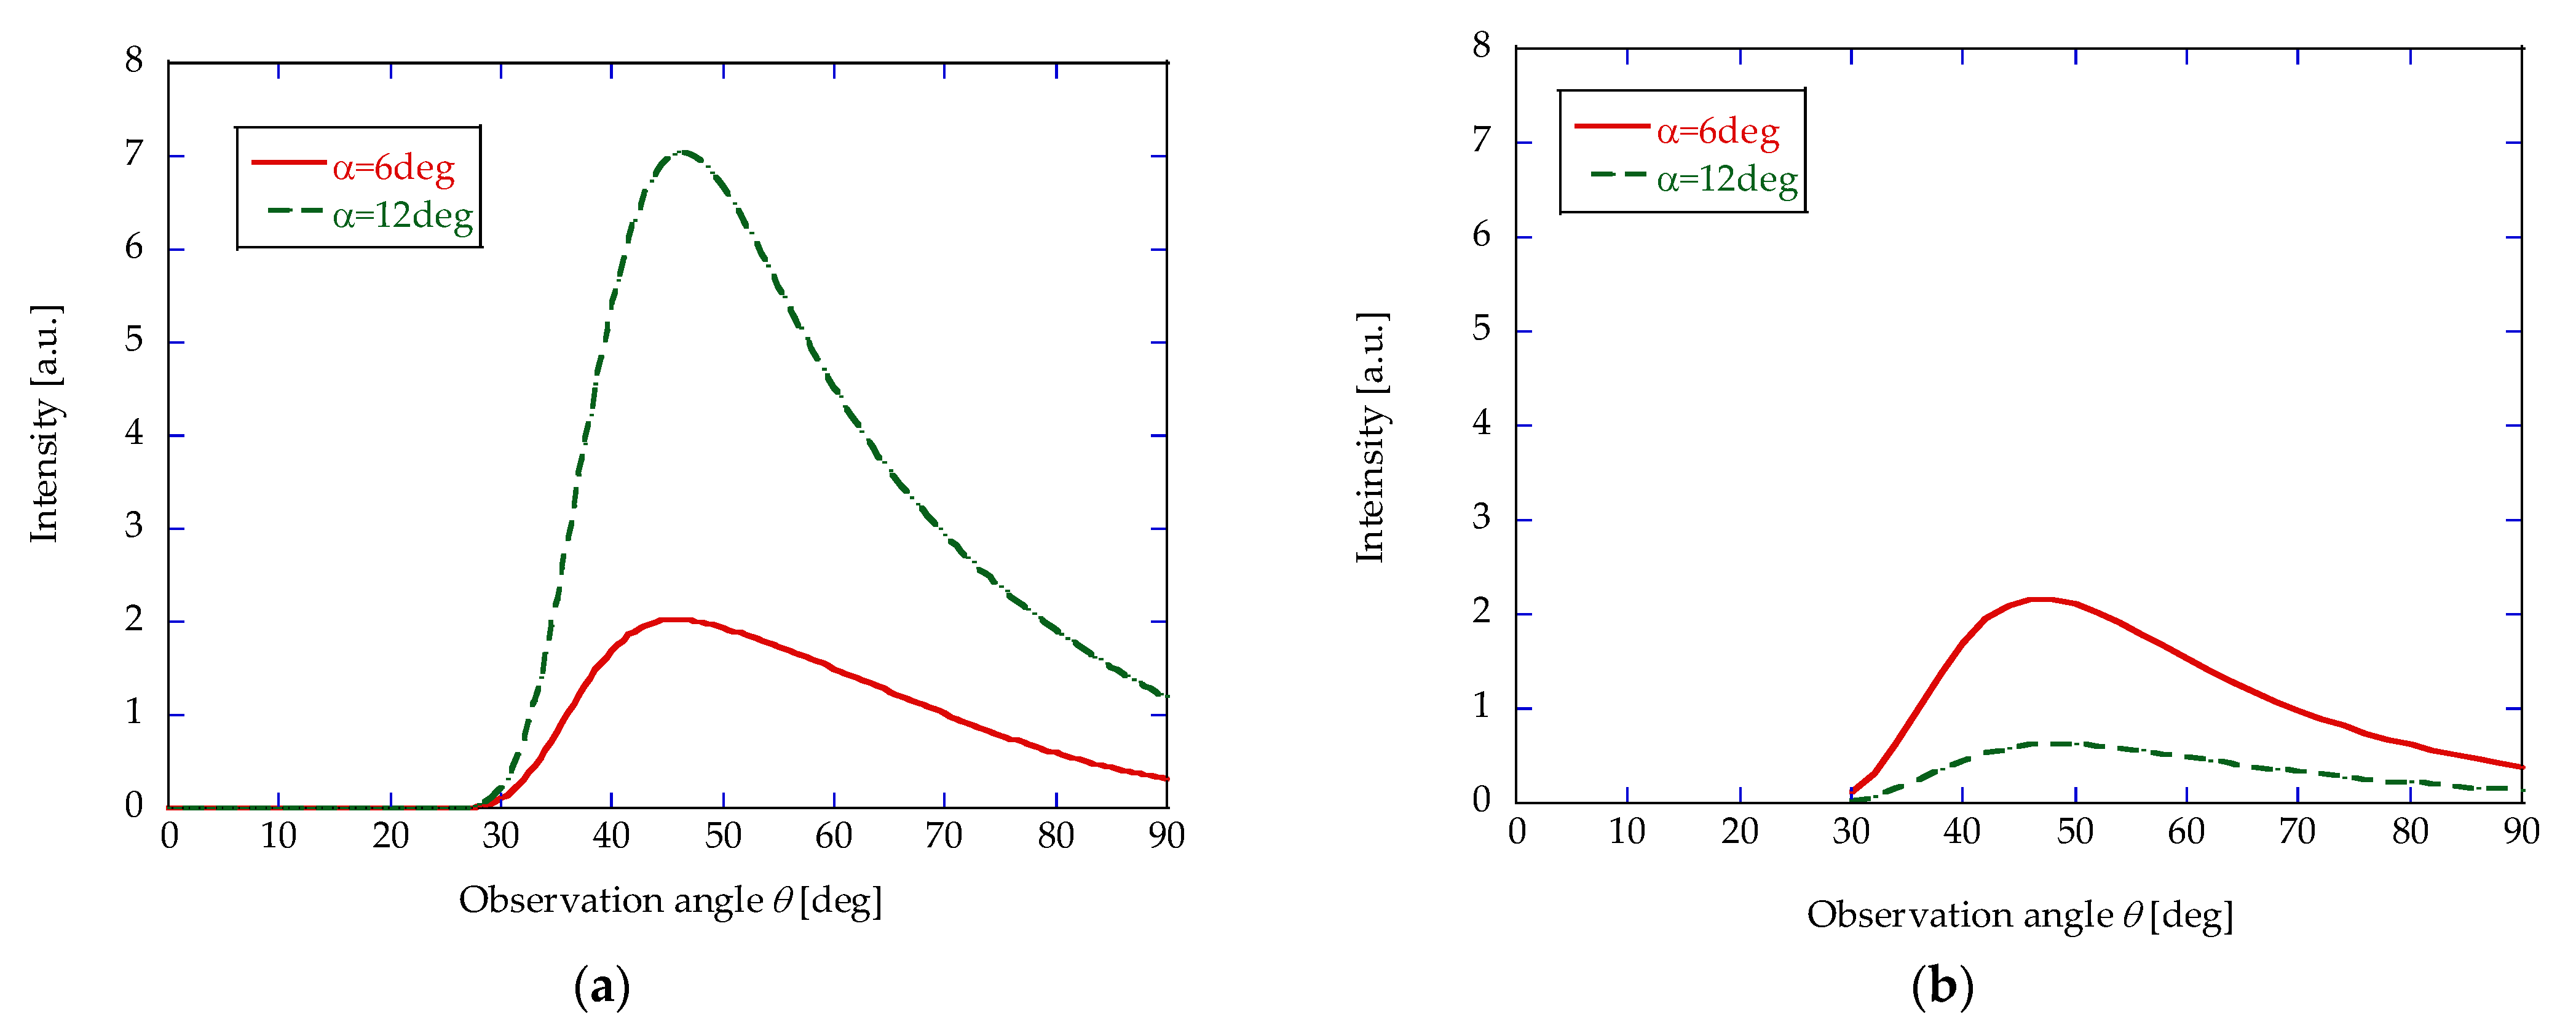
The shading effect also influences the blaze angle dependence of the radiation intensity. While the original SC model predicts an increase in radiation intensity with increasing blaze angle, our calculations show the opposite trend under shading conditions: the radiation intensity decreases with increasing blaze angle due to the enhanced obscuration of the first facet.
Figure 3 shows the angular distribution for gratings with different blaze angles for bunch length 100 fs. The original SC model under our experimental conditions shows that the radiation intensity increases with increasing grating blaze angle. On the other hand, an evaluation of the modified SC model considering the shading effect predicts that the radiation intensity will increase when the blaze angle of the grating is smaller. Further experimental investigations were performed to verify the shading effect with respect to these discrepancies, as presented in the next section.
3. Experiment
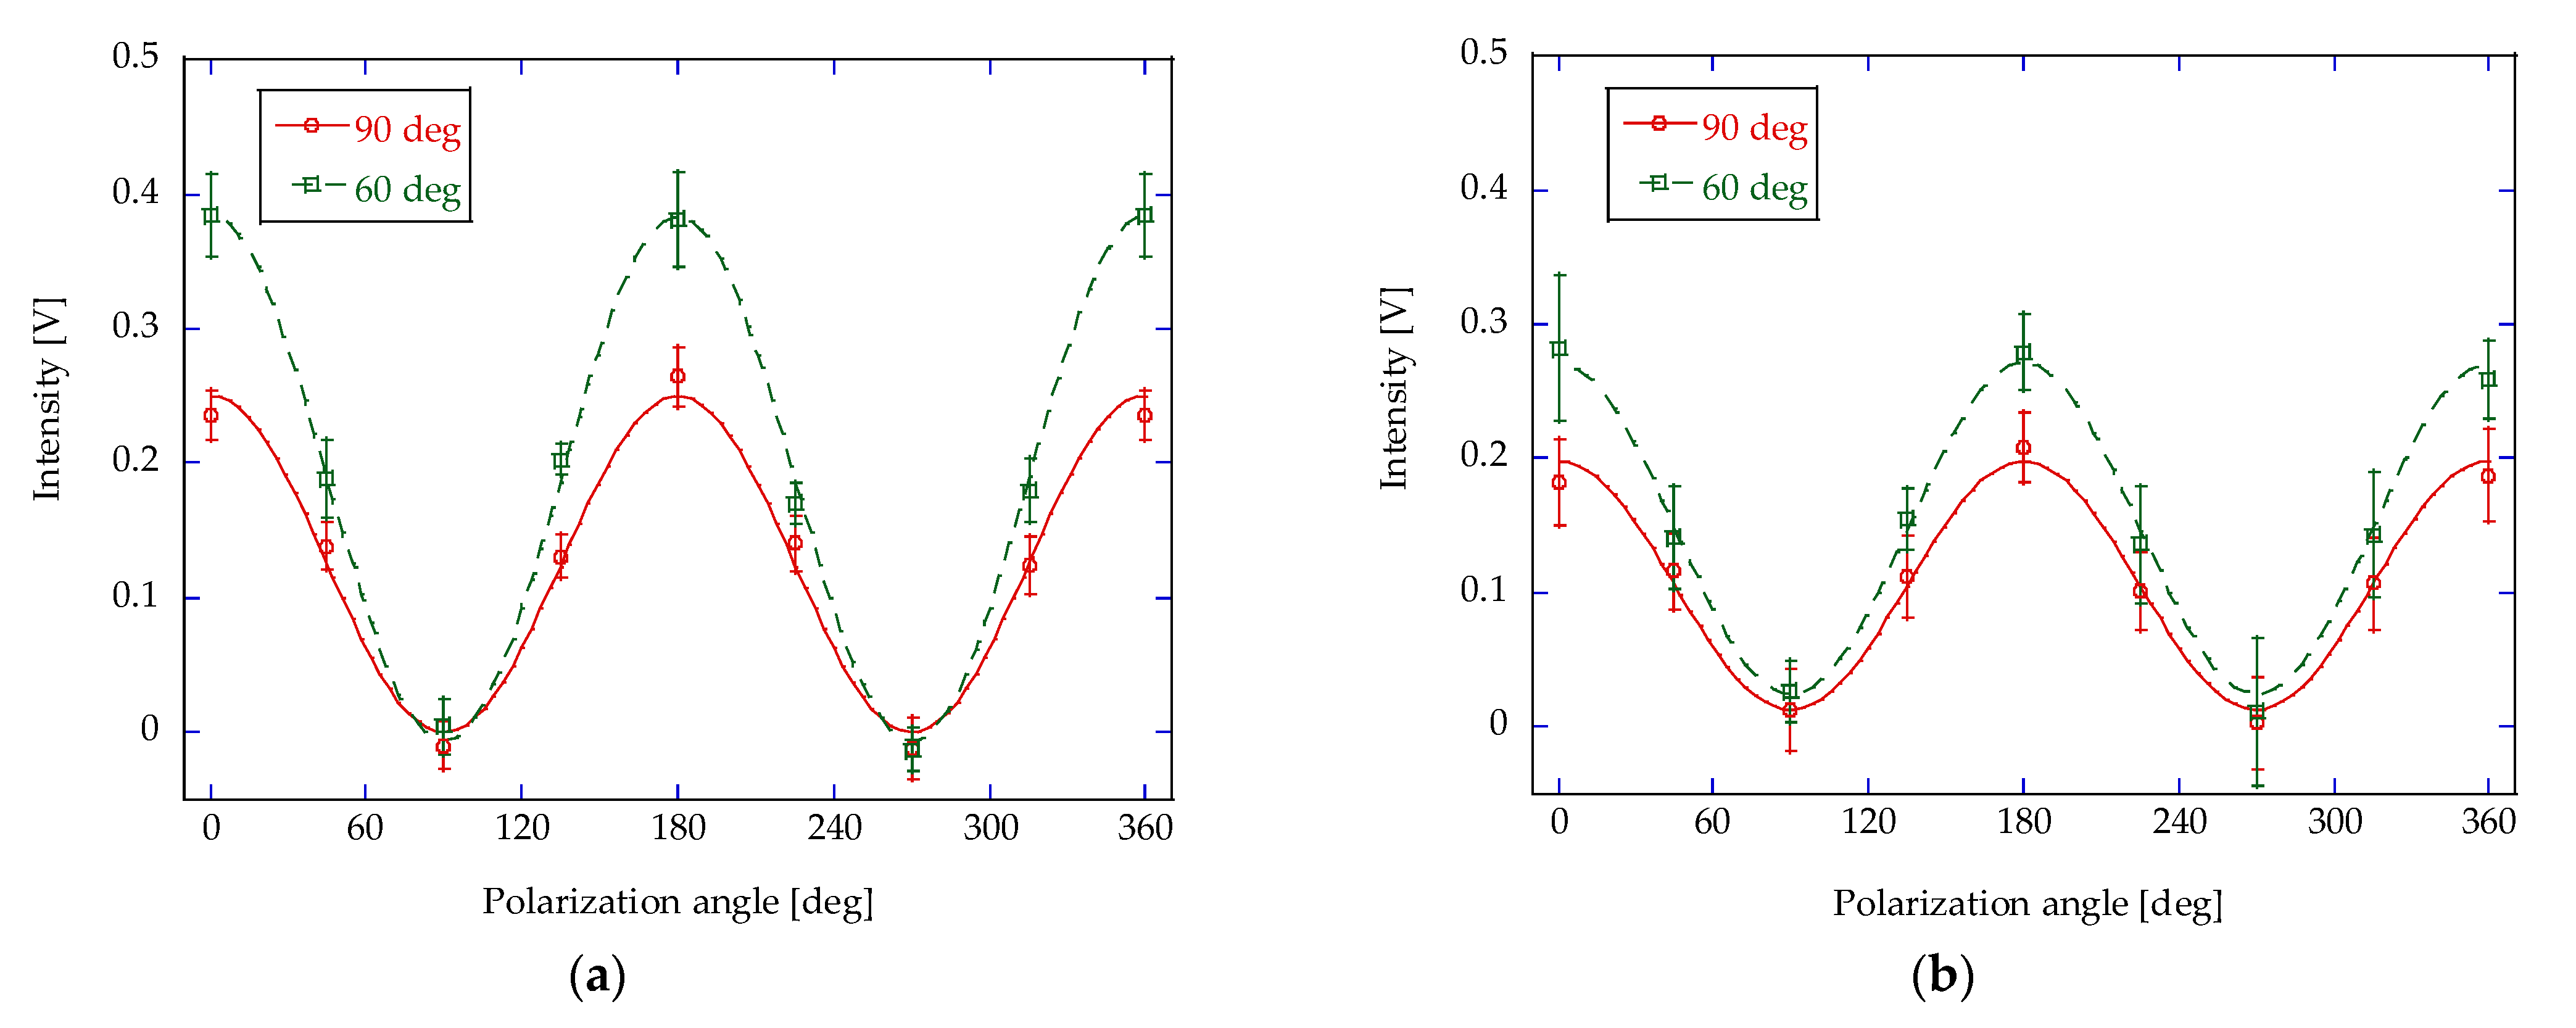
The experiments in this study were conducted using the very short electron bunch, less than 100 fs in the test accelerator, t-ACTS at Tohoku University. In this experiment, to investigate the influence of the shading effect, two gratings with different blaze angles were prepared, and the following measurements were performed. (1) Polarization measurement: The polarization state of CSPR was measured in the medium plane
to compare the expectations of the SC model with and without the shading effect. (2) Angular distribution measurement: The intensity distribution concerning the emission angle (
θ) was measured to investigate the response of the blaze angle of the grating on the radiation intensity. The beam parameters used in the experiment are shown in
Table 1.
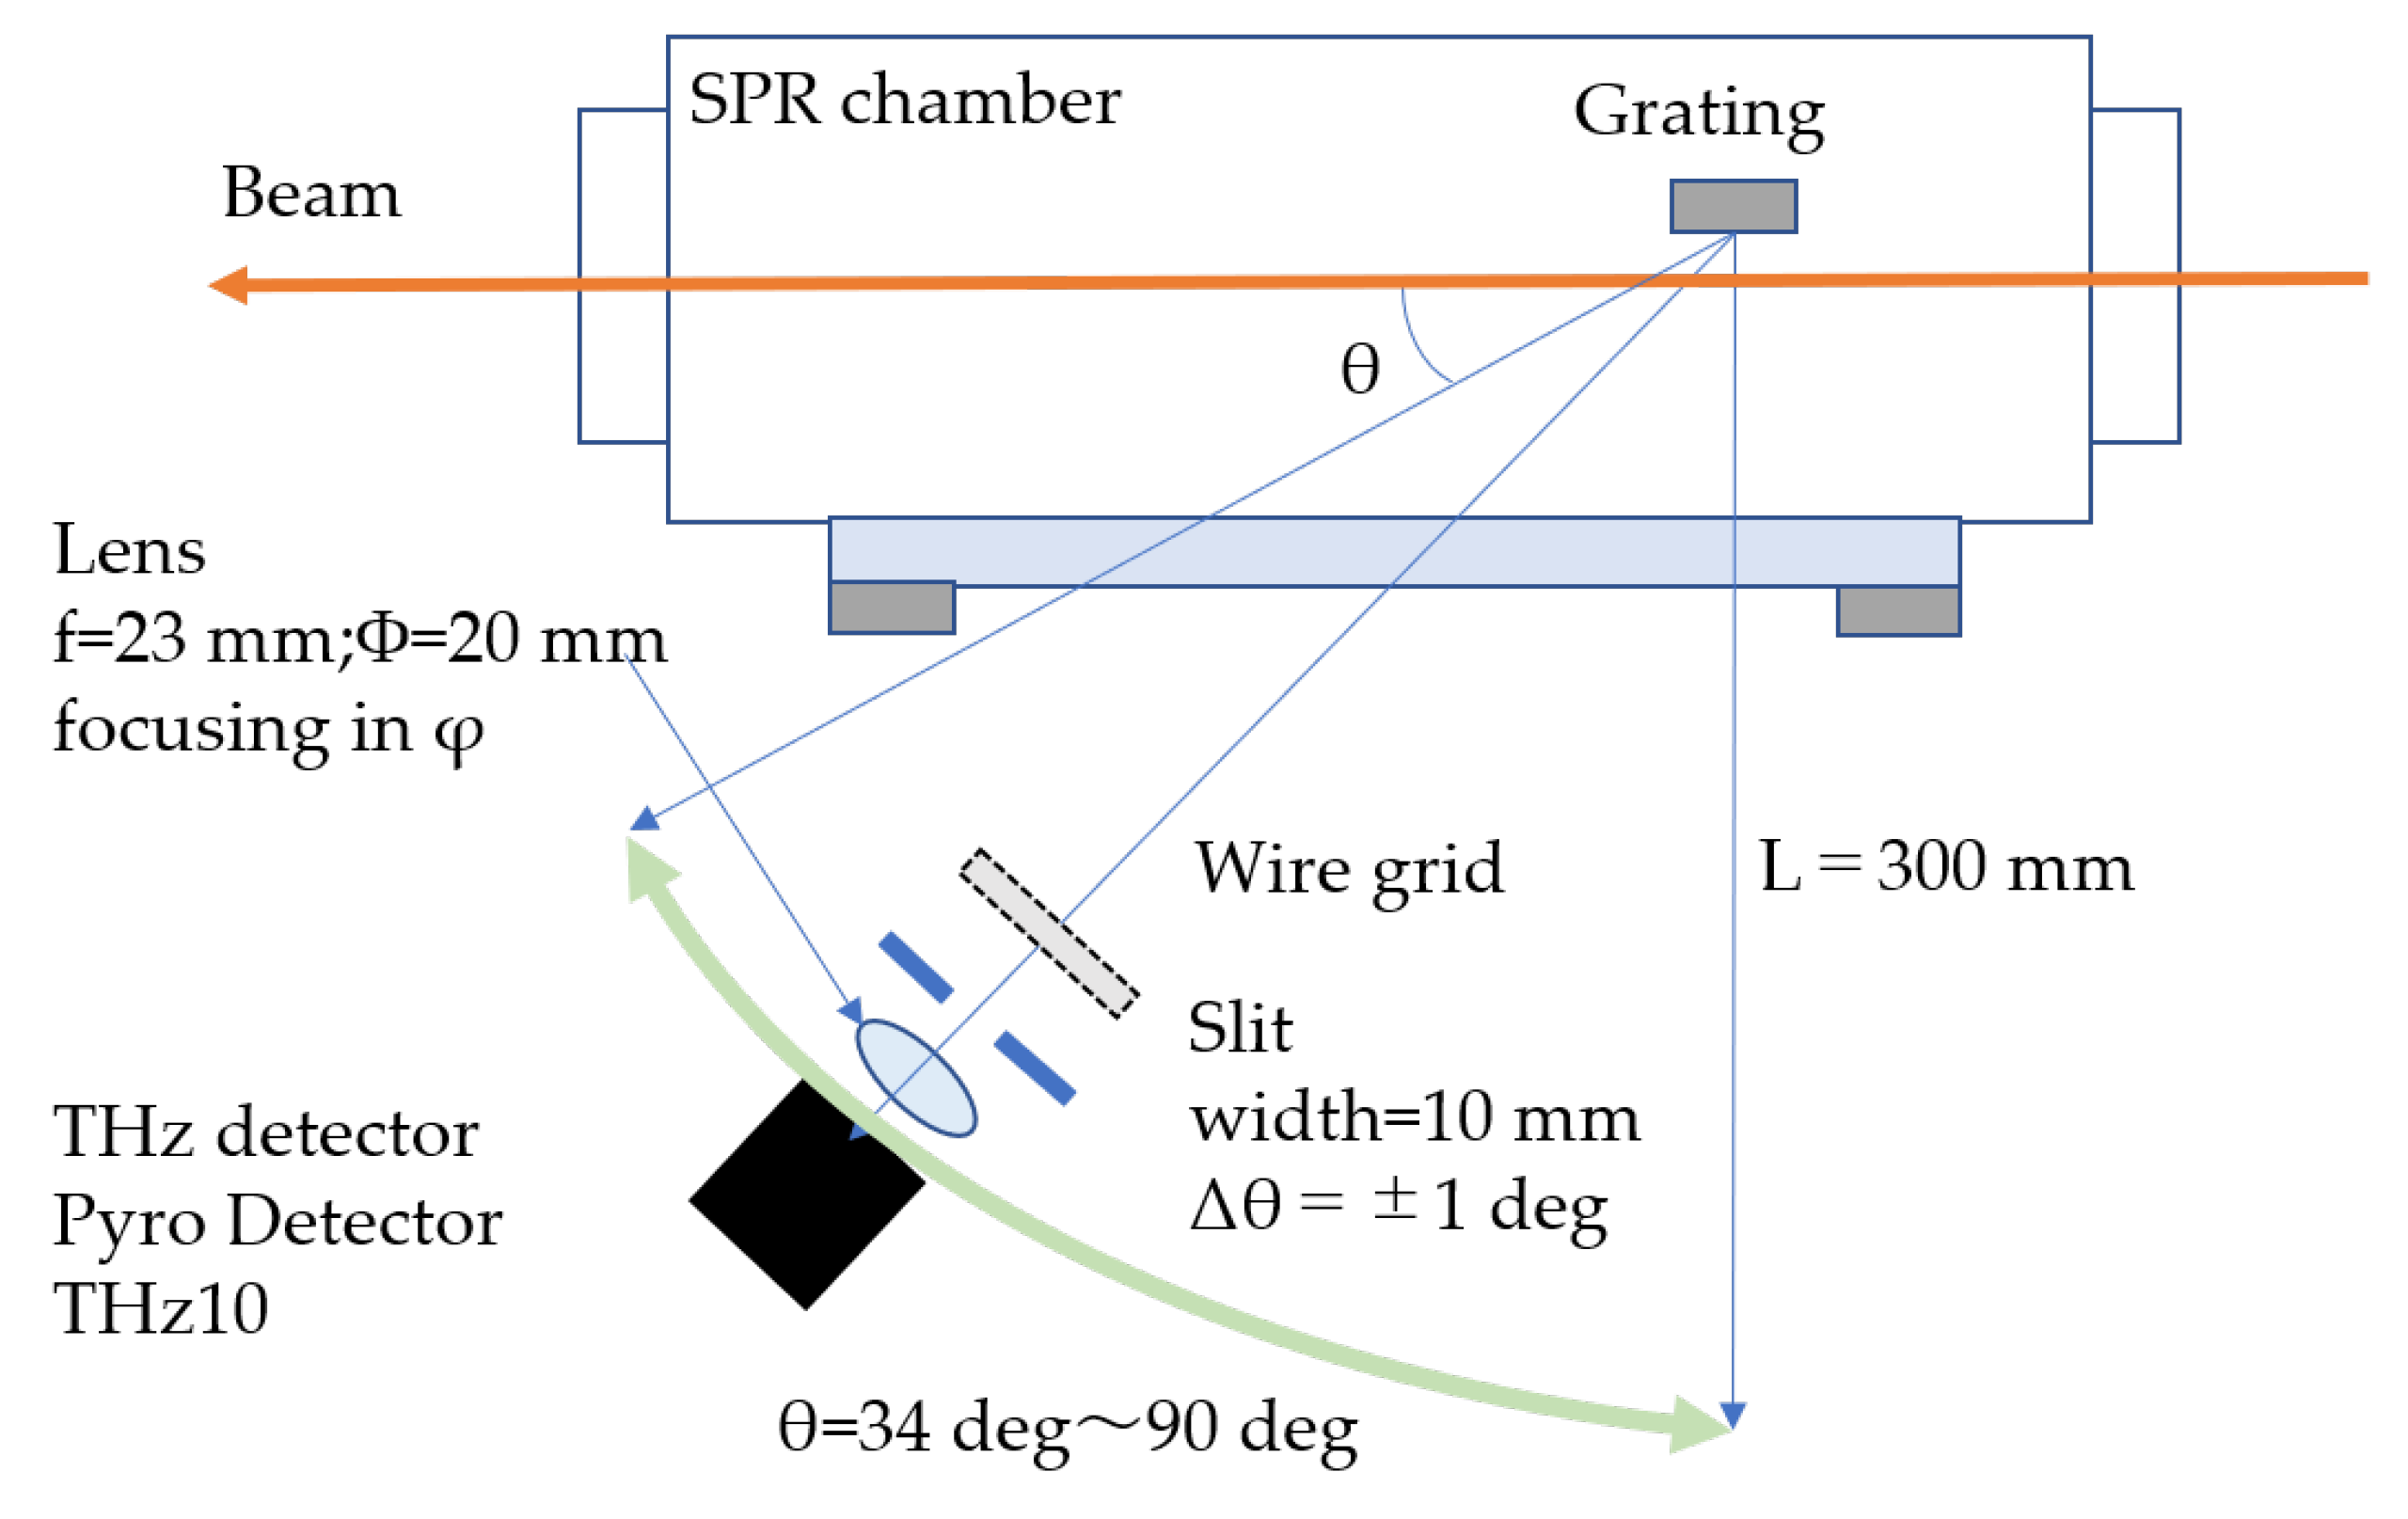
A schematic of the measurement system is shown in
Figure 4. The grating made of an aluminum alloy is attached to a base fixed to the tip of a linear feedthrough that can be inserted into the SPR chamber. A mirror is also attached to the same base to observe the beam position and profile. In the measurements, the horizontal beam size at the grating position was focused to less than 100 μm so that the tail of the beam would not hit the grating, while the distance between the beam and the grating was adjusted to 750 μm. The SPR measurement system was located at 2 m downstream from the accelerating structure in the t-ACTS beamline. The emitted SPR was then directed to the measurement system through a vacuum window of a Z-cut crystal, which has a high transmittance of 60–80% in the range of 0.5–2 THz and 40–60% at 2–3 THz. The entire measurement system was covered, and its inside was replaced with dry air to suppress the absorption of THz light by water.
Two gratings with a blaze angle α of 6 degrees and 12 degrees were prepared for the measurements. Both had a periodic length of 600 μm, a number of periods of 21 and an apex angle of 90 degrees. It was confirmed that the periodic length of the gratings was manufactured with a precision of 600 ± 3 microns. The parameters of the gratings are summarized in
Table 2. The frequency range of the fundamental radiation is 0.5 THz to 2.76 THz for the periodic length of 600 μm, the observation angle range of 90 to 34 degrees and the beam energy of 22 MeV. A pyroelectric detector (THz10, SLT Sensor- and Laser Techniques), which has high sensitivity and wide bandwidth in the terahertz frequency region, was used to detect CSPR. A lens with a diameter of 1 inch was installed for focusing the radiation. The angular acceptance was limited to ±1 degree by a horizontal aperture to define the resolution. The measurement of angular distribution was performed in the
direction over an angular range from 34 to 90 degrees in the median plane
while keeping the optical path length L (the distance from the center of the grating to the detector) at 300 mm. The polarization of SPR was measured at observation angle
θ = 60, 90 degrees. A wire grid polarizer with a wire diameter of 10 μm and a wire separation of 25 μm (57207, SPECAC, Orpington, UK) was placed in front of the detector. The acceptance in the
ϕ direction for the measurements is ±2.7 degrees. In addition, a dummy block with the same dimension but no groove was used to measure the background. The signal waveform of CSPR from the THz detector exhibits a steep leading edge of approximately 0.2 ms, followed by a rather slow decay over several milliseconds. For this THz detector signal, which fluctuates with each shot, the baseline level was determined by averaging the signal for 2 milliseconds before the trigger. This baseline was then subtracted from the average of the signal within a 0.1 ms region around its peak after the trigger, in order to determine the signal intensity. A similar measurement was performed using a dummy block, and a background value of approximately 20 mV was subtracted from this measured signal. The measurement error was evaluated from the variation in these obtained values over 20 shots.
5. Discussion
In this study, we measured polarization, azimuthal angular distribution and the response of the grating blaze angle to CSPR intensity. We then compared these experimental results with numerical calculations for both cases with and without the shading effect. The experimental results are consistent with the predictions of the modified SC model in terms of the degree of polarization and the response to different blaze angles, supporting the need to incorporate the shading effect in the SC model.
The polarization measurement errors shown in
Table 3 are caused by shot-to-shot variations in the measured waveform. To facilitate further detailed discussions, an improvement in the signal-to-noise ratio (SNR) is important. A significant challenge we currently face is the exceedingly low intensity of the CSPR signal. To detect this weak signal, we employ a substantial amplification gain of 10,000 for the pyroelectric detector. However, this high amplification inherently compromises the SNR. The dominant noise in the measured waveform is partially random and distributed throughout the signal region. Its fluctuation amplitude typically ranges from 20 to 40 mV, which represents approximately 10% of the signal strength, even at the observation angle yielding the maximum signal. Crucially, these noises are evident even when the detector’s light path is physically obstructed. This observation indicates that their origin is not exclusively optical but is also attributable to electromagnetic environmental noise or radiation noise stemming from minor beam losses.
In our current measurement configuration, it is known that when the grating and the electron beam are in close proximity, radiation-induced noise appears as a peak of opposite polarity to the optical signal waveform. While this noise decreases with an increasing impact parameter, the signal strength also diminishes. Therefore, in actual measurements, the impact parameter was set to 750 μm to allow for sufficient noise attenuation while maintaining a moderate signal strength. On the other hand, the frequency range occupied by electromagnetic environmental noise is almost identical to that of the observed signal. Consequently, noise removal using a filter proved ineffective, and we could not entirely eliminate it. The effect of this noise is particularly noticeable at a polarizer rotation angle of 90°, where the CSPR signal reaches its minimum value, which is almost comparable to the noise level. This may significantly contribute to uncertainties in evaluating the degree of polarization. The measurement errors of the degree of polarization presented in
Table 3 do not include systematic errors. If we assume that a maximum noise of approximately 40 mV systematically contributes to the subtraction of this background level, the uncertainty of the degree of polarization is estimated to be approximately 0.08, which is still small compared to the stated measurement error. To advance our investigation, it is imperative to improve the SNR; thus increasing the CSPR signal strength is essential. One promising approach is to increase the bunch charge of the electron beam. Currently an upgrade project to introduce a photocathode rf gun is underway, which is expected to significantly increase the bunch charges. This upgrade will significantly increase the signal intensity and allow the amplifier gain to be kept low, thereby improving the SNR and thus the reliability of the overall measurement.
In addition, the measurement results shown in
Figure 6 were compared with the calculation results shown in
Figure 3 for the angular distribution. The measurement results are almost flat from 40 to 70 degrees, especially for the distribution at a blaze angle of 6 degrees. This discrepancy differs from the shape predicted by the calculation. One reason for this discrepancy is that the calculation evaluates the transverse bunch shape as Gaussian, but the actual bunch shape may not be perfectly Gaussian. According to a tracking simulation using the GPT code [
8], the bunch shape is evaluated to be roughly Gaussian in the range where the bunch length is close to its minimum value, although there is a slight tail.
For this experiment, Z-cut quartz was used as the vacuum window for CSPR extraction due to its high transmittance in the terahertz range. However, since quartz is not an isotropic material, it may exhibit characteristics different from those expected when radiation is incident on the window at a finite angle. Although preliminary measurements with coherent transition radiation confirmed that the transmittance does not significantly differ between oblique and perpendicular incidence, the development of a new vacuum window using optically isotropic TPX material is also being considered for future experiments.
6. Conclusions
CSPR shows promise as a non-destructive beam monitor, as it emits radiation without beam interference, its emission wavelength has an angular dispersion and its wavelength range can be selected by the periodic length of the grating. In evaluating the angular distribution of this CSPR, the SC model was used due to the simplicity of calculation, but our previous experimental results did not agree with the model prediction. We modified the original SC model by incorporating the shading effect, in which the electric field is blocked by the grating structure, which was not considered in the original SC model. Measurements were performed to confirm this experimentally using gratings with different blaze angles. All the experimental results with respect to the degree of polarization and the response to different blaze angles are consistent with the modified SC model, which supports the need to incorporate the shading effect in the SC model. However, because of a low SNR due to the very weak CSPR signal, there is room for improvement for a more detailed study. To improve the SNR, we are preparing to introduce a photocathode into the RF gun and increase the bunch charge by more than 10 times. Since the intensity of coherent radiation is proportional to the square of the bunch charge, this is expected to greatly increase the signal intensity. In addition, both the original SC model and the calculation considering the shading effect ignore the effects of the grating edge and the diffraction and/or reflection of the radiation. Since the shape of the measured angular distribution is somewhat different from that predicted by the modified model, these factors, including the effect of the transverse bunch shape, which may affect the evaluation of radiation intensity, should also be further investigated.


 ,
, 

