All articles published by MDPI are made immediately available worldwide under an open access license. No special
permission is required to reuse all or part of the article published by MDPI, including figures and tables. For
articles published under an open access Creative Common CC BY license, any part of the article may be reused without
permission provided that the original article is clearly cited. For more information, please refer to
https://www.mdpi.com/openaccess.
Feature papers represent the most advanced research with significant potential for high impact in the field. A Feature
Paper should be a substantial original Article that involves several techniques or approaches, provides an outlook for
future research directions and describes possible research applications.
Feature papers are submitted upon individual invitation or recommendation by the scientific editors and must receive
positive feedback from the reviewers.
Editor’s Choice articles are based on recommendations by the scientific editors of MDPI journals from around the world.
Editors select a small number of articles recently published in the journal that they believe will be particularly
interesting to readers, or important in the respective research area. The aim is to provide a snapshot of some of the
most exciting work published in the various research areas of the journal.
PBP-CMU Electron Linac Laboratory (PCELL), Plasma and Beam Physics Research Facility, Department of Physics and Materials Science, Faculty of Science, Chiang Mai University, Chiang Mai 50200, Thailand
2
Ph. D. Program in Applied Physics (International Program), Department of Physics and Materials Science, Faculty of Science, Chiang Mai University, Chiang Mai 50200, Thailand
3
Thailand Center of Excellence in Physics, Ministry of Higher Education, Science, Research and Innovation, Bangkok 10400, Thailand
*
Author to whom correspondence should be addressed.
This study presents the design and development of electromagnetic dipole magnets for use as beam dumps and spectrometers in the MIR and THz free-electron laser (FEL) beamlines at the PBP-CMU Electron Linac Laboratory (PCELL). The magnets were optimized to achieve a 60-degree bending angle for electron beams with energies up to 30 MeV, without requiring water cooling. Using CST EM Studio for 3D magnetic field simulations and ASTRA for particle tracking, the THz dipole (with 414 turns) and MIR dipole (with 600 turns) generated magnetic fields of 0.1739 T and 0.2588 T, respectively, while both operating at currents below 10 A. Performance analysis confirmed effective beam deflection, with the THz dipole showing that it was capable of handling beam energies up to 20 MeV and the MIR dipole could handle up to 30 MeV. The energy measurement at the spectrometer screen position was simulated, taking into account transverse beam size, fringe fields, and space charge effects, using ASTRA. The energy resolution, defined as the ratio of energy uncertainty to the mean energy, was evaluated for selected cases. For beam energies of 16 MeV and 25 MeV, resolutions of 0.2% and 0.5% were achieved with transverse beam sizes of 1 mm and 4 mm, respectively. All evaluated cases maintained energy resolutions below 1%, confirming the spectrometer’s suitability for high-precision beam diagnostics. Furthermore, the relationship between the initial and measured energy spread errors, taking into account a camera resolution of 0.1 mm/pixel, was evaluated. Simulations across various beam energies (10–16 MeV for the THz dipole and 20–25 MeV for the MIR dipole) confirmed that the measurement error in energy spread decreases with smaller RMS transverse beam sizes. This trend was consistent across all tested energies and magnet configurations. To ensure accurate energy spread measurements, a small initial beam size is recommended. Specifically, for beams with a narrow initial energy spread, a transverse beam size below 1 mm is essential.
Mid-infrared (MIR) and terahertz (THz) radiation have become essential tools in a wide range of scientific and technological applications, including spectroscopy, imaging, and materials characterization. MIR radiation is particularly effective in chemical analysis and medical diagnostics due to its strong interaction with molecular vibrations [1]. Meanwhile, THz radiation has gained increasing attention for its potential in semiconductor inspection, biological studies, food safety, medical imaging, security screening, and environmental monitoring [2]. The growing demand for high-intensity THz radiation, especially for advanced imaging, spectroscopy, and material analysis, has driven significant research into reliable and tunable radiation sources. Several techniques have been developed to generate THz radiation, such as optical rectification [3] and undulator based free-electron lasers (FELs) [4]. Among these, FELs employing undulators are particularly promising due to their ability to produce highly coherent radiation with tunable frequency and high power.
At the PBP-CMU Electron Linac Laboratory (PCELL), Chiang Mai University, an electron linear accelerator-based light source has been established to generate FEL radiation in both the MIR and THz spectral ranges. The facility can produce and accelerate short-pulse electron beams with energies up to 30 MeV. These relativistic electron beams are delivered through two independent beamlines to generate coherent, high-intensity radiation, including MIR and THz FELs, as well as THz transition radiation (THz TR) [5]. The resulting radiation supports time-domain spectroscopy (TDS) and pump-probe experiments, serving as a valuable tool for both fundamental research and practical applications. The accelerator system consists of a thermionic RF electron gun, longitudinal bunch compression systems (an alpha magnet and two sets of 180-degree bending magnet), a linear accelerator, magnetic focusing and steering elements, and two FEL radiation sources. A schematic layout of the facility is shown in Figure 1.
For both MIR and THz FEL beamlines, dipole magnets are used to bend the electron beam trajectories at specific angles after radiation generation. Faraday cups are positioned at the ends of both beamlines to serve as beam stoppers. These dipole magnets are also being studied for their potential use as spectrometers to measure electron beam energy. The energy distribution, particularly after the alpha magnet, is critical for the compression process within the linac’s traveling wave electric field. This process is essential for generating short electron bunches in the THz beamline, which produces THz radiation using the super-radiant technique. Similarly, the MIR beamline also requires accurate knowledge of the beam energy and its radiation.
Beam spectrometers are essential components in accelerator facilities, providing precise measurements of beam energy that are critical for optimizing accelerator performance, maintaining beam stability, and achieving the required beam parameters for specific applications. A notable example is the spectrometer developed for measuring the energy spectrum of electron beams generated by the superconducting radio-frequency (SRF) photoelectron gun under construction at Helmholtz-Zentrum Berlin (HZB) as part of the bERLinPro project. The bERLinPro (Berlin Energy Recovery Linac Prototype) project aims to demonstrate the generation of high-current, low-emittance electron beams using superconducting energy recovery linac (ERL) technology. Serving as a testbed for continuous-wave (CW) operation with an SRF photoelectron gun, bERLinPro supports the advancement of next-generation accelerator-based light sources [6]. The spectrometer, offering an energy resolution of approximately 0.1%, is also designed to enable single-shot phase space diagnostics when used in conjunction with a transverse deflecting cavity [7]. Another spectrometer for energy measurement was developed for the AXISS project at DESY to measure electron energies in the range of 5 MeV to 20 MeV in a single shot [8]. The energy uncertainty, defined as the relative energy spread (), was improved through using an energy slit at the entrance of the spectrometer, and their study suggested that this can enhance the energy resolution to better than 0.2%. The development of spectrometers continues to be an area of active research, with advancements aimed at improving energy resolution and expanding their applicability to a wider range of beam energies and accelerator configurations.
This investigation aims to develop the electromagnetic dipole magnets that deflect electron beams after radiation generation at the ends of the MIR and THz FEL beamlines. These dipole magnets will also function as spectrometers to measure the beam energy at the end stations of both the THz and MIR beamlines. These magnets are referred to as the THz Beam Dump (THz.BD) and MIR Beam Dump (MIR.BD). The designed dipole magnets can deflect the electron beams with a 60-degree bending angle, without requiring a cooling system for the magnet conduction coils.
This contribution presents an evaluation of the dipole magnetic field and electron beam trajectories along the field. Additionally, it includes the design of a spectrometer, along with simulations to investigate the resolution of the spectrometer and the energy spread errors that occur when incorporating camera resolution into the calculations.
2. Methodology
2.1. Electron Beam Trajectory Design
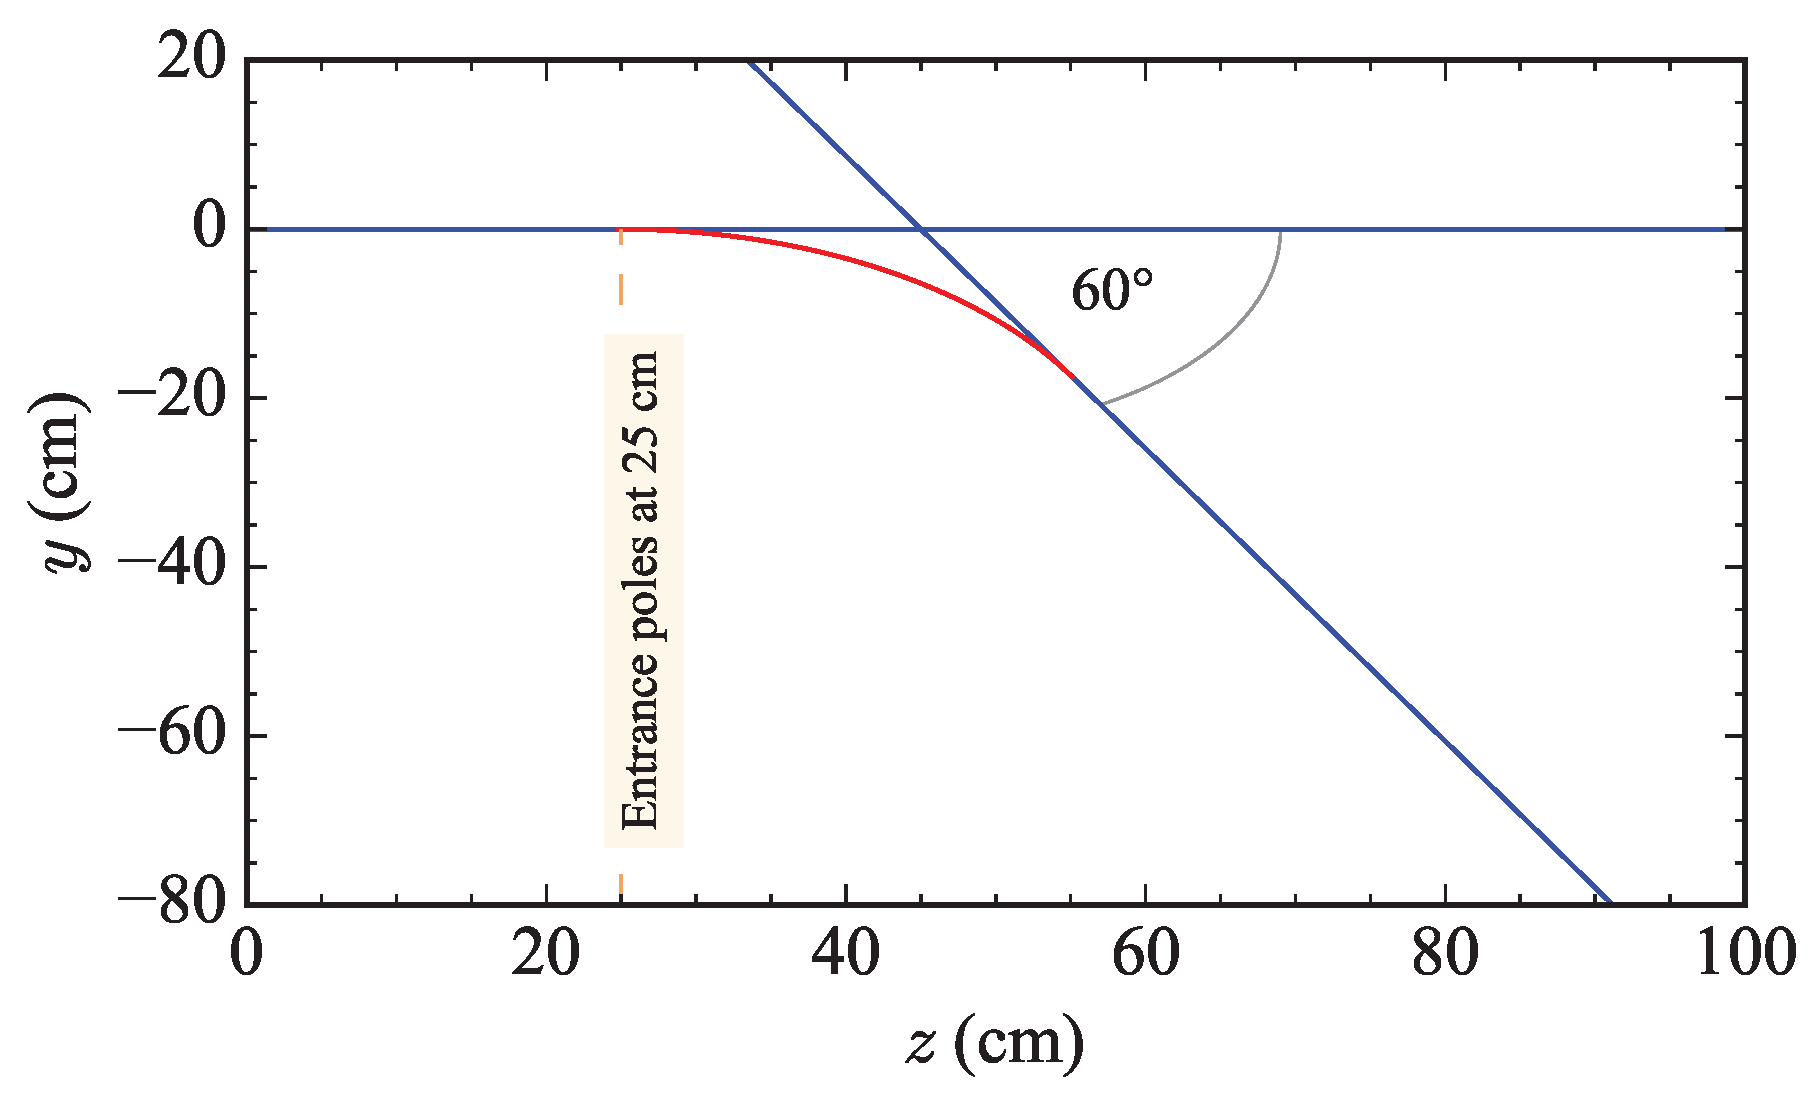
According to the facility’s radiation protection and safety requirements, a horizontal space of approximately 2 m is allocated for radiation shielding following the MIR and THz FEL beamlines. Meanwhile, the available horizontal distance for deflecting the electron beams downward to the Faraday cup is limited to 1 m. To accommodate this constraint, the optimum deflection angle for the electron beams was determined to be 60°. Initially, the magnet was designed for an electron beam energy of 30 MeV for the MIR.BD beamline, as illustrated in Figure 2. The accelerator’s central beam pipe is positioned 80 cm above the ground. The deflection radius (R) and arc length (l) of the beam trajectory can be calculated using the equation , where is expressed in radians. In the first step, the deflection radius was selected to be 35 cm based on the available space. Using this radius, the corresponding arc length was calculated to be 36.6 cm.
To determine the required magnetic field for deflecting an electron beam at a specific angle, the effective magnetic length () can approximately be calculated as the sum of the arc length (l) and the pole gap (h), i.e., . Equation (1) [9] is then used to determine the magnetic field. In this study, the pole gap was chosen to be 5 cm to ensure safe beam clearance beyond the vacuum tube diameter and prevent beam loss. Therefore, the estimated effective magnetic length is .
where is the bending angle, is the normalized electron beam velocity (), and E represents the total energy of the electron. Initially, the magnet of the MIR.BD was designed to bend a 30 MeV electron beam by 60°, for which the required magnetic field was calculated to be 0.2588 T.
The relationship between the applied current (I) and the resulting magnetic field strength () within the gap of an ideal dipole magnet is given by Equation (2) [10].
The magnetic field strength () is expressed as being directly proportional to the applied current (I) and the number of coil turns (N), while being inversely proportional to the gap width (h) between the magnet poles. The proportionality constant represents the magnetic permeability of free space, with a value of H/m. This relationship emphasizes how the magnet configuration, particularly the number of coil turns and the pole gap, influences the resulting magnetic field strength. Based on this relationship, the required ampere-turns () to produce a magnetic field of 0.2588 T was calculated to be 10,298 A·turns.
The maximum allowable current density (J) for air-cooled conducting coils has been reported to be less than 2 A/mm2 [11]. In this work, a more conservative limit of approximately 1 A/mm2 was initially adopted. Since electrical resistance is inversely proportional to the conductor’s cross-sectional area, selecting a sufficiently large area ensures both thermal safety and minimal resistive losses in the coil. Accordingly, a wire corresponding to Standard Wire Gauge (S.W.G.) number 10, which has a diameter of 3.251 mm, was selected. The minimum required cross-sectional area of the conductor was calculated to be approximately 8.582 mm2. Based on this choice, the number of coil turns per pole for the MIR.BD magnet was set to 600, requiring an applied current of 8.582 A.
The same magnetic yoke structure was used for the THz.BD magnet, which is designed to bend an electron beam with a maximum energy of 20 MeV. Using the same methodology as applied to the MIR.BD, the maximum required magnetic field was determined to be 0.1739 T, and the required magnetomotive force () was calculated to be 6920 A·turns. Using the same conductor size and considering the winding layout, the number of coil turns per pole was determined to be 414, corresponding to an applied current of 8.357 A. This current is within the operating limits of the power supply (10 A). The design parameters are summarized in Table 1, which also provides the initial values used in the magnetic field simulation.
2.2. Dispersion Function of the Designed Electromagnetic Dipole
Electron beams that deviate from their nominal energy or momentum would travel along the dispersive trajectory (), as described by the dispersion function [10]. The function can affect the transverse beam size of the electron beam when the beam with spread of energy travels through the section, as illustrated in Equation (3).
where is the relative change in momentum.
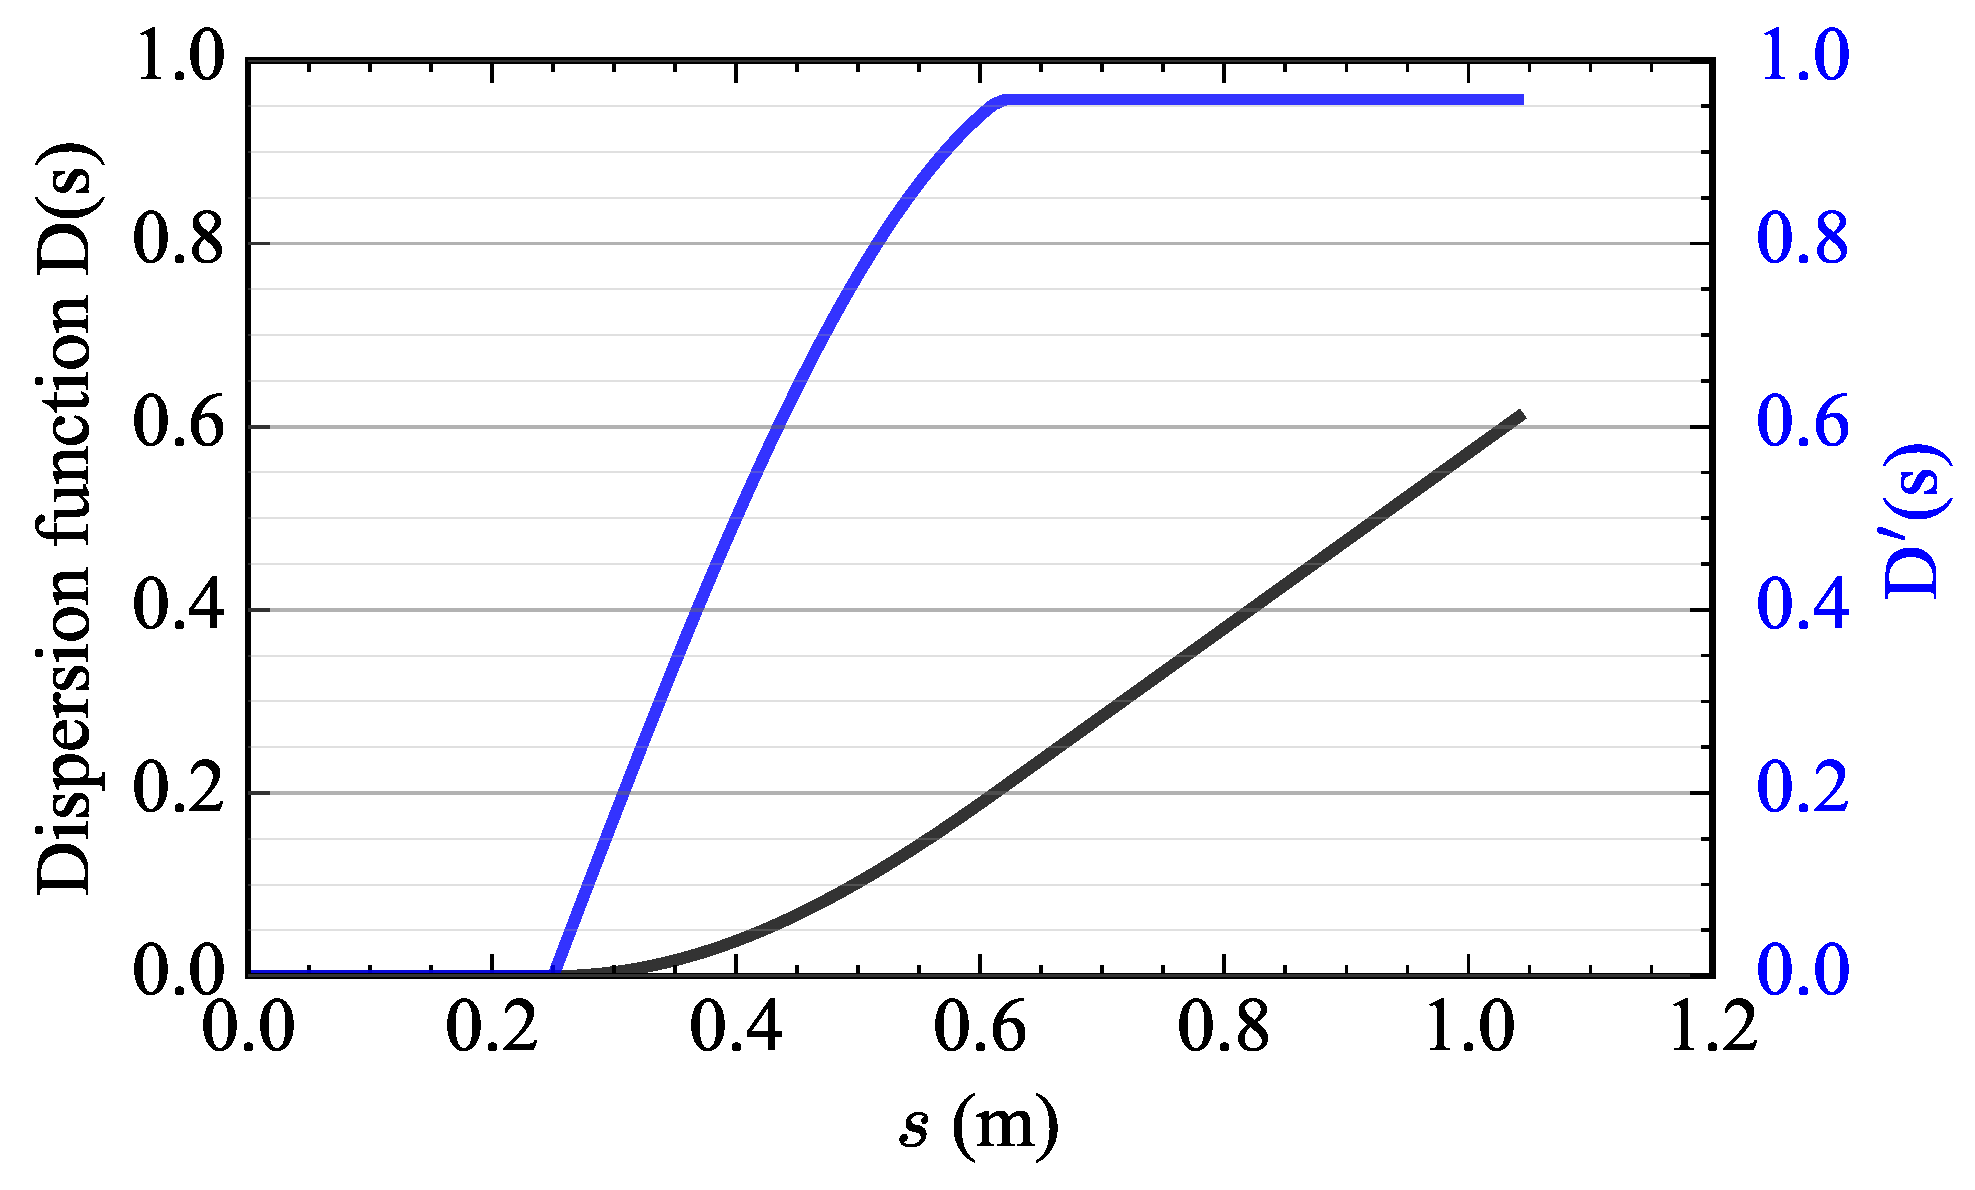
The calculated vertical dispersion along the design path of the electron trajectory, along with its first derivative , are presented in Figure 3. The dispersion at the design screen position was approximately 0.591 m, while the dispersion value at the entrance of the Faraday Cup was 0.610 m. This value was used to estimate the vertical beam expansion after passing through the dipole magnet.
2.3. Electromagnetic Dipole Modeling and Simulation
The contribution concentrated on determining, considering the limited available space and the requirement for operation without a cooling system, the necessary parameters for designing the geometry of the electromagnetic dipole. Therefore, the dipole magnet geometry was optimized to meet the desired magnetic field strength and bending angle using those conditions and constraints.
Both THz.BD and MIR.BD use identical geometries for the magnetic yoke. The magnet yoke geometries were modeled according to the designed arc length (l) obtained from the previous section, which was determined to be 366 mm. This value was used to define the shape of the magnet pole plates in the modeling process. The magnet was designed as a sector electromagnet to accommodate the long effective length, ensuring easier electron beam delivery to the dump while avoiding edge focusing.
The electromagnetic dipole was modeled using CST-EM Studio software (versions 2023 and 2024) [12]. This software enables three-dimensional (3D) modeling of the magnet’s structure and simulates the magnetic field in 3D space, resulting in a 3D magnetic field (). The function of this magnet is to bend the electron beam down toward the collector (Faraday cup). Hence, the magnetic field in the horizontal direction () was utilized to deflect the electron beam, especially the magnetic field intensity along the propagated path of the electron beam.
2.4. Spectrometer Design
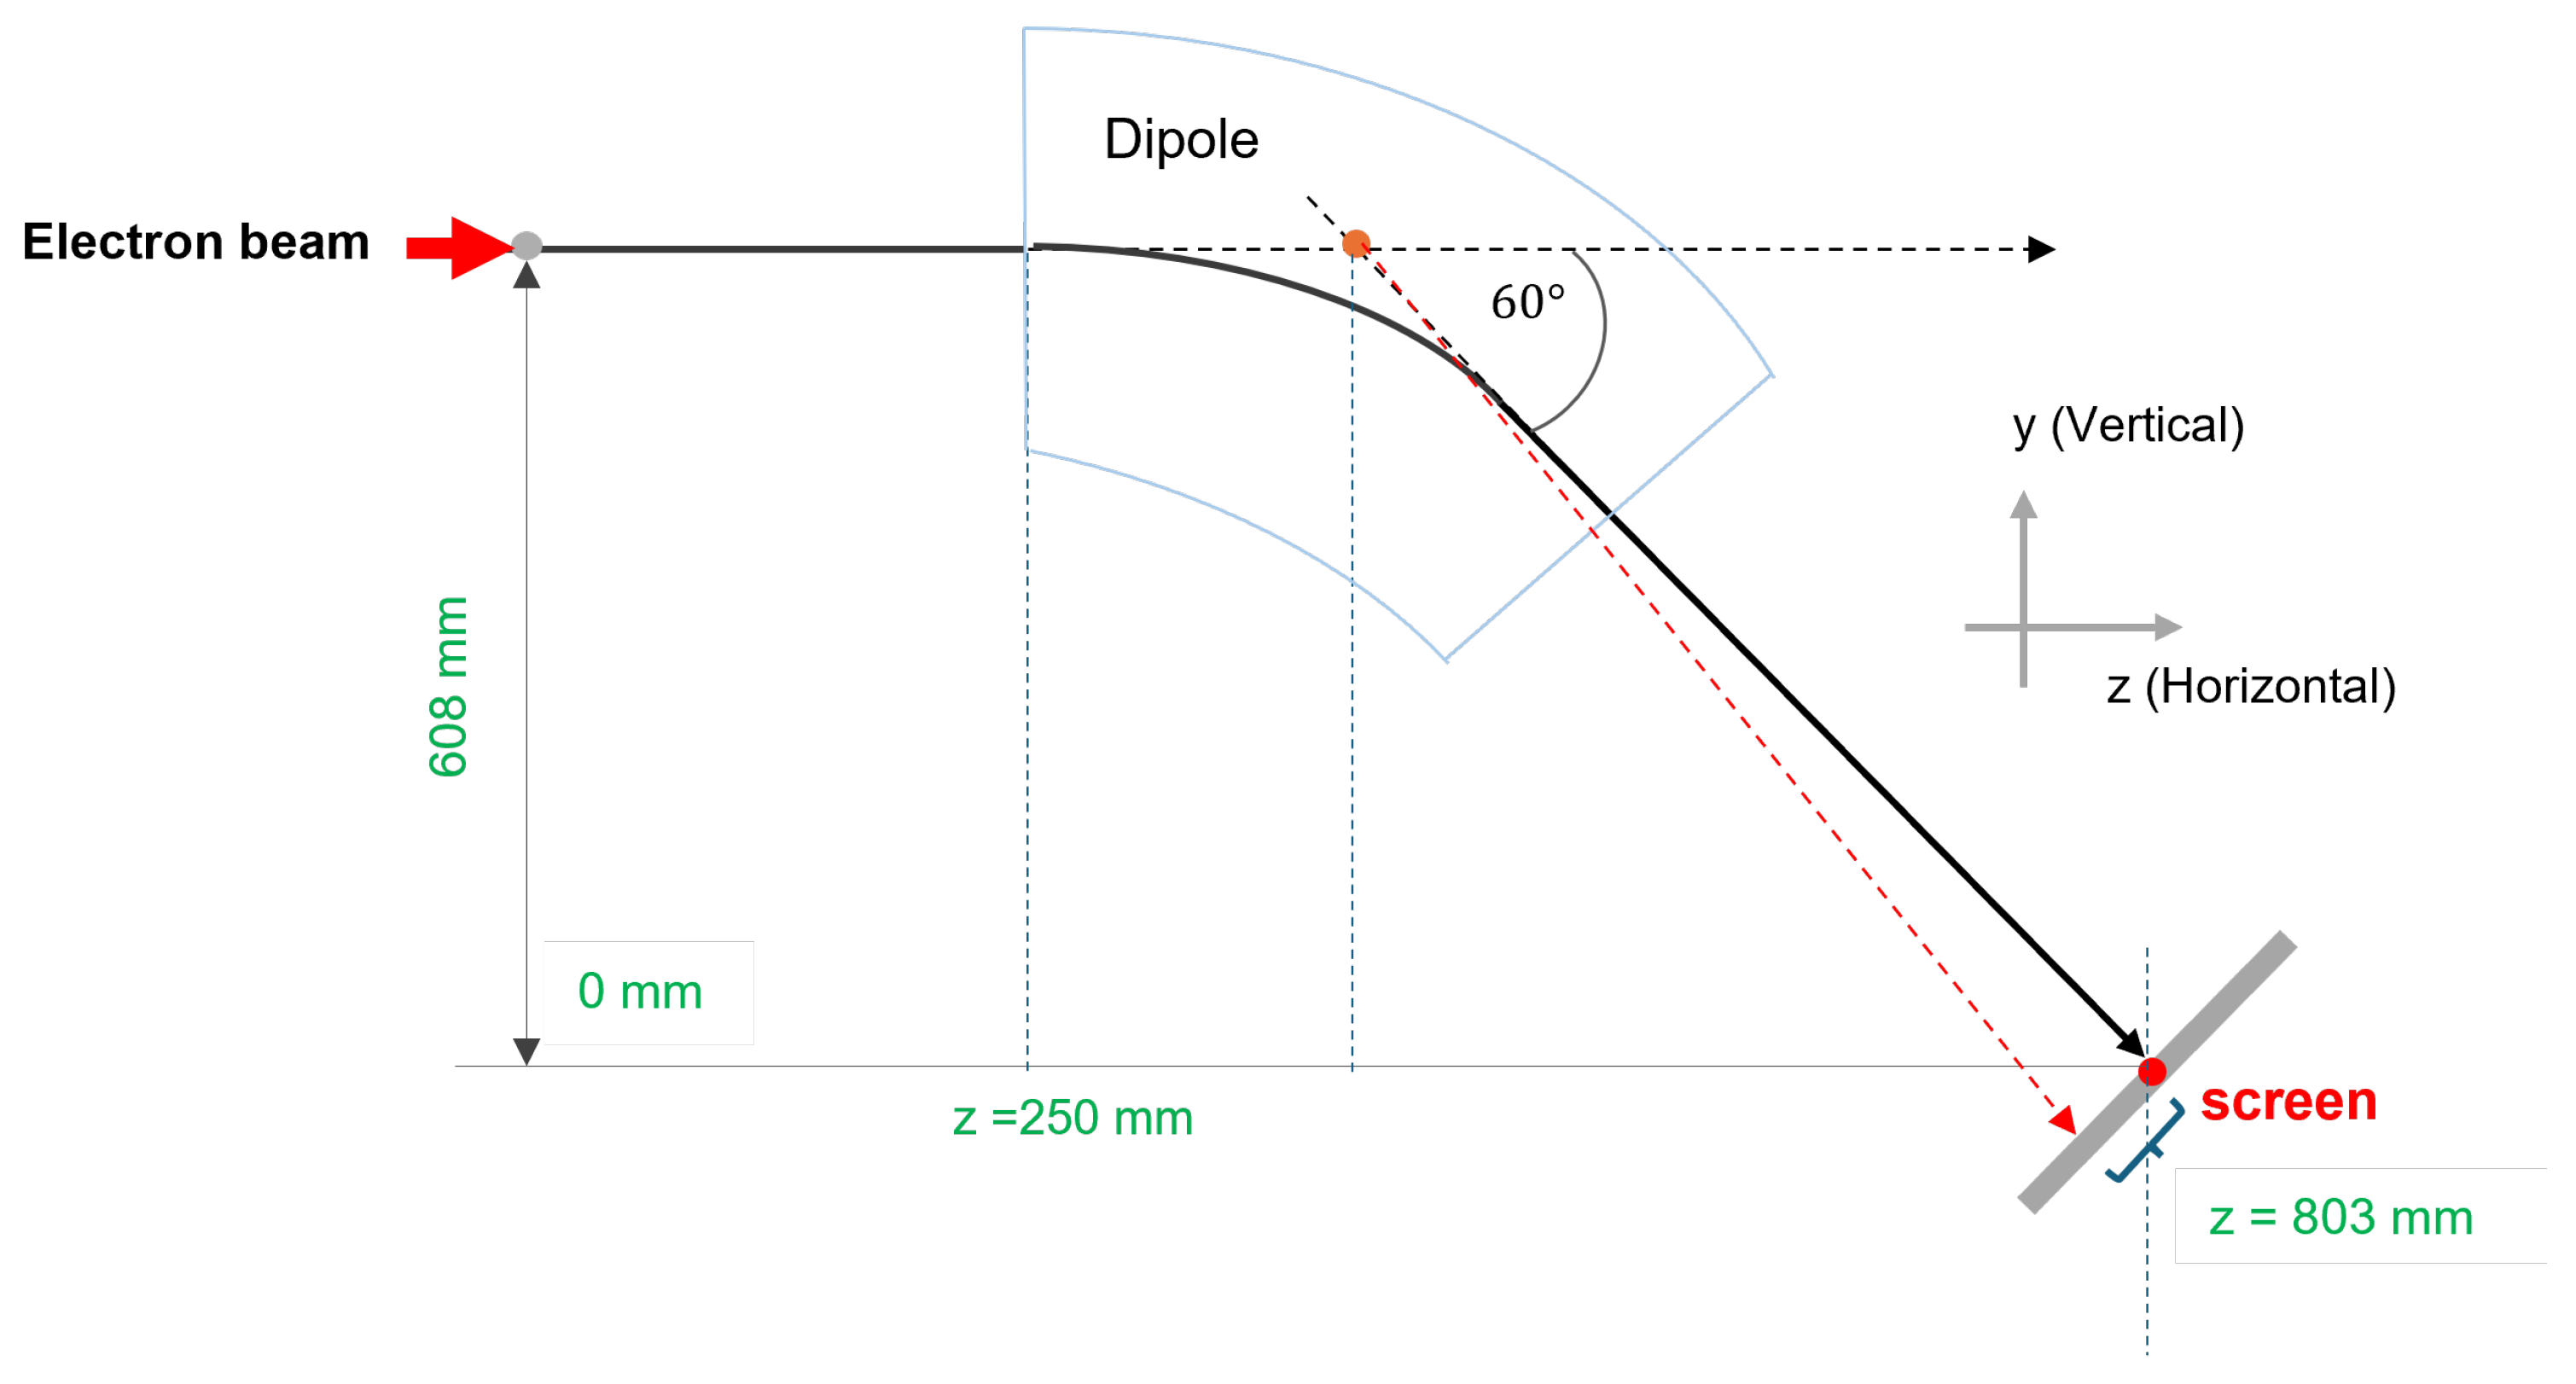
The spectrometers were designed with consideration of the available space for installation in the THz and MIR beamlines. The magnets were configured to bend the electron beam in the vertical direction toward the Faraday cup. The layout of the dipole magnet and screen, accounting for spatial constraints, is illustrated in the diagram of Figure 4.
The beam profile monitoring system was developed to measure the beam profile. This system includes a phosphor screen, a deflecting mirror, and a CCD camera. The setup provides an image resolution of 0.1 mm/pixel [13], which was incorporated into the calculation of the energy spread.
The kinetic energy of the electron beam can be directly determined from the measured beam profile using Equation (4). With the bending angle fixed at 60°, the beam energy is expressed as a function of the magnetic peak field (, in Teslas), the effective magnetic length (, in meters), and the beam displacement on the screen (D, in meters).
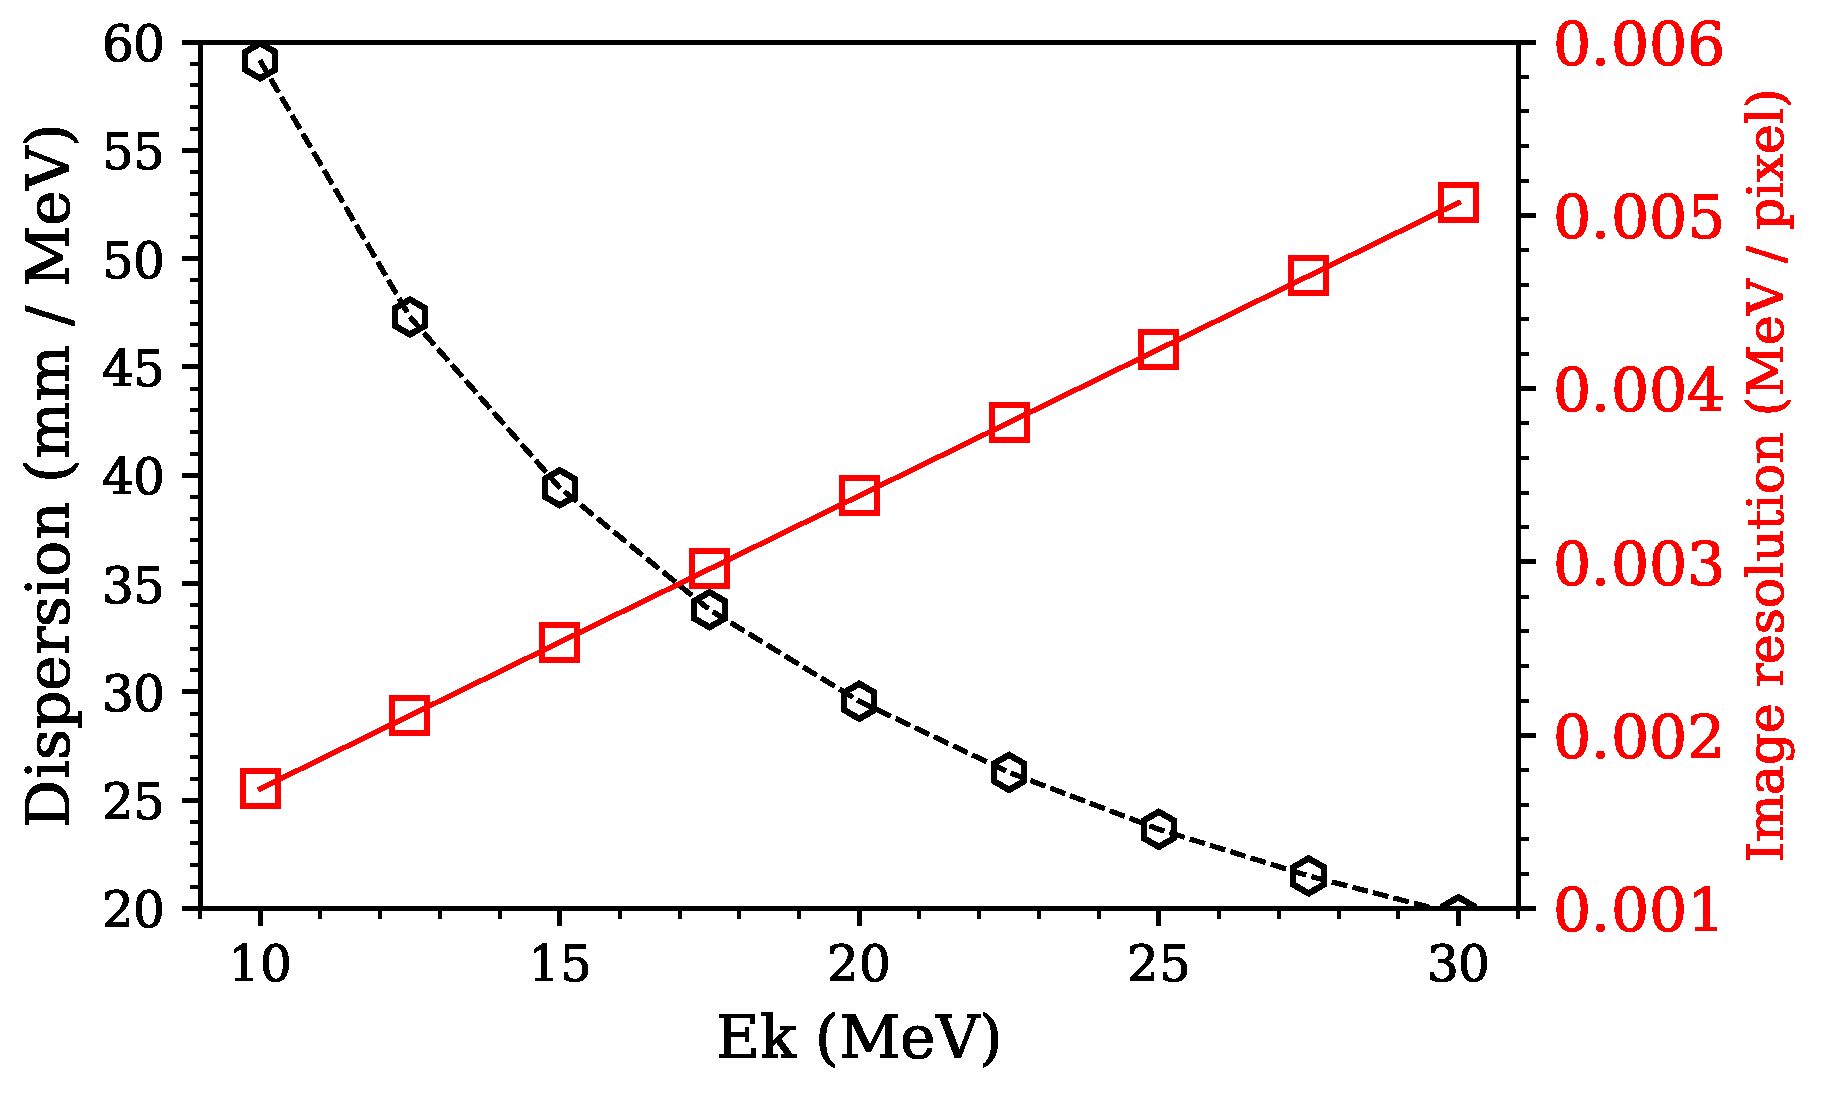
The energy resolution of the spectrometer is determined by both the dispersion provided by the dipole magnet and the spatial resolution of the beam imaging components. Dispersion at the design screen position (591 mm) was used to calculate the energy dispersion over the electron beam energy range. The image resolution of 0.1 mm/pixel was incorporated as a function of energy per pixel. As shown in Figure 5, the primary y-axis illustrates that the dispersion per energy decreased with increasing beam energy, while the secondary y-axis indicates that the image resolution increased linearly with beam energy, reaching a maximum of 0.005 MeV/pixel.
The calculated results considered only a pencil beam and did not account for the effect of the beam size. Consequently, further simulations are required to investigate these effects in greater detail.
2.5. Beam Dynamic Simulation
There are two primary purposes of the simulation. First, the simulation aims to determine the relationship between the electron beam energy and the applied electric current to the magnet for a 60° bending angle. Second, the results from scanning the applied current are used to set the magnet parameters and design the spectrometer for the THz and MIR beamlines.
In the design of the spectrometers, the THz spectrometer was evaluated using beam energies of 10 MeV and 16 MeV, with the energy spread varying from 0.1% to 2%. Similarly, the MIR spectrometer was tested with beam energies of 20 MeV and 25 MeV, and the energy spread was also varied from 0.1% to 2%. The transverse distribution was employed to analyze the spread of the electron beam, incorporating the image resolution of 0.1 mm/pixel into the calculation. This was achieved by separating the electron beam distribution and calculating the energy spread by weighting the bins according to the number of electrons within each. The error of the energy measurement depends directly on the transverse beam profile measurement, which is discretized into pixels of 0.1 mm size. This discretization leads to uncertainties in determining the exact beam position and, thus, the energy. Therefore, the energy spread error was quantified by weighting the electron counts within each bin and propagating the spatial resolution uncertainty through the beam optics dispersion relation. This approach provides a realistic estimate of the systematic error that arises from the measurement setup and ensures that the calculated energy spread accurately reflects the physical limitations of the detection system.
Electron beam dynamics simulations through both dipole magnets were performed using the ASTRA software (version 3.2, March 2017) [14]. The electron beam was generated with the ASTRA particle generator and positioned 250 mm upstream from the edge of the magnetic pole (at ) to ensure that the simulation began before entering the magnet’s fringe field. The electron beam distribution was assumed to be Gaussian in the transverse plane, with a bunch charge of 100 pC. Zero emittance was assumed to represent an ideal paraxial beam, which implies no initial divergence or spread in the beam’s phase space. This assumption simplifies the analysis by isolating the effects of the magnetic field on the beam trajectory under ideal conditions. A distinctive feature of ASTRA is its ability to import 3D magnetic field data obtained from CST-EM Studio, enabling more accurate simulation results.
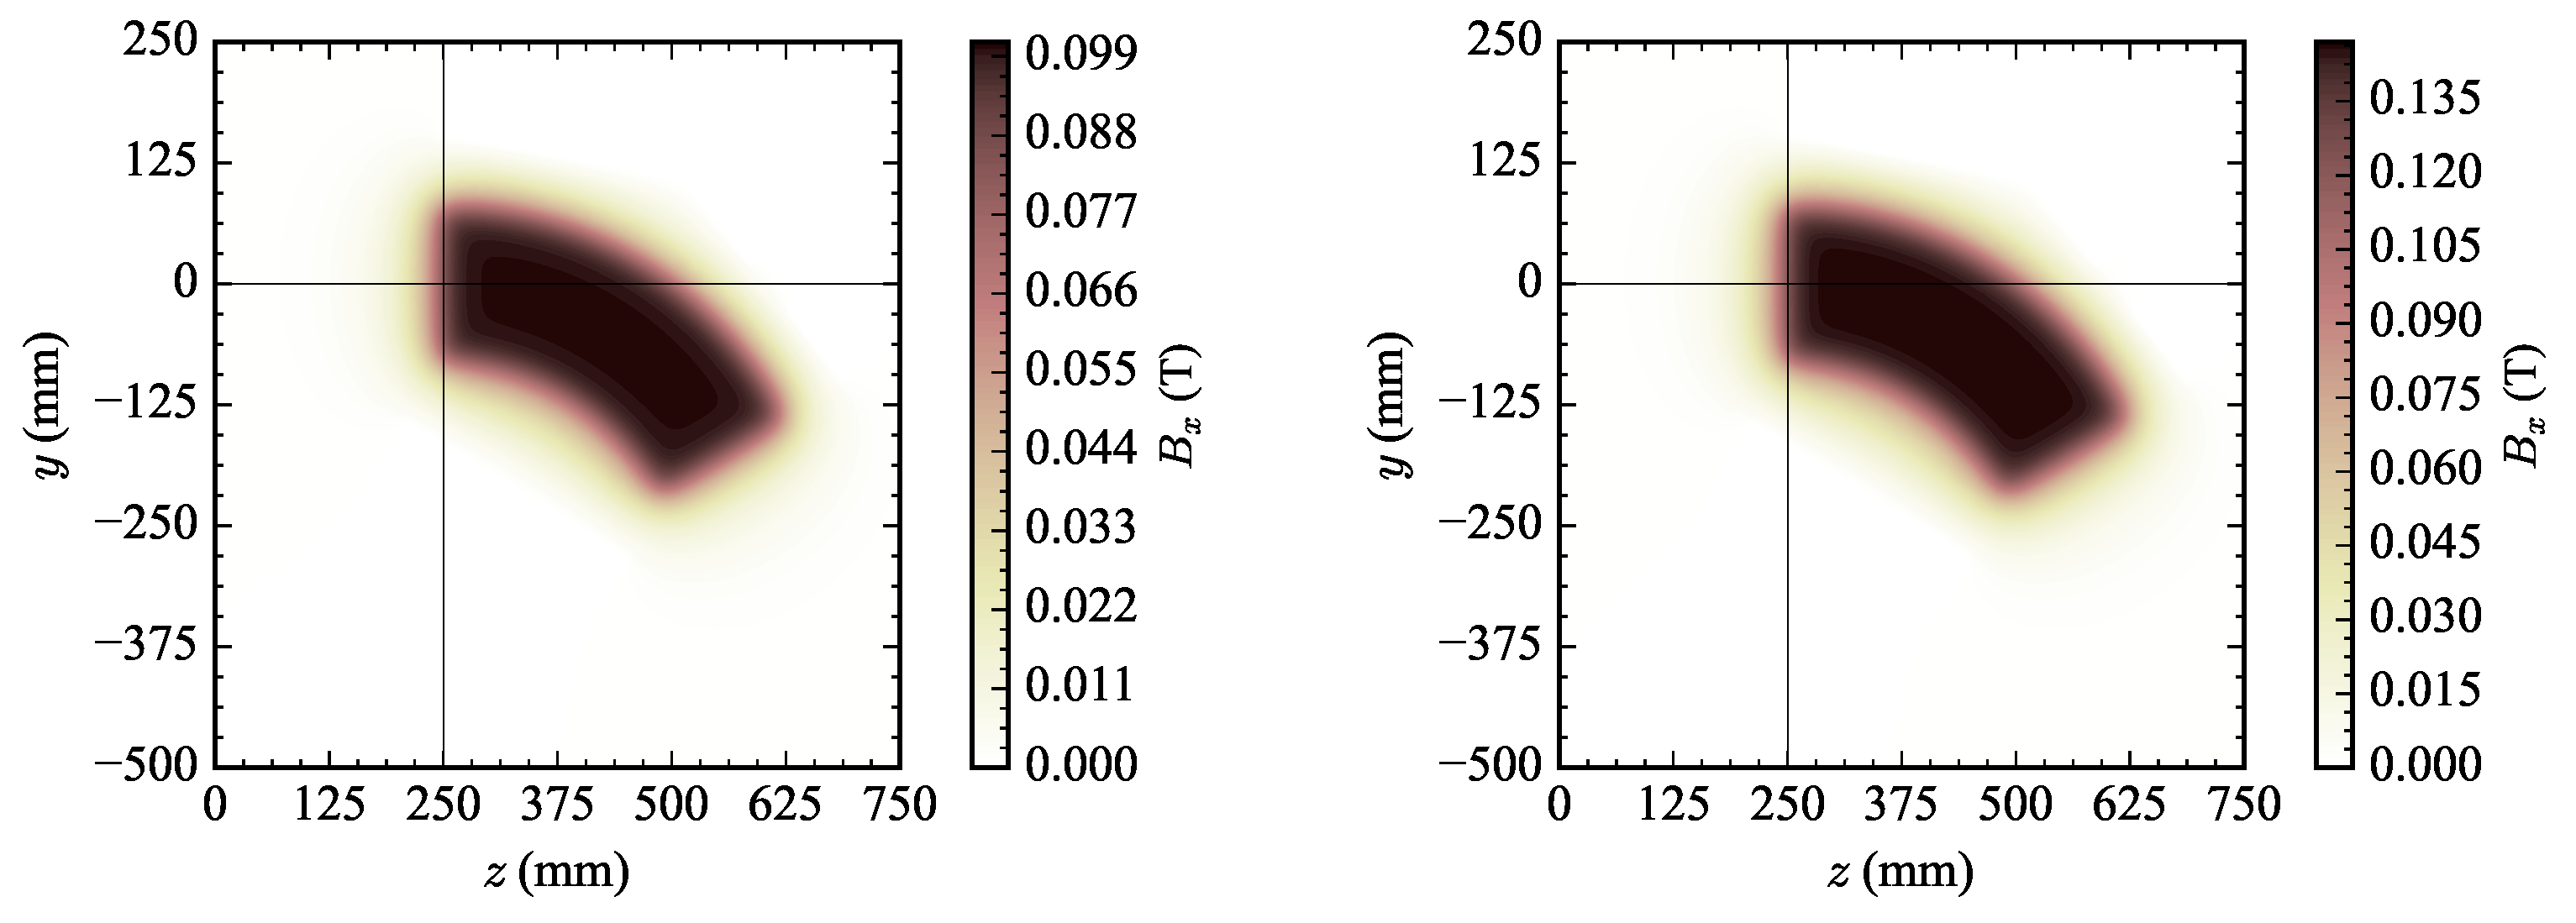
Additionally, ASTRA can track electron beams while including space charge effects, further enhancing its accuracy. In this study, the 3D magnetic field maps of the magnets were implemented to investigate the focusing effects caused by the magnetic field components in the vertical and longitudinal directions ( and ). As illustrated in Figure 6, the horizontal magnetic field intensity () in the center plane () of the THz dipole (left) and the MIR dipole (right) were recorded when the electric current was set to 5 A. The field consists of two main regions (which correspond to the direction of the magnetic flux): the air gap magnetic field (positive intensity) and the field inside the yoke (negative intensity). Figure 7 shows only the magnetic field intensity in the air gap region, which is responsible for deflecting the electron beam. These field profile results provide the scaling factors for the magnetic field intensity used to adjust the magnetic field in the ASTRA simulation: 0.1461 A for the MIR dipole and 0.1002 A for the THz dipole.
3. Results and Discussion
3.1. Magnetic Field Simulation
The magnetic field intensity along the trajectory path and the effective magnetic field length are generally defined by considering the fringe field at the magnet’s edges. As illustrated in Figure 8, this can be determined directly using Equation (5). The calculated effective magnetic length () along the designed trajectory was 427 mm, which was approximately 16% longer than the geometrical pole length and 2.5% longer than the originally approximated effective length.
where is defined from the maximum magnetic field at the center of the uniformity length.
In principle, the geometric arc length (l) is different from the effective field length () of the magnetic field. In all cases for the dipole magnet [9], the geometric arc length is usually shorter than the effective field length ().
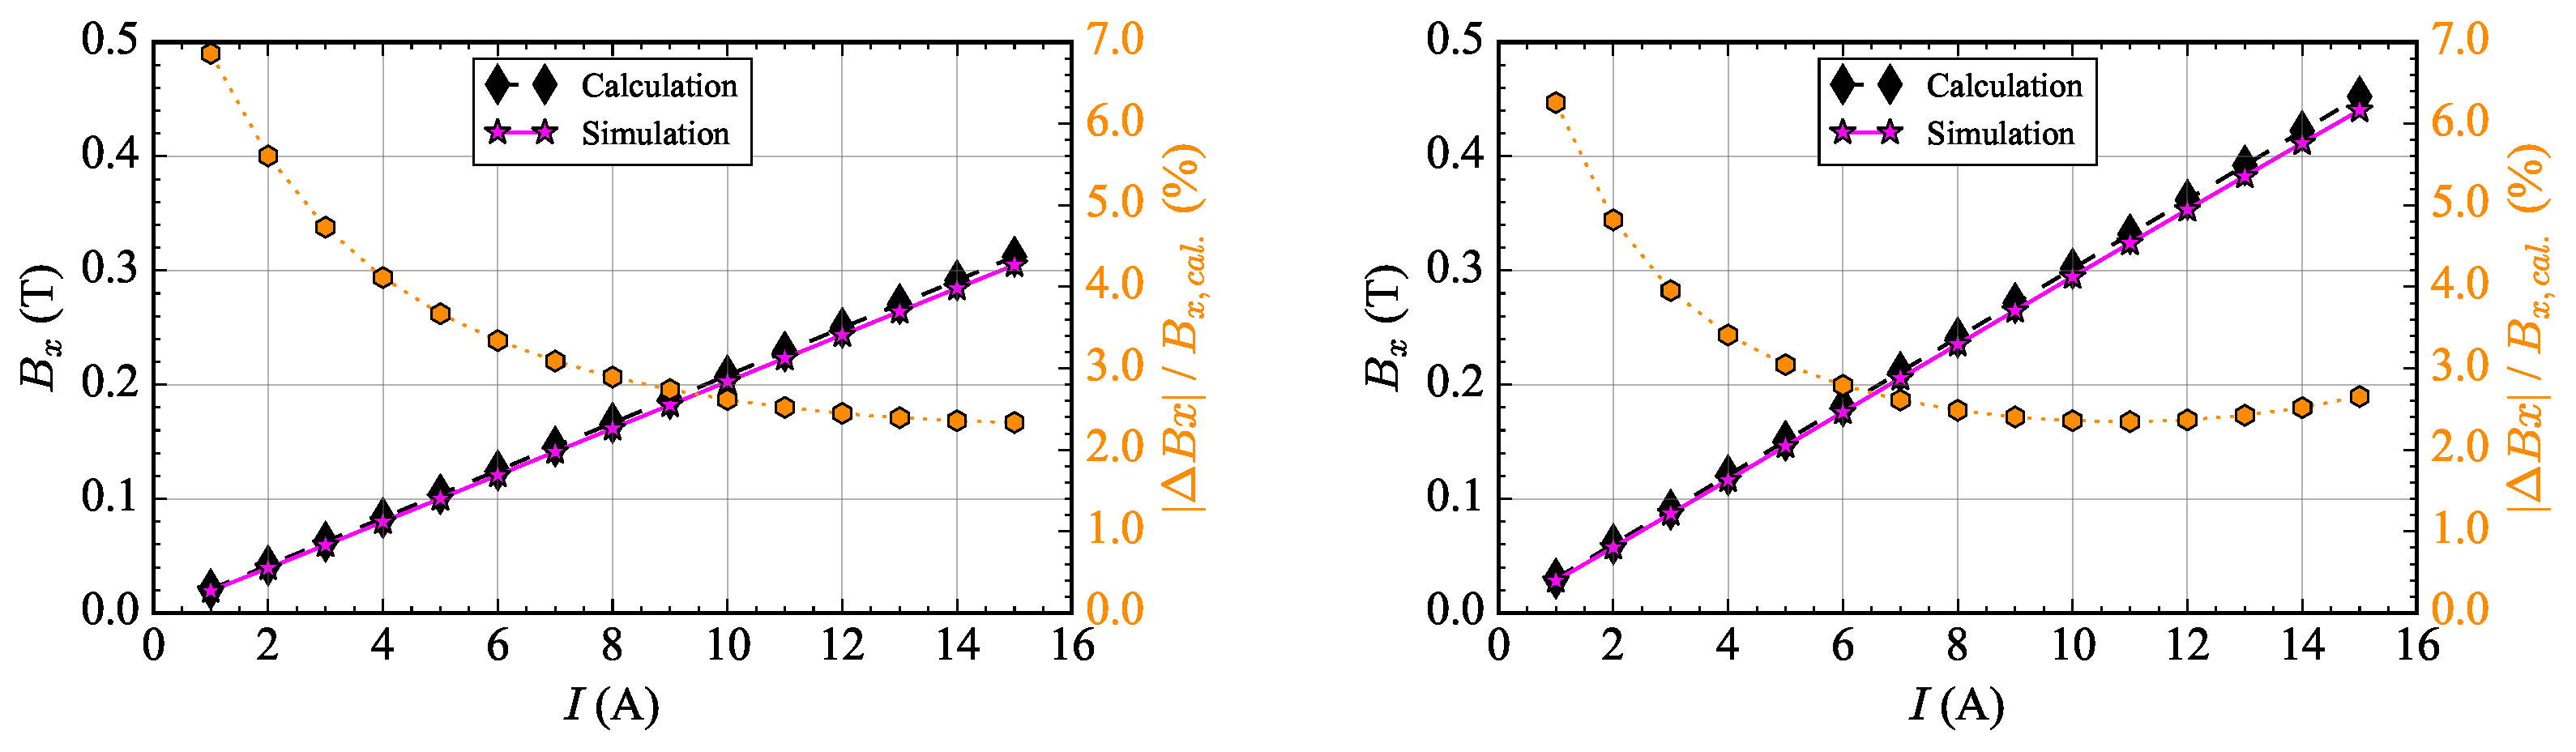
As shown in Figure 9, the plot represents the horizontal magnetic field intensity at the center of the pole plates. The calculated results using Equation (2) were compared with the simulation data obtained from CST-EM Studio. The results demonstrate a linear correlation between the magnetic field and the applied current to the conducting coil. The calculated and simulated magnetic field at the center of the pole plates showed a less than 3% difference. The comparison between the two showed close agreement.
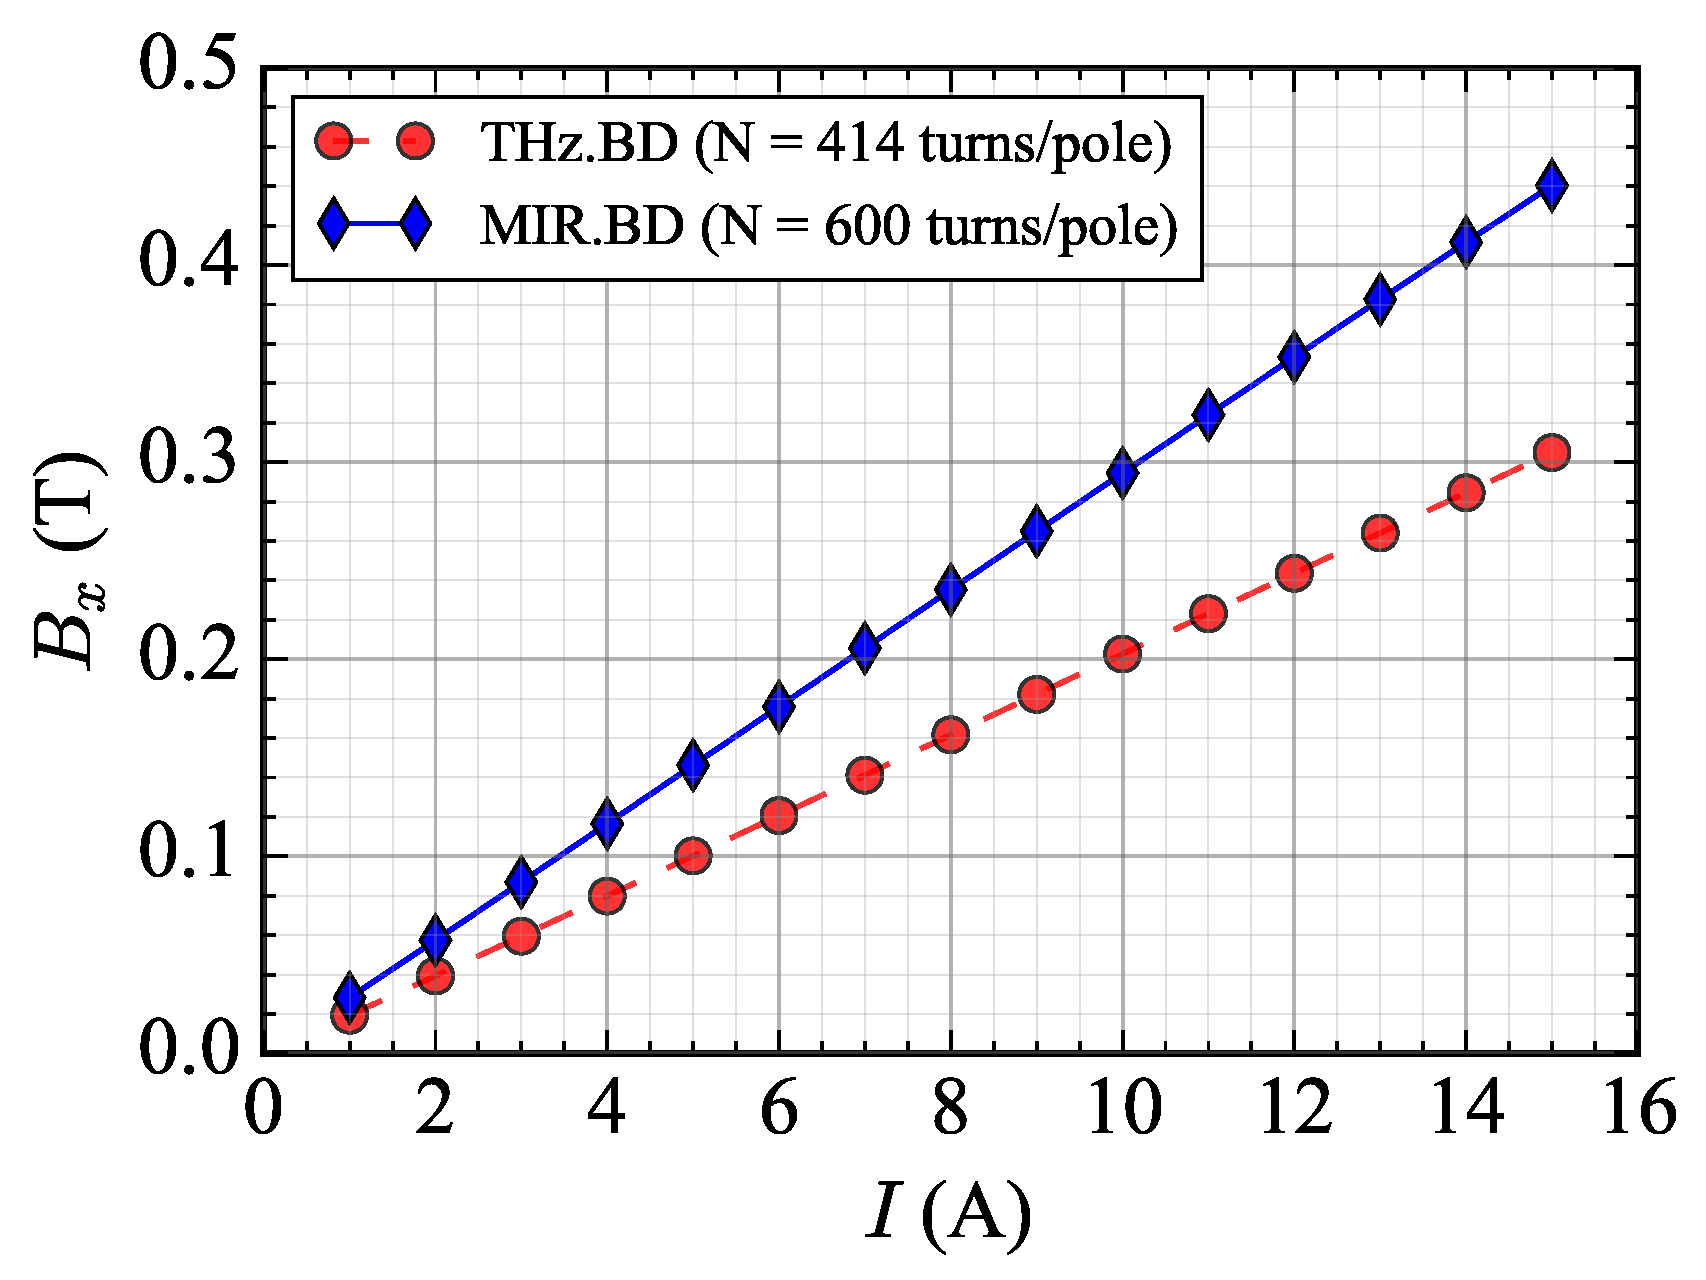
The magnetic field intensity at the center of the pole plate for both THz.BD and MIR.BD, as a function of the applied current, is illustrated in Figure 10. A linear correlation was established for both magnets, with slopes of 0.0204 T/A for THz.BD and 0.0295 T/A for MIR.BD.
3.2. Beam Energy and Current Correlation Study
ASTRA software was used to simulate the transport of the electron beam through the dipole magnet. The simulation was terminated at the entrance of the Faraday cup along the z-axis. By varying the applied current for each beam energy and monitoring the resulting deflection angle, a linear correlation was established to determine the required current to achieve a deflection angle of 60° for each electron beam energy.
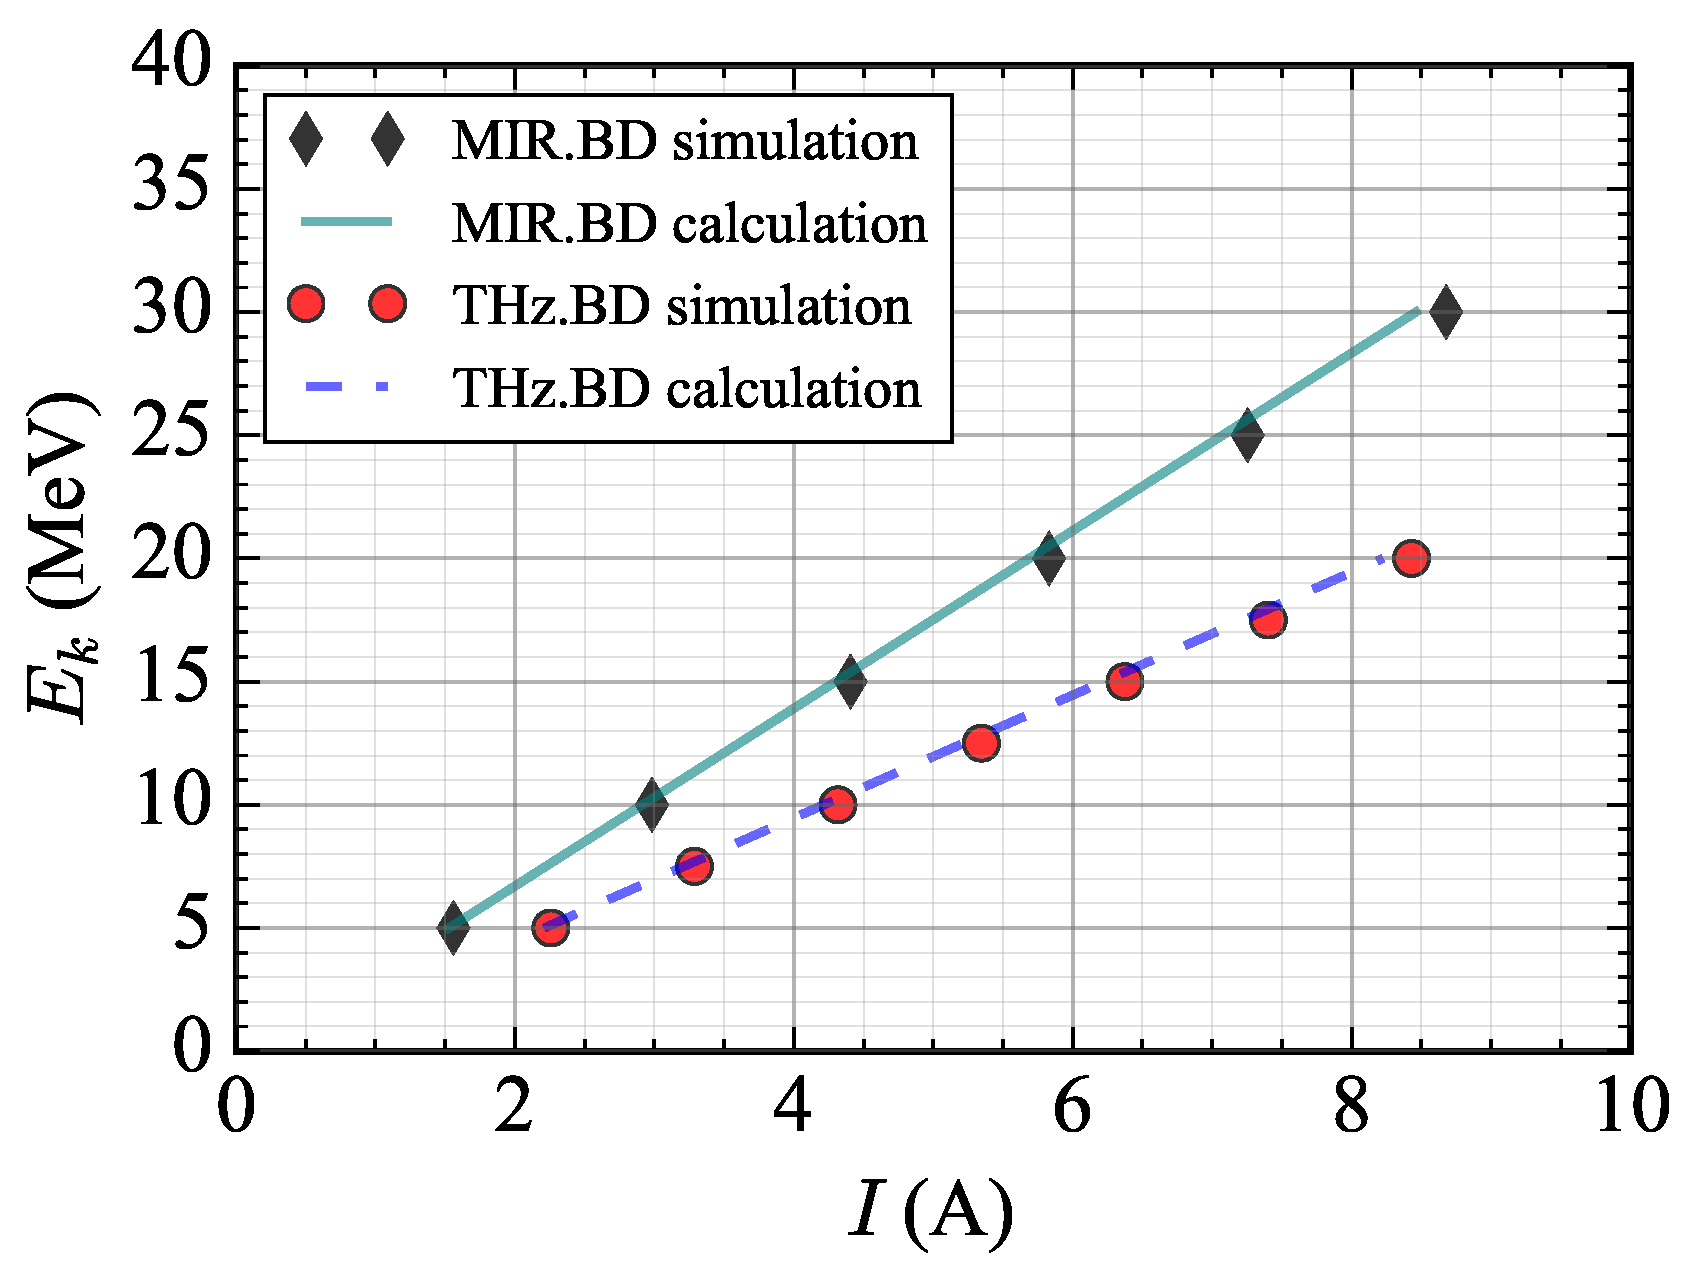
As shown in Figure 11, the plot illustrates the correlation between the electron beam kinetic energy () and the applied current (I) for both beam dumps, where the calculated values (line graph) were compared with the simulation results. The data exhibit strong linearity, with coefficients of determination () equal to 1 for MIR.BD and approximately 1 for THz.BD. The corresponding linear equations are provided in Equations (6) and (7), respectively. The maximum applied current for both beam dumps remained below 10 A, which is sufficient to achieve the required 60° deflection for the specified beam energies. The simulation results were in good agreement with the theoretical predictions, where the required beam currents to deflect electron beams with energies of 20 MeV and 30 MeV were 8.230 A for THz.BD and 8.542 A for MIR.BD, respectively.
3.3. Investigation of the Beam Energy Resolution and Energy Spread Error
The energy resolution, defined as the ratio of the energy uncertainty to the mean energy, was investigated. A study was conducted for two beam energies: 16 MeV for the THz.BD and 25 MeV for the MIR.BD. For the 16 MeV electron beam with an initial energy spread of 0.1%, the energy resolutions were found to be 0.2% for a transverse beam size of 1 mm and 0.5% for 4 mm. A similar trend was observed for the 25 MeV beam, where the energy resolutions were also 0.2% and 0.5% for beam sizes of 1 mm and 4 mm, respectively. These results clearly indicate that a smaller initial transverse beam size leads to improved energy resolution. Overall, the analysis demonstrates that energy resolution degrades as both the initial transverse beam size and energy spread increase. Nevertheless, in all cases, the resolution remains below 1%, with the best performance observed at approximately 0.2%. These findings underscore the critical role of the initial beam size in determining energy resolutions, where smaller transverse beam sizes consistently yield superior performance. This expected performance is comparable to the results reported in other compact spectrometer designs [8].
In our planned experiment, the beam kinetic energy was calculated using Equation (4). The average energy and energy spread were determined from the measured transverse position of the beam image. In our study, the effect of the image resolution was taken into account, as it introduces uncertainty in the measured position and, consequently, affected the accuracy of the calculated energy spread, as outlined in the Methodology section. Therefore, the measured energy spread was investigated to accommodate for this resolution-induced error.
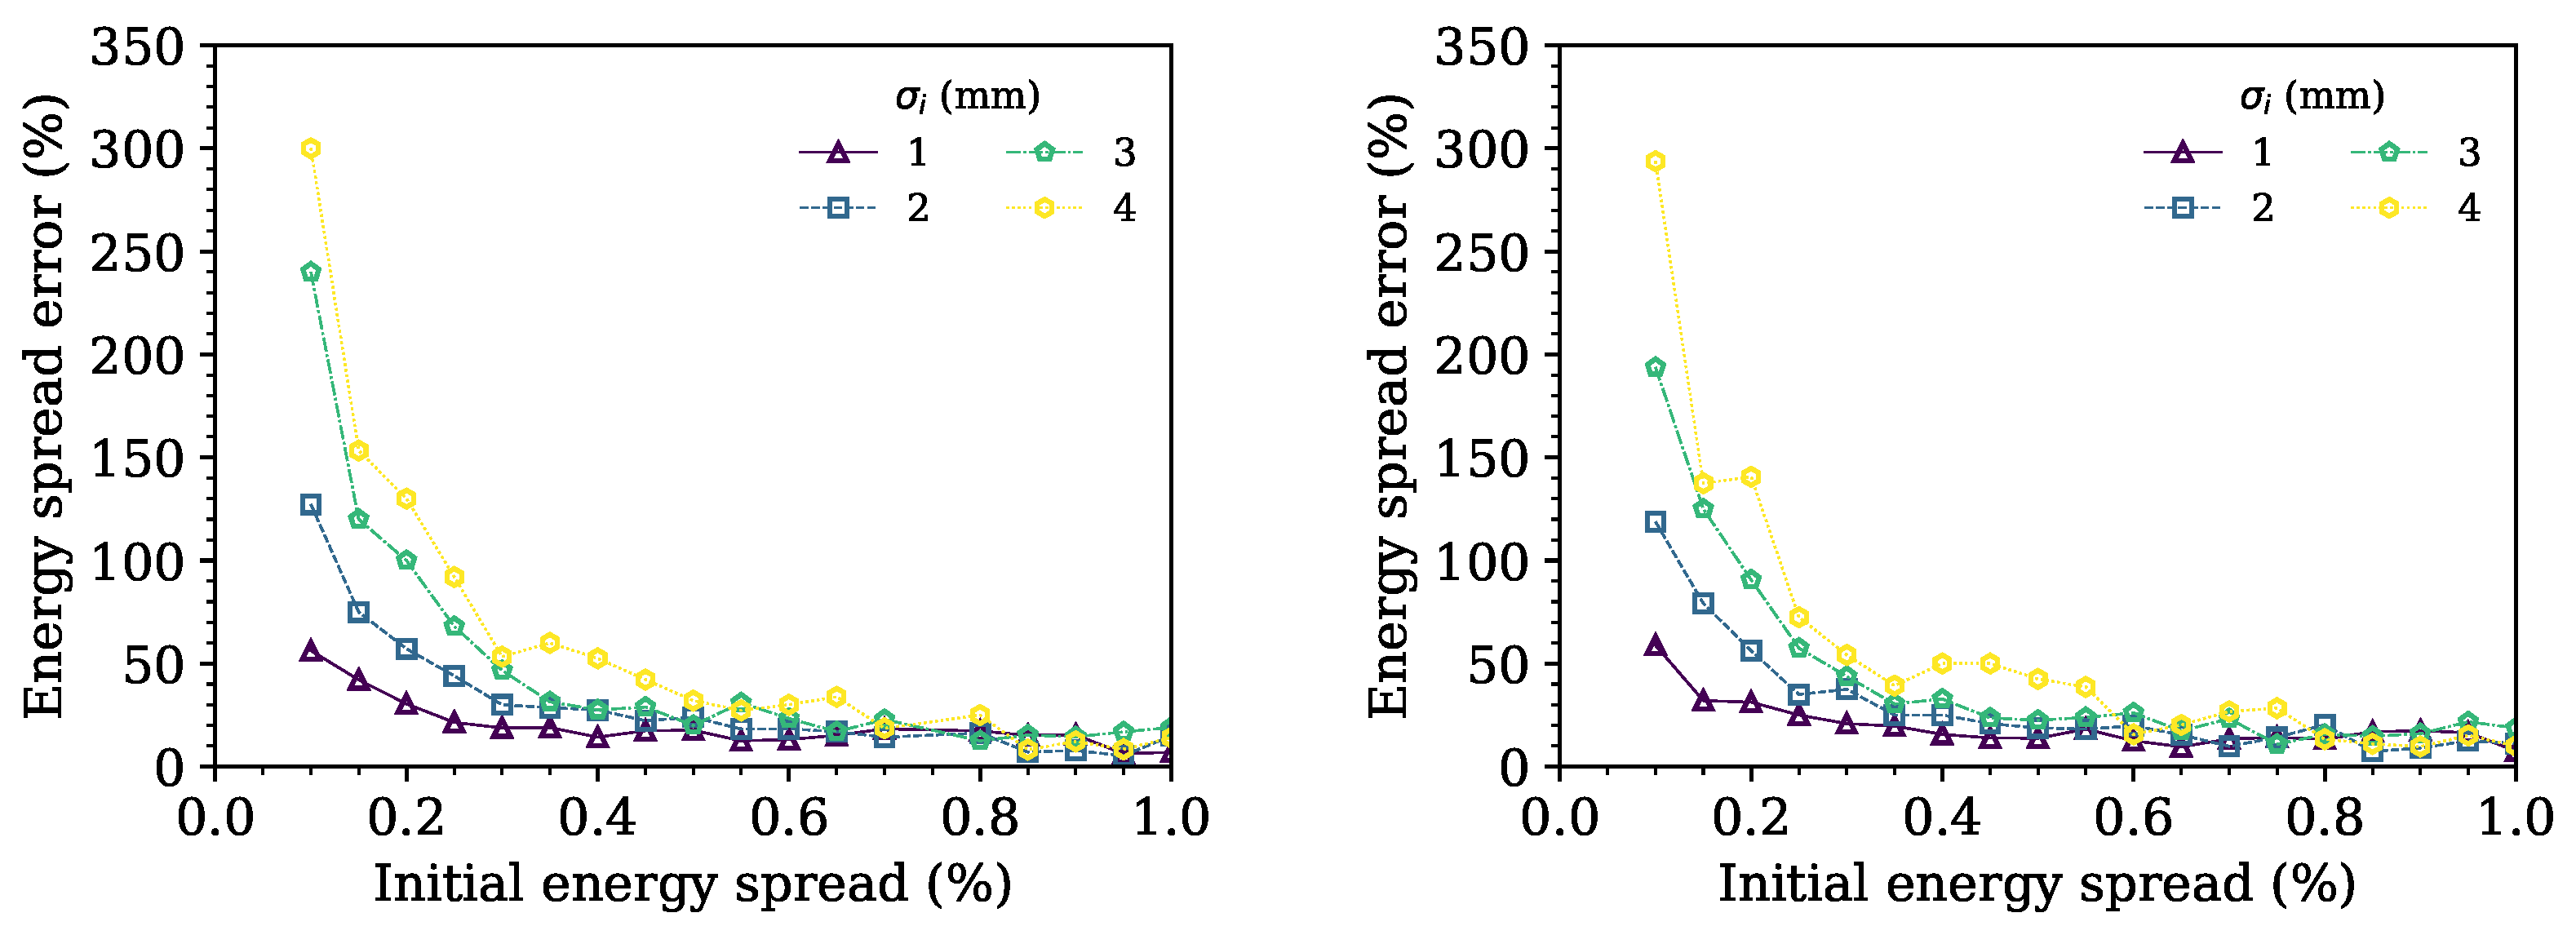
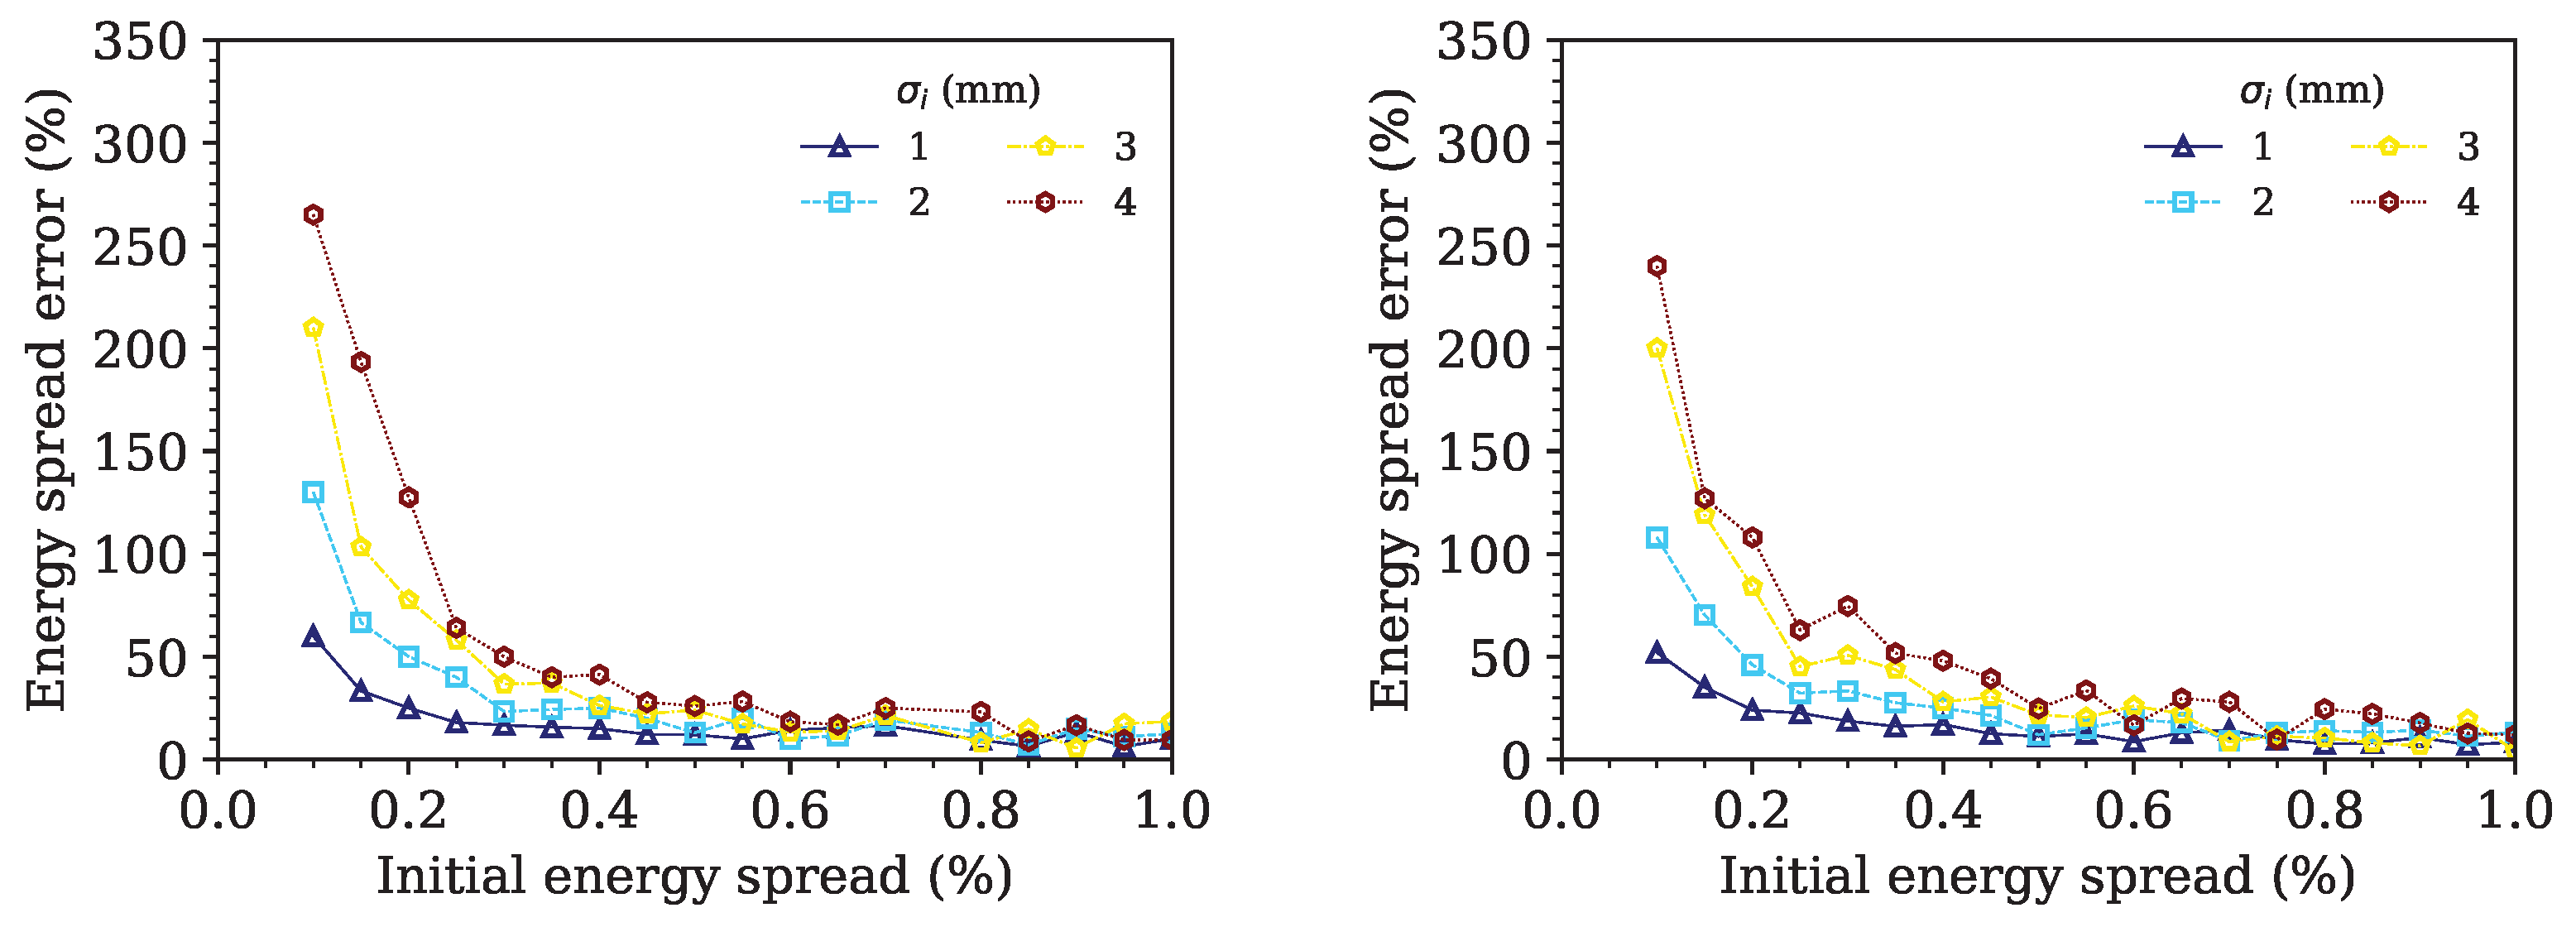
The simulated energy spread error, defined as the ratio of the measured energy spread on the screen (as in the experiment) to the initial energy spread specified in the simulation for both the THz and MIR spectrometers at the designated image positions, is presented in Figure 12 and Figure 13. The simulation results were obtained using ASTRA software, with screen resolution effects incorporated into the data analysis. The graphs illustrate the relationship between the measured energy spread error (expressed as a percentage) and the input energy spread across various initial beam sizes, ranging from 1 mm to 4 mm. For the THz spectrometer, simulations were performed at beam energies of 10 MeV and 16 MeV, while the MIR spectrometer was evaluated at 20 MeV and 25 MeV, as shown in the left and right plots, respectively.
The data analysis for the four considered beam energies reveals that the error in the measured energy spread decreased as the RMS transverse beam size decreased. Therefore, to minimize the energy spread error, a small initial beam size should be used. For the measurement of beams with a small initial energy spread, only a small beam size (smaller than 1 mm) must be used to maintain measurement accuracy.
4. Conclusions
We successfully designed and developed electromagnetic dipole magnets for electron beam deflection, which also serve as spectrometers in the MIR and THz FEL beamlines at the PCELL facility. These sector-type electromagnets, which operate without the need for water cooling, were implemented in both THz and MIR dipole configurations. The magnets effectively bend the electron beams by 60° toward their respective Faraday cup beam dumps while simultaneously functioning as energy spectrometers. The simulated effective magnetic length, calculated using the first field integral, was 427 mm—approximately 17% longer than the geometrical arc length. Key achievements include the generation of magnetic fields of 0.1739 T (with 414 turns per pole) for the THz dipole and 0.2588 T (with 600 turns per pole) for the MIR dipole, where both were operating at currents below 10 A. The conductor coils were optimized using Standard Wire Gauge (SWG) No. 10 copper wire with a diameter of 3.251 mm, ensuring the current density remains below 2 A/mm2.
In the spectrometer design, a detailed analysis was performed to evaluate both the energy resolution and energy spread measurement errors. The energy resolution, defined as the ratio of energy uncertainty to the mean energy, was shown to improve significantly with a smaller initial transverse beam size. For instance, at beam energies of 16 MeV and 25 MeV with an initial energy spread of 0.1%, energy resolutions of 0.2% and 0.5% were achieved for transverse beam sizes of 1 mm and 4 mm, respectively. This trend was consistent across all simulated conditions, with all configurations yielding resolutions below 1%, validating the spectrometer’s capability for high-precision beam diagnostics. Additionally, the analysis of energy spread errors revealed a strong correlation between the measured error and the initial energy spread. It was observed that decreasing the transverse beam size (from 4 mm to 1 mm) consistently reduced the energy spread measurement errors. This trend was evident across all tested beam energies: 10–16 MeV for the THz dipole and 20–25 MeV for the MIR dipole. The analysis across four beam energies confirmed that the measurement error in the energy spread decreased as the RMS transverse beam size became smaller. This trend was consistent for both the THz and MIR beamline configurations. To minimize energy spread measurement errors, a small initial beam size is recommended. In particular, for beams with a small initial energy spread, using a transverse beam size smaller than 1 mm is essential to maintain high measurement accuracy.
To further enhance resolution, future improvements may include the implementation of an energy-selecting slit to reduce the effective beam size or the use of a quadrupole magnet to focus the beam before entering the spectrometer. These strategies are expected to minimize beam divergence and reduce the transverse size at the detection screen, thereby improving both energy spread accuracy and overall spectrometer resolution.
Author Contributions
Conceptualization, E.K., C.T. and S.R.; methodology, E.K. and C.T.; validation, C.T. and S.R.; formal analysis, E.K.; investigation, E.K., K.D. and N.K.; resources, C.T. and S.R.; data curation, E.K.; writing–original draft preparation, E.K.; writing–review and editing, C.T.; visualization, C.T. and S.R.; supervision, C.T. and S.R.; project administration, S.R.; funding acquisition, S.R. All authors have read and agreed to the published version of the manuscript.
Funding
This research project was supported by Chiang Mai University and the NSRF via the Program Management Unit for Human Resources & Institutional Development, Research and Innovation (grant number B43G670045).
Data Availability Statement
The data that support the findings of this study are available from the corresponding author (C.T.) upon reasonable request.
Acknowledgments
This research has received support from Chiang Mai University and NSRF through the Human Resources Program Management Unit for Human Resources & Institutional Development, Research and Innovation [grant number B43G670045]. The authors express their sincere thanks to the engineering team at the National Astronomical Research Institute of Thailand (NARIT) for their invaluable support and assistance in the construction of the magnet yoke. E Kongmon acknowledges support from the Science Achievement Scholarship of Thailand (SAST).
Conflicts of Interest
The authors declare no conflicts of interest.
References
Hank, J.A.; Smith, P. Mid-infrared spectroscopy for chemical analysis. Anal. Chem.2014, 86, 133–144. [Google Scholar]
Rimjaem, S.; Apiwattanakul, P.; Chaisueb, N.; Jaikaew, P.; Jaikla, W.; Kangrang, N.; Kitisri, P.; Kongmali, K.; Kongmon, E.; Nanthanasit, P.; et al. Infrared Free-Electron Laser Project in Thailand. In Proceedings of the 13th International Particle Accelerator Conference, Bangkok, Thailand, 12–17 June 2022. [Google Scholar]
Rudolph, J.; Abo-Bakr, M.; Bürger, M.; Feikes, J.; Kuske, P.; Meseck, A.; Schälicke, A.; Schmidl, B.; Wüstefeld, G. Status of the HZB ERL Prototype BERLinPro. In Proceedings of the 5th International Particle Accelerator Conference (IPAC2014), Dresden, Germany, 15–20 June 2014; pp. 340–342. [Google Scholar] [CrossRef]
Vladimirov, I.; Shvedunov, V.; Kamps, T.; Voelker, J. Spectrometer for SRF Gun. In Proceedings of the 5th International Particle Accelerator Conference, Dresden, Germany, 15–20 June 2014; pp. 1234–1238. [Google Scholar]
Bazrafshan, R.; Rohwer, T.; Fakhari, M.; Kärtner, F.X.; Matlis, N.H. Design of a Compact 180-Degree Single-Shot Energy Spectrometer Based on a Halbach Dipole Magnet. In Proceedings of the 13th International Particle Accelerator Conference, Bangkok, Thailand, 12–17 June 2022; pp. 2564–2566. [Google Scholar]
Techakaew, K.; Kongmali, K.; Rimjaem, S. Electron Energy Spectrometer for MIR-THz FEL Light Source at Chiang Mai University. Particles2023, 6, 703–712. [Google Scholar] [CrossRef]
Floettmann, K. A Space Charge Tracking Algorithm (ASTRA). Available online: https://www.desy.de/~mpyflo/ (accessed on 5 October 2022).
Figure 1.
A 2D diagram of the PCELL accelerator, including an electron source, linac, and THz and MIR beamlines.
Figure 1.
A 2D diagram of the PCELL accelerator, including an electron source, linac, and THz and MIR beamlines.
Figure 2.
The designed trajectory of the electron beam with a bending angle of 60°.
Figure 2.
The designed trajectory of the electron beam with a bending angle of 60°.
Figure 3.
The dispersion function in meters (black, primary y-axis) and its first derivative (blue, secondary y-axis) along the design trajectory from both beam dumps to the screen position.
Figure 3.
The dispersion function in meters (black, primary y-axis) and its first derivative (blue, secondary y-axis) along the design trajectory from both beam dumps to the screen position.
Figure 4.
A diagram of the spectrometer, including a dipole magnet that deflects an electron beam by 60°.
Figure 4.
A diagram of the spectrometer, including a dipole magnet that deflects an electron beam by 60°.
Figure 5.
Dispersion per energy as a function of the electron beam energy ranging from 10 to 30 MeV (primary y-axis), and the image resolution in energy per pixel (secondary y-axis).
Figure 5.
Dispersion per energy as a function of the electron beam energy ranging from 10 to 30 MeV (primary y-axis), and the image resolution in energy per pixel (secondary y-axis).
Figure 6.
Distribution of the horizontal magnetic field intensity at the center plane () for THz.BD (left) and MIR.BD (right). The visualization includes the magnetic field intensity within the air gap (positive intensity) and inside the magnetic yoke, highlighting field variations in both regions (negative intensity).
Figure 7.
A visualization depicting the horizontal magnetic field intensity at the center plane () of THz.BD (left) and MIR.BD (right). These only show the magnetic field in the useful region (air gap) that is utilized to deflect the electron beam toward the Faraday cup.
Figure 7.
A visualization depicting the horizontal magnetic field intensity at the center plane () of THz.BD (left) and MIR.BD (right). These only show the magnetic field in the useful region (air gap) that is utilized to deflect the electron beam toward the Faraday cup.
Figure 8.
Magnetic field intensity and its first integral, representing the effective magnetic length, as obtained from CST EM Studio for the MIR.BD at a current of 5 A.
Figure 8.
Magnetic field intensity and its first integral, representing the effective magnetic length, as obtained from CST EM Studio for the MIR.BD at a current of 5 A.
Figure 9.
Magnetic field intensity in the horizontal direction at the center of the pole plate as a function of the applied electric current, with THz.BD on the left and MIR.BD on the right. The secondary y-axis represents the relative difference between the simulated and calculated results.
Figure 9.
Magnetic field intensity in the horizontal direction at the center of the pole plate as a function of the applied electric current, with THz.BD on the left and MIR.BD on the right. The secondary y-axis represents the relative difference between the simulated and calculated results.
Figure 10.
Magnetic field intensity in the horizontal direction at the central pole () as a function of the applied electric current (I) for THz.BD and MIR.BD, where the number of coil turns per pole was 414 for THz.BD and 600 for MIR.BD.
Figure 10.
Magnetic field intensity in the horizontal direction at the central pole () as a function of the applied electric current (I) for THz.BD and MIR.BD, where the number of coil turns per pole was 414 for THz.BD and 600 for MIR.BD.
Figure 11.
A correlation study between the electron kinetic energy and the optimal applied electric current for deflecting the electron beam by 60° downward toward the Faraday cup of both MIR.BD and THz.BD on the left plot.
Figure 11.
A correlation study between the electron kinetic energy and the optimal applied electric current for deflecting the electron beam by 60° downward toward the Faraday cup of both MIR.BD and THz.BD on the left plot.
Figure 12.
Energy spread error measured from the screen as a function of the initial energy spread of the THz spectrometers: 10 MeV on the left and 16 MeV on the right.
Figure 12.
Energy spread error measured from the screen as a function of the initial energy spread of the THz spectrometers: 10 MeV on the left and 16 MeV on the right.
Figure 13.
Energy spread error measured from the screen as a function of the initial energy spread of the MIR spectrometers: 20 MeV on the left and 25 MeV on the right.
Figure 13.
Energy spread error measured from the screen as a function of the initial energy spread of the MIR spectrometers: 20 MeV on the left and 25 MeV on the right.
Table 1.
Optimal parameters for the MIR FEL Beam Dump (MIR.BD) and THz FEL Beam Dump (THz.BD).
Table 1.
Optimal parameters for the MIR FEL Beam Dump (MIR.BD) and THz FEL Beam Dump (THz.BD).
Parameter
MIR.BD
THz.BD
Maximum beam energy (MeV)
30
20
Deflection angle (degrees)
60
60
Geometrical pole arc length (mm)
366
366
Magnetic field (T)
0.2588
0.1739
Dipole gap (mm)
50
50
Maximum current density (A/mm2)
2
2
Number of coil turns per pole (turns)
600
414
Coil diameter (mm)
3.251
3.251
Current (A)
8.582
8.357
Disclaimer/Publisher’s Note: The statements, opinions and data contained in all publications are solely those of the individual author(s) and contributor(s) and not of MDPI and/or the editor(s). MDPI and/or the editor(s) disclaim responsibility for any injury to people or property resulting from any ideas, methods, instructions or products referred to in the content.
Kongmon, E.; Damminsek, K.; Khangrang, N.; Rimjaem, S.; Thongbai, C.
Design and Development of Dipole Magnet for MIR/THz Free Electron Laser Beam Dumps and Spectrometers. Particles2025, 8, 66.
https://doi.org/10.3390/particles8030066
AMA Style
Kongmon E, Damminsek K, Khangrang N, Rimjaem S, Thongbai C.
Design and Development of Dipole Magnet for MIR/THz Free Electron Laser Beam Dumps and Spectrometers. Particles. 2025; 8(3):66.
https://doi.org/10.3390/particles8030066
Chicago/Turabian Style
Kongmon, Ekkachai, Kantaphon Damminsek, Nopadon Khangrang, Sakhorn Rimjaem, and Chitrlada Thongbai.
2025. "Design and Development of Dipole Magnet for MIR/THz Free Electron Laser Beam Dumps and Spectrometers" Particles 8, no. 3: 66.
https://doi.org/10.3390/particles8030066
APA Style
Kongmon, E., Damminsek, K., Khangrang, N., Rimjaem, S., & Thongbai, C.
(2025). Design and Development of Dipole Magnet for MIR/THz Free Electron Laser Beam Dumps and Spectrometers. Particles, 8(3), 66.
https://doi.org/10.3390/particles8030066
Article Metrics
No
No
Article Access Statistics
For more information on the journal statistics, click here.
Multiple requests from the same IP address are counted as one view.
Kongmon, E.; Damminsek, K.; Khangrang, N.; Rimjaem, S.; Thongbai, C.
Design and Development of Dipole Magnet for MIR/THz Free Electron Laser Beam Dumps and Spectrometers. Particles2025, 8, 66.
https://doi.org/10.3390/particles8030066
AMA Style
Kongmon E, Damminsek K, Khangrang N, Rimjaem S, Thongbai C.
Design and Development of Dipole Magnet for MIR/THz Free Electron Laser Beam Dumps and Spectrometers. Particles. 2025; 8(3):66.
https://doi.org/10.3390/particles8030066
Chicago/Turabian Style
Kongmon, Ekkachai, Kantaphon Damminsek, Nopadon Khangrang, Sakhorn Rimjaem, and Chitrlada Thongbai.
2025. "Design and Development of Dipole Magnet for MIR/THz Free Electron Laser Beam Dumps and Spectrometers" Particles 8, no. 3: 66.
https://doi.org/10.3390/particles8030066
APA Style
Kongmon, E., Damminsek, K., Khangrang, N., Rimjaem, S., & Thongbai, C.
(2025). Design and Development of Dipole Magnet for MIR/THz Free Electron Laser Beam Dumps and Spectrometers. Particles, 8(3), 66.
https://doi.org/10.3390/particles8030066


 and
and 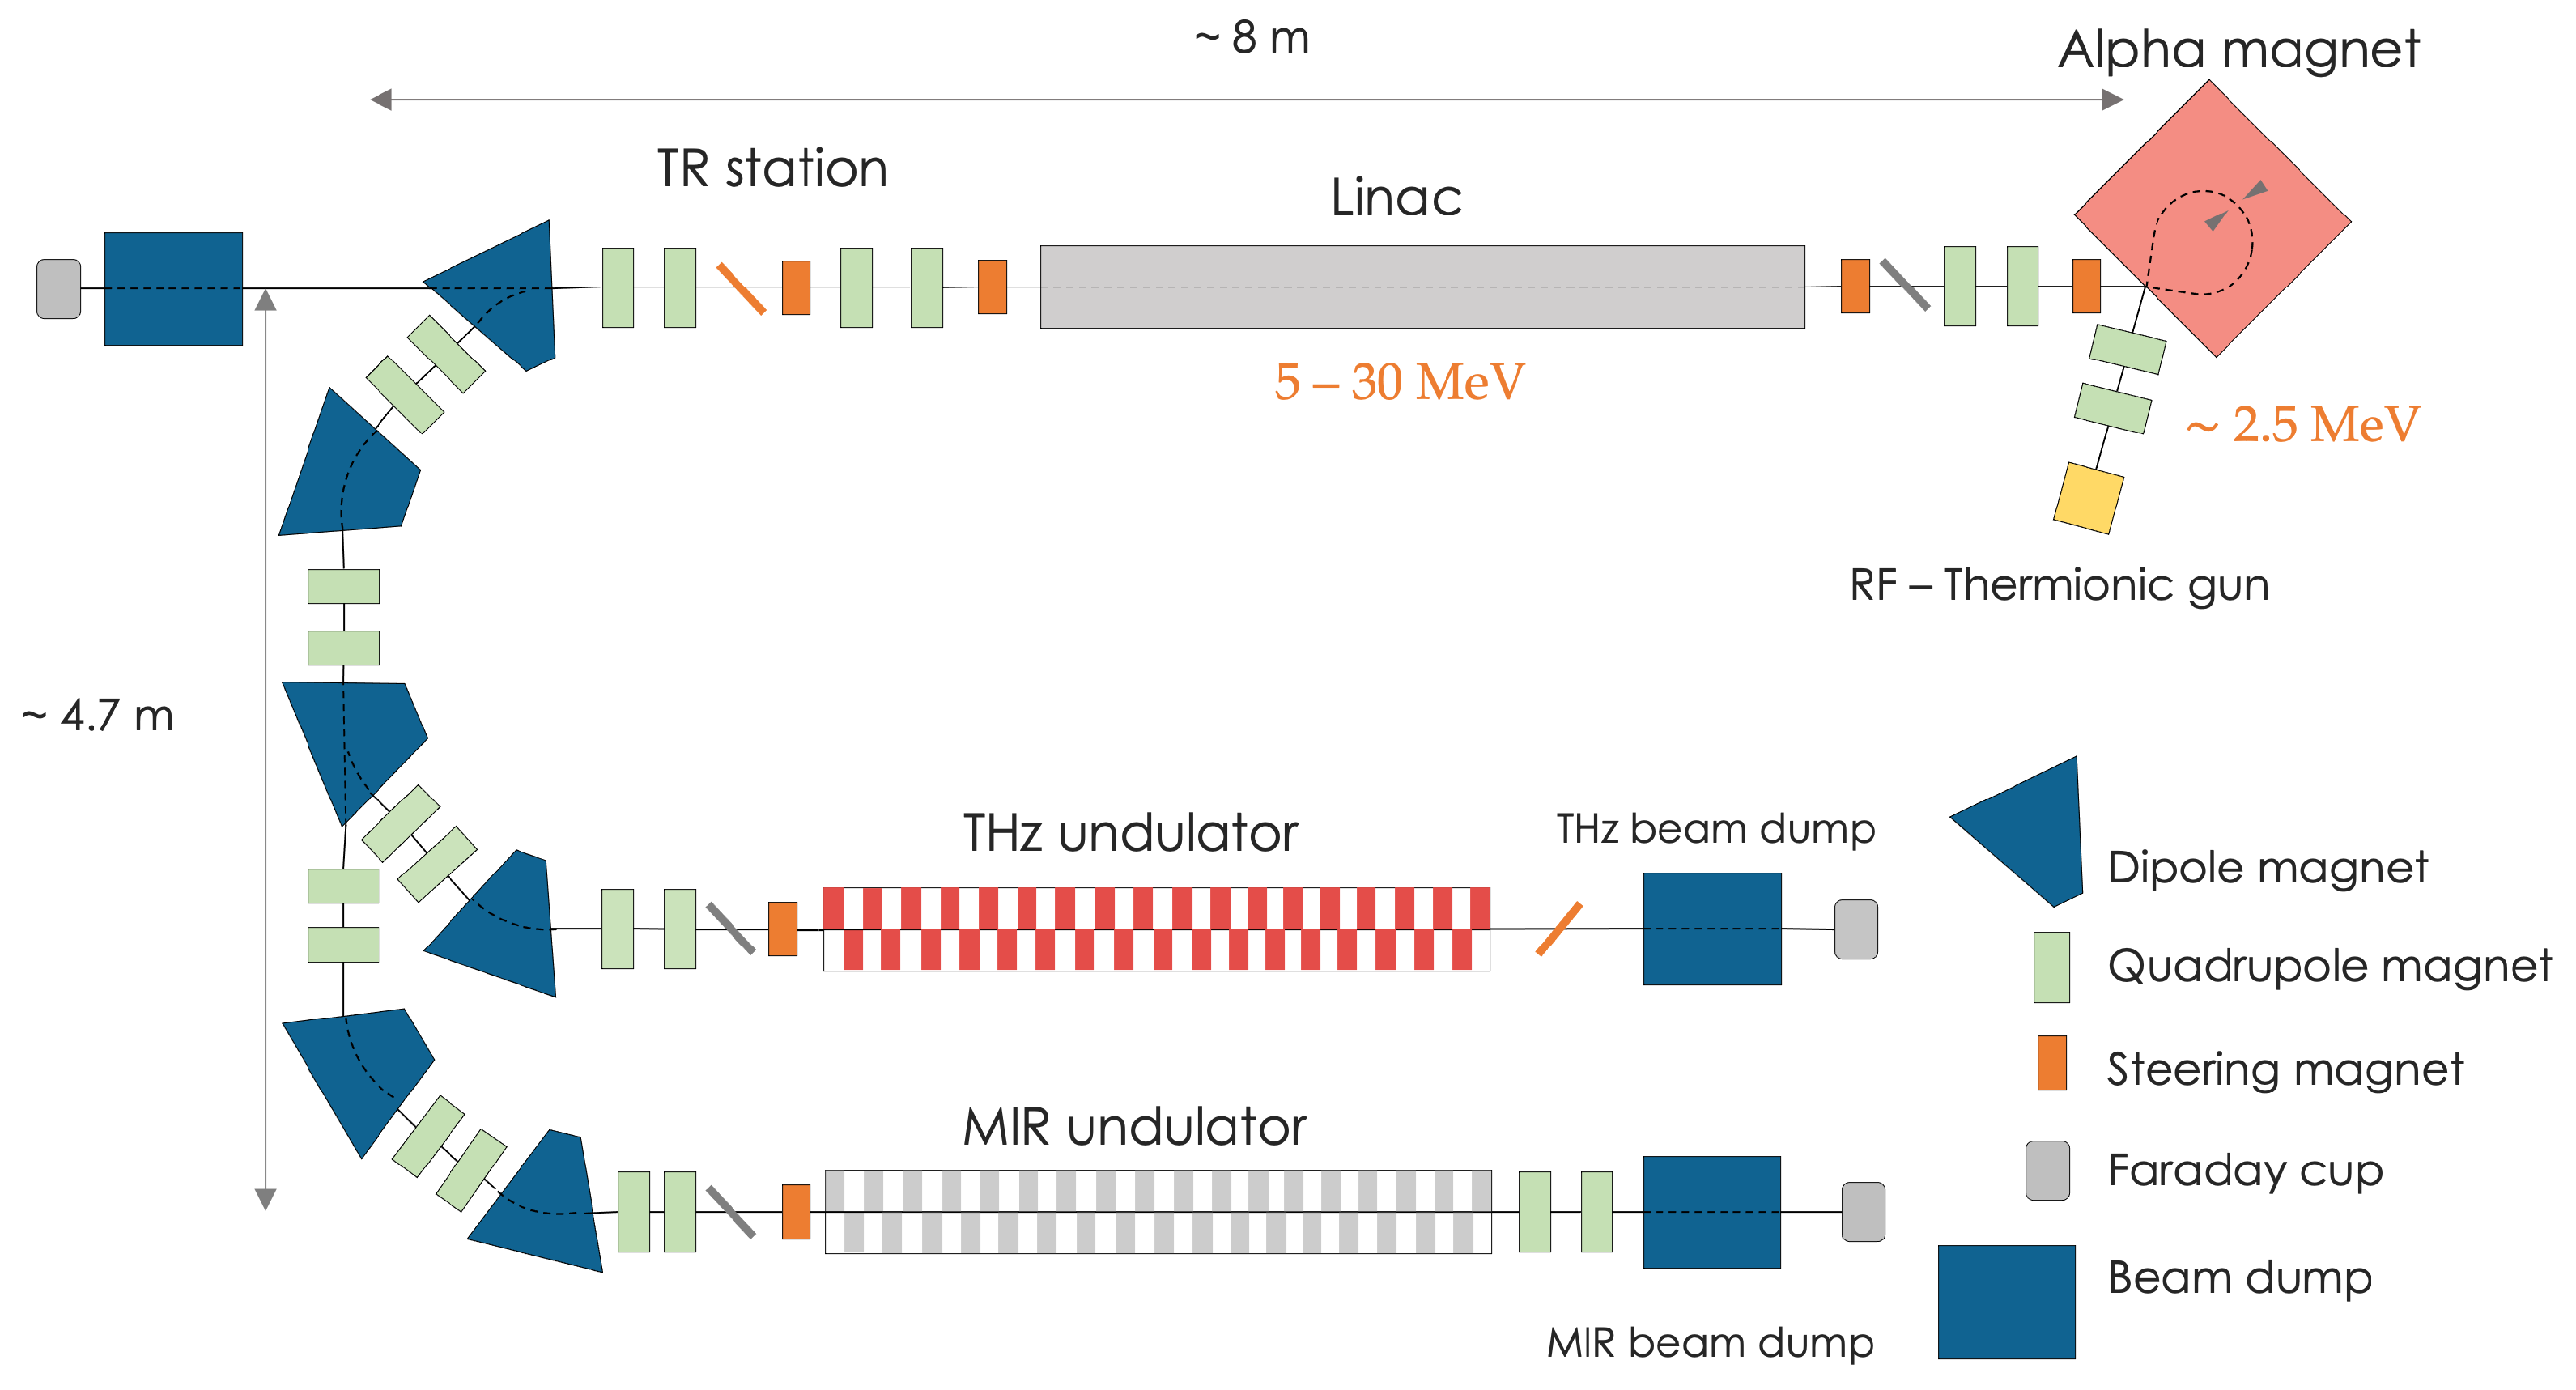


