All articles published by MDPI are made immediately available worldwide under an open access license. No special
permission is required to reuse all or part of the article published by MDPI, including figures and tables. For
articles published under an open access Creative Common CC BY license, any part of the article may be reused without
permission provided that the original article is clearly cited. For more information, please refer to
https://www.mdpi.com/openaccess.
Feature papers represent the most advanced research with significant potential for high impact in the field. A Feature
Paper should be a substantial original Article that involves several techniques or approaches, provides an outlook for
future research directions and describes possible research applications.
Feature papers are submitted upon individual invitation or recommendation by the scientific editors and must receive
positive feedback from the reviewers.
Editor’s Choice articles are based on recommendations by the scientific editors of MDPI journals from around the world.
Editors select a small number of articles recently published in the journal that they believe will be particularly
interesting to readers, or important in the respective research area. The aim is to provide a snapshot of some of the
most exciting work published in the various research areas of the journal.
Department of Physics, Old Dominion University, Norfolk, VA 23529, USA
2
Institut für Theoretische Physik, Universität Heidelberg, Philosophenweg 12, D-69120 Heidelberg, Germany
3
Department of Physics, University of Virginia, Charlottesville, VA 22901, USA
*
Author to whom correspondence should be addressed.
†
Deceased. This publication is dedicated to the memory of Dr. Corey Sargent, who tragically passed away on 11 June 2022, at the age of 25, and to his parents, Tracy Sargent and Gerard Carelli. At the time of his passing, Corey was developing the model at the heart of this article. To his fellow students W. C. and E. R., he was a friend and a mentor.
We examine the claimed observations of a gravitational external field effect (EFE) reported by Chae et al. We show that observations suggestive of the EFE can be interpreted without violating Einstein’s equivalence principle, namely from known correlations between the morphology, the environment, and dynamics of galaxies. While Chae et al.’s analysis provides a valuable attempt at a clear test of modified Newtonian dynamics, an evidently important topic, a re-analysis of the observational data does not permit us to confidently assess the presence of an EFE or to distinguish this interpretation from that proposed in this article.
One of the most pressing problems in contemporary science is the origin of an apparent substantial missing mass in large gravitational systems, such as galaxies or clusters of galaxies. The prevailing explanation for this phenomenon is the presence of non-baryonic weakly interacting matter known as dark matter. However, the consensus on dark matter’s existence is not universal. This is partly due to the lack of detection of dark matter particles either directly [1] or indirectly [2]. Furthermore, advances in particle physics have ruled out the most natural extensions of the Standard Model of particle physics, which previously offered promising dark matter candidates [3]. This has fueled alternative explanations for the missing mass problem. The most well-known of these alternatives is modified Newtonian dynamics (MOND) [4]. MOND has achieved notable success in economically describing observations at the galactic scale and even making predictions that have been subsequently validated; see [5,6] for a review. One such prediction is the radial acceleration relation (RAR), a strict correlation between the measured accelerations experienced by baryonic matter within galaxies and the accelerations predicted by Newtonian gravity in the absence of dark matter. This strict correlation has been observed [7,8]. While a loose correlation may be expected within the context of dark matter and galaxy formation, they offer no uncontrived explanation for the strict correlation. MOND is foremost a phenomenological theory. If its origin is fundamental rather than being an effective theory for phenomena arising from the complexity of galaxy dynamics and/or of general relativity (GR), it would violate some of GR’s tenets. Notably, the characteristic acceleration, denoted as , should lead to an external field effect (EFE), which contradicts GR’s strong equivalence principle. The EFE would substantially weaken the self-gravity of dwarf galaxies in a cluster environment, perhaps explaining why dwarf galaxies in the Fornax Cluster are much more susceptible to tides than expected in LCDM [9,10].
Recently, observations of the EFE have been reported by [11]. A refined analysis of the RAR data indicates that galaxies subjected to an external gravitational field, such as that emanating from neighboring galaxies, tend to display less missing mass compared to more isolated galaxies which, conversely, tend to have flatter rotation curves. This observation is naturally expected from MOND; given that the onset of MOND’s regime starts below , a constant external field added to the galactic field delays the transition to this regime. This, in turn, keeps the galaxy in the Newtonian regime longer, reducing their missing mass.
If these observations hold, it would mark the first experimental observation of a departure from GR and, equally significant, strongly challenge the dark matter hypothesis. Thus, it is imperative to study and exhaust alternative mundane explanations for the observations in [11]. The study’s authors examine various such hypotheses and reject them. In this article, we examine the claim that the observations in [11] evince the existence of an EFE. First, we investigate a possible explanation that has not been covered in [11], one that preserves GR and its strong equivalence principle while still obviating the need for dark matter. Specifically, we show how correlations between galactic properties, rotation curves, and environment may explain the observations in [11]. The appendices provide technical details of the analyses in Section 2 and a more quantitative analysis on how well MOND, with and without the EFE, fits the observational data based on the same MCMC approach taken in [11]. In particular, we examine how the uncertainties associated with the analysis in [11] affect the claim of EFE observation.
2. Modeling Radial Acceleration Relation with General Relativity Self-Interaction
The observations in [11] can be naturally explained without jeopardizing the strong equivalence principle by considering two facts. The first is that rotation curves depend on the galaxy’s distinct morphology. This is generally expected for any non-spherical extended system, regardless of whether Newtonian physics or GR is considered. If the system is large enough, the self-interaction of the gravitational field in GR is expected to cause (the rotation speed at the outskirts of the galactic disk) to noticeably depend on the morphology of the galaxy, particularly on the relative size of the bulge versus that of the disk. The second fact is the relationship between the environment and galactic morphology. It has been observed that the distribution of bulge types in the nearby universe clearly depends on the environment in which the galaxies reside [12]. This is expected in current hierarchical models of galaxy formation, in which the bulges of disk galaxies grow from environmental disturbances, particularly mergers [13], and this is supported by the observation that the bulge-to-total mass ratio of nearby galaxies correlates with their number of satellite galaxies [14]. Taken together, the dependence of on morphology and the correlation of the latter with the environment could explain the observations in [11] without violating the strong equivalence principle of GR. We will now quantitatively investigate this possibility.
To illustrate our model, we generated a set of 40,000 simulated disk galaxies with bulges sampling the correlations derived from observations in the manner previously described in detail in [15].
We account for GR self-interaction (GR-SI) in a disk galaxy by modeling it following [15]: the galaxy has two components, a disk and a bulge made solely of baryonic matter. The model does not require dark matter, since for galaxies large enough, field self-interaction constrains the gravitational field lines to remain within the disk, effectively confining gravity to approximately the two dimensions of the disk. This phenomenon, however, is suppressed in the bulge because its three-dimensional volume presents no particular direction or plane into which the field lines can collapse [16]. This expectation has been verified by observing that in elliptical galaxies, the larger the ellipticity, the more the dynamics of baryonic matter departs from the Newtonian expectation [17,18].
The model in [15] entails that the total acceleration within the galaxy () is the sum of the Newtonian acceleration () from the bulge and that of gravity is constrained to propagate in 2D (). We present an improved model:
with being the effective coupling constant of gravity in two dimensions. and are the masses of the baryonic bulge and disk, respectively, contained within a sphere of radius r. We improved the model mainly with the handling of the factor (discussed in detail in Appendix A) such that it satisfies the Tully–Fisher relation (detailed in Appendix B). The expression of the 2D part relates to the effective potential emerging from the solution found in [19] for a system with cylindrical symmetry in GR, but it is extrapolated to an extended source with a given mass profile here. It is worthwhile to emphasize that this and previous GR-based analyses of approximate 2D systems [16,20,21] positions our approach strictly within the framework of GR and its approximations and the Standard Model of particle physics, in contrast to MOND and CDM. The resulting is evaluated numerically (cf. Appendix B) and plotted versus in Figure 1. As the evaluation depends on the ratio of disk and bulge mass, or equivalently the bulge-to-total mass ratio , where and are total masses of the bulge and the disk, respectively, the distribution of this parameter in the numerical evaluation is plotted for reference. Clearly, at low accelerations, galaxies with large bulges (red color in the figure) are closer to the Newtonian expectation (diagonal line) than those with a small bulge (blue color). Equation (1) can be re-expressed as the ratio between the total acceleration to that from Newton’s gravity:
which can then be compared to those proposed in [7,11] in the context of a violation of the strong equivalence principle; see Appendix B.
We now utilize the observed correlation reported in [14], wherein a correlation was found between the bulge-to-total mass ratio of galaxies with their number of satellite galaxies. This relationship is given by
where is the number of observed satellites within a distance of 200 kpc from the main galaxy. This correlation serves here as a measure of the density of the environment in which the main galaxies reside, and therefore as a measure of the external gravitational field to which the galaxies are subjected to. This approach differs from that in [11], which estimated the external field within the standard CDM context using an N-body simulation and the 2M++ survey [22] to populate observed SPARC galaxies. We find our approach to be appropriate for this study due to the difficulties CDM has with estimating satellite populations [23] and its challenges in explaining strong correlations between bulge mass and satellite populations [24]. The absence of accurate SPARC bulge-to-total ratios also makes a direct comparison to [11] difficult. We also acknowledge that [14] did not aim to present an exact formula for N vs. . Instead, we use Equation (3) for the purpose of better understanding the trend presented by the data. In doing so, we note that the complex histories of individual galaxies play the most important role in determining morphology and corresponding isotropies. These complex histories present a problem when attempting to analyze individual galaxies. Therefore, analyzing individual rotation curves, while often useful, is not necessary in our context.
Reformulating Equation (2) as shown in Appendix B and combining Equations (A10) and (3) yields the observation that galaxies from a dense environment tend to be closer to the Newtonian expectation than isolated galaxies:
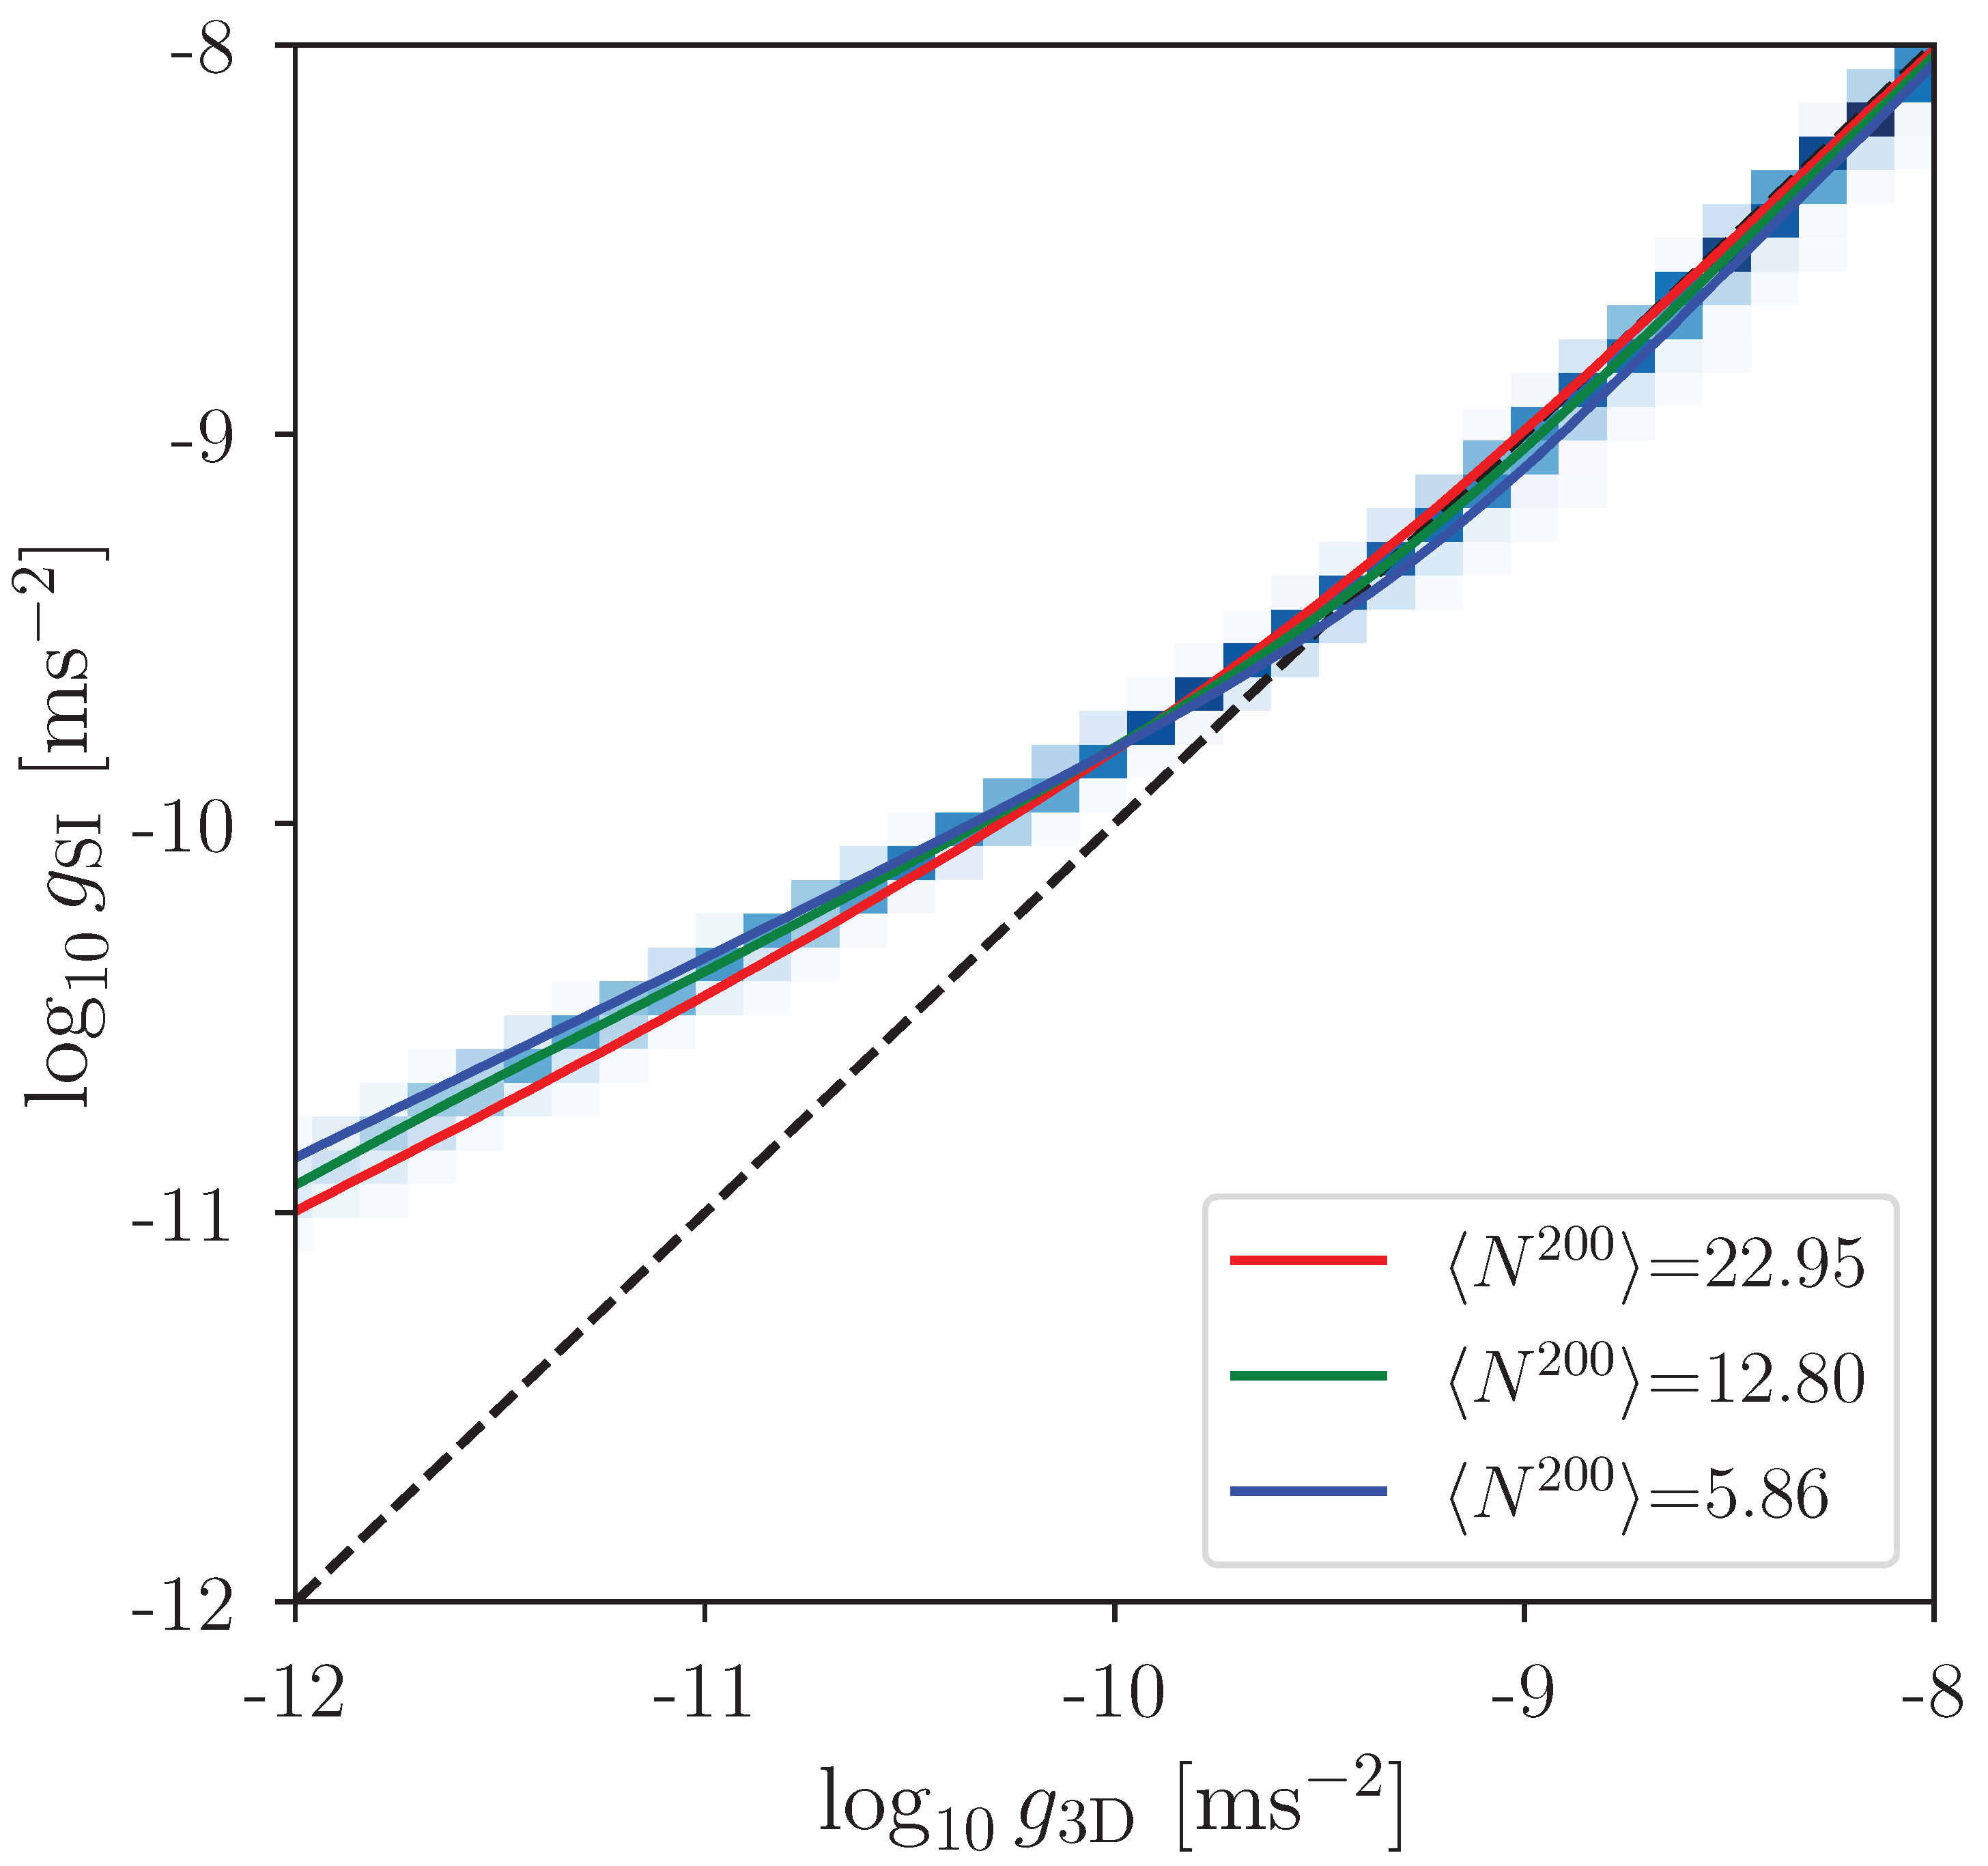
The third term on the right-hand side of Equation (4) will result in the radial acceleration curve getting closer to the 45° diagonal as increases, as shown in Figure 2.
Using this result, we find we can thus account for the correlation observed in [11] without invoking an EFE. This is achieved by combining the verified GR-SI prediction that the departure from a Newtonian behavior of a large system is suppressed by the degree of isotropy of the system [17,18], with the observed correlations between the morphology of disk galaxies and satellite galaxy populations [12,13,14]. In short, if the dynamics of spiral galaxies are dependent on galactic morphology in the way predicted by GR-SI, and the morphology of galaxies are correlated with their number of satellite galaxies (and more generally, their environment), then we expect to see a correlation between the dynamics of galaxies and their external fields. This expected correlation is in direct contrast to the explanation given in [11] wherein external fields directly affect the dynamics of spiral galaxies via the suppression of the MOND effect.
For a quantitative comparison, the MCMC analysis in [11] should be repeated with our model. For technical details, see Appendix C. We find that the significance of the analysis in [11] is not as high as claimed. Re-conducting their analysis, we find considerably different values and large error margins. Within these errors, our results are consistent with the values in [11], but our analysis does not provide further insights aside from highlighting important instabilities in the MCMC analysis and possible insufficient convergence. This suggests that [11] might not have found a global maximum of the likelihood in the parameter space. In particular, Chae et al. [11] stops after a given number of iterations and does not demonstrate convergence of the MCMC analysis. To quantitatively determine which model is preferred would require a prohibitively expensive investigation of the parameter space to ensure proper convergence of the MCMC algorithm, which is beyond the scope of this paper. At this point, we can only state that the MCMC analysis in [11] suffers from insufficient convergence, which, in addition to the alternative explanation presented here, further weakens claims for an EFE.
3. Conclusions
We examined the claim of observations of an external field effect (EFE) in gravitation reported in [11], based on extensive data on disk galaxy rotation [7]. First, we showed with an example that there exist other plausible explanations not requiring an EFE nor contrived models tailored to explain this phenomenon. To do so, we demonstrated that an apparent deviation from Einstein’s strong equivalence principle could be explained instead by examining the known correlations between galactic morphology, the galactic environment (specifically, satellite galaxy populations), and galaxy dynamics. More precisely, it is expected from the non-linear character of general relativity that galaxies with larger bulges exhibit more Newtonian dynamics, just like how rounder elliptical galaxies exhibit a smaller missing mass problem than flatter ones [17,18]. This, together with the observation that galaxies with a higher number of satellites, which is indicative of a denser environment (and incidentally a greater external field), tend to have larger bulges [14], explain the apparent EFE. Furthermore, while re-analyzing the data following the approach in [11], we found that, given the analysis method used in [11] and in this study, observational data do not permit us to confidently assess the the existence of an EFE or to distinguish between the possible various interpretations of these data.
Author Contributions
Conceptualization, C.S., A.D. and B.T.; methodology, C.S., A.D. and B.T.; software, C.S., W.C., A.S. and B.T.; validation, A.M., A.S., A.L. and E.R.; formal analysis, C.S., W.C., E.R., A.M., A.S., A.L., A.D. and B.T.; investigation, A.L.; resources, A.M. and W.C.; data curation, C.S. and A.M.; writing—original draft preparation, A.D. and B.T.; writing—review and editing, A.D., B.T., W.C. and A.S.; visualization, C.S., W.C., A.S. and B.T.; supervision, A.D. and B.T.; project administration, A.D. and B.T.; funding acquisition, B.T. All authors have read and agreed to the published version of the manuscript.
Funding
This work was funded by the U.S. National Science Foundation grant no. 1847771 and by the Corey Sargent Memorial Scholarship in Physics at Old Dominion University.
Data Availability Statement
All data used in this paper were collected from open sources and the references are provided.
Conflicts of Interest
The authors declare no conflicts of interests.
Appendix A. Effective Coupling Constant α
The quantity appearing in our model, Equation (1), is the effective coupling of the gravitational force when its propagation is constrained within less than three dimensions. From a dimensional consideration, a different coupling is required when a force propagates in a space of dimension not equal to three. This has been experimentally observed in the case of forces other than gravity. It is helpful here to use the strong nuclear force as an example, which displays a conspicuous field self-interaction effect.
The strong force potential between two static color charges separated by distance r is accurately modeled by [25,26,27].
where the 4/3 is a color combinatorial term coming from the fact that there are three types of color charge, is the fundamental strong force coupling constant [28,29,30], and is the effective strong force coupling in one dimension, called the “string tension”. The term is the “Coulomb/Newtonian” part of the potential that dominates at short distances, while is the string/flux tube part that dominates at long distances. The latter term originates from the collapse of the force field lines into flux tubes, and therefore is an emergent effective potential. In all, is the coupling of this effective 1D force.
Likewise, is the coupling of the effective force in 2D in the case of a perfect disk galaxy which is large enough to enable GR’s non-linear regime. In the static cylindrical vacuum metric presented in [19], an integration constant arises which, although a priori without clear physical interpretation, compares to in the effective potential.
In the field line picture, it can be envisioned that the galactic density is too weak to fully collapse the field lines into a 2D system. Therefore, the value of will depend on the galaxy characteristics. Furthermore, the field line collapse occurs over a finite distance and, in particular, is delayed by the presence of the bulge. There is therefore a transition region where the value of depends on the distance to the galactic center. This is not modeled in Equation (1), which assumes only 3D and 2D regimes. From these considerations, it is not expected that is universal for all galaxies and it would need to be computed case by case, which is not practical. Therefore, we treat here as a free parameter of our model, albeit with a clear physical meaning.
Appendix B. Interpolation Function for General Relativity Self-Interaction
The acceleration ratio for our model given in Equation (A14) is
This approach is evaluated numerically by constructing model galaxies by generating parameters such as half-light radius, disk scale length, Sérsic parameter, total mass of the disk, and the total mass of the bulge. We then enforce known relations between these quantities to ensure a realistic parameter space for individual galaxies. To determine and , we solve the Abel integral for the disk and bulge of individual galaxies. Normalizing these with the parameters and obtained from the total mass gives and . Importantly, with this normalization, we can rewrite
where is the total baryonic mass. The implicitly defined functions and are dimensionless mass profiles (in particular, independent of the total mass), which can be rescaled appropriately to obtain the mass profile of any synthetic galaxy with bulge and disk masses , respectively. Using these definitions, we can reformulate Equation (A2) as
For chosen from an appropriate galaxy model, this depends on the bulge-to-total-mass ratio only.
The ratio matches the Newtonian regime, , where and . The regime where SI is important, , where , yields
and multiplying it by , we obtain the asymptotic behavior of :
or, in terms of a log-log plot of versus :
Combining Equation (A10) with Equation (3) yields Equation (4). The second term on the right-hand side of Equation (A10) is model-dependent (related to the 2D coupling ), and the third term is a galaxy-dependent vertical shift (related to galaxy properties and ). Data [31] shows that and are correlated via , where [15]. Incorporating this correlation into Equation (A10), we obtain
From Equation (A11), the larger is, the closer the slope is to one (the diagonal in vs. plot), as evident from Figure 1.
from which the relationship between the asymptotic velocity and the baryonic mass of the galaxy can be expressed as
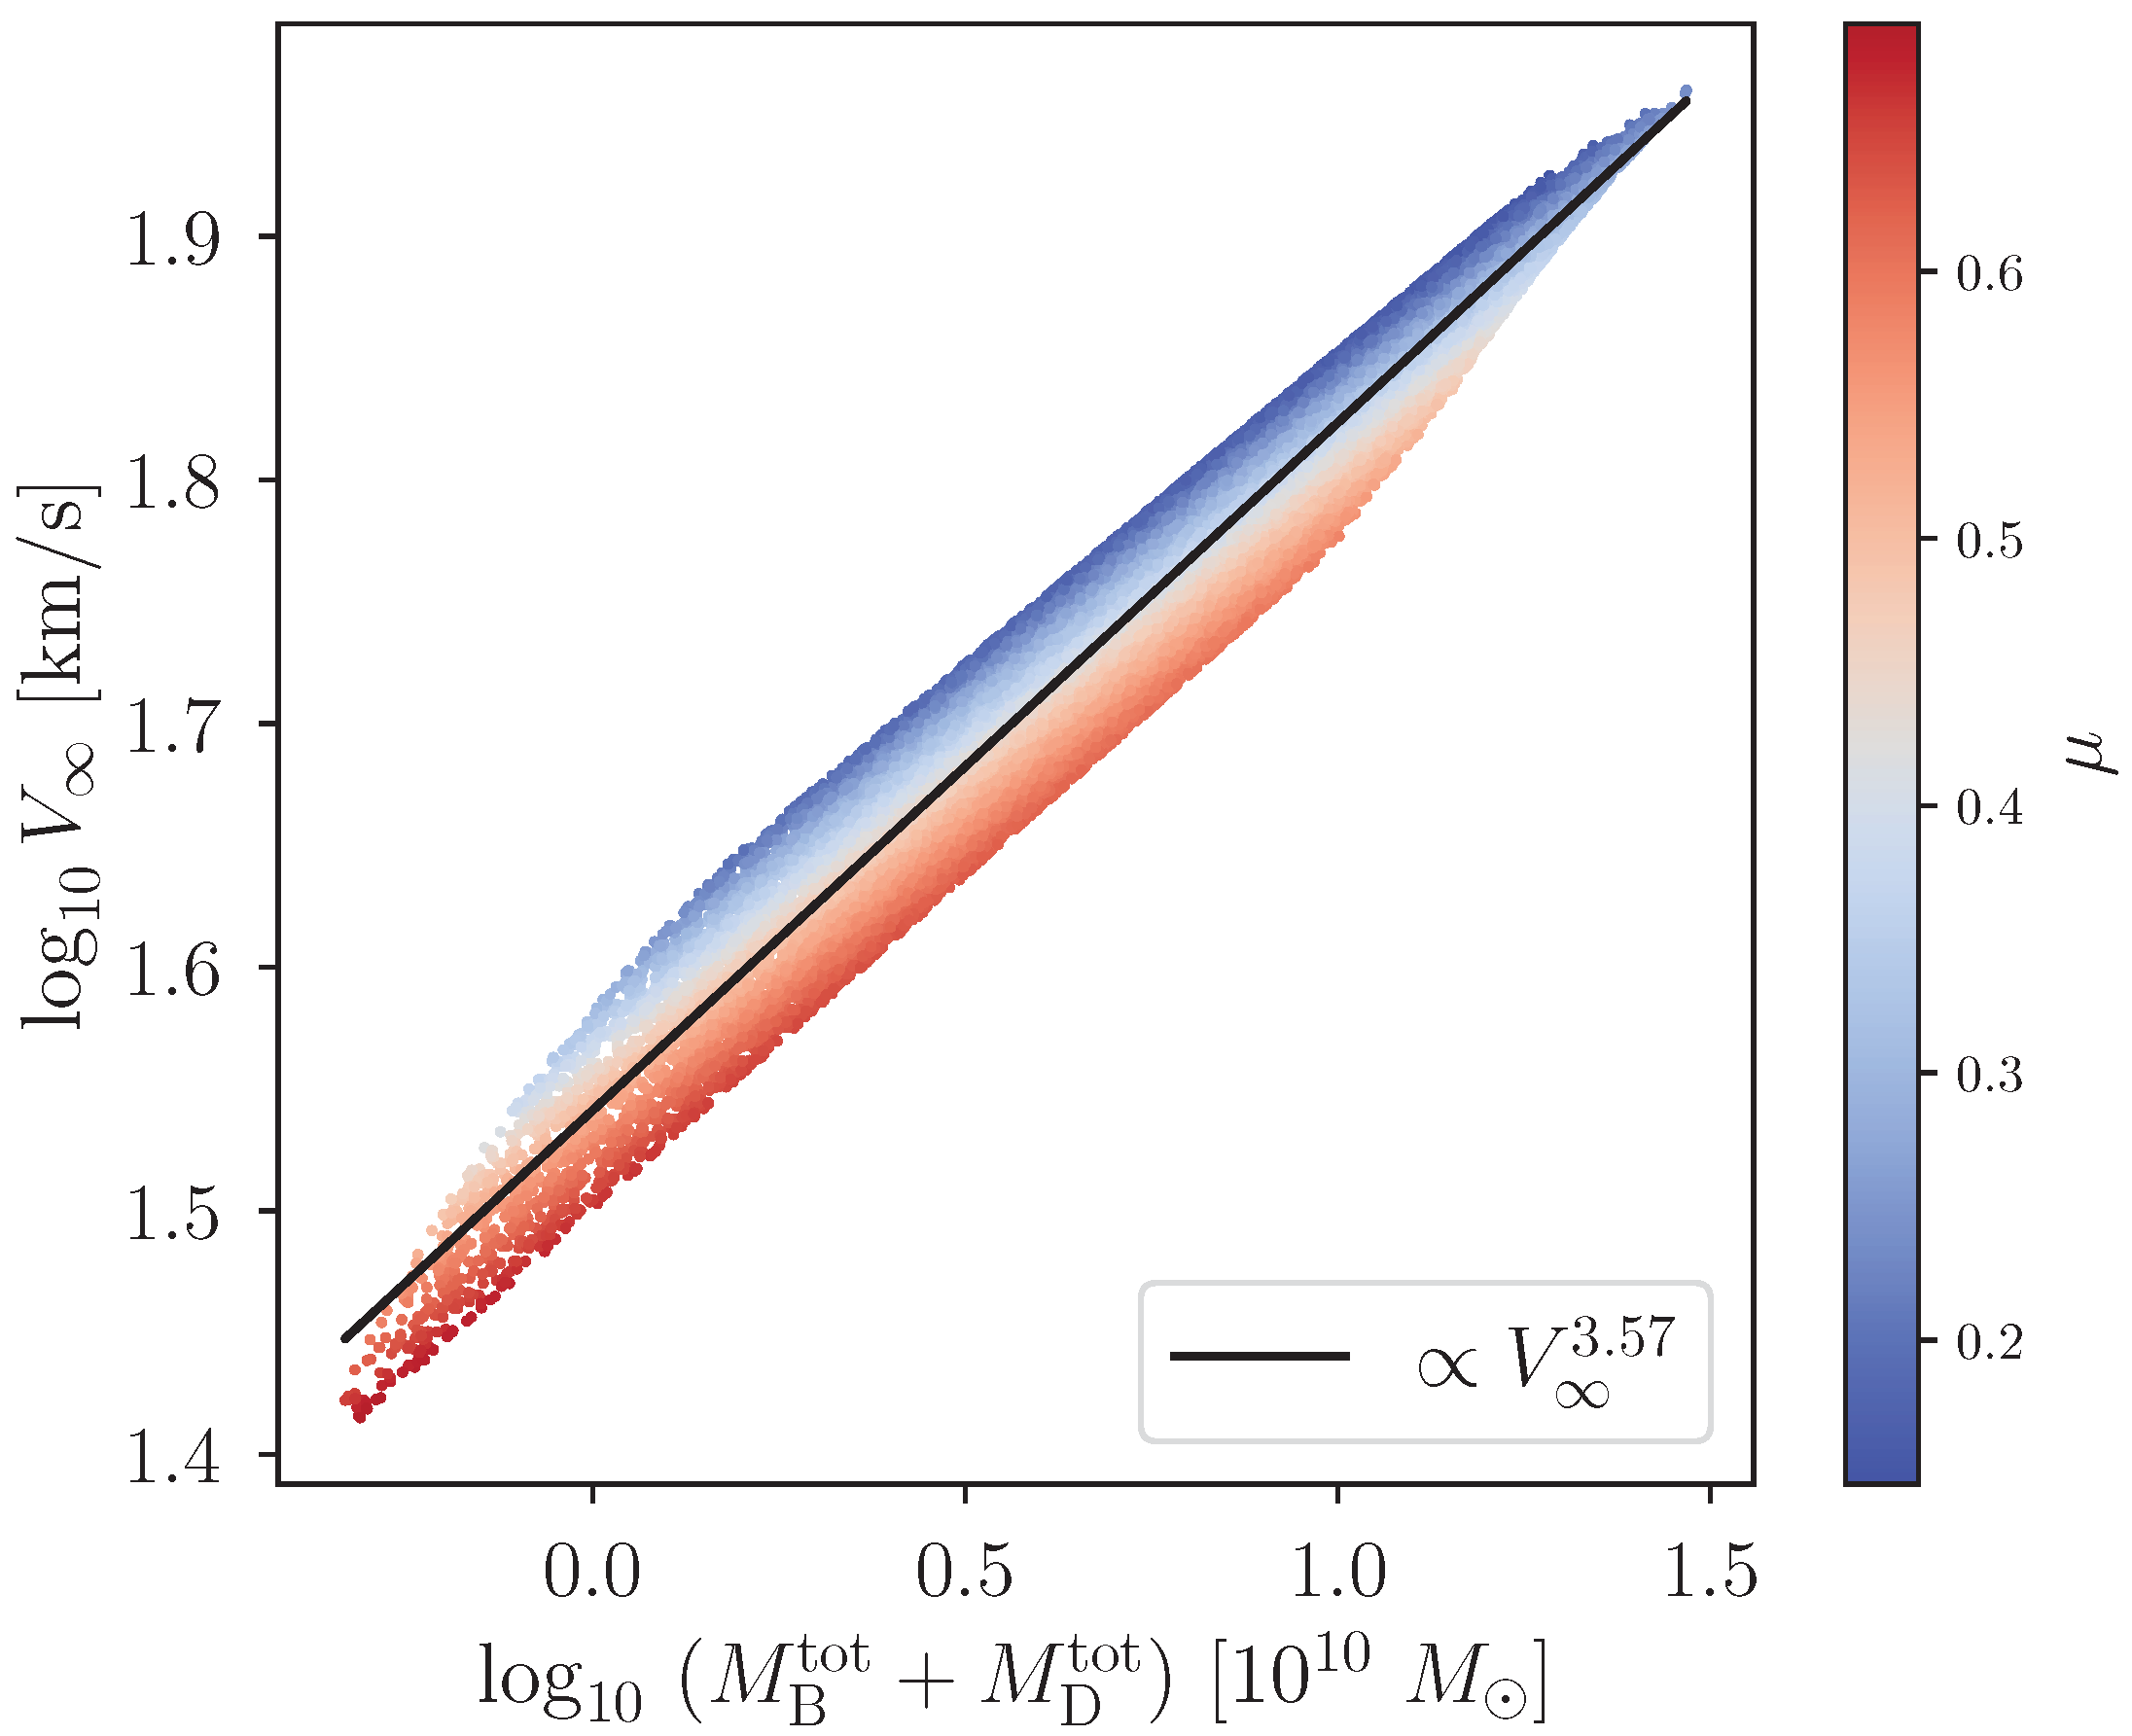
While this directly correlates with the asymptotic velocity with the total baryonic mass of the disk, with the disk mass and the bulge mass being correlated, it is expected that a relation between the total baryonic mass will also be strongly correlated with the asymptotic velocity . Figure A1 shows this expectation, with a correlation slope close to four, consistent with the baryonic Tully–Fisher relation [32].
Figure A1.
The relationship between the total baryonic mass and the asymptotic velocity using the model in Equation (1). A slope slightly smaller than four is consistent with the baryonic Tully–Fisher relation. A value of is used.
Figure A1.
The relationship between the total baryonic mass and the asymptotic velocity using the model in Equation (1). A slope slightly smaller than four is consistent with the baryonic Tully–Fisher relation. A value of is used.
Appendix C. Bayesian Analysis
To compare our results to the observations, we used an approach similar to the one in [11] formulated in terms of the following interpolation function:
For our model presented in Section 2, this ratio is discussed in Appendix B. The evaluation of the model is then performed using Markov chain Monte Carlo (MCMC) simulations with the parameter vector using the posterior probability
where are the prior probabilities and
This posterior probability follows in the work of Chae et al. [11]. However, Chae [33] later stated that Chae et al. [11] used additional terms in the likelihood, namely
We examine the results for both choices of the posterior probability but do not find any significant changes in our claims (Figure A2). In both cases, the sum is calculated from the rotational velocity
given by the observed values and their standard deviations , as well as the observed inclination and the theoretical inclination i treated as a nuisance parameter in the MCMC. Furthermore, the baryonic matter velocity is calculated from the observed values for (bulge), (disk), (gas) [34], the mass-to-light ratios for each component, and the fiducial distance , with the latter and the mass-to-light ratios being additional nuisance parameters in the MCMC. Here, denotes the ratio of the total gas mass to the Hi mass and is chosen in the same way as by Chae et al. [11]. In particular, for each galaxy, we calculate the inverse ratio from Chae et al. [11] (Equation (4)) and use it as a prior, allowing to vary about [11] (cf. Table 1). The baryonic matter velocity is then given by
following [11]. From this, the rotational velocity according to the model can be obtained from , Equation (A14):
The parameter vector for the MCMC is given by . The evaluation is performed analogously to the analysis in [11] using the public code emcee [35] with , discarding the burn-in steps up to and thinning the rest by a factor of 50. We choose .
This evaluation can be performed for different interpolation functions . Here, we examine the following functions:
where is the external field parameter, is the total mass, and for constant as in [11]. The first of these, , refers to the interpolation function presented in [7]; the second, , is the one from [11]. Concerning for our model, we evaluate it based on Equation (A5). The normalized mass profiles are obtained as described in Appendix B, choosing modeled galaxies with the total mass matching the one of the observed galaxies. In particular, they are independent of the total mass, but we have to average over the bulge-to-total mass ratio and the galaxy parameters used in the galaxy model. The additional parameters e for and for are used as further parameters in the MCMC parameter vector .
As all of these models depend on the mass-to-light ratios through only, cannot be determined if the respective velocity part vanishes for all radii. Furthermore, as the fiducial distance enters the probability function through defined in Equation (A20) only, it is degenerate with the mass-to-light ratios, but only the products , , and are fixed. Comparing these factors and the remaining parameters resulting from the evaluation of to the results reported in [11], we find that they agree within the given error margins (Figure A2).
Following [11], we use the Bayesian information criterion (, with the maximum likelihood , the number of free parameters k, and the number of data points N) to compare the models. From Equations (A15) and (A17), we find
Notably, the absolute value of the maximization likelihood is only fixed up to a constant by the MCMC parameters. Furthermore, as the specific parameter values obtained from the MCMC differ from the results in [11], so does and thus the . In particular, ref. [11] considered the so-called golden galaxies (Table A1), two of which have very low values according to [11], which was not the case in our analysis. As we have conducted the same analysis as Chae et al. [11] to the best of our knowledge, we conclude that the MCMC results are not stable enough to infer any results based on the only. Investigating this criterion based on Equation (A25),
we find that it is dominated by the and terms. However, the term does not differ much between the different models, as it depends only on one fitted parameter, i. The main contributions to any value thus come from the term. In order to make any statements about the significance of the preference for any model, we analyze this term. In particular, we consider the reduced with as the number of degrees of freedom. Note that any parameter vector that maximizes the likelihood in Equation (A15) also maximizes it for instead of (or instead of ). Our conclusions are thus based on the difference in given by with the corresponding uncertainty determined by error propagation based on Equation (A16) for . This analysis yields no significant preferences of models for the golden galaxies (Table A1). We note that although we aimed to follow the approach described in [11] to the best of our knowledge, the and values obtained from our analysis differ from the ones reported in [11]. However, based on the error bars in our calculation of , this difference is not significant.
To evaluate the preference of the models for the remaining galaxies, we use . For 135 out of 149 galaxies, we find that this difference is within , while two galaxies, UGC 3580 and NGC 2903, weakly favor the [7] model and the other 12 are in favor of the model in [11]. However, all of these preferences are still below the significance. Comparing the models by [7,11] to GR-SI, we find similar results. The MCMC-based analysis of the interpolation function thus does not favor any of the three models. Importantly, we do not find any significant indication for an EFE.
Table A1.
Evaluation based on for the analyses of and for the golden galaxies investigated in [11] compared to our analysis. Positive values indicate preference of the model in [11] with an EFE over the one in [7]. The first column provides the values reported in [11] and in the second, we present the values obtained from our MCMC analysis of the and interpolation functions. For investigating the significance of the model preference, we provide the values for the (third column) and (fourth column) interpolation functions, as well as their difference with the respective error margins in addition to the . Note that the values are quoted based on from Equation (A17), whereas the three right columns give the difference in reduced , making it less obvious that the is indeed dominated by .
Figure A2.
Results for the dimensionless parameters in the parameter vector and their error margins (1, 2, and 3σ) from the MCMC analysis in [11] and in our evaluation, both using the vC20 model, shown in Equation (A23). The results from our analysis are given both for the likelihood build from , in Equation (A16), (red) and , in Equation (A17) (green). The estimated parameters are shown by the light green, red, and black lines, respectively, and the green, orange, and blue regions give the respective error margins. In the first three panels, we show the products , respectively, as the mass-to-light ratios Υ that are degenerate with . Note that can only be determined for galaxies with non-vanishing VB. The two bottom panels give the results for the inclination i and the external field parameter e.
References
Kahlhoefer, F. Review of LHC Dark Matter Searches. Int. J. Mod. Phys. A2017, 32, 1730006. [Google Scholar] [CrossRef]
Gaskins, J.M. A review of indirect searches for particle dark matter. Contemp. Phys.2016, 57, 496–525. [Google Scholar] [CrossRef]
Arcadi, G.; Dutra, M.; Ghosh, P.; Lindner, M.; Mambrini, Y.; Pierre, M.; Profumo, S.; Queiroz, F.S. The waning of the WIMP? A review of models, searches, and constraints. Eur. Phys. J. C2018, 78, 203. [Google Scholar] [CrossRef] [PubMed]
Milgrom, M. A modification of the Newtonian dynamics as a possible alternative to the hidden mass hypothesis. Astrophys. J.1983, 270, 365–370. [Google Scholar] [CrossRef]
Merritt, D. A Philosophical Approach to MOND; Cambridge University Press: Cambridge, UK, 2020. [Google Scholar] [CrossRef]
Banik, I.; Zhao, H. From Galactic Bars to the Hubble Tension: Weighing Up the Astrophysical Evidence for Milgromian Gravity. Symmetry2022, 14, 1331. [Google Scholar] [CrossRef]
Lelli, F.; McGaugh, S.S.; Schombert, J.M.; Pawlowski, M.S. One Law to Rule Them All: The Radial Acceleration Relation of Galaxies. Astrophys. J.2017, 836, 152. [Google Scholar] [CrossRef]
Asencio, E.; Banik, I.; Mieske, S.; Venhola, A.; Kroupa, P.; Zhao, H. The distribution and morphologies of Fornax Cluster dwarf galaxies suggest they lack dark matter. Mon. Not. R. Astron. Soc.2022, 515, 2981–3013. [Google Scholar] [CrossRef]
Xu, X.; Peletier, R.F.; Awad, P.; Raj, M.A.; Smith, R. Asymmetry at low surface brightnesses as an indicator of environmental processes in the Fornax cluster. Astron. Astrophys.2025, 695, A219. [Google Scholar] [CrossRef]
Chae, K.H.; Lelli, F.; Desmond, H.; McGaugh, S.S.; Li, P.; Schombert, J.M. Testing the Strong Equivalence Principle: Detection of the External Field Effect in Rotationally Supported Galaxies. Astrophys. J.2020, 904, 51. [Google Scholar] [CrossRef]
Fisher, D.B.; Drory, N. Demographics of bulge types within 11 Mpc and implications for galaxy evolution. Astrophys. J. Lett.2011, 733, L47. [Google Scholar] [CrossRef]
Baugh, C.M. A primer on hierarchical galaxy formation: The semi-analytical approach. Rep. Prog. Phys.2006, 69, 3101. [Google Scholar] [CrossRef]
Javanmardi, B.; Kroupa, P. A correlation between the number of satellites and the bulge-to-total baryonic mass ratio extending beyond the Local Group. Mon. Not. R. Astron. Soc. Lett.2020, 493, L44–L48. [Google Scholar] [CrossRef]
Deur, A.; Sargent, C.; Terzić, B. Significance of Gravitational Nonlinearities on the Dynamics of Disk Galaxies. Astrophys. J.2020, 896, 94. [Google Scholar] [CrossRef]
Deur, A. Implications of Graviton-Graviton Interaction to Dark Matter. Phys. Lett. B2009, 676, 21–24. [Google Scholar] [CrossRef]
Deur, A. A relation between the dark mass of elliptical galaxies and their shape. Mon. Not. R. Astron. Soc.2014, 438, 1535–1551. [Google Scholar] [CrossRef]
Winters, D.; Deur, A.; Zheng, X. New Analysis of Dark Matter in Elliptical Galaxies. Mon. Not. R. Astron. Soc.2022, 518, 2845–2852. [Google Scholar] [CrossRef]
Seifert, A. The Importance of Being Symmetric: Flat Rotation Curves from Exact Axisymmetric Static Vacuum Spacetimes. arXiv2024, arXiv:2405.04933. [Google Scholar]
Deur, A. An explanation for dark matter and dark energy consistent with the Standard Model of particle physics and General Relativity. Eur. Phys. J. C2019, 79, 883. [Google Scholar] [CrossRef]
Deur, A. Effect of gravitational field self-interaction on large structure formation. Phys. Lett. B2021, 820, 136510. [Google Scholar] [CrossRef]
Lavaux, G.; Hudson, M.J. The 2M++ galaxy redshift catalogue. Mon. Not. R. Astron. Soc.2011, 416, 2840–2856. [Google Scholar] [CrossRef]
Klypin, A.A.; Kravtsov, A.V.; Valenzuela, O.; Prada, F. Where are the missing Galactic satellites? Astrophys. J.1999, 522, 82–92. [Google Scholar] [CrossRef]
Javanmardi, B.; Raouf, M.; Khosroshahi, H.; Tavasoli, S.; Müller, O.; Molaeinezhad, A. The number of dwarf satellites of disk galaxies versus their bulge mass in the standard model of cosmology. Astrophys. J.2019, 870, 50. [Google Scholar] [CrossRef]
Gross, F.; Klempt, E.; Brodsky, S.J.; Buras, A.J.; Burkert, V.D.; Heinrich, G.; Jakobs, K.; Meyer, C.A.; Orginos, K.; Strickland, M.; et al. 50 Years of Quantum Chromodynamics. Eur. Phys. J. C2023, 83, 1125. [Google Scholar] [CrossRef]
Sofue, Y. Rotation curve decomposition for size mass relations of bulge, disk, and dark halo components in spiral galaxies. Publ. Astron. Soc. Jpn.2015, 68, 2. [Google Scholar] [CrossRef]
Lelli, F.; McGaugh, S.S.; Schombert, J.M.; Desmond, H.; Katz, H. The baryonic Tully–Fisher relation for different velocity definitions and implications for galaxy angular momentum. Mon. Not. R. Astron. Soc.2019, 484, 3267–3278. [Google Scholar] [CrossRef]
Chae, K.H. Distinguishing Dark Matter, Modified Gravity, and Modified Inertia with the Inner and Outer Parts of Galactic Rotation Curves. Astrophys. J.2022, 941, 55. [Google Scholar] [CrossRef]
Lelli, F.; McGaugh, S.S.; Schombert, J.M. SPARC: Mas models for 175 disk galaxies with Spitzer photometry and accurate rotation curves. Astron. J.2016, 152, 157. [Google Scholar] [CrossRef]
Figure 1.
(Left): Radial acceleration relation for 40,000 simulated galaxies, color-coded for bulge-to-total mass ratios . Three different populations are shown, two of which are the edge cases of bulge-dominated (red line) and disk-dominated (blue line) galaxies (both subsamples contain 2% of the total population), while the green line shows the remaining average population. (Right): Distribution of bulge-to-total mass ratio, , for the same galaxies, also color-coded. The shape of the distribution comes from our enforcement of realistic combinations of galaxy parameters. Vertical dashed lines delineate the three populations. We use the 2D gravity effective coupling value .
Figure 2.
Total acceleration versus that expected from the baryonic matter and Newtonian gravity, . The colors correspond to the average number of satellite galaxies per bin within 200 kpc. The number of satellite galaxies was calculated by applying Equation (3) to the bulge-to-total ratios of modeled galaxies. The similarity between Figure 2 and Figure 1 arises from both figures using the same 40,000 simulated galaxies and the strong relationship between the bulge-to-total mass ratio and the satellite galaxy population, as given by Equation (3).
Disclaimer/Publisher’s Note: The statements, opinions and data contained in all publications are solely those of the individual author(s) and contributor(s) and not of MDPI and/or the editor(s). MDPI and/or the editor(s) disclaim responsibility for any injury to people or property resulting from any ideas, methods, instructions or products referred to in the content.
Sargent, C.; Clark, W.; Seifert, A.; Mand, A.; Rogers, E.; Lane, A.; Deur, A.; Terzić, B.
On the Evidence for the Violation of the Equivalence Principle in Disk Galaxies. Particles2025, 8, 65.
https://doi.org/10.3390/particles8030065
AMA Style
Sargent C, Clark W, Seifert A, Mand A, Rogers E, Lane A, Deur A, Terzić B.
On the Evidence for the Violation of the Equivalence Principle in Disk Galaxies. Particles. 2025; 8(3):65.
https://doi.org/10.3390/particles8030065
Chicago/Turabian Style
Sargent, Corey, William Clark, Antonia Seifert, Alicia Mand, Emerson Rogers, Adam Lane, Alexandre Deur, and Balša Terzić.
2025. "On the Evidence for the Violation of the Equivalence Principle in Disk Galaxies" Particles 8, no. 3: 65.
https://doi.org/10.3390/particles8030065
APA Style
Sargent, C., Clark, W., Seifert, A., Mand, A., Rogers, E., Lane, A., Deur, A., & Terzić, B.
(2025). On the Evidence for the Violation of the Equivalence Principle in Disk Galaxies. Particles, 8(3), 65.
https://doi.org/10.3390/particles8030065
Article Metrics
No
No
Article Access Statistics
For more information on the journal statistics, click here.
Multiple requests from the same IP address are counted as one view.
Sargent, C.; Clark, W.; Seifert, A.; Mand, A.; Rogers, E.; Lane, A.; Deur, A.; Terzić, B.
On the Evidence for the Violation of the Equivalence Principle in Disk Galaxies. Particles2025, 8, 65.
https://doi.org/10.3390/particles8030065
AMA Style
Sargent C, Clark W, Seifert A, Mand A, Rogers E, Lane A, Deur A, Terzić B.
On the Evidence for the Violation of the Equivalence Principle in Disk Galaxies. Particles. 2025; 8(3):65.
https://doi.org/10.3390/particles8030065
Chicago/Turabian Style
Sargent, Corey, William Clark, Antonia Seifert, Alicia Mand, Emerson Rogers, Adam Lane, Alexandre Deur, and Balša Terzić.
2025. "On the Evidence for the Violation of the Equivalence Principle in Disk Galaxies" Particles 8, no. 3: 65.
https://doi.org/10.3390/particles8030065
APA Style
Sargent, C., Clark, W., Seifert, A., Mand, A., Rogers, E., Lane, A., Deur, A., & Terzić, B.
(2025). On the Evidence for the Violation of the Equivalence Principle in Disk Galaxies. Particles, 8(3), 65.
https://doi.org/10.3390/particles8030065


 ,
, 
