Hadron Identification Prospects with Granular Calorimeters
Abstract
1. Introduction
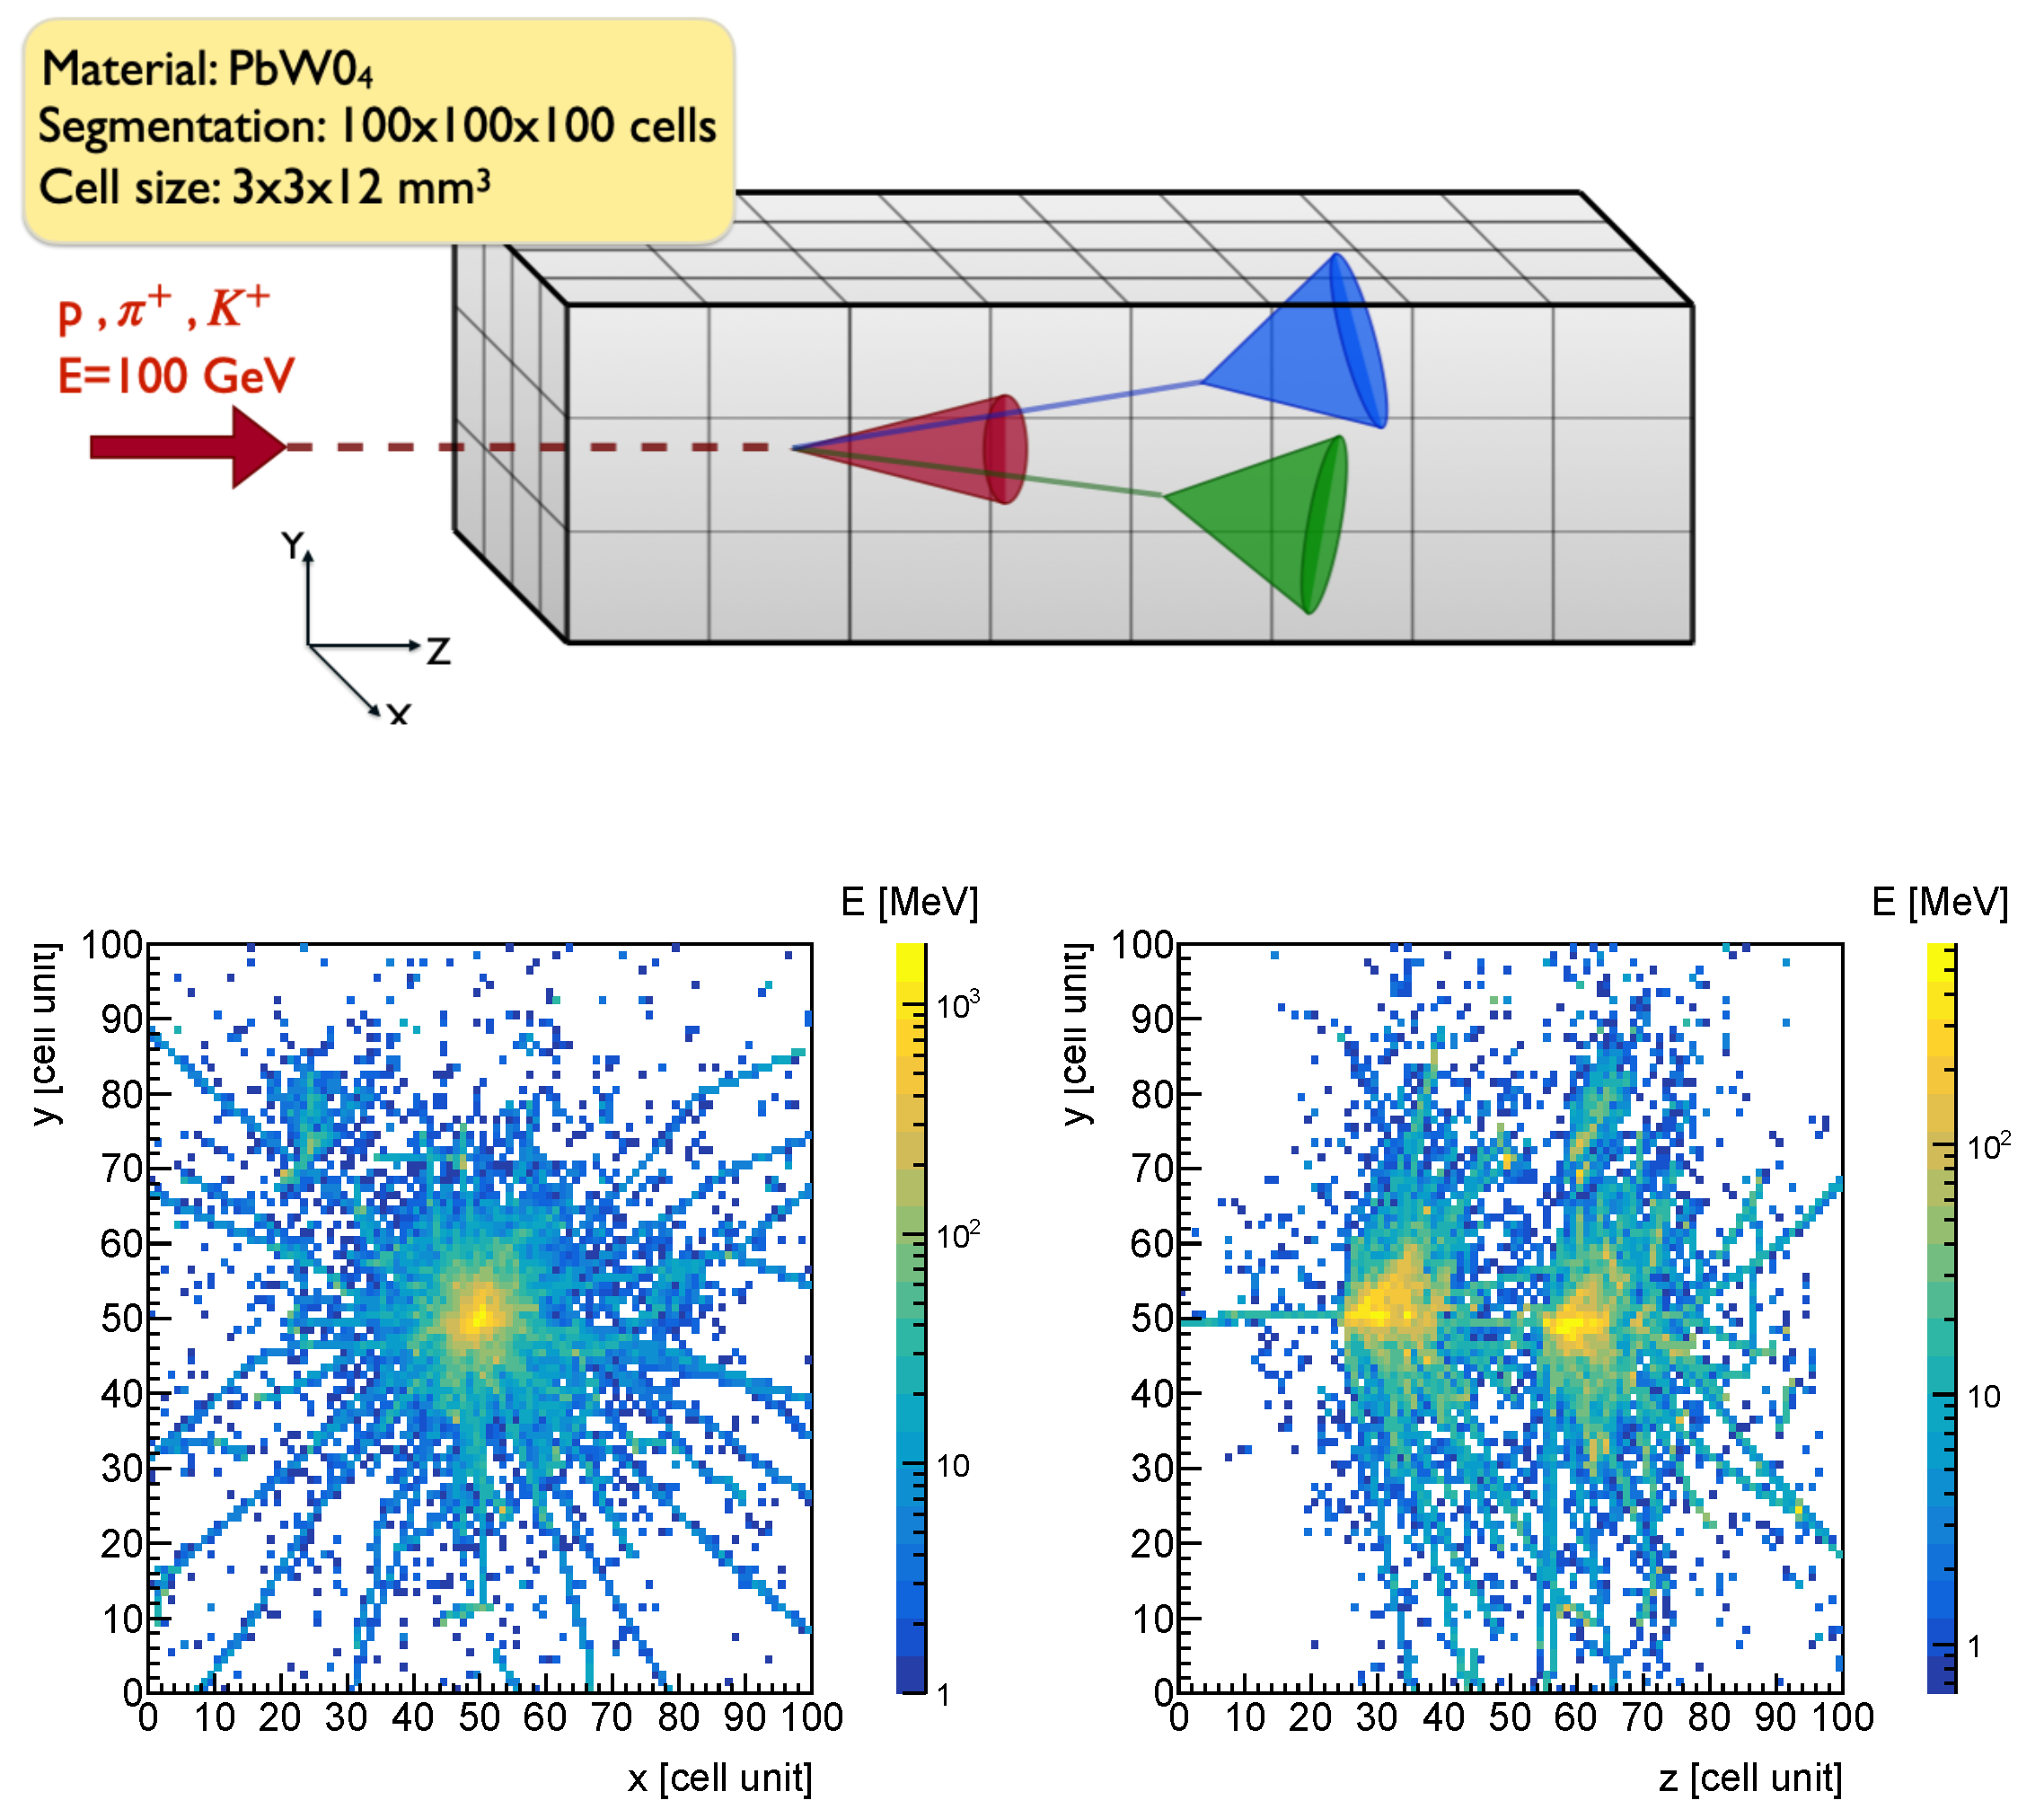
2. Simulation and Data Generation
- PDG index: This refers to the identity of the particle that released the energy, and its value is encoded according to the Particle Data Group’s encoding;
- PostStep TotalMomentum: This variable retrieves the total momentum of the particle after it has completed the current step in the simulation;
- Delta Kinetic Energy: This variable is computed as the difference between the kinetic energy after and before the GEANT4 simulation step;
- TotalEnergyDeposit: This variable retrieves the total energy deposited during the simulation step;
- PostStep GlobalTime: This variable measures the GlobalTime (time since the beginning of the event) after the GEANT4 step.
- Spatial coordinates of the cell that recorded the step: Each step is recorded by a cell, identified by a pair of indices: the cubelet index (representing a region in the calorimeter) and the cell index (representing the cell within the cubelet). Both indices range from 0 to 99.
2.1. Time Smearing
3. Definition of Sensitive Variables
3.1. Properties of Calorimeter Cells
- Position: The spatial coordinates of the cell within the calorimeter, which determine its location in the detector geometry.
- Total absorbed energy: The total energy deposited in the cell during the event.
- Cell Characteristic time: The timing information associated with a cell, defined as the weighted average of the times of all energy depositions within the cell, where the deposited energy serves as the weight:Here, represents the i-th energy deposition within the cell, and is the corresponding time. The sum is taken over all the energy depositions within the cell.
3.2. Global Variables
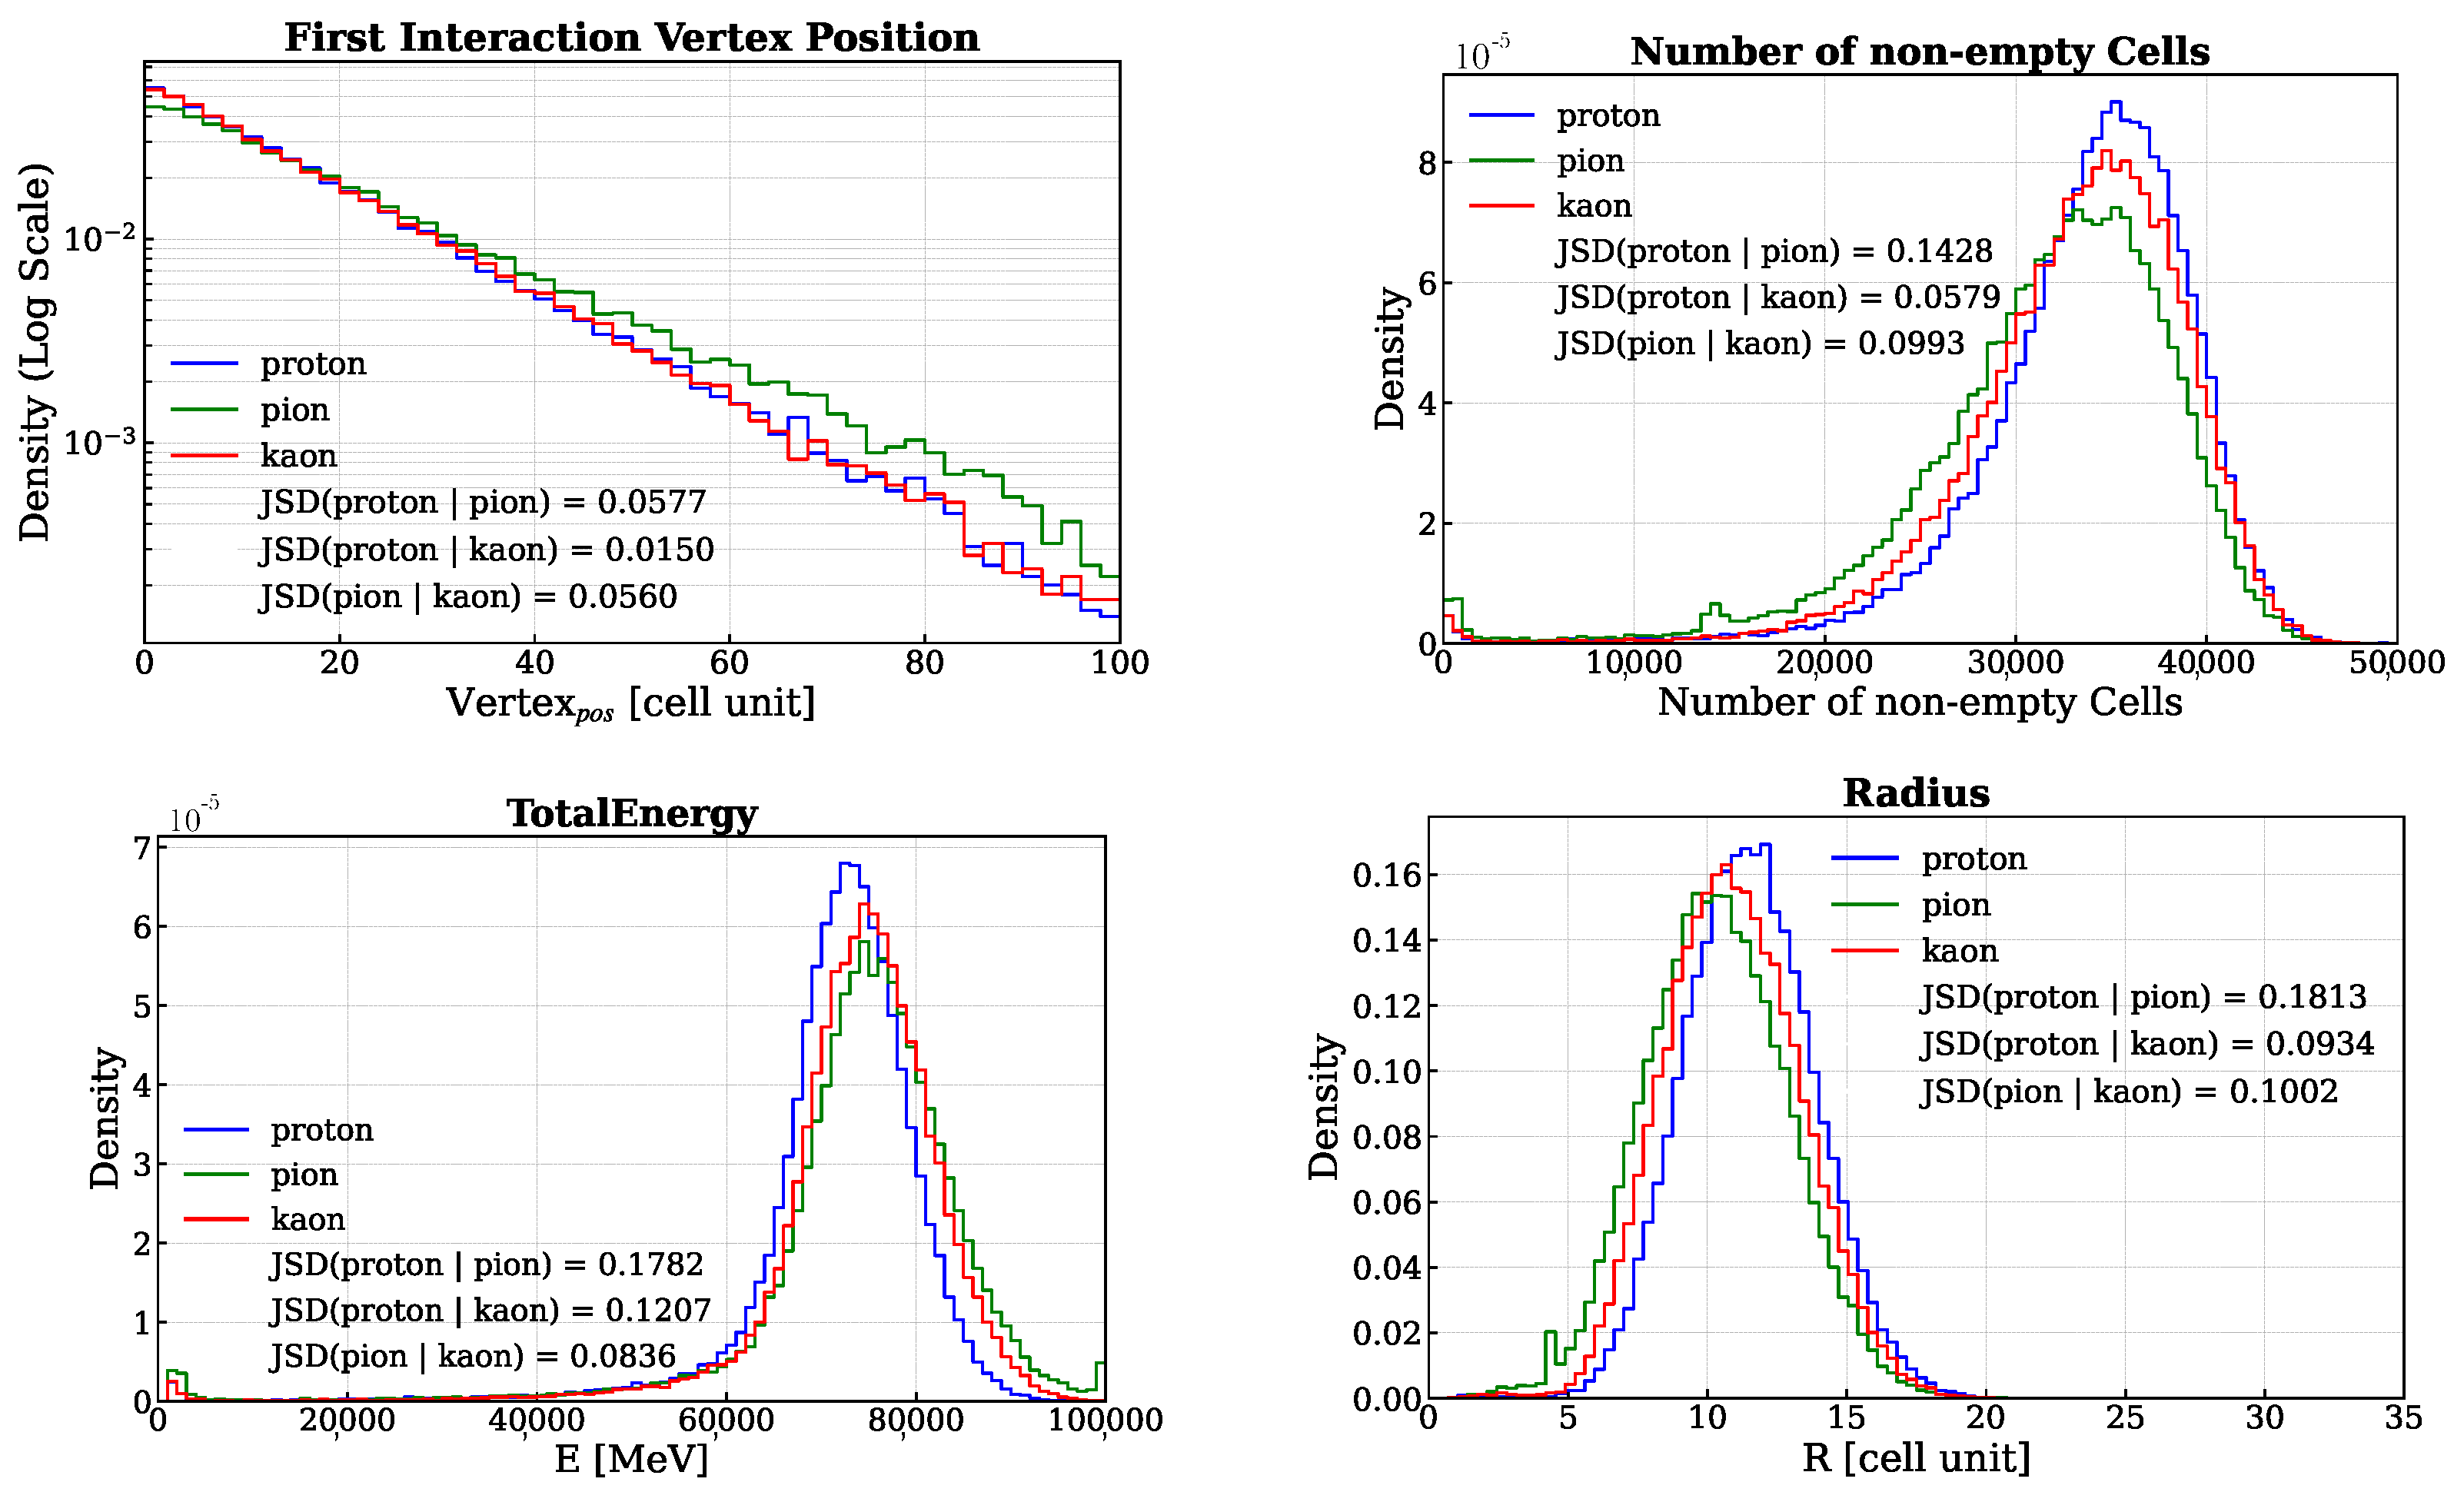
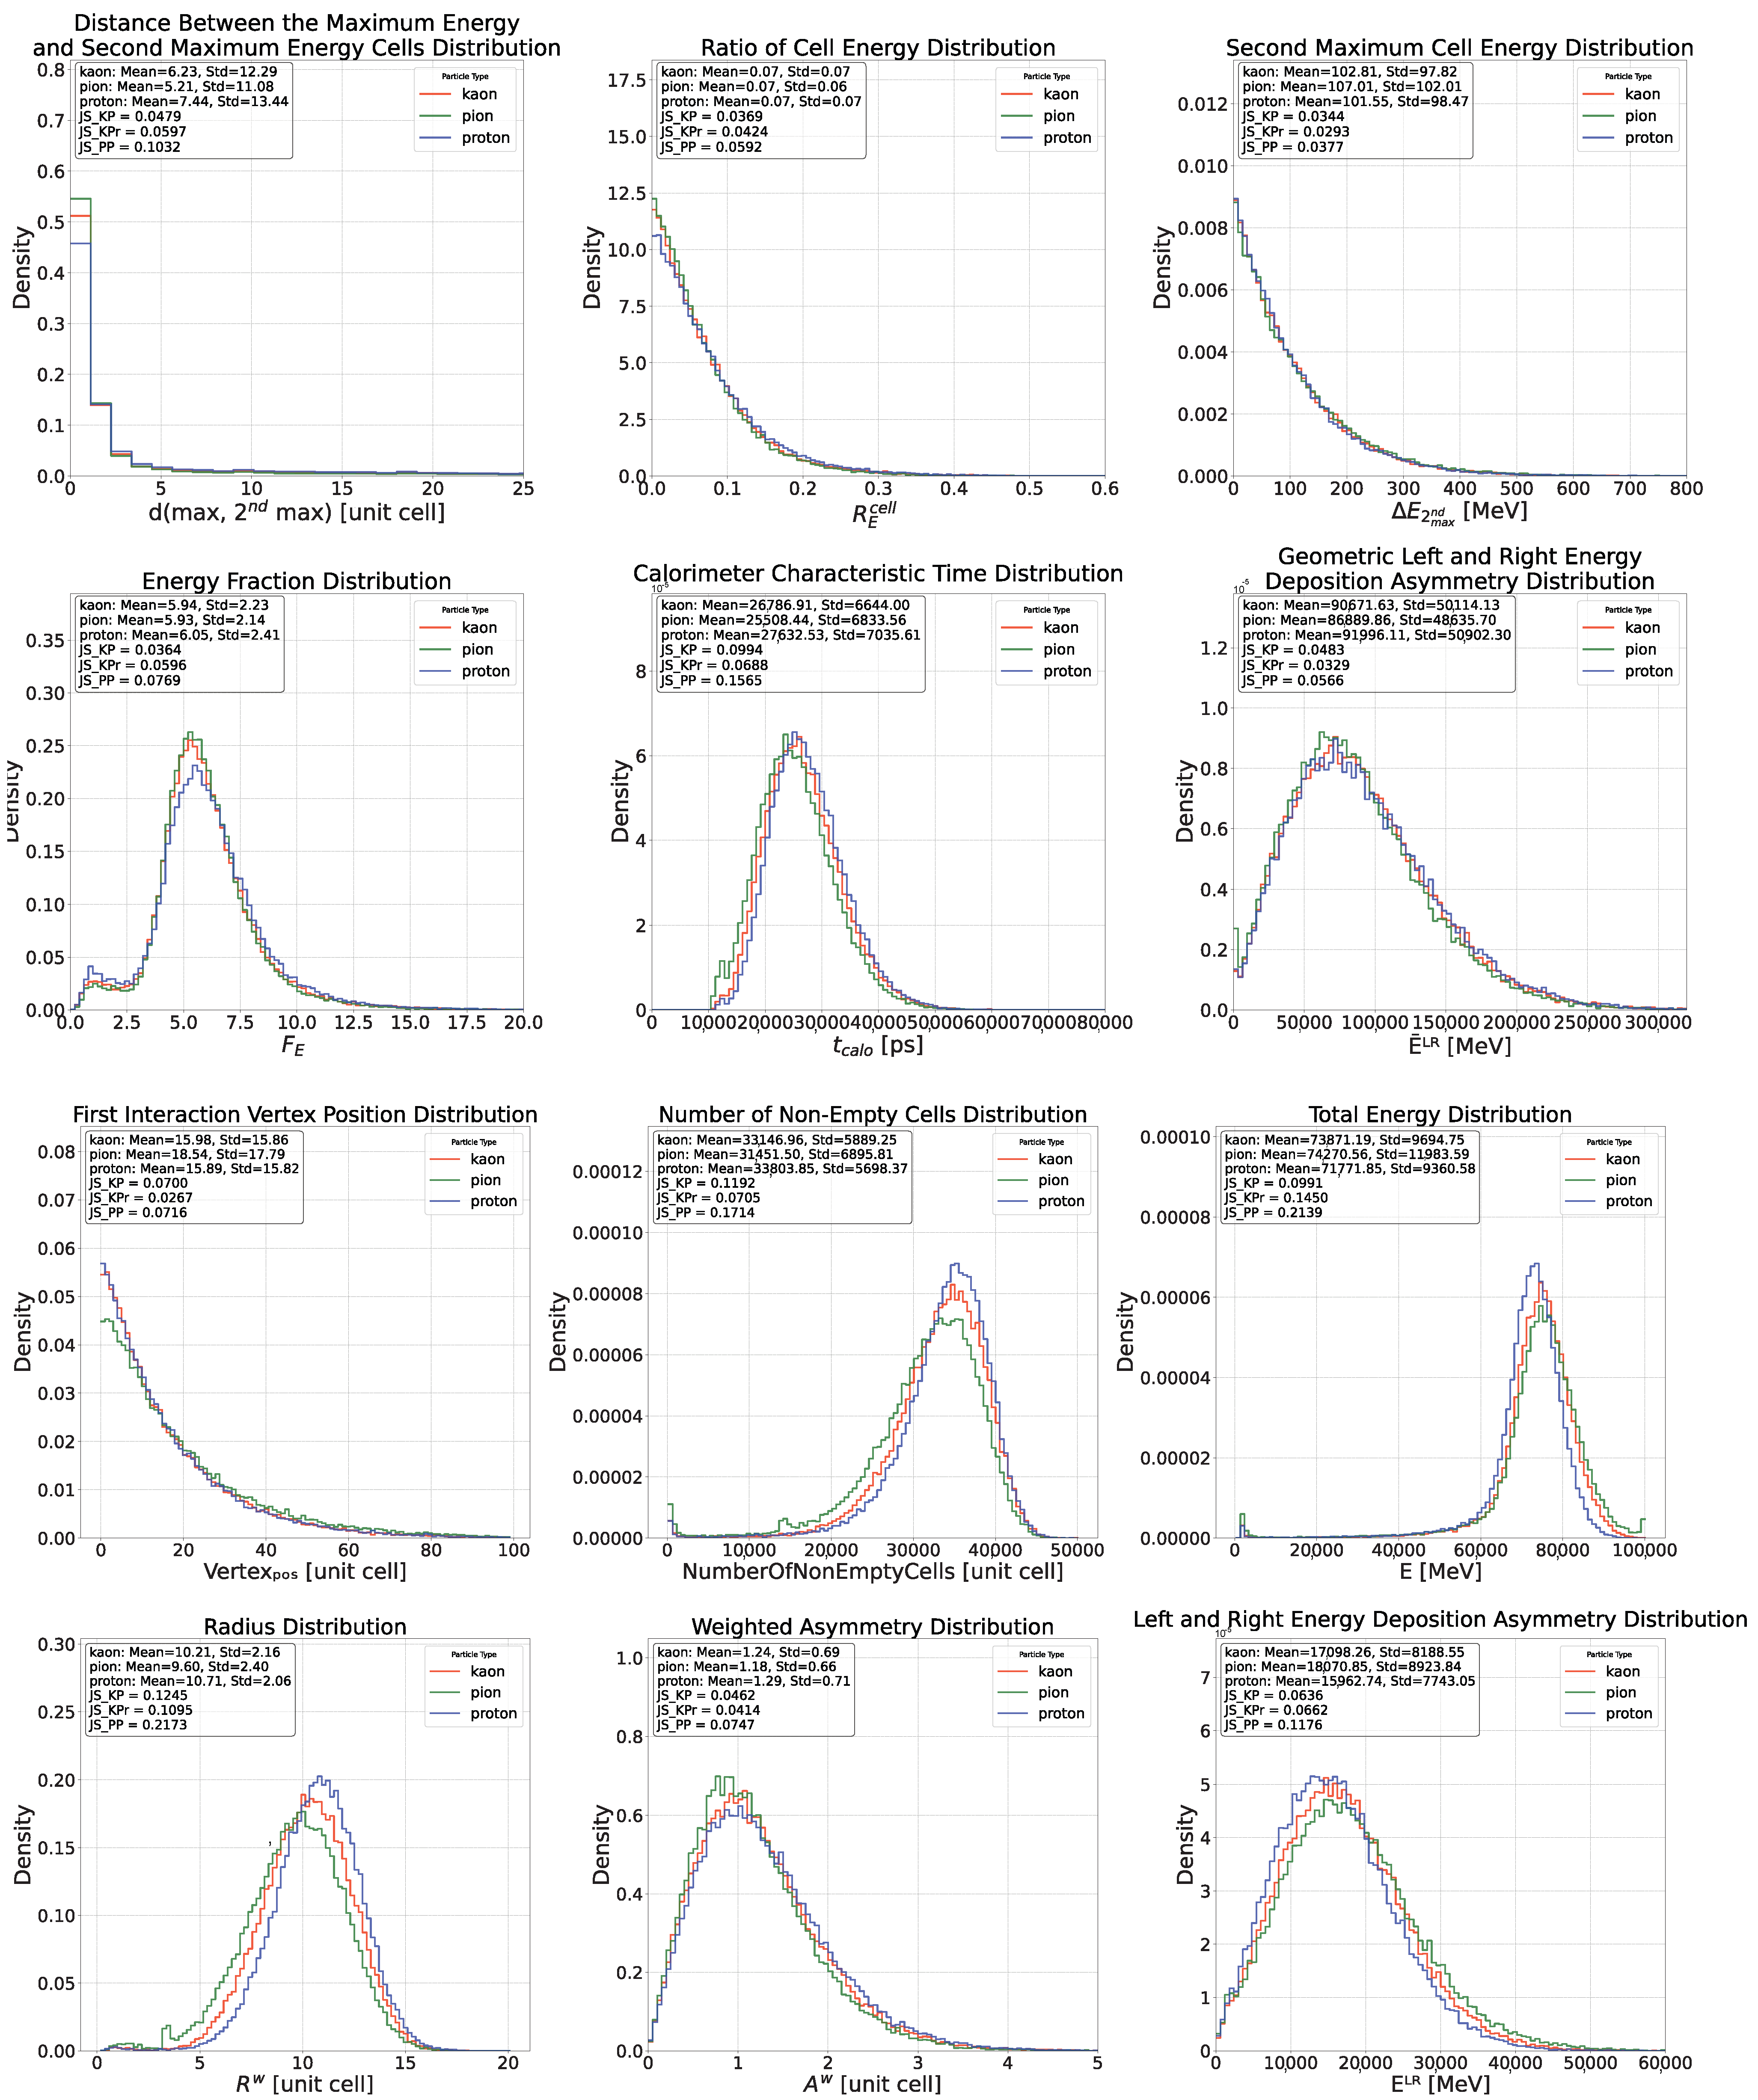
- Total energy deposited in the calorimeter: In Figure 2, the corresponding distribution is displayed in the bottom-left corner.
- Calorimeter characteristic time: The timing information associated with the calorimeter, defined as the weighted average of the characteristic times of all cells, where the energy deposited in each cell serves as the weight:This property is computed using the cell properties, and for that reason, it could be considered a local variable. However, its meaning is global, as it corresponds to the mean signal time extracted from a homogeneous calorimeter.
- Time of flight of the particle: The time of flight (ToF) of the primary particle, hypothetically extracted from a tracker-like detector that is 3 m long and placed before the calorimeter. Assuming that it is possible to measure the creation time and the arrival time of the particle at the calorimeter interface with perfect resolution, this feature is extracted as follows:where E and m are the total energy of the particle and its rest mass, respectively. Here d is the distance traveled by the particle and it is equal to 3 m; a 30 ps smearing is however added to time measurements later, see infra, Section 2.1.
3.3. Local Variables
- First nuclear interaction vertex position: The position of the first nuclear interaction vertex provides an indirect measure of the probability that a particle will interact with the medium through which it is passing. This probability, represented by the particle’s nuclear cross section, depends on the properties of the medium, the energy of the particle, and the particle’s identity. Therefore, when the first two factors are held constant, the position of the first interaction vertex becomes a variable sensitive to the particle’s identity. To determine this position, the First Nuclear Interaction Vertex Finder is used (see Appendix A). In Figure 2, the corresponding distribution is displayed in the top-left corner.
- First interaction vertex time: The instant at which the first nuclear interaction vertex takes place can be defined as the characteristic time of the cell identified as containing that vertex.
- Speed: Given the First Nuclear Interaction Vertex Position and the First Interaction Vertex Time, the particle speed is defined as the ratio between these two quantities.
- : Given the First Interaction Vertex Time and the time when 50% of the total deposited energy is exceeded (), it is possible to define .
- Fraction of energy deposited after the first vertex: Referring only to longitudinal segmentation, the calorimeter can be described as a set of layers perpendicular to the direction of the primary particle. Based on this premise, the fraction of energy released after the primary interaction vertex is defined as the energy deposited in the cells located in the layers of the calorimeter that follow the layer containing the vertex.
- Number of non-empty cells before the first vertex layer: Using the same logic applied to compute the Fraction of Energy Deposited after the First Vertex, it is also possible to count the number of non-empty cells in the layers preceding the one containing the vertex.
- Number of non-empty cells: The total number of cells for which the deposited energy is greater than 0.1 MeV. In Figure 2, the corresponding distribution is displayed in the top-right corner.
- Maximum cell energy: Maximum Cell Energy refers to the highest total energy deposited in the cells of the calorimeter.
- Second maximum cell energy: This variable measures the total energy deposited in the calorimeter cells, representing the second highest value.
- Total energy close to the first vertex and fraction of energy close to the first vertex: Once the cell of the primary vertex has been identified, it is possible to define a sphere with radius d, centered on the selected cell; for different studied segmentations d varies between 2 and 5 cell units. The total energy deposited in the cells within this sphere represents the Total Energy Close to the First Vertex. Thus it also represents a fraction of the total energy deposited in the calorimeter.
- Maximum energy deposited close to the first vertex: Once the cell of the primary vertex has been identified, it is possible to define a sphere with radius d, centered on the selected cell; for different studied segmentations d varies between 2 and 5 cell units. The maximum energy near the primary vertex corresponds to the highest total energy deposited in one of the cells of the sphere.
- Energy variance close to the first vertex: Once the cell containing the primary vertex has been identified, a transverse section cross-section of the calorimeter can be examined, encompassing all the cells within it. The individual energy values of these cells can then be used to calculate the variance of the energy deposited within the calorimeter slice centered on the cell containing the primary vertex.
- Distance between the cell with maximum energy and the first vertex cell: By considering all the cells of the calorimeter, it is possible to define the distance between the cell containing the primary interaction vertex and the cell with the maximum energy deposition.
- Distance between the maximum energy and second maximum energy cells: By considering all the cells of the calorimeter, it is possible to define the distance between the cells with the first and second maximum energy depositions.
- Energy close to energy peak and fraction of energy close to energy peak: After the primary vertex, a peak of deposited energy is generated. The position of this peak can be determined using the energy peak finder (see Appendix B). Similar to the cell containing the primary vertex, a sphere with radius d (cell unit), centered on the cell containing the energy peak, can be defined. This sphere allows for the assessment of the total energy deposited around the peak, as well as the fraction of the total energy deposited within it.
- Left and right energy deposition asymmetry: The impinging position of the primary particle can be considered the center of the reference system, so it is necessary to change the reference system from that of the simulation to the one just described.Once the new reference system has been adopted, it is possible to compare the left and right energy deposition. There are two methods: the standard definition () and the geometrical definition (). The former is defined as followsThe geometrical definition, on the other hand, is defined as the following:This definition involves the product of the position of the energy depositions and the energy deposits. The former is expressed in cell units, making it dimensionless. Consequently, the geometric definition yields pure energy values, expressed in MeV.
- : The energy ratio is defined as the followingHere, represents the maximum total energy deposited in one cell and is the second maximum total energy.
- : The energy Delta is the numerator of .
- : The energy fraction is defined as the followingHere, N can be tuned and it defines a cube around the cell with the maximum total energy.
3.3.1. Physics-Based Observables
- Fraction of energy deposited close to the beam axis: The differences in the fraction of calorimetric signal in the central tower can also be explained by this leading particle effect [14]. The leading particle carries a large fraction of the momentum of the incident particle. Therefore, it may be expected to travel almost in the same direction as the incident particle [14]. If this particle is a , it will thus generate a large signal in the central calorimeter tower. The soft ’s that constitute the signal from proton-induced showers are produced, on average, at larger angles than the leading particles [14]. As a result, the lateral profile of the energy deposition by the is wider for proton-induced showers than for pion-induced ones. Thus, the fraction of the total signal recorded in the central tower is, on average, smaller for protons and kaons than for pions [14].
- Standard spatial observables: Each energy deposit position can be described by the position of the cell in which it occurred. Thus, it is possible to define the average position along the x, y and z axes of the laboratory reference system (). With these quantities, the average radius of the energy shower (R) and the are the followingIn Figure 2, the R distribution is displayed in the bottom-right corner.Similarly, the average length of the energy shower (L) and its standard deviation are following
- Weighted spatial observables: Alternatively, the spatial observables can be calculated using the deposited energy as weight. This is how the standard spatial observables are modified once the deposited energy is also taken into account:
- and : The presence of asymmetries in the transverse profile of the shower can be estimated with the parameters A and . Similarly to the left-right energy asymmetry, the impinging position of the primary particle can be considered the center of the reference system. Once the new reference system has been adopted, the parameters A and can be calculated as follows:
4. Study Setup and Methodology
4.1. Metrics
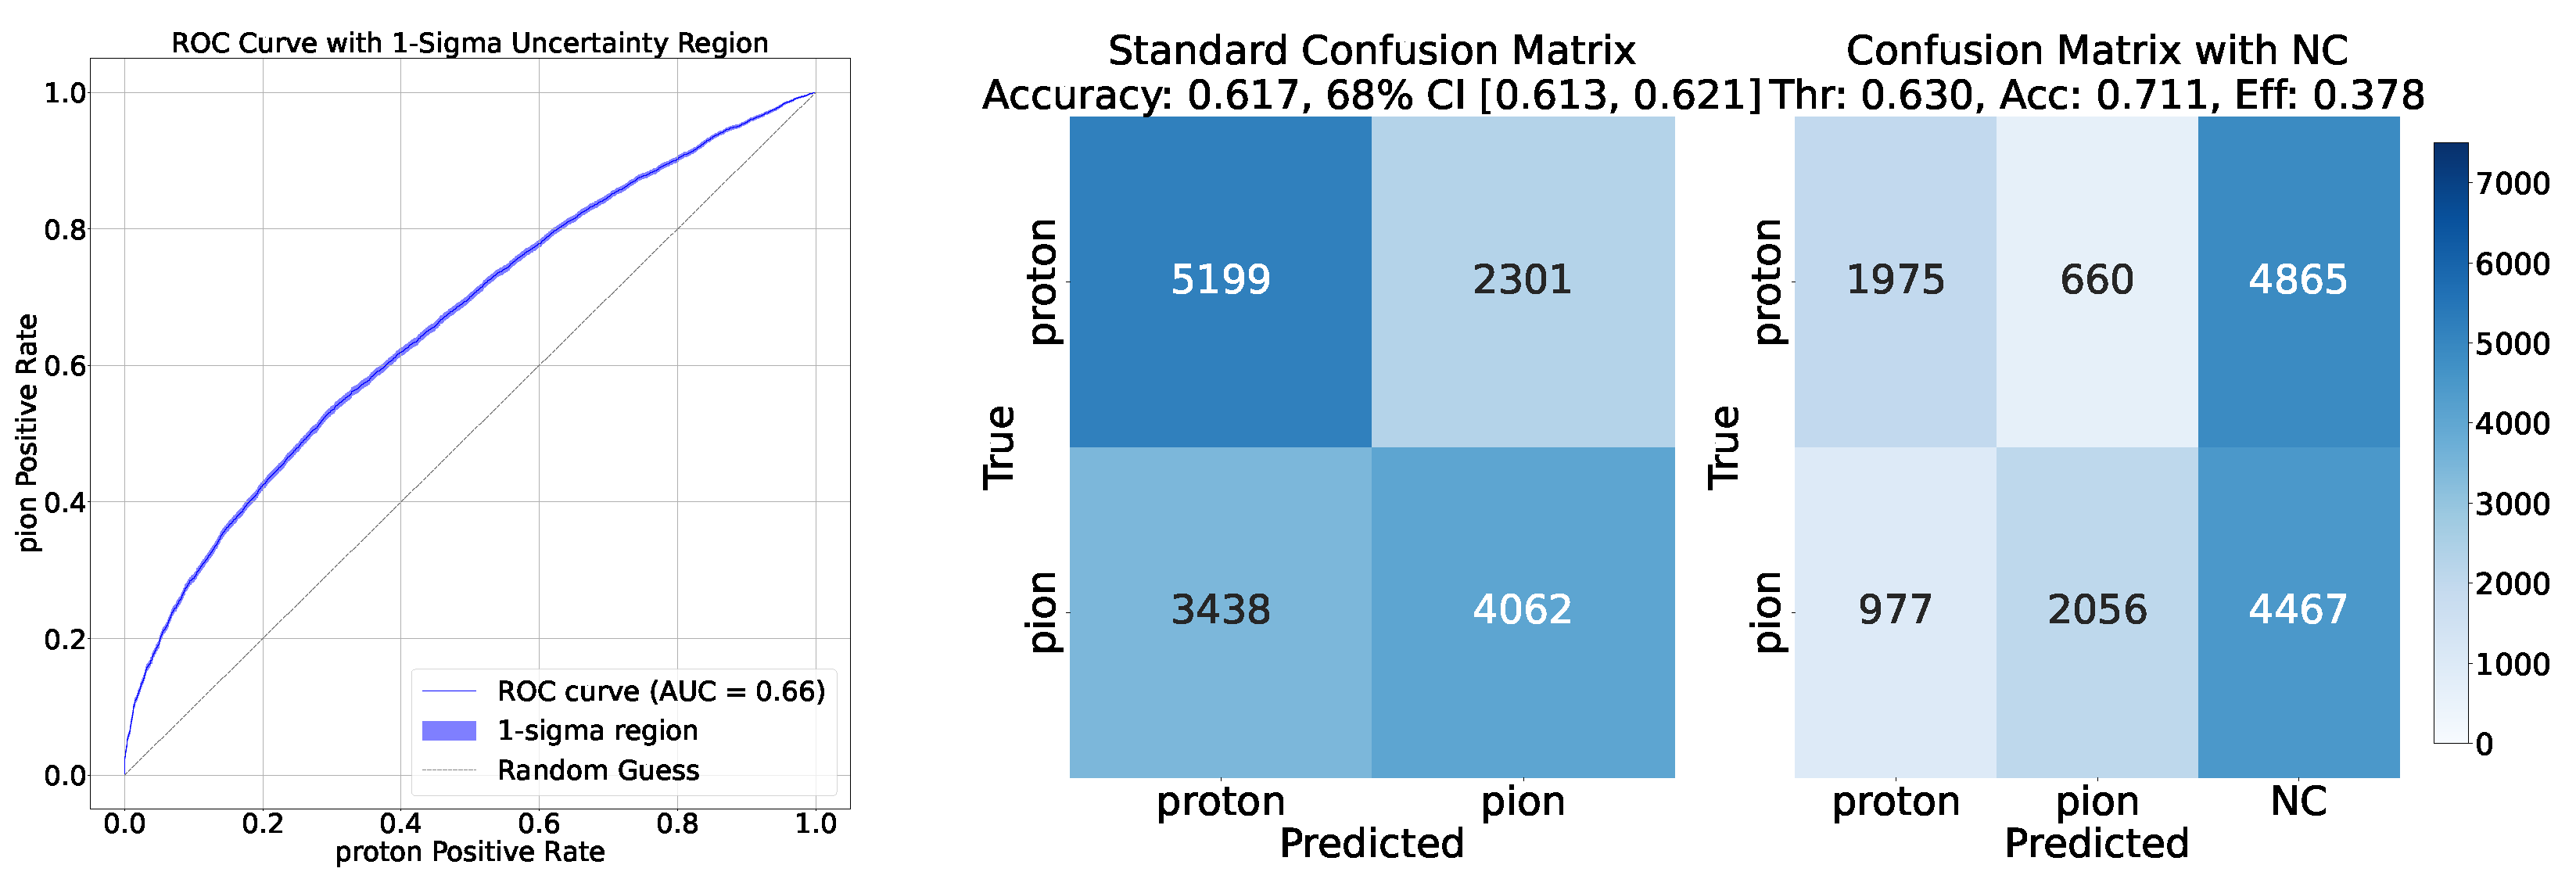
- Confusion Matrix: The confusion matrix is a fundamental tool for evaluating classification models. The confusion matrix provides a foundation for deriving other metrics such as accuracy, precision, recall, and F1-score.
- ROC Curve: The Receiver Operating Characteristic (ROC) curve is a graphical representation of a classification model’s performance across different threshold values. For example, when considering the classification, it plots the Proton Positive Rate () against the Pion Positive Rate (), defined as:The uncertainty associated with the ROC curve is calculated with Wald intervals for the binomial ratio, which is sufficient as the numbers at numerator and denominator are large and the ratio is not close to 0 or 1.
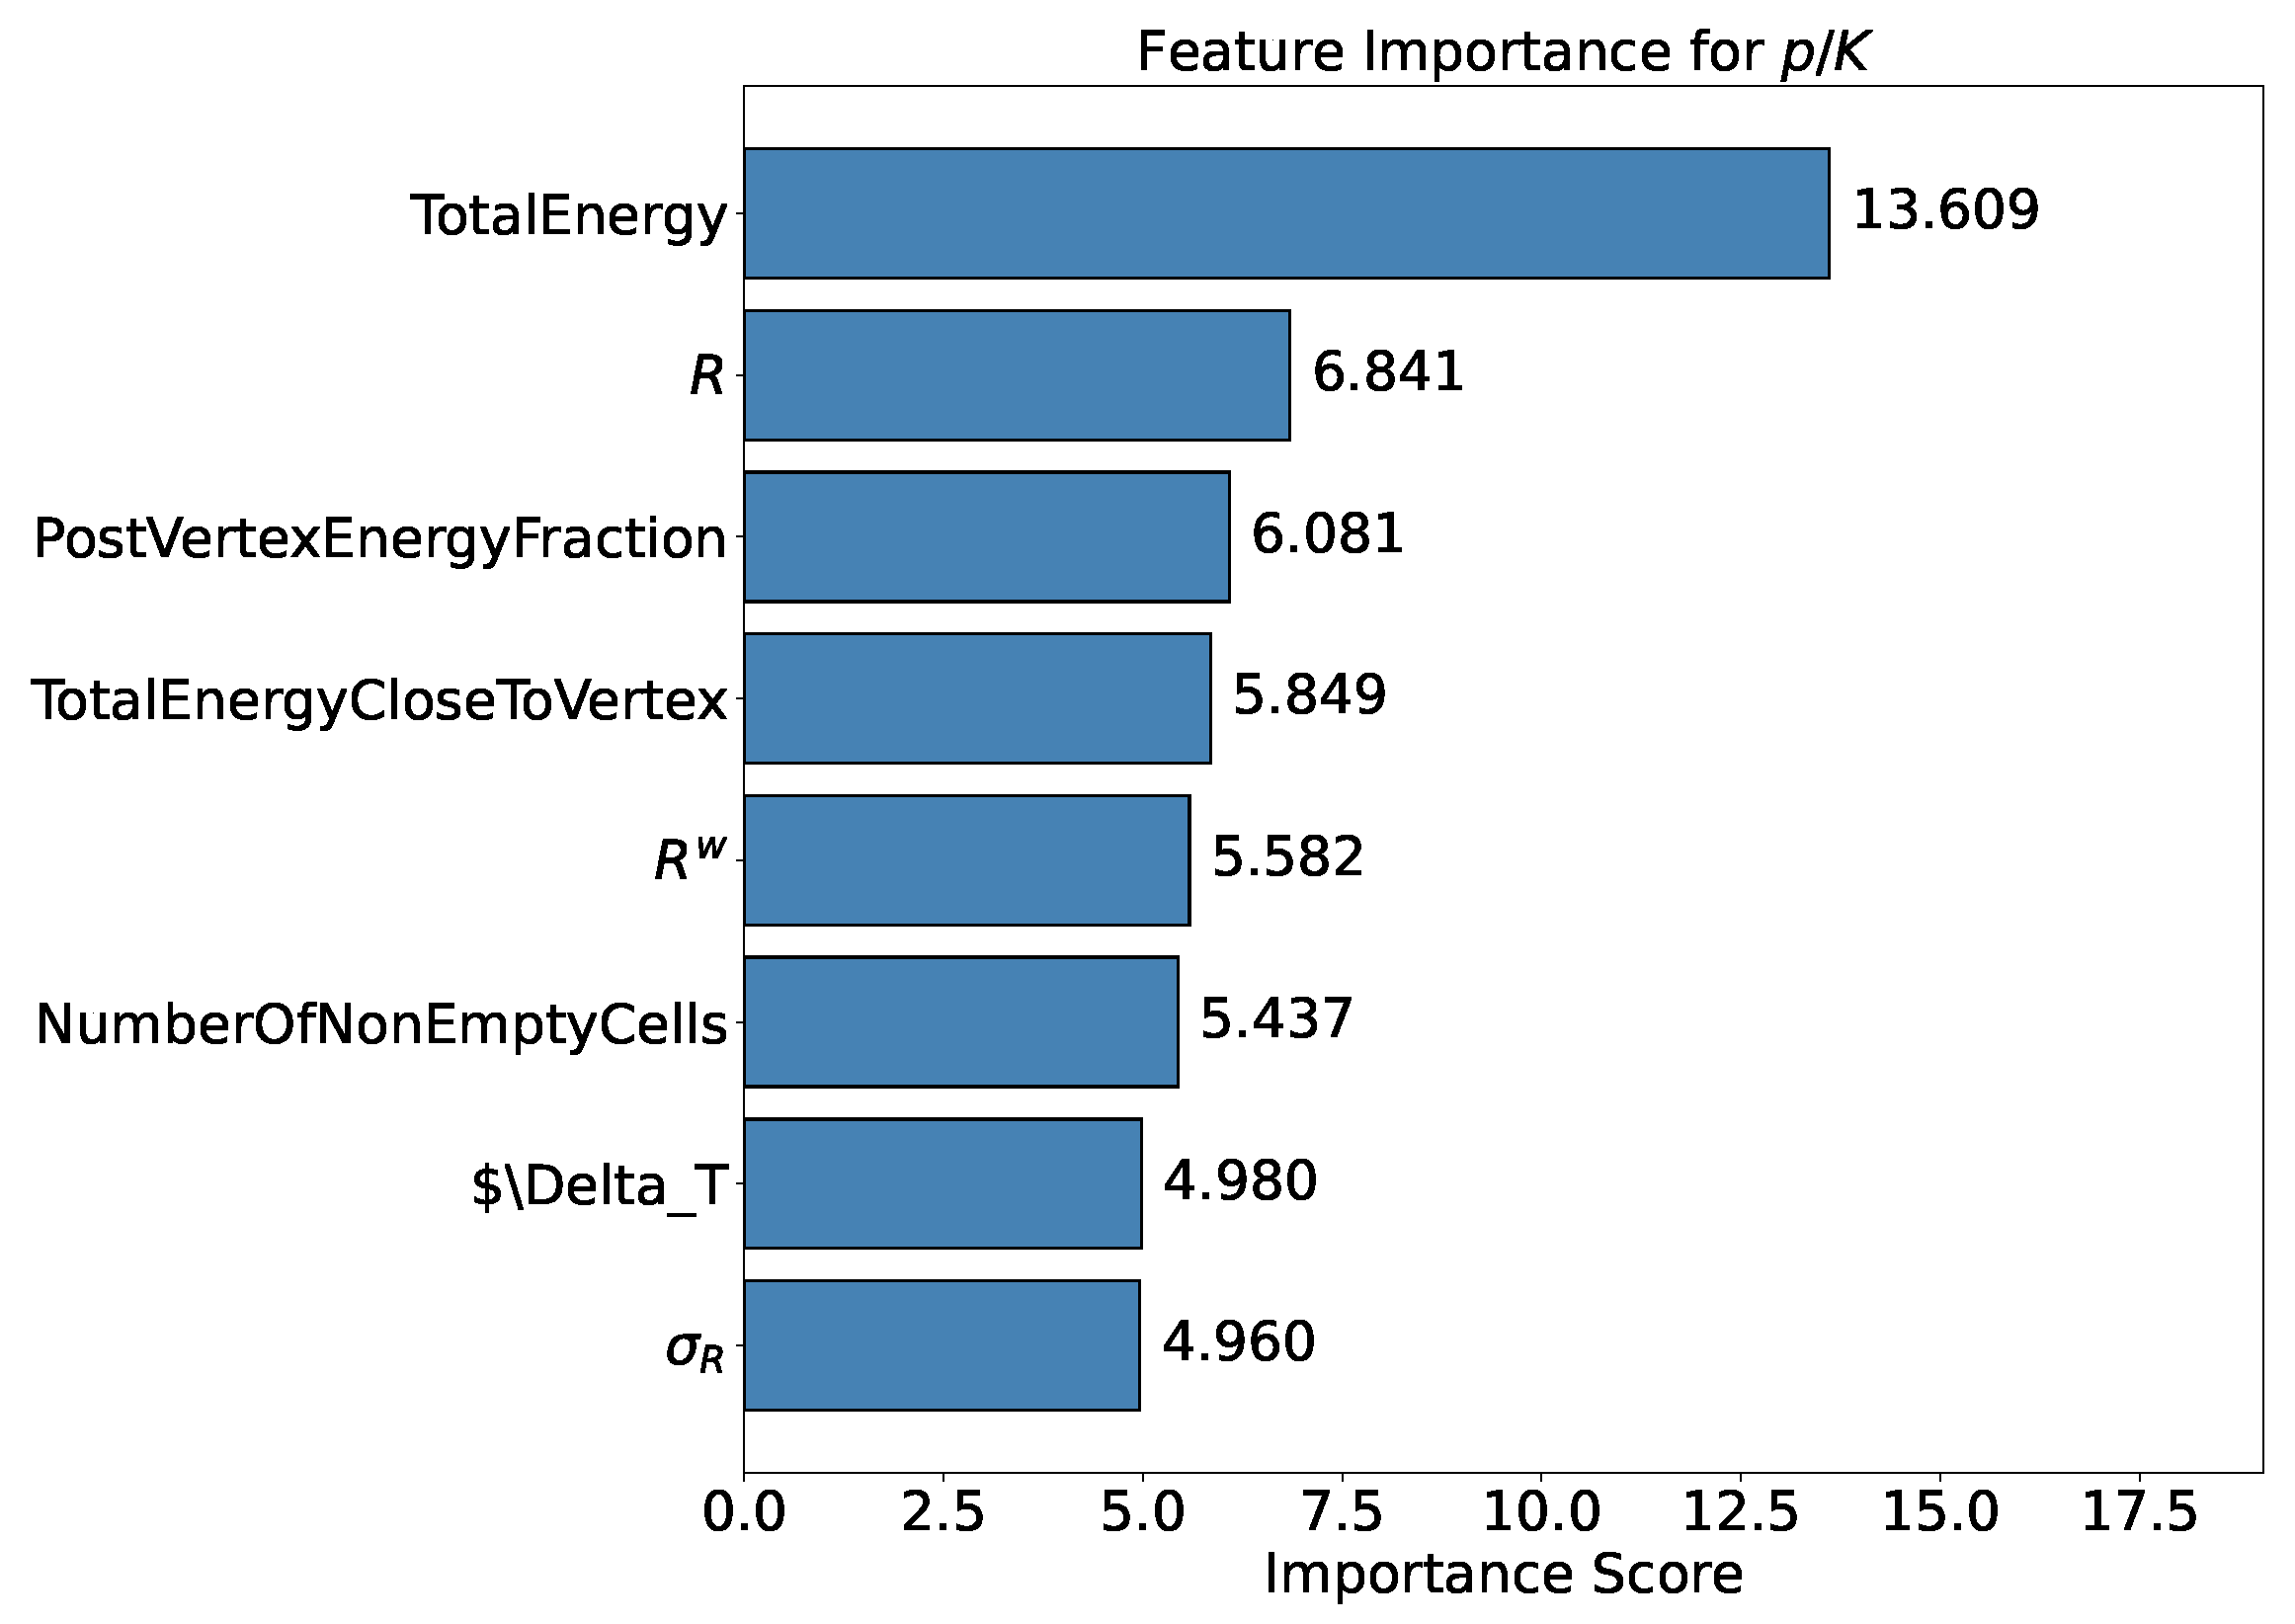
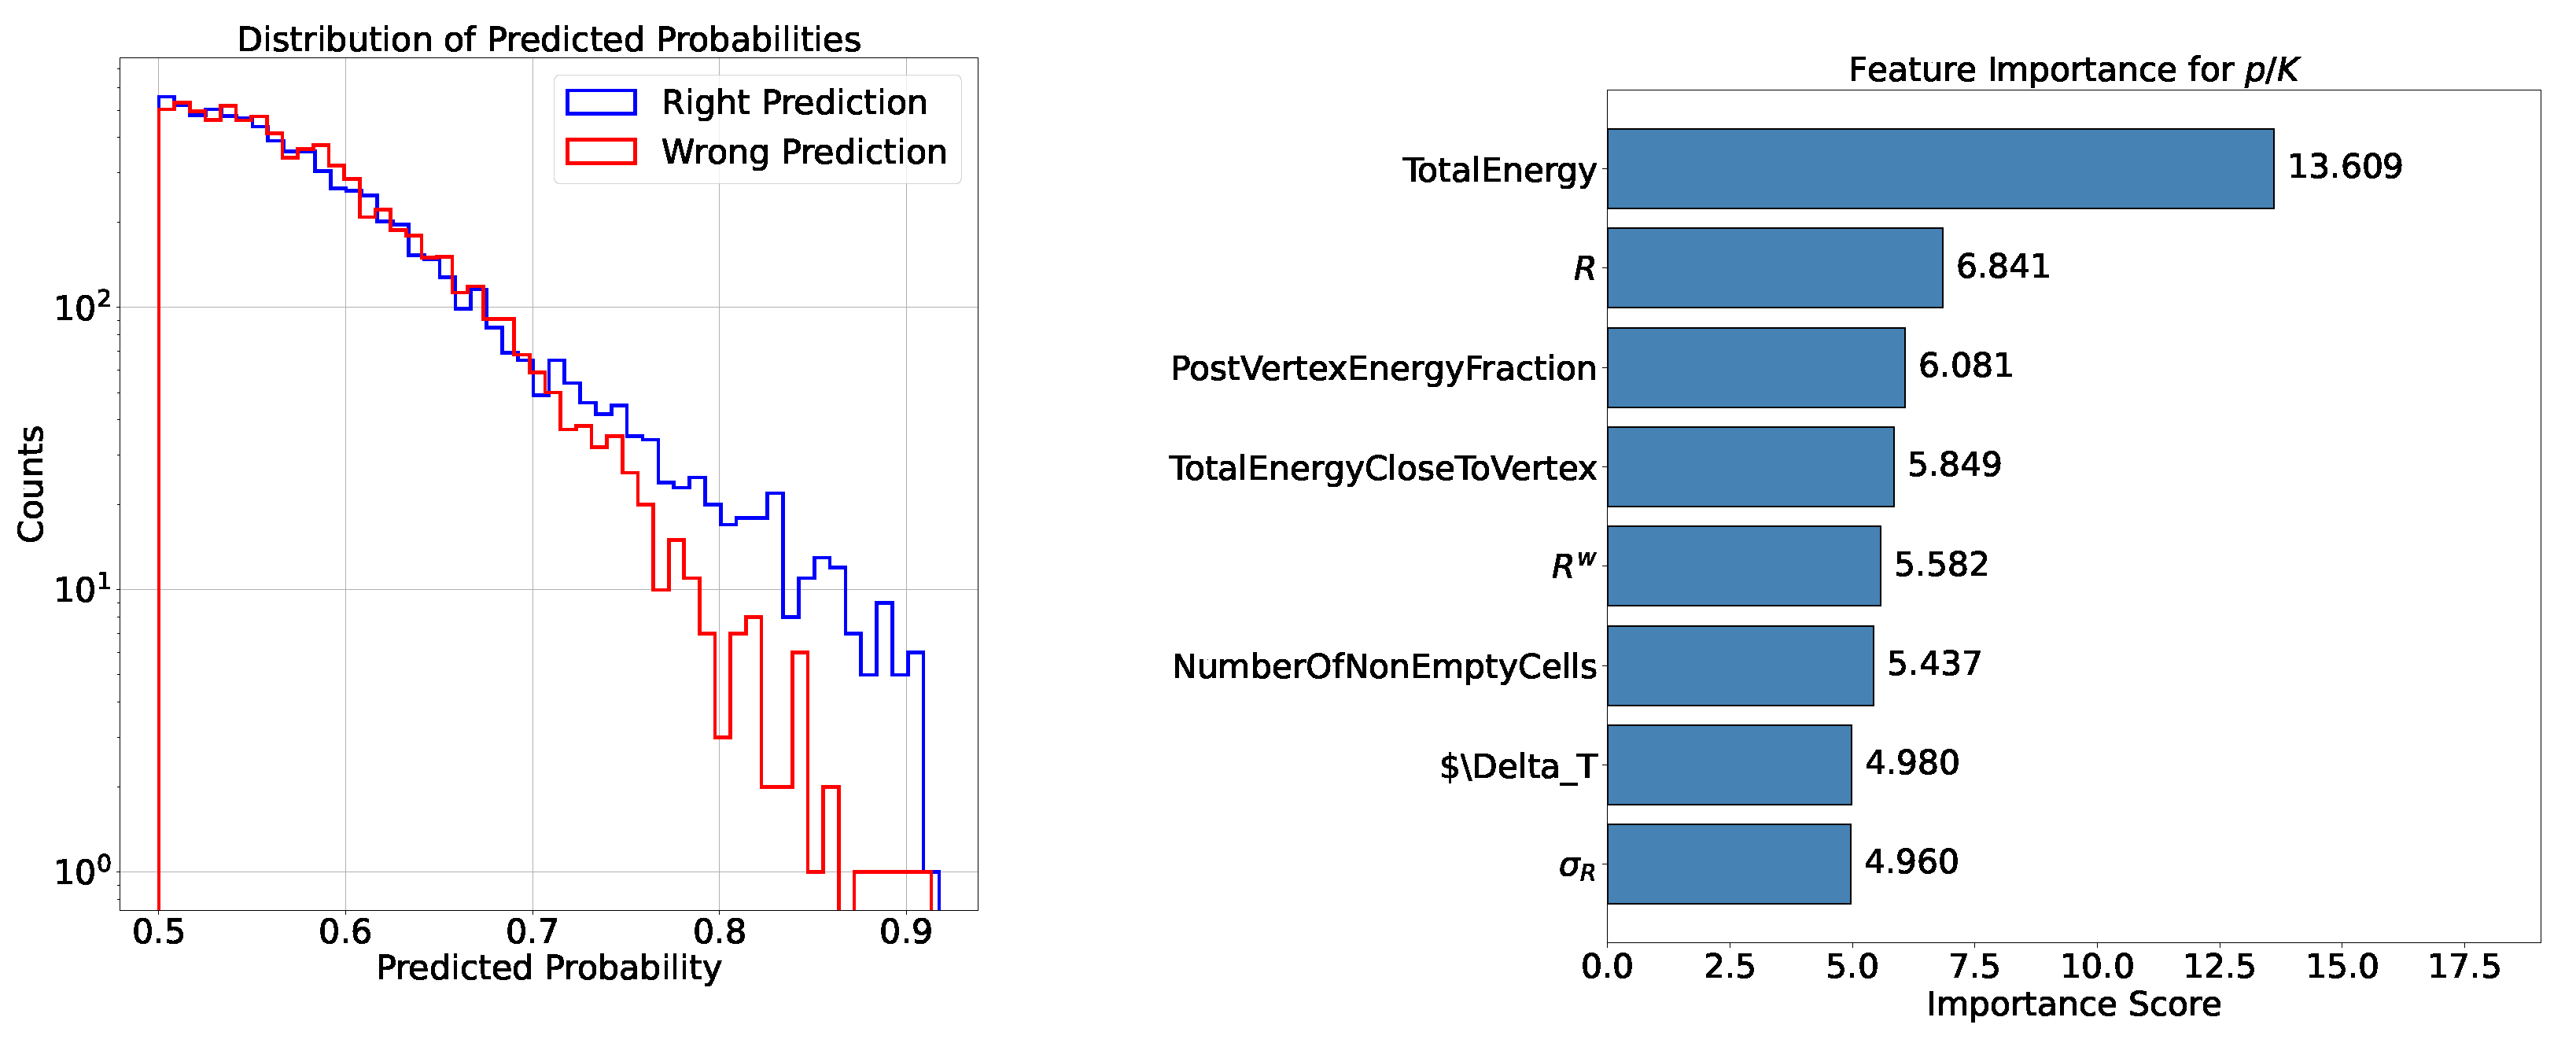
- Feature Importance: Feature importance quantifies the contribution of each input variable to the model’s predictions. It helps identify the most relevant features for the task and provides insights into the underlying data. In the following analysis this metric is available when testing the XGBoost model. The chosen importance metric is “gain”, which represents the relative contribution of a feature to the model, calculated based on its impact across each tree. A higher gain compared to another feature signifies greater importance in the prediction. It measures the improvement in accuracy brought by a feature to the branches it influences: by adding a split on feature X, two new branches are created, each exhibiting higher accuracy than before, thereby reducing misclassifications.
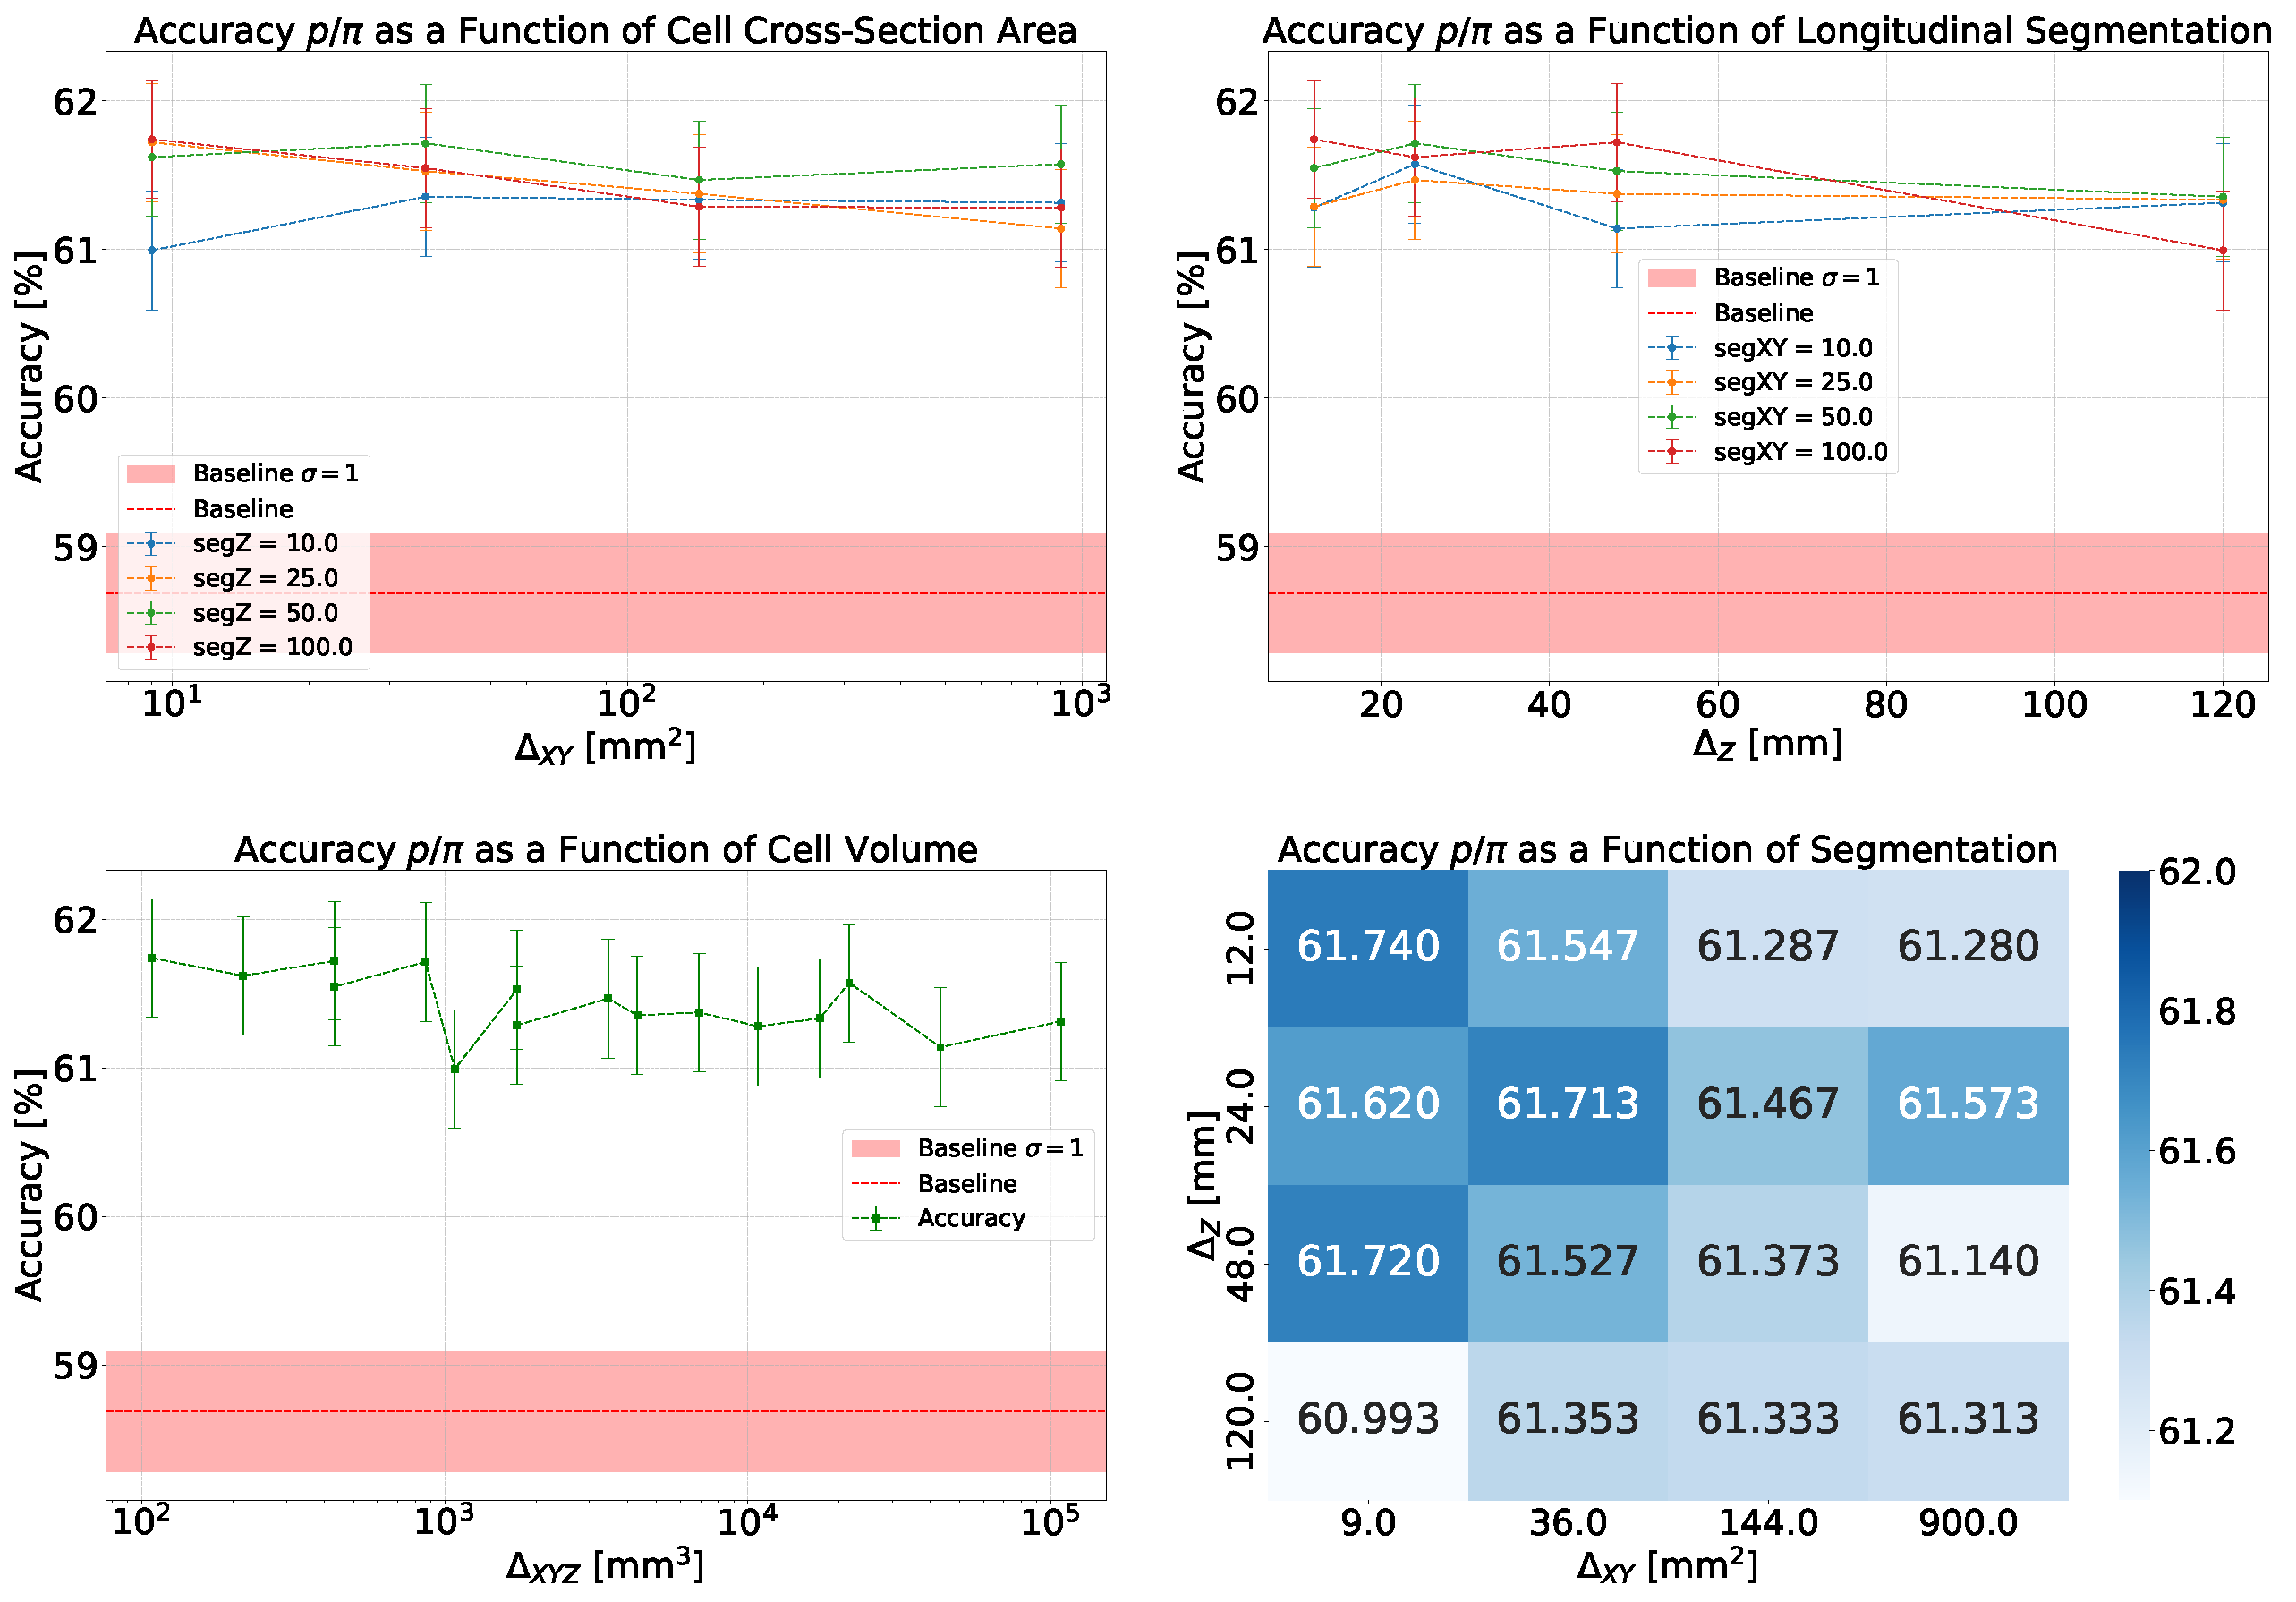
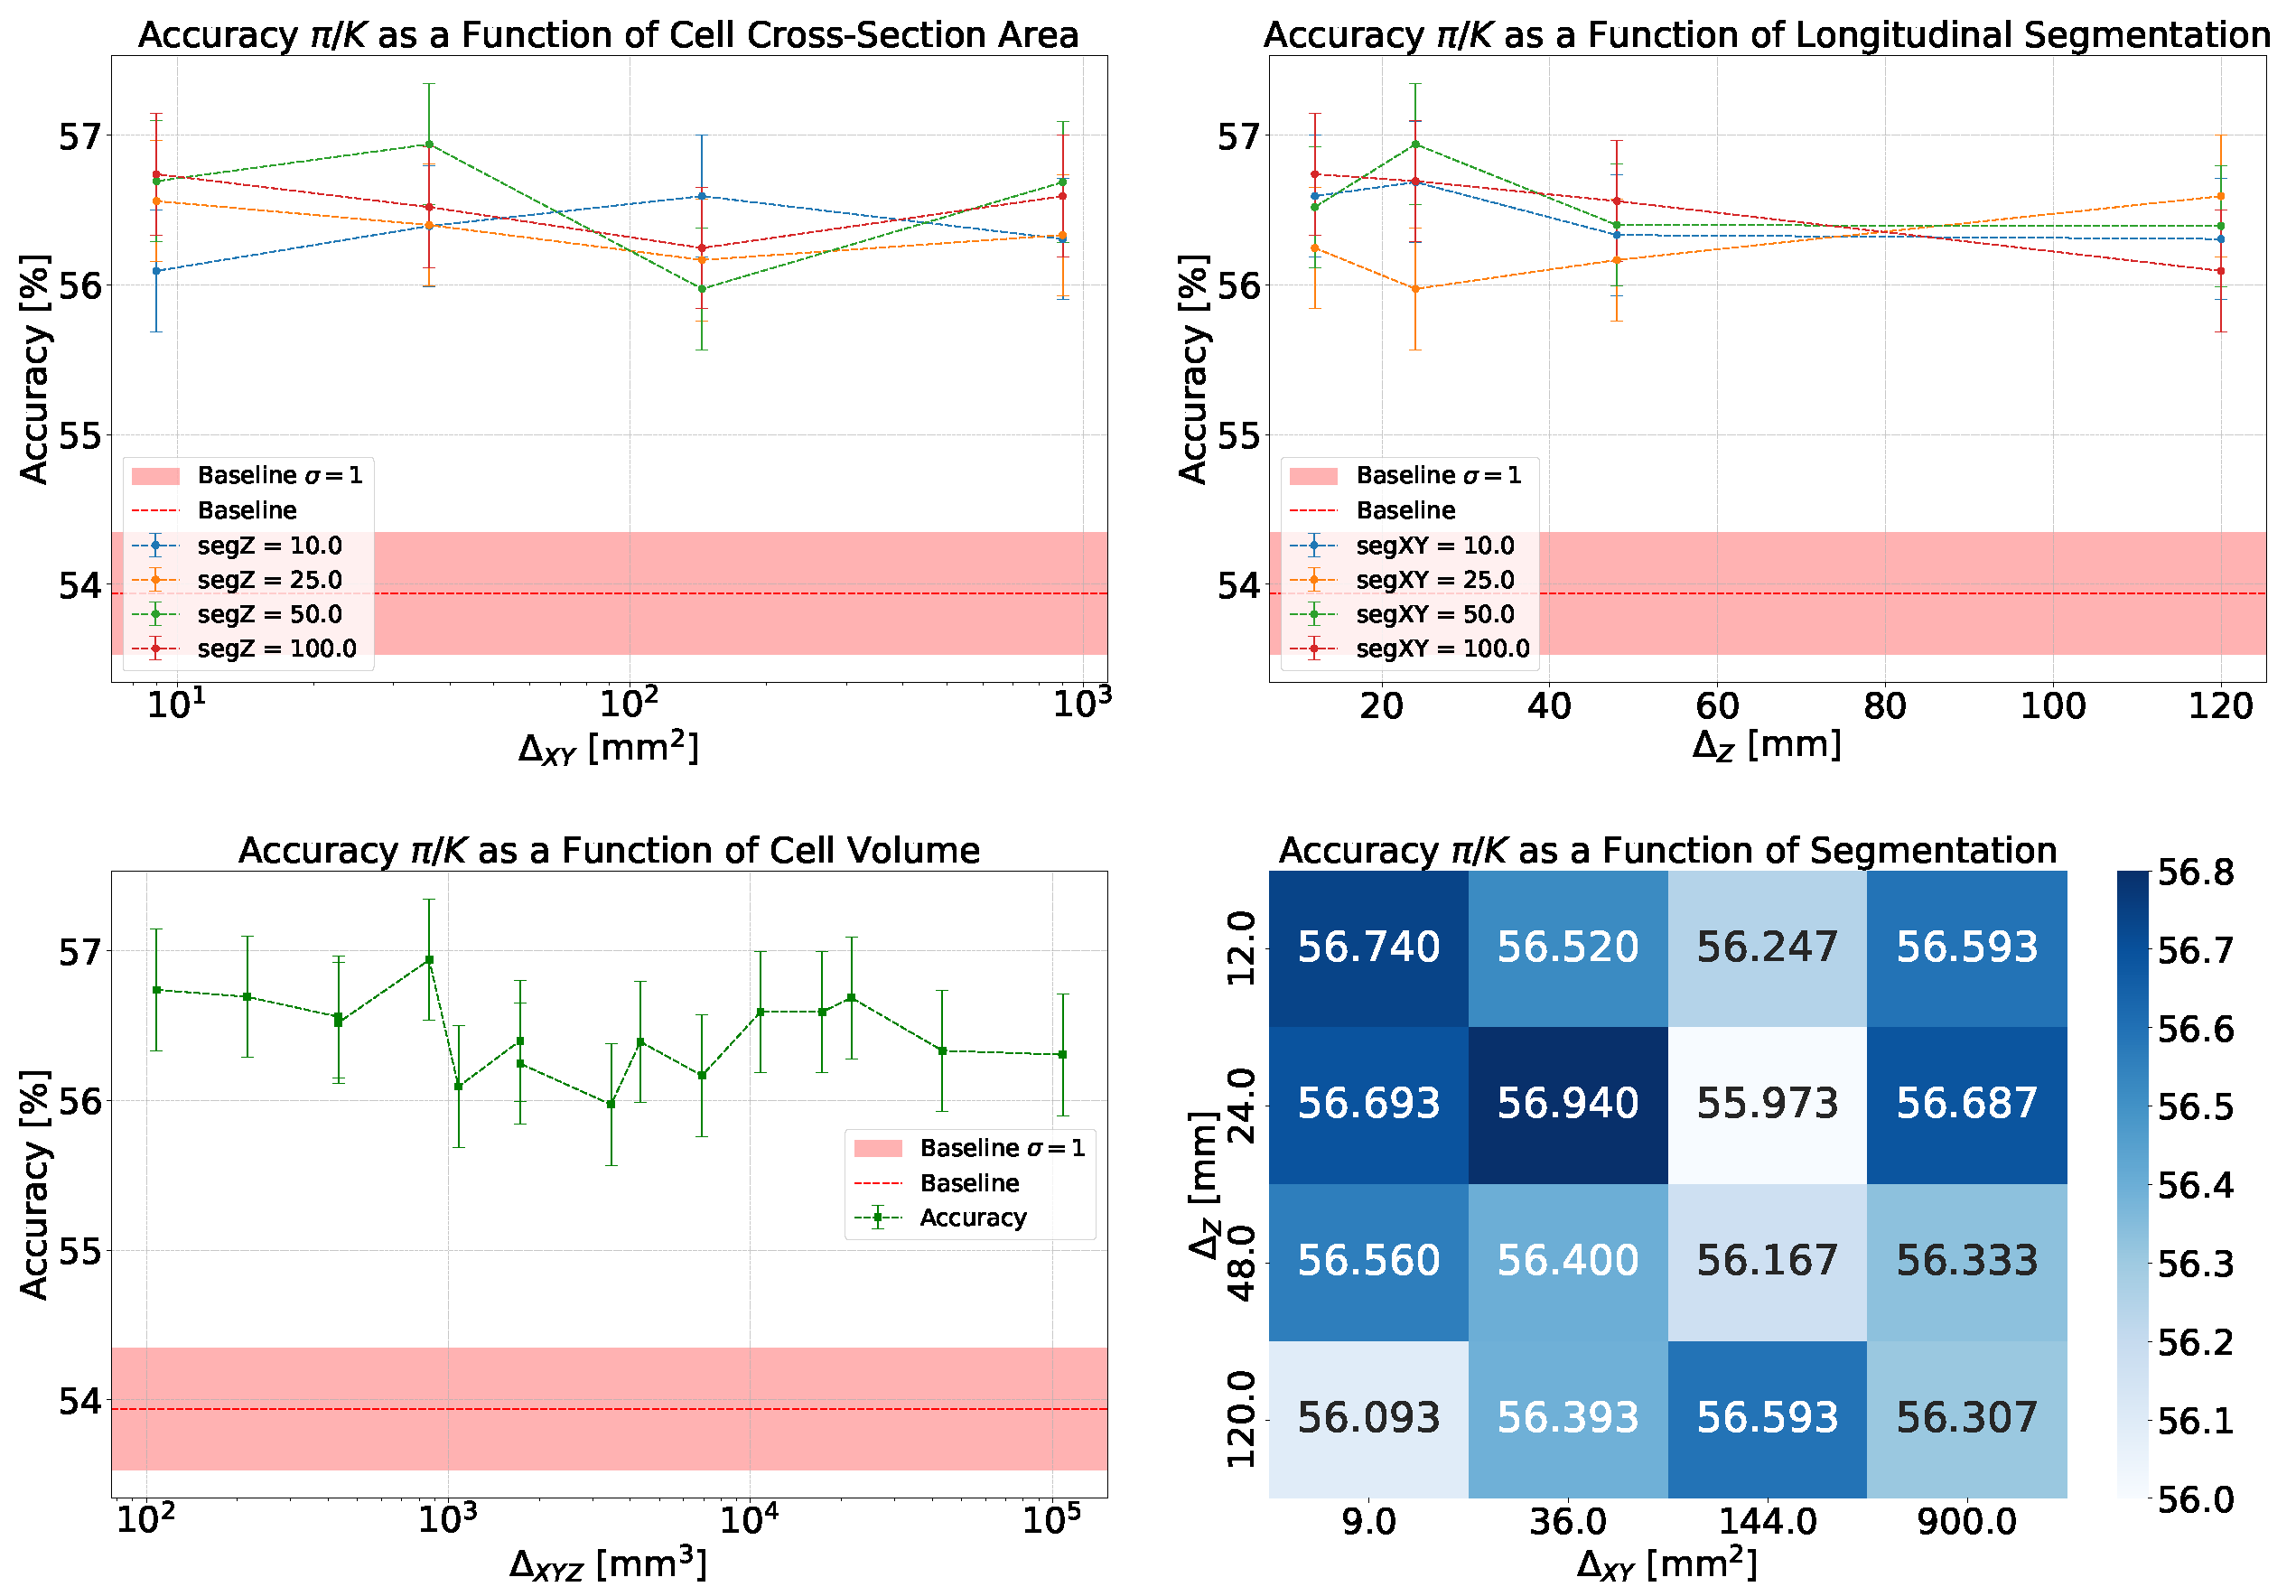
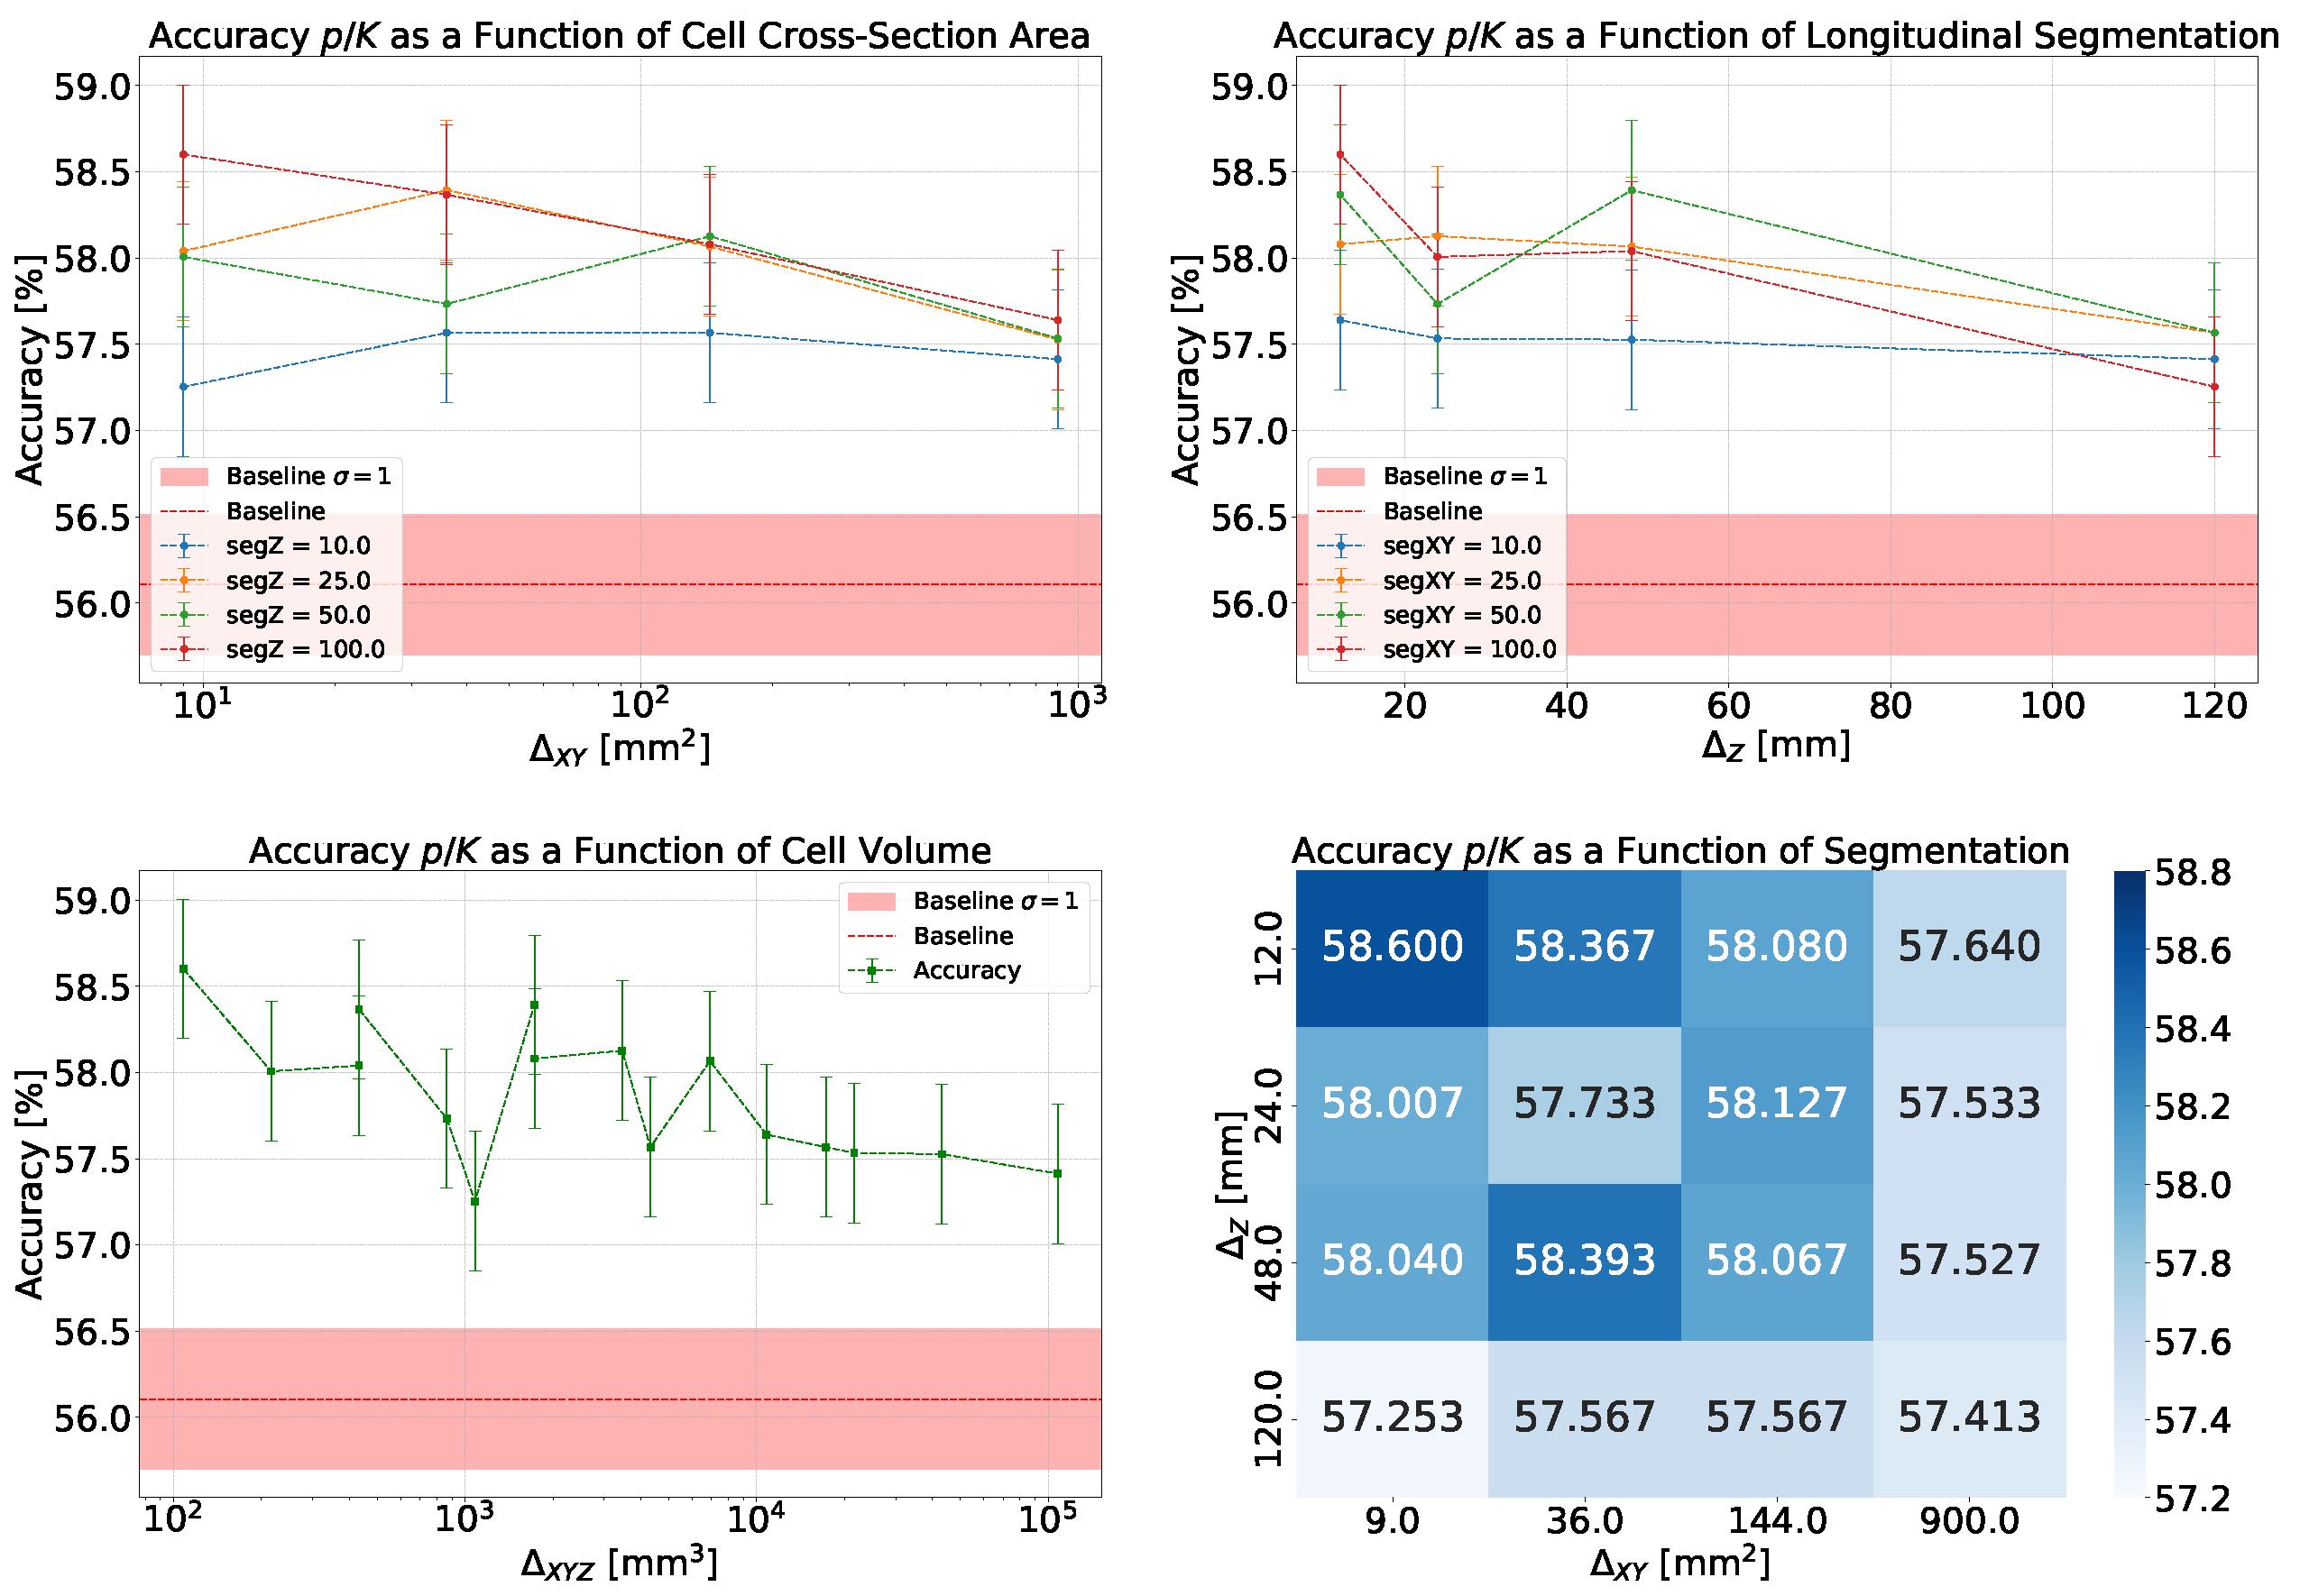
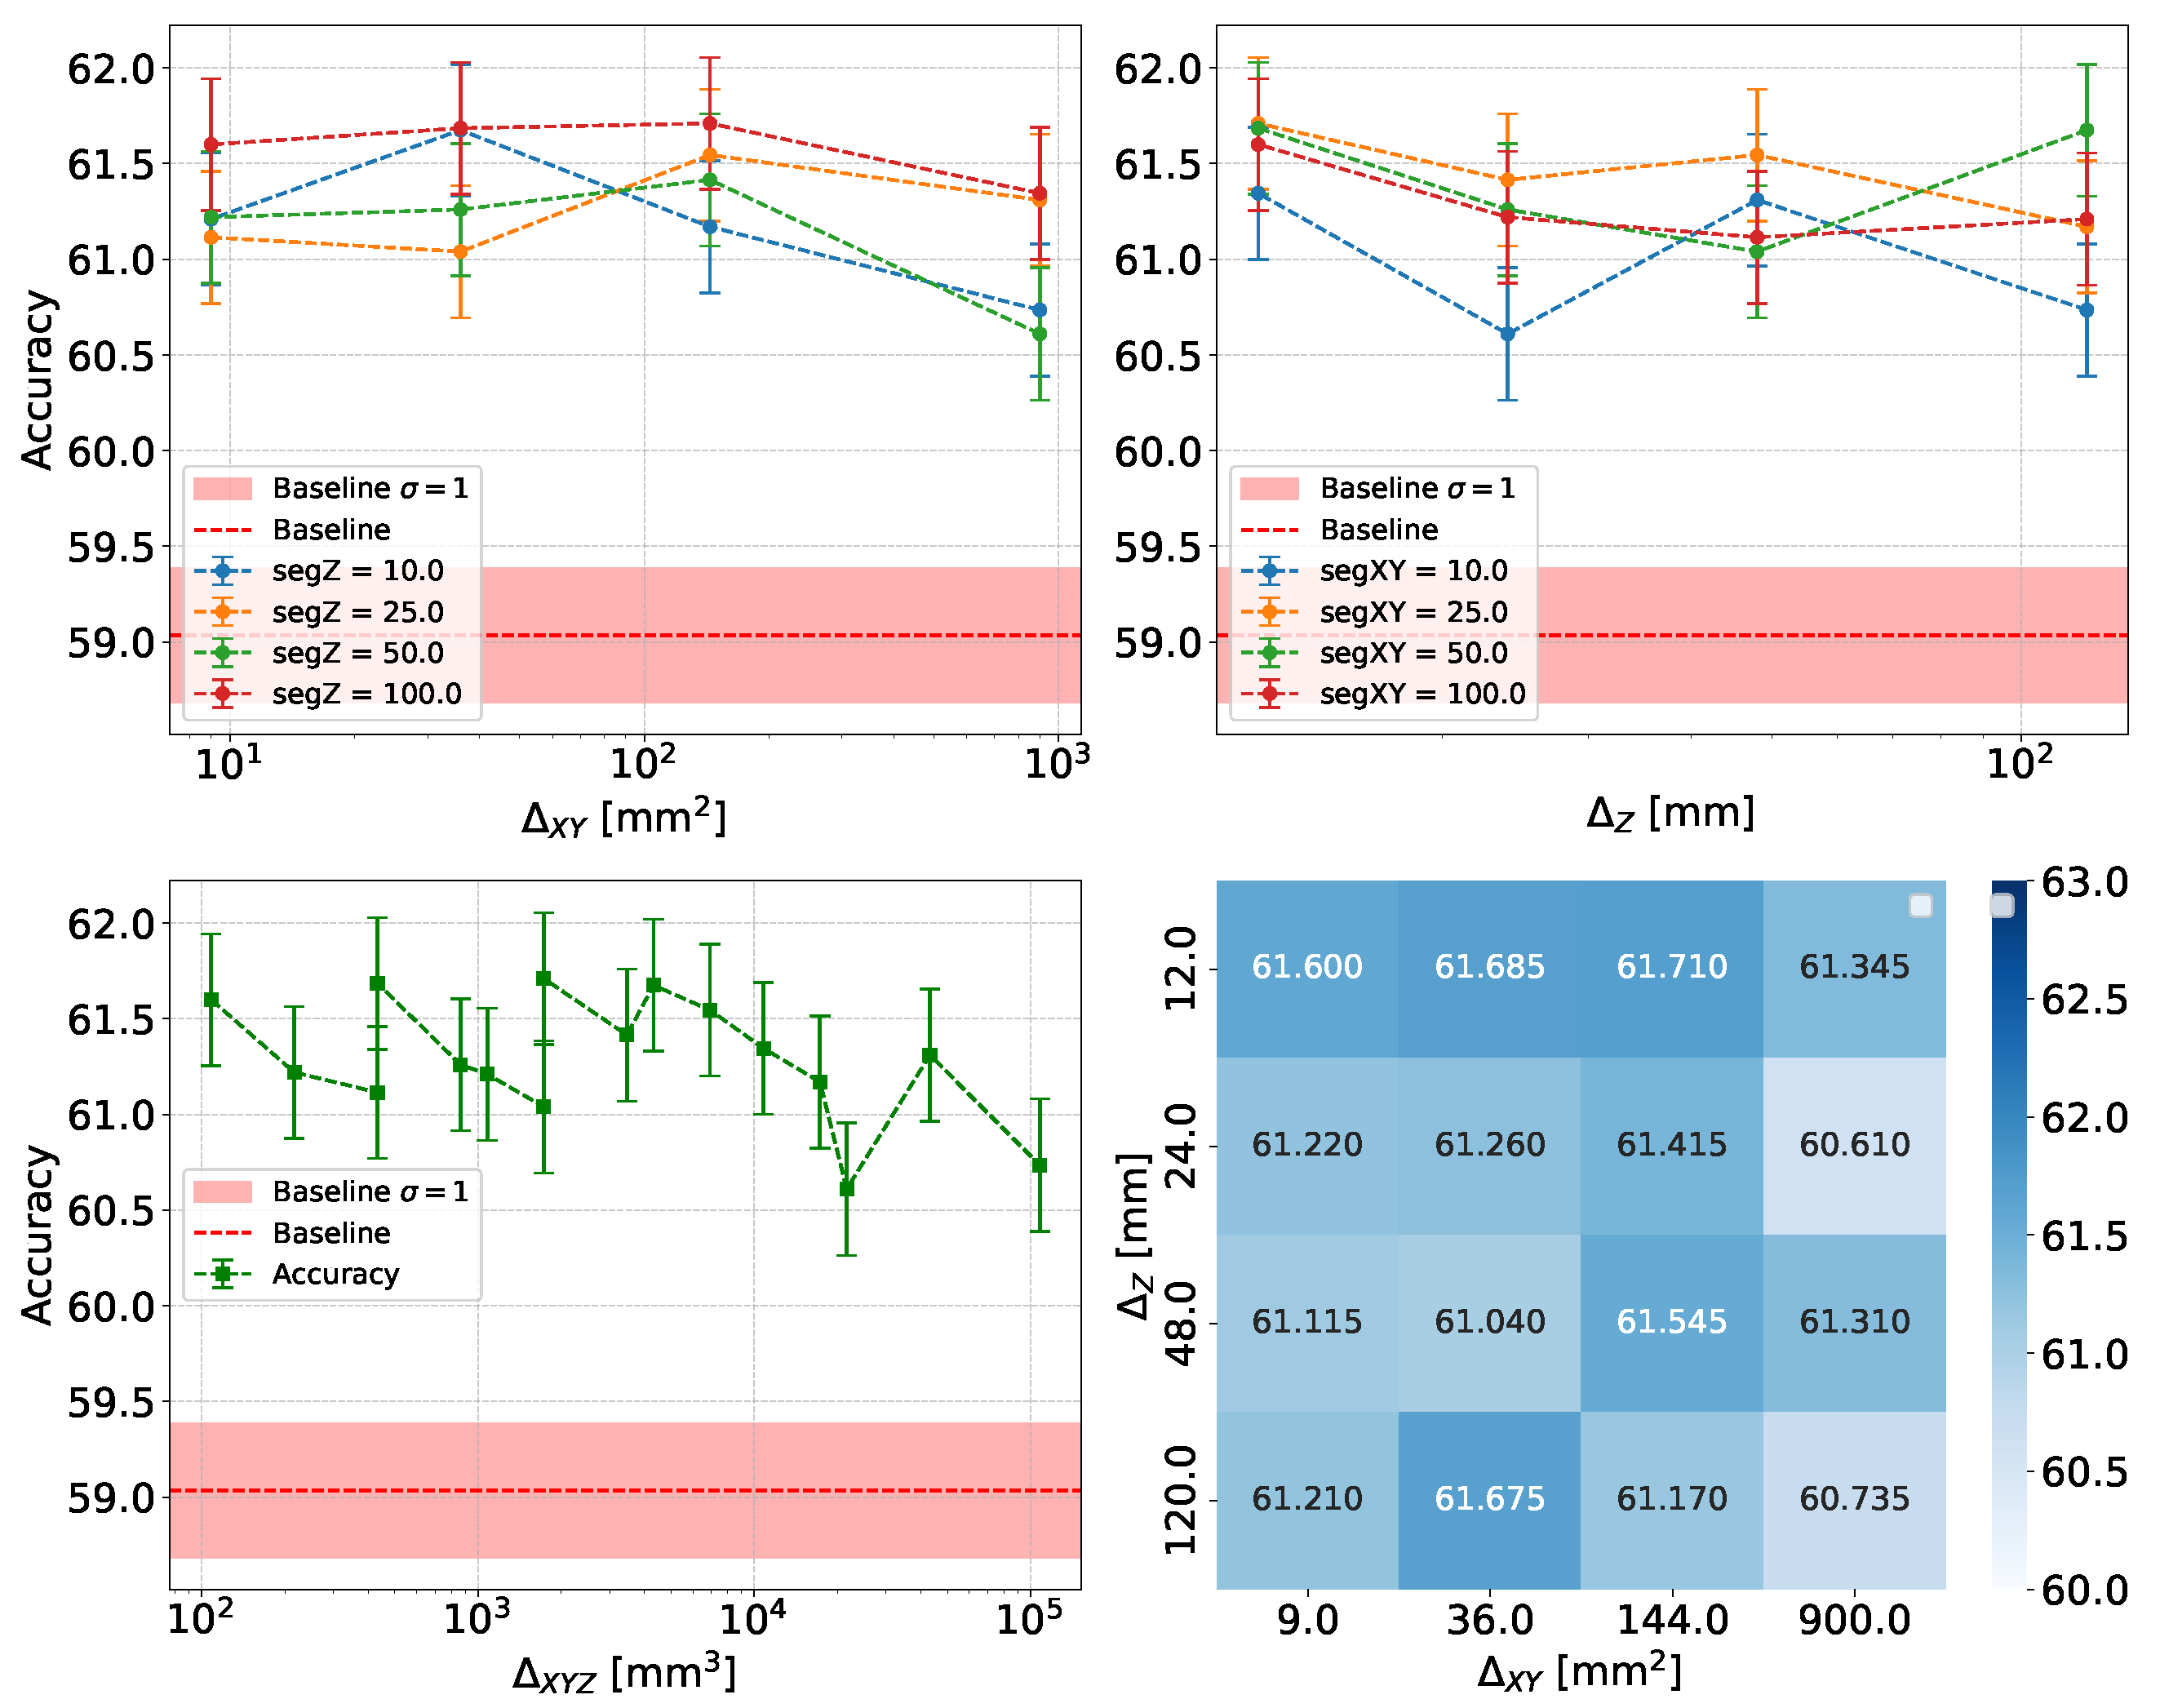
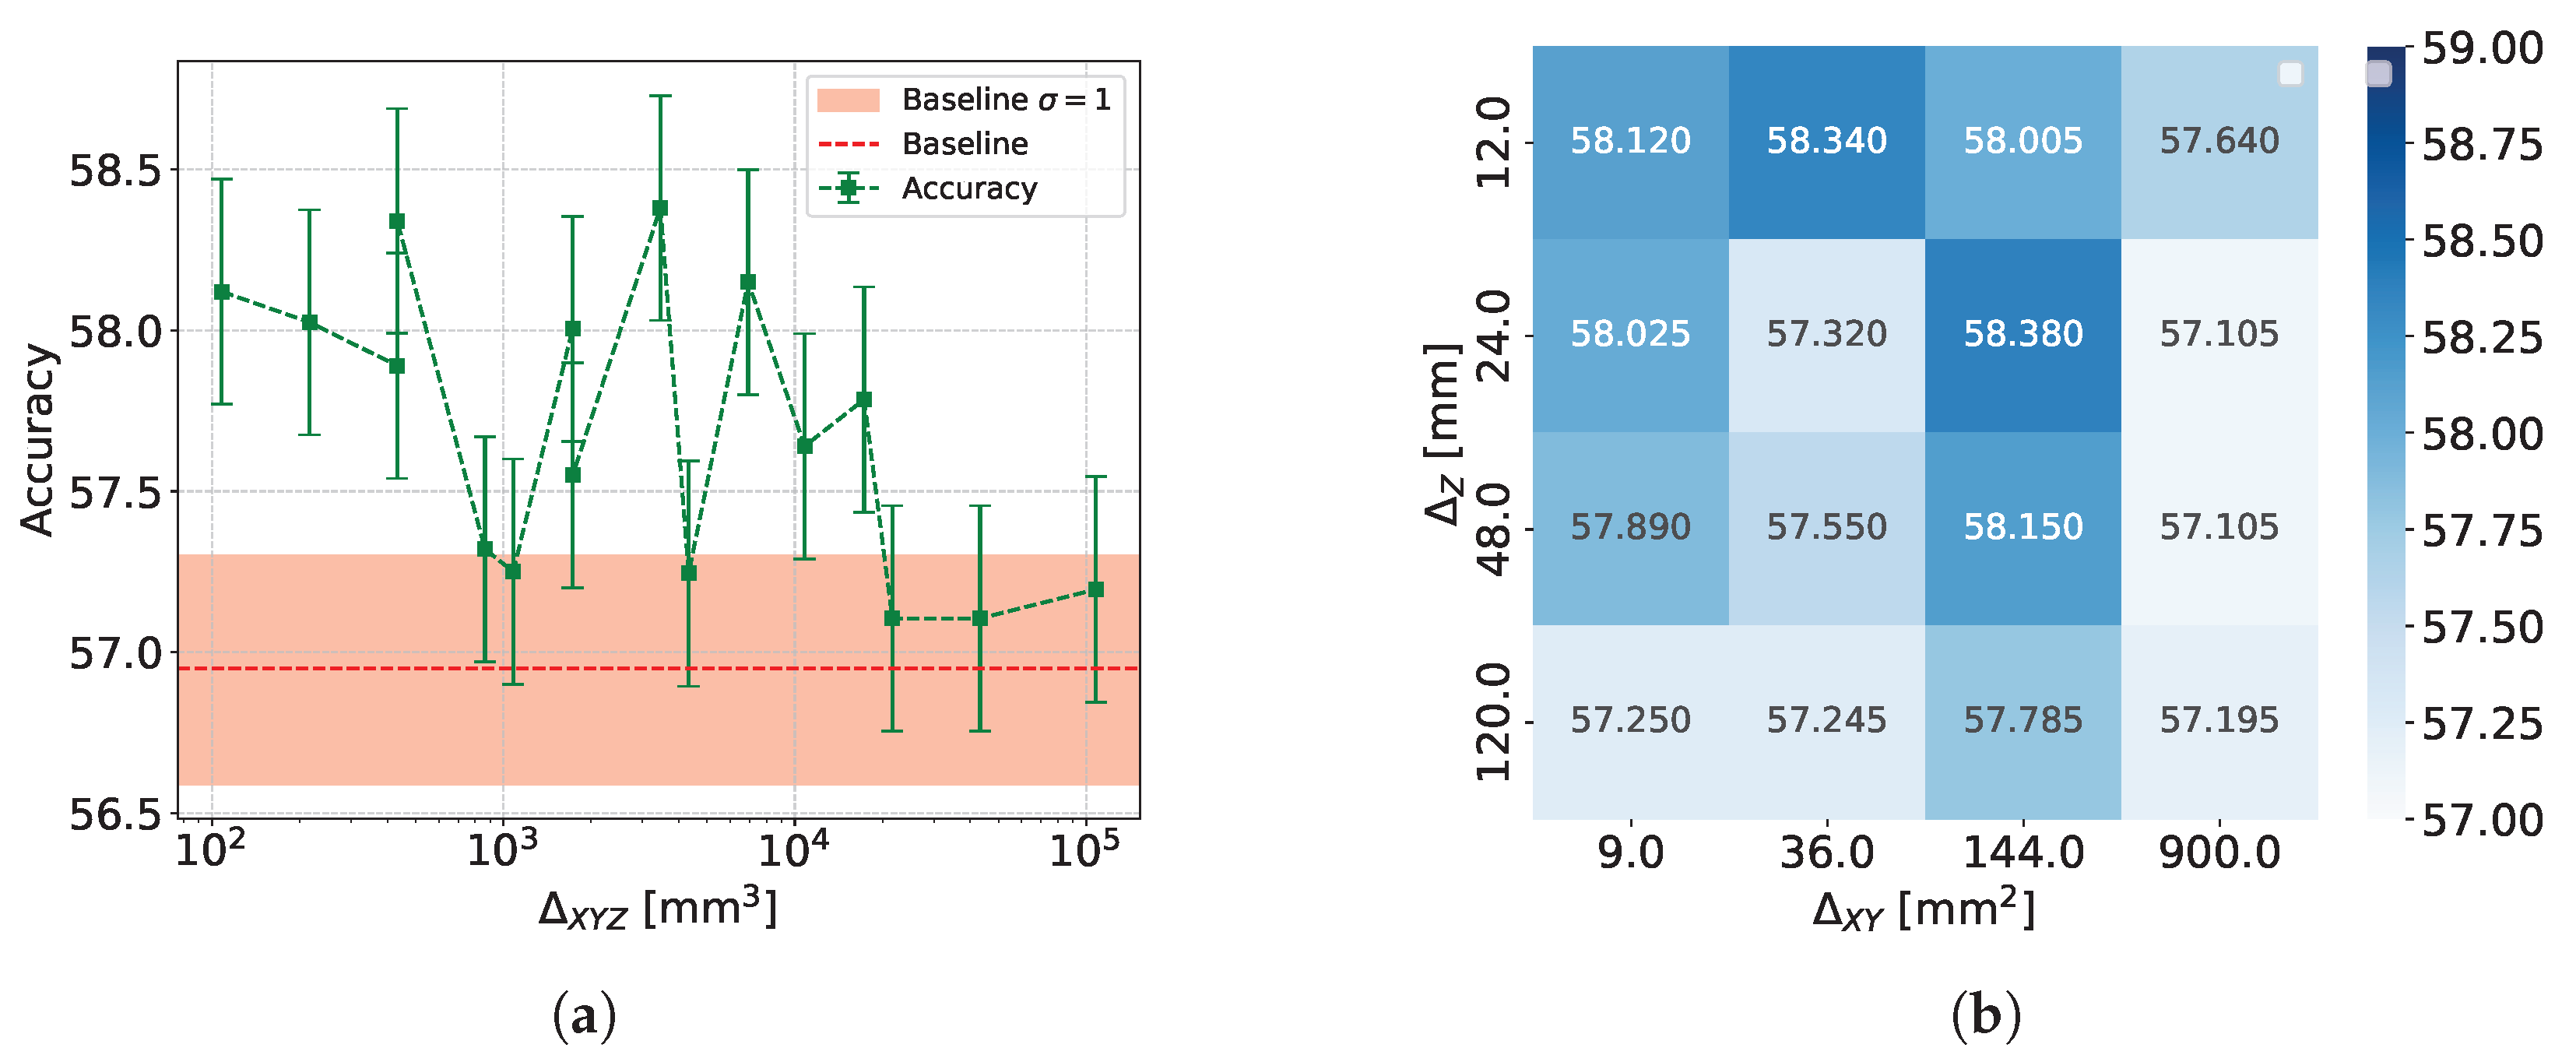
- Accuracy and Efficiency: The models used for classifying showers into particle classes (, , or ) output pairs of values summing to 1, representing the probability that an event belongs to either the first or second class. For example, in the classification of protons and pions, the model might output a probability of 0.7 for a proton, meaning the probability for a pion would be 0.3.A threshold can be defined based on these probabilities to determine the reliability of the model’s output. By setting such a threshold, fewer outputs are considered reliable, reducing the algorithm’s efficiency, which refers to number of output that are reliable over the total number of inputs. However, this trade-off leads to improved accuracy, a measure of how well the model’s predictions match the true class labels, calculated as the proportion of correct predictions out of all predictions made. The accuracy and efficiency curves show how these metrics change with varying threshold values.Moreover, the accuracy values as a function of the calorimeter cell size are presented. This analysis is carried out for various configurations, with comparisons made by incorporating the uncertainty in the accuracy values. The uncertainty is estimated using the Clopper-Pearson interval, which provides a confidence interval for a binomial proportion. For an accuracy a, estimated over a sample of n observations with k successes, the confidence interval at a confidence level of is defined as:where represents the inverse cumulative distribution function of the Beta distribution.
4.2. Machine Learning Strategy
4.2.1. XGBoost
4.2.2. Deep Neural Network
5. Results
5.1. XGBoost
5.1.1. Classification
5.1.2. Classification
5.1.3. Classification
5.2. Deep Neural Network
6. Related Work
7. Conclusions
Author Contributions
Funding
Data Availability Statement
Conflicts of Interest
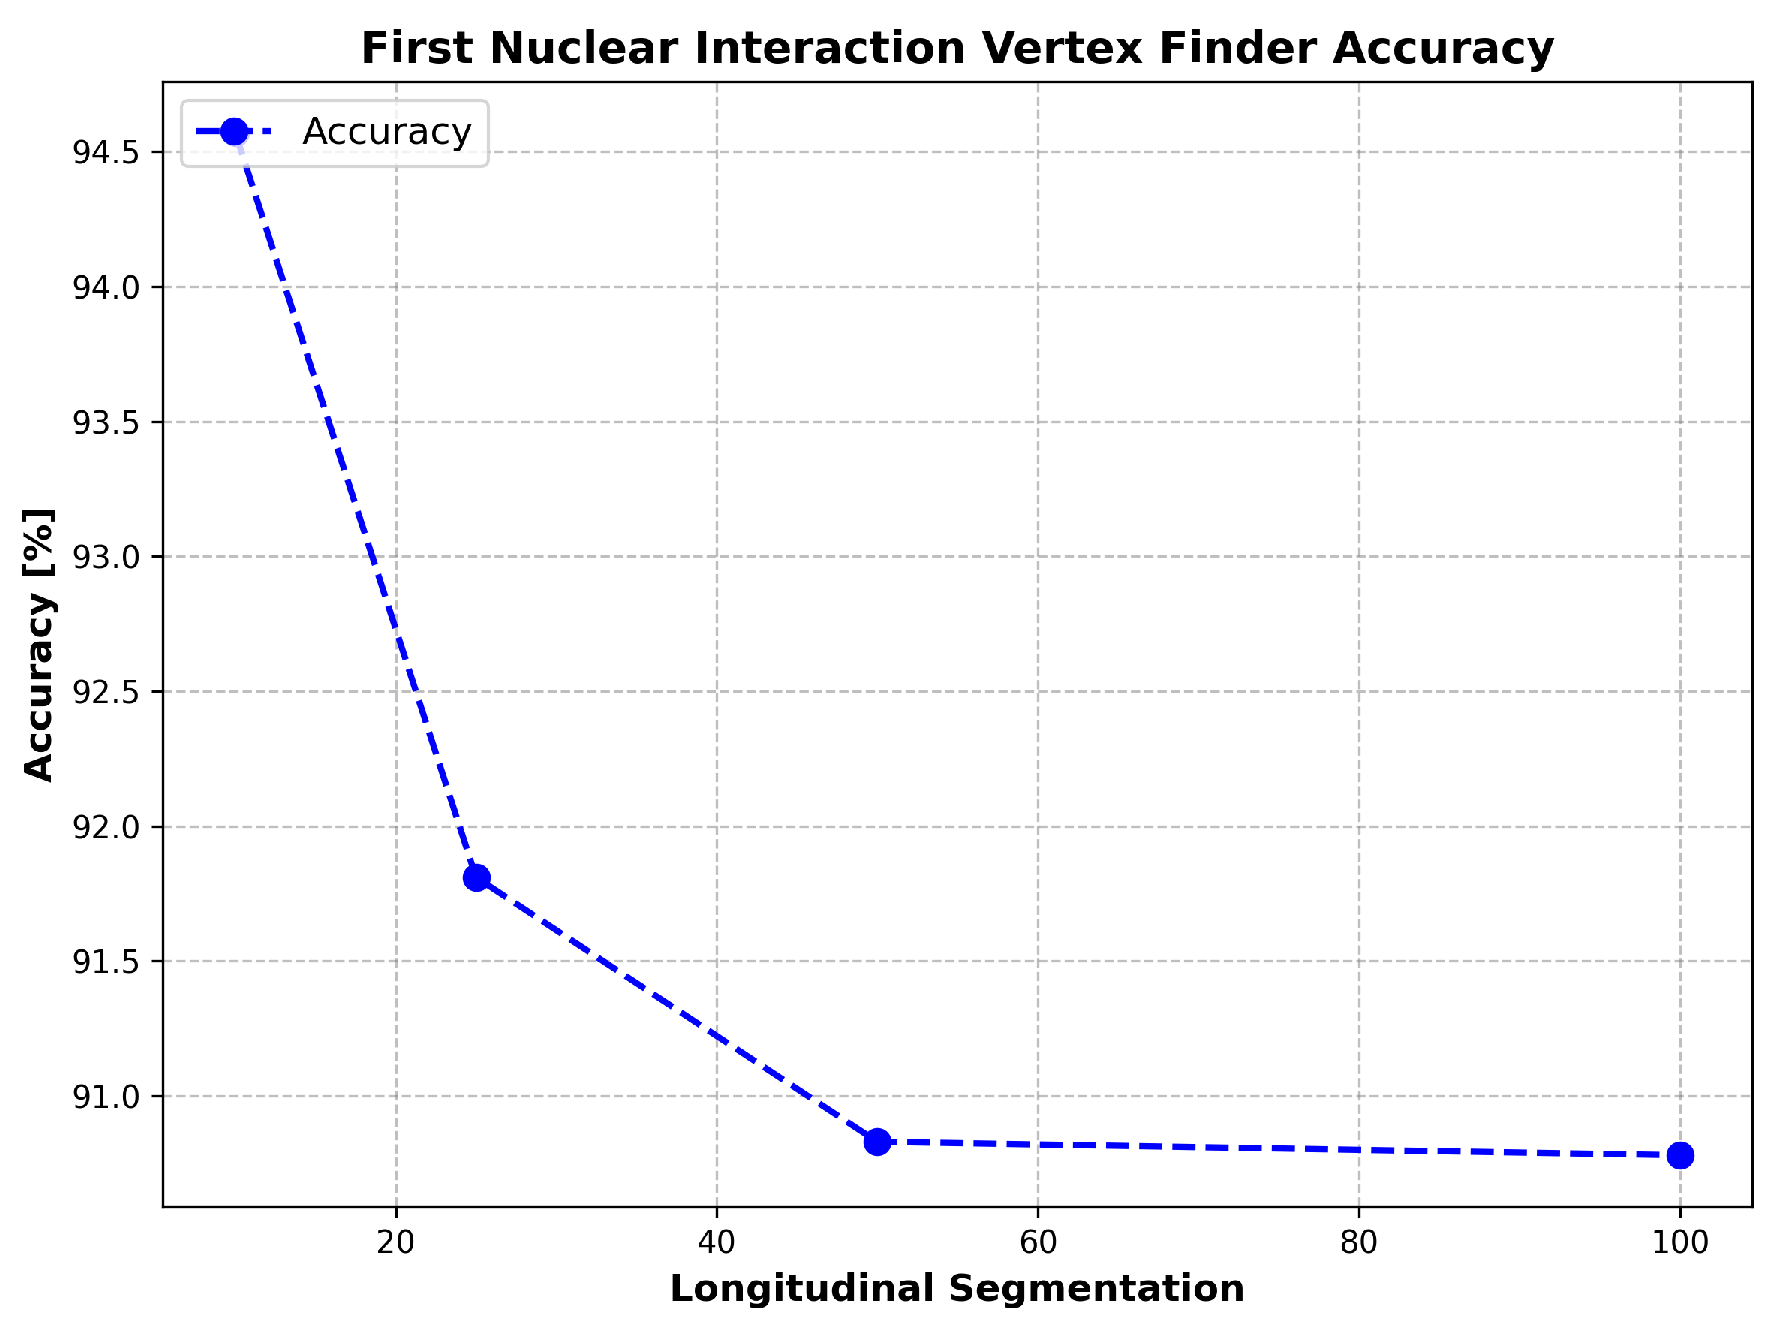
Appendix A. First Nuclear Interaction Vertex Finder
Appendix A.1. Inputs and Parameters
- energyCoordinates: A vector representing the spatial energy coordinates.
- energyDeposition: A vector representing the energy deposited at each coordinate.
- threshold: The initial threshold used to detect the peak in the energy profile.
Appendix A.2. Step-by-Step Algorithm Overview
- Energy Profile Calculation The algorithm processes the interactions to construct an energy profile along the z-dimension:
- Spatial coordinates and energy deposition (E) are retrieved for each interaction.
- Energy contributions are accumulated into z-slices within the XY window range.
- To improve peak detection, the energy profile is smoothed using a moving average filter.
- First Pass: Initial Peak Detection In the first pass, the algorithm scans the energyProfile to locate the first peak using the original threshold:
- Iterate through the elements of the energy profile:
- The algorithm identifies significant peaks in a sequence by comparing the values of consecutive elements. If an element surpasses a predefined threshold, its index is immediately returned as a peak. Alternatively, if the difference between two consecutive elements exceeds the threshold, the index of the second element is returned, marking it as the peak.
- Second Pass: Threshold Reduction If no peak is found in the first pass, the threshold is gradually reduced, and the search is repeated:
- Decrease the threshold by 10% in each iteration:
- Perform the peak detection search with the new threshold:
- Handling Cases with No Peak If no peak is detected after both passes, the function returns −1, indicating that no significant peaks were found in the vector.
Appendix A.3. Summary of Behavior
- The function employs a greedy approach, returning the index of the first detected peak in the energy profile.
- By gradually reducing the threshold, the function becomes more sensitive to smaller variations in the data, improving peak detection in cases of low-energy deposition.
- If no peak is identified after both search passes, the function returns −1, indicating that no peak meets the specified criteria.
Appendix A.4. Performance Evaluation
Appendix B. Energy Peak Finder
Appendix B.1. Inputs and Parameters
Appendix B.2. Step-by-Step Algorithm Overview
- Histograms Creation: Two 2D histograms (hist_cell_zy and hist_cell_zx) are created to represent energy deposits in the Z-Y and Z-X planes, respectively. These histograms are filled on the basis of the event data.
- Energy Profile Along Z-Axis and Peak Detection: The energy deposition data are projected along the Z-axis:
- A projection of the hist_cell_zy histogram onto the Z axis is stored in projZ.
- TSpectrum::Search is used to find peaks in projZ with a threshold of 0.1 [23].
- The positions of the detected peaks along the Z-axis are stored in peaksZ.
- The peaks are sorted in increasing order of associated energy, and the highest energy one is finally stored.
In most analyzed events the algorithm finds a single peak; cases when multiple peaks compete for being classified as the first event vertex are very rare; the highest-energy one is anyway used. - Peak Filtering and Search in X and Y Projections: Given the Z peak position, the function performs the following steps:
- Filters the hist_cell_zx and hist_cell_zy histograms based on the Z peak position.
- Projects the filtered histograms onto the X and Y axes, respectively, creating projX and projY.
- Searches for peaks in the X and Y projections using TSpectrum::Search [23].
- If multiple peaks are found in X or Y, the algorithm selects the most prominent peak by comparing the peak intensities.
- Energy Accumulation Around Peaks: The function accumulates the energy deposition values around the detected peak:
- For each energy deposition in the event, the 3D position is converted to cell coordinates.
- The proximity of the energy deposition to the detected peaks is evaluated, and the energy is added if the energy deposition is within the sphere defined by sphere_radius.
Appendix B.3. Results
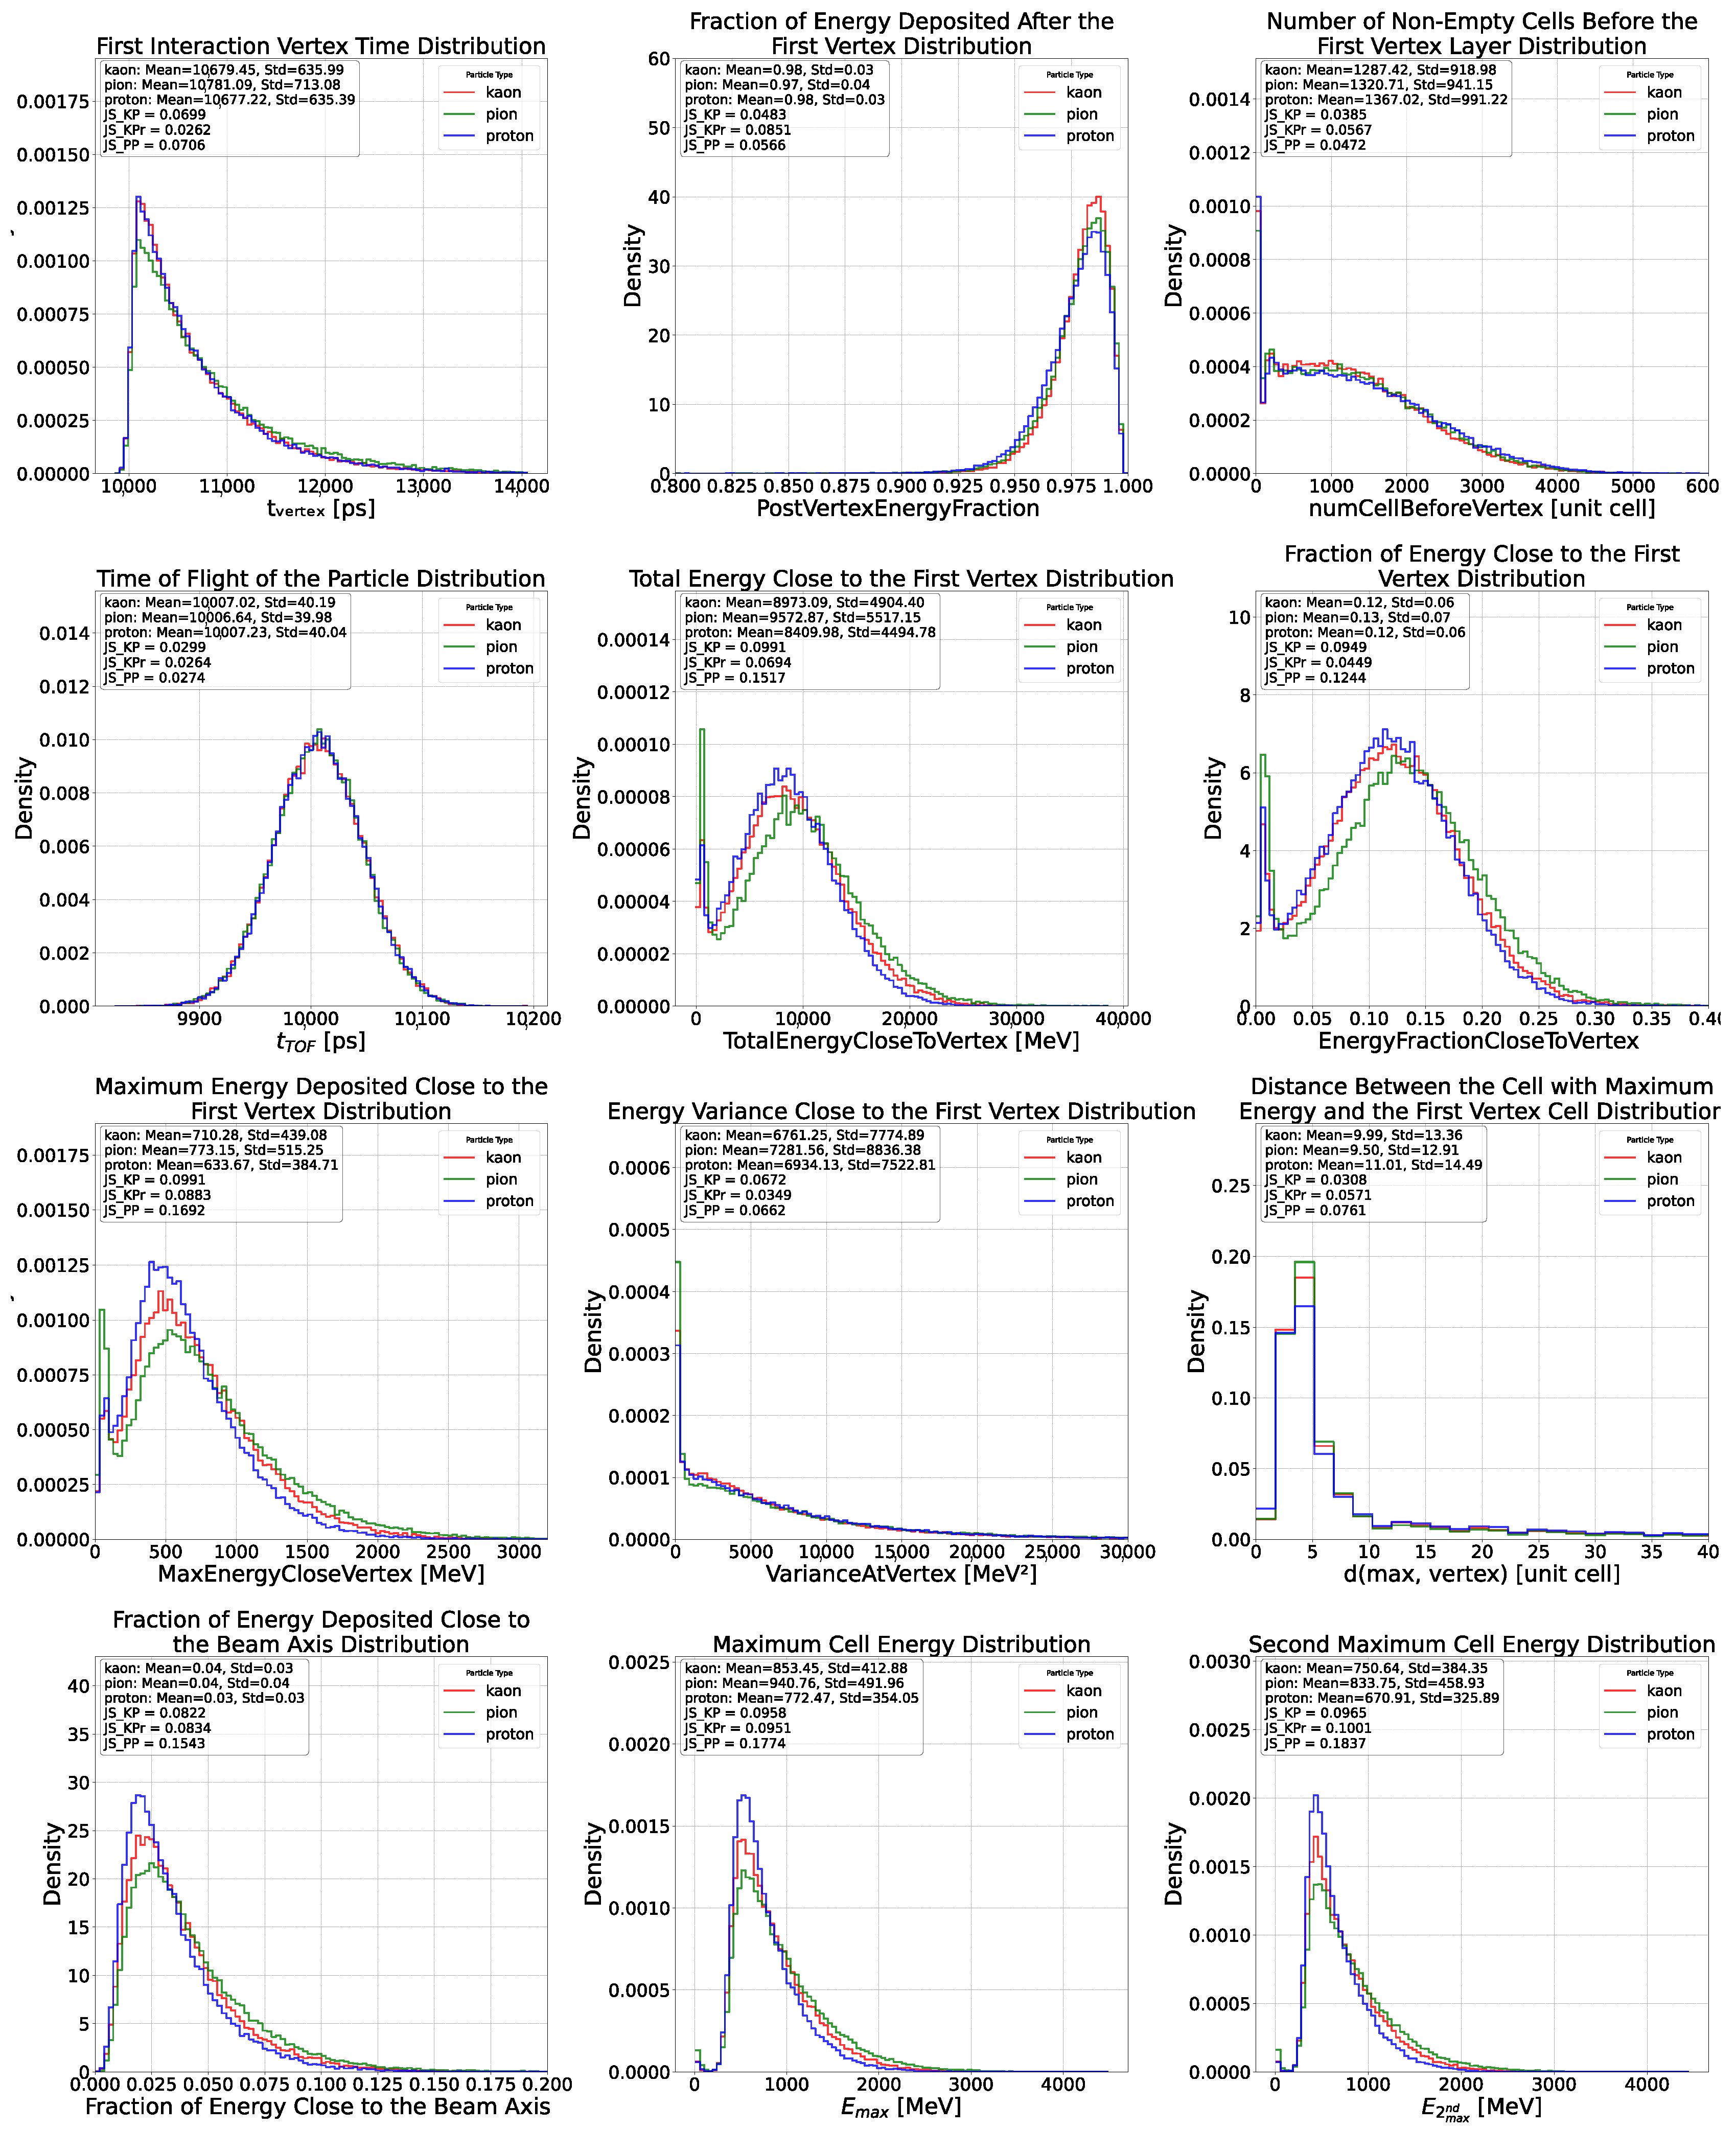
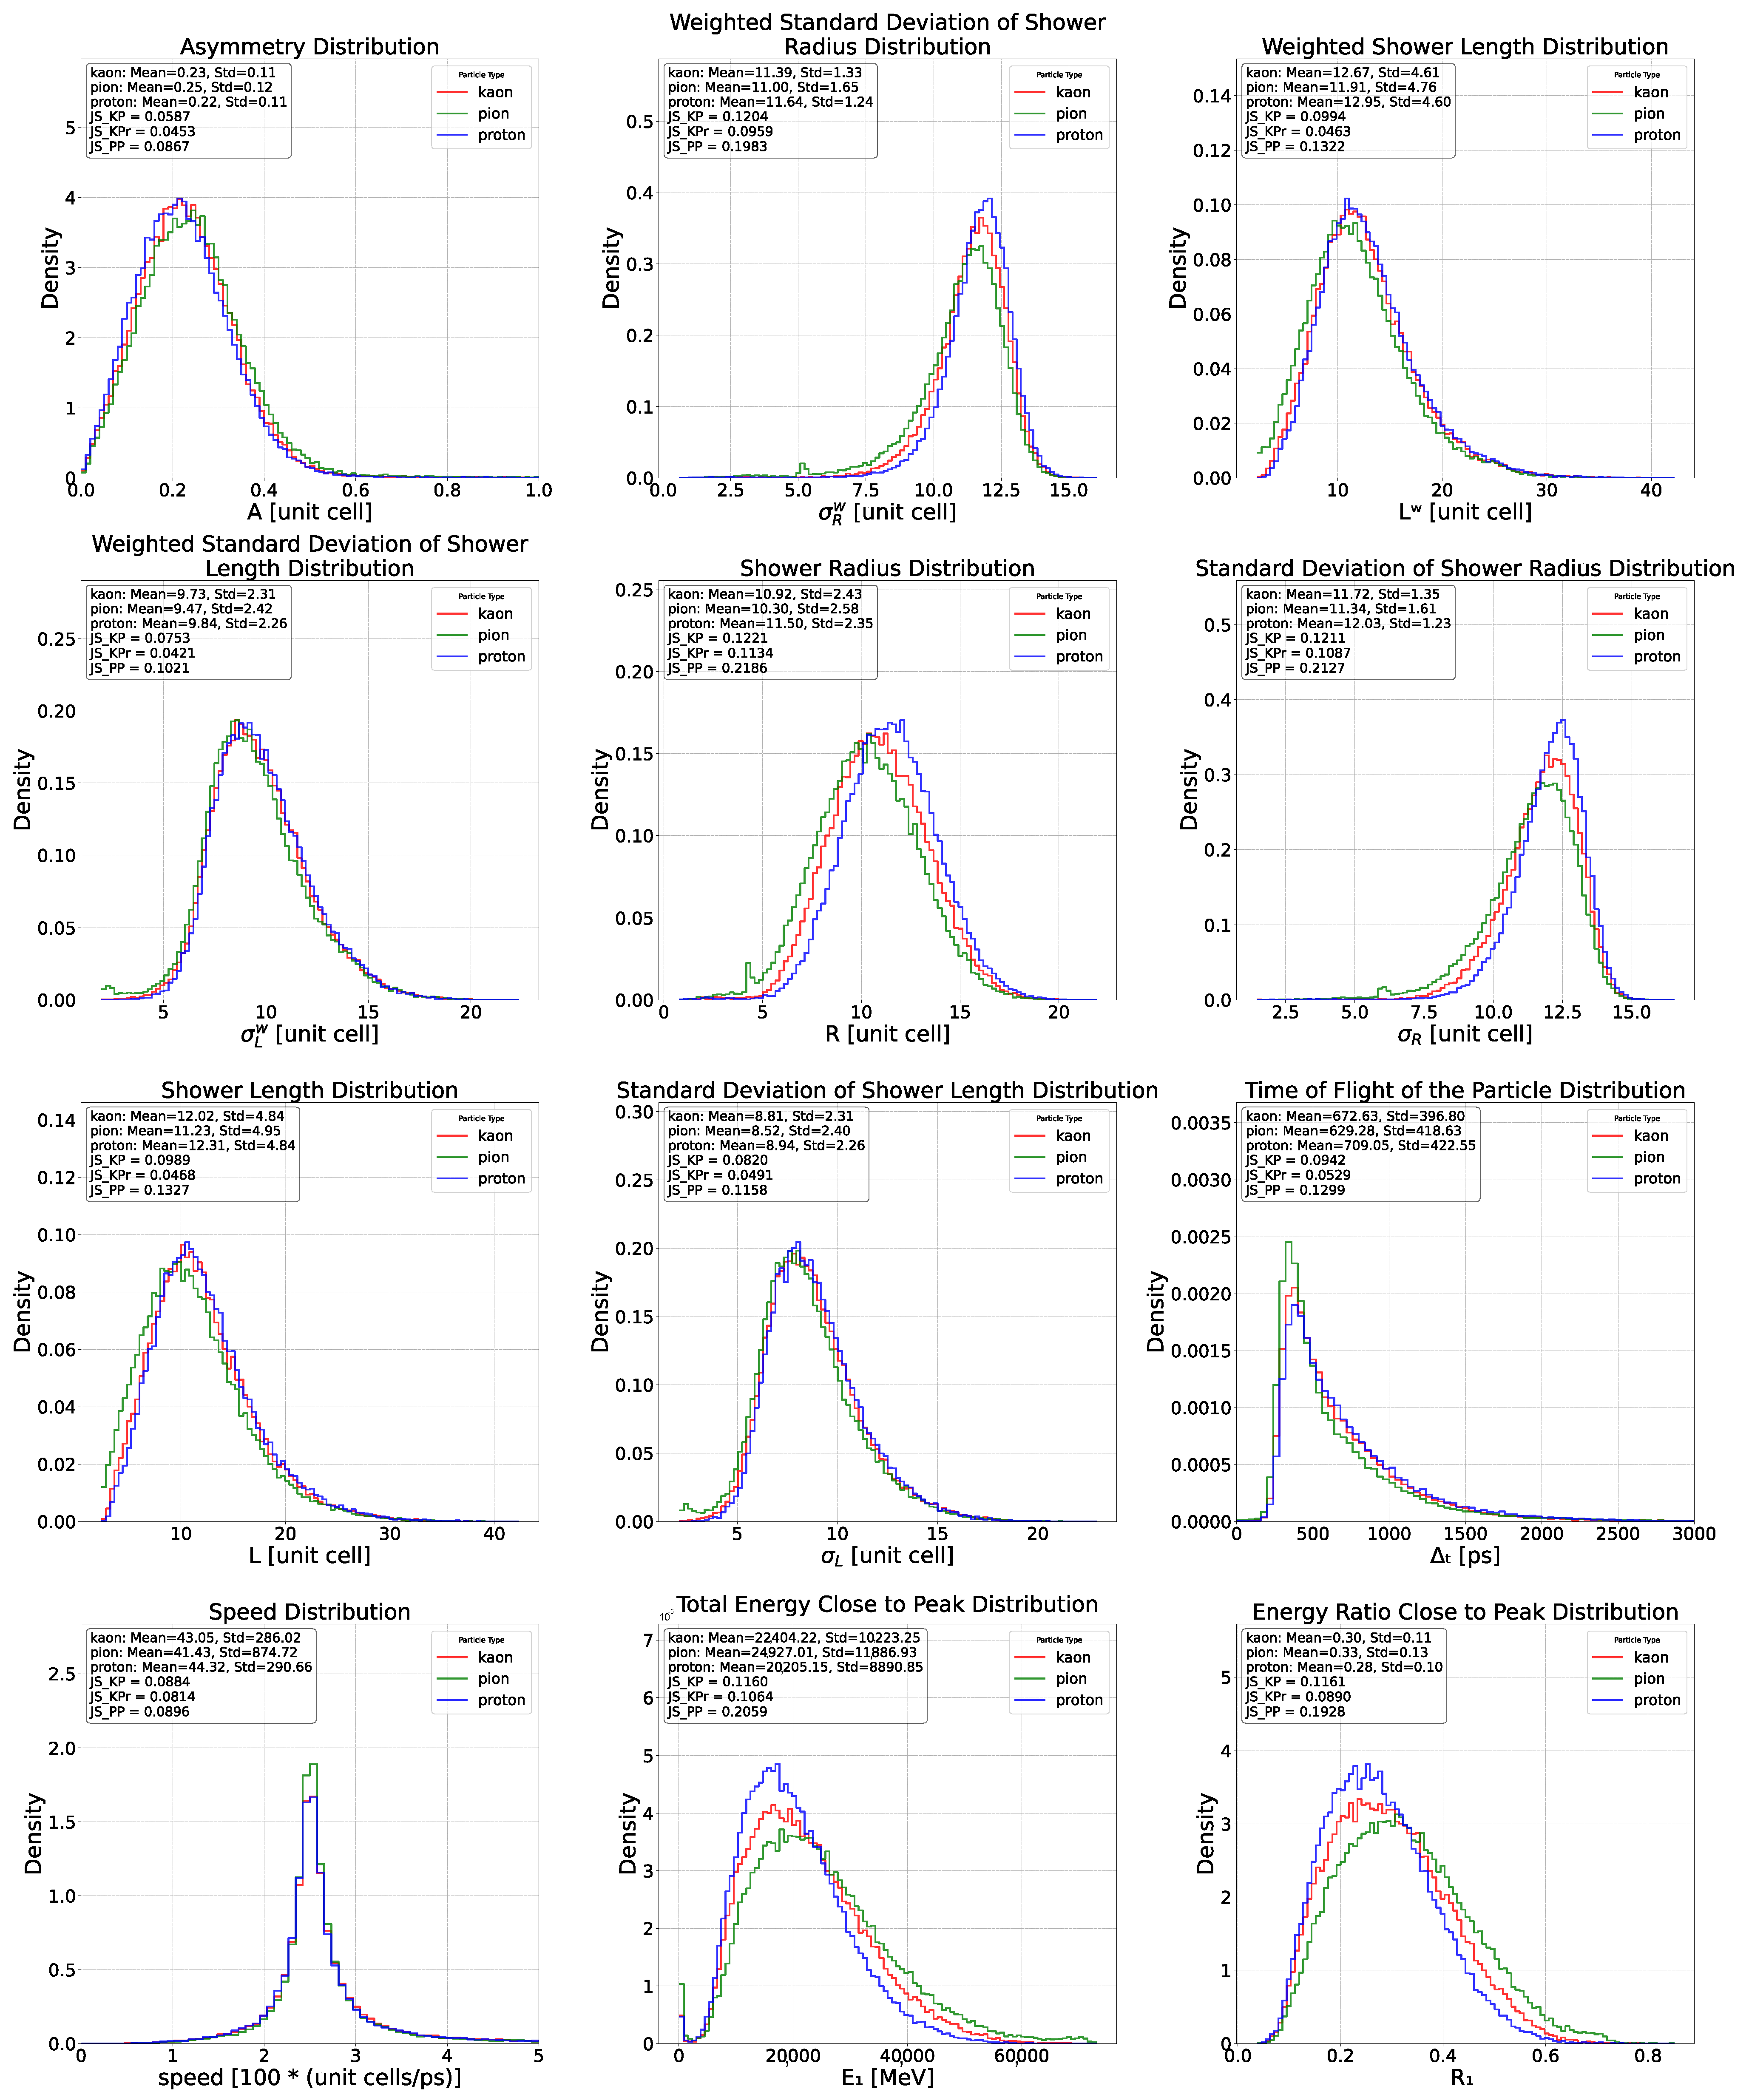
Appendix C. Feature Distributions for Proton, Pion and Kaons
References
- Wing, M. Precise measurement of jet energies with the ZEUS detector. arXiv 2000, arXiv:hep-ex/0011046. [Google Scholar]
- Qu, H.; Gouskos, L. Jet tagging via particle clouds. Phys. Rev. D 2020, 101, 056019. [Google Scholar] [CrossRef]
- Dreyer, F.; Qu, H. Jet tagging in the Lund plane with graph networks. J. High Energy Phys. 2020, 2021, 52. [Google Scholar] [CrossRef]
- The ATLAS Collaboration. Transformer Neural Networks for Identifying Boosted Higgs Bosons Decaying into and in ATLAS. Technical Report; CERN: Geneva, Switzerland, 2023. [Google Scholar]
- Kasieczka, G. Boosted Top Tagging Method Overview. arXiv 2018, arXiv:1801.04180. [Google Scholar]
- The CMS Collaboration. Particle-flow reconstruction and global event description with the CMS detector. J. Instrum. 2017, 12, P10003. [Google Scholar] [CrossRef]
- Thomson, M. Particle flow calorimetry and the PandoraPFA Algorithm. Nucl. Instrum. Methods Phys. Res. Sect. A Accel. Spectrometers Detect. Assoc. Equip. 2009, 611, 25–40. [Google Scholar] [CrossRef]
- Bilki, B.; Repond, J.; Xia, L.; Eigen, G.; Thomson, M.A.; Ward, D.R.; Benchekroun, D.; Hoummada, A.; Khoulaki, Y.; Chang, S.; et al. Pion and proton showers in the CALICE scintillator-steel analogue hadron calorimeter. J. Instrum. 2015, 10, P04014. [Google Scholar] [CrossRef]
- Verhelst, M.; Bahai, A. Where Analog Meets Digital: Analog-to-Information Conversion and Beyond. IEEE Solid-State Circuits Mag. 2015, 7, 67. [Google Scholar] [CrossRef]
- Allison, J.; Amako, K.; Apostolakis, J.; Arce, P.; Asai, M.; Aso, T.; Bagli, E.; Bagulya, A.; Banerjee, S.; Barrand, G.; et al. Recent developments in Geant4. Nucl. Instrum. Methods Phys. Res. Sect. A Accel. Spectrometers Detect. Assoc. Equip. 2016, 835, 186–225. [Google Scholar] [CrossRef]
- Allison, J.; Amako, K.; Apostolakis, J.; Araujo, H.; Dubois, P.A.; Asai, M.; Barrand, G.; Capra, R.; Chauvie, S.; Chytracek, R.; et al. Geant4 developments and applications. IEEE Trans. Nucl. Sci. 2006, 53, 270. [Google Scholar] [CrossRef]
- Agostinelli, S.; Allison, J.; Amako, K.A.; Apostolakis, J.; Araujo, H.; Arce, P.; Asai, M.; Axen, D.; Banerjee, S.; Barrand, G.; et al. Geant4—A simulation toolkit. Nucl. Instrum. Methods Phys. Res. Sect. A Accel. Spectrometers Detect. Assoc. Equip. 2003, 506, 250–303. [Google Scholar] [CrossRef]
- Perez-Lara, C.; Wetzel, J.; Akgun, U.; Anderson, T.; Barbera, T.; Blend, D.; Cankocak, K.; Cerci, S.; Chigurupati, N.; Cox, B.; et al. Study of time and energy resolution of an ultra-compact sampling calorimeter (RADiCAL) module at EM shower maximum over the energy range 25 GeV ≤ E ≤ 150 GeV. arXiv 2024, arXiv:2401.01747. [Google Scholar] [CrossRef]
- Akchurin, N.; Ayan, S.; Bencze, G.L.; Chikin, K.; Cohn, H.; Doulas, S.; Dumanoǧlu, I.; Eskut, E.; Fenyvesi, A.; Ferrando, A.; et al. On the differences between high-energy proton and pion showers and their signals in a non-compensating calorimeter. Nucl. Instrum. Methods Phys. Res. Sect. A Accel. Spectrometers Detect. Assoc. Equip. 1998, 408, 380–396. [Google Scholar] [CrossRef]
- Lin, J. Divergence measures based on the Shannon entropy. IEEE Trans. Inf. Theory 1991, 37, 145–151. [Google Scholar] [CrossRef]
- Grinsztajn, L.; Oyallon, E.; Varoquaux, G. Why do tree-based models still outperform deep learning on tabular data? arXiv 2022, arXiv:2207.08815. [Google Scholar]
- Li, X.; Orabona, F. On the Convergence of Stochastic Gradient Descent with Adaptive Stepsizes. arXiv 2019, arXiv:1805.08114. [Google Scholar]
- Belayneh, D.; Carminati, F.; Farbin, A.; Hooberman, B.; Khattak, G.; Liu, M.; Liu, J.; Olivito, D.; Pacela, V.B.; Pierini, M.; et al. Calorimetry with deep learning: Particle simulation and reconstruction for collider physics. Eur. Phys. J. C 2020, 80, 688. [Google Scholar] [CrossRef]
- Barsotti, R.; Shepherd, M. Using machine learning to separate hadronic and electromagnetic interactions in the GlueX forward calorimeter. J. Instrum. 2020, 15, P05021. [Google Scholar] [CrossRef]
- Acosta, F.T.; Mikuni, V.; Nachman, B.; Arratia, M.; Karki, B.; Milton, R.; Karande, P.; Angerami, A. Comparison of point cloud and image-based models for calorimeter fast simulation. J. Instrum. 2024, 19, P05003. [Google Scholar] [CrossRef]
- Zaheer, M.; Kottur, S.; Ravanbakhsh, S.; Poczos, B. Deep Sets. In Advances in Neural Information Processing Systems; Curran Associates, Inc.: Red Hook, NY, USA, 2017; Volume 30. [Google Scholar]
- An, L.; Auffray, E.; Betti, F.; Dall’Omo, F.; Gascon, D.; Golutvin, A.; Guz, Y.; Kholodenko, S.; Martinazzoli, L.; De Cos, J.M.; et al. Performance of a spaghetti calorimeter prototype with tungsten absorber and garnet crystal fibres. Nucl. Instrum. Methods Phys. Res. Sect. A Accel. Spectrometers Detect. Assoc. Equip. 2023, 1045, 167629. [Google Scholar] [CrossRef]
- Silagadze, Z. A new algorithm for automatic photopeak searches. Nucl. Instrum. Methods Phys. Res. Sect. A Accel. Spectrometers Detect. Assoc. Equip. 1996, 376, 451–454. [Google Scholar] [CrossRef]





| Parameter | Setting or Value |
|---|---|
| Batch size | 128 |
| Type of loss function | CrossEntropyLoss |
| Weight decay | 0.001 |
| Learning rate (initial) | 0.0009 |
| Learning rate (schedule) | |
| Optimizer | AdamW |
Disclaimer/Publisher’s Note: The statements, opinions and data contained in all publications are solely those of the individual author(s) and contributor(s) and not of MDPI and/or the editor(s). MDPI and/or the editor(s) disclaim responsibility for any injury to people or property resulting from any ideas, methods, instructions or products referred to in the content. |
© 2025 by the authors. Licensee MDPI, Basel, Switzerland. This article is an open access article distributed under the terms and conditions of the Creative Commons Attribution (CC BY) license (https://creativecommons.org/licenses/by/4.0/).
Share and Cite
De Vita, A.; Abhishek; Aehle, M.; Awais, M.; Breccia, A.; Carroccio, R.; Chen, L.; Dorigo, T.; Gauger, N.R.; Keidel, R.; et al. Hadron Identification Prospects with Granular Calorimeters. Particles 2025, 8, 58. https://doi.org/10.3390/particles8020058
De Vita A, Abhishek, Aehle M, Awais M, Breccia A, Carroccio R, Chen L, Dorigo T, Gauger NR, Keidel R, et al. Hadron Identification Prospects with Granular Calorimeters. Particles. 2025; 8(2):58. https://doi.org/10.3390/particles8020058
Chicago/Turabian StyleDe Vita, Andrea, Abhishek, Max Aehle, Muhammad Awais, Alessandro Breccia, Riccardo Carroccio, Long Chen, Tommaso Dorigo, Nicolas R. Gauger, Ralf Keidel, and et al. 2025. "Hadron Identification Prospects with Granular Calorimeters" Particles 8, no. 2: 58. https://doi.org/10.3390/particles8020058
APA StyleDe Vita, A., Abhishek, Aehle, M., Awais, M., Breccia, A., Carroccio, R., Chen, L., Dorigo, T., Gauger, N. R., Keidel, R., Kieseler, J., Lupi, E., Nardi, F., Nguyen, X. T., Sandin, F., Schmidt, K., Vischia, P., & Willmore, J. (2025). Hadron Identification Prospects with Granular Calorimeters. Particles, 8(2), 58. https://doi.org/10.3390/particles8020058


