Article

RNA-Seq Analysis of Neuronal Gene Expression Changes in Rat Müller Glia-Derived rMC-1 Cells Under Treatment with Compounds Promoting Photoreceptor Differentiation


1
Laboratory of Visual Neuroscience, Molecular Medical Science, Division of Agriculture, Iwate University, 4-3-5 Ueda, Morioka 020-8551, Japan
2
Sensory Functions Section, Research Institute, National Rehabilitation Center for Persons with Disabilities, 4-1 Namiki, Tokorozawa 359-8555, Japan
3
Laboratory of Cell Engineering and Molecular Genetics, Molecular Medical Science, Division of Agriculture, Iwate University, 4-3-5 Ueda, Morioka 020-8551, Japan
4
Laboratory of Cell Biochemistry, Molecular Medical Science, Division of Agriculture, Iwate University, 3-18-8 Ueda, Morioka 020-8550, Japan
*
Author to whom correspondence should be addressed.
Neuroglia 2026, 7(1), 8; https://doi.org/10.3390/neuroglia7010008
Submission received: 19 January 2026 / Revised: 26 February 2026 / Accepted: 4 March 2026 / Published: 7 March 2026

Abstract

Background: The principal glial cells of the retina, Müller glia, play a central role in retinal regeneration in teleost fish and have recently attracted attention as potential sources of neuronal regeneration in mammals. Objectives: In this study, we examined whether SV40-immortalized rat Müller glia could be directed toward neuronal differentiation using a non-genetic approach with defined culture conditions. Methods: Comprehensive transcriptomic profiling by RNA sequencing indicated that changes in culture medium alone could induce transcriptional reprogramming toward a neuronal lineage. Results: Specifically, expression of Müller glia-related genes decreased, while a subset of photoreceptor-related transcription factors and specific genes showed altered expression, suggesting early-stage induction toward a photoreceptor-like fate. This finding suggests that even immortalized cells may exhibit activation of neuronal genes through non-genetic culture interventions. Gene set enrichment analysis further revealed upregulation of pathways related to the synaptic vesicle cycle, metabolic activation, oxidative stress defense, and lysosomal function, consistent with initiation of neuronal differentiation. Conversely, pathways associated with cell cycle regulation and stemness signaling were downregulated, reflecting a transition from a proliferative to a differentiation-prone state. Collectively, these results provide preliminary molecular markers for early neuronal induction and potential targets for chemical screening. Conclusions: Importantly, this strategy enables neuronal-like differentiation of Müller glia without genetic manipulation, offering a safe and cost-effective platform. Overall, our findings may support the development of in vitro models for retinal neuroregeneration and facilitate research toward regenerative therapies for retinal disorders.

1. Introduction

Vision relies on the precise organization and function of diverse neuronal cell types in the retina, including photoreceptors and horizontal, bipolar, amacrine, and retinal ganglion cells. Photoreceptors are essential for visual perception because they convert light stimuli into electrical signals that are transmitted through retinal circuits to the brain. Degeneration or loss of photoreceptors occurs in retinal diseases such as retinitis pigmentosa and age-related macular degeneration. This leads to irreversible blindness because the regenerative capacity of the adult mammalian retina is limited. Therefore, the development of strategies to regenerate or replace lost photoreceptors has become a major focus of research into retinal regeneration [1,2].
Direct reprogramming enables the conversion of a differentiated cell type into another through the forced expression of specific transcription factors [3]. This is a powerful tool for inducing neuronal regeneration in Müller glia [4,5]. Achaete-scute homolog 1 (Ascl1) induces reprogramming from Müller glia to retinal neurons [6,7] whereas combinations of photoreceptor-related transcription factors such as cone-rod homeobox protein (Crx), neural retina-specific leucine zipper protein (Nrl), and orthodenticle Homeobox 2 (Otx2) can drive Müller glia toward a photoreceptor-like fate [8]. In contrast, some chemical compounds such as cell signaling inhibitors improve the efficiency of photoreceptor differentiation [9,10]. However, in cell fate conversion induced by non-genetic interventions, key issues such as differentiation efficiency, cell subtype specificity, and functional maturation remain insufficiently characterized. Because thorough evaluation of these aspects requires multifaceted analyses, including morphological and functional assessments, it is essential first to clarify the molecular changes that occur during this process. In particular, before assessing differentiation efficiency or functional maturation, it is important to determine to what extent non-genetic, pharmacological conditions alone can induce neuron-like transcriptional states, especially in immortalized Müller glia-derived cells, whose differentiation capacity may be more restricted than that of primary cells. Immortalized cell lines offer high reproducibility and experimental accessibility; however, the degree to which their intrinsic transcriptional plasticity can be harnessed by pharmacological cues alone remains unclear.
Therefore, prior to detailed evaluation of differentiation efficiency and functional maturation, the present study focused on changes in neuron-related gene expression in Müller glia under non-genetic conditions. Müller glia are known to contribute to retinal regeneration following injury in teleost fish, highlighting their potential as a source of neuronal regeneration [11]. In this study, rat Müller glia-derived rMC-1 cells were cultured under conditions containing multiple compounds previously reported to promote photoreceptor differentiation, and RNA sequencing was employed to comprehensively characterize transcriptional profile changes induced by differences in culture conditions.

2. Materials and Methods

2.1. Cell Culture

Immortalized rat retinal Müller cells (rMC-1 cells) transformed with the SV40 large T antigen (T0576) were obtained from Applied Biological Materials Inc. (Richmond, BC, Canada). Cells were seeded at a density 4 × 10⁴ cells/cm2 in atelocollagen-coated culture plates (Koken Co., Tokyo, Japan). Cells were cultured in Dulbecco’s modified Eagle’s medium (DMEM) supplemented with 10% fetal bovine serum, 1× Antibiotic-Antimycotic solution, 1× GlutaMax (all from Thermo Fisher Scientific Inc., Waltham, MA, USA) and 0.35% D-glucose (FUJIFILM Wako Pure Chemical Corp., Osaka, Japan; rMC-1 medium).

2.2. Culture Medium Replacement

One day later, cells were gently washed with basal DMEM, and subsequently cultured in serum-free medium (SFM) containing 0.35% D-glucose, 1% GlutaMax, and 5 µg/mL Fibronectin (Thermo Fisher Scientific Inc.) in DMEM. Thereafter, half of the SFM was replaced on alternating days for 4 d, then the cells were cultured for up to 4 weeks in PDM consisting of DMEM containing 0.35% D-glucose, 1% GlutaMax, 5 µg/mL of fibronectin, 2% B27 supplement and 500 µM of valproic acid (both from Thermo Fisher Scientific Inc.), 4.8 µM CHIR-99021 (Cayman Chemical, Ann Arbor, MI, USA), which is a selective inhibitor of glycogen synthase kinase-3β (GSK-3β), 10 µM forskolin (Fujifilm Wako Pure Chemical Corp., Osaka, Japan), 500 nM retinoic acid (Sigma-Aldrich Corp., St. Louis, MO, USA), and 10 µM γ-secretase inhibitor IX (DAPT; Merck KGaA, Darmstadt, Germany). The PDM was replaced every other day. Concurrently with culture in PDM, rMC-1 cells were maintained in standard rMC-1 medium and designated as the Control group.

2.3. RNA-Seq and Data Processing

We extracted total RNA from cultured cells (n = 3) using Maxwell® RSC simplyRNA Tissue Kits (Promega Corp., Madison, WI, USA) and isolated mRNAs using the NEBNext® Poly(A) mRNA Magnetic Isolation Module (New England Biolabs Corp., Ipswich, MA, USA). A cDNA library was constructed using NEBNext Ultra II Directional RNA Library Prep Kits (New England Biolabs Corp.). We then applied paired-end 150 bp sequencing of poly A-tailed RNA on an Illumina NovaSeq X Plus system (Illumina Inc., San Diego, CA, USA). For each experimental group, three biological replicates were collected. All sequence reads were processed using Fastp v. 0.24.0 for quality filtering, adaptor trimming, and removing low-quality bases [12,13]. A summary of the FastQC results for each sample is provided in Table S4. We evaluated the quality of the filtered reads using FastQC v. 0.12.1, aligned them to the National Center for Biotechnology Information (NCBI) rat reference genome (GRCr8) using STAR, v. 2.7.11b [14], then obtained gene-level read counts using the featureCounts program in the Subread package v. 2.1.1 [15,16]. Summaries of the STAR alignment results and featureCounts quantification results are presented in Tables S5 and S6, respectively. Raw sequence reads were uploaded to the Sequence Read Archive database of the NCBI (Bethesda, MD, USA). We analyzed gene expression dynamics during retinal development, then downloaded mouse retinal RNA-seq data between embryonic day 11 to postnatal day 28 from the Gene Expression Omnibus (GEO; accession number GSE101986). Processed read count matrices were downloaded from GEO [17]. These matrices were used directly without realignment or further quantification.

2.4. Principal Component Analysis and Enrichment of Transcriptome Profiles

For principal component analysis and enrichment of transcriptome profiles, raw count data were normalized and transformed into a matrix using the DESeq2 package (v1.48.1) in R [18], and principal component analysis (PCA) was subsequently performed to assess sample relationships. The PCA results were visualized using the ggplot2 package v. 4.0.0 in R [19], and the variance explained by each principal component is indicated on the axes. Similarities between samples were further evaluated by hierarchical clustering based on Euclidean distances using complete linkage. A dendrogram was generated and visualized the data using the ggplot2 package in R.

2.5. Detection of Differentially Expressed Genes and Enrichment Analysis

Data were normalized using the DESeq2 package and false discovery rates (FDRs) were corrected based on the Benjamini–Hochberg method using a graphical user interface for the Tag Count Comparison package in R. The threshold for differentially expressed genes (DEGs) was FDR < 0.05. Functional enrichment was analyzed using g: Profiler with the g: GO St multiple test correction method at a significance threshold of FDR < 0.05 [20]. Significant GO Biological Process terms identified by enrichment analysis were visualized as dot plots using the ggplot2 package and p values were adjusted considering the significance threshold of FDR < 0.05. Dot sizes represent the number of genes annotated to the corresponding term, and colors indicate −log10 (FDR). Terms were ordered by descending gene ratios, and the axis text size was adjusted to ensure readability. Upregulated DEGs in each comparison between experimental groups were visualized by mapping them onto the KEGG pathways of “Synaptic vesicle cycle” (rno04721) and “Cell cycle” (rno04110) using the KEGG Mapper color Tool [21,22].

2.6. Detection of DEGs and Enrichment Analysis

Based on normalized data, we visualized selected target genes expressed by experimental groups using dot plots and heat maps for retinal cell type-specific Müller glia and photoreceptor marker genes. Z-scores were calculated from marker gene values to visualize data as colors in heat maps generated using Morpheus software [23]. Hierarchical clustering was based on Euclidean distances between samples determined using complete linkage.

2.7. RT-qPCR

Total RNA from cells was extracted using the Absolutely RNA Miniprep Kit (Agilent Technologies, Tokyo, Japan) and ReliaPrepTM RNA Cell Miniprep System (Promega, Tokyo, Japan), respectively. For qRT-PCR validation, each experimental group included 2 biological replicates, with 3 technical replicates each, for a total of n = 6. cDNA was synthesised using the ReverTra Ace® qPCR RT Master Mix with gDNA remover (TOYOBO, Osaka, Japan). RT-qPCR was performed using the SsoAdvancedTM Universal SYBR® Green Supermix (Bio-Rad Laboratories, Tokyo, Japan). The primers used are listed in Table 1. RNA expression levels were quantified using the CFX Connect Real-Time PCR Analysis System (Bio-Rad Laboratories). Gapdh was used as the reference gene, and expression was quantified using the comparative Ct method.

2.8. Immunocytochemistry

Cells were cultured on collagen-coated culture slides (Corning, Inc., Corning, NY, USA) and fixed in 4% paraformaldehyde at room temperature for 10 min. The fixed cells were permeabilised with 0.1% Triton-X in TBS for 10 min and blocked in 1% bovine serum albumin (Sigma-Aldrich Corp), 3% normal goat serum (abcam, Cambridge, UK) in TBST for 1 h. Primary antibodies or isotype control were incubated overnight at 4 °C. The culture slides were incubated with secondary antibodies for 1 h at room temperature, and mounted with DAPI Fluoromount-G (Southern Biotechnology Associates Inc., Birmingham, AL, USA). Images were taken on an Axiovert200M (Carl Zeiss, Oberkochen, Germany). The antibodies and isotype control used are provided in Table 2.

2.9. Data Analysis Using ChatGPT

Numerous upregulated and downregulated KEGG pathways were identified using enrichment analysis. To facilitate the conceptual organization and interpretation of the extracted pathway information, ChatGPT (OpenAI, San Francisco, CA, USA; GPT-4) was used as a supportive tool. All biological interpretations were independently evaluated by the authors.

2.10. Statistical Analysis

Differential expression and enriched RNA-seq data were analyzed in triplicate using the Benjamini–Hochberg method for FDR correction. Values with FDR < 0.05 were considered statistically significant.

3. Results

3.1. PDM Induces Morphological and Transcriptomic Changes in rMC-1 Cells

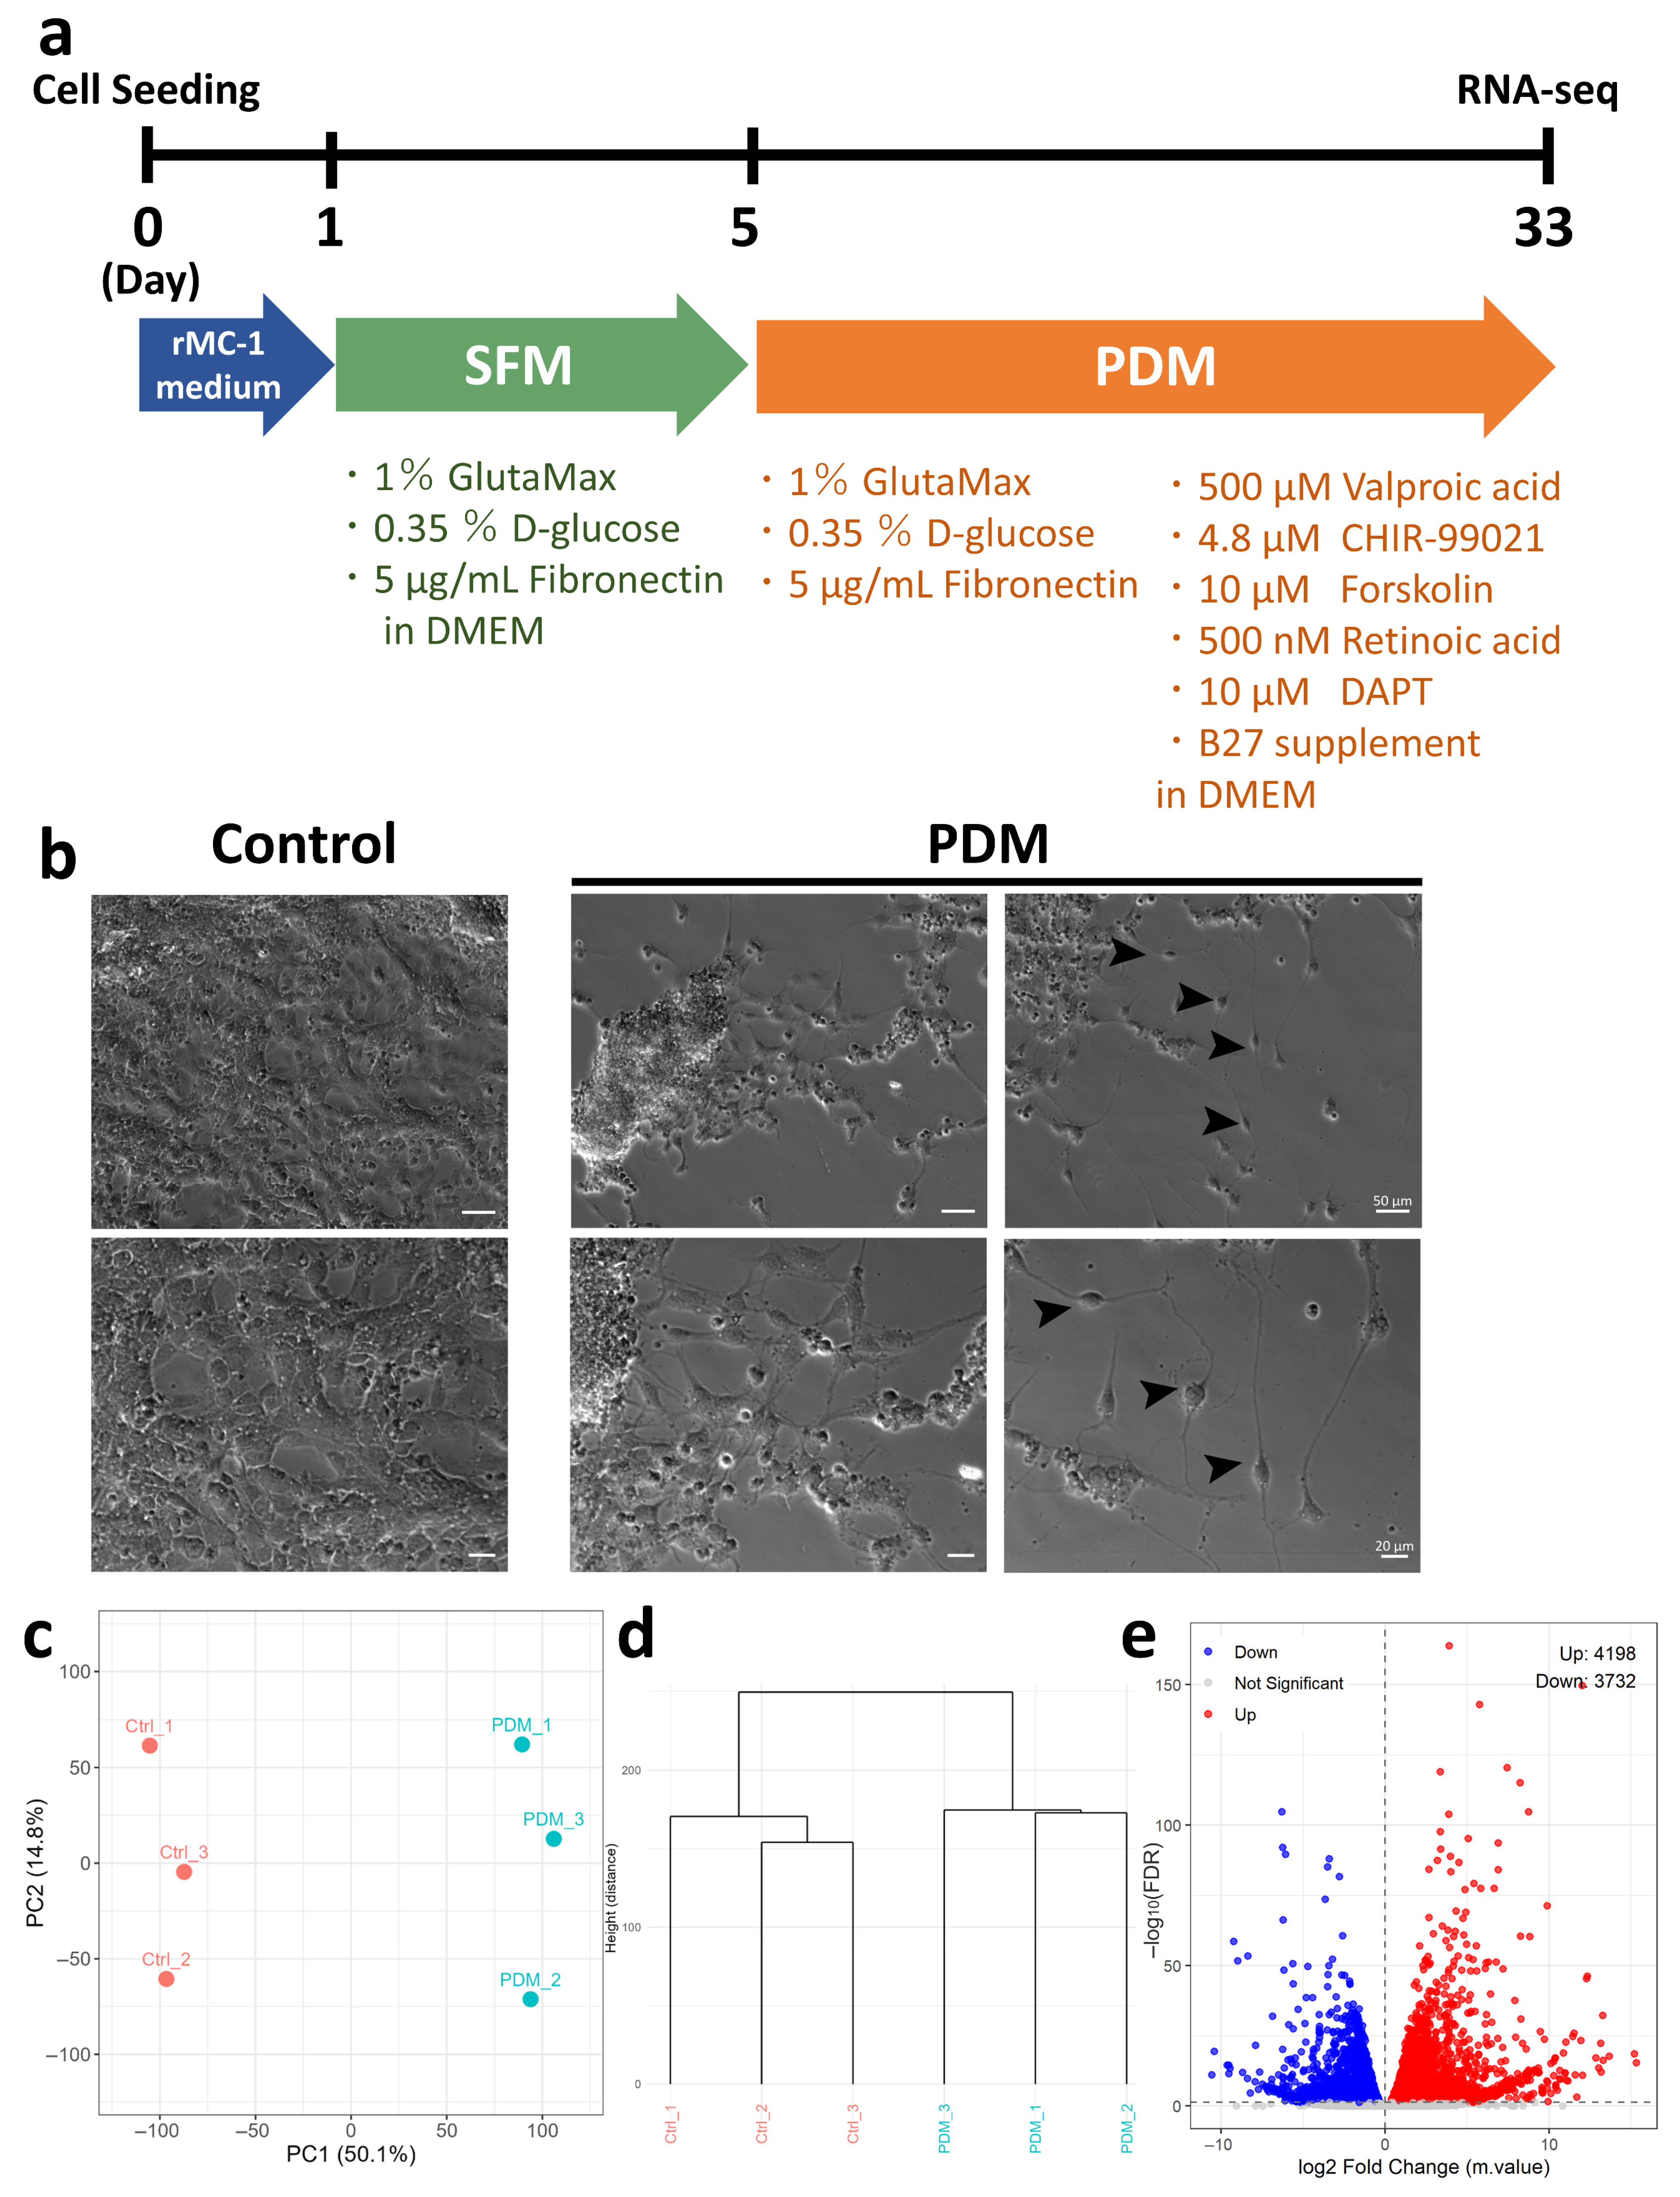
rMC-1 cells derived from Müller glia were cultured in photoreceptor differentiation medium (PDM), a combination of small molecules that promote photoreceptor differentiation. To assess the impact of PDM on global gene expression profiles, we performed PCA, hierarchical clustering, and volcano plot analyses. Triplicate independent experiments were conducted to control for variation between experiments (Figure 1a). Under the Control condition, rMC-1 cells predominantly exhibited a flattened morphology. In contrast, cells cultured in PDM displayed elongated, radially extending processes, as well as a neuron-like morphology characterized by a round cell body with two thin, long processes (indicated by arrowheads) (Figure 1b).
The PCA results revealed clear separation of each group (Figure 1c) and clustered biological replicates within each group indicated high reproducibility (Figure 1d). A volcano plot revealed 4198 and 3732 significantly upregulated and downregulated genes, respectively, between the groups (Figure 1e). These analyses demonstrated a clear separation in gene expression patterns between the PDM-treated and control groups, confirming that PDM treatment induces broad transcriptional changes.

3.2. PDM Induces Changes in Photoreceptor- and Müller Glia-Specific Gene Expression

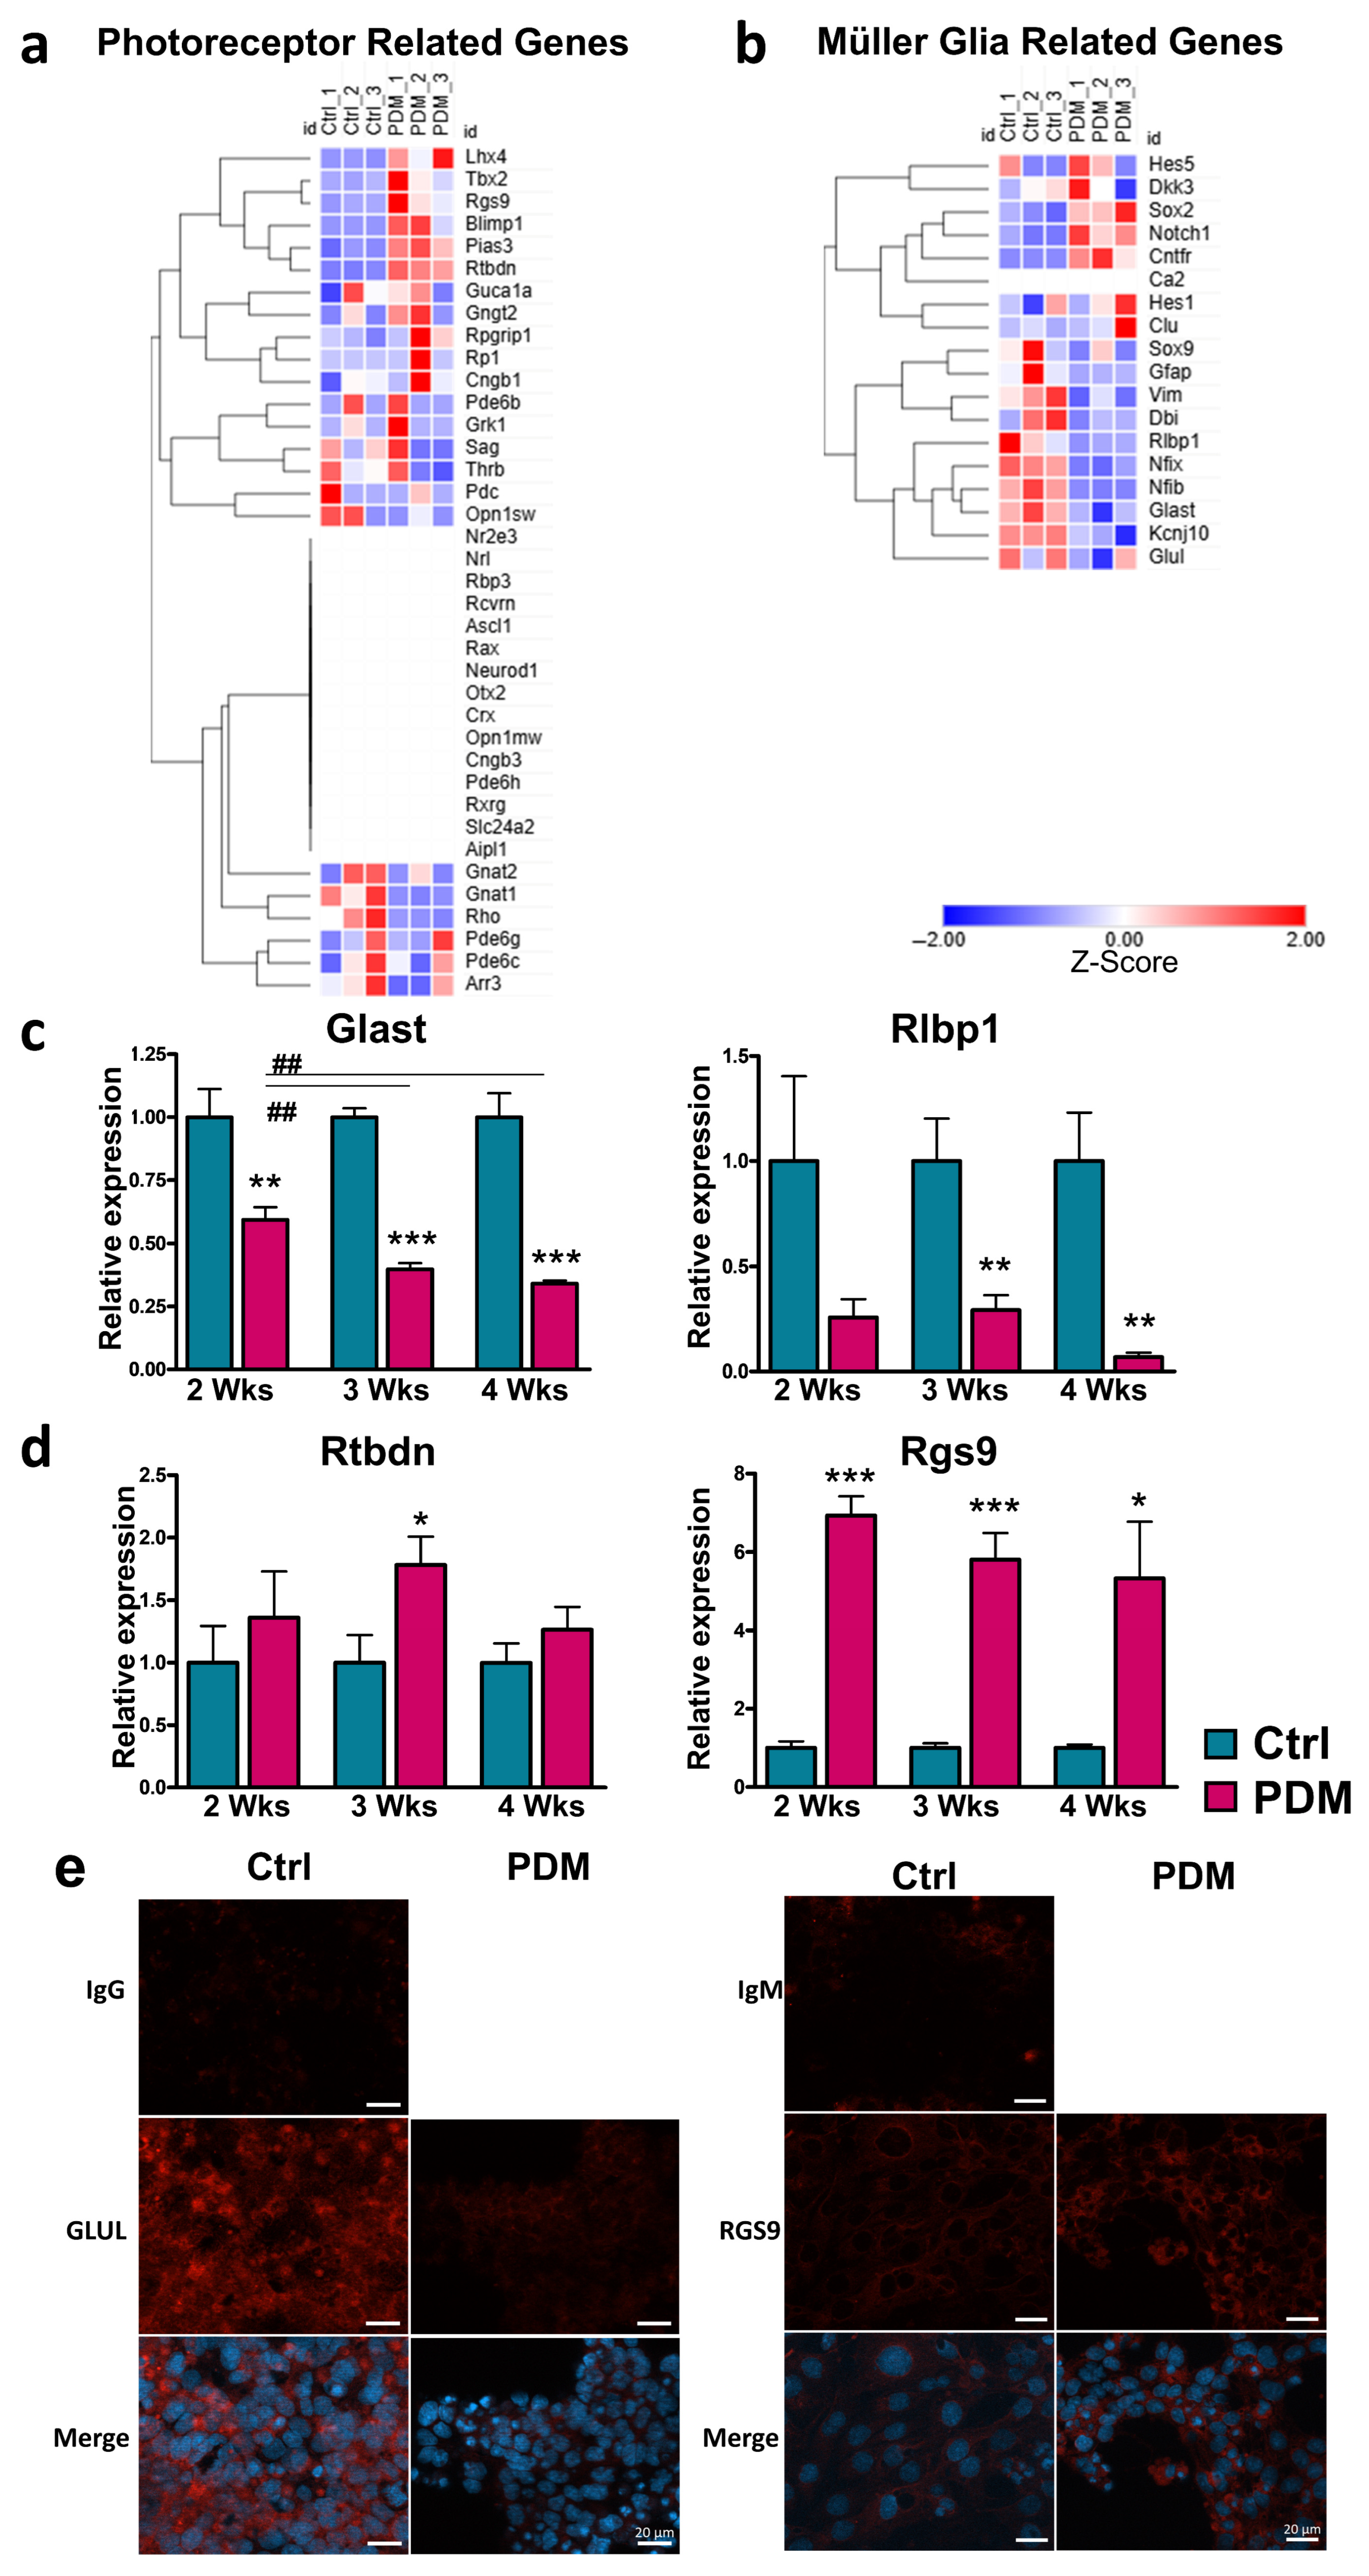
Next, to evaluate the impact of PDM treatment on the expression of Müller glia-specific and photoreceptor-specific genes, we quantified gene expression changes using RNA-seq analysis and visualized them in a heatmap. Selected genes were further validated by RT-qPCR. The photoreceptor-specific genes, LIM homeobox 4 (Lhx4), T-Box transcription factor 2 (Tbx2), Regulator of G protein signaling 9 (Rgs9), B lymphocyte—induced maturation protein (Blimp1), protein inhibitor of activated STAT 3 (Pias3), and Retbindin (Rtbdn) were upregulated. (Figure 2a, Table 3). In contrast, transcripts of key photoreceptor transcription factors (Crx, Nrl, and Nr2e3) were not detected in our RNA-seq dataset under PDM conditions. Meanwhile, the dedifferentiation markers Notch Receptor 1 (Notch1), SRY-box transcription factor 2 (Sox2), and ciliary neurotrophic factor receptor were confirmed (Table 4) in Müller cells cultured with PDM. In contrast, the Müller glia-specific glial fibrillary acidic protein (Gfap), vimentin (Vim), nuclear factor I B (Nfib), glutamate/aspartate transporter, and retinaldehyde-binding protein 1 (Rlbp1) genes were substantially downregulated (Figure 2b, Table 4). These results suggested that rMC-1 cells underwent dedifferentiation when cultured in PDM.
To validate the RNA-seq results and assess the temporal effects of PDM treatment, representative Müller glia-related genes (Glast, Rlbp1) and photoreceptor-related genes (Rtbdn, Rgs9) used in the heatmap were selected for RT-qPCR analysis at 2, 3, and 4 weeks of PDM culture (Day 19, Day 26, Day 33). In the PDM-treated group, the Müller glia-specific gene Glast was downregulated compared with the control at week 2, with further decreases at weeks 3 and 4. Rlbp1 also showed reduced expression starting from week 3 (Figure 2c). For photoreceptor-specific genes, Rtbdn was significantly upregulated at week 3, while Rgs9 expression increased at weeks 2 and 3, with a smaller difference observed at week 4 (Figure 2d). Although the timing of peak expression varied among genes, overall, PDM treatment resulted in a consistent pattern of decreased expression of Müller glia-related genes and increased expression of photoreceptor-related genes. These results indicate that PDM culture induces gene expression changes in a time-dependent manner, supporting the RNA-seq findings and highlighting a shift in gene expression patterns toward a photoreceptor-like profile.
To assess the effects of PDM culture on protein expression, immunofluorescence staining was performed for the Müller glia marker GLUL and the photoreceptor marker RGS9. In the control group, GLUL-positive cells were readily detected, whereas GLUL fluorescence was markedly reduced to near-background levels in cells cultured in PDM. RGS9 staining was weakly observed in the control group but was increased in cells cultured in PDM. For both markers, the majority of observed cells exhibited positive staining, and localization was uniform throughout the cytoplasm. These findings indicate that culture in PDM leads to decreased GLUL expression and increased RGS9 expression, consistent with the RNA-seq and RT-qPCR results.

3.3. PDM Upregulates Neuron-like Transcriptional Programs and Downregulates Proliferation

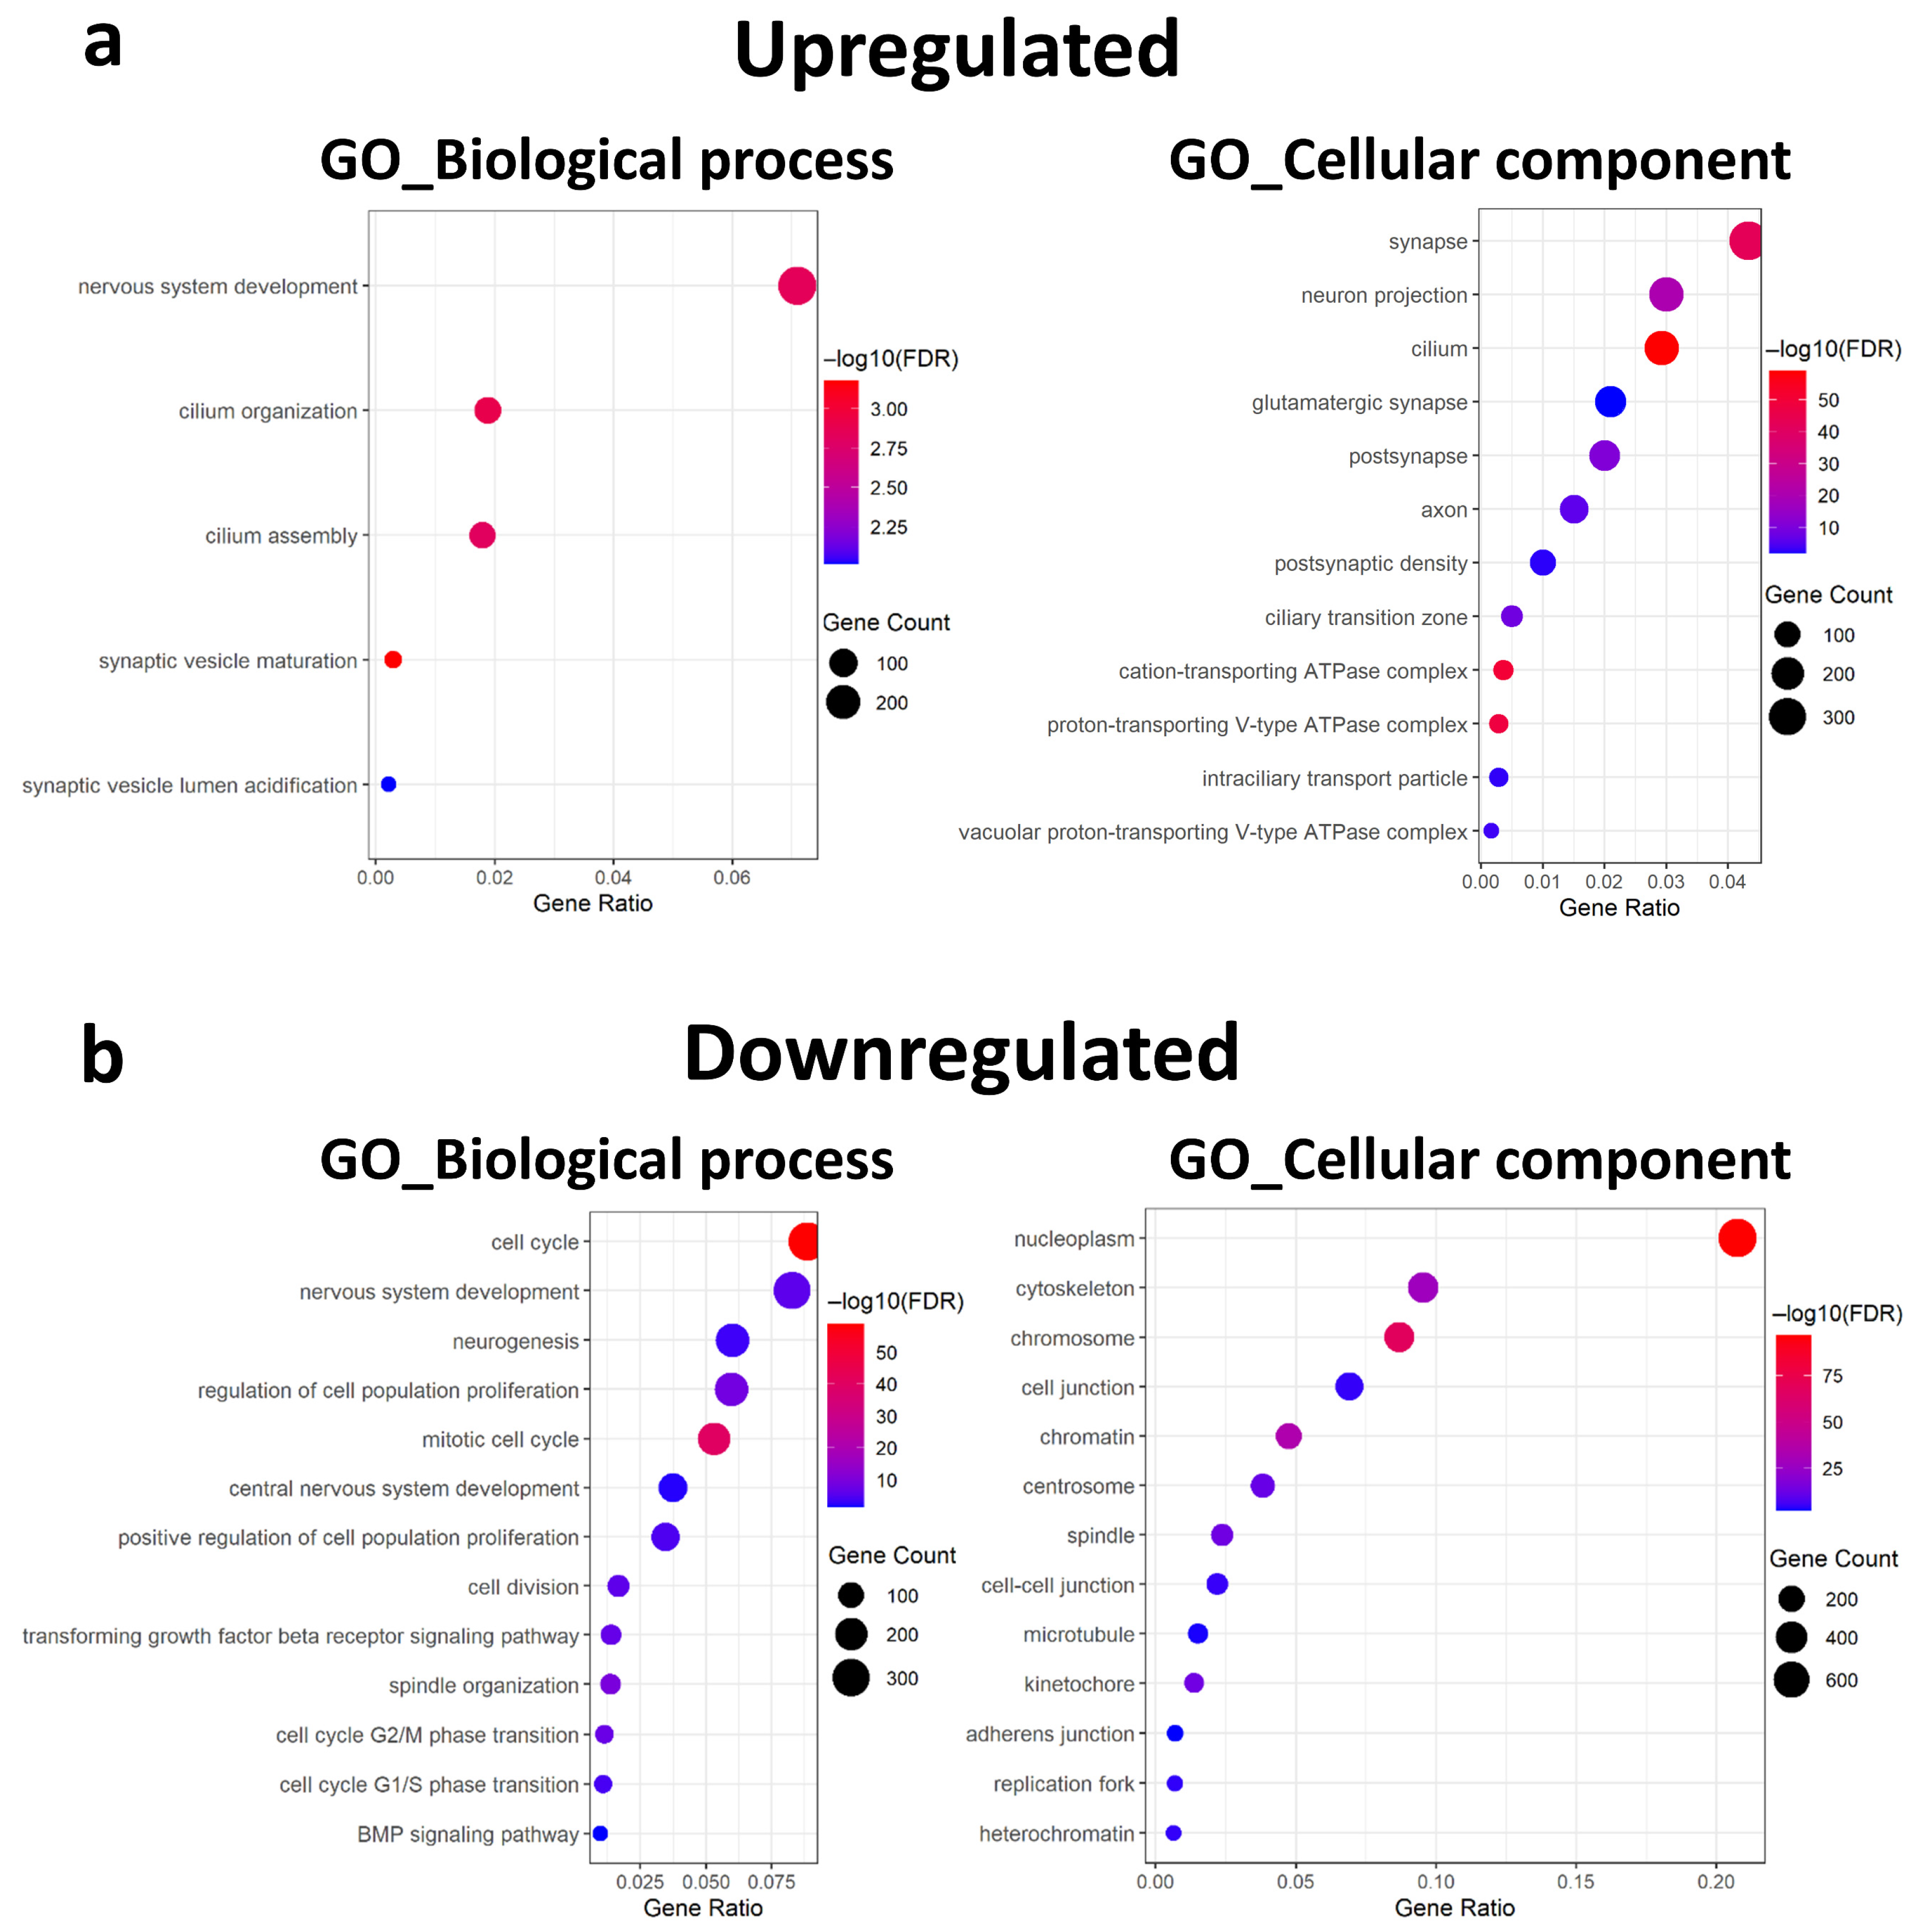
To assess the structural and functional changes induced in rMC-1 cells by culture in PDM, we performed Gene Ontology (GO) enrichment analyses for Biological Process and Cellular Component categories. The Top ranking GO terms of biological processes, including biological regulation (GO:0065007), regulation of biological processes (GO:0050789), and response to stimulus (GO:0050896) that are often found in genes expressing transduced cells, indicated altered cellular functions (Table S1; Biological Process). The GO terms associated with neuronal features such as synaptic vesicle maturation (GO:0016188), cilium organization (GO:0044782), nervous system development (GO:0007399), and cilium assembly (GO:0060271) were upregulated (Figure 3a), as well as cellular components such as cytoplasm (GO:0005737) and membrane (GO:0016020) etc. We also detected GO terms associated with neuronal features (Figure 3a, Table S1; Cellular Component). GO enrichment analysis of upregulated genes revealed terms related to neural processes and structures, including neurogenesis, synaptic vesicles, neurons, axons, and cilia. In contrast, downregulated genes were enriched for terms associated with cell proliferation (GO:0007049) and cell adhesion (GO:0030054) (Figure 3b, Table S2). These results suggest that PDM treatment may induce neuronal-like transcriptional tendencies while suppressing proliferation in rMC-1 cells.

3.4. PDM Induces Enhanced Clearance, Extracellular Remodeling, and Reduced Proliferation

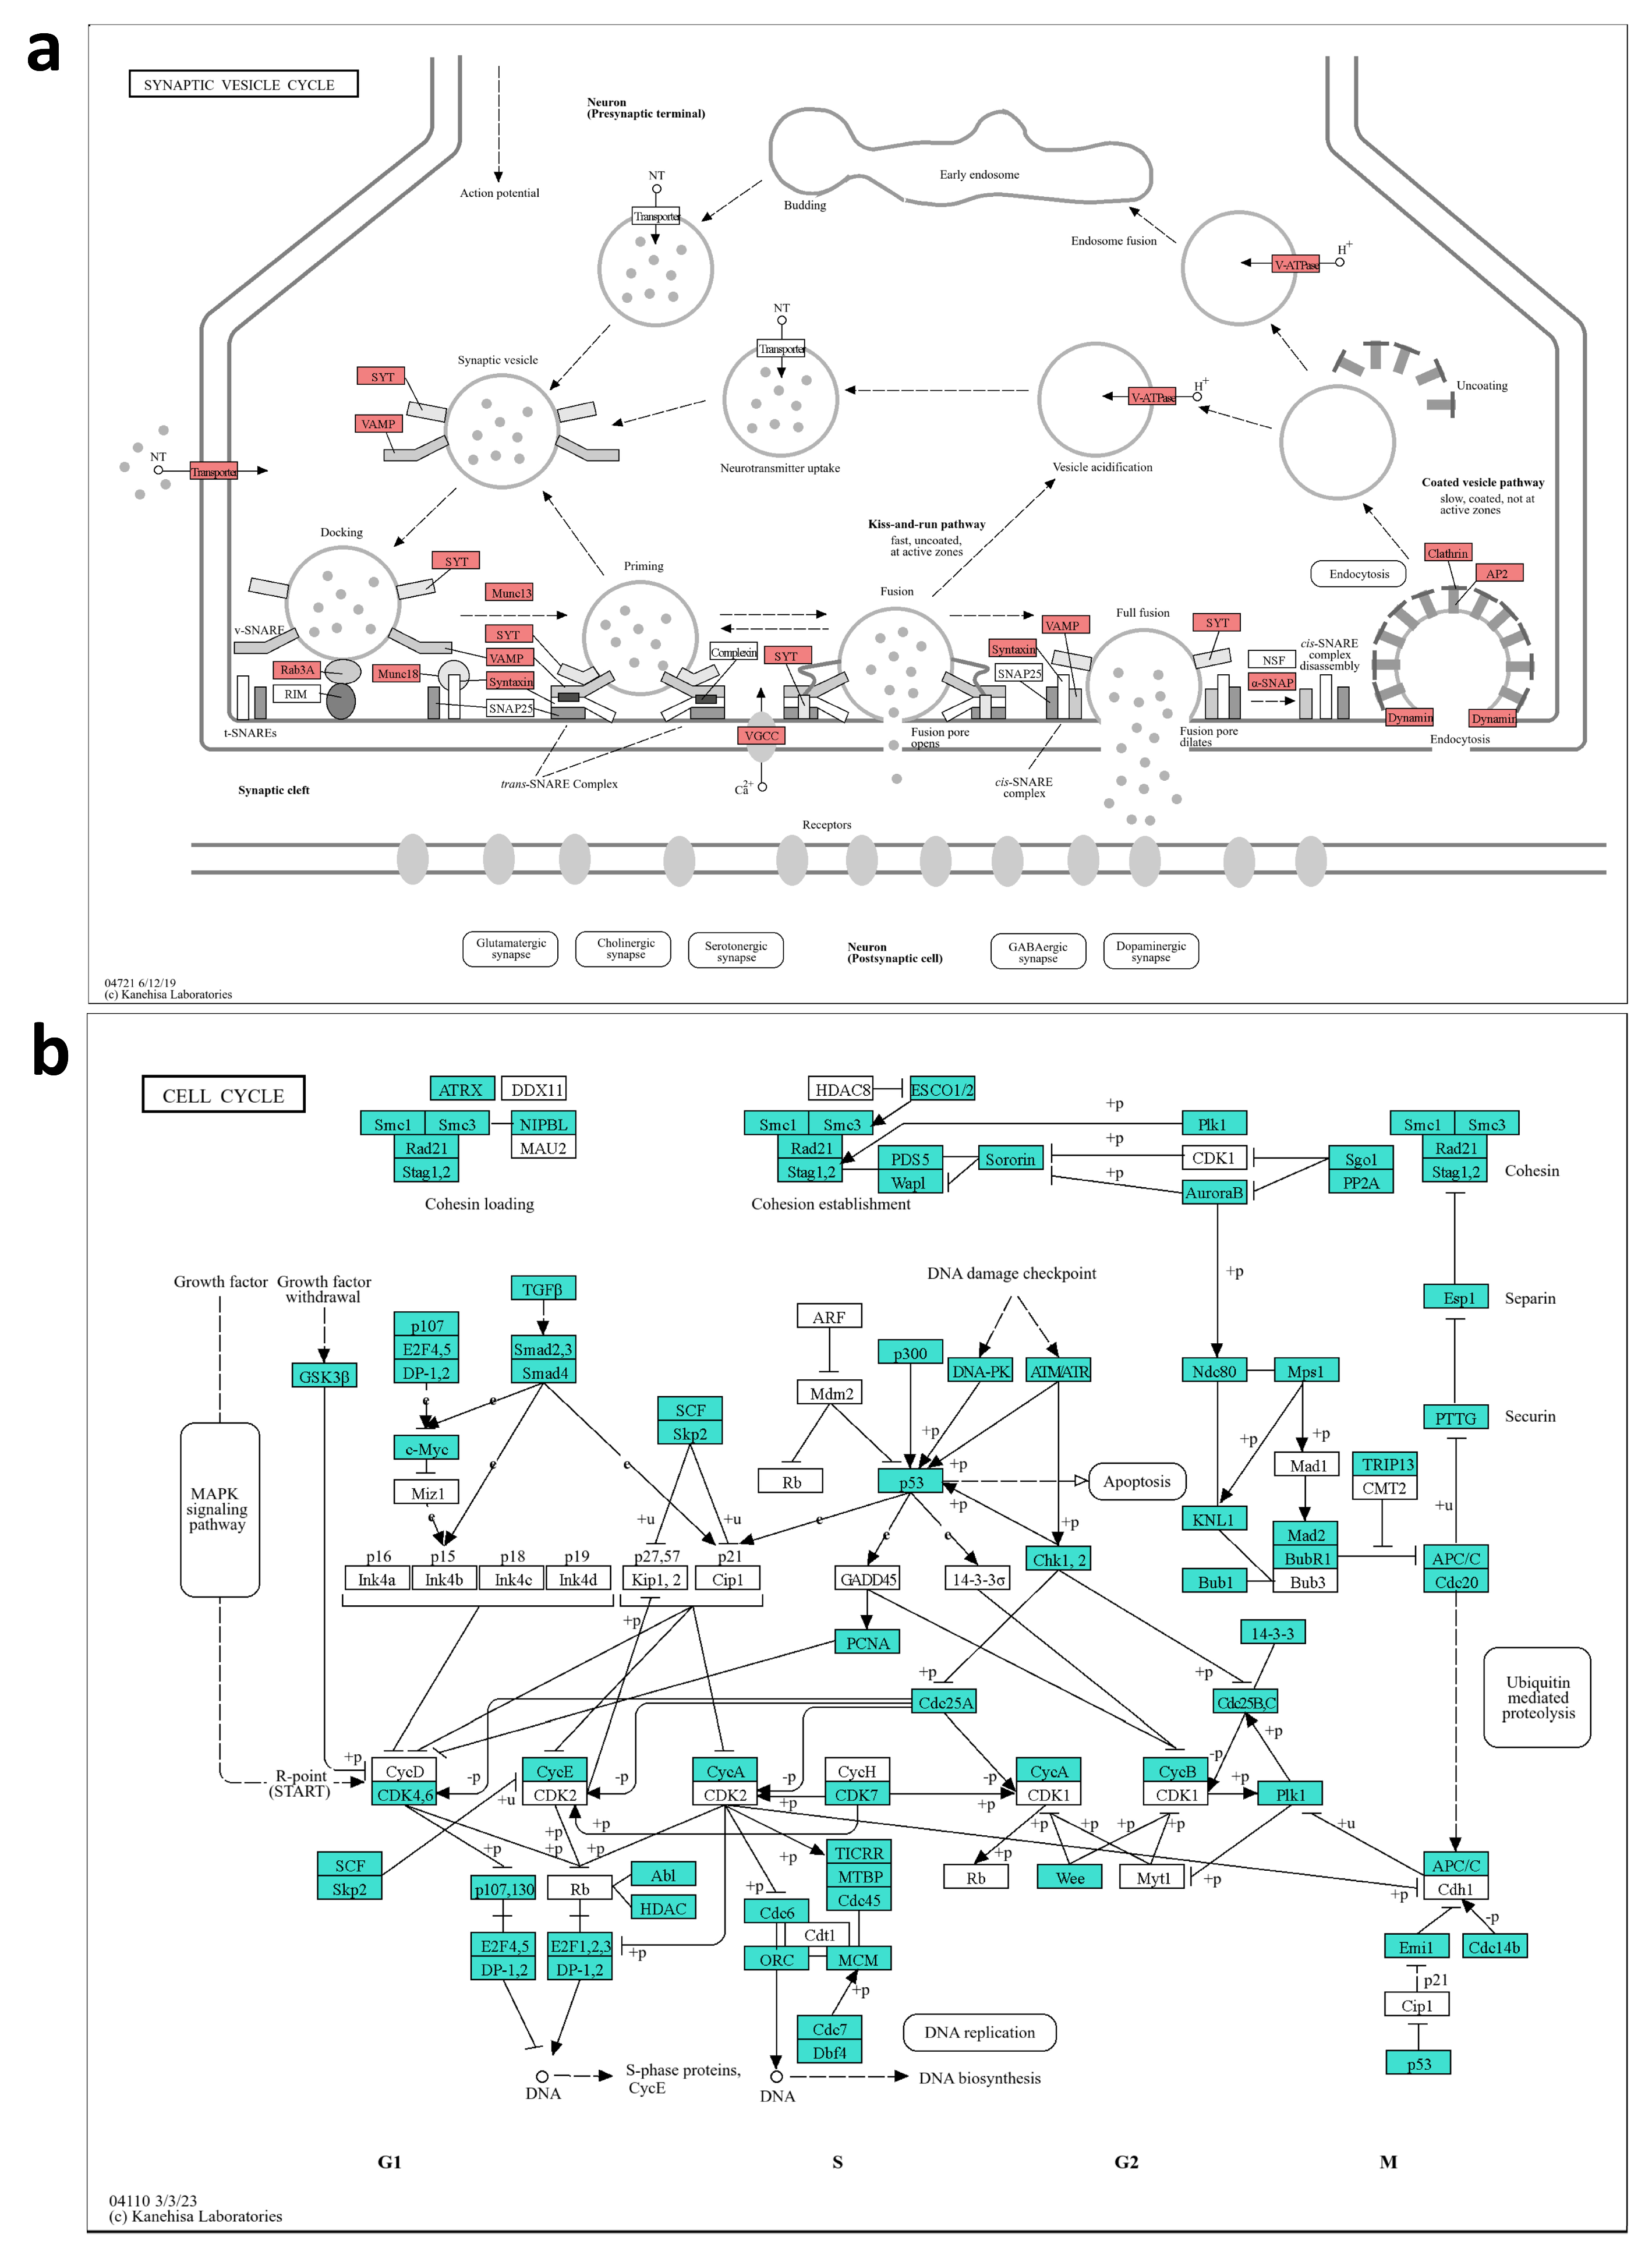
To gain insight into the signaling and metabolic pathways potentially affected in rMC-1 cells cultured in PDM, we performed KEGG pathway enrichment analysis. We mapped numerous upregulated and downregulated genes in various KEGG pathways (Table S3). The characteristics of cells cultured in PDM were difficult to grasp due to the multitude of involved pathways. Therefore, ChatGPT was used as a supportive tool to aid in the conceptual organization of pathway-related information. The upregulated KEGG pathways were predominantly associated with cellular stress adaptation and metabolic remodeling. Enrichment was observed in oxidative phosphorylation (rno00190, oxidative phosphorylation), peroxisome (rno04146), antioxidant metabolism (rno00480, glutathione metabolism), lysosomal pathways, autophagy (rno04142), phagosome (rno04145), and endocytosis (rno04144), suggesting a shift toward mitochondrial stress defense and increased intracellular degradation capacity. In addition, expression of the synaptic vesicle cycle pathway (rno04721; Figure 4a) was upregulated. This upregulation, together with the enhanced activity of phagosome and endocytosis pathways, further supported enhanced cellular clearance and remodeling of the extracellular environment. The downregulated KEGG pathways included cell cycle progression (rno04110; Figure 4b), DNA replication (rno03030, DNA replication), proteasome-mediated protein turnover (rno03050, proteasome), adhesion (rno04520, adherens junction), and cytoskeletal regulatory pathways (rno04810, regulation of the actin cytoskeleton). Suppressed signaling in Transforming growth factor-β (TGF-β, rno04350), Hippo (rno04390), and pluripotency-related pathways (rno04550, signaling pathways regulating pluripotency of stem cells) suggested reduced regenerative or proliferative potential. Downregulated cell junction and focal adhesion pathways implied a reduced contribution to tissue structural maintenance. In summary, rMC-1 cells cultured in PDM exhibited upregulation of pathways associated with cellular stress response, metabolic remodeling, and intracellular clearance, while pathways related to cell proliferation, regenerative potential, and tissue structural maintenance were downregulated. These findings suggest that PDM induces broad transcriptional and functional changes that shift the cells toward a state more conducive to neuronal differentiation.

4. Discussion

Terminally differentiated mammalian Müller glia possess the potential to regenerate retinal neurons, attracting considerable attention in the field of regenerative medicine. In this study, rat Müller glia-derived rMC-1 cells were cultured under conditions containing compounds reported to promote photoreceptor differentiation, and RNA sequencing was used to comprehensively analyze how culture conditions affect the expression of neuronal genes. Representative examples of genetic reprogramming include overexpression of Ascl1, which induces transcriptional reprogramming of Müller glia toward retinal neurons, and combinations of photoreceptor-related transcription factors such as Crx, Nrl, and Otx2, which drive Müller glia toward a partially photoreceptor-like phenotype. Although these approaches are powerful, precise control of expression levels and timing is challenging, and they may directly alter intrinsic transcriptional networks. In contrast, a non-genetic approach using pharmacological compounds allows graded and reversible control through compound concentration and treatment duration, making it useful for analyzing transcriptional responses based on the inherent plasticity of the cells. In this study, we focused on changes in neuronal gene expression in Müller glia under non-genetic conditions and aimed to characterize how culture conditions influence transcriptional profiles.
Based on this background, the present study aimed to analyze transcriptional responses of Müller glia-derived cells under non-genetic conditions, using compounds that have been employed in previous studies to induce photoreceptor differentiation and pharmacological reprogramming [10]. The culture conditions used in this study included multiple compounds acting at distinct molecular levels, including modulation of intracellular signaling pathways, regulation of transcriptional networks, and activation of the cAMP signaling pathway. Such compounds have been reported to promote pharmacological reprogramming toward photoreceptor-like cells in other cellular systems. Building on these findings, we examined how such non-genetic culture conditions alter transcriptional profiles in the rat Müller glia-derived rMC-1 cell line.
In this study, we investigated molecular state changes in rMC-1 cells cultured under PDM conditions. Distinct transcriptional profiles were observed compared with control cells. Among Müller glia-related genes, markers associated with immature or progenitor-like states were upregulated, whereas markers characteristic of mature Müller glia were downregulated. Notch1 and Sox2 are known to be involved in the maintenance of undifferentiated states and inhibition of terminal differentiation. Therefore, their upregulation may reflect an intermediate or reprogramming-associated state rather than reinforcement of Müller glial identity. By contrast, the downregulation of mature Müller glial markers is consistent with attenuation of Müller glia-specific molecular characteristics. With respect to photoreceptor-related genes, several markers associated with early photoreceptor commitment were upregulated, suggesting activation of lineage-related transcriptional programs. In contrast, Gnat1, which is essential for mature rod photoreceptor function, was downregulated. This suggests that the state induced under PDM culture does not correspond to fully mature photoreceptors, but rather may represent an intermediate stage during transition toward the photoreceptor lineage. Gene ontology analysis of differentially expressed genes further supported this interpretation. Genes upregulated under PDM conditions were enriched for neuronal terms such as synapse formation, axon development, and cilium organization, whereas downregulated genes were enriched for terms related to cell proliferation and cell adhesion. Together, these enrichment patterns are consistent with reduced proliferation and partial neuronal induction under PDM culture. In addition to molecular changes, marked alterations in cellular morphology were observed. rMC-1 cells cultured under PDM conditions progressively extended elongated processes and acquired a neuron-like morphology, supporting the presence of coordinated transcriptional and phenotypic remodeling.
The PDM used in this study consists of a combination of five compounds: valproic acid, CHIR99021, Forskolin, retinoic acid, and DAPT. Forskolin promotes neuronal differentiation by increasing intracellular cAMP levels through activation of adenylate cyclase [24]. Retinoic acid regulates gene expression via retinoic acid receptors (RARs) and retinoid X receptors (RXRs) and is known to contribute to photoreceptor lineage specification [25]. DAPT, a γ-secretase inhibitor, suppresses Notch signaling and has been reported to promote neuronal and photoreceptor differentiation [26]. In contrast, valproic acid and CHIR99021 exert effects that can maintain cells in undifferentiated or intermediate neural progenitor-like states through histone deacetylase inhibition and activation of Wnt signaling, respectively [27,28,29]. As a result, the differentiation-promoting effect of Notch inhibition may have been modulated by concurrent activation of Wnt signaling and histone acetylation pathways under the present culture conditions.
We used transcriptome data from the developing mouse retina and determined that the Blimp1, Tbx2, Pias3, Lhx4, Rtbdn, and Rgs9 genes peaked on the following postnatal (P) days P2, P2, P10, P14, P21, and P28, respectively (Figure S1) [30]. Both Blimp1 and Tbx2 peaked early, around P2, and Blimp1 was already induced. Therefore, the transcriptional changes observed under PDM culture may partially resemble early postnatal developmental patterns. However, among 48 retinal cell-related genes examined, only six were significantly upregulated. Moreover, the key photoreceptor transcription factors Crx, Nrl, and nuclear receptor subfamily 2 group E member 3 (Nr2e3), and the phototransduction-related Rhodopsin (Rho), Opsin 1, Short Wave Sensitive (Opn1sw), and Opsin 1, Medium Wave Sensitive (Opn1mw) genes were not notably altered. Collectively, the cells cultured in PDM cannot be definitively assigned to a single developmental stage. Instead, the data may reflect a heterogeneous induction state, in which the features of various differentiation stages coexist. In the present study, several photoreceptor-related genes were upregulated; however, no clear induction was observed for key transcription factors that constitute the core of photoreceptor differentiation (e.g., Crx, Nrl, and Nr2e3). The lack of robust upregulation of these transcription factors suggests that the canonical transcriptional program for photoreceptor differentiation may not be fully activated under PDM conditions. Therefore, rather than indicating complete photoreceptor differentiation of rMC-1 cells, our findings are more consistent with a partial and heterogeneous induction of photoreceptor lineage-associated transcriptional changes under non-genetic culture conditions. This incomplete activation of the photoreceptor transcription factor network may be related to the increased Notch1 and Sox2 expression observed under PDM conditions, as discussed below.
The immature state may have been maintained, as Sox2 and Notch1 were increased in PDM, and their expression may promote cellular dedifferentiation such that cells remained undifferentiated [31,32] while inhibiting cell differentiation [33,34]. Notch1 notably suppresses photoreceptor differentiation by inhibiting the transcription factors Crx, Otx2, Neurod1, and Nrl, which are essential for photoreceptor development [35]. This is consistent with our observation that key photoreceptor transcription factors were not robustly induced under PDM conditions. Included in PDM are valproic acid, a histone deacetylase inhibitor, and CHIR-99021, a GSK-3β inhibitor [36,37,38], both of which are known to promote Notch1 and Sox2 activation. Future studies should investigate whether adjusting the timing of the compound administration can induce photoreceptor maturation. In addition, fibroblast or epidermal growth factors are instrumental in inducing progenitor cells from Müller cells, and activation of Wnt signaling using CHIR99021 is necessary to differentiate these progenitors into neurons during the early phase [39]. An activated signaling pathway plays an important role in differentiation into photoreceptor cells [40,41]. In our experiments, we used CHIR-99021 to activate Wnt signaling, but the expression of numerous genes involved in the Wnt signaling pathway was diminished.
The RNA-seq and KEGG pathway findings revealed distinct transcriptional reprogramming in Müller glia under stress. Specifically, oxidative phosphorylation, glutathione metabolism, lysosome, and peroxisome pathways were significantly enriched, suggesting enhanced mitochondrial activity and antioxidant capacity. Activated phagosome and endocytosis pathways further may suggest that the Müller glia increase their capacity for cellular clearance and recycling damaged components. KEGG pathway analysis revealed coordinated transcriptional changes in rMC-1 cells under PDM culture. Although the expression of synaptic vesicle cycle-related genes was increased overall, several pathways associated with cell proliferation (Figure 4a; Table S3), cell cycle regulation, and structural maintenance were significantly downregulated (Figure 4b; Table S3). Suppression of cell cycle, DNA replication, proteasomes, and ubiquitin-mediated proteolytic pathways is consistent with an overall decrease in cell turnover and protein synthesis. Furthermore, downregulated adherens junction pathways may reflect weakened intercellular adhesion and tissue integrity. The reduced activity in Hippo and TGF-β signaling, along with pathways regulating pluripotency of stem cells, may indicate that Müller glia loses their regenerative or dedifferentiation potential under these conditions. Conversely, pathways related to lysosome, autophagy, and oxidative phosphorylation were enriched, suggesting enhanced metabolic activity and intracellular quality control.
In this study, a certain degree of cell death was observed during PDM culture. Cell attrition is a phenomenon commonly associated with differentiation processes, particularly in neural systems, where subsets of cells are selectively eliminated during development and maturation [42,43]. In the present experimental context, multiple factors may have contributed to reduced cell survival. rMC-1 cells are immortalized with SV40 Large T Antigen (LT), which is known to influence cell cycle regulation. The coexistence of differentiation signals and LT-driven proliferative pressure may impose cellular stress, potentially affecting cell viability. Although serum starvation was applied to suppress proliferation, complete cell cycle arrest may not have been fully achieved. Such systems do not fully recapitulate the complex cellular interactions, extracellular matrix components, and biochemical and mechanical cues present in the native retinal environment. Moreover, SV40 Large T Antigen is known to alter cellular physiology and transcriptional regulation, which may influence differentiation responses under pharmacological stimulation. Therefore, the transcriptional changes observed in this study should be interpreted within the limitations of an immortalized in vitro model. Although cell loss was observed during PDM culture, a subset of rMC-1 cells still exhibited neuron-like morphology and photoreceptor-related transcriptional changes. At the same time, because quantitative assessment of cell death was not performed, the impact of cell loss on the observed transcriptional changes remains unresolved. This is also relevant for interpreting the bulk transcriptomic data, because selective loss of more vulnerable cells could potentially shift the apparent expression profile of the surviving population. Further investigation will be required to quantify survival rates and clarify the cellular states of the differentiation-induced population. Together, these limitations highlight the need for further analyses to better define the cellular states induced under PDM conditions.
Beyond these considerations, certain questions could not be fully addressed in the present work. Since bulk RNA-sequencing was performed, it remains unclear whether the observed changes in gene expression occur within the same cells or across different subpopulations of rMC-1 cells. Apparent “non-changes” may also partly reflect signal dilution, whereby transcriptional changes in a responsive subpopulation are averaged with non-responsive or incompletely reprogrammed cells. Therefore, the extent of cellular heterogeneity and the precise proportion of cells undergoing neuron-like transcriptional changes remain undetermined. Although transcriptional changes suggested neuronal induction, functional validation at the cellular level—such as synaptic activity, proliferation reduction, or photoreceptor-specific gene function—was not performed. The differentiation efficiency, subtype specificity, and functional maturation also remain unassessed. Quantitative evaluation of transdifferentiation efficiency will be essential to determine whether the observed transcriptional remodeling reflects partial reprogramming in a subset of cells or a coordinated shift across the population. This could be addressed by quantifying marker-positive cells (e.g., immunocytochemistry-based positivity rates and/or flow cytometry). Furthermore, this study was conducted solely using the immortalized rMC-1 cell line, which may not fully recapitulate the behavior of primary Müller glia. In addition, the rMC-1 monoculture does not recapitulate the in situ retinal environment, including cell–cell and cell–extracellular matrix interactions as well as other biochemical and mechanical cues. Caution should therefore be exercised when generalizing these findings. Future studies incorporating primary Müller glia, co-culture systems, or more physiologically relevant models will help clarify how non-genetic induction strategies operate in situ. Prospective optimization may include reinforcing photoreceptor regulatory programs, potentially via microRNA-based approaches targeting key regulators (e.g., Crx-, Nrl-, or Otx2-related networks). Finally, integration of single-cell transcriptomics, temporal lineage tracing, and functional assays will be necessary to define the trajectory and stability of PDM-induced cellular states. Comparative analyses with native photoreceptors and genetically reprogrammed photoreceptor-like cells using public transcriptomic datasets may further contextualize the transcriptional landscape observed in this study by benchmarking lineage similarity and maturation status of PDM-induced states. Taken together, the present work provides an exploratory framework for evaluating partial photoreceptor-associated transcriptional remodeling under non-genetic induction conditions in an immortalized Müller glial model.

5. Conclusions

This study demonstrated that Müller glia-derived cells can be induced toward a neuron-like transcriptional state solely by modifying the culture conditions, without the need for gene transduction. Under PDM culture, genes associated with neural-related GO terms and KEGG pathways were partially upregulated, notably those involved in the “synaptic vesicle cycle.” These genes may serve as early molecular markers of neuronal induction and could be useful for guiding chemical compound screening or for improving the efficiency of Müller glia differentiation into neurons.

Supplementary Materials

The following supporting information can be downloaded at: https://www.mdpi.com/article/10.3390/neuroglia7010008/s1, Figure S1: Expression of Lhx4, Pias3, Blimp1, Rgs9, Rtbdn, and Tbx2 in the mouse retina from embryonic day 11 to postnatal day 28; Table S1: Gene Ontogeny terms of upregulated gene; Table S2: Gene Ontogeny terms of downregulated gene; Table S3: KEGG pathways of upregulated and downregulated genes; Table S4: Summary of FastQC Results for Each Sample; Table S5: Summary of STAR Alignment Results for Each Sample; Table S6: Summary of featureCounts Quantification Results for Each Sample.

Author Contributions

Data curation and writing—original draft preparation, Y.E.; supervision, validation, and methodology, E.S., Y.S. and T.F.; supervision, K.T.; data curation, T.K., S.M. and T.Y.; methodology, T.O. and L.B.; conceptualization, review, and editing, H.T. All authors have read and agreed to the published version of the manuscript.

Funding

This research was funded by Grants-in-Aid for Scientific Research from the Ministry of Education, Culture, Sports, Science, and Technology, Japan (Grant Nos. 22KJ0150, 25H01209, 24K12798, 22K09760, and 21K18278).

Institutional Review Board Statement

Not applicable.

Informed Consent Statement

Not applicable.

Data Availability Statement

The RNA-seq datasets generated during the current study are available in the NCBI Sequence Read Archive (SRA) under BioProject ID PRJNA1295714. Other datasets used and/or analysed during the current study are available from the corresponding author upon reasonable request.

Acknowledgments

We express our heartfelt appreciation to Miho Sato of the Laboratory of Visual Neuroscience and Yoko Takahashi (formerly of the Laboratory of Visual Neuroscience) for assisting with the experimental equipment used in this study.

Conflicts of Interest

The authors declare no conflicts of interest.

References

  1. Mandai, M.; Fujii, M.; Hashiguchi, T.; Sunagawa, G.A.; Ito, S.-I.; Sun, J.; Kaneko, J.; Sho, J.; Yamada, C.; Takahashi, M. iPSC-Derived Retina Transplants Improve Vision in rd1 End-Stage Retinal-Degeneration Mice. Stem Cell Rep. 2017, 8, 69–83. [Google Scholar] [CrossRef]
  2. Tu, H.-Y.; Watanabe, T.; Shirai, H.; Yamasaki, S.; Kinoshita, M.; Matsushita, K.; Hashiguchi, T.; Onoe, H.; Matsuyama, T.; Kuwahara, A.; et al. Medium- to long-term survival and functional examination of human iPSC-derived retinas in rat and primate models of retinal degeneration. EBioMedicine 2019, 39, 562–574. [Google Scholar] [CrossRef]
  3. Wang, H.; Yang, Y.; Liu, J.; Qian, L. Direct cell reprogramming: Approaches, mechanisms and progress. Nat. Rev. Mol. Cell Biol. 2021, 22, 410–424. [Google Scholar] [CrossRef] [PubMed]
  4. Jorstad, N.L.; Wilken, M.S.; Grimes, W.N.; Wohl, S.G.; VandenBosch, L.S.; Yoshimatsu, T.; Wong, R.O.; Rieke, F.; Reh, T.A. Stimulation of functional neuronal regeneration from Müller glia in adult mice. Nature 2017, 548, 103–107. [Google Scholar] [CrossRef]
  5. Todd, L.; Jenkins, W.; Finkbeiner, C.; Hooper, M.J.; Donaldson, P.C.; Pavlou, M.; Wohlschlegel, J.; Ingram, N.; Mu, X.; Rieke, F.; et al. Reprogramming Müller glia to regenerate ganglion-like cells in adult mouse retina with developmental transcription factors. Sci. Adv. 2022, 8, eabq7219. [Google Scholar] [CrossRef] [PubMed]
  6. Wohlschlegel, J.; Finkbeiner, C.; Hoffer, D.; Kierney, F.; Prieve, A.; Murry, A.D.; Haugan, A.K.; Ortuño-Lizarán, I.; Rieke, F.; Golden, S.A.; et al. ASCL1 induces neurogenesis in human Müller glia. Stem Cell Rep. 2023, 18, 2400–2417. [Google Scholar] [CrossRef] [PubMed]
  7. Pollak, J.; Wilken, M.S.; Ueki, Y.; Cox, K.E.; Sullivan, J.M.; Taylor, R.J.; Levine, E.M.; Reh, T.A. ASCL1 reprograms mouse Muller glia into neurogenic retinal progenitors. Development 2013, 140, 2619–2631. [Google Scholar] [CrossRef]
  8. Yao, K.; Qiu, S.; Wang, Y.V.; Park, S.J.H.; Mohns, E.J.; Mehta, B.; Liu, X.; Chang, B.; Zenisek, D.; Crair, M.C.; et al. Restoration of vision after de novo genesis of rod photoreceptors in mammalian retinas. Nature 2018, 560, 484–488. [Google Scholar] [CrossRef]
  9. Fujii, Y.; Arima, M.; Murakami, Y.; Sonoda, K.-H. Rhodopsin-positive cell production by intravitreal injection of small molecule compounds in mouse models of retinal degeneration. PLoS ONE 2023, 18, e0282174. [Google Scholar] [CrossRef]
  10. Mahato, B.; Kaya, K.D.; Fan, Y.; Sumien, N.; Shetty, R.A.; Zhang, W.; Davis, D.; Mock, T.; Batabyal, S.; Ni, A.; et al. Pharmacologic fibroblast reprogramming into photoreceptors restores vision. Nature 2020, 581, 83–88. [Google Scholar] [CrossRef]
  11. Goldman, D. Müller glial cell reprogramming and retina regeneration. Nat. Rev. Neurosci. 2014, 15, 431–442. [Google Scholar] [CrossRef] [PubMed]
  12. Chen, S.; Zhou, Y.; Chen, Y.; Gu, J. fastp: An ultra-fast all-in-one FASTQ preprocessor. Bioinformatics 2018, 34, i884–i890. [Google Scholar] [CrossRef] [PubMed]
  13. Chen, S. Ultrafast one-pass FASTQ data preprocessing, quality control, and deduplication using fastp. IMeta 2023, 2, e107. [Google Scholar] [CrossRef]
  14. Dobin, A.; Davis, C.A.; Schlesinger, F.; Drenkow, J.; Zaleski, C.; Jha, S.; Batut, P.; Chaisson, M.; Gingeras, T.R. STAR: Ultrafast universal RNA-seq aligner. Bioinformatics 2013, 29, 15–21. [Google Scholar] [CrossRef]
  15. Liao, Y.; Smyth, G.K.; Shi, W. The Subread aligner: Fast, accurate and scalable read mapping by seed-and-vote. Nucleic Acids Res. 2013, 41, e108. [Google Scholar] [CrossRef] [PubMed]
  16. Liao, Y.; Smyth, G.K.; Shi, W. featureCounts: An efficient general purpose program for assigning sequence reads to genomic features. Bioinformatics 2014, 30, 923–930. [Google Scholar] [CrossRef]
  17. Al Mahi, N.; Najafabadi, M.F.; Pilarczyk, M.; Kouril, M.; Medvedovic, M. GREIN: An Interactive Web Platform for Re-analyzing GEO RNA-seq Data. Sci. Rep. 2019, 9, 7580. [Google Scholar] [CrossRef]
  18. Love, M.I.; Huber, W.; Anders, S. Moderated estimation of fold change and dispersion for RNA-seq data with DESeq2. Genome Biol. 2014, 15, 550. [Google Scholar] [CrossRef]
  19. Wickham, H. ggplot2; Springer: New York, NY, USA, 2009. [Google Scholar] [CrossRef]
  20. Kolberg, L.; Raudvere, U.; Kuzmin, I.; Adler, P.; Vilo, J.; Peterson, H. g:Profiler—Interoperable web service for functional enrichment analysis and gene identifier mapping (2023 update). Nucleic Acids Res. 2023, 51, W207–W212. [Google Scholar] [CrossRef]
  21. Kanehisa, M.; Sato, Y. KEGG Mapper for inferring cellular functions from protein sequences. Protein Sci. 2020, 29, 28–35. [Google Scholar] [CrossRef]
  22. Kanehisa, M.; Sato, Y.; Kawashima, M. KEGG mapping tools for uncovering hidden features in biological data. Protein Sci. 2022, 31, 47–53. [Google Scholar] [CrossRef]
  23. Broad Institute. Morpheus. Available online: https://software.broadinstitute.org/morpheus// (accessed on 19 November 2025).
  24. Wang, G.; Zhang, D.; Qin, L.; Liu, Q.; Tang, W.; Liu, M.; Xu, F.; Tang, F.; Cheng, L.; Mo, H.; et al. Forskolin-driven conversion of human somatic cells into induced neurons through regulation of the cAMP-CREB1-JNK signaling. Theranostics 2024, 14, 1701–1719. [Google Scholar] [CrossRef] [PubMed]
  25. Kelley, M.W.; Turner, J.K.; Reh, T.A. Retinoic acid promotes differentiation of photoreceptors in vitro. Development 1994, 120, 2091–2102. [Google Scholar] [CrossRef] [PubMed]
  26. Kuwahara, A.; Ozone, C.; Nakano, T.; Saito, K.; Eiraku, M.; Sasai, Y. Generation of a ciliary margin-like stem cell niche from self-organizing human retinal tissue. Nat. Commun. 2015, 6, 6286. [Google Scholar] [CrossRef]
  27. Yu, I.T.; Park, J.-Y.; Kim, S.H.; Lee, J.; Kim, Y.-S.; Son, H. Valproic acid promotes neuronal differentiation by induction of proneural factors in association with H4 acetylation. Neuropharmacology 2009, 56, 473–480. [Google Scholar] [CrossRef] [PubMed]
  28. Telias, M.; Ben-Yosef, D. Pharmacological Manipulation of Wnt/β-Catenin Signaling Pathway in Human Neural Precursor Cells Alters Their Differentiation Potential and Neuronal Yield. Front. Mol. Neurosci. 2021, 14, 680018. [Google Scholar] [CrossRef] [PubMed]
  29. Bang, W.-S.; Kim, K.-T.; Cho, D.-C.; Kim, H.-J.; Sung, J.-K. Valproic Acid increases expression of neuronal stem/progenitor cell in spinal cord injury. J. Korean Neurosurg. Soc. 2013, 54, 8–13. [Google Scholar] [CrossRef]
  30. Brooks, M.J.; Chen, H.Y.; Kelley, R.A.; Mondal, A.K.; Nagashima, K.; De Val, N.; Li, T.; Chaitankar, V.; Swaroop, A. Improved Retinal Organoid Differentiation by Modulating Signaling Pathways Revealed by Comparative Transcriptome Analyses with Development In Vivo. Stem Cell Rep. 2019, 13, 891–905. [Google Scholar] [CrossRef]
  31. del Debbio, C.B.; Balasubramanian, S.; Parameswaran, S.; Chaudhuri, A.; Qiu, F.; Ahmad, I. Notch and wnt signaling mediated rod photoreceptor regeneration by müller cells in adult mammalian retina. PLoS ONE 2010, 5, e12425. [Google Scholar] [CrossRef]
  32. Gorsuch, R.A.; Lahne, M.; Yarka, C.E.; Petravick, M.E.; Li, J.; Hyde, D.R. Sox2 regulates Müller glia reprogramming and proliferation in the regenerating zebrafish retina via Lin28 and Ascl1a. Exp. Eye Res. 2017, 161, 174–192. [Google Scholar] [CrossRef]
  33. Graham, V.; Khudyakov, J.; Ellis, P.; Pevny, L. SOX2 functions to maintain neural progenitor identity. Neuron 2003, 39, 749–765. [Google Scholar] [CrossRef] [PubMed]
  34. Kageyama, R.; Ohtsuka, T.; Shimojo, H.; Imayoshi, I. Dynamic Notch signaling in neural progenitor cells and a revised view of lateral inhibition. Nat. Neurosci. 2008, 11, 1247–1251. [Google Scholar] [CrossRef] [PubMed]
  35. Jadhav, A.P.; Mason, H.A.; Cepko, C.L. Notch 1 inhibits photoreceptor production in the developing mammalian retina. Development 2006, 133, 913–923. [Google Scholar] [CrossRef]
  36. Zheng, L.; Conner, S.D. Glycogen synthase kinase 3β inhibition enhances Notch1 recycling. Mol. Biol. Cell 2018, 29, 389–395. [Google Scholar] [CrossRef]
  37. Adler, J.T.; Hottinger, D.G.; Kunnimalaiyaan, M.; Chen, H. Histone deacetylase inhibitors upregulate Notch-1 and inhibit growth in pheochromocytoma cells. Surgery 2008, 144, 956–961. [Google Scholar] [CrossRef]
  38. Lyssiotis, C.A.; Walker, J.; Wu, C.; Kondo, T.; Schultz, P.G.; Wu, X. Inhibition of histone deacetylase activity induces developmental plasticity in oligodendrocyte precursor cells. Proc. Natl. Acad. Sci. USA 2007, 104, 14982–14987. [Google Scholar] [CrossRef]
  39. Zhao, J.J.; Ouyang, H.; Luo, J.; Patel, S.; Xue, Y.; Quach, J.; Sfeir, N.; Zhang, M.; Fu, X.; Ding, S.; et al. Induction of retinal progenitors and neurons from mammalian Müller glia under defined conditions. J. Biol. Chem. 2014, 289, 11945–11951. [Google Scholar] [CrossRef] [PubMed]
  40. Osakada, F.; Ooto, S.; Akagi, T.; Mandai, M.; Akaike, A.; Takahashi, M. Wnt Signaling Promotes Regeneration in the Retina of Adult Mammals. J. Neurosci. 2007, 27, 4210–4219. [Google Scholar] [CrossRef]
  41. Heravi, M.; Rasoulinejad, S.A. Potential of Müller Glial Cells in Regeneration of Retina; Clinical and Molecular Approach. Int. J. Organ. Transpl. Med. 2022, 13, 50–59. [Google Scholar]
  42. Oppenheim, R.W. Cell death during development of the nervous system. Annu. Rev. Neurosci. 1991, 14, 453–501. [Google Scholar] [CrossRef]
  43. Young, R.W. Cell death during differentiation of the retina in the mouse. J. Comp. Neurol. 1984, 229, 362–373. [Google Scholar] [CrossRef] [PubMed]
Figure 1. Global transcriptome landscape and differential expression between culture conditions. (a) Experimental protocol to induce photoreceptor-like cells. Cells cultured in standard rMC-1 medium were used as the control. (b) Morphology of rMC-1 cells cultured in PDM or rMC-1 medium (Control) at Day 33, as illustrated in the time course shown in Figure 1a. Arrowheads indicate cells with round cell bodies and two thin, elongated neurite-like processes. Scale bars: (upper panels), 50 µm; (lower panels), 20 µm. Dashed lines indicate panels corresponding to the PDM group. (c) Principal component analysis of gene expression data from cells cultured in rMC-1 or PDM photoreceptor differentiation. (d) Hierarchical clustering of gene expression by cells cultured in rMC-1 medium or PDM. (e) Volcano plot shows DEGs between rMC-1 samples cultured under rMC-1 medium or PDM. The statistical significance of DEGs was defined as FDR < 0.05 after Benjamini–Hochberg correction. DEGs, differentially expressed genes; FDR, false discovery rate; PCA, principal component analysis; PDM, photoreceptor differentiation medium; rMC-1, rat retinal Müller cell line; SFM, serum-free medium.
Neuroglia 07 00008 g001
Figure 2. Effects of PDM on photoreceptor and Müller glia-related gene expression. (a) Heat maps of photoreceptor-related genes expressed by cells cultured in rMC-1 medium or PDM. (b) Heat maps of Müller glia-related gene expression. (c) RT-qPCR analyses were conducted at 2–4 weeks after culture initiation (Day 19, 26, and 33) to evaluate the expression of Müller glia-related genes (Glast and Rlbp1) in rMC-1 cells cultured in PDM. (d) RT-qPCR analyses were conducted at 2–4 weeks after culture initiation (Day 19, 26, and 33) to evaluate the expression of photoreceptor-related genes (Rtbdn and Rgs9) in rMC-1 cells cultured in PDM. Data are shown as mean ± SD, n = 6, *, **, *** p < 0.05, 0.01, 0.001 compared to Control (unpaired t-test). ## p < 0.01 compared to PDM Day19 (Tukey’s multiple comparison test). (e) Immunocytochemistry of the photoreceptor marker Rgs9 and Müller glia marker GLUL in rMC-1 cells cultured in PDM and control. Scale bar, 20 µm.
Neuroglia 07 00008 g002
Figure 3. Effects of PDM on biological processes and cellular components. Representative Gene Ontology (GO) terms for Biological Process and Cellular Component enriched in gene sets showing (a) upregulated and (b) downregulated expression in cells cultured in PDM.
Neuroglia 07 00008 g003
Figure 4. Synaptic vesicle cycle and cell cycle-related gene expression changes in cells cultured with PDM. Genes with (a) upregulated and (b) downregulated expression in rMC-1 cells cultured in PDM compared with that of the controls mapped to KEGG pathways of “Synaptic vesicle cycle” (rno04721) and “Cell cycle” (rno04110). Genes shown in coral indicate upregulated expression, whereas genes shown in light blue indicate downregulated expression. The images were generated by the KEGG Mapper color Tool (Version 5.2).
Neuroglia 07 00008 g004
Table 1. List of primers used for RT-qPCR.
Gene
Name
Sequence Annealing
Temp (°C)
Product
Size (bp)
Refseq
Accession Number
GlastForward 5′- TTCTCCATGTGCTTCGGCTT -3′ 60 142 NM_019225.2
Reverse 5′- AGAAGAGGATGCCCAGAGGT -3′
Rlbp1Forward 5′- CACTATCGAGGCCGGTTACC -3′ 60 142 NM_001106274.2
Reverse 5′- CTCCAGAATGAAACAATATGCCTG -3′
Rgs9Forward 5′- GCGTGACCAATCCAAACGAA -3′ 60 122 NM_019224.2
Reverse 5′- GATTCCTCCAAGGGACACCG -3′
RtbdnForward 5′- GCATGGAGCTCTGCCAGATT -3′ 60 135 NM_001107165.1
Reverse 5′- TGGCGTTGGCAAAAGTCTGA -3′
GapdhForward 5′- AGGTCGGTGTGAACGGATTTG -3′ 60 123 NM_017008.4
Reverse 5′- TGTAGACCATGTAGTTGAGGTCA -3′
Table 2. List of primary antibodies, secondary antibodies, and isotype controls used in immunocytochemistry.
Antibody/Isotype ControlSpeciesDilutionManufacturer
RGS9mouse1:50Santa Cruz Biotechnology,
Dallas, TX, USA (sc-377252)
GLULrabbit1:500abcam, (ab73593)
Alexa Fluor™ 568mouse1:2000Invitrogen, Carlsbad, CA, USA (A21043)
Alexa Fluor™ 594rabbit1:500Invitrogen (A11037)
IgM Isotype Controlmouse1:250Invitrogen (MA1-10438)
IgG Isotype Controlrabbit1:5000Invitrogen (02-6102)
Table 3. Significantly altered expression of photoreceptor-related genes in cells cultured in PDM.
Gene
Symbol
NCBI
Gene ID
Mean
Expression Level
log2 Fold Changep-ValueFDR
upregulatedRtbdn3046677.994.203.82 × 10−552.29 × 10−52
Lhx43608585.123.352.59 × 10−94.16 × 10⁻⁸
Pias38361411.010.863.16 × 10−84.30 × 10⁻⁷
Blimp13098714.857.896.10 × 10−76.75 × 10−6
Tbx23033986.902.661.02 × 10−61.08 × 10⁻⁵
Rgs9294815.092.964.41 × 10−64.12 × 10⁻⁵
downregulatedGnat13631435.33−3.376.07 × 10−121.42 × 10⁻¹⁰
Table 4. Significantly altered expression of Müller glia-related genes in cells cultured in PDM.
Gene SymbolNCBI Gene IDMean
Expression Level
log2 Fold Changep-ValueFDR
upregulatedNotch12549611.501.432.06 × 10−114.45 × 10⁻¹⁰
Cntfr313173−2.717.868.18 × 10−111.63 × 10−9
Sox249959311.011.007.46 × 10−78.11 × 10⁻⁶
downregulatedNfib2922712.76−1.301.56 × 10−177.29 × 10⁻¹⁶
Gfap243873.96−3.545.83 × 10−54.43 × 10⁻⁴
Vim8181815.31−0.761.69 × 10−41.17 × 10⁻³
Glast2948310.02−1.141.80 × 10−41.24 × 10⁻³
Rlbp12930492.21−3.664.66 × 10−32.33 × 10⁻²
Disclaimer/Publisher’s Note: The statements, opinions and data contained in all publications are solely those of the individual author(s) and contributor(s) and not of MDPI and/or the editor(s). MDPI and/or the editor(s) disclaim responsibility for any injury to people or property resulting from any ideas, methods, instructions or products referred to in the content.