1. Introduction
With the rapid development of China’s high-speed railway and the growing demand for passengers’ travel comfort, traffic noise control has become a key link in line design and environmental governance. As a sound insulation structure between the sound source and the receiver, the sound barrier is widely used in the reconstruction of existing lines and new construction projects [
1,
2,
3]. The traditional vertical sound barrier is limited by height and form, which makes it difficult to meet the noise reduction requirements of higher floors and special noise-sensitive areas. For the semi-closed sound barrier, noise can overflow due to the open side of the structure, and the diffraction area formed by the overflow noise is difficult to interfere with on the closed side [
4,
5]. Therefore, the semi-closed sound barrier has dual functions of ensuring the sound comfort inside the vehicle and protecting the sound environment of high-rise buildings on the side of the line, and is especially suitable for noise control of complex bridges and urban railways.
Abbott J P et al. [
6] found through experiments that the wind speed amplification effect of the wind fence enclosures and the problem of infrasound noise reduction cannot be ignored. Belloli et al. [
7] combined numerical simulation and experimental methods to study the complex fluid–solid coupling phenomenon that occurs when a vehicle passes through the sound barrier. Then, the corresponding theoretical research was gradually improved. Zhang et al. [
8] derived the calculation formula for the wind load change on the train body when the train enters or leaves the wind barrier structure and established the dynamic analysis model of the wind–vehicle–bridge system. Based on theoretical research, many scholars have conducted various experimental and numerical simulation studies on the wind load effect of high-speed railway sound barriers. The study by Lü et al. [
9] analyzed the influence of EMU speed, the distance between the train and the sound barrier, and the type of EMU on the aerodynamic load characteristics of the noise-reducing barrier through experimental methods. Taking the fully enclosed sound barrier as the research object, researchers explored the influence of wind speed, Reynolds number effect, wind angle of attack, and test section location on the surface wind load of the fully enclosed sound barrier using sectional model wind tunnel tests [
10]. They indicated that the Reynolds number effect has a significant influence on the crosswind aerodynamic characteristics and the wind pressure distribution at the top of the fully enclosed sound barrier. The wind angle of attack has a substantial influence on the drag coefficient. Reference [
11] conducted a numerical simulation of the air pressure load on an 840 m long fully enclosed sound barrier of a high-speed railway. They demonstrated that the extreme pressure under opposing-traffic conditions is greater than that under single-vehicle conditions, and the variation pattern is more complex. The pressure reaches its maximum when the middle position of the fully enclosed sound barrier is aligned with the vehicle. Yang et al. [
12] revealed the pressure relief mechanism of the pressure relief hole on the fully enclosed sound barrier and the buffering mechanism of the buffer structure at the end of the semi-enclosed sound barrier from the perspective of the flow field. Wu et al. [
13] also investigated the fatigue life prediction of the semi-enclosed sound barrier of high-speed railways under wind load and proposed a new method for predicting the fatigue life of the sound barrier. Deng et al. [
14] used the improvement of the delayed detached-eddy simulation (IDDES) method based on the SST k-ω turbulence model for numerical calculation and the overlapping grid method to realize the relative movement of trains, and studied the influence of the wind barrier of the bridge on the aerodynamic characteristics of high-speed trains when they meet under crosswind. Moreover, to explain the mechanisms and conditions for the occurrence of VIVs in the main girder affected by water-filled barriers, Liang et al. [
15] studied the effect of water-filled barriers on the Vortex-Induced Vibration performance of suspension bridges.
Accordingly, most existing research focuses on the wind load characteristics of the fully enclosed sound barrier under the action of train-induced fluctuating wind [
3,
7,
9,
16,
17]. For the semi-closed sound barrier, although the load caused by the fluctuating wind of the train is relatively small, the effect of natural wind is extremely significant. In addition, compared to the traditional plug-in sound barrier, the external sound barrier is only fixed on the outside of the steel structure, resulting in relatively poor wind resistance performance and low structural reliability under load conditions with high train running speeds and significant aerodynamic wind pressure effects. Therefore, it is necessary to evaluate the wind resistance of the semi-enclosed external sound barrier system.
Furthermore, compared with the above references, this research fills the research gap under specific bridge conditions and adopts a multi-dimensional research method. Firstly, innovation of research perspective: from “influence caused by a single train [
12]” to “wind load under complex bridge conditions”. Secondly, deepening of engineering background: from “single bridge type, and sound barrier on conventional bridges [
4]” to “complex intersection area”. Thirdly, integration of research methods: from “single means” to “joint verification of wind tunnel test and CFD”, and “local wind load concentration” is revealed. Finally, sublimation of research objectives: from “performance analysis and focuses on the bridge’s vibration [
13]” to “wind-resistant design guidance”. To sum up, this research, through the three-dimensional research framework of “complex bridge condition (single/three-line bridge junction), unique load (natural crosswind), and comprehensive method (test and simulation)”, fills the research gap on the distribution law and mechanism of extreme wind pressure of semi-closed sound barrier under such complex geometric boundaries at the intersection of multi-line bridges. The specific works are as follows:
This paper studies the wind-induced response of the semi-enclosed external sound barrier on a high-speed railway bridge at the junction of a single-track bridge and a three-track bridge. It employs the wind tunnel test method to systematically investigate the wind load distribution characteristics of the sound barrier by analyzing the patterns of average wind pressure, fluctuating wind pressure, and extreme wind pressure on its surface. Then, with the aid of FLUENT software, the SST k-ω turbulence model is employed to simulate the wind field environment of the semi-enclosed sound barrier on the single-track bridge and the three-track bridge in both windward and leeward directions, and to obtain the flow field characteristics under the two flow conditions. It not only reveals the influence mechanism of different bridge types and incoming flow directions on the wind pressure distribution, but also strongly proves the extreme of local wind load. The research results can provide a reference for wind-resistant design and structural optimization of a semi-closed external sound barrier under complex bridge conditions for high-speed railways.
2. Materials & Methods
2.1. Introduction of Engineering Project
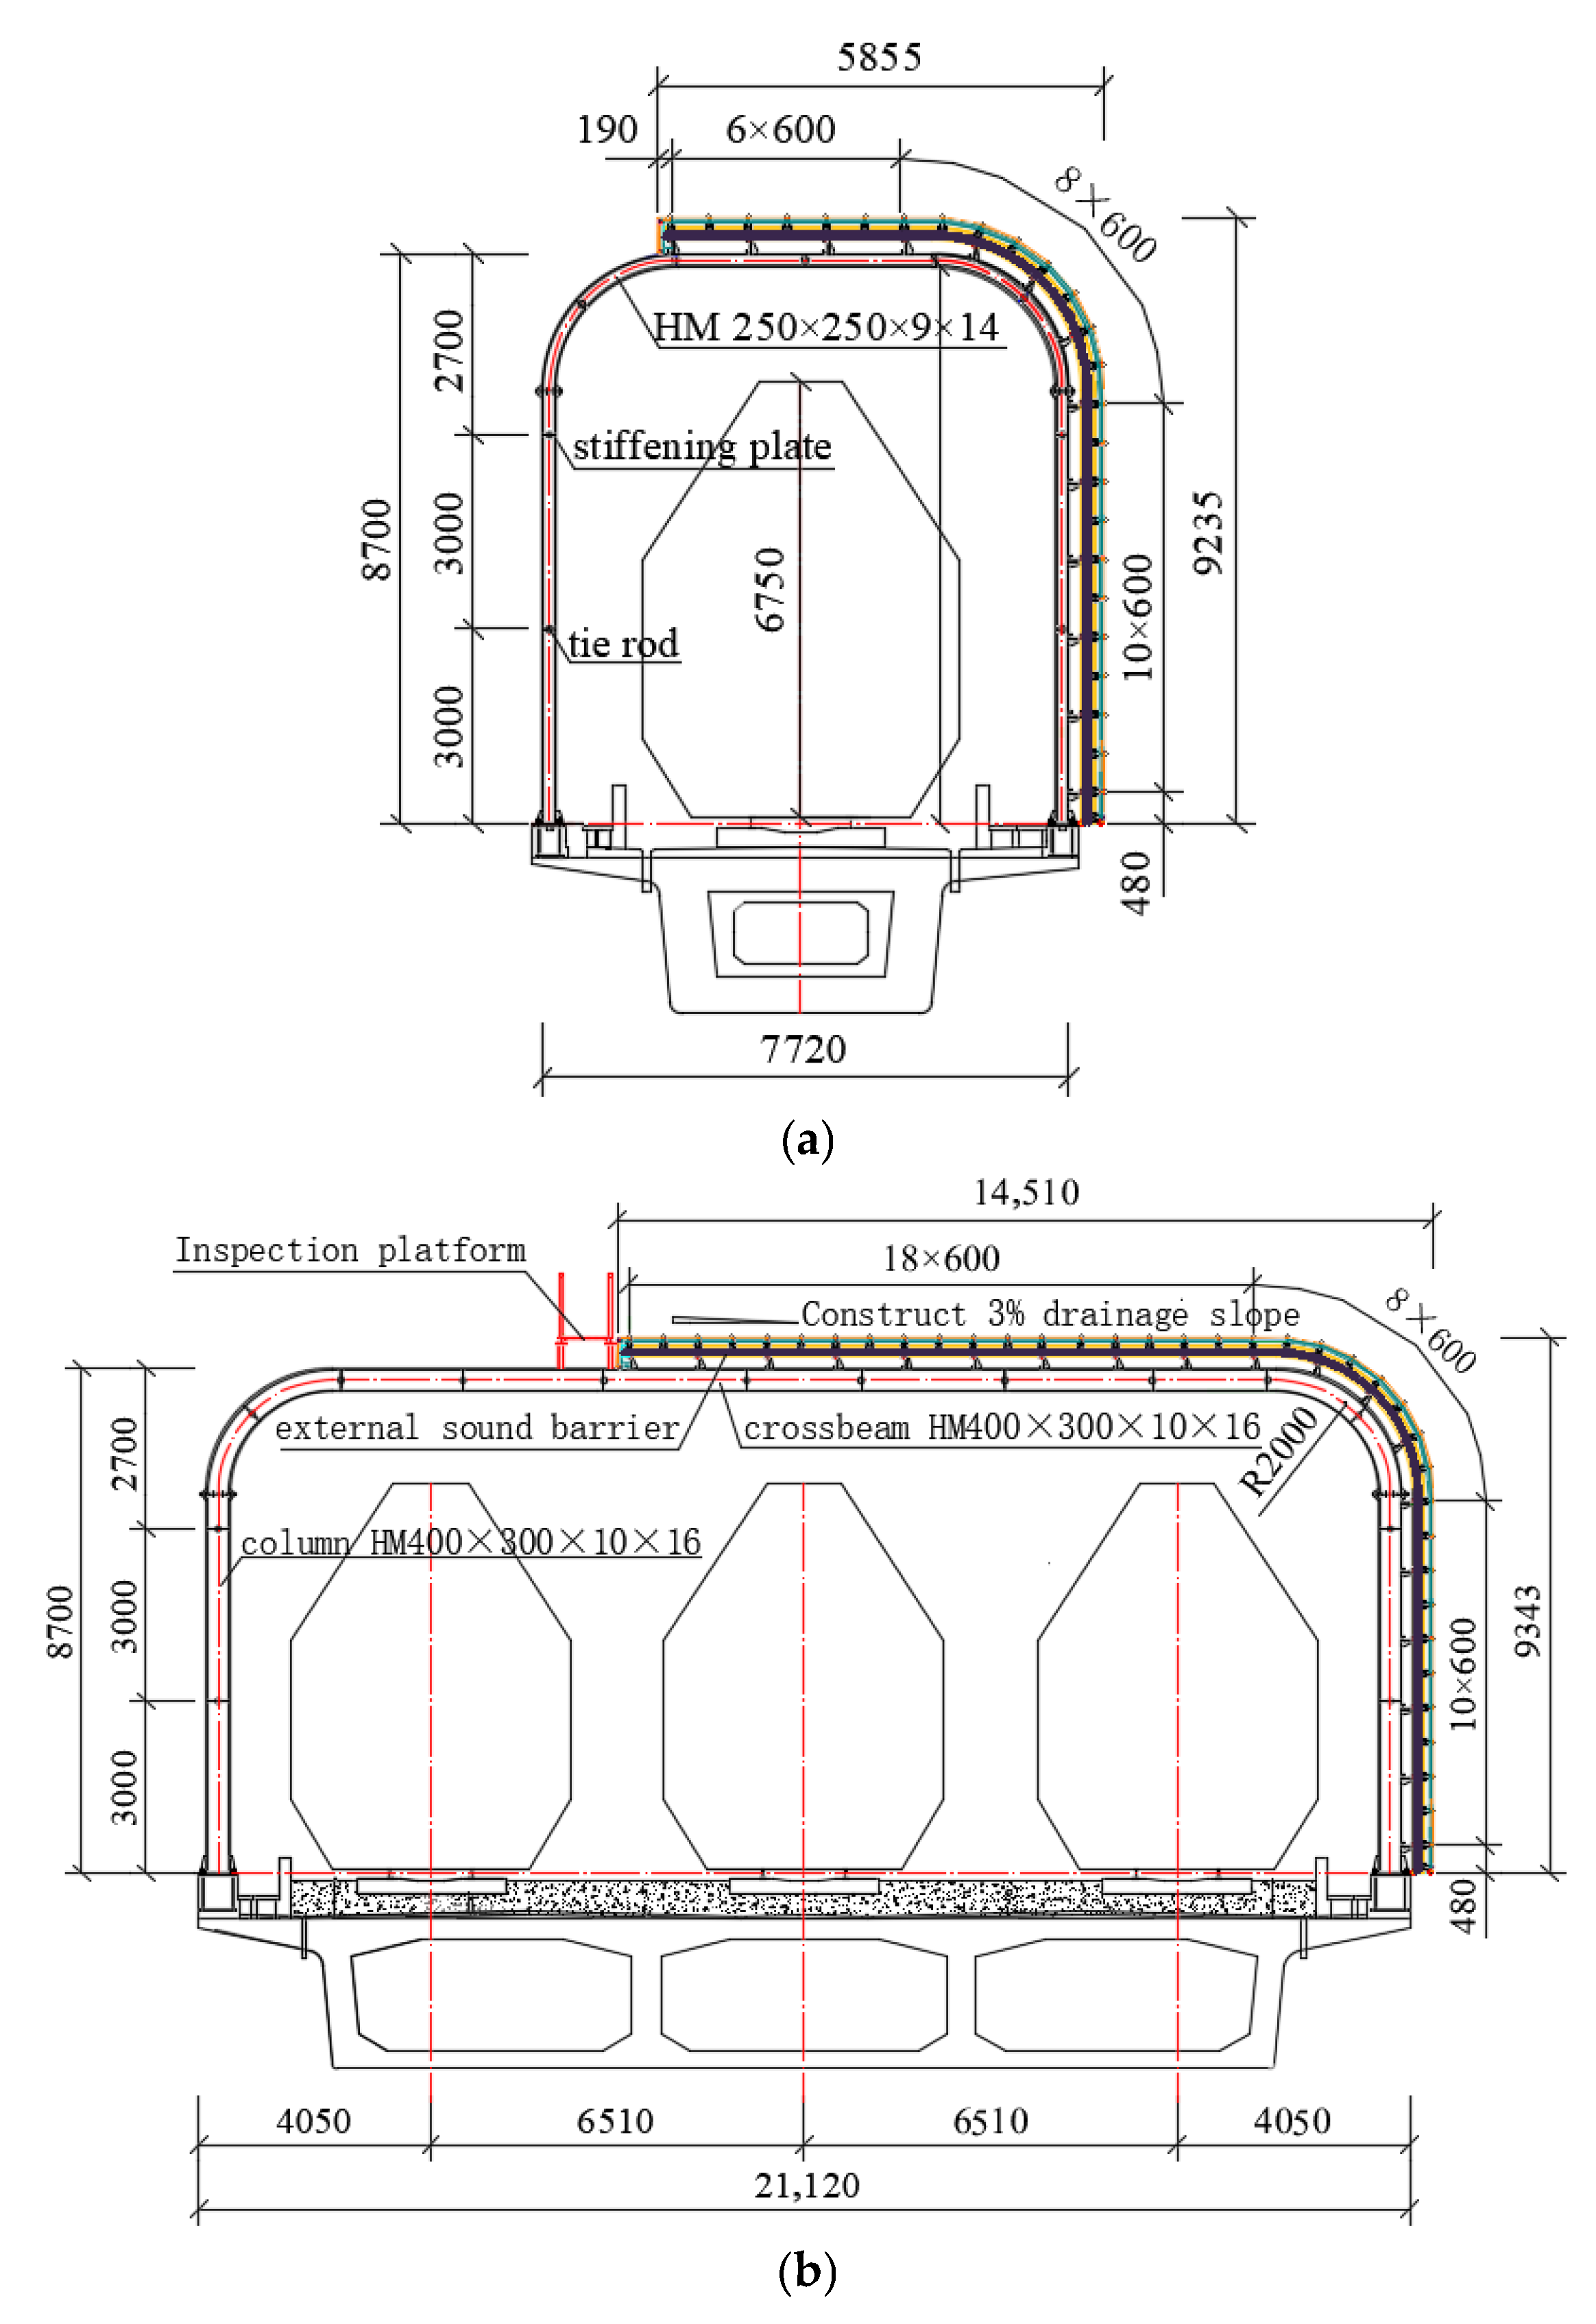
A 1550 m semi-enclosed external sound barrier is installed for noise control near Dongping Station on the Xining-Huangshengguan section of the new Xining-Chengdu Railway Line. Among these, the length of the semi-enclosed sound barrier on the single-track bridge is 350 m, and the height of the bridge is approximately 40 m. The length of the semi-enclosed sound barrier on the three-track bridge is 1200 m, and the bridge height ranges from approximately 10 to 30 m. The design speed of the Xining-Chengdu Railway is 200 km/h; however, due to the line conditions within the mileage range of the semi-enclosed sound barrier, the maximum operating speed is expected to be 120 km/h. The cross-sectional form of the project’s single-track and three-track bridges is shown in
Figure 1.
The semi-enclosed sound barrier structure adopts a portal frame configuration with a total frame height of 8.7 m. The vertical sections and the top of the sound barrier are constructed entirely from metal sound barrier panels. The semi-enclosed sound barrier columns for the single-track bridge have a cross-section of HW 250 × 250 × 9 × 14, with a spacing of 2 m along the bridge. The contact network foundation is installed separately, and the sound barrier foundation is connected to the side wall of the bridge by six M27 U-type high-strength bolts. The semi-enclosed sound barrier columns for the three-track bridge have a cross-section of HW 400 × 300 × 10 × 16, with a longitudinal spacing of 2 m. The contact network columns and sound barrier columns on the inside of the bridge sidewalls are integrated to save space, and eight M30 U-type high-strength bolts are utilized to firmly connect the bridge sidewalls to the full-frame sound barrier foundation of the three-track bridge.
2.2. Wind Tunnel Test Model
The wind tunnel test was conducted in a boundary layer wind tunnel with main technical indices that reached an advanced international level. The dimensions of the test section of the wind tunnel are 36 (L) × 22.5 (W) × 4.5 m (H), and the adjustable range of experimental wind speeds is 1.0–16.5 m/s. The wind tunnel is equipped with a simulation device that accurately reproduces the atmospheric boundary layer characteristics of the region where the structure is located through measures such as rough elements and baffle settings. A rotating disk at the base of the wind tunnel allows for wind direction adjustment from 0° to 360°, accommodating the complex requirements of the wind tunnel experiments.
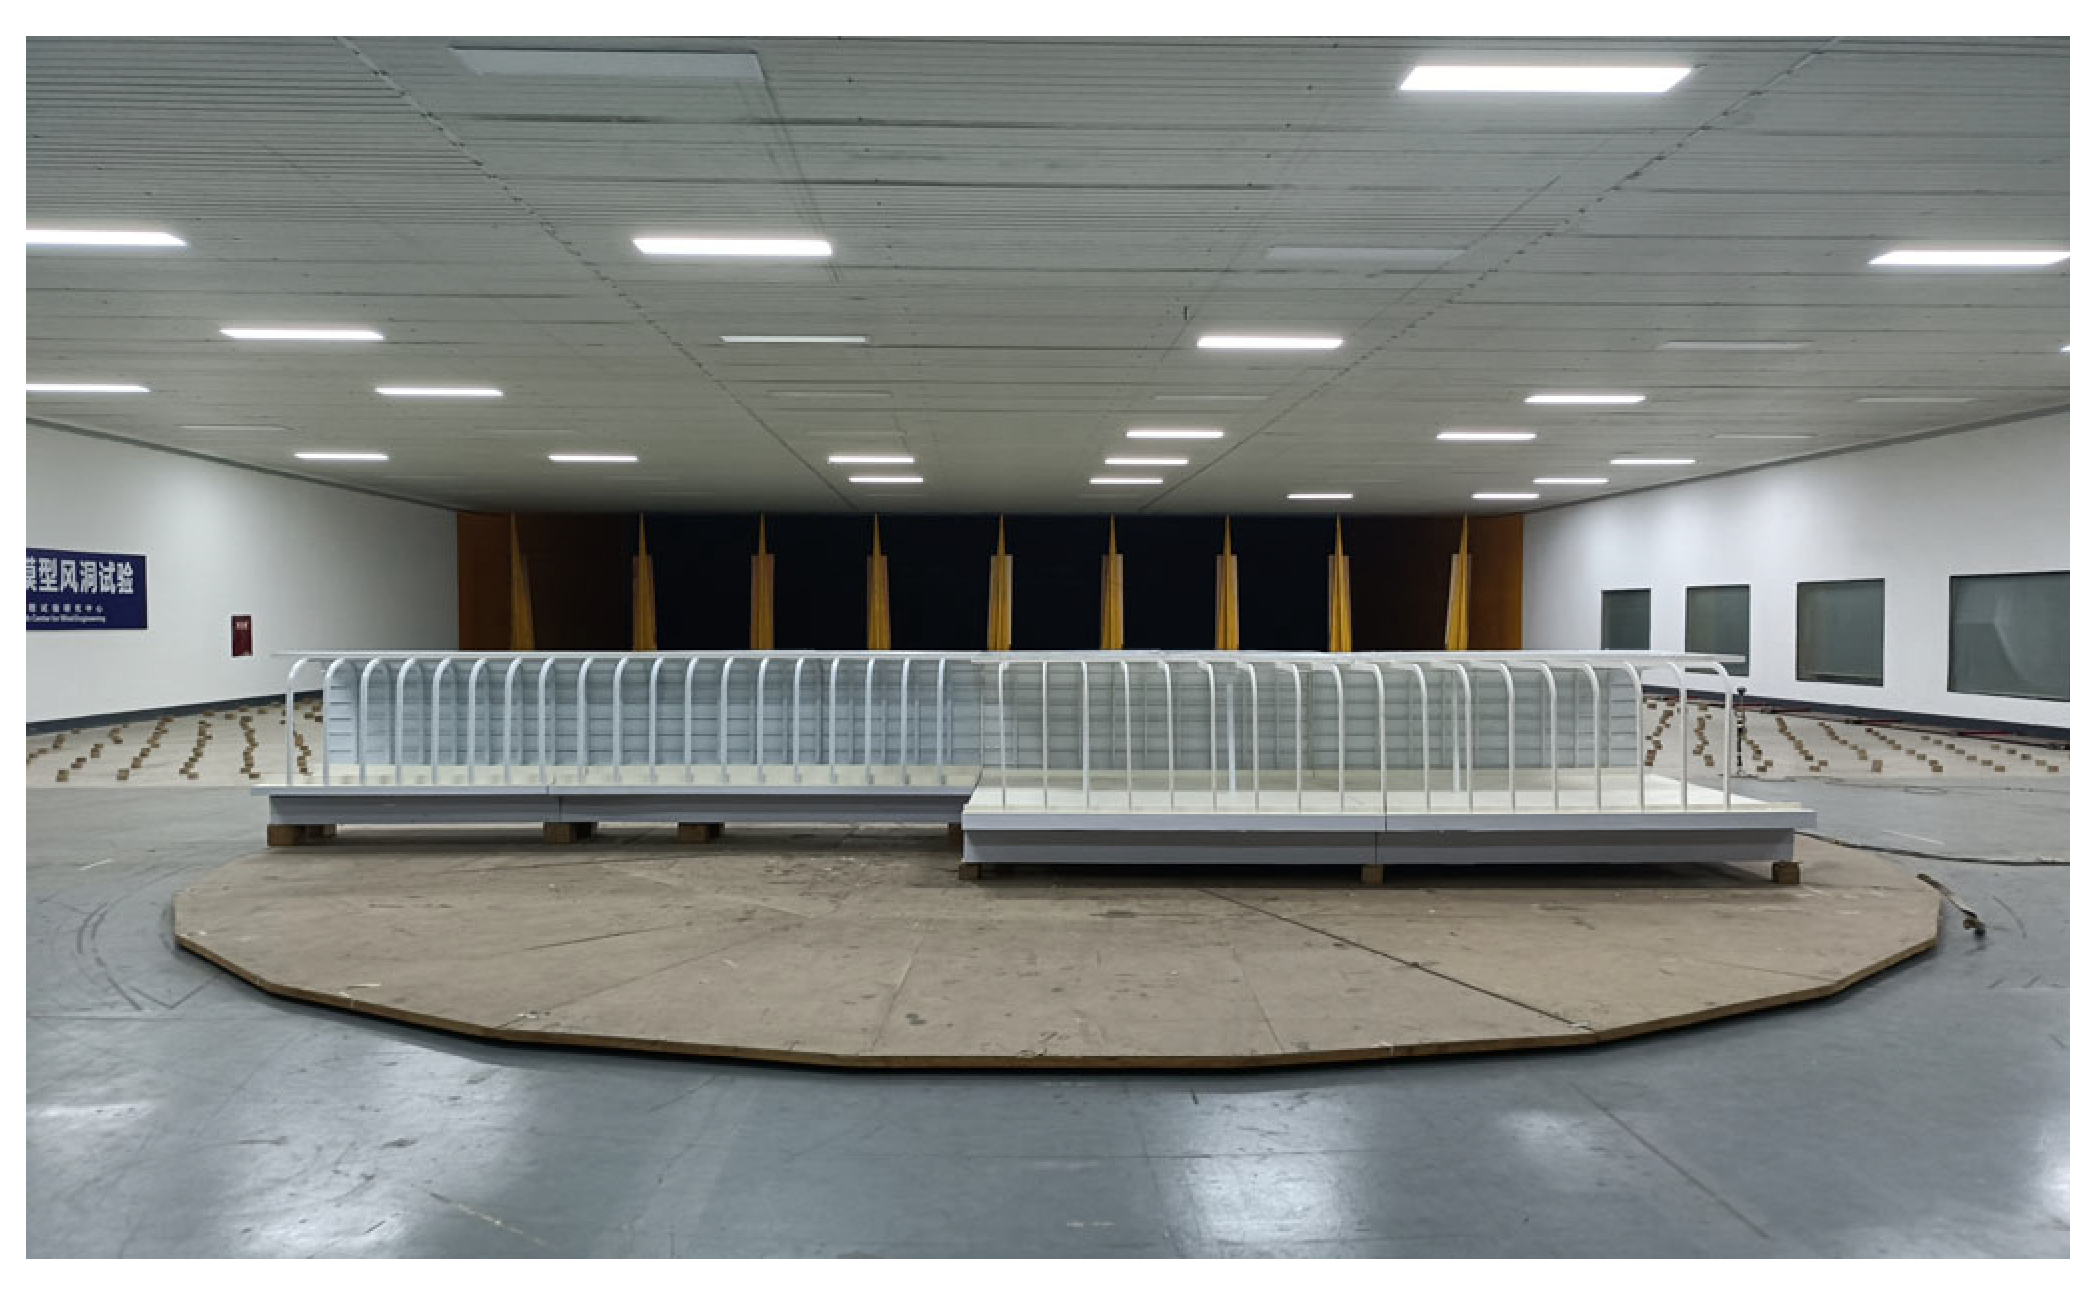
After comprehensive analysis of the wind tunnel test section size and the geometric dimensions of the sound barrier structure to be simulated, the geometric scale of the test model was set at 1:10, which meets the balance between Reynolds number similarity and model detail capture. Based on the provided design drawings, the model was 3D printed using metal pipes, composite materials, plexiglass, and other materials, in accordance with geometric similarity requirements. As the model is a rigid-body pressure measurement model, aerodynamic shape similarity was the primary consideration. The model’s blockage ratio (Corrected by the classical correction formula) in the wind tunnel is less than 5%, meeting wind tunnel test standards. The semi-enclosed sound barrier models of the single-track bridge and three-track bridge installed in the wind tunnel are shown in
Figure 2. Both sound barrier models are 4 m in length. The model’s height is 30 cm above the ground, equivalent to the actual pier height of 3 m.
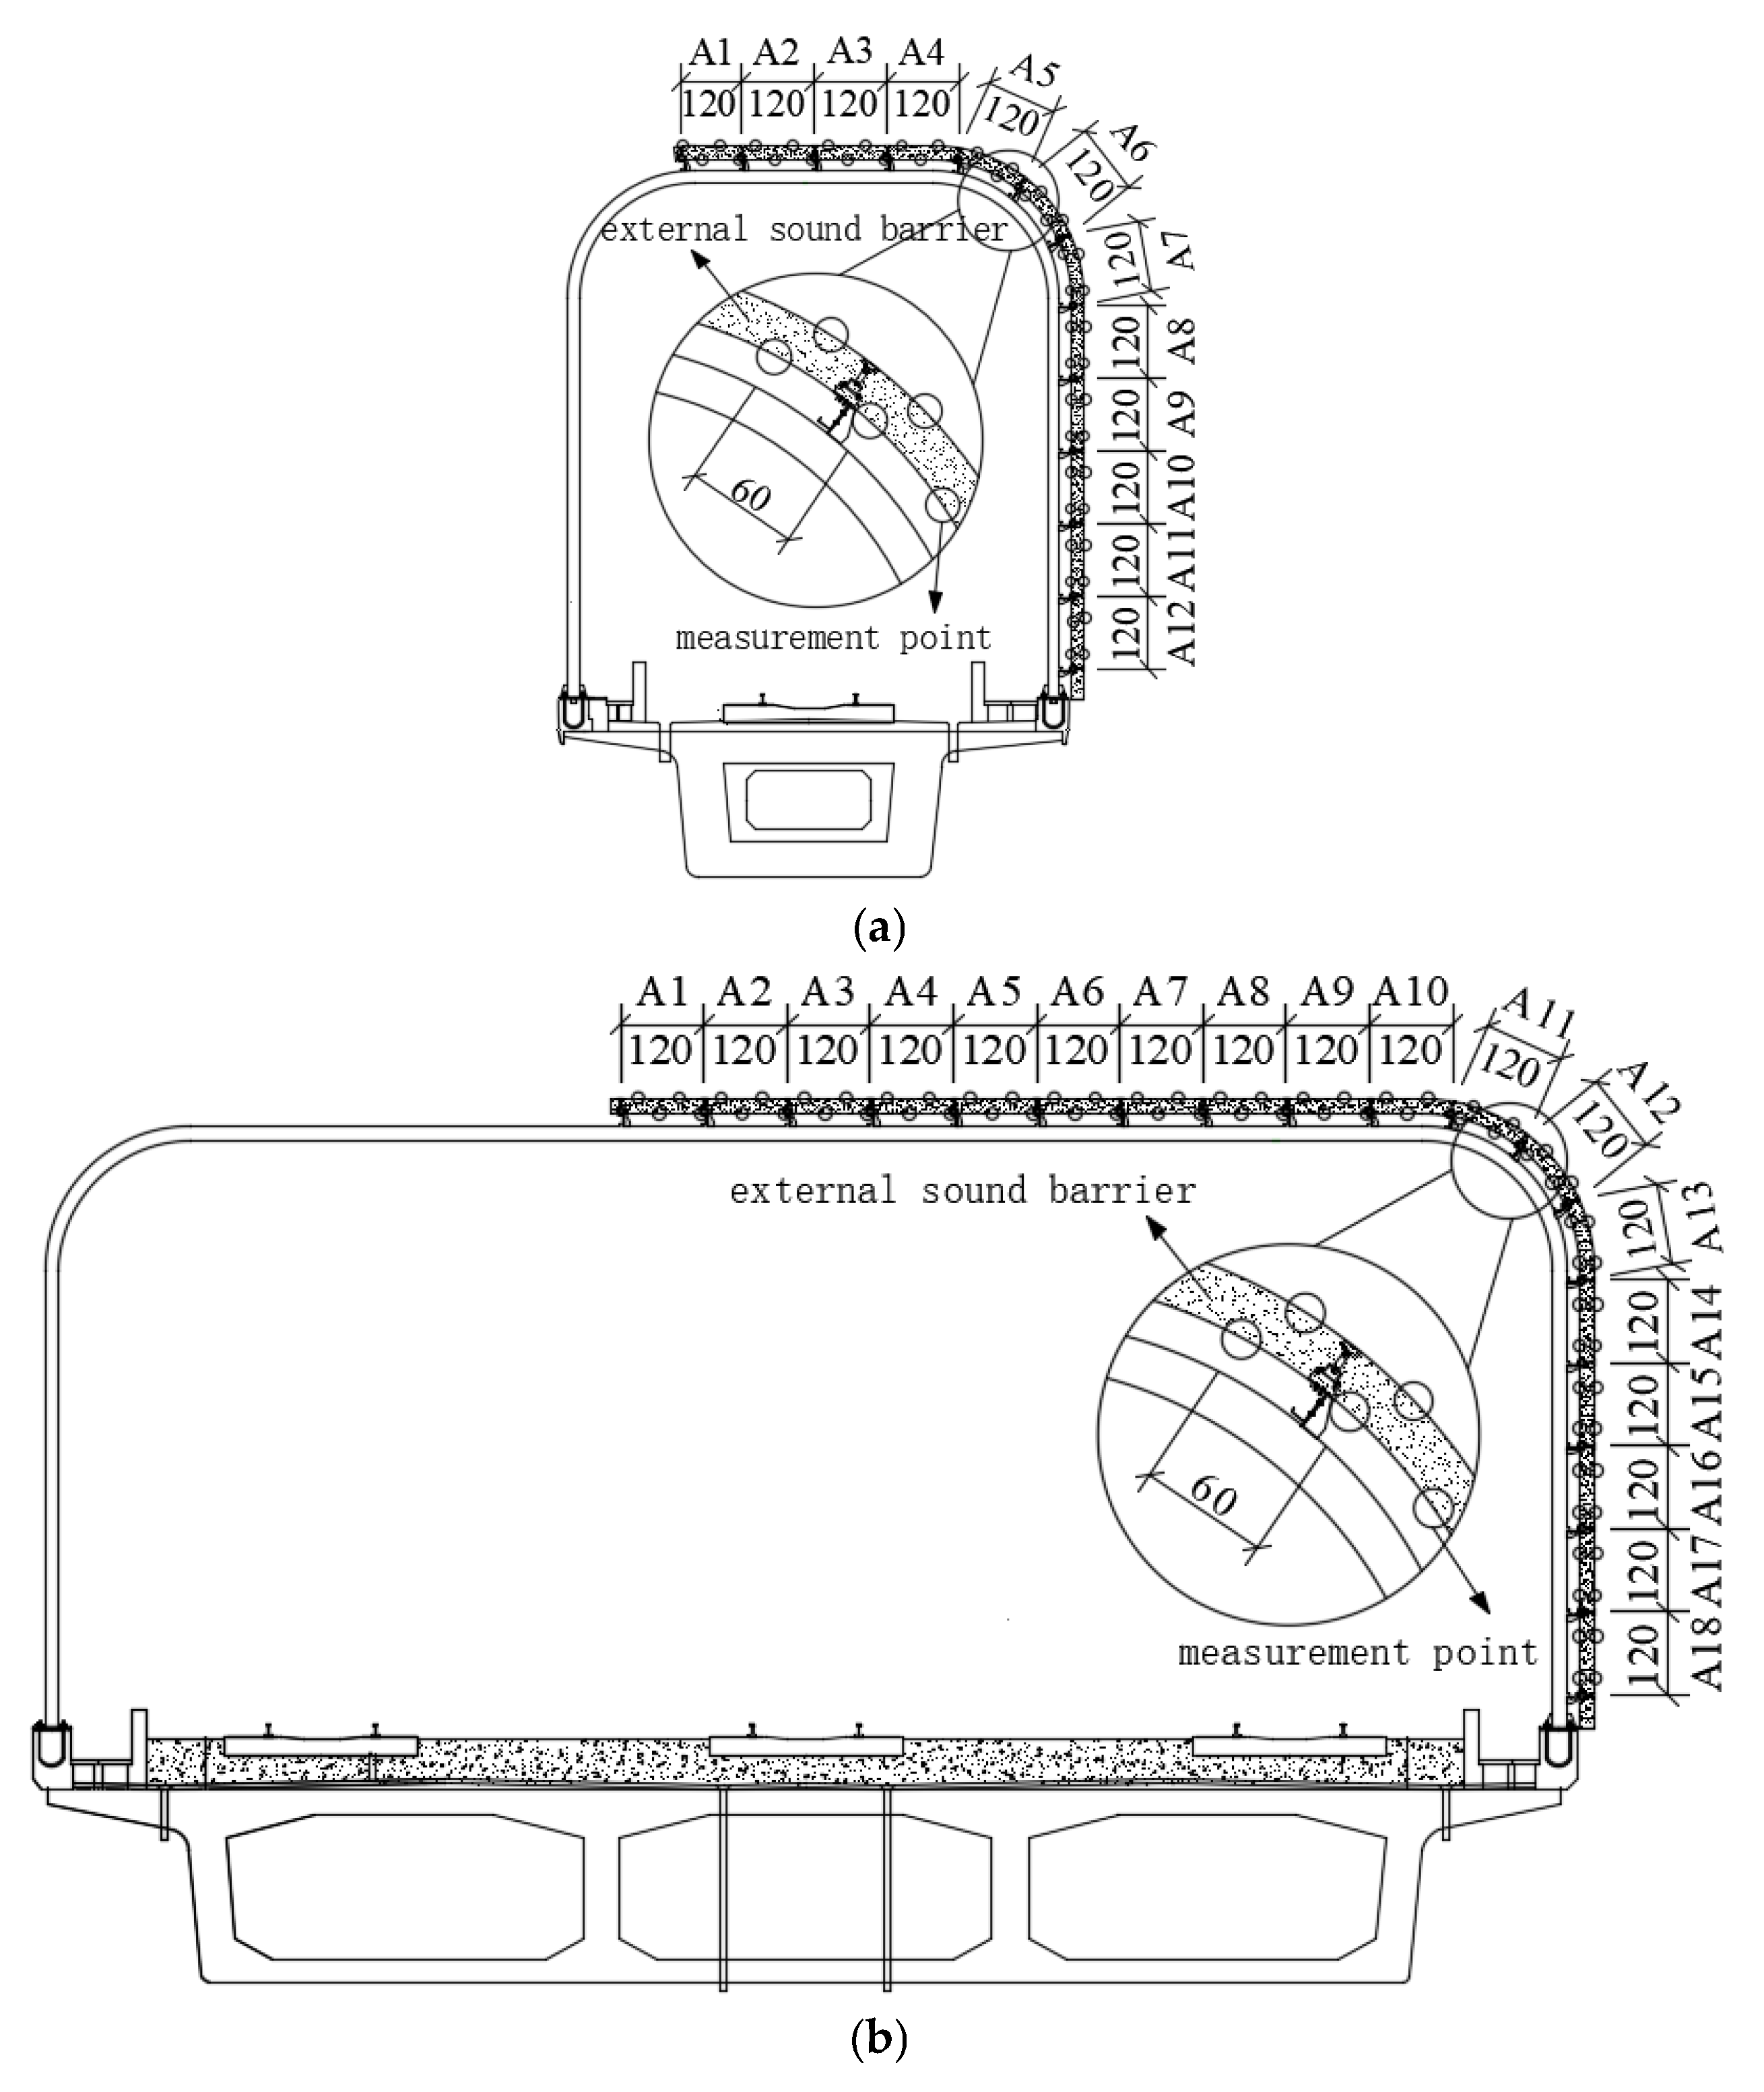
Wind pressure measurement points in the cross-section are arranged on both the inner and outer sides of the sound barrier. The surface of the sound barrier is partitioned to facilitate subsequent analysis and application.
Figure 3 illustrates that there are 47 wind load measurement points for wind barriers on the single-track bridge, which are divided into 12 zones and numbered A1 through A12. For wind barriers on the three-track bridge, there are 71 wind load measurement points, which are divided into 18 zones and numbered A1 through A18.
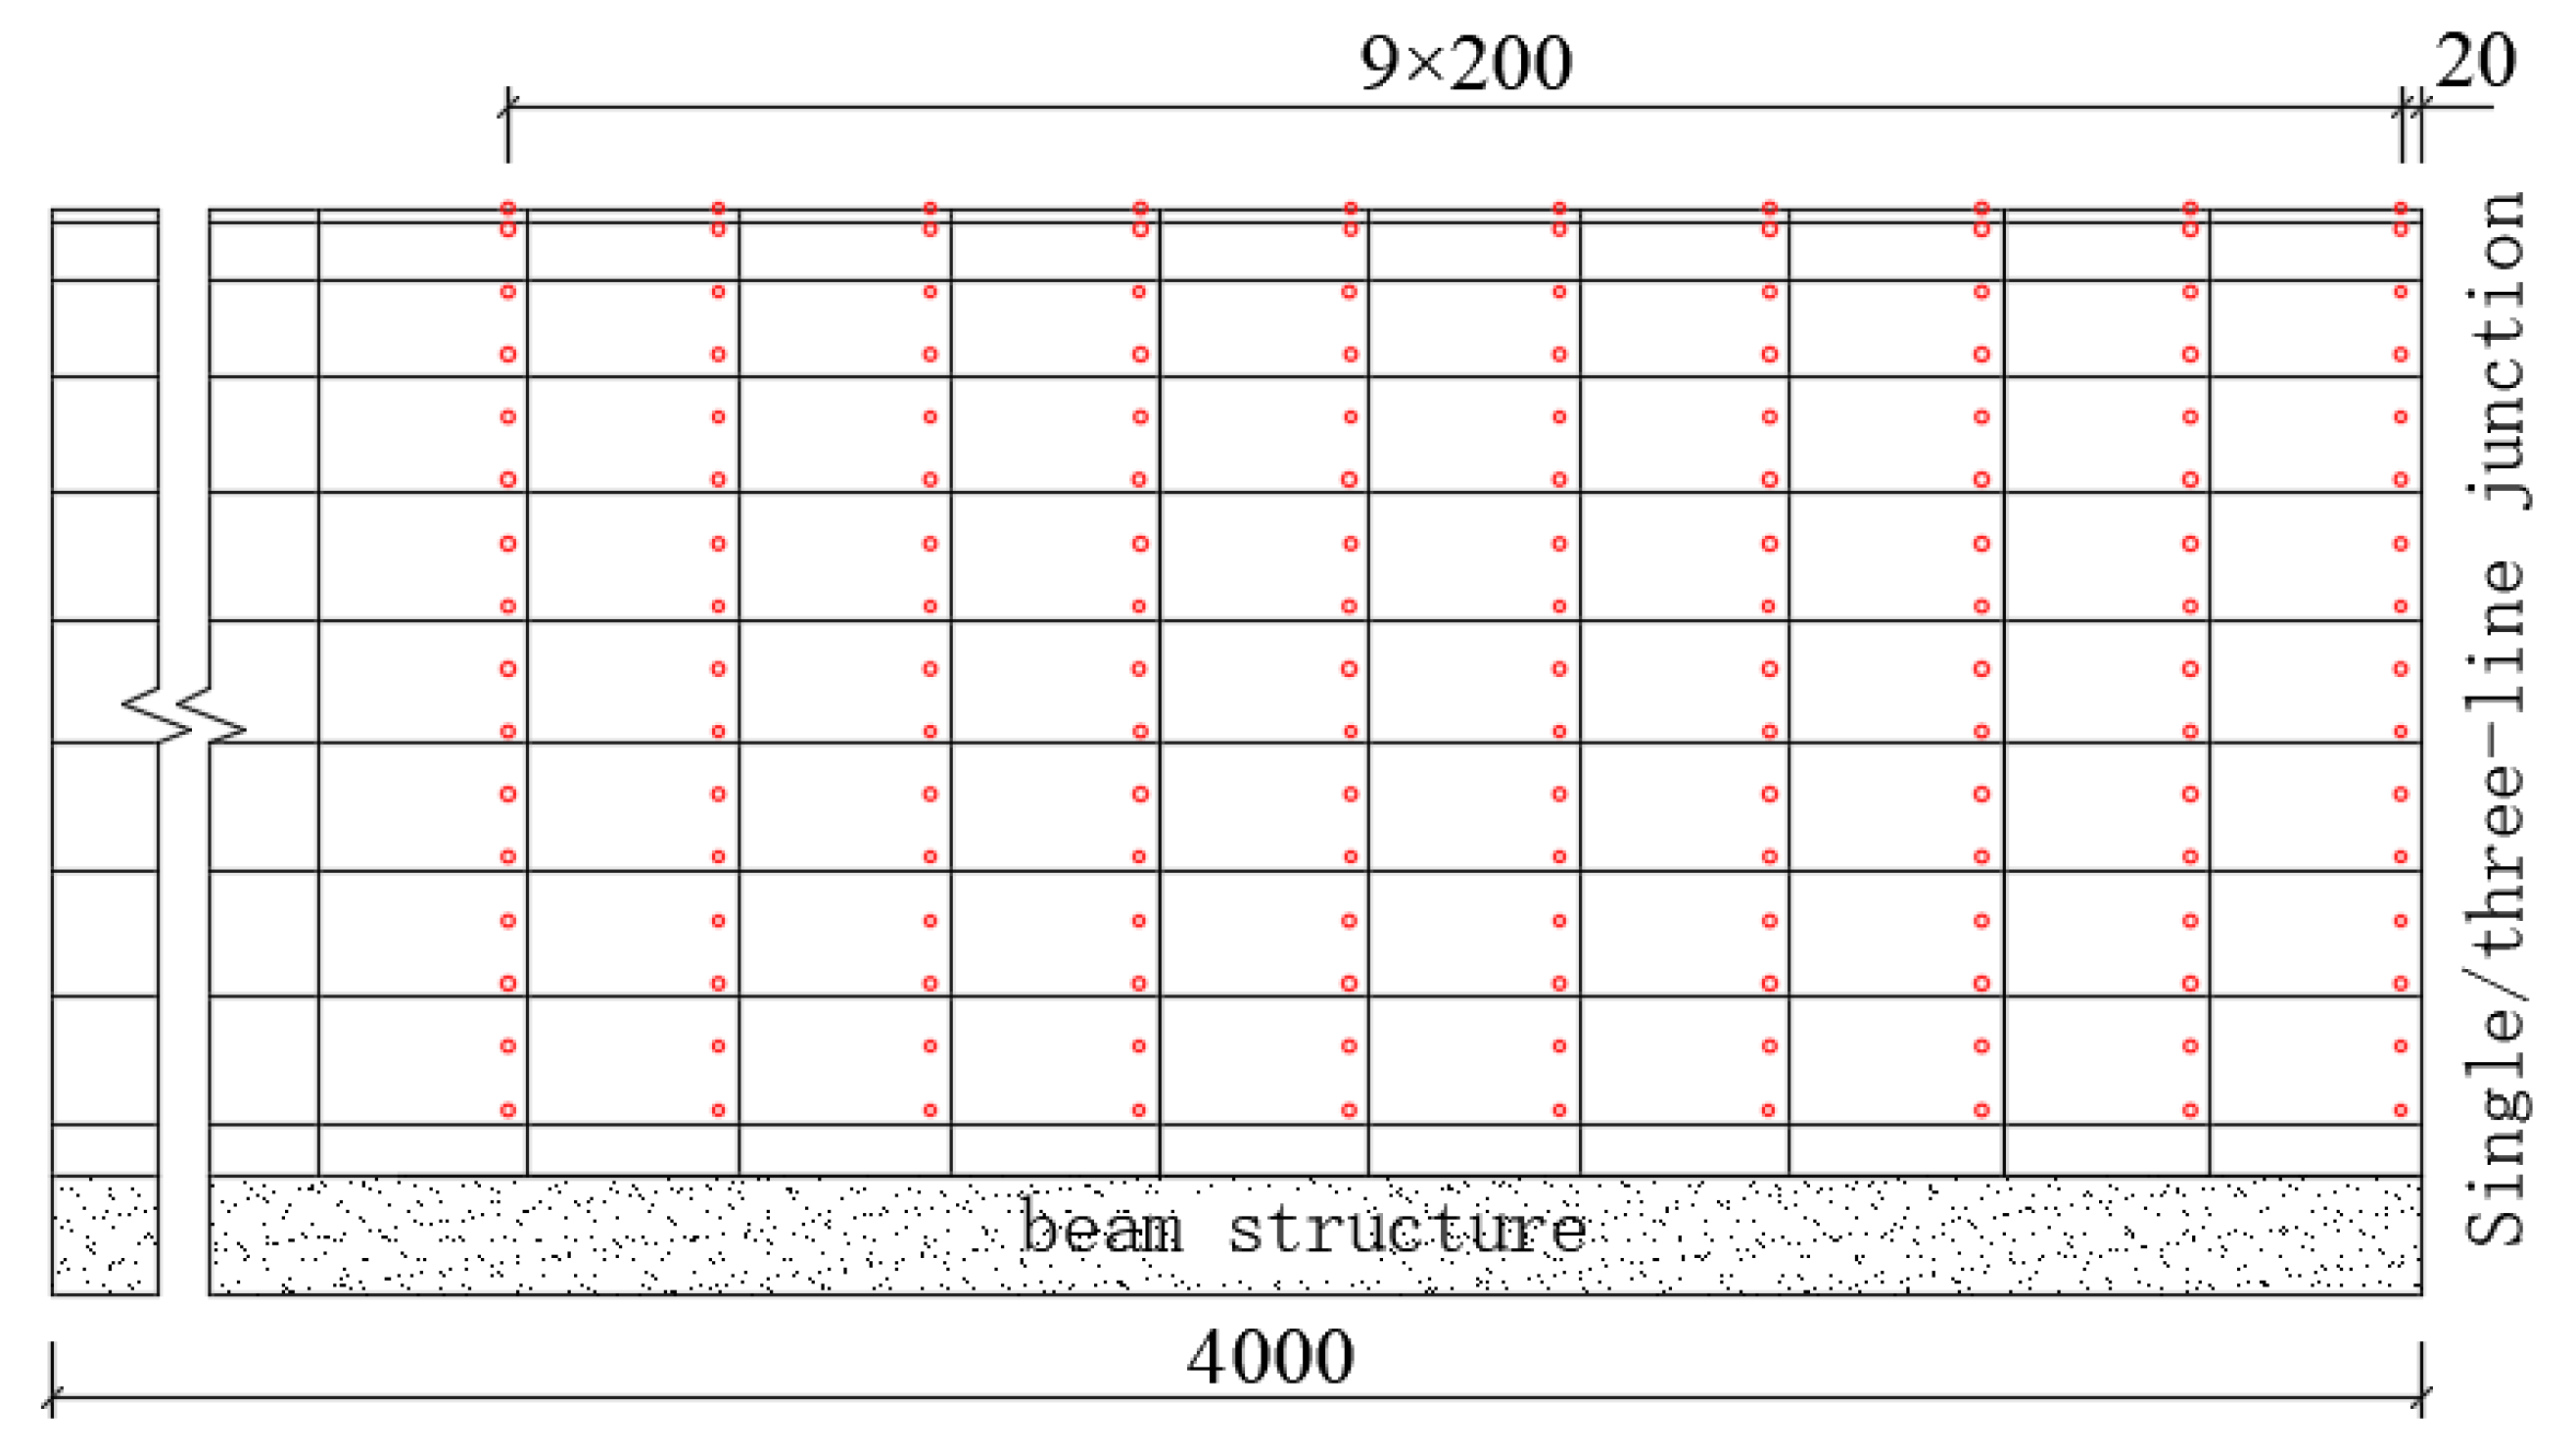
The vertical arrangement of the measurement points is shown in
Figure 4. The measurement points on both the single-track and three-track bridges are arranged in 10 columns along a longitudinal interval of 200 mm. These points are positioned 20 mm on the left and right sides of the junction.
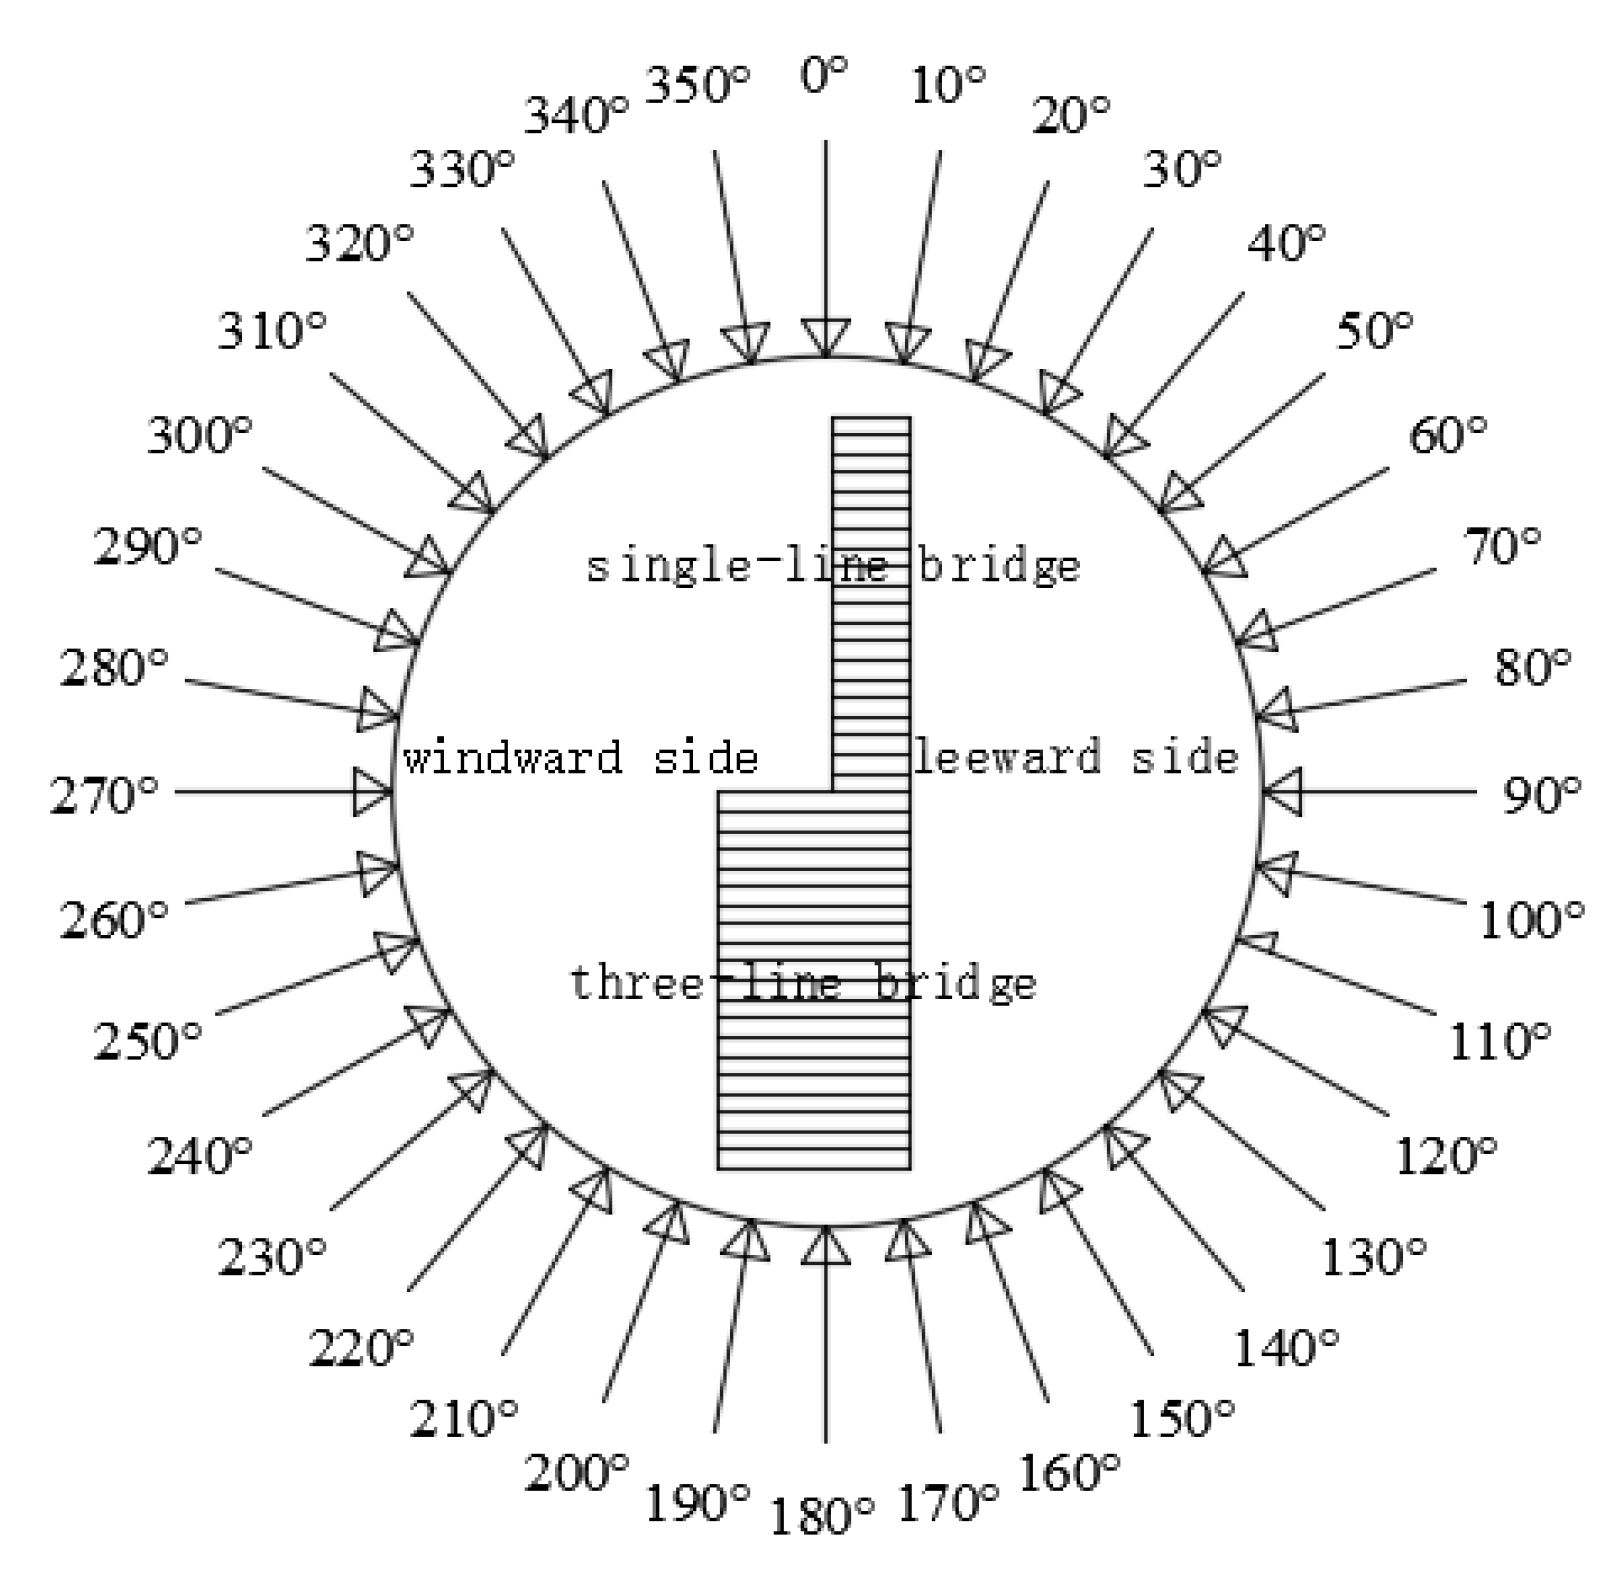
The model is installed on the turntable of the wind tunnel test section. Each point is sampled for 60 s at 256 Hz, allowing for the simultaneous acquisition of pressure time histories for all measurement points. The setup of the wind direction angle and the model coordinate axis is shown in
Figure 5. The incoming flow along the length direction of the sound barrier is defined as β = 0°, and the wind tunnel test encompasses 36 working conditions, spaced at 10° intervals from 0° to 360°. The test wind speed is 8 m/s, and each wind direction angle is measured twice. The turbulence intensity at the height of the test section model is approximately 15%, and the lateral uniformity of the flow field is about 0.5%.
2.3. Wind Pressure Load Test
During the test, the instrument utilized to measure the total pressure and static pressure at the flow field measurement point and the surface of the sound barrier is the Scanvalve electronic pressure scanning valve from the United States. The wind pressure coefficient of each measurement point is calculated using the following formula:
where
pi is the pressure at each pressure measurement point of the model;
pH is the reference static pressure at the height;
is the air density;
VH is the average wind speed in the undisturbed area in front of the model, which is equivalent to the average wind speed at the maximum height of the sound barrier.
The mean value and root-mean-square of the wind pressure coefficients reflect the average wind pressure and the fluctuating wind pressure characteristics at pressure measurement point i, respectively, and are defined as follows:
where
are the average and fluctuating wind pressure coefficients at the measurement point i, respectively;
N is the number of sampling points in the pressure measurement test.
Due to the large number of measurement points and the extensive volume of data, the average along the bridge direction of the collected data is used as the final cross-section measurement partition result. The mean wind pressure coefficient and fluctuating wind pressure coefficient for each partition are calculated using the following formula:
where
is the area of each measuring point;
is the sum of the area of each measuring point.
Due to the presence of fluctuating wind pressure, it is necessary to calculate the extreme pressure distribution on the surface of the sound barrier. The extreme pressure (
) is expressed as the sum of the fluctuating pressure coefficient and the average pressure coefficient, that is,
where
g is the peak factor. The theory of probability and statistics indicates that when the pressure time series is a smooth Gaussian process, and the peak factor is 3.5, the actual occurrence of the instantaneous pressure does not exceed the extreme value of the pressure determined by Equation (6) at a probability level of 99.9%.
The wind pressure symbol in this study is defined as follows: relative to the surface of the semi-closed sound barrier, pressure that is upward or outward is considered negative, and pressure that is downward or inward is considered positive.
2.4. Computational Fluid Dynamic (CFD) Simulation Calculation of Ambient Wind Loads
This study simulates the wind field environment of the full-frame semi-closed sound barrier on a single-track bridge and a three-track bridge in the leeward direction (wind direction angle 90° in
Figure 5) and the windward direction (wind direction angle 270° in
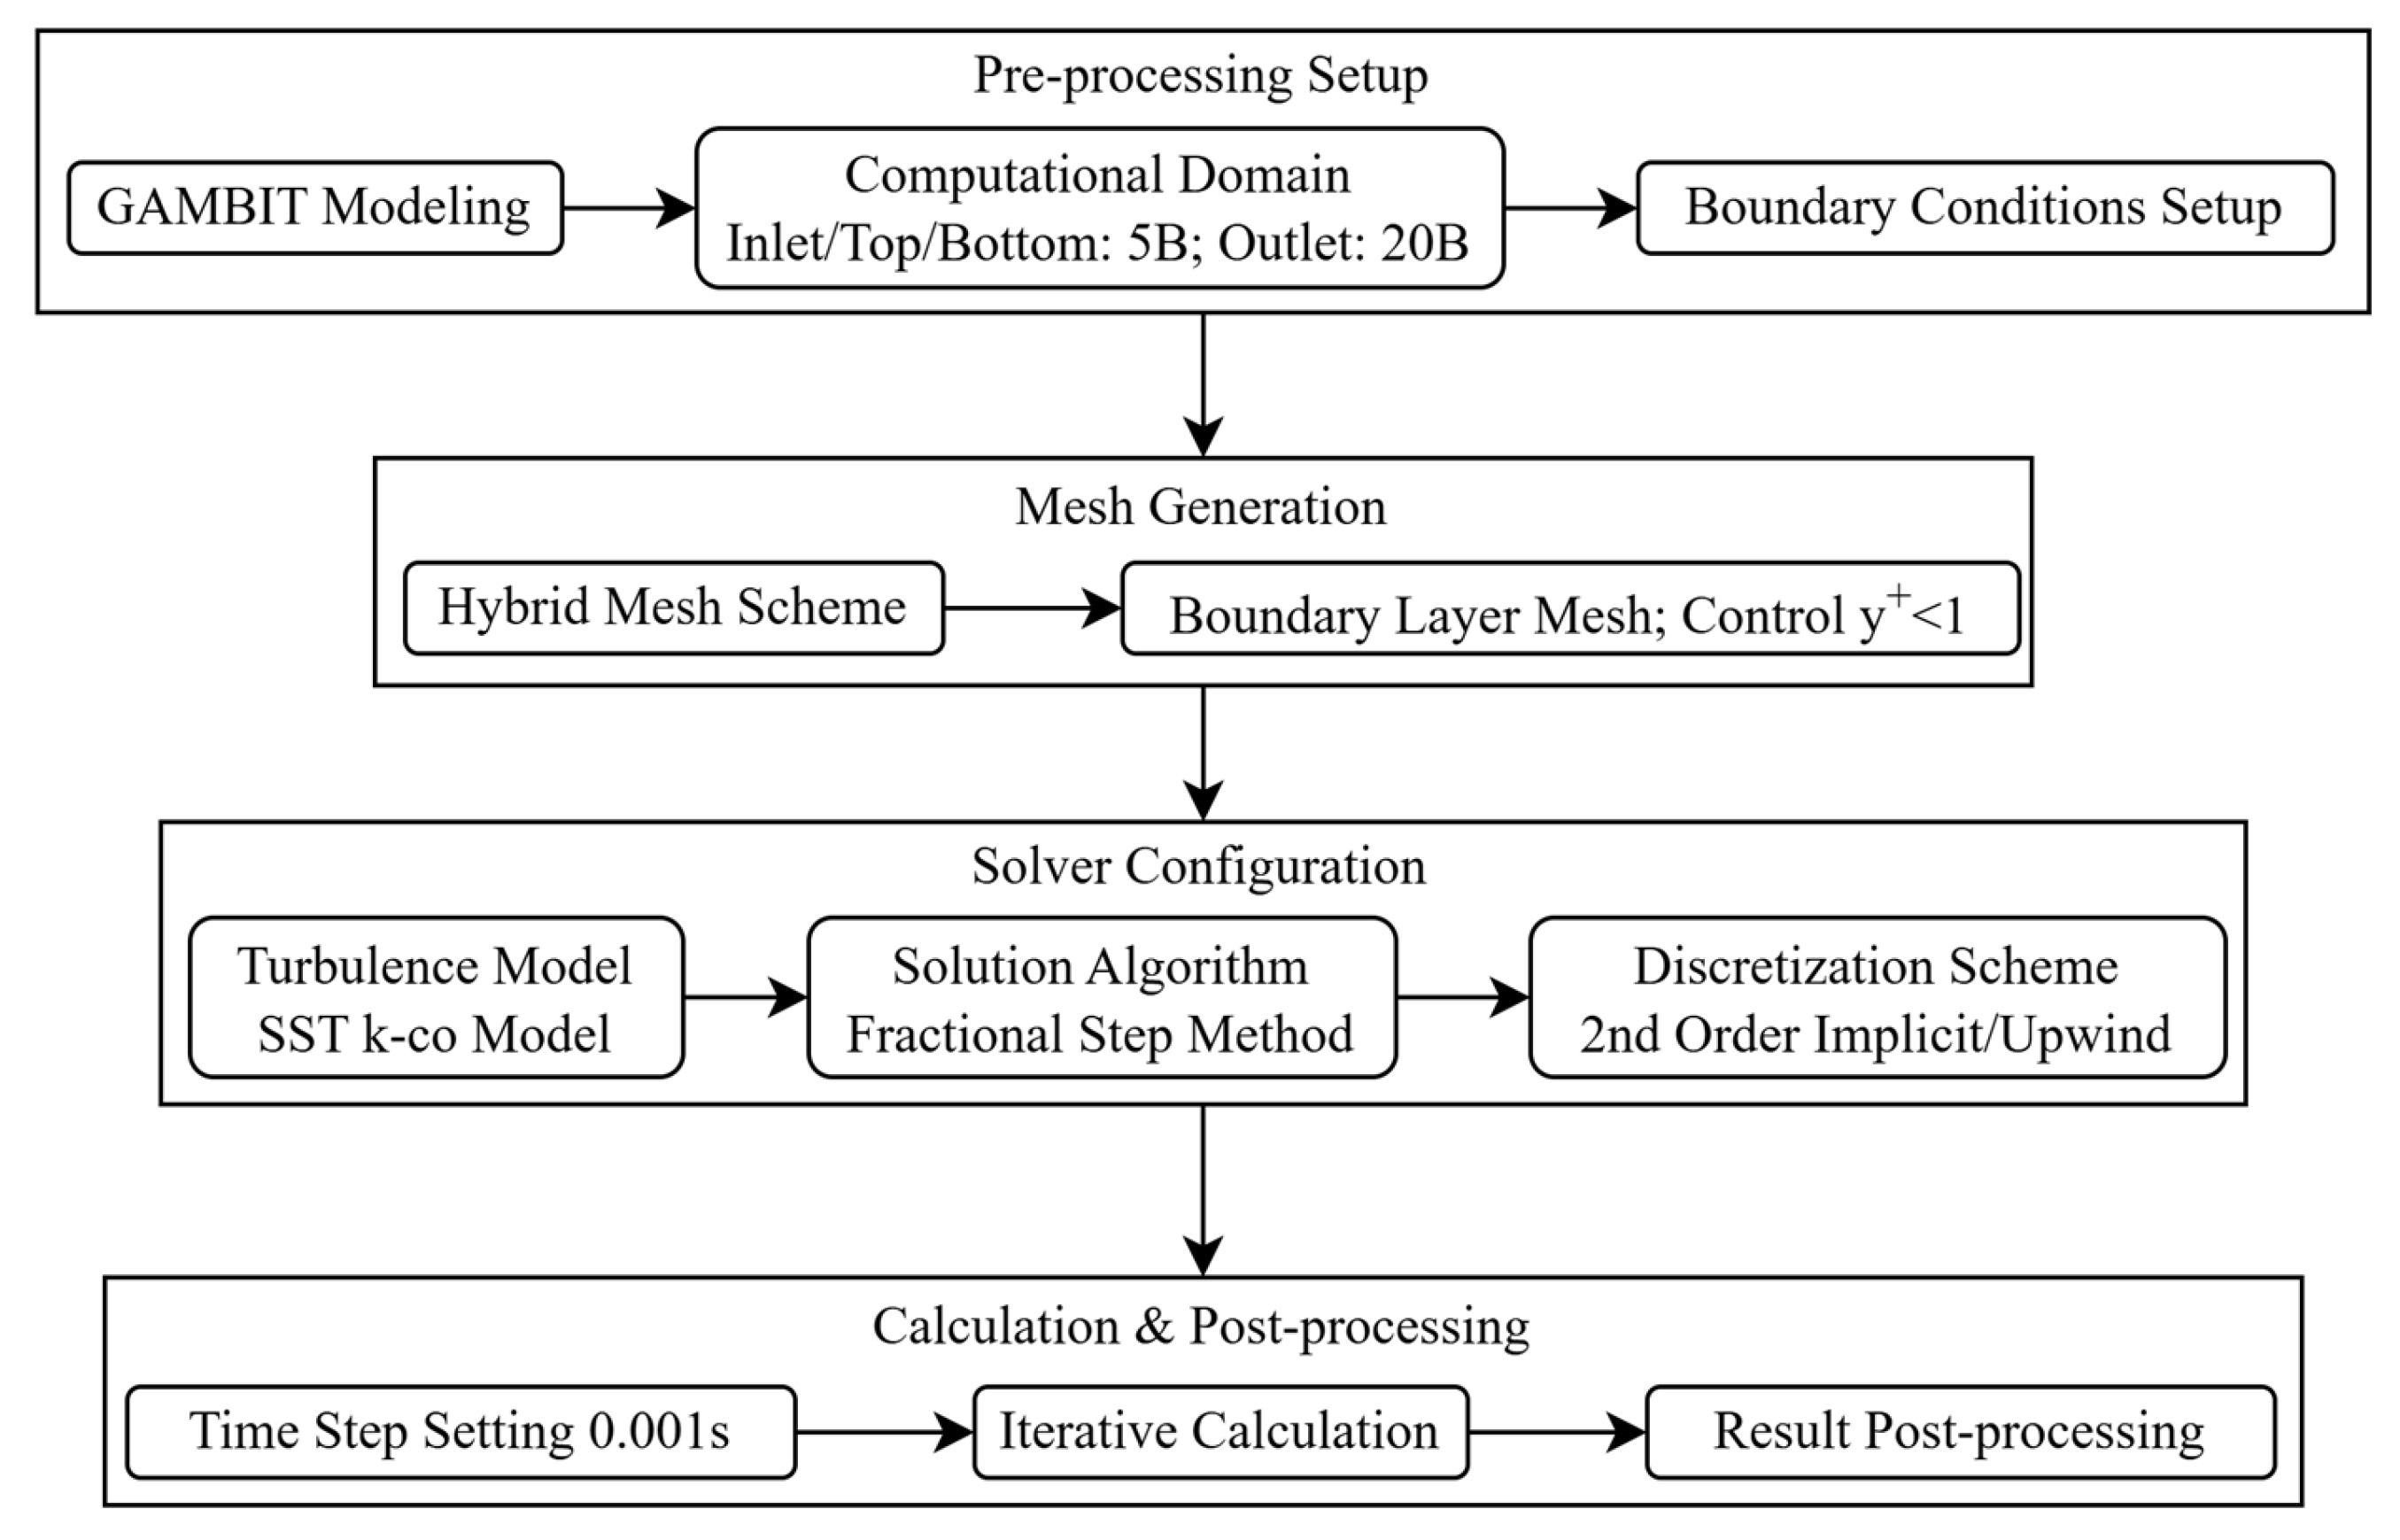
Figure 5) to analyze the characteristics of wind pressure distribution on a sound barrier under crosswind using FLUENT software. The modeling process is shown in
Figure 6.
The pre-processing software GAMBIT 6.3.26 is utilized to construct the numerical model. Based on the provisions of “D.2 Virtual Wind Tunnel Test Area and Boundary Conditions” in the “Code for Wind-Resistant Design of Highway Bridges (JTG/T 3360-01-2018),” the distance from the entrance and the top and bottom sides to the experimental model is set to 5B, and the distance from the exit to the model is set to 20B, where B is the width of the bridge segment model. The inlet of the computational domain is considered as a uniform incoming flow, and the inlet boundary condition is set to velocity-inlet. The pressure difference at the outlet is considered to be zero, and the boundary condition is set to pressure-out. The upper and lower boundaries are set as symmetrical boundaries (Symmetry). The bridge section and its ancillary components are set as non-slip solid wall boundaries (wall).
For the division of the element mesh, grid models with different densities and types were first constructed, and numerical simulations were carried out under the same boundary conditions and calculation settings. The variation in surface wind pressure coefficient with grid density was compared and analyzed. At the same time, the grid density is determined by referring to the grid division standard of similar structural numerical simulation in the relevant literature (such as the y+ value corresponding to Reynolds number) and combining with engineering experience. The results show that when the hybrid grid scheme is adopted, when the grid density reaches a specific threshold, the calculation result of the wind pressure coefficient on the surface of the sound barrier changes by less than 5%, and the solver has high computational efficiency. At the same time, the calculation results under the grid setting are in good agreement with the wind tunnel test data, indicating that the grid setting adopted can meet the accuracy requirements of this study.
The hybrid mesh scheme considers the accuracy, speed, and flexibility of the solver. Structured meshes and unstructured quadrilateral meshes are utilized to divide the peripheral flow field and the area near the bridge, respectively. The computational Reynolds number is 5 × 10
4, and boundary layer mesh control is maintained with y
+ less than 1. The mesh system is shown in
Figure 7. The turbulence model selected is the SST k-ω model, which has a wide application range, high precision, good stability, and strong adaptability to flow around bluff body cross-sections. In addition, the SST k-ω model has recognized accuracy in simulating large separation flow and inverse pressure gradient in the blunt body section, which was used in the full-scale three-dimensional computational fluid dynamics simulation of the Queensferry Crossing Bridge, and the aerodynamic behavior of the bridge midspan and central tower under the action of a real wind field is successfully simulated [
18]. The coupled pressure-velocity algorithm used in the solver is the Fractional Step method, which has the same second-order accuracy as the PISO algorithm. The second-order implicit method and the second-order upwind scheme are employed for temporal and spatial discretization, respectively. The time step is set to 0.001 s to meet the Courant number requirement.
3. Test Results
3.1. Mean Wind Pressure Distribution
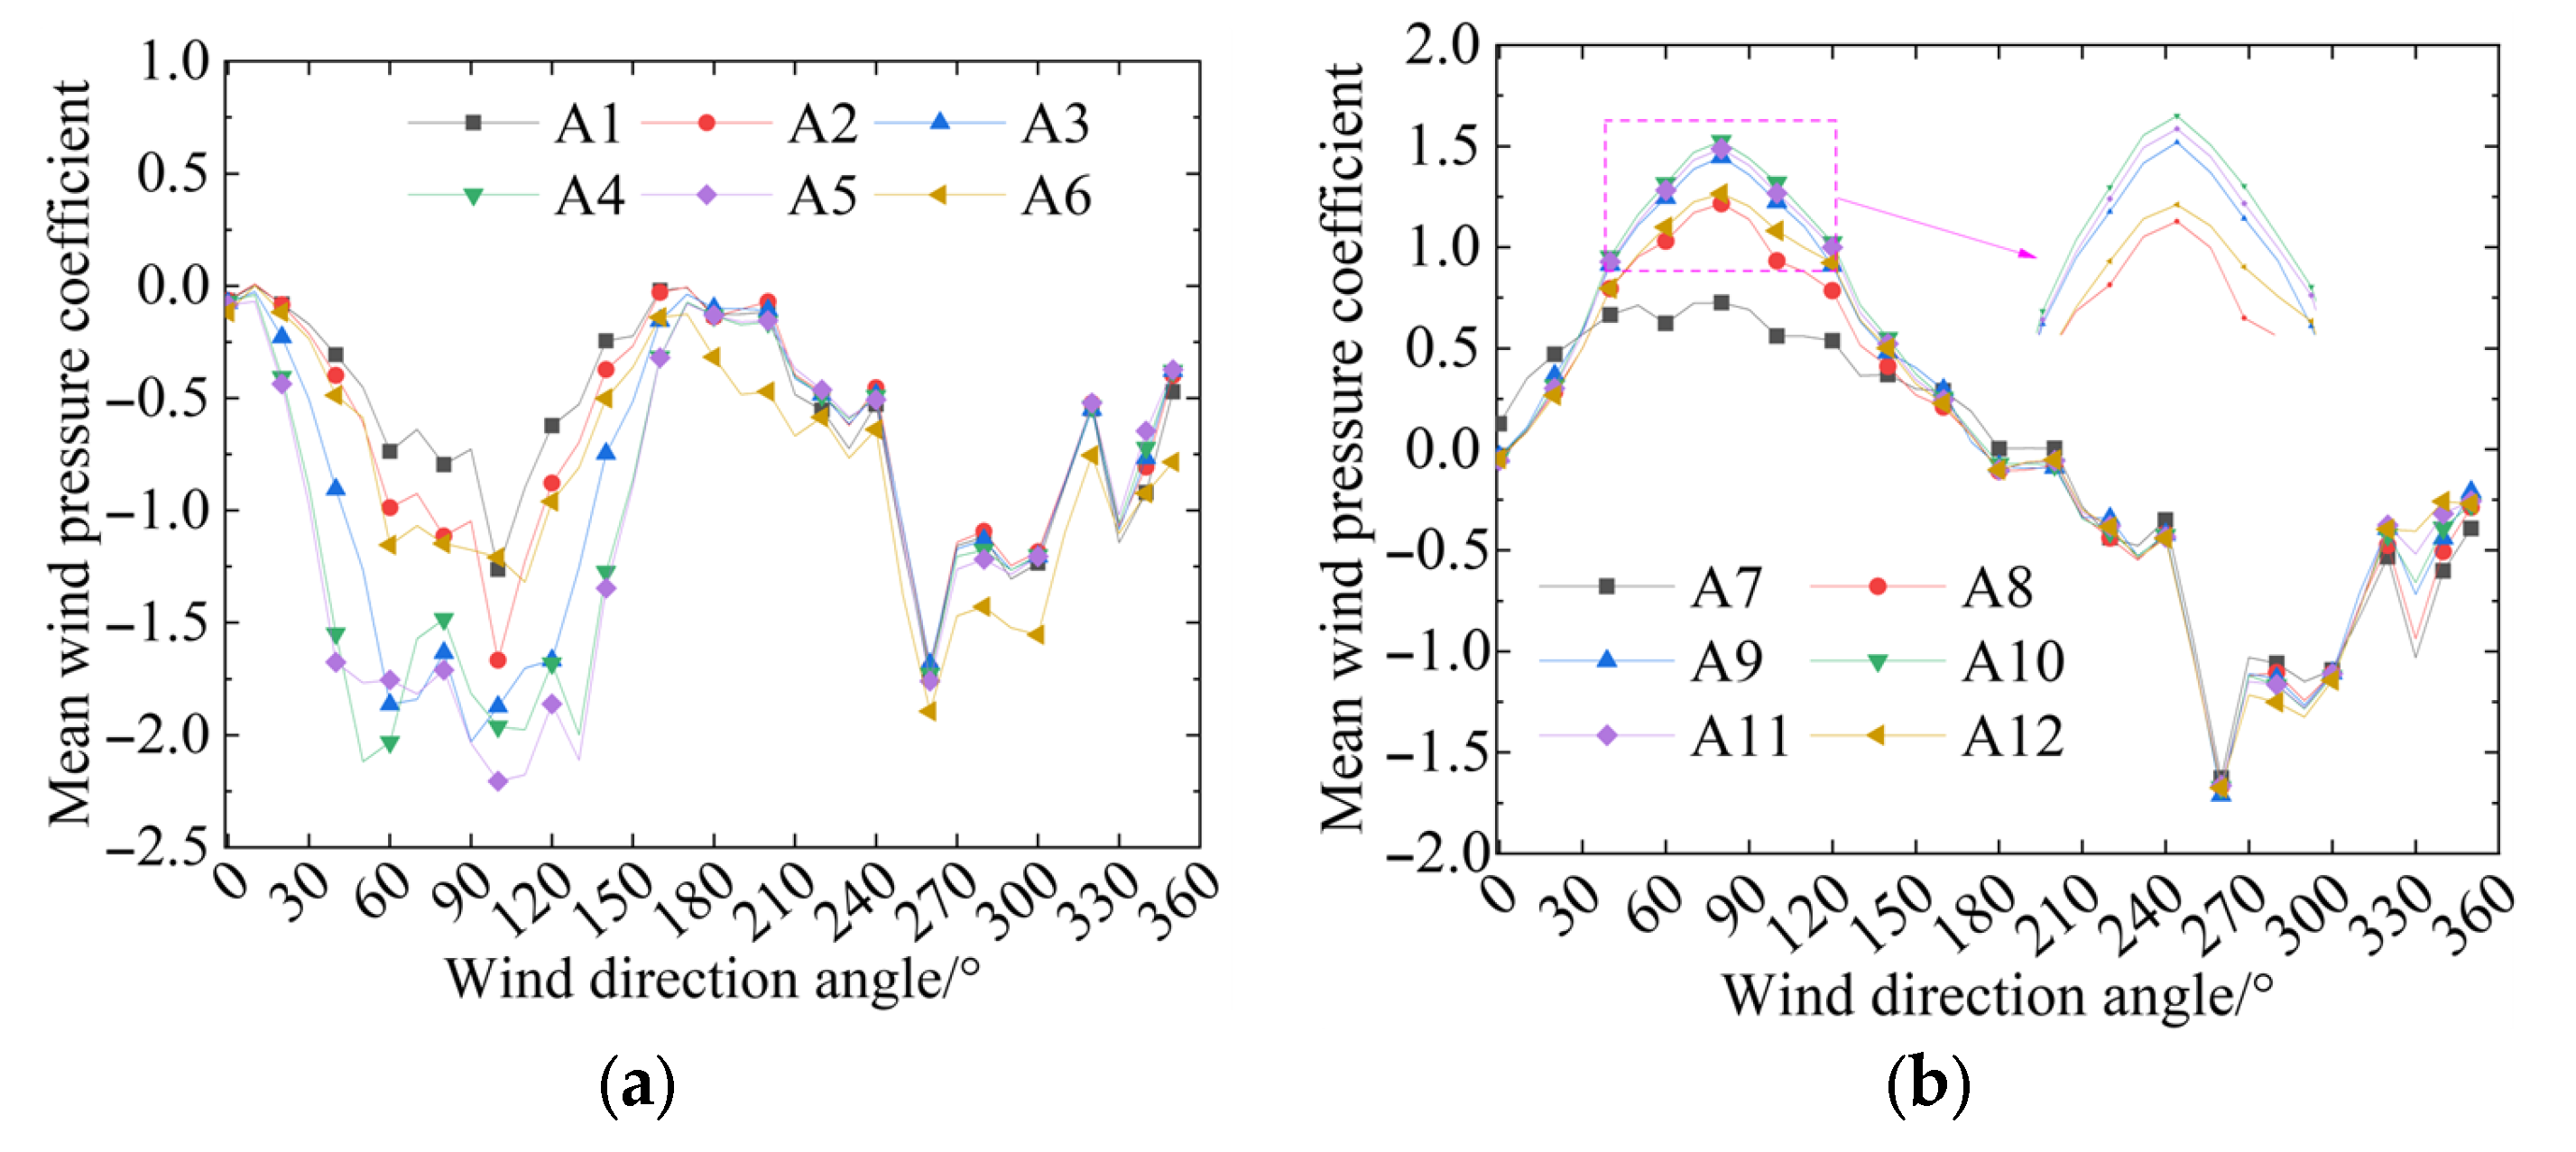
The characteristics of the mean wind pressure distribution on the surface of the sound barrier are reflected using the mean wind pressure coefficient. The distribution of mean wind pressure coefficients in each partition of the semi-enclosed sound barrier of the single-track bridge is shown in
Figure 8.
Figure 8 indicates that with the change in wind direction angle, the area above the sound barrier of the single-track bridge (partitions 1–5) is mainly under suction, and the distribution range of the mean wind pressure coefficient is [−2.3, 0.1]. The side area (parts 6–12) primarily exhibits an alternating distribution of pressure and suction, with the distribution range of the mean wind pressure coefficient primarily in the range of [−2.0, 1.7].
When the wind direction angle is in the range of [170, 350], the mean wind pressure coefficients of each partition in the upper region are relatively consistent. When the wind direction angle is in the range of [0, 170], the distribution of the mean wind pressure coefficient is more irregular, and the most unfavorable wind pressure coefficients vary across different parts. The variation in the mean wind pressure coefficient of each partition in the side area is generally similar under different wind direction angles. Since partitions A6 and A7 are located at the corner, flow separation occurs at these positions, resulting in a complex flow field distribution and a noticeable difference in wind pressure coefficients compared to other locations.
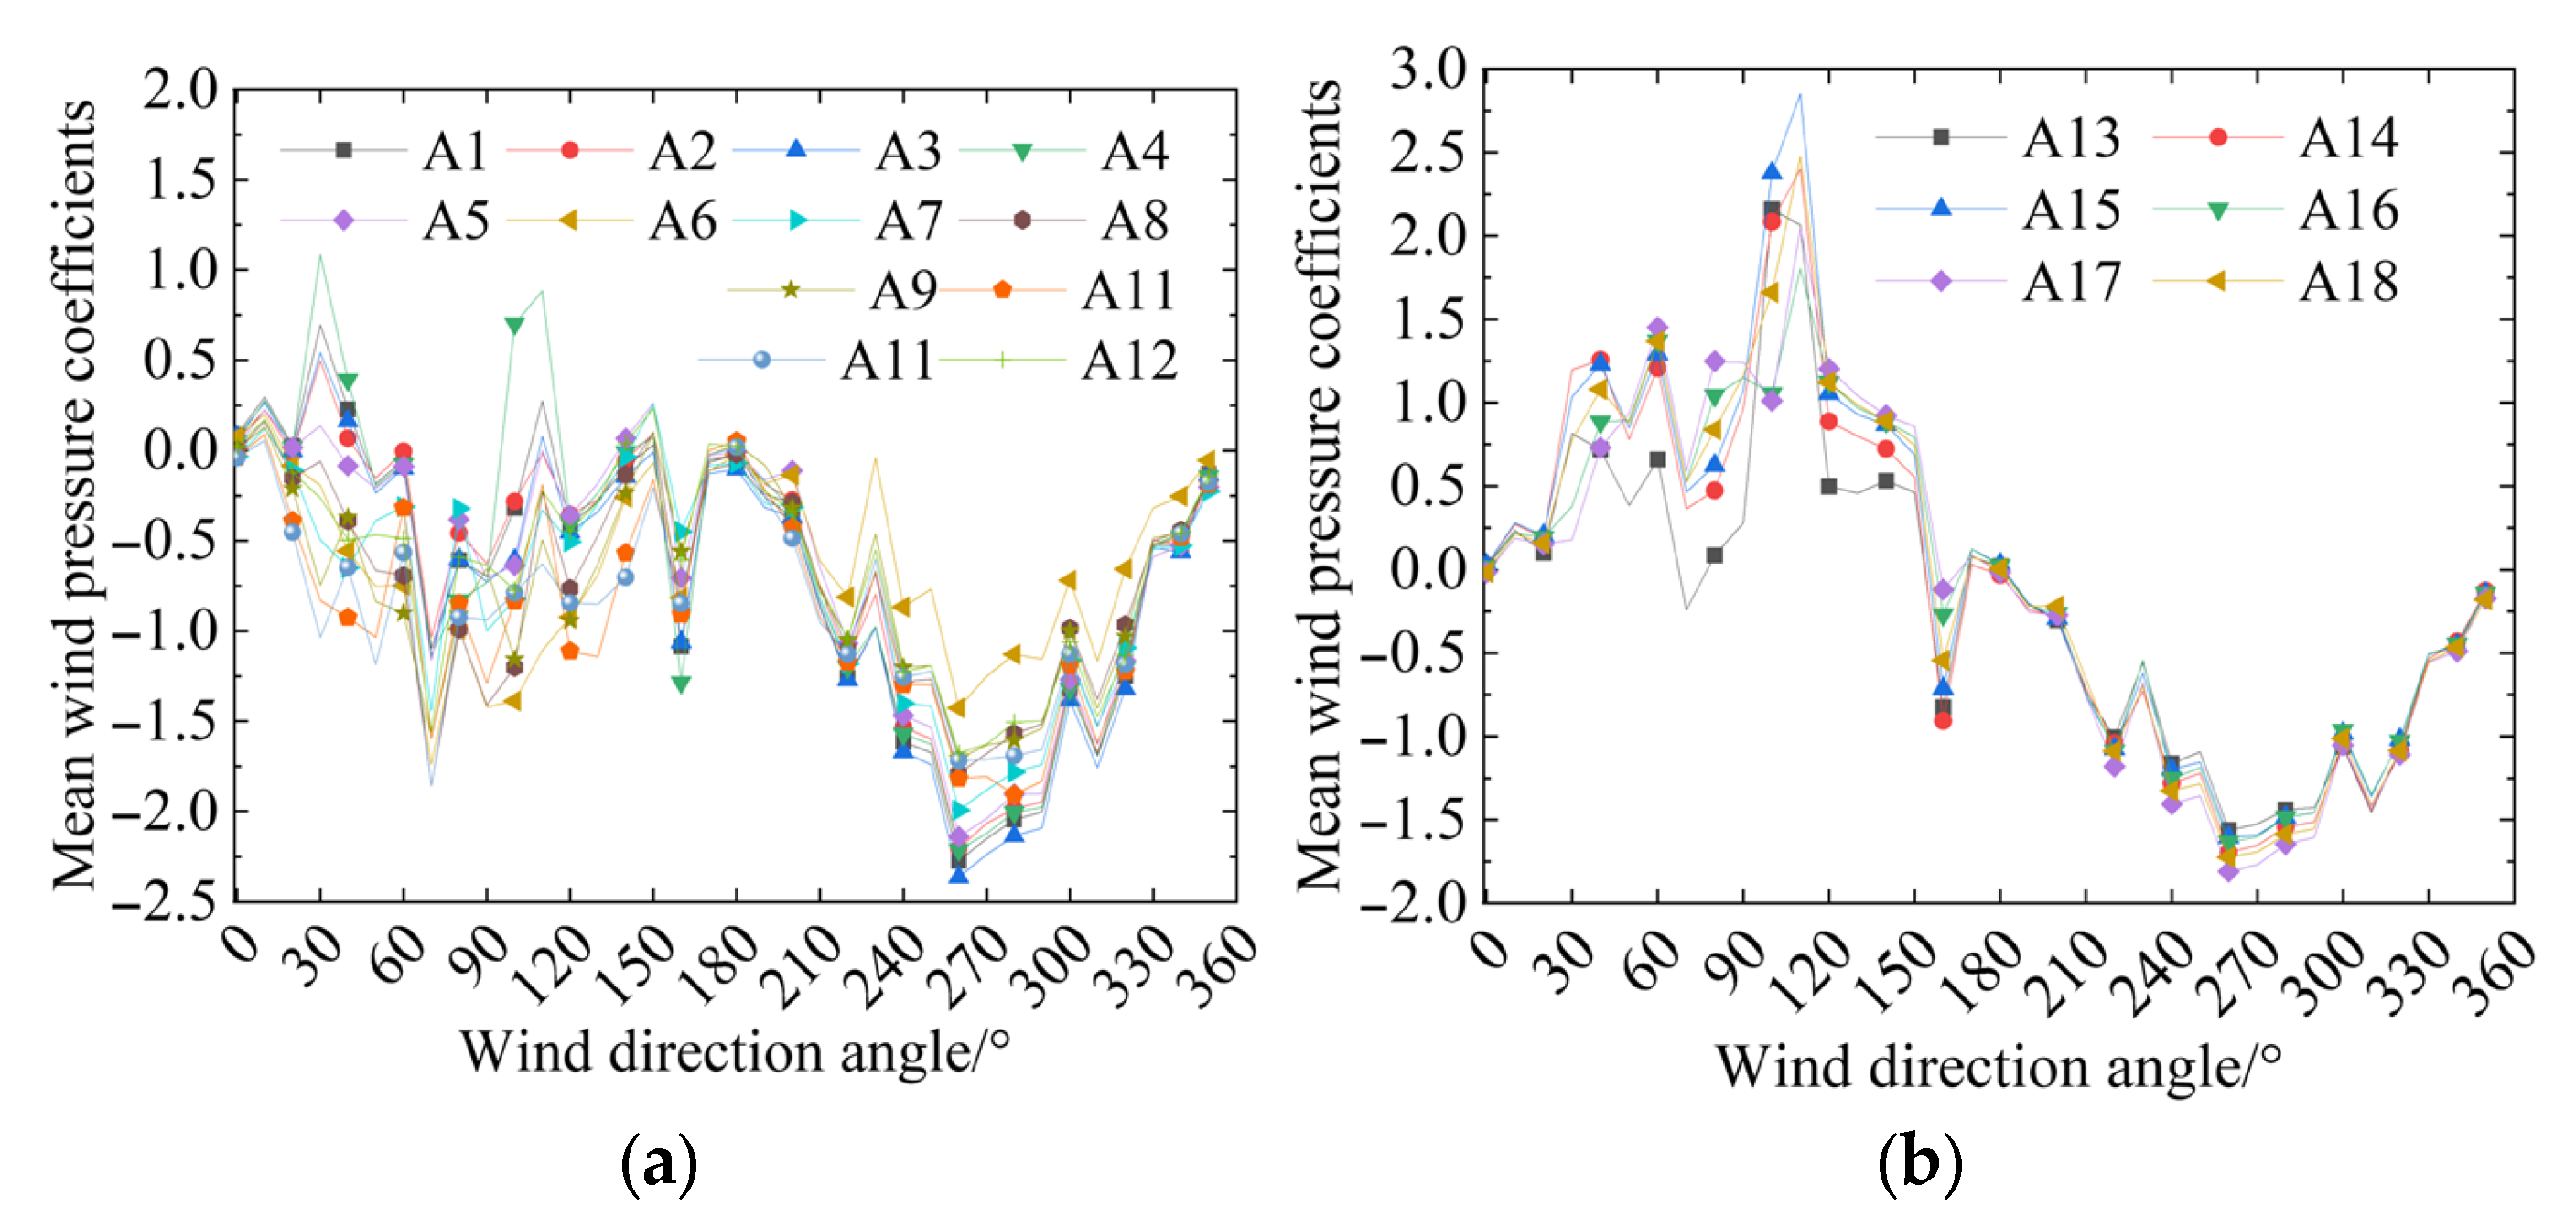
Figure 9 shows the distribution of the mean wind pressure coefficients for each partition of the semi-enclosed sound barrier on the three-track bridge. It demonstrates that the trend of the mean wind pressure coefficient of the three-track bridge is similar to that of the single-track bridge. With the change in wind direction angle, the upper region (partitions 1~12) is mainly subject to suction, and the mean wind pressure coefficient distribution range is [−2.4, 1.1]. The wind direction angle at which maximum suction occurs appears near 260°, and this variation is caused by the upstream and downstream positions of the single-track bridge and the three-track bridge.
The maximum average negative pressure of the two sound barriers in the windward and leeward wind field environments appears near the corner between the horizontal and vertical sections, namely, the single-track bridge A5 and A6 measurement point partitions and the three-track bridge A11 and A12 measurement point partitions. The pronounced negative pressure peaks observed at critical corner regions can be attributed to a well-defined flow separation mechanism. As the crosswind impinges on the windward edge of the semi-enclosed barrier, the flow separates, forming a shear layer that detaches from the surface. This shear layer subsequently rolls up into a transiently anchored vortex core, which remains near the corner. The low-pressure region associated with this vortex core is directly responsible for the high suction peaks recorded. Conversely, the adjacent side areas experience a more attached flow, resulting in a relatively moderate and uniform pressure distribution. In general, for both the single-track bridge and the three-track bridge sound barriers, the mean wind pressure distribution exhibits a similar trend with the wind direction angle. The wind direction angles corresponding to the maximum mean wind pressure in the side area differ, but are all near the 90° wind direction angle. This is because, when the wind direction angle is 90°, the incoming flow is directly obstructed by the sound barrier, and the static wind force acting on the sound barrier is greater. When there is a deviation of more than 90 ° from the 90° wind direction angle, a three-dimensional effect occurs. Specifically, after the incoming flow is rolled up on the leeward side of the single-track bridge, it interferes with the stable flow field behind the semi-closed sound barrier of the three-track bridge, generating vortices that increase the static wind suction behind the sound barrier. Therefore, the maximum mean wind pressure coefficient in the side area of the three-track bridge sound barrier appears near 110°. However, the box body of the three-track bridge is significantly wider than that of the single-track bridge. The flow field after separation on the leeward side of the three-track bridge has little effect on the wake of the single-track bridge, resulting in the maximum mean wind pressure coefficient in the side area of the single-track bridge sound barrier still appearing near 90 °.
3.2. Fluctuating Wind Pressure Distribution
The fluctuating wind pressure coefficient can be utilized to reflect the adverse effects of fluctuating wind pressure on the sound barrier structure.
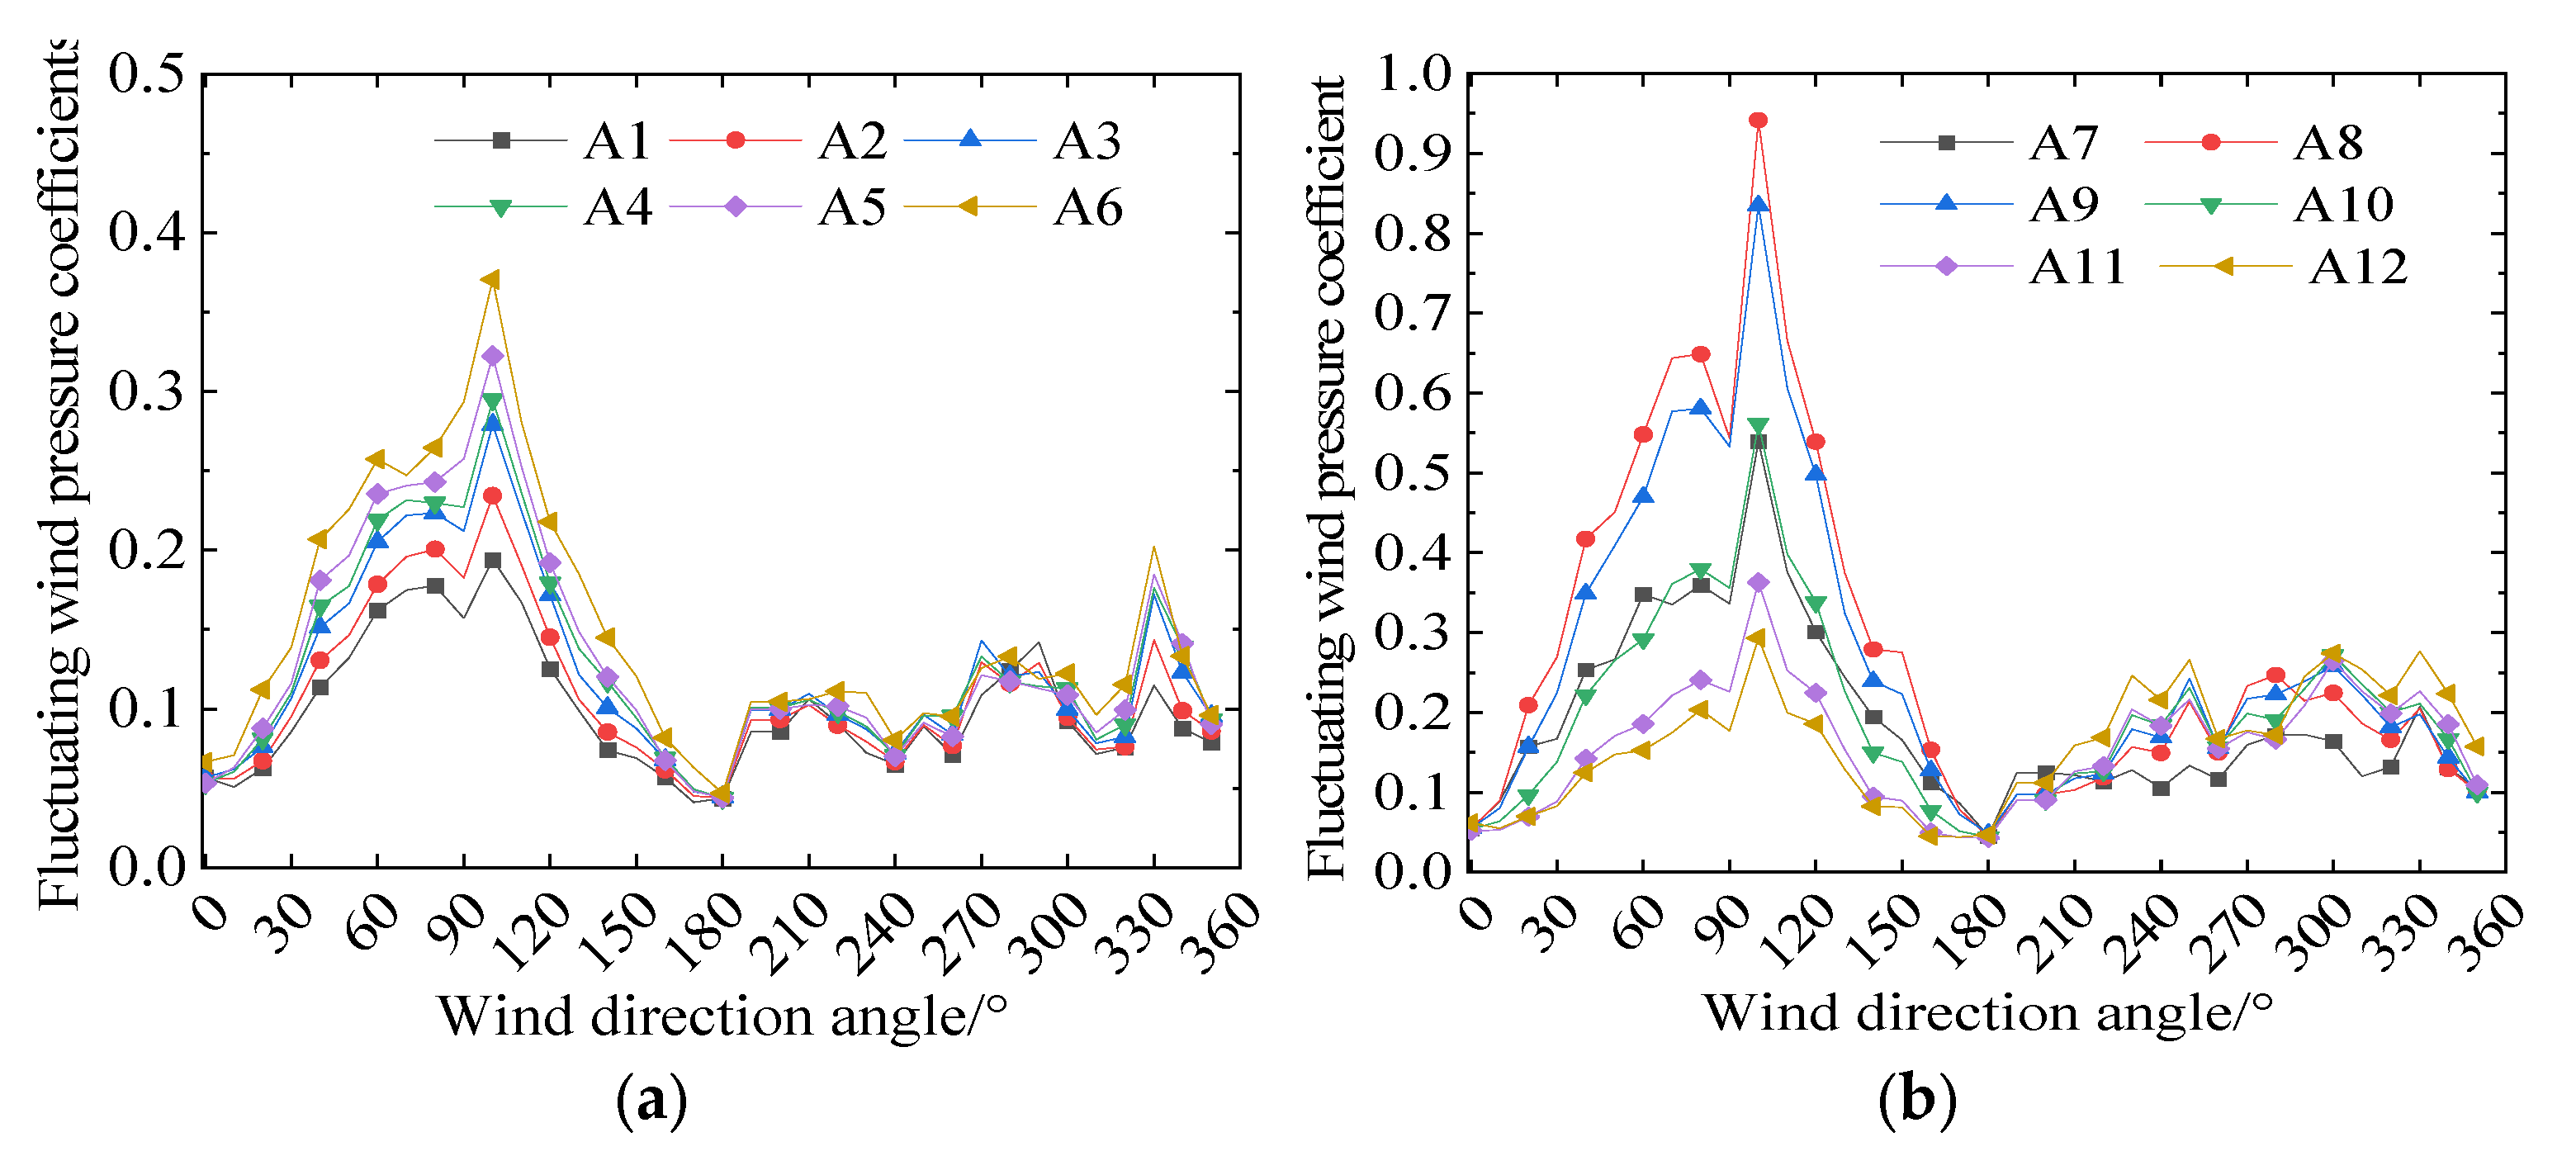
Figure 10 and
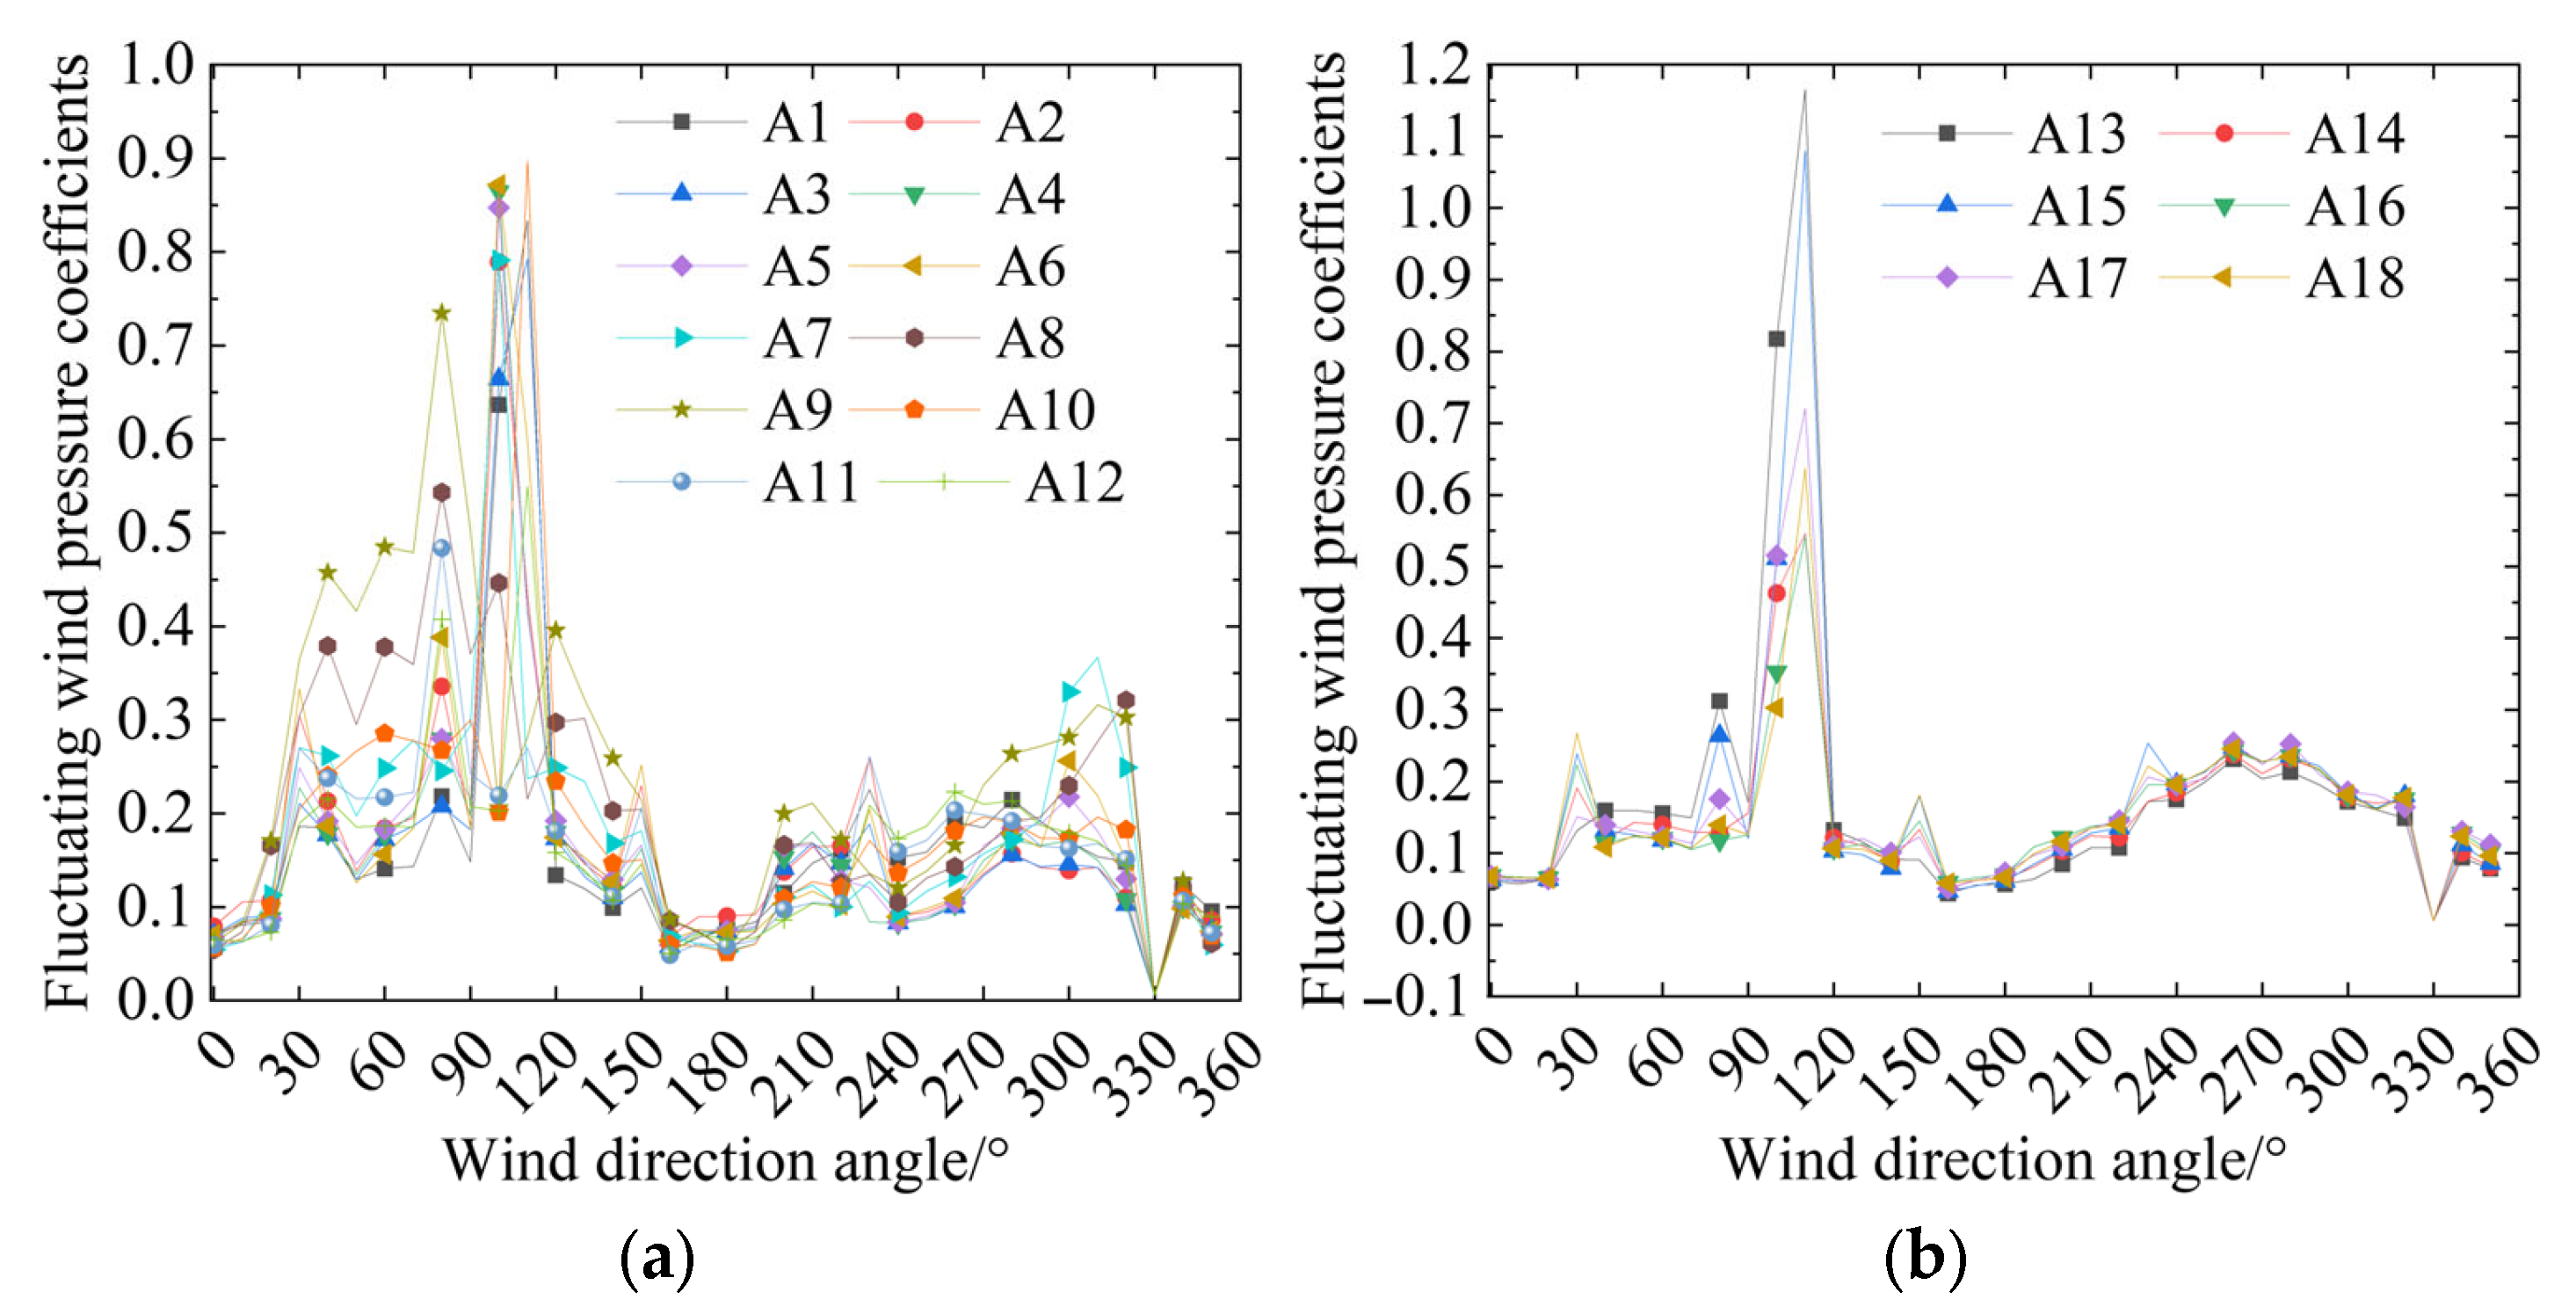
Figure 11 show the distribution of the fluctuating wind pressure coefficient on the surface of the semi-closed sound barriers of the single-track bridge and the three-track bridge under different wind direction angles.
Figure 10 exhibits that the distribution range of the fluctuating wind pressure coefficient in the upper area of the semi-closed sound barrier of the single-track bridge is [0.05, 0.37], and in the side area is [0.05, 0.96]. Between the wind direction angles of 50° and 120°, the fluctuating wind pressure coefficient in each partition of the single-track bridge is relatively high. The fluctuating wind pressure coefficients of partitions A5−A6 and A8−A9 are greater than those of the other partitions. Under the action of fluctuating wind, wind-induced vibration is more likely to occur at these locations, potentially resulting in the loosening and shedding of bolts on the sound barrier.
Figure 11 reveals that the distribution range of the fluctuating wind pressure coefficient in the upper area of the semi-closed sound barrier of the three-track bridge is [0.05, 0.9], and in the side area is [0.05, 1.15]. The distribution pattern of the fluctuating wind pressure coefficient on the surface of the semi-closed sound barrier of the three-track bridge is similar to that of the single-track bridge, but the values are higher. Therefore, the influence of fluctuating wind on the semi-closed sound barrier of the three-track bridge is more pronounced, and wind-induced vibration is more likely to occur.
Comparing
Figure 10 and
Figure 11 reveals that the fluctuating wind pressure distribution of the single-track bridge and the three-track bridge sound barrier changes abruptly near the 100° wind direction angle. This occurs because when the wind direction angle is 90°, the incoming flow is orthogonal to the bridge, and the three-dimensional effect of the wake generated around both the single-track bridge and the three-track bridge is weaker. Moreover, at this angle, the wake of the single-line bridge interacts strongly with the incoming flow of the three-line bridge, forming a complex vortex merging and interference effect, which leads to a sharp change in the wind pressure on the surface of the downstream sound barriers. When there is a 10° deviation in the wind direction, the box of the single-track bridge is narrower than that of the three-track bridge. The wake formed after the flow is rolled up on the leeward side of the single-track bridge floor interferes with the stability of the flow state downstream of the semi-closed area of the three-track bridge sound barrier, resulting in a complex turbulent flow and increasing the fluctuating wind pressure acting on the semi-closed sound barriers of both bridge types. As the wind direction angle increases further, the interference effect diminishes, and the fluctuating wind pressure is reduced.
3.3. Extreme Wind Pressure Distribution
The extreme wind pressure refers to the wind pressure generated by the maximum wind speed that the structure may encounter during the design life, which is the benchmark load for the wind-resistant design of the structure. Extreme wind pressure is a critical parameter for the wind-resistant design of the external sound barrier structure.
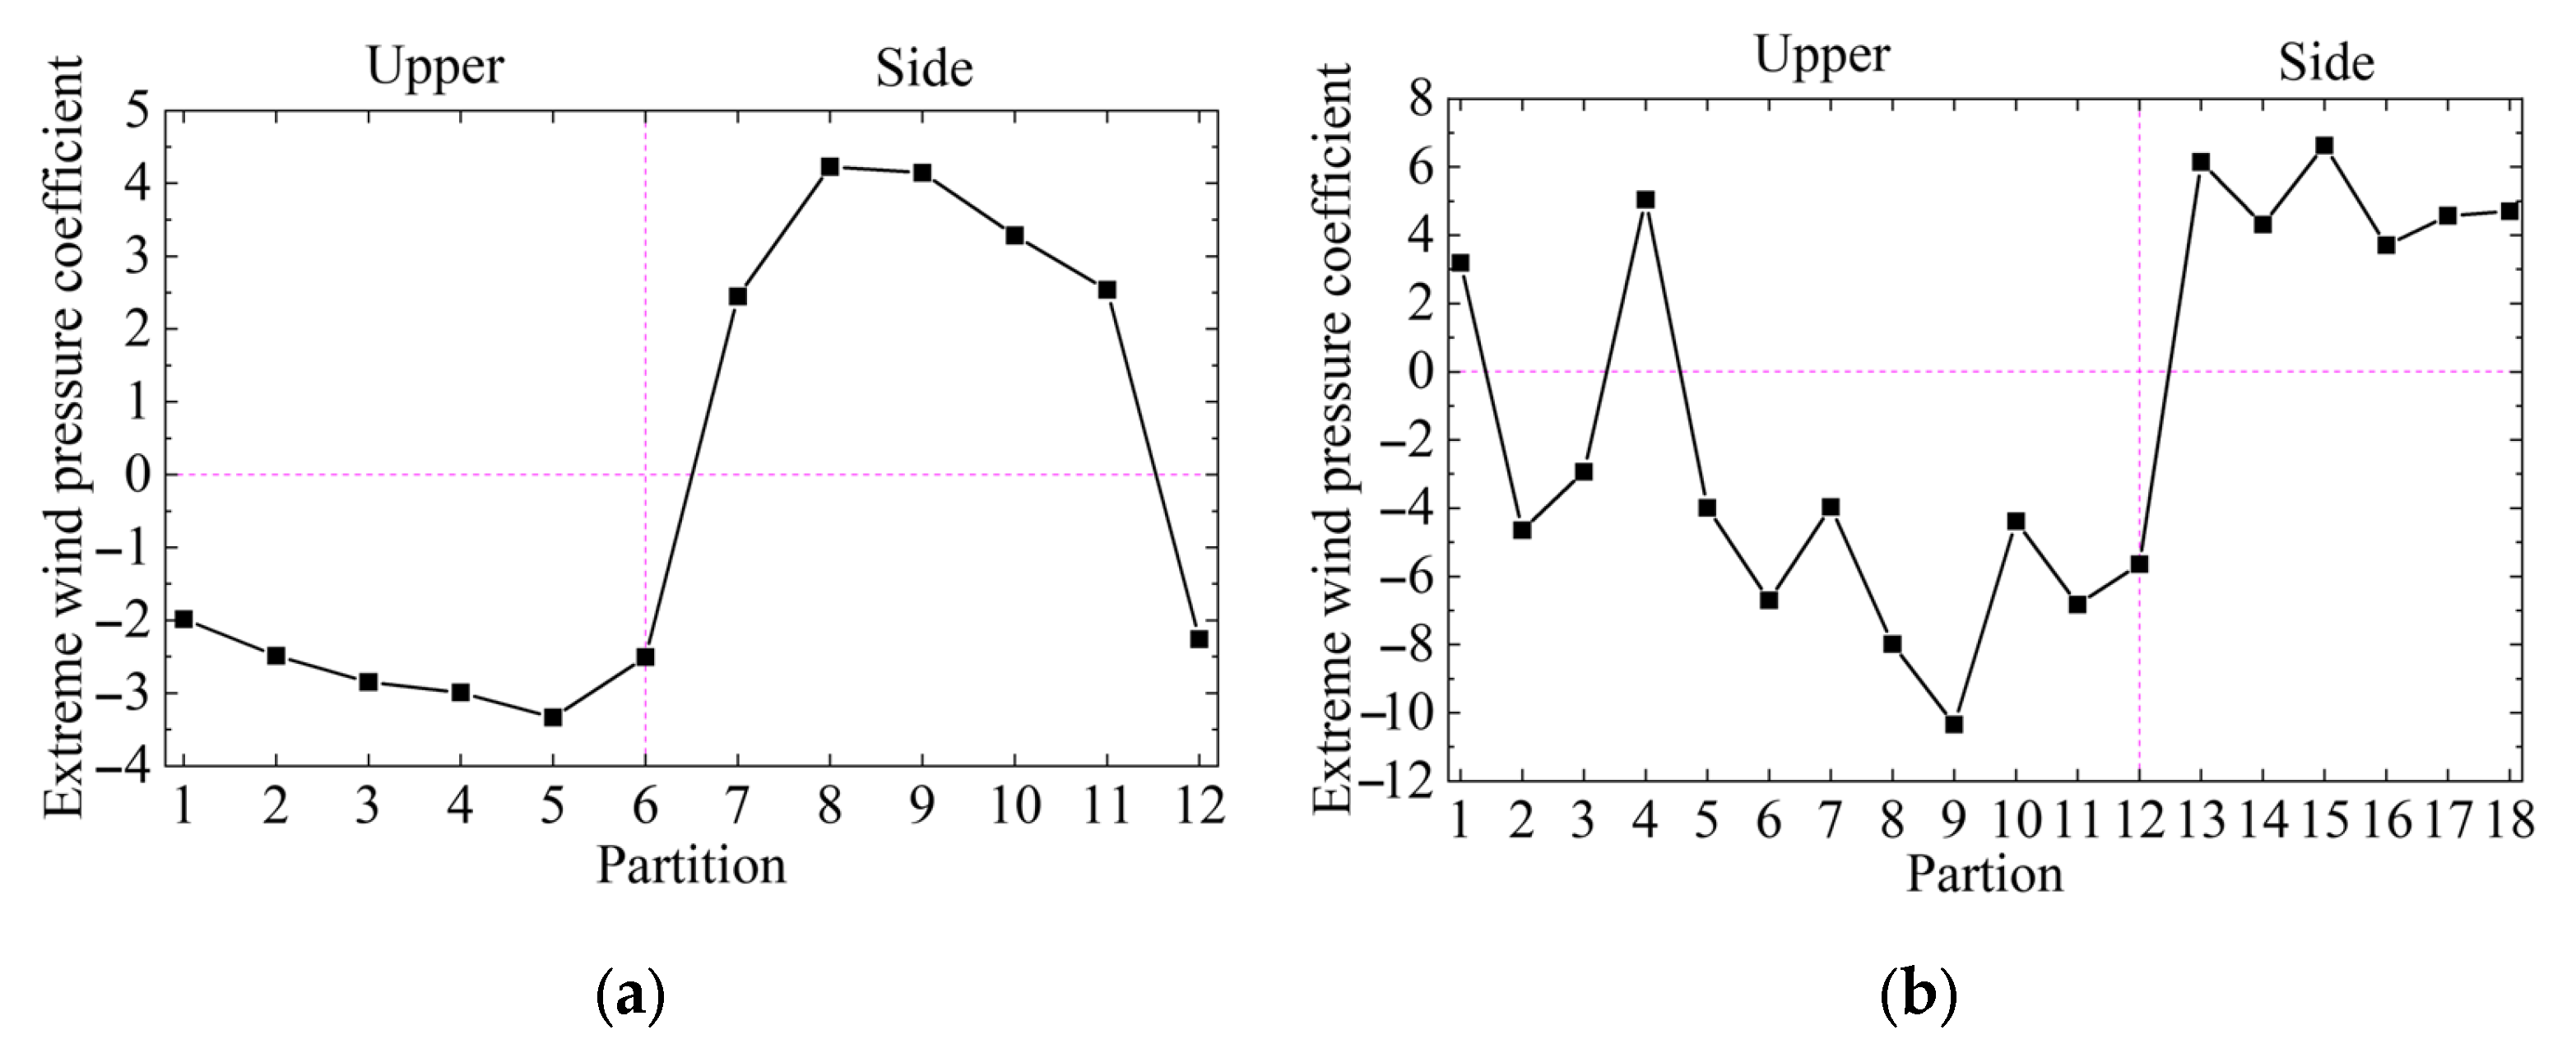
Figure 12 shows the distribution of the extreme wind pressure coefficients for each partition of the semi-closed sound barrier of the single-track bridge and the three-track bridge at wind direction angles of 0−360°.
The extreme wind pressure in the upper area of both sound barriers is negative, while in the side area it is positive. A comparison reveals that the extreme wind pressure coefficients for each partition of the semi-closed sound barrier of the three-track bridge are significantly higher than those of the single-track bridge sound barrier. Based on the previous analysis, under specific wind direction deviation angles, both the mean wind pressure and fluctuating wind pressure distribution of the three-track bridge sound barrier are increased compared to those of the single-track bridge. This is due to the three-dimensional effect formed by the interference of the single-track bridge wake with the three-track bridge, which significantly increases the extreme wind pressure coefficient.
4. Discussion
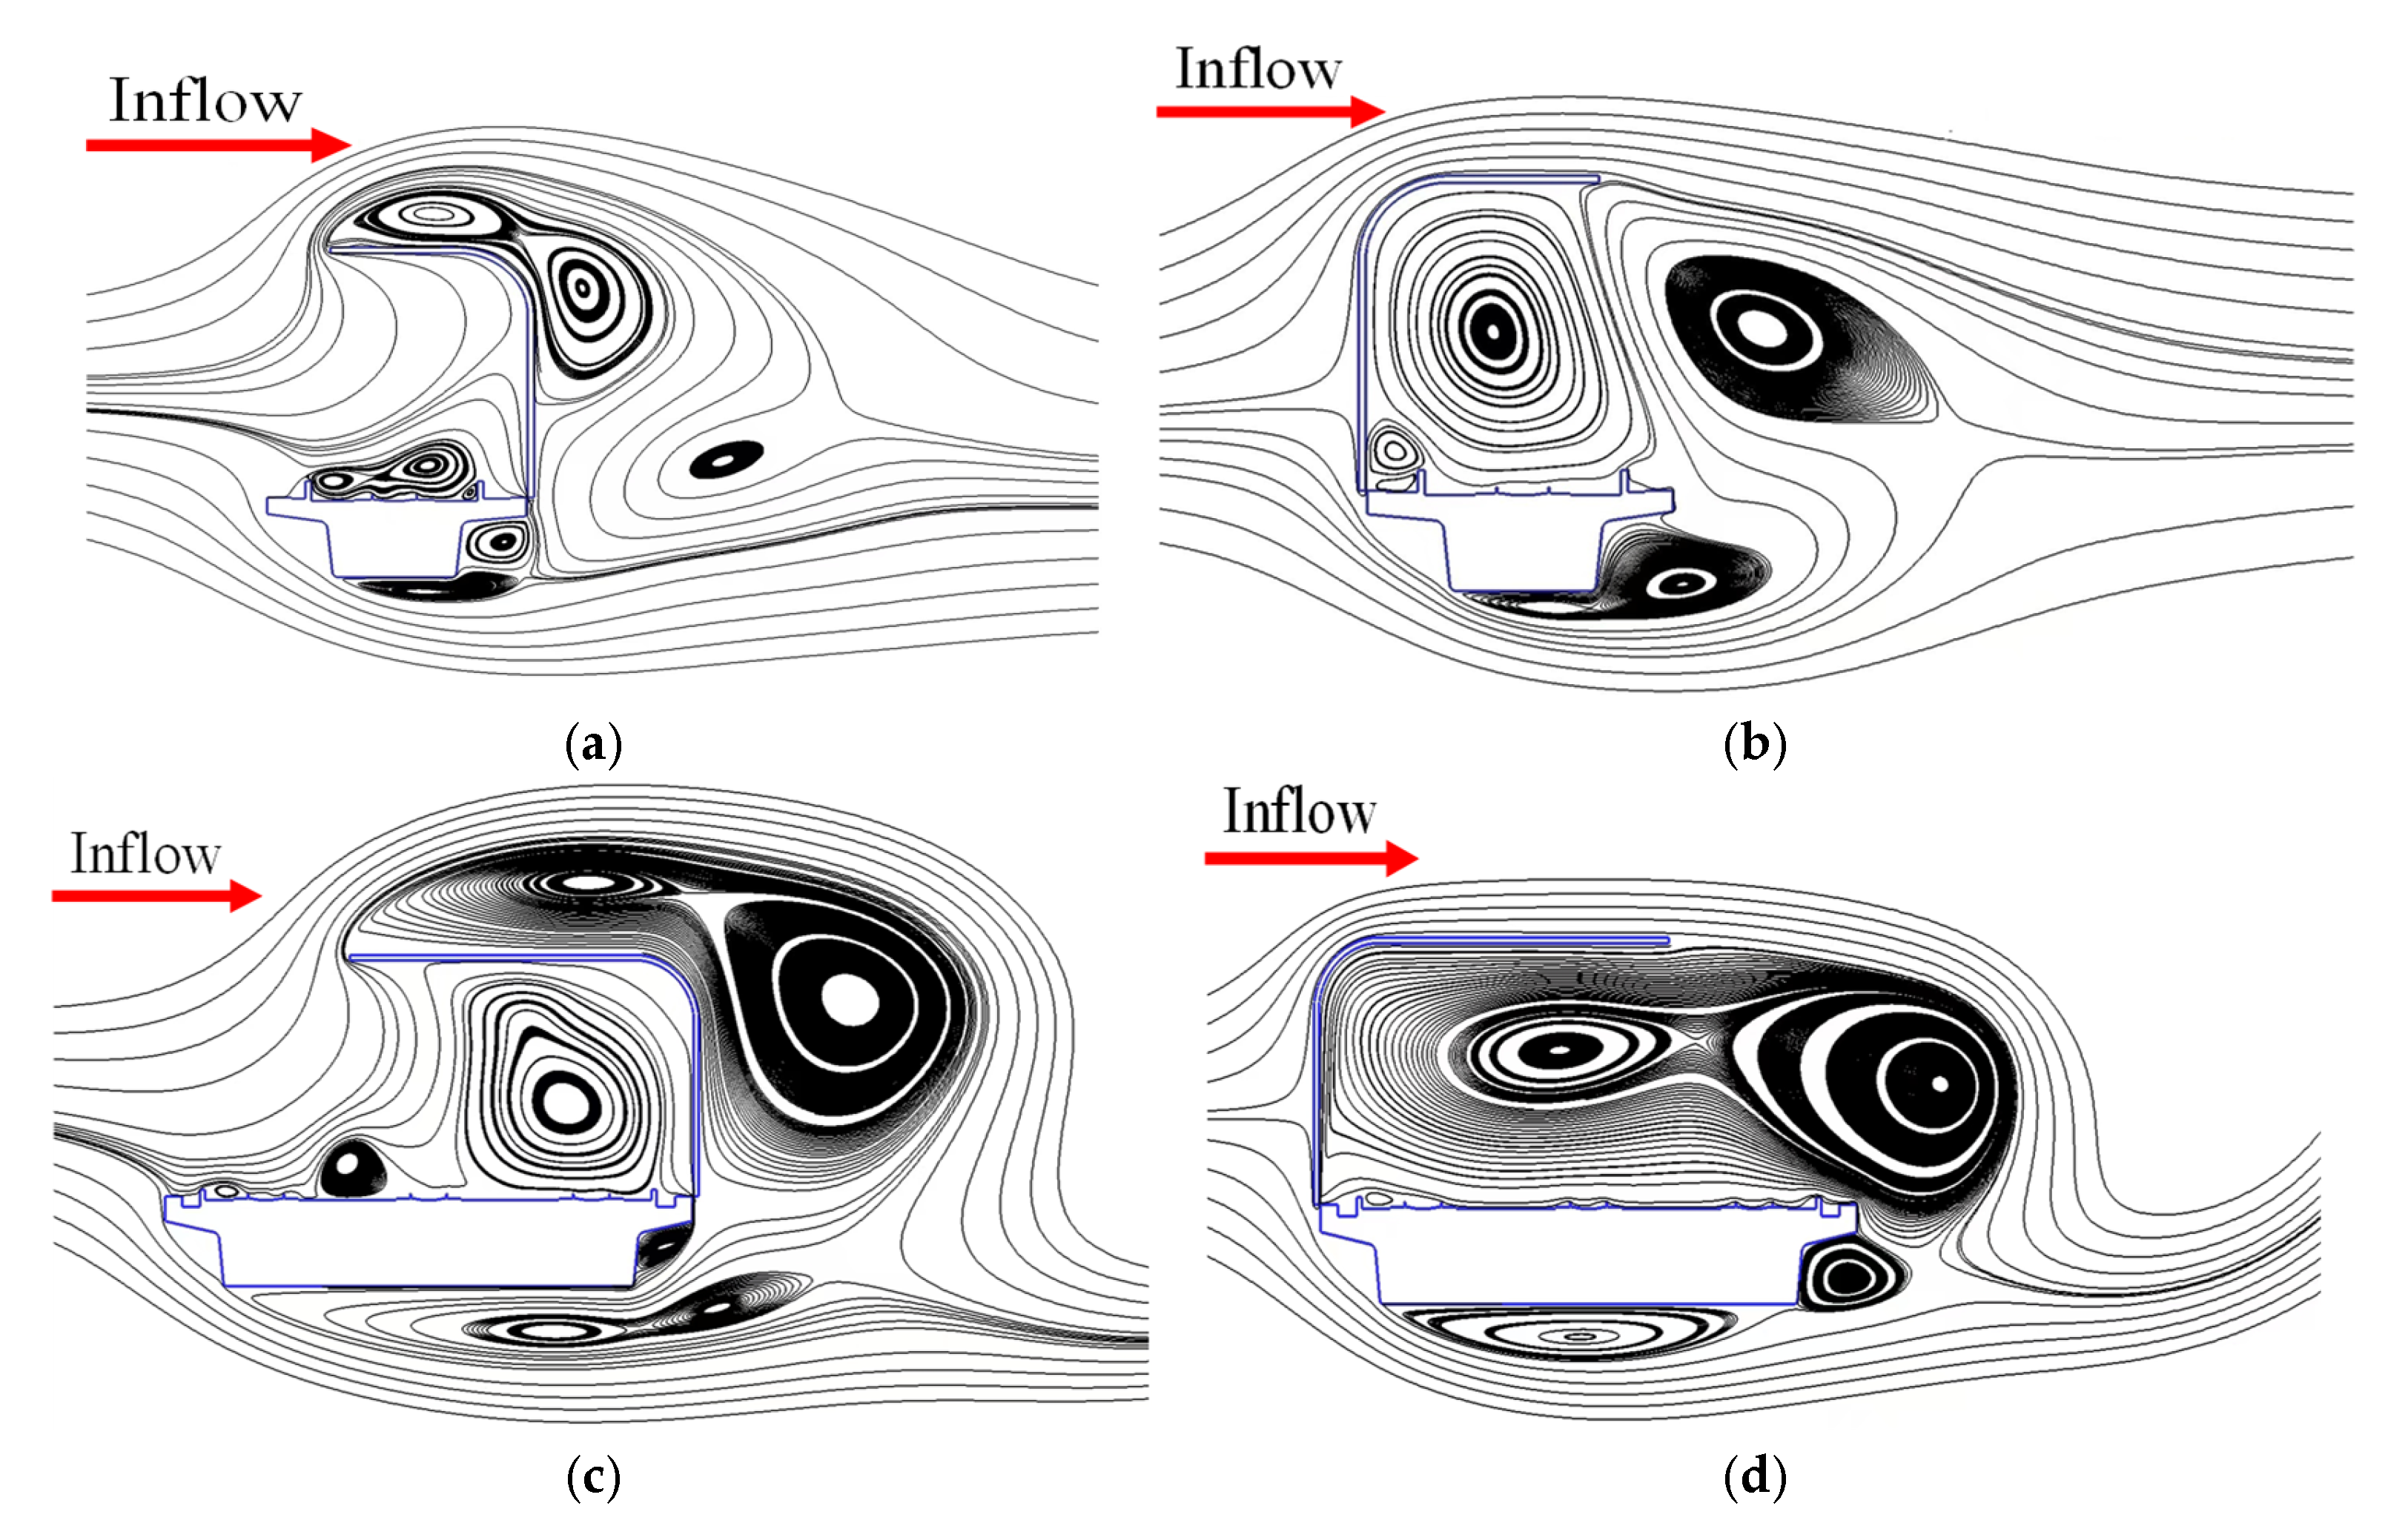
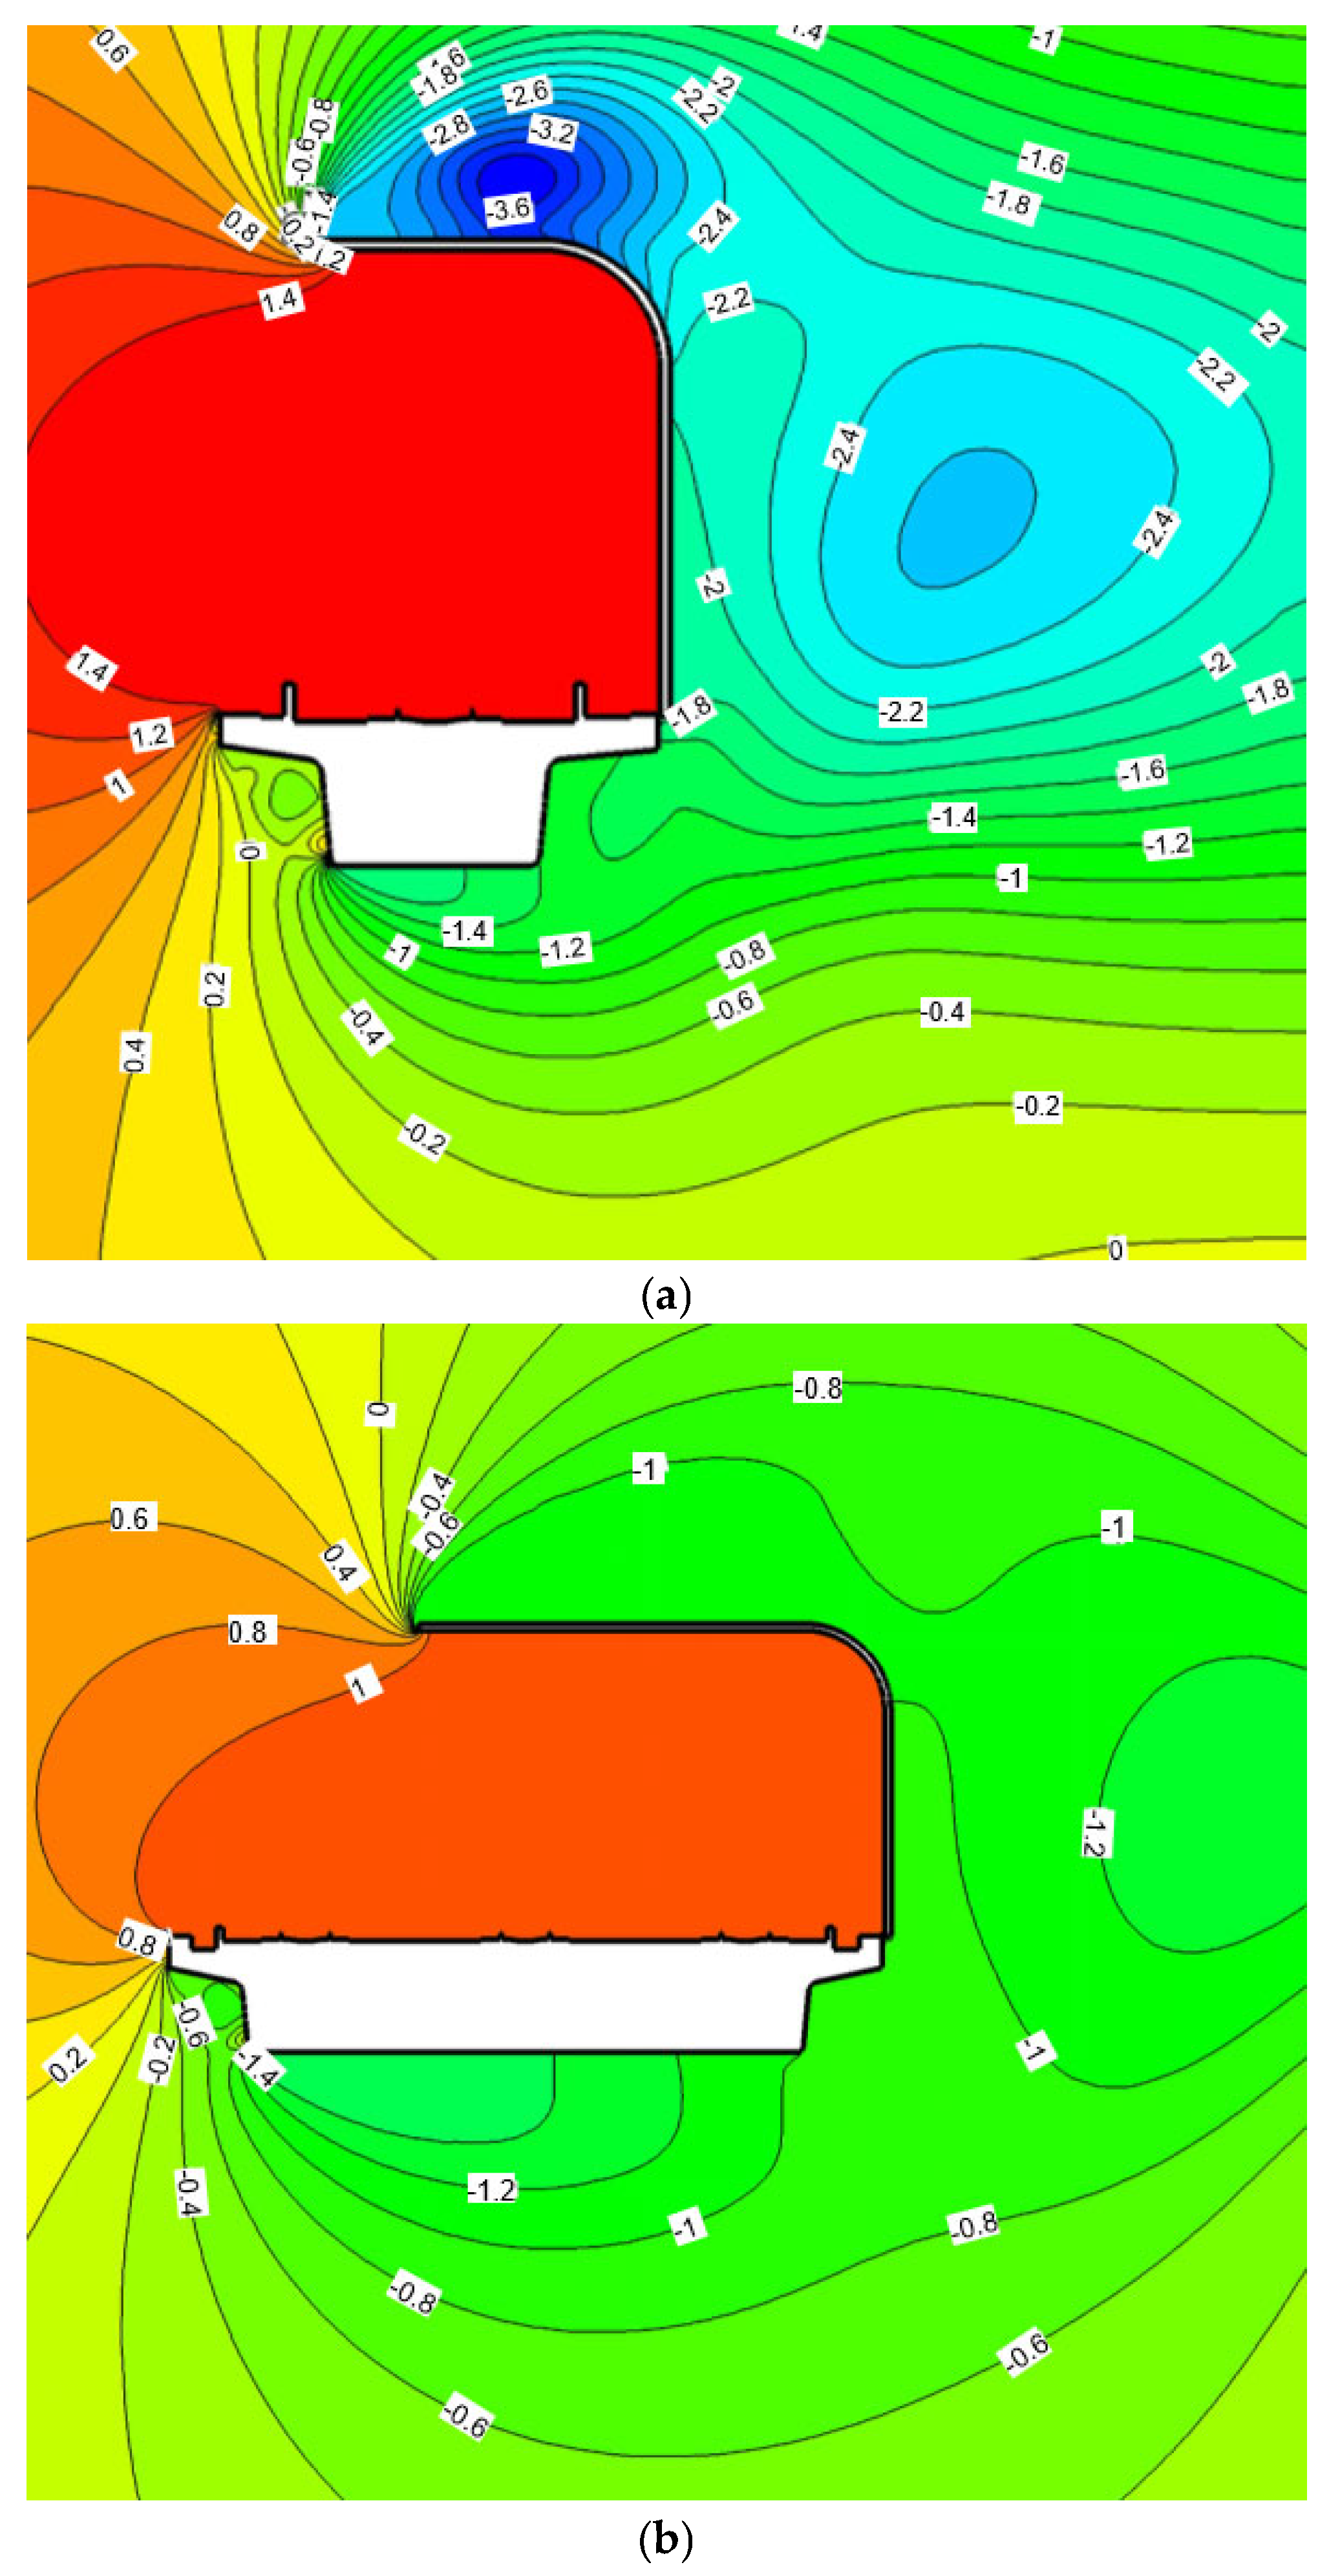
The time-averaged streamline diagram represents the mean flow field after time averaging, and its characteristics help explain the distribution of mean pressure on the surface of the structure. The simulation results of the time-averaged streamline and the mean wind pressure distribution for the single-track bridge and the three-track bridge sound barrier in the windward and leeward wind fields are shown in
Figure 13 and
Figure 14, respectively. Comparing the experimental results indicates that the mean wind pressure calculated by CFD is consistent with the distribution trend of the experimental values. However, in general, the CFD results are slightly higher than those from the wind tunnel tests because the CFD analysis is two-dimensional.
When the windward flow occurs, the flow separates at the windward angle of the sound barrier, and two separation bubbles are formed in the upper parts of the horizontal and vertical sections, respectively. The degree of turbulence increases, and the pressure on the suction surface of the sound barrier rises, while the pressure on the pressure surface inside the sound barrier remains essentially unchanged, resulting in a reduction in the pressure difference on the surface of the sound barrier. In the leeward inflow, the flow through the arc section of the sound barrier remains attached without separation, maintaining a laminar flow state. The flow on the upper suction surface accelerates, the pressure decreases along the flow direction, a pressure gradient forms, and the pressure difference on the surface of the sound barrier increases. Therefore, the maximum average negative pressure of the two sound barriers in the leeward inflow wind field environment is greater than that in the windward inflow.
In addition, in the windward flow, although the separation bubble size and reattachment length of the three-track bridge sound barrier increase compared to the single-track bridge sound barrier, the vortex core is located farther from the surface of the sound barrier, so the maximum mean negative pressure of the two sound barriers does not differ significantly. In the leeward flow, the vortex center in the inner recirculation zone of the single-track bridge sound barrier is clearly closer to the sound barrier, resulting in a greater maximum mean negative pressure for the single-track bridge sound barrier compared to the three-track bridge sound barrier.
Accordingly, the wind tunnel test and numerical simulation results obtained in this study can provide an important basis for the wind-resistant design of high-speed railway semi-enclosed external sound barriers. The results show that the extreme wind pressure on the three-track bridge sound barrier is significantly higher than that on the single-track bridge, especially in the corner area, where the structural strength under wind suction should receive greater attention. Areas with considerable fluctuating wind pressure are prone to fatigue damage, and it is recommended to optimize the connection structure to suppress vibration. In addition, the three-dimensional flow field effect at the junction of single/three-track bridges aggravates the non-uniformity of wind load distribution, and the design should incorporate local reinforcement to improve structural performance.
5. Conclusions
This study examines the distribution characteristics of mean wind pressure, fluctuating wind pressure, and extreme wind pressure acting on the surface of the semi-enclosed sound barriers of single-track and three-track bridges through synchronous pressure measurement wind tunnel tests. It analyzes the flow field characteristics under windward and leeward flow conditions through numerical simulation. The main conclusions are as follows:
(1) The mean wind pressure in the upper area of the semi-enclosed sound barrier is mainly negative, indicating a dominant influence of wind suction, with the maximum suction occurring near a wind direction angle of 90°. The side exhibits an alternating distribution of pressure and suction as the wind direction angle increases.
(2) The fluctuating wind pressure coefficients of each partition of the semi-enclosed sound barrier of the single-track bridge and the three-track bridge are larger between 50° and 120°. When the wind direction angle exceeds 160°, the fluctuating wind pressure coefficient of each partition of the single/three-track bridge remains very low.
(3) The calculation results of the wind pressure coefficient of the sound barrier in different zones do not show significant differences, mainly because its geometry is relatively simple and there is no significant aerodynamic shape change, resulting in a stable and similar flow field in most areas. As the key characteristic parameter of the flow field, the consistency of the pressure coefficient indicates that the overall flow structure under different partition schemes remains similar, which indicates that the dominant flow mechanism in the studied area does not change substantially due to the change in partition modes. The applicability of this conclusion may be limited to the current research conditions and needs to be verified in a wider range of parameters.
(4) The study reveals that the maximum extreme wind pressure coefficient for both single- and three-track bridge sound barriers occurs on the upper surface near the corner—specifically at partitions A5 and A6 for the single-track bridge and A11 and A12 for the three-track bridge—which is consistent with numerical simulations. These areas’ extreme wind pressure is the key load to control the fatigue design of structures and check the strength of connecting bolts. The three-track bridge exhibits a significantly higher extreme wind pressure coefficient than the single-track bridge, whereas values in side regions are relatively similar for both bridge types. Therefore, the structural wind resistance design requirements for the upper surface of the three-track bridge near the corner should be enhanced to address this localized wind load concentration, such as through local load coefficient adjustments, structural stiffness reinforcement, and optimized wind-resistant detailing, to ensure structural safety and durability under extreme wind conditions. Furthermore, the boundary configuration of the bridges introduces a three-dimensional effect, resulting in complex cross-sectional wind pressure distributions along the semi-enclosed sound barrier, with a pronounced influence on the three-track bridge. Accurate determination of extreme wind pressure loads thus requires wind tunnel testing. The scale models, measurement point layouts, and testing methodologies developed in this study offer a reference for the design of comparable structures.
