1. Introduction
Nonlinear oscillations arise across many areas of science, with significant applications in mechanics and engineering [
1,
2,
3,
4,
5,
6], physics [
7,
8,
9,
10,
11], and mathematics [
12,
13,
14,
15]. They are typically described by nonlinear differential equations (NDEs), whose strong nonlinearities make their analysis particularly challenging. This complexity has driven researchers to develop a variety of approximation techniques, and over the past few decades many solution methods have been proposed. Classical perturbation methods, however, fall short when dealing with strongly nonlinear oscillators, as they fail to provide accurate results. To overcome these limitations, several alternative analytical approaches have been introduced. A wide spectrum of methods has been applied to nonlinear oscillators, such as the harmonic balance method [
16,
17], variational iteration method [
18,
19], homotopy analysis method [
20,
21], homotopy perturbation method [
22,
23], Li-He’s modified homotopy perturbation method [
24], enhanced homotopy perturbation method [
25], asymptotic techniques [
26,
27], energy balance method [
28], differential transformation method [
29], parameter expansion schemes [
30,
31], variational principles [
32], frequency–amplitude formulations [
33], among others.
Recent advancements in the evaluation of mechanical nonlinearities have introduced refined experimental and analytical methodologies for capturing complex dynamic behaviors. Bonisoli et al. investigated the nonlinear dynamics of cantilever beams subjected to magnetic and contact-induced nonlinearities, employing a laser profilometer for precise displacement measurements [
34]. Their Multi-Phi linearization framework effectively demonstrated how nonlinearities influence the dynamic response of mechanical structures. Similarly, other studies have focused on identifying instantaneous modal parameters, such as natural frequencies and damping coefficients, and their dependence on vibration amplitude and excitation conditions [
35]. Using signal processing techniques, including the Hilbert transform, these works have provided efficient schemes for detecting nonlinear effects in single-degree-of-freedom systems exhibiting hardening behavior. Collectively, these approaches emphasize the importance of integrating experimental observations with analytical models to characterize nonlinear mechanical responses and to complement theoretical formulations. Additionally, the wavelet transform provides a time–frequency representation for system identification, enabling accurate estimation of natural frequencies and viscous damping ratios from free vibration responses. Its advantages in analyzing free decay are highlighted through comparisons with previous techniques, and its accuracy is confirmed via numerical simulations and real-world measurements from the Queensborough Bridge in Vancouver, demonstrating agreement with established dynamic behavior [
36].
Extensive research has also aimed at developing general models that can describe a wide range of nonlinear oscillations. For example, approximate solutions have been proposed for systems with cubic and harmonic restoring forces [
37,
38], a problem of particular importance, as it captures phenomena that appear across mathematics, physics, and engineering [
38,
39]. This formulation encompasses well-known cases such as the Duffing oscillator [
40], the simple pendulum [
41], the cubic–quintic Duffing system [
42], and the capillary oscillator [
43,
44]. Consequently, obtaining reliable approximations for such general cases is of fundamental importance in nonlinear science. In addition, special attention has been given to cases with polynomial type restoring forces [
45]:
where
are arbitrary constants. This is a very important case, since Equation (1) can be used to describe many cases of one-dimensional force fields through Maclauren series expansions [
46]. The differential equation describing such cases is providing below [
47]:
Another interesting case is the one involving elastic forces [
47]. In this case, the force magnitude is usually described by a power law of the form
, where
are positive constants that depend on the material properties and the contact geometry of the interacting bodies [
48,
49]. The most well-known nonlinear example of such forces is the classical Hertzian model, which describes the contact between a sphere and an elastic half-space, with the corresponding force magnitude given as follows [
50]:
where
In Equations (3) and (4),
represent the Young’s moduli and Poisson’s ratios of the contacting elastic materials (the sphere and the elastic half space),
is the sphere’s radius,
is the applied force and
is the displacement of the sphere within the elastic material. If considering that the sphere is much stiffer than the elastic half space (i.e.,
), then
. A typical oscillatory motion under the conservative Hertz force field in this case is described by the equation below:
where
is the mass of the oscillating sphere. It is interesting to note that the half-period of the oscillatory motion described by Equation (5) can also be used to determine the duration of interaction between a rigid sphere and an elastic wall during a collision [
51]. It is also important to note that the presented in this paper nonlinear oscillator behavior, is relevant to Atomic Force Microscopy (AFM) technology. Specifically, the undamped oscillations of a rigid sphere interacting with a linearly elastic surface are of particular interest. In many AFM force modes used to determine the Young’s modulus of a sample, the spherical tip experiences forced oscillations while in contact with the surface [
52]. Determining the frequency of the undamped free oscillation provides useful insight into the magnitude of the resonance frequency, since, in nonlinear systems, the oscillation frequency depends on amplitude. Although the resonance and free oscillation frequencies are not identical, they exhibit similar amplitude-dependent shifts, allowing the latter to serve as a practical approximation. Equation (5) belongs to the generic form below [
47]:
where
and
. The accurate equation for the oscillation period in this case has been previously presented [
47,
53] and is provided below:
where
Γ is the gamma function and
is the oscillation’s amplitude. For example, for
:
While the case of oscillatory motion in a classic Hertz field (Equation (3)) has already been solved, there are many other cases that still require further investigation. More specifically, Equation (3) is valid only in the limit
. For large deformations, the Hertz equation provides significant errors in force calculations [
54,
55]. The accurate equations of the force between a rigid sphere and an elastic half space has been given by Sneddon’s equations below [
56,
57]:
where
is the contact radius between the indenter and the sample. The deformation
x is connected to the contact radius and the indenter radius through the following relation [
56,
57]:
There is no analytical solution of the system of Equations (9) and (10). Müller et al. presented an approximate force equation using a truncated power series expansion; according to the paper, this expression was obtained through personal communication with Wolfgang Dobler (JPK Instruments, Berlin) [
58]:
Since Sneddon’s equations (Equations (9) and (10)) cannot be analytically solved, two approximate expressions have been proposed in the literature [
57,
58]. The present study adopts the formulation presented in [
58] (i.e., Equation (11)), as it ensures high accuracy for
and smoothly converges to the Hertzian solution at small indentation depths whereas the equation presented in [
57] provides better results for very large deformations but introduces a small error in the Hertzian limit.
Equation (11) accounts for large deformations of the elastic material when interacting with the rigid sphere. In other words, the accurate equation relating the force applied between a rigid sphere and a linearly elastic material is given by Equation (11). Therefore, the differential equation involving oscillations under the force field described by Equation (11) is provided below:
where
This paper is organized as follows. In
Section 2 we present the numerical method used to identify the oscillation period of the differential Equation (12). In
Section 3, we present an approximate analytical approach for determining the oscillation period as a function of amplitude. The results are compared with numerical solutions, and the relative errors are also reported. Additionally, a simple sinusoidal solution, based on the analytically determined period, is presented and compared with the numerical results. In
Section 4, the accuracy and limitations of the proposed method are also presented and discussed. Comparisons with the Harmonic Balance Method [
45] are also presented.
2. Numerical Solution
Since the magnitude of interest involving a large deformation is
,
and Equation (12) can be expressed as follows:
Equation (14) is dimensionally consistent. The units of
are
which are equivalent to the units of the parameter
. Therefore, in this paper, we focus on the case involving a one-dimensional force field with magnitude of the following form:
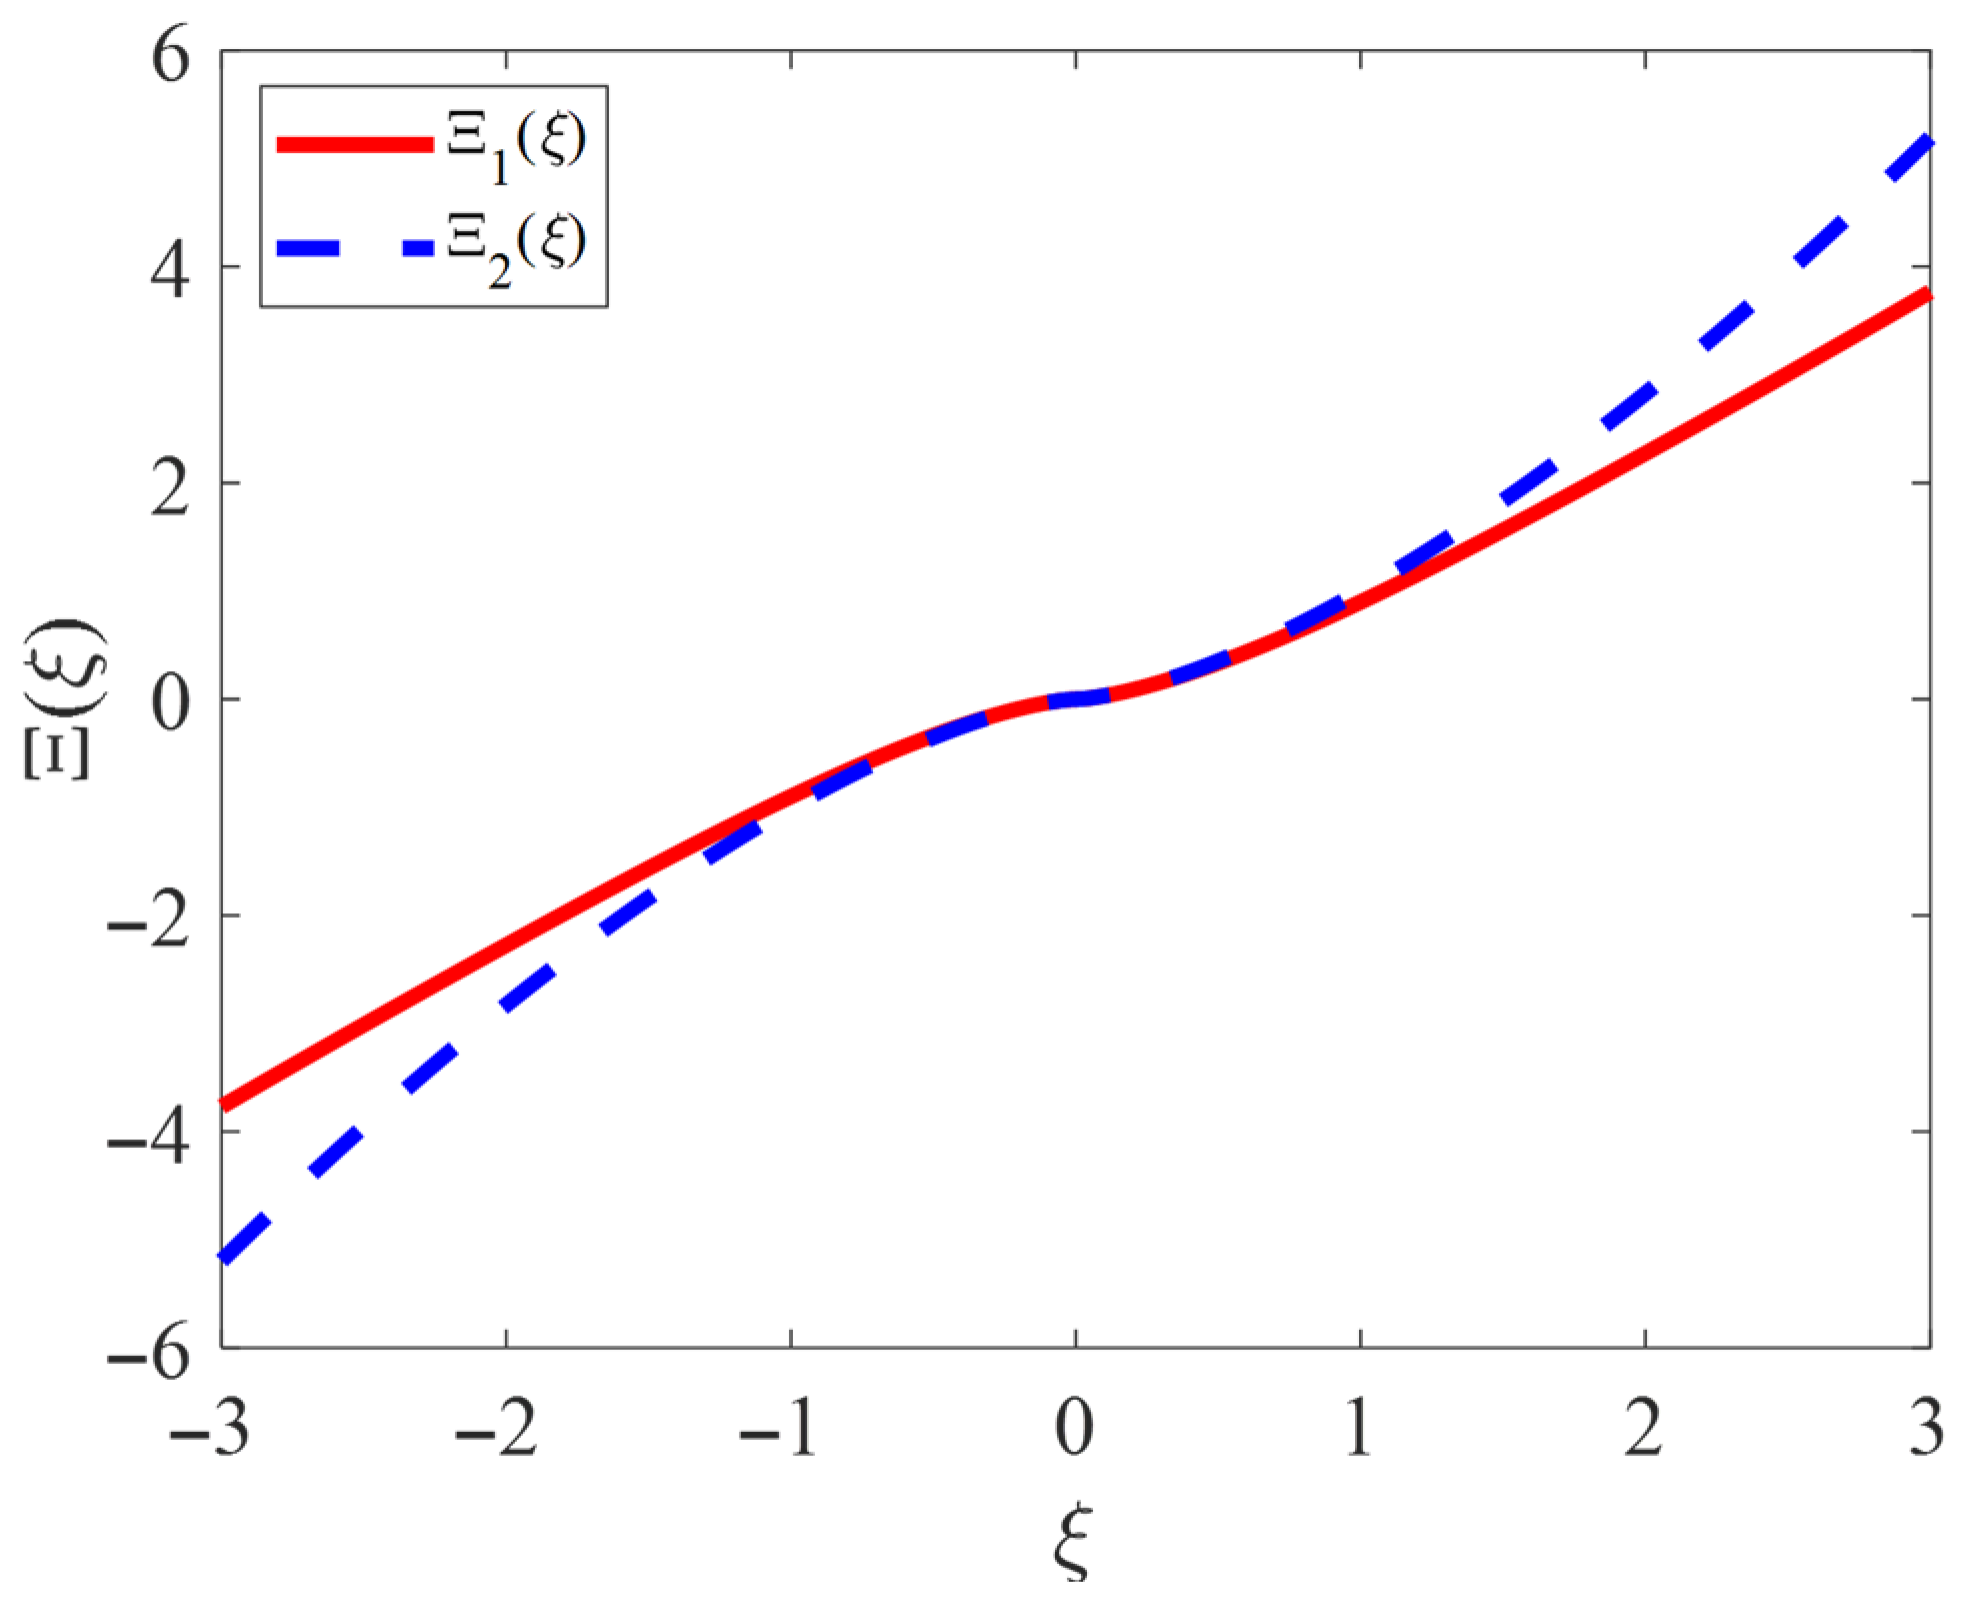
To visualize the force field described by Equation (15), the terms
and
were plotted comparatively in
Figure 1, where
and,
It is interesting to note that the force field described by Equation (15) presents an interesting behavior as also shown in
Figure 1. For small deformations, the force is proportional to the term
, whereas for larger deformations the force–deformation curve tends to become linear. This behavior has been previously explained in terms of contact mechanics and arises by the behavior of the contact area between the interacting bodies [
57]. For large deformations, the contact area tends to a limiting value. This is the reason for obtaining this force–deformation behavior [
57].
The differential equation to be solved, is described as below:
Let
, then using the chain rule we conclude in
. Thus, Equation (18) is expressed as follows:
where
C is the integration constant. Using the initial conditions,
and
, we concluded in:
Equation (20) expresses the energy conservation of the oscillating system. The time interval required for the variable
to change from
ξ = +
A (its value at
t = 0) to an arbitrary value
ξ is calculated as below:
where
is the dummy integration parameter. Therefore, the oscillation’s period can be calculated as follows:
For example, for
we conclude in:
where
,
,
,
and
(we also considered
for simplicity and
t,
T are measured in seconds. This parameter (i.e.,
) serves only as a multiplicative factor and does not affect the results). Equation (23) can be solved numerically to provide the oscillation’s period for any given amplitude.
An interesting question to be addressed concerns the
coefficients in Equations (18)–(23), which originate from Equation (11). An analytical method for determining these coefficients is presented in [
59]. The approach involves applying a Maclaurin series expansion to Equation (10) and subsequently solving the resulting expression with respect to
. By defining an equation of the form
, we can substitute it into the general relation
for axisymmetric indenters and directly calculate the coefficient
By including higher-order terms in the function
, it is also possible to determine the remaining
values so that our solution matches Sneddon’s results. It is worth noting that several combinations of
constants can lead to accurate solutions, as discussed in [
59].
It is also important to note that as shown in
Figure 1,
takes both positive and negative values during oscillation. However, for analytical simplicity, the integration in Equation (19) was performed only over the positive range of
. Equation (19) represents the energy conservation principle, where the total energy, comprising kinetic and potential energy terms, remains constant throughout the motion. Since the oscillation is perfectly symmetric with respect to
, it is sufficient to evaluate the motion over the positive half-cycle. The time interval
corresponding to the change of
from
to
represents one quarter of the total period (
). Thus, the complete oscillation period is obtained as
.
3. Analytical Approximate Approach
Let us re-examine the one-dimensional force field described by Equation (15). The force magnitude can be easily rewritten as follows:
For
, the oscillation’s period as already mentioned in the introduction should be:
An idea to account for cases where
is to consider an amplitude-dependent correction factor. The easiest approach is to consider the average value of
over the domain
. Τherefore, we re-write Equation (24) in the following approximate form:
where
Equation (27) can also be written in the generic form:
Thus, by adding the correction factor
to Equation (25) we finally conclude in:
In
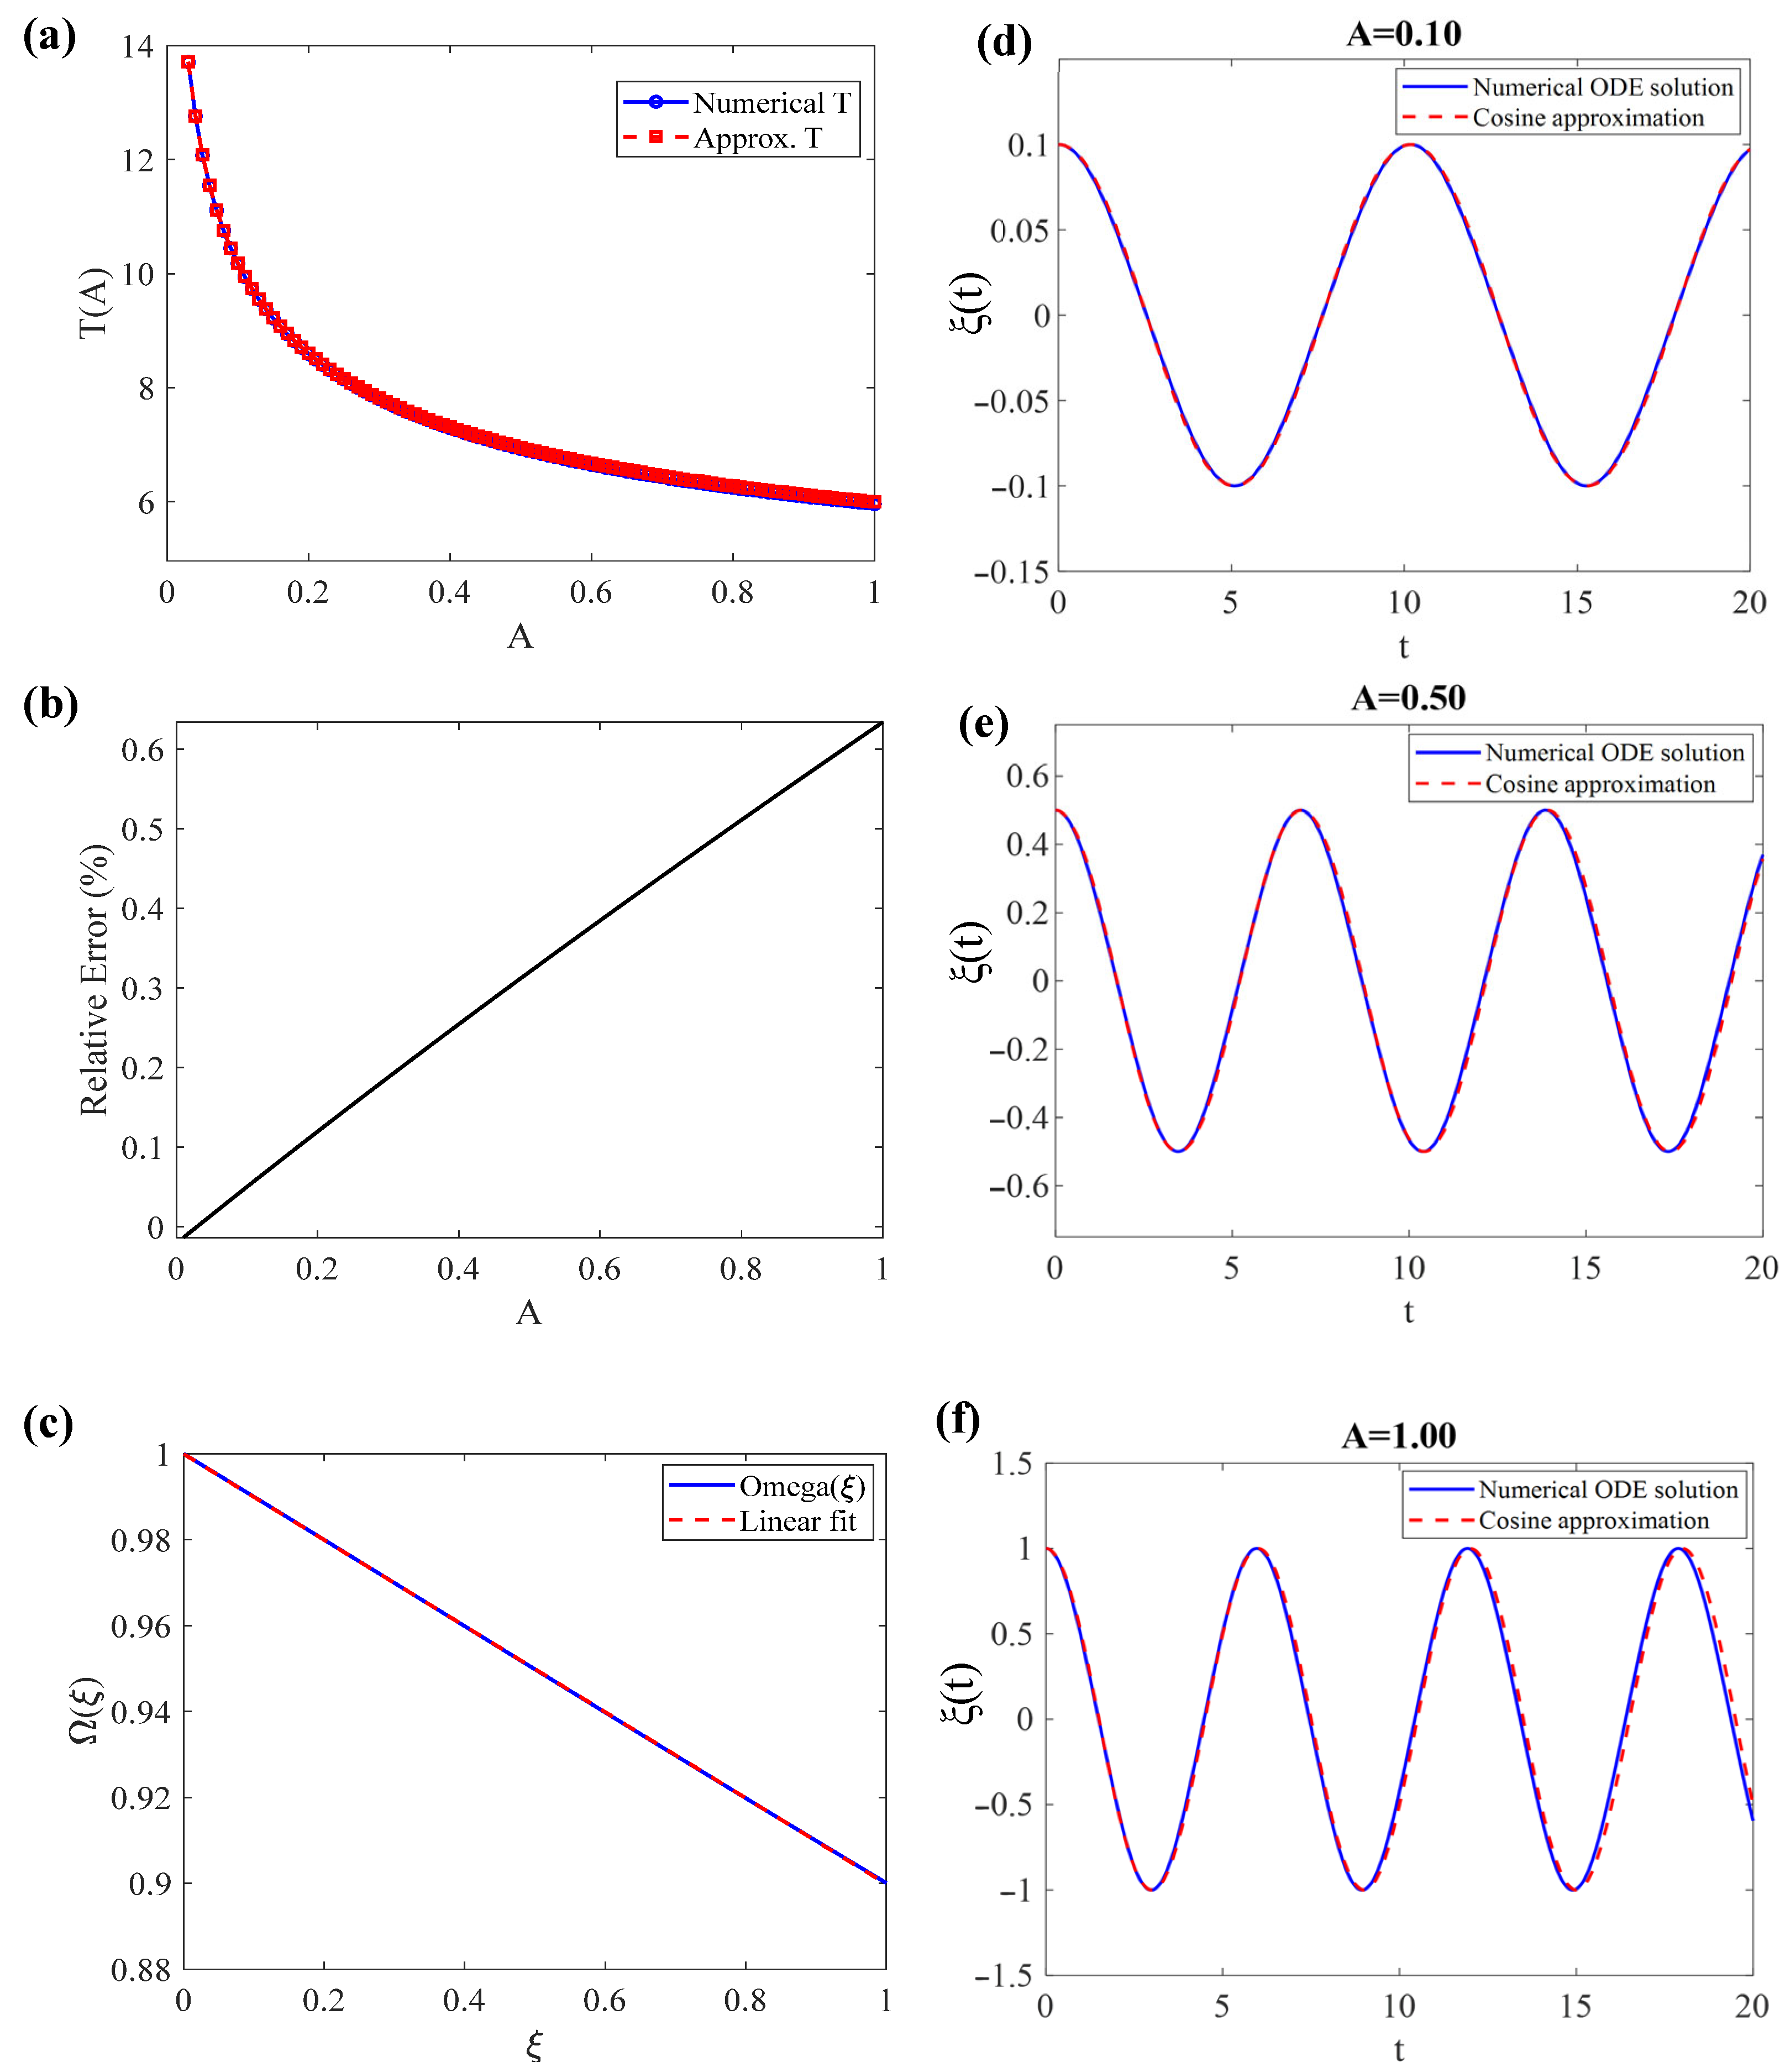
Figure 2a, we present the period as determined numerically using Equation (23) and as estimated using the approximate Equation (30) in the domain
. This is usually the domain of interest because an oscillation amplitude of
corresponds to
. For larger deformations, the linear elastic response of the contacting materials may no longer be valid (however, this case will also be discussed later). In this domain (
) the approximate Equation (30) leads to nearly identical results to Equation (23). The relative error is calculated using the following Equation:
The results are presented in
Figure 2b. In
Figure 2c the
parameter is presented in the domain
. It is interesting that it can be accurately approximated by a straight line as follows:
Therefore, the average
Ω value can also be expressed using the simple equation below:
Therefore, Equation (30) can be simplified as follows:
The linear averaging assumption used in Equation (32) is justified by the observation that, within the typical amplitude range of interest
, the function
Ω(
ξ) varies almost linearly with
ξ. As shown in
Figure 2c,
can be closely approximated by a straight line,
(the R squared coefficient of the liner fit resulted in 1.0000), leading to a simple expression for the average,
. Higher-order terms in the expansion contribute increasingly smaller corrections because the coefficients
decrease in magnitude for
and the powers of
remain small in the domain of interest. Consequently, the integral of the full polynomial is very well approximated by its first-order (linear) term. This is confirmed numerically: the approximate period computed using the linear average in Equation (34) matches the period obtained from the exact numerical integration (Equation (23)) with small errors. The error associated with Equation (34) is approximately 0.63% for
, which is similar to that obtained using Equation (30). Thus, the linear averaging is sufficient for practical purposes within the considered amplitude range, while retaining the simplicity and analytical tractability of the expression.
In addition, the numerical
functions (solutions of Equation (14)) are presented graphically in
Figure 2d–f in the domain
and compared with the trivial solution below:
In addition, we can further increase the accuracy of the analytical approach (Equation (30)). The curve described the relative error as shown in
Figure 2b can be approximated to the following linear curve:
Therefore, we can add a correction factor to Equation (30) as follows:
The idea on the semi-empirical factor is based in
Figure 2b in the manuscript as already mentioned. Since the relative error when using the approximate approach is almost linear with respect to the oscillation’s amplitude, we approximately determined the slope of the
curve using the simple equation
. The period obtained using the numerical method was smaller than that obtained using the proposed method; therefore, we introduced the semi-empirical factor
into our solution.
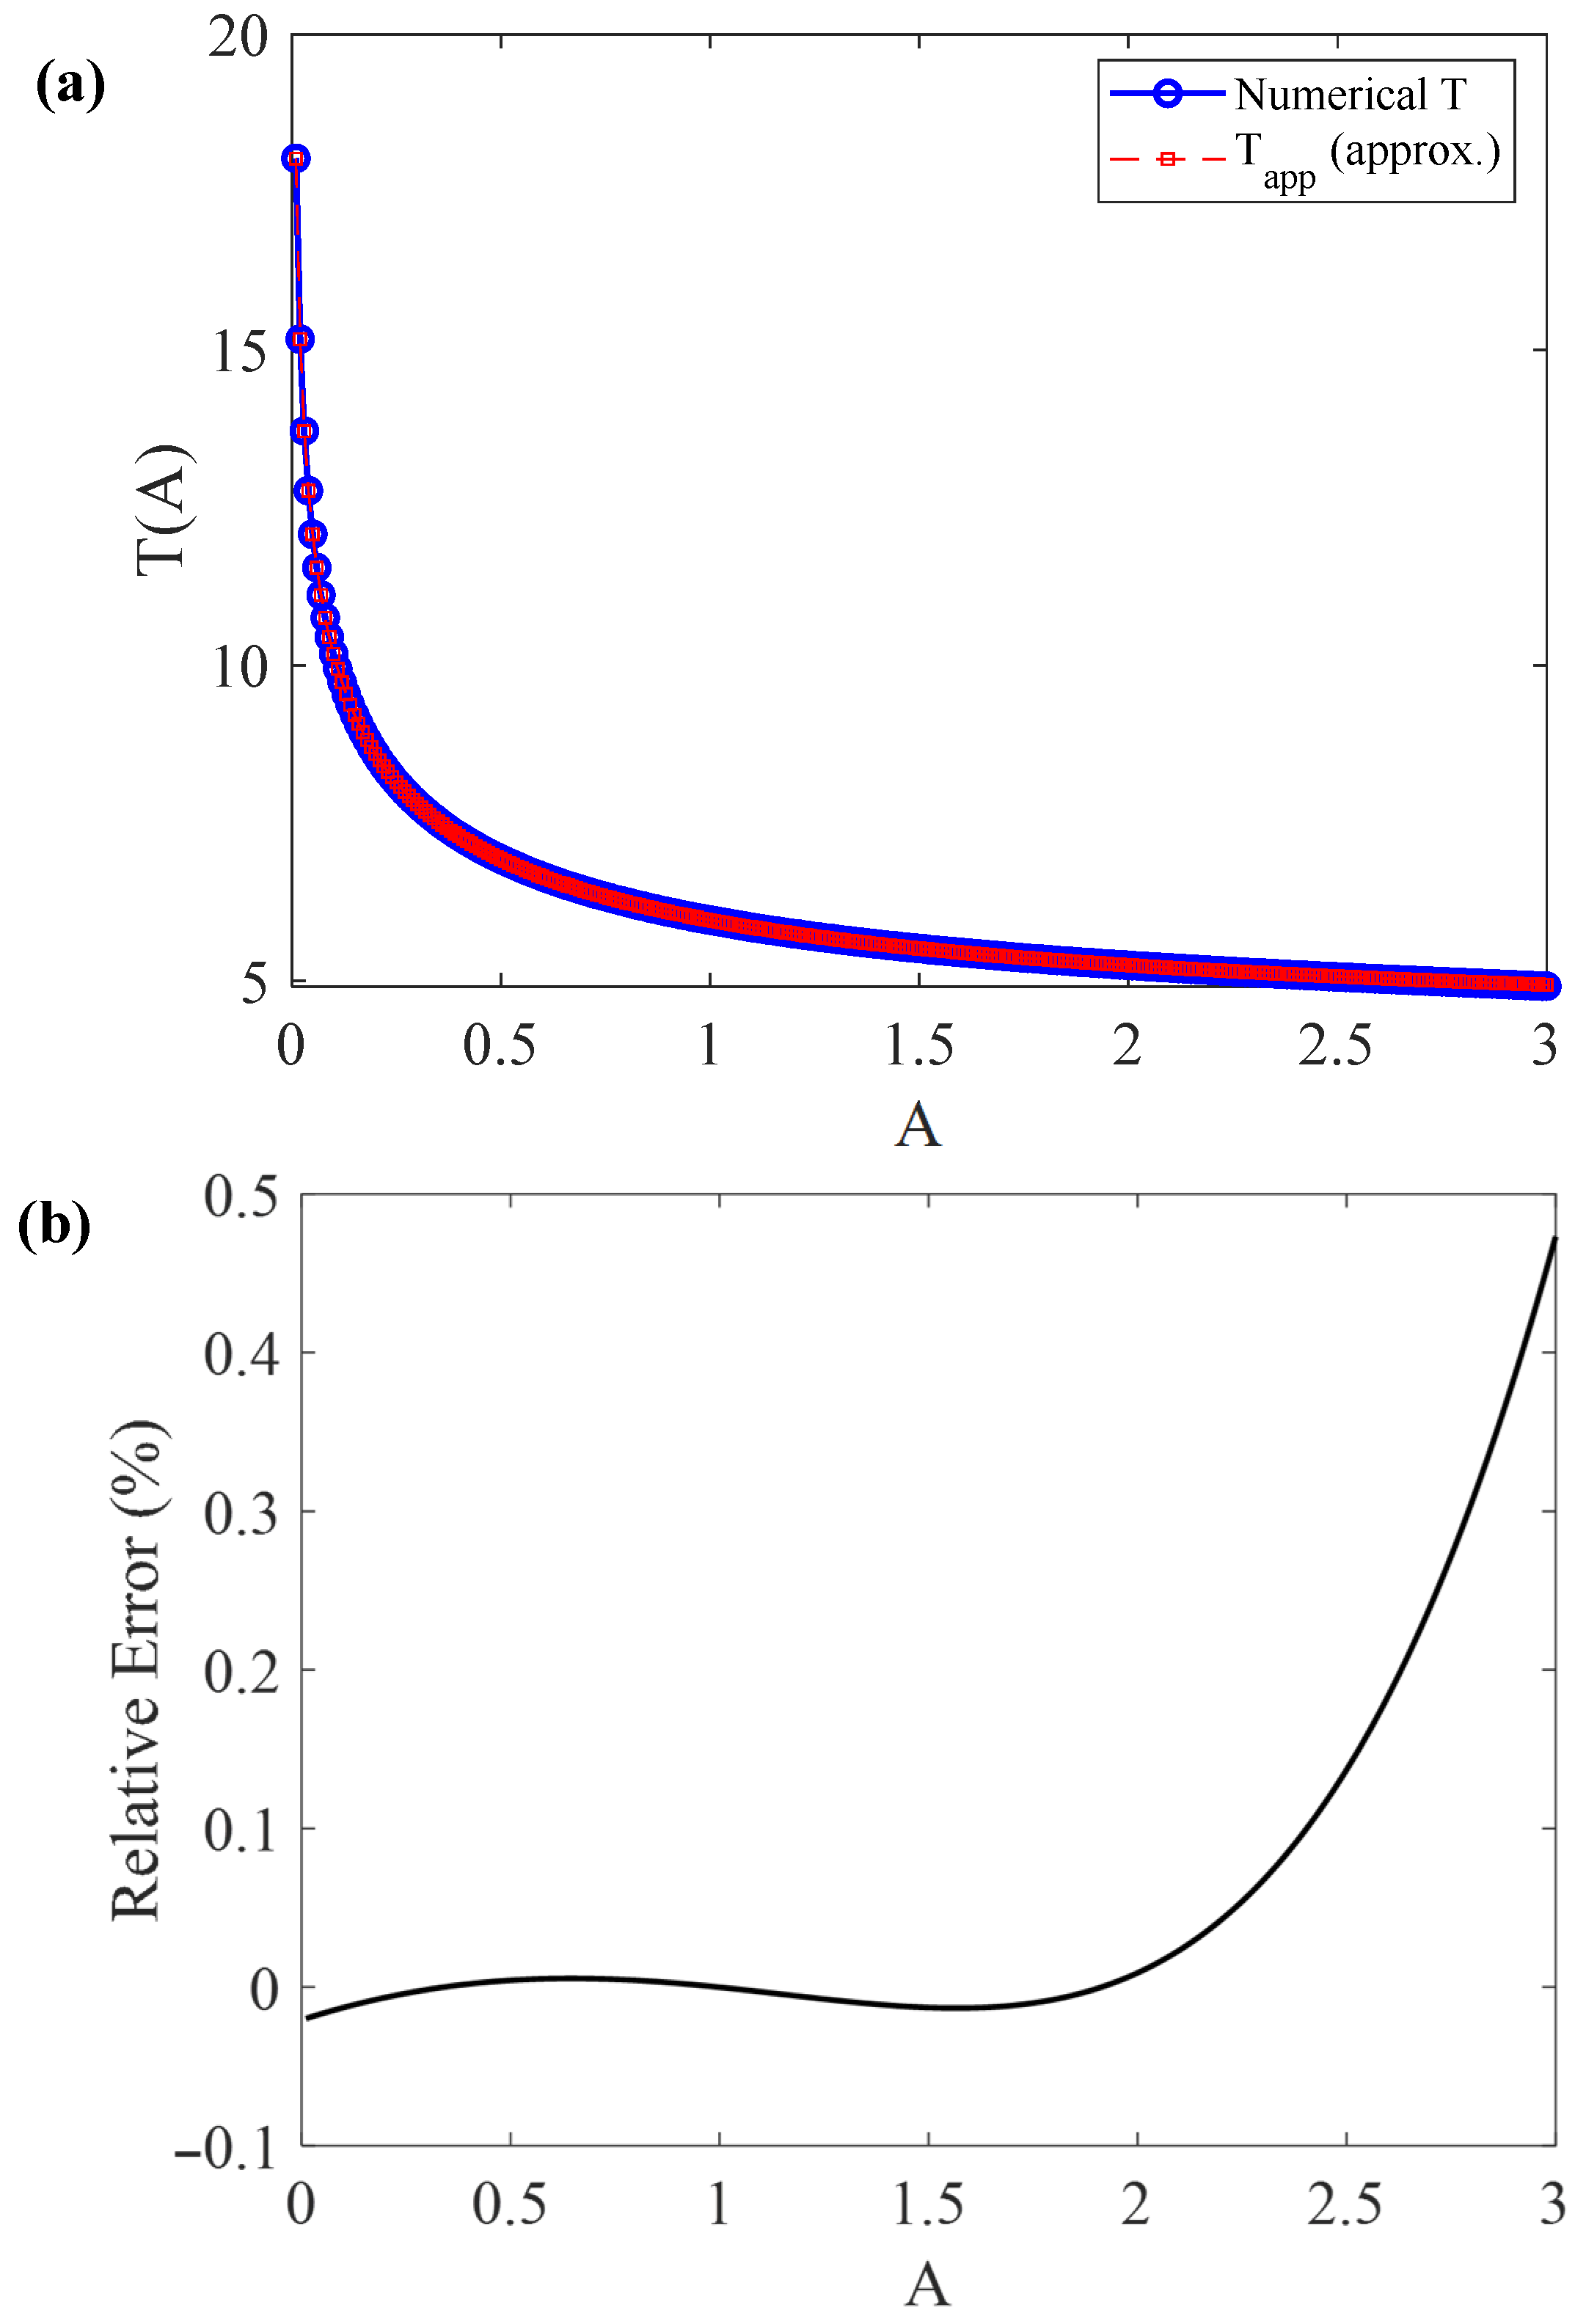
The numerical solution for the oscillation period (obtained using Equation (23) and the approximate solution with the correction factor introduced in Equation (36), i.e., Equation (37)), are presented comparatively in
Figure 3a. The relative error of Equation (37) with respect to the exact numerical result is also shown in
Figure 3b.
In conclusion, Equations (30) and (34) can be safely used for (corresponding to a deformation ), while Equation (37) can be safely used for .
4. Discussion
In this paper, the generic case of nonlinear oscillation under the influence of Hertzian-type restoring forces is examined (Equation (14)). The exact formulation of the oscillation period, expressed in Equation (23), requires the evaluation of a nonlinear integral that depends explicitly on the oscillation amplitude
. This formulation accounts for the full series expansion of the force law, which involves terms of the type
, where
. Although this approach is exact, the integral cannot be expressed in closed form for arbitrary
, and numerical evaluation is generally required. The analytical approximation introduced in
Section 3 is based on two central ideas. First, the force law is separated into a dominant Hertzian-like contribution and a multiplicative correction factor
, as expressed in Equation (24). Second, the
function is replaced by its average value over the oscillation range
. This averaging procedure smooths out the variation of
and effectively transforms the nonlinear problem into one with a closed-form solution similar to the classical Hertzian oscillator. It is important to note that this method works particularly well because the dominant scaling of the system is controlled by the Hertzian term (
). To demonstrate this, we analyze the following formula:
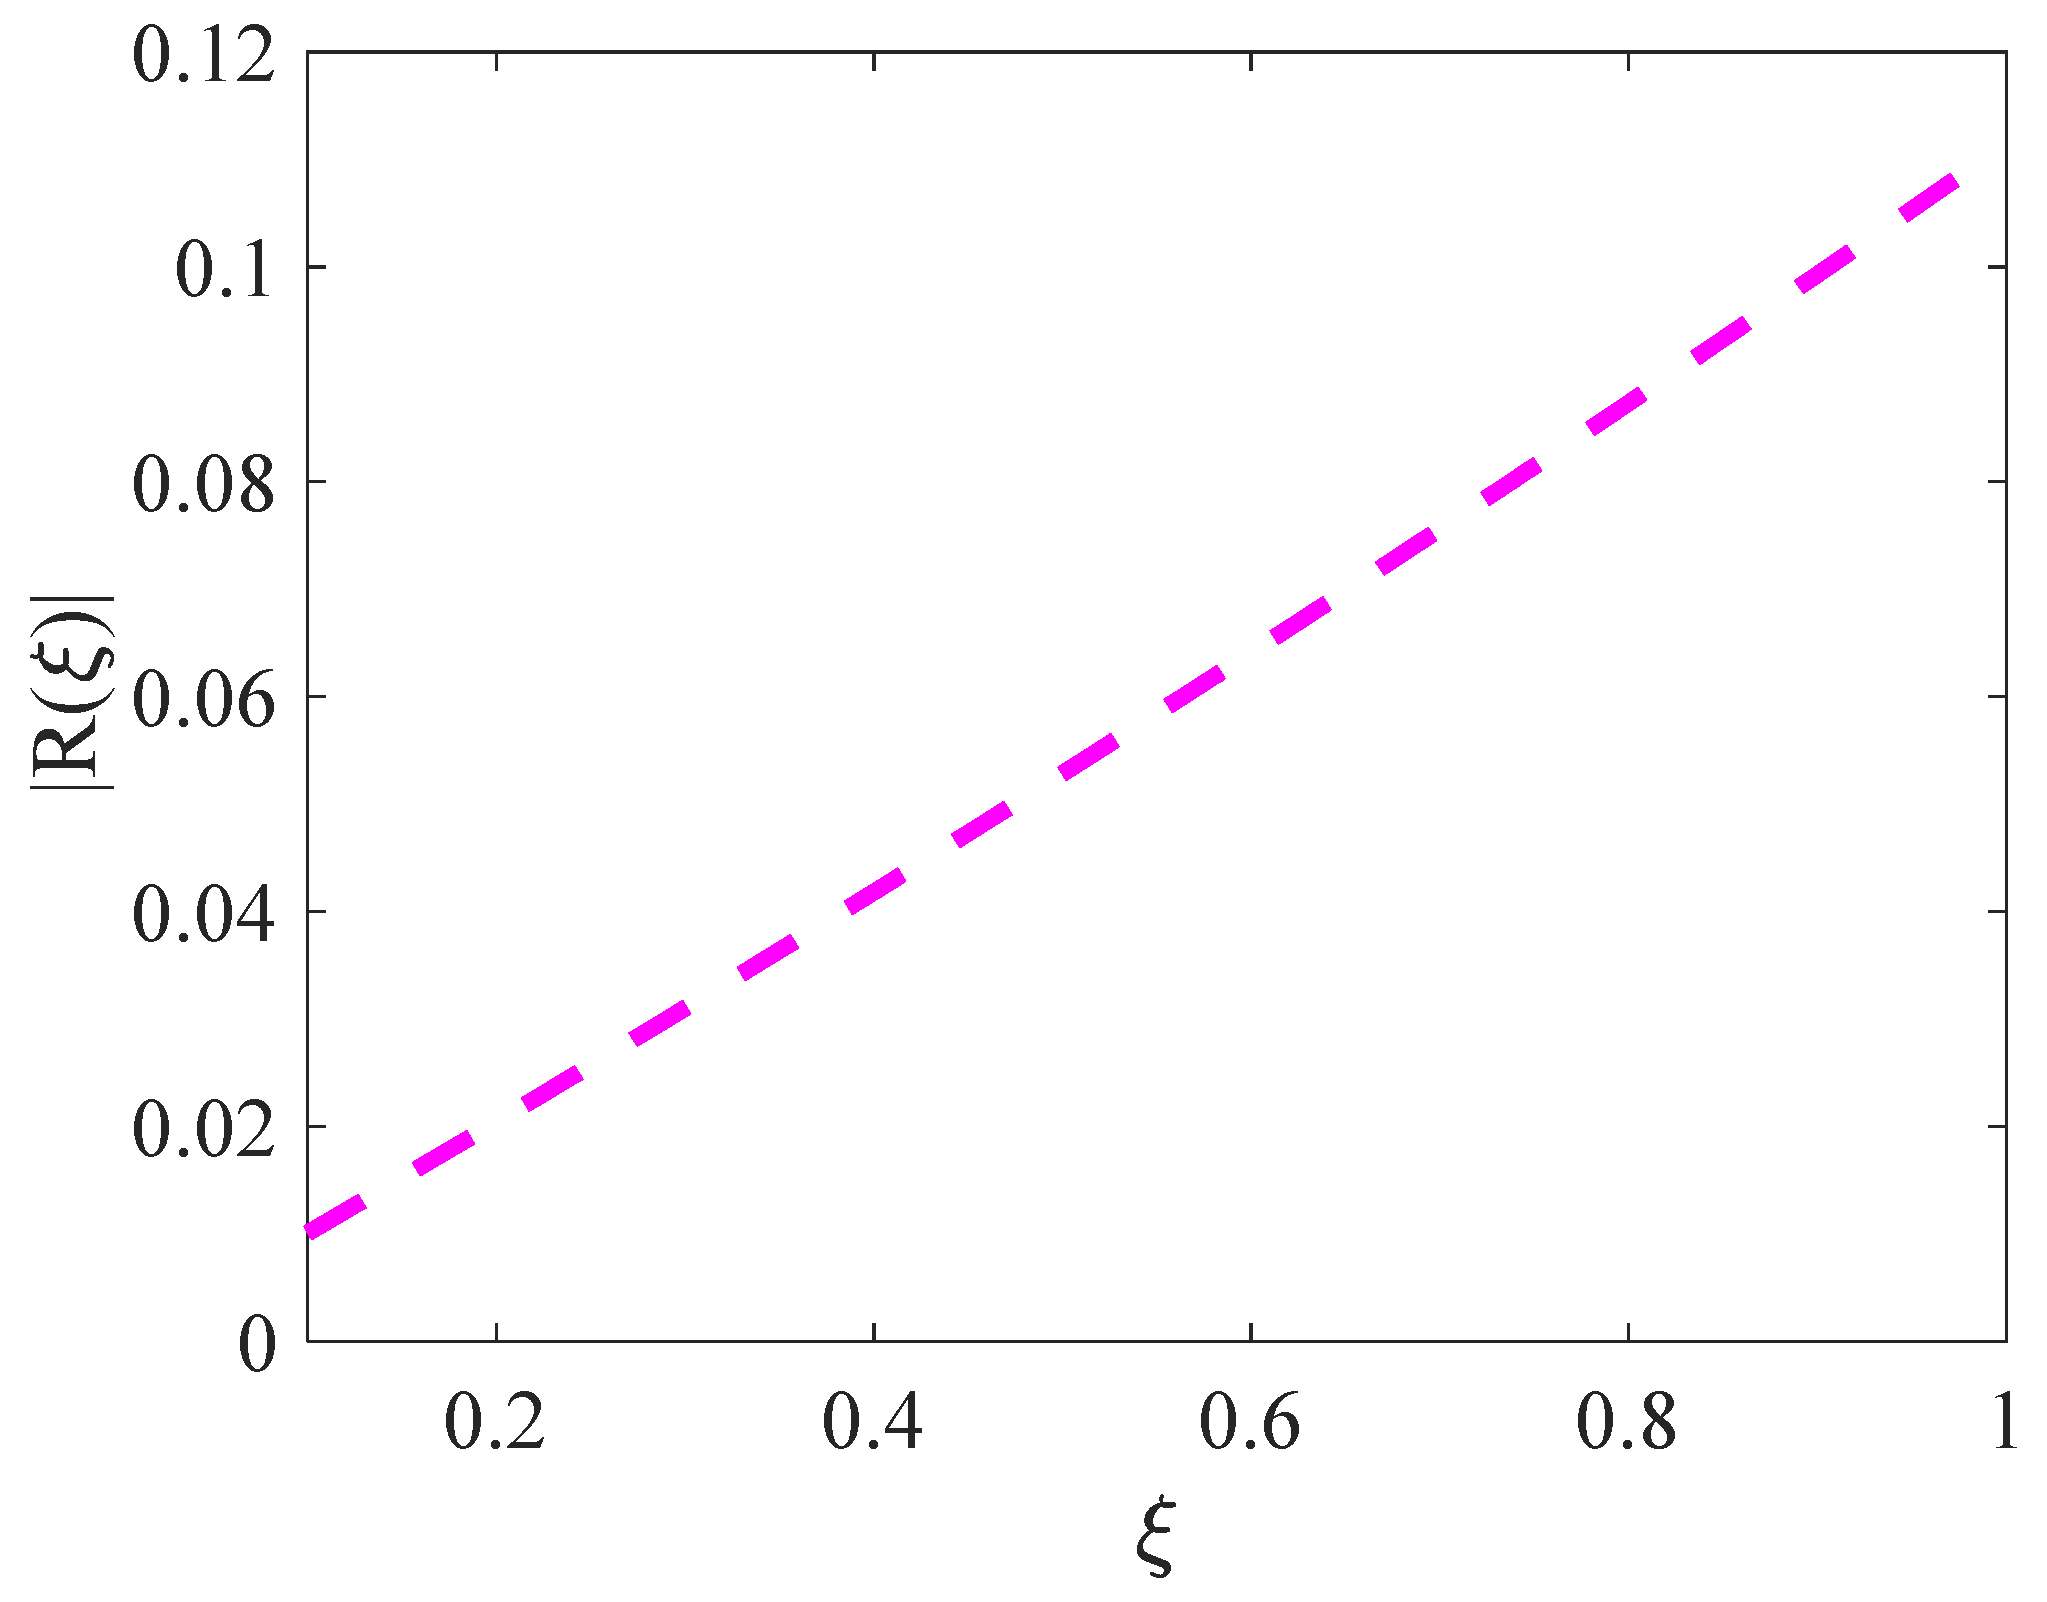
The numerator of Equation (38) is the sum of the higher-order correction terms in the Hertzian equation, while the denominator is the Hertzian term. The absolute value of the
parameter with respect to
in the domain
is presented in
Figure 4. For small
values, the
parameter is small, leading to the result that in this regime the restoring force is dominated by the classic Hertzian term. As the
variable increases, the higher-order terms significantly influence the type of restoring force. However, for
,
. In this regime, employing the average value of
parameter leads to small errors in period calculations.
Therefore, the higher-order corrections should enter as smooth polynomial contributions that do not significantly distort the overall dependence of the restoring force within the interval of interest. By replacing with its average, the main influence of these corrections is retained without introducing large errors in the calculation of the oscillation’s period. The symmetry of the oscillation about further supports the validity of the averaging approach, since no systematic phase bias is introduced. More specifically, the oscillation is symmetric with respect to , meaning that the system moves equally between positive and negative displacements of the same magnitude. This symmetry ensures that the restoring force acts in a balanced way during both halves of the cycle. As a result, when the correction factor is replaced by its average value, the overall dynamics are not distorted in one direction or the other. In other words, the averaging procedure does not introduce any systematic phase shift, and the resulting motion remains consistent with the natural cosine-like symmetry of the exact solution.
The comparison between the exact and approximate formulations confirms the accuracy of the proposed approach. For amplitudes in the range
, the discrepancy between Equations (23) and (30) is negligible, as shown in
Figure 2b. In this domain,
varies approximately linearly and remains close to unity, with a simple approximation
. Consequently, the use of the average value in Equation (27) accurately captures its net effect over the oscillation cycle. The resulting approximate period is nearly identical to the numerical value obtained from the exact integral. The domain of validity of the method is therefore well defined. The approximation remains accurate as long as the amplitude does not exceed
. This corresponds physically to the deformation scale where
, beyond which the assumption of linear elastic contact may no longer hold. At larger deformations, the higher-order polynomial terms grow in importance, the contact area tends to a limiting value, and the force–deformation law approaches linearity. In this regime, representing the force as a Hertzian-like term corrected by a smooth factor becomes inadequate, leading to larger errors.
In addition, the accuracy of the analytical approach can be further improved. The curve representing the relative error, as shown in
Figure 2b, can be well approximated by a simple linear relation (Equation (36)). This observation allows the introduction of a correction factor, resulting in an improved expression for the approximate period (Equation (37)). By applying this correction, the systematic errors associated with larger amplitudes are significantly reduced, providing a more accurate estimate of the period in the regime where the Hertzian-like approximation alone becomes insufficient. It should be noted that the elastic half-space approximation, which assumes linearly elastic materials, may no longer hold for large deformations, except in special cases involving very soft materials. Nevertheless, from a purely mathematical perspective, it is worthwhile to present this semi-empirical solution (including the correction factor) because it fully captures the dependence of the oscillation period on the amplitude, even for large deformations. This approach provides a complete analytical description of the system’s behavior, which can be useful for theoretical studies and comparisons with numerical results.
It is also instructive to compare the results obtained using the method presented in this paper with those derived from the Harmonic Balance Method (HBM) [
45], which is one of the most widely used and classical techniques for solving nonlinear second-order differential equations. Consider Equation (18) for
:
In addition, consider the trial solution
, with
. The first-harmonic contributions of the five nonlinear terms are given below:
where
By symmetry the integral over [0, 2π] equals twice the integral over [0, π], where
. Thus, Εquations (45)–(49) are modified as below:
By substituting to Equation (39):
Finally, the oscillation’s period using the HBM results in:
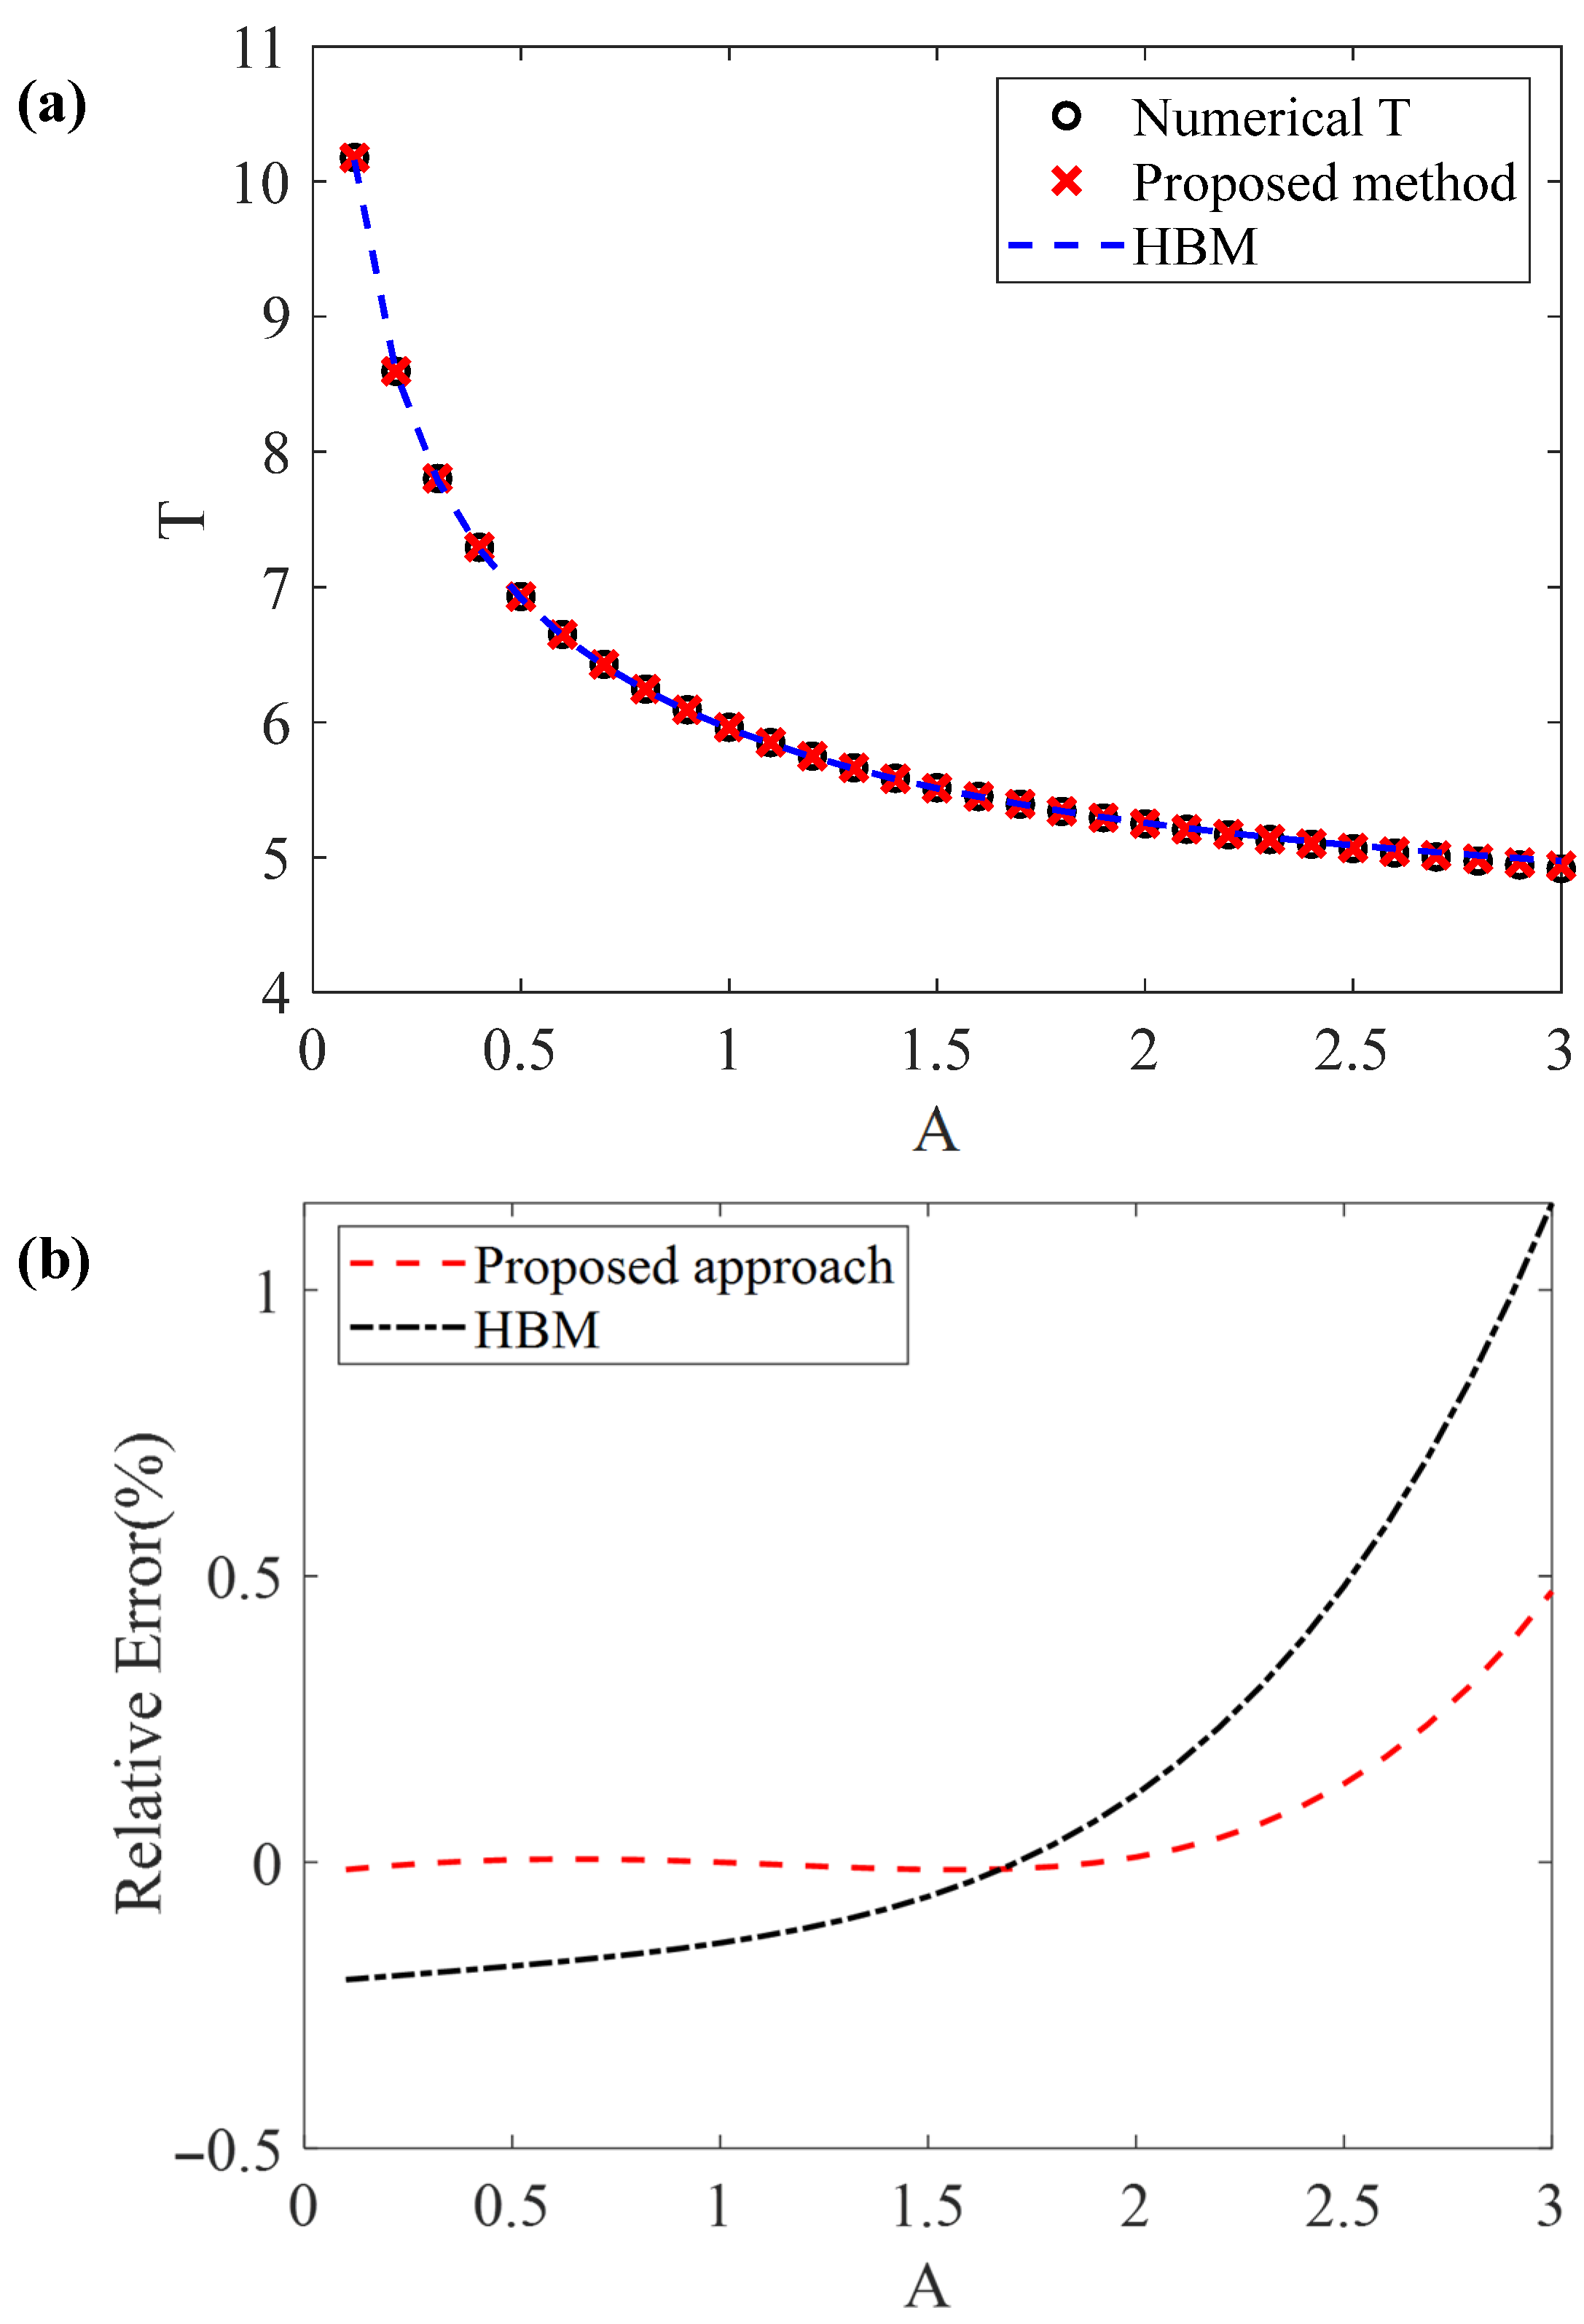
In
Figure 5a, the numerical results for the oscillation period (Equation (23)) are presented for comparison with the results from the proposed Equation (37) and those from the harmonic balance method (Equation (57)) in the domain
.
In
Figure 5b, the errors associated with Equation (37) (i.e., the proposed method) and the HBM (when terms higher than the first order are omitted, as explained in Equations (40)–(44)) are also presented for comparison.
The numerical results for the oscillation period obtained using the numerical solution (Equation (23)), the proposed approach (Equation (37)), and the HBM (Equation (57)) are presented for comparison in
Table 1 for different amplitudes. The errors associated with Equations (37) and (57) are presented in
Table 2.
It should be noted that the elastic half-space approximation, which assumes linearly elastic materials, may no longer be valid for large deformations, except in special cases involving very soft materials. Despite this limitation, the overall analysis in this work assumes a linear elastic response in all studied cases. If the material exhibits a weakly nonlinear elastic response, the method proposed in this paper can still be applied; however, the exponents in the differential Equation (18) will differ, since in the power law describing the applied force on the sphere, both the geometry and the material nonlinearities contribute. In such cases, the method can be applied again using the classical generic solution (Equation (7)) with a new average
factor tailored to the specific system of interest. A representative example is the work by Ding et al. [
60], where the Hertzian equation was modified through the introduction of a correction factor. In conclusion, for cases of weak nonlinearities, such as those in which the force–deformation relationship can be expressed as
, where
is a correction factor that does not significantly deviate from linearity, the approach presented in this paper can be applied. Nevertheless, it should be noted that for strongly nonlinear materials, the
-function may deviate significantly from linear behavior. In these cases, a careful examination is required to assess the accuracy of the proposed method. Therefore, for cases of strong nonlinearities, involving special forms of the
function, further research is required to establish the limits of validity of the proposed approach.
In addition, it is also important to note that the general behavior of the force–deformation relationship when a rigid sphere interacts with an elastic half-space follows Hertz’s law,
, which gradually approaches a linear relation
for large deformations. This linear behavior becomes evident for
, as presented in reference [
57]. Therefore, the part of the oscillation corresponding to very large indentations tends to be harmonic. However, there is no universal equation that accurately captures the force–deformation relationship over the entire range from very small to extremely large deformations (
). An attempt in this direction was made in [
57], where an equation suitable for large indentations was derived. Nevertheless, it introduces a small error for shallow deformations, where the classical Hertz equation remains valid. In contrast, Equation (11) is accurate for
and coincides with the Hertzian solution for very small indentations. In conclusion, there is no available equation for
in Equation (15) due to the mathematical complexity of Sneddon’s nonlinear system and because, at very large deformations, the assumption of linear elasticity is no longer valid.
It is interesting to also note at this point that a practical example illustrating the relevance of the present solution is in AFM experiments with a spherical tip. While AFM typically involves forced oscillations to probe the mechanical properties of a sample, evaluating the free oscillation frequency of the tip provides valuable information for a rough estimation of the resonance frequency. It should be noted that the free oscillation frequency is not identical to the resonance frequency; however, in nonlinear systems, both exhibit similar amplitude-dependent shifts, allowing the free oscillation analysis to serve as a practical and efficient approximation. This approach provides insight into the dynamic behavior of the system and helps guide experimental interpretation without the need for full forced-vibration simulations. Future research will focus on cases involving nonlinear force oscillations of the AFM tip, aimed at developing advanced characterization methods for nanomechanical property mapping.
