Abstract
An accelerometer mounting technique has large implications on the frequency range and accuracy of the measurement, with stiffness and the mass relative to the monitored structure as the primary concerns. The International Organization for Standardization (ISO) gives an extensive list in 5348:2021, detailing mounting methods, and provides recommendations for testing mounts that are not specifically defined. In the nuclear industry on the laboratory scale, there is a need for vibration measurements for predictive maintenance and process monitoring that are nondestructive and capable of working in high-temperature environments. Commercial adhesive products with easy application and removal were tested as nondestructive methods, while quick mounts to a commonly used aluminum frame were tested as nondestructive and have potential applicability in high-temperature environments. The sinusoidal excitation method was used, measuring frequencies from 50 Hz to 10 kHz in one-third octave band intervals, utilizing three accelerometers and comparing the results to those obtained with the stud-mounting method. Using the lowest ±3 dB threshold across each accelerometer, foam dots and poster strips were not successful, and foam tapes were accurate up to 2000 Hz, hose clamps and zip ties up to 800 Hz, and a custom 3D printed mount up to 1000 Hz. Knowing the limitations of each mounting technique allows for accurate measurements within the appropriate range.
1. Introduction
Vibration analysis has a broad range of applications, such as predictive maintenance and condition monitoring, and is used in fields such as wind, oil and gas, aerospace and defense, music, automotive, recycling, and nuclear [1,2,3,4,5,6,7,8,9,10,11,12,13]. Sensors to monitor vibration include velocity transducers, displacement sensors, laser vibrometers, fiber optic, MEMS accelerometers, and piezoelectric accelerometers [9,10]. Benefits of utilizing piezoelectric accelerometers include high sensitivity, lightweight, compact, wide dynamic and frequency range, cost advantage, and they offer model variety [9,10,14]. One specific model demonstrated stable performance after 10 h in a 1000 °C environment and one month of a gamma exposure rate of 15 Gy/hr [15]. A piezoelectric accelerometer works by converting acceleration to a proportional electrical output designed to measure vibration [16].
Accelerometers rely on the relatively flat frequency response below the resonance or natural frequency of the sensor. While a benefit of laser vibrometers is noncontact measurements, accelerometers must be mechanically coupled to the monitored vibrational system. The mounting method is an important consideration when deploying an accelerometer, impacting the fidelity and upper frequency limit of the accelerometer.
ISO 5348:2021 gives specific guidance regarding accelerometer mounting and lists options with their limitations, such as stud, adhesive, wax, thin double-sided tape, magnets, and probe tip [16]. In general, the mounting method should be as rigid and firm as possible to ensure stiffness, and the mass of the mount should be small in comparison to the monitored structure [16,17,18,19]. Additionally, any mounting bracket should avoid introducing its own resonance frequencies in the frequency range of interest [19]. Other considerations for the accelerometer itself are the environmental conditions, such as temperature, acoustic noise, and nuclear radiation [19]. For adhesive, wax, and tape mounting, the temperature needs to be considered [17,19,20,21]. For magnet mounting, the mass, strength, and geometry of the magnet should be considered [22].
Knowing the limitations of the sensor and mounting is critical for accurately capturing the vibrational system. Depending on the specific industry and use of vibration monitoring, different frequency bands are of interest. ISO 20816-1 gives general guidelines and introduces a set of standards for evaluation zones depending on the machine type [23]. Chu et al. offer common machinery fault frequencies to consider, depending on the fundamental frequency or turning speed of the monitored rotating equipment [2]. Individual considerations should be made for each specific application, utilizing all known frequency limitations.
In the nuclear industry, vibration monitoring is used for flow-induced vibrations, predictive maintenance, and process monitoring [1,3,5,6]. For nuclear research applications, there are laboratory-scale setups utilizing novel equipment with vibration-monitoring needs. Advancements in nuclear power plants, as well as the development of small modular reactors and fuel reprocessing, require distinct technological advancements before large-scale deployment [1,24,25,26,27,28,29,30,31,32]. For nuclear power plants, vibration monitoring has found relationships with pump faults, flow accelerated corrosion, and flow-rate monitoring using small-scale setups [24,25,27,32]. Regarding nuclear fuel reprocessing, Cárdenas et al. showed the potential of vibration monitoring for organic and aqueous flow rates in a solvent extraction system [1].
Laboratory-scale setups of nuclear processes do not always allow permanent or destructive installations, such as stud mounting and epoxy adhesives, in locations without magnetic materials, and these environments are often at temperatures exceeding the capabilities of adhesives and tape. Frequency ranges of interest, environmental temperatures, and radiation levels also vary drastically depending on each individual laboratory setup. Quick and nondestructive yet high-fidelity mounting techniques are needed for these environments.
ISO 5348:2021 does not go into detail regarding quick mounts and recommends testing natural frequencies for both quick mounts and mounting fixtures, such as brackets. To determine the mounted fundamental resonance frequency of an accelerometer, ISO 5348:2021 lists either the vibration-excitation method, utilizing an electrodynamic vibration exciter with reference transducer, or the shock excitation method, using an impact test, drop test, hammer blow, or a pencil break [16]. ISO 5347-22:1997 elaborates further on the excitation method, giving specifics regarding instrumentation and procedures to be used with accelerometer resonance testing, ranging from 50 Hz to 200 kHz [33].
This work looks to test mounting techniques using commercially available adhesive products with easy removal, along with techniques that would allow for quick, nondestructive mounting with potential applicability in high-temperature environments. Overall, the goal is to determine the usable frequency range of these techniques and if they are viable for quick, accurate, and nondestructive vibration measurements. While this work was inspired by a need in the nuclear industry, the research is applicable and relevant to all accelerometer measurements.
2. Materials and Methods
2.1. Sources and Sensors
A PCB Piezotronics Model 699B06 portable calibration shaker (Depew, NY, USA) was used for these measurements. The shaker was programmed to run at frequencies from 50 Hz to 10 kHz with intervals at the center frequencies of one-third octave bands totaling 24 discrete measurement points. A frequency of 50 Hz was selected following the lower limit suggested by ISO 5347-22:1997, while 10 kHz was the highest frequency of the shaker and accelerometers tested. Center frequencies of one-third octave bands were used following the shaker’s manual, citing ISO 16063-21 [34]. The shaker was first tested with a voltmeter to confirm an accurate and stable internal reference accelerometer. An amplitude of 0.1 g RMS was selected to be safely above the noise floor but low enough not to generate distortions.
Three different accelerometer models, PCB Piezotronics 352B, 352C33, and 333B30 (Depew, NY, USA), were used for this analysis to measure the mounting techniques with varying masses, sensitivities, and frequency responses. Table 1 gives specifications regarding each accelerometer. Masses for all mounts were measured using a calibrated scale. Data from accelerometers was collected by a Larson Davis 831c sound level meter using a PCB Piezotronics ICP cable adaptor model ADP074 (Depew, NY, USA). The meter was equipped with sound recording and measurement history firmware to measure 16-bit wav files sampled at 24 kHz and Excel files with one-third octave band data, averaged every second.

Table 1.
Accelerometer model, sensitivity, frequency range, and measured mass for each of the three accelerometers.
2.2. Mounting Techniques
Two separate mounting masses were used, allowing for the different mounting methods to be attached. First, a mounting plate provided with the shaker was used with predrilled holes of varying thread sizes, with a mass of 114.1 g. This flat, clean surface allowed for testing of the adhesive products along with stud mounting. Then, a 1.5″ × 1.5″ × 3″ cut of T slot aluminum structure with mass 109.5 g was drilled to allow for connection to the shaker, as well as predrilled holes for stud mounting accelerometers. The aluminum cut was to simulate a real-world scenario of a structure commonly used and to give enough space to attach the quick mounting and bracket methods.
Seven mounting methods were selected for testing, along with the reference stud mounting. A variety of materials using adhesives were measured using the mounting plate, while the other techniques were measured using the aluminum frame. Table 2 gives a description of each mounting technique along with a measured mass and thickness. An example of using mounting tape is shown in Figure 1, where accelerometer C is mounted with thick foam tape. The remaining images in Figure 1 show accelerometers mounted onto the T-slot aluminum structure. ISO 5348:2021 specifies the use of film tape with a thickness less than 0.2 mm, and that foam-based tapes are generally not suitable. Thus, only foam-based materials were tested to better characterize and understand their specific limitations not captured in the standard. A 3D printed mount, hose clamp, and zip tie mount were tested following guidance for quick mounts and mounting fixtures. The high-temperature limitation of these mounts is expected to be at the melting point, though further testing is required. Two different 3D printed mounts were used, as each had a different predrilled thread size. These 3D mounts were specifically printed to attach to a T-slot aluminum structure.
Table 2.
Mount, general description, measured mass, and measured thickness of each accelerometer mount are measured.
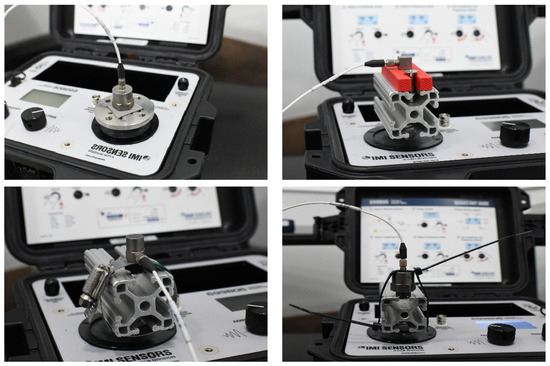
Figure 1.
Accelerometer C thick foam tape mounted on the mounting disk (top left). A 3-D print mounted on an aluminum frame (top right), accelerometer B hose clamp mounted to an aluminum frame (bottom left), and accelerometer C zip tie mounted to an aluminum frame (bottom right).
2.3. Measurement and Analysis
Frequency measurement points, implemented by the shaker, were held constant for 5–10 s for each mounting condition to allow for a steady state to be reached. Each test was repeated three times to ensure consistency across measurements. Care was taken during mounting to follow relevant ISO 5348:2021 guidance, such as ensuring a clean surface and inspecting a flat, tight connection.
While both wav and Excel files were recorded, the Excel files were used for analysis, which utilized the meter’s processing, such as one-third octave band filtering and converting to vibration amplitude units of g. Python (Version 3.12.8) was used to extract amplitudes for each test in each band, and a data frame was created with labels regarding mounting condition, accelerometer model, and test number. To only compare the mounting method and limit artifacts introduced by the two mounting masses, the stud-mounted method was used as the ground truth, following Miller et al. [22]. Ratios were calculated for each method against stud mounting, and thresholds of ±5%, 10%, and 3 dB were set [16,17,22]. These thresholds represent a relationship to the resonance frequency and indicate the frequencies where accelerometer measurements are inaccurate.
3. Results
3.1. Consistency Between Measurements
Each mounting and accelerometer condition was repeated three times to ensure consistency across each measurement. Overall, there were small standard deviations between repeated measurements before the 3 dB increase. After the 3 dB threshold was exceeded, the amplitudes varied. Figure 2 shows an example of an averaged repeated test with ± one standard deviation for accelerometer B mounted onto the 3D printed mount. Measurements are consistent until resonance, which falls between approximately 2000 and 9000 Hz, indicating an inaccurate measurement range.
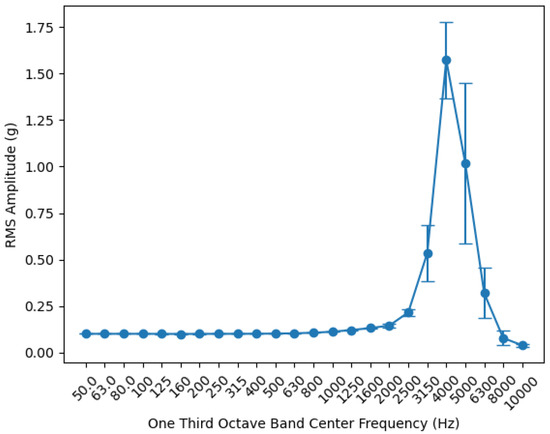
Figure 2.
Accelerometer B 3D print mounted to an aluminum frame, RMS amplitude averaged across three repeated measurements with ± one standard deviation error bars.
3.2. Adhesive Mounting
Four adhesive mounts were examined, and the amplitude ratios were calculated against stud mounting. Figure 3 shows each adhesive for each accelerometer, while Table 3 gives the upper frequency range for each threshold. The ±3 dB region is marked following Dumont et al. [17]. Neither the foam dot nor the poster strip performed well over approximately 160 Hz and 200 Hz, respectively, with the best performance measured during the 3 dB threshold and only up to 500 Hz. Two double-sided tapes were tested, finding the 3 dB limit from 2000 Hz up to 5000 Hz, though this upper limit exceeded sensor limits. Additionally, the thin foam tape had the highest values for two of the accelerometers using the 10% threshold. Differences across accelerometers were noted with the foam dot and poster strip, following an expected shift in the lightest accelerometer having the highest resonance frequency [17].
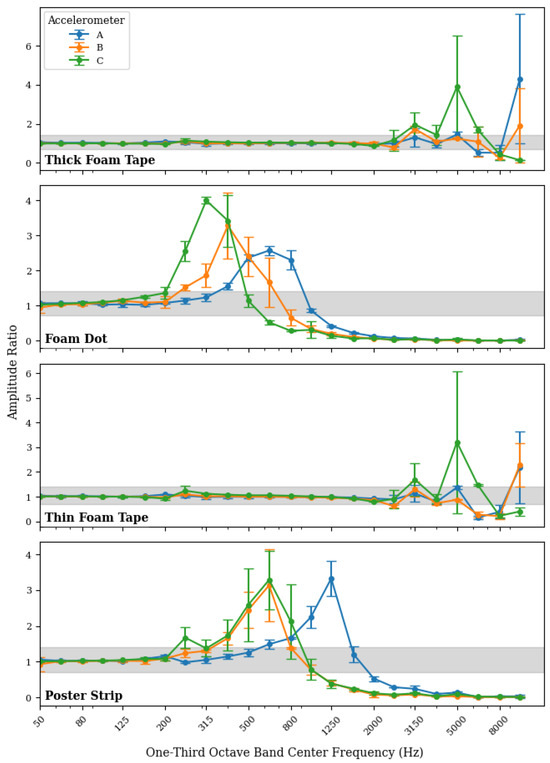
Figure 3.
Amplitude ratio of adhesive mounts, thick foam tape, foam dot, thin foam tape, and poster strip against stud mounting for accelerometer A, B, and C, with the ±3 dB thresholds shadowed and error bars showing ± one standard deviation.
Table 3.
Upper frequency limits of ±5%, 10%, and 3 dB for each adhesive mounting method and accelerometer. Shading is included when the frequency exceeds the manufacturer’s sensor limits.
3.3. Frame Mounting
Three quick mounts were tested, and the amplitude ratios were calculated against the stud mounting. Figure 4 shows each quick mount for each accelerometer, while Table 4 gives the upper frequency range for each threshold. Both the hose clamp and zip tie had a wide range at the 3 dB threshold from 800 to 2500 Hz. Large differences in amplitude and resonant frequency between accelerometers were observed for each mount. The reason for these differences is unclear, but mounting techniques were prone to slippage and unlevel mounting. Hose-clamp mounting for accelerometer A shows multiple distinct peaks, suggesting loose mounting.
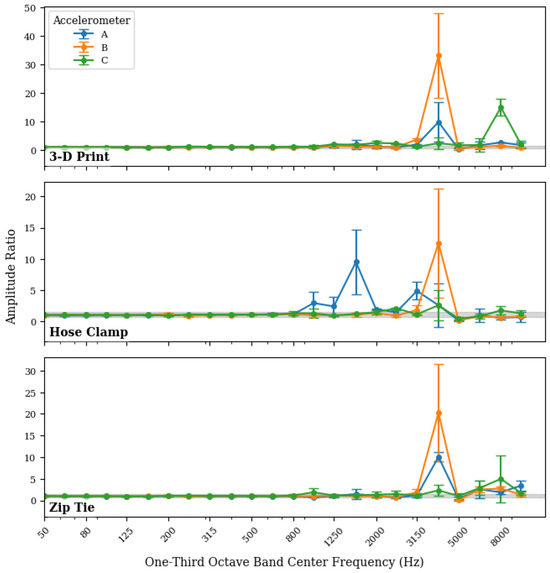
Figure 4.
Amplitude ratio of quick mounts 3D print, hose clamp, and zip tie against stud mounting for accelerometer A, B, and C, with the ± 3 dB thresholds shadowed and error bars showing ± one standard deviation.
Table 4.
Upper frequency limits of ±5%, 10%, and 3 dB for each quick mounting method and accelerometer.
3.4. Overall Mounting Results
From Table 3 and Table 4, the lowest frequency at the 3 dB threshold for each mounting condition across accelerometers is shown in Figure 5. The lowest was used as a conservative estimate of a maximum frequency. This was performed to give a clear, practical limit of each mounting condition tested and to summarize Table 3 and Table 4. Both foam tapes had the highest two maximum frequencies, while the foam dot and poster strip performed the worst.
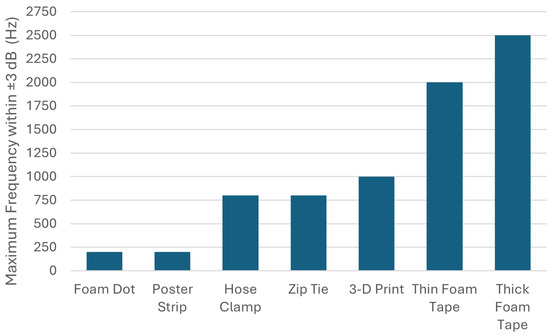
Figure 5.
Maximum frequency within the ±3 dB range using the lowest value across the three accelerometers.
4. Discussion
Adhesive and quick mounts were tested using the sinusoidal vibration excitation method, finding the upper frequency limit. First, it was found that measurements were consistent across each test to help ensure the precision of the measurement. Then, the results showed the measurement for each mount and accelerometer across frequency. The difference between each accelerometer within the same mounting condition inconsistently differed. For the poster strip and foam dot adhesive mounts, the accelerometer with the lowest mass was found to have the highest resonance frequency. For the quick mount, differences may be attributed to the size and geometry of the accelerometers, allowing for differences in surface contact made by each accelerometer to the structure.
For each mounting technique and accelerometer, the thresholds of ±5%, 10%, and 3 dB were calculated. The 5% and 10% thresholds were not used for additional analysis, as they typically were exceeded at a low frequency not representative of resonance. This is most likely due to the combined variation in each accelerometer (±5%) and the shaker table (±3%), as well as the ratio of mounting mass to structure mass.
Using the ±3 dB threshold, the lowest value across accelerometers was used as a conservative bound for maximum measurable frequency. This can be used concurrently with standards and recommendations, such as ISO 20816-1 and Chu et al., depending on the individual field and vibration monitoring needs [2,23]. Both the poster strip and foam dot did not perform well and are deemed as not recommended for use. These mounts are easy to remove without leaving residue behind, which would be nondestructive and quick to remove; however, this also indicates an adhesive strength not suitable for a rigid mount. Additionally, these mounts were relatively thick and made of material that was not suitable for vibration measurements.
The hose clamp and zip tie were both limited to 800 Hz each by one accelerometer, while the other two accelerometers performed to a higher frequency of 1600–2500 Hz. These methods were prone to mounting errors of unlevel contact, not tight enough connection, and potential for slippage. The large range of mounting frequency and the difference between accelerometers could be partially attributed to these risks. Accelerometer A hose-clamp mounting is also indicative of this risk, showing multiple distinct resonances most likely due to slippage or loose mounting.
The 3D printed mount was within ±3 dB up to a frequency of 1000 Hz and is designed to work on aluminum-frame structures, such as 80/20 T slots. Both double-sided tapes performed the best out of the methods tested. Double-sided tape is one of the methods defined in ISO 5348:2021, though foam is mentioned to generally not be suitable. The thinner tape did not perform as well as the thicker tape, which was not expected, though other factors, such as adhesive strength, are also a factor. In total, knowing the range and limitations of these methods allows for the determination of situations in which the mounting method could be appropriate.
In regard to limitations and future work, this test used a portable shaker table for measurements. A larger table with a larger mass would help negate any effects due to the mounting mass being on a similar scale, with a closer agreement across the accelerometer expected. An internal reference accelerometer could also be used in a shaker with a mass much larger than the mounting material, limiting error. Additionally, a shock test could be used to confirm these sinusoidal excitation results. The quick mounts were all measured using an aluminum frame that is often seen in the field. Other mounting surfaces and shapes, such as pipes, should be tested with zip ties and hose clamps to ensure accuracy. The quick mounts would ideally work in high-temperature environments, though the specific high-temperature limitation and thermal aging effects for adhesives should be tested.
5. Conclusions
The mounting of an accelerometer is an important decision impacting the frequency limit of an accurate measurement. Novel methods that would be quick, nondestructive, and potentially applicable in a high-temperature environment mounting were tested using the sinusoidal excitation method, following recommendations from ISO 5348:2021. Foam dots and poster strips were deemed not viable for accelerometer mounting; hose clamps and zip ties were accurate up to 800 Hz, with extra care to securely mount to a surface; a 3D-printed mount designed for an aluminum frame was accurate up to 1000 Hz; and two foam tapes were accurate up to 2000 Hz. These methods, after researching their limitations, allow for monitoring below the set thresholds accurately in a quick, nondestructive manner and have potential in high-temperature environments.
Author Contributions
Conceptualization, K.H., J.H. and E.C.; methodology, K.H., J.H. and E.C.; formal analysis, K.H.; investigation, K.H. and J.H.; writing—original draft preparation, K.H.; writing—review and editing, J.H. and E.C.; visualization, K.H.; supervision, E.C.; project administration, E.C.; funding acquisition, E.C. All authors have read and agreed to the published version of the manuscript.
Funding
This research was funded through a Laboratory Directed Research and Development project under Battelle Energy Alliance, LLC contract number DE-AC07-05ID14517.
Data Availability Statement
Restrictions apply to the availability of these data. Data were generated at Idaho National Laboratory and are available with the permission of the U.S. Department of Energy and Battelle Energy Alliance. To request data access, contact the corresponding author.
Conflicts of Interest
The authors declare no conflicts of interest.
References
- Cárdenas, E.S.; Hix, J.D.; Ocampo Giraldo, L.A.; Greenhalgh, M.R.; Walker, C.M.; Johnson, J.T. A new approach to monitoring solvent extraction processes for the nuclear industry. Nucl. Sci. Technol. Open Res. 2024, 2, e26282. [Google Scholar] [CrossRef]
- Chu, T.; Nguyen, T.; Yoo, H.; Wang, J. A review of vibration analysis and its applications. Heliyon 2024, 10, e26282. [Google Scholar] [CrossRef] [PubMed]
- Hashemian, H.M. Wireless sensors for predictive maintenance of rotating equipment in research reactors. Ann. Nucl. Energy 2011, 38, 665–680. [Google Scholar] [CrossRef]
- Nandi, A.; Ahmed, H. Condition Monitoring with Vibration Signals: Compressive Sampling and Learning Algorithms for Rotating Machine; John Wiley & Sons Ltd.: Hoboken, NJ, USA, 2019. [Google Scholar]
- Park, B.; Yang, J.Y.; Lee, H.S.; Sohn, H. Sensing solutions for assessing and monitoring of nuclear power plants. In Sensor Technologies for Civil Infrastructures; Woodhead Publishing: Cambridge, UK, 2022; pp. 427–462. [Google Scholar]
- Pettigrew, M.; Taylor, C.; Fisher, N. Flow-Induced Vibration Handbook for Nuclear and Process Equipment; John Wiley & Sons, Inc.: Hoboken, NJ, USA, 2021. [Google Scholar]
- Casazza, M.; Barone, F.; Bonisoli, E.; Dimauro, L.; Venturini, S.; Masoero, M.; Shtrepi, L. A procedure for the characterization of a music instrument vibro-acoustic fingerprint: The case of a contemporary violin. Acta IMEKO 2023, 12, 1–6. [Google Scholar] [CrossRef]
- Ozturk, S. Experimental and numerical modal analysis of the traditional percussion instrument “Erbane”. Int. J. Eng. Sci. 2025, 216, 104351. [Google Scholar] [CrossRef]
- Mohd Ghazali, M.H.; Rahiman, W.; Tang, G. Vibration Analysis for Machine Monitoring and Diagnosis: A Systematic Review. Shock Vib. 2021, 2021, 9469318. [Google Scholar] [CrossRef]
- Tudor, E.; Vasile, I.; Lipcinski, D.; Dumitru, C.; Tănase, N.; Drăghici, F.; Popa, G. Accelerometers in Monitoring Systems for Rail Vehicle Applications: A Literature Review. Appl. Syst. Innov. 2025, 8, 70. [Google Scholar] [CrossRef]
- Karpenko, M.; Prentkovskis, O.; Skačkauskas, P. Analysing the impact of electric kick-scooters on drivers: Vibration and frequency transmission during the ride on different types of urban pavements. Eksploat. I Niezawodn.—Maint. Reliab. 2025, 27, 199893. [Google Scholar] [CrossRef]
- Karpenko, M.; Ževžikov, P.; Stosiak, M.; Skačkauskas, P.; Borucka, A.; Delembovskyi, M. Vibration Research on Centrifugal Loop Dryer Machines Used in Plastic Recycling Processes. Machines 2024, 12, 29. [Google Scholar] [CrossRef]
- Bagri, I.; Tahiry, K.; Hraiba, A.; Touil, A.; Mousrij, A. Vibration Signal Analysis for Intelligent Rotating Machinery Diagnosis and Prognosis: A Comprehensive Systematic Literature Review. Vibration 2024, 7, 1013–1062. [Google Scholar] [CrossRef]
- Su, X.; Liu, J.; Xu, J.; Chen, P. Recent Advances on Vibration Sensors and Calibration Methods for the Operation and Maintenance of Mechanical Equipment. Meas. Sci. Rev. 2025, 25, 122–133. [Google Scholar] [CrossRef]
- Kim, H.; Kerrigan, S.; Bourham, M.; Jiang, X. AlN Single Crystal Accelerometer for Nuclear Power Plants. IEEE Trans. Ind. Electron. 2021, 68, 5346–5354. [Google Scholar] [CrossRef]
- ISO 5348:2021; Mechanical Vibration and Shock—Mechanical Mounting of Accelerometers. International Organization for Standardization: Geneva, Switzerland, 2021.
- Dumont, M.; Cook, A.; Kinsley, N. Acceleration Measurement Optimization: Mounting Considerations and Sensor Mass Effect. In Topics in Modal Analysis & Testing, Volume 10; Conference Proceedings of the Society for Experimental Mechanics Series; Springer: Cham, Switzerland, 2016; pp. 61–71. [Google Scholar]
- Dumont, M.; Kuntz, D.; Petzsche, T. Testing Methods for Verification of a Mounted Accelerometer Frequency Response. In Special Topics in Structural Dynamics, Volume 6; Conference Proceedings of the Society for Experimental Mechanics Series; Springer: Cham, Switzerland, 2017; pp. 53–66. [Google Scholar]
- Piersol, A.; Paez, T. Harris’ Shock and Vibration Handbook, 6th ed.; McGraw-Hill: New York, NY, USA, 2010. [Google Scholar]
- Cocconcelli, M.; Spaggiari, A. Mounting of accelerometers with structural adhesives: Experimental characterization of the dynamic response. J. Adhes. 2015, 93, 585–598. [Google Scholar] [CrossRef]
- Spaggiari, A.; Cocconcelli, M. Effect of Temperature on the Dynamic Response of Adhesively Mounted Accelerometers. Exp. Tech. 2018, 42, 299–309. [Google Scholar] [CrossRef]
- Miller, A.; Sburlati, D.; Duschlbauer, D. Accelerometer mounting—comparison of stud and magnetic mounting methods. In Proceedings of the Hear to Listen Acoustics, Adelaide—South Australia, Adelaide, Australia, 6–9 November 2018. [Google Scholar]
- ISO 20816-1:2016; Mechanical Vibration—Measurement and Evaluation of Machine Vibration Part 1: General Guidelines. International Organization for Standardization: Geneva, Switzerland, 2016.
- Chae, Y.H.; Kim, S.G.; Kim, H.; Kim, J.T.; Seong, P.H. A methodology for diagnosing FAC induced pipe thinning using accelerometers and deep learning models. Ann. Nucl. Energy 2020, 143, 107501. [Google Scholar] [CrossRef]
- Chung, B.; Kim, J.; Jang, D.; Kim, S.; Choi, Y. Experimental investigation of a method for diagnosing wall thinning in an artificially thinned carbon steel elbow based on changes in modal characteristics. Nucl. Eng. Technol. 2023, 55, 947–957. [Google Scholar] [CrossRef]
- Ghimire, L.; Waller, E. Small Modular Reactors: Opportunities and Challenges as Emerging Nuclear Technologies for Power Production. J. Nucl. Eng. Radiat. Sci. 2023, 9, 044501. [Google Scholar] [CrossRef]
- Li, T.; Fan, B.; Xiong, X. Multimodal Fusion-Based Fault Diagnosis of Motor in CRF Pump-Unit Under Data Imbalance. In Proceedings of the 2023 International Conference on Sensing, Measurement & Data Analytics in the Era of Artificial Intelligence (ICSMD), Xi’an, China, 2–4 November 2023; pp. 1–7. [Google Scholar]
- Lyseid Authen, T.; Adnet, J.-M.; Bourg, S.; Carrott, M.; Ekberg, C.; Galán, H.; Geist, A.; Guilbaud, P.; Miguirditchian, M.; Modolo, G.; et al. An overview of solvent extraction processes developed in Europe for advanced nuclear fuel recycling, Part 2—Homogeneous recycling. Sep. Sci. Technol. 2021, 57, 1724–1744. [Google Scholar] [CrossRef]
- Miguirditchian, M.; Vanel, V.; Marie, C.; Pacary, V.; Charbonnel, M.-C.; Berthon, L.; Hérès, X.; Montuir, M.; Sorel, C.; Bollesteros, M.-J.; et al. Americium Recovery from Highly Active PUREX Raffinate by Solvent Extraction: The EXAm Process. A Review of 10 Years of R&D. Solvent Extr. Ion Exch. 2020, 38, 365–387. [Google Scholar] [CrossRef]
- Terranova, M.L.; Tavares, O.A.P. Trends and Perspectives on Nuclear Waste Management: Recovering, Recycling, and Reusing. J. Nucl. Eng. 2024, 5, 299–317. [Google Scholar] [CrossRef]
- Xu, L.; Xiao, Y.; van Sandwijk, A.; Xu, Q.; Yang, Y. Production of nuclear grade zirconium: A review. J. Nucl. Mater. 2015, 466, 21–28. [Google Scholar] [CrossRef]
- Zhu, R.; Li, Y.; Huang, Q.; Li, S.; Zhang, X.; Li, H.; Fu, Q. Research on Vertical SEC Centrifugal Pump Multi-Fault Diagnosis Based on WPT–SVM. Energies 2023, 16, 7653. [Google Scholar] [CrossRef]
- ISO 5347-22:1997; Methods for the Calibration of Vibration and Shock Pick-Ups Part 22: Accelerometer Resonance Testing—General Methods. International Organization for Standardization: Geneva, Switzerland, 1997.
- ISO 16063-21:2003; Methods for the Calibration of Vibration and Shock Transducers Part 21: Vibration Calibration by Comparison to a Reference Transducer. International Organixation for Standardization: Geneva, Switzerland, 2003.


Disclaimer/Publisher’s Note: The statements, opinions and data contained in all publications are solely those of the individual author(s) and contributor(s) and not of MDPI and/or the editor(s). MDPI and/or the editor(s) disclaim responsibility for any injury to people or property resulting from any ideas, methods, instructions or products referred to in the content. |
© 2025 by the authors. Licensee MDPI, Basel, Switzerland. This article is an open access article distributed under the terms and conditions of the Creative Commons Attribution (CC BY) license (https://creativecommons.org/licenses/by/4.0/).