Article

The Effect of Wave Signature on the Voltage Output of an Oscillating Water Column

Department of Mechanical Engineering, Georgia Southern University, Statesboro, GA 30458, USA
Vibration 2025, 8(3), 54; https://doi.org/10.3390/vibration8030054
Submission received: 4 July 2025 / Revised: 9 September 2025 / Accepted: 17 September 2025 / Published: 22 September 2025

Abstract

The reduction in carbon footprint and scarcity of energy resources have increased the demand for renewable and sustainable energy resources, and thus, significant efforts have been concentrated on harnessing renewable and sustainable energy resources. The oscillating water column (OWC) wave energy converter has proven to be the most promising approach for harnessing wave energy. The OWC offers the benefits of a long operating time span and low maintenance, as air serves as the driving fluid. The hydrodynamic efficiency of OWC depends on the wave motion and its interaction with the OWC structure. Therefore, the present research concerns the impact of the incident wave signature on the OWC’s efficiency voltage output, and it is carried out experimentally using a laboratory-scale wave tank. Four different waves, of different amplitudes and frequencies, and their impact on the OWC voltage output are experimentally investigated. This study shows that the four waves exhibit different characteristics, such as crests and troughs of different slopes and amplitudes. However, although the wave crests exhibit relatively similar amplitudes, the wave troughs exhibit significantly different characteristics. This study also reveals that the OWC voltage output exhibits a nonlinear behavior due to the nonlinear nature of the incident waves and compressible air inside the OWC chamber. The maximum voltage output is obtained for a maximum air compressibility factor. However, lower voltage outputs are obtained for both compression and decompression of the air inside the OWC chamber.

1. Introduction

The reduction in carbon footprint and scarcity of energy resources caused an increased demand for renewable and sustainable energy resources [1,2,3,4,5,6,7,8,9,10,11,12,13,14,15]. Thus, significant efforts have been concentrated on harnessing renewable and sustainable energy resources. Since the early 2000s, the development of various renewable energy technologies has been investigated and utilized. Wind, solar, and wave energy are the most promising sustainable energy resources [1,2,3,4,5,6,7,8,9,10,11,12,13,14,15,16,17,18,19,20,21,22,23,24,25,26,27,28]. In the past, wind and solar energy resources have seen the most extensive developments, compared with wave energy [1]. However, wave energy, with a density thousands of times higher than the density of air, offers the advantage of higher power energy output compared with wind energy [1,5,6,7,8,9,10]. Compared with wind energy, the development of wave energy converters (WECs) is still in the very early stage of development [8,9,10]. In the past, various wave energy converters (WECs) have been studied using theoretical, computational, and experimental approaches. Currently, there are four main categories of wave energy convertors (WECs), namely, point absorbers, overtopping devices, attenuators, and oscillating water columns (OWCs). Out of all these wave extraction converter technologies, the oscillating water column is the most promising wave energy conversion approach due to its design simplicity, reliability, and ease of accessibility. It is worth mentioning here that the oscillating water column (OWC) uses the air as the driving fluid for the power take-off (PTO) unit, and thus, there is no direct contact between the corrosive ocean water and the PTO. Because the OWC does not have any rotating parts in direct contact with the ocean water, it is also an environmentally friendly wave energy converter. Usually, an oscillating water column consists of a closed chamber with two openings that trap air flow inside the OWC chamber. One opening of the chamber is exposed to ocean waves, while the other opening is designed with a PTO unit. The submerged part of the oscillating water column allows the column of water inside the chamber to oscillate up and down, which further causes the mass of air inside the OWC chamber to move outwards and inwards. In turn, the compression/decompression of the air forces the PTO to produce electricity.
The hydrodynamic efficiency of the OWC has been studied both experimentally and computationally with the aim of improving hydrodynamic efficiency. Both vertical OWC and inclined OWC have been investigated separately in the past, and studies showed that both designs present advantages and disadvantages [20]. Other various designs of OWC have been explored, such as multiple-chamber OWC [29,30], U-shape OWC [31], multiple-chamber cylindrical shape OWC [32], front-wall modified geometry OWC [33,34], bottom geometry modification OWC [35,36], oscillating front wall OWC [37,38,39], bottom plate on a floating OWC [12,13], projecting sidewalls [14], parabolic side wall for wave direction [40,41], coupling of OWC and floating cylinder [42], etc. In spite of the extensive experimental and computational research on OWC, there is a research gap between U-shaped and inclined OWC, and therefore, there is a need for further research on the combined designs of U-shaped and inclined OWC [31,33,37,43,44].

2. Literature Review

The first oscillating water column concept was developed in 1910, in France [1]. Further developments of the OWC followed in the early 1970s, in Japan [14]. The recent decades have also seen significant efforts and developments concerning the harnessing of wave energy. Therefore, some of the very first studies concerned the feasibility of wave energy extraction and its effectiveness and efficiency [1]. Previous researchers explored the feasibility of various designs using additional chambers to increase the air flow rate passing through the turbine [2,4,5,6,7,8,9,10]. The results showed that this design can enhance the voltage output, and thus, it outperformed the single-chamber design by increasing voltage output [7,8,9,10,14,15].
Other studies showed that the location of the OWC has a significant impact on the power voltage output [7,8,9,10]. Thus, coastal regions dominated by high waves generate higher voltage output, while a lower voltage output was observed in regions of low-amplitude ocean waves. Thus, studies conducted in Portugal showed that the Azores archipelago is one of the best locations for OWC [7,8,9,10]. It is worth mentioning here that the efficiency of the OWC is defined as pneumatic efficiency, which represents the efficiency of converting the wave power into pneumatic power [5,6]. On the other hand, the PTO efficiency is defined as the capacity of the PTO to transform pneumatic power into electricity [5,6,7,8,9,10]. Studies showed that usually, the OWC has efficiency in the range of 15–40%, for a short wave period range [14,15].
Besides experimental studies, numerical studies concerning the oscillating water column have also been conducted in the past. Thus, in recent years, computational fluid dynamics (CFD) have been used in studies of oscillating water columns as well [12]. These studies have shown that the CFD approach provides a good prediction of the hydrodynamics associated with the OWC. Computational studies of OWC’s design and efficiency, using OpenFOAM software (version 2016), were performed in the past [17]. One study concerned the impact of the geometric shape of the OWC chamber on the voltage output performance. The study concluded that the dual chamber enhances the voltage output [17].
Aiming at improved voltage output efficiency, previous computational and experimental studies employed designs that had a step on a single-chamber design [20,45]. The studies showed that this design enhanced the maximum pneumatic efficiency by up to 60%, while in some cases, the pneumatic efficiency was increased by 150%. It is worth mentioning here that the efficiency of the OWC is defined by the pressure distribution within the chamber. Studies showed that the immersion depth of the front wall and the length of the chamber are the main factors that impact the hydrodynamic efficiency of the OWC [20]. Thus, a study concerning the hydrodynamic performance of the OWC has also been performed, and it showed that the bottom slope and water depth impact the performance of the OWC [20]. Similar research investigated the dynamic wave forces acting on the front wall of a stationary OWC, showing that the incident wave force is defined by the ratio of the surface of the water column and the orifice area [5,6]. The study also showed that the total wave force decreases as the wavelength increases. Previous studies also showed that the efficiency of the oscillating water column is defined by the chamber geometry and the characteristics of the incident wave [5,11,14,17,18,20].
In spite of the notable advancement in harnessing wave energy, the optimum harnessing of wave energy has not been fully understood, and thus, there is still a large amount of wave energy that is not fully exploited. One of the main challenges posed by the OWC is its low efficiency. It is well-acknowledged by the research community that the oscillating water column technology has not reached maturity, and this has been hampered by its high cost and low power-output efficiency for significantly high coastal locations [7,8,9,10]. Generally, identifying the factors that affect the optimum operation of oscillating column technologies, as well as their locations, poses significant challenges associated with high financial costs.
Since full-scale experimental platforms of oscillating water columns pose significant financial cost challenges, small-scale laboratory experimental platforms can provide a wide range of information regarding the operations of the OWC at lower costs. Studies showed that laboratory-scale experiments are a promising approach for investigating the factors affecting the optimum efficiency of the OWC [24]. Moreover, studies showed that physical modeling of the oscillating water column, using lab-scale experimental approaches, provides a very good insight into the operation of the OWC under various sea conditions [24]. Thus, the present research concerns the experimental studies of OWC using a laboratory-scale wave tank. The present study concerns the impact of the characteristics of the incident wave on the voltage output efficiency of the OWC. The hypothesis of this research is that the nonlinear nature of the incident wave signature and air compressibility causes a nonlinear hydrodynamic energy conversion and thus, a nonlinear voltage output.
In the past, various designs of OWC have been explored [46,47,48,49,50,51,52,53,54]. One of these designs is the U-shaped OWC, which is a geometric modification of the conventional vertical column. This design features a horizontal leg forming a U-like structure, offering improved tuning capacity and broader frequency response. The U-shaped OWC concept was introduced to enhance energy capture across a wider range of wave frequencies by exploiting internal resonance. Early work explored the hydrodynamic response of OWC systems with different geometries and emphasized the advantages of frequency tuning using internal water column lengths [48].
Theoretical and experimental analysis of ducted OWCs focused on the optimization of the duct length and area to improve resonance conditions and airflow regulation [50,51]. Previous studies introduced the concept of a Resonant Wave Energy Converter (REWEC), which is a variation of the U-shaped OWC integrated into breakwaters. The theoretical model demonstrated that the addition of a horizontal duct enabled frequency tuning that allowed the OWC to resonate more closely with incoming wave periods [47]. Further studies also advanced the understanding of the internal dynamics of U-shaped OWCs by developing a comprehensive mathematical model [49]. The work accounted for air compressibility, nonlinear wave forcing, and chamber geometry to predict system performance and resonance conditions [49].
Experimental validation has been crucial for understanding real-world behavior [20,54]. Studies were conducted using wave tank experiments on REWEC systems and found that U-shaped OWCs performed better than conventional designs under irregular wave conditions [53]. Other studies provided performance data from a full-scale REWEC plant installed in the port of Civitavecchia, Italy, confirming its long-term operational viability [46]. It is worth mentioning here that efficient conversion of pneumatic energy into electricity is heavily dependent on turbine performance. Previous studies investigated Wells turbines in traditional OWCs, and recent efforts have examined their performance in U-shaped configurations [54]. Computational fluid dynamics (CFD) was also used to analyze airflow patterns and turbine integration, highlighting the importance of reducing pressure drop and flow separation [50]. Studies showed that U-shaped OWC challenges include complex hydrodynamics in extreme weather, turbine efficiency under bi-directional and fluctuating airflow, and long-term maintenance costs in harsh marine environments.
Thus, the goal of this research is to investigate a novel design of the OWC that combines a U-shaped with an inclined OWC. The hypothesis of this research is that the vertical water column of the U-shaped section would minimize energy losses due to wave–structure interactions. A second hypothesis of this research is that the nonlinear nature of the incident wave signature and air compressibility causes a nonlinear hydrodynamic energy conversion and thus, a nonlinear voltage output.

3. Materials and Methods

3.1. Laboratory-Scale Oscillating Water Column

As already mentioned, in the present research, a laboratory-scale wave tank is used to investigate the impact of the incident wave signature on the voltage output of an oscillating water column. Figure 1 presents the schematic of the experimental setup of the oscillating water column. In this case, the chamber of the OWC has an inclination of 45°, as shown in Figure 1. The inclination of the proposed design of the oscillating water column was based on the inclination of the LIMPET project, where the inclination angle was α = 40° [15]. Moreover, the proposed design of the OWC presents a vertical water column, as shown later in this section. The rationale for the vertical water column design was to minimize energy dissipation due to the vortices generated by wave–structure interactions. It is worth mentioning here that Figure 1a is adapted from [14], while Figure 1b is adapted from [15]. The power take-off is replaced in this lab-scale experimental platform by a piezoelectric membrane, which provides the voltage output. As shown in Figure 1, the incident wave impinges on the front wall of the OWC, and it causes an up-and-down motion of the water column inside the chamber. The up-and-down oscillation of the water column inside the OWC chamber causes compression/decompression of the mass of air in the upper region of the chamber. The schematic also shows the location of the piezoelectric membrane at the upper end of the lab-scale oscillating water column. As already mentioned, in this research, a piezoelectric transducer is used to replace the turbine and generator.
The piezoelectric transducer was chosen due to the fact that it is durable and convenient for integration into micro-electro-mechanical systems (MEMS) and is free of humidity in the moist water environment. Moreover, studies showed that usually, the PTO exhibits nonlinear behavior, which augments the overall nonlinearities associated with the OWC [55,56]. Usually, the OWC uses air turbines as PTO [55]. However, studies showed that the PTO system for a moving body-type OWC is usually modeled as an energy-dissipating damper in concept validation tests [57]. Thus, several studies modeled the PTO using an orifice plate to represent the quadratic air pressure flow characteristics of the air turbine [58,59,60,61,62,63]. Recent studies showed that the use of a piezoelectric membrane provides more accurate results by eliminating some of the nonlinear effects and uncertainties [58,64]. Thus, a piezoelectric membrane was adopted in this study as well. The choice of a piezoelectric membrane presents several advantages. Thus, piezoelectric materials generate electricity directly from mechanical stress or vibrations. In an OWC, the rising and falling water column creates pressure variations that can flex a piezoelectric membrane. This allows bypassing intermediate mechanical parts (e.g., turbines), reducing energy losses. Traditional turbines can be inefficient in low or irregular wave conditions. Piezoelectric membranes can respond to small pressure variations, making them more efficient at capturing energy in mild wave environments such as small-scale experiments. Membranes are typically thin and light, allowing for compact designs, which can reduce structural complexity and cost. No moving mechanical components means less wear and tear and less maintenance compared to turbines that have bearings, blades, and other moving parts.
Usually, the mechanism of energy conversion of OWC involves different energy transformation stages, such as hydrodynamic, turbine, and generator. The overall efficiency of the OWC depends on the individual efficiency of each of these stages. The first stage, the hydrodynamic stage, is the stage where the wave energy is first converted. This stage is dominated by complex fluid flow interactions between the incident wave and the solid wall of the OWC. In this stage, part of the wave energy is reflected back off the OWC wall, while another part of the wave energy is transmitted to the water column inside the chamber of the OWC, as shown in Figure 1b. This stage of energy conversion is the most important because low-efficiency energy conversion at this stage would result in low-energy conversion of the OWC. Studies showed that the hydrodynamic conversion stage plays the most important role in the efficiency of the OWC, and it is the main factor that has hindered the large-scale implementation and use of the OWC [7,8,9,10].
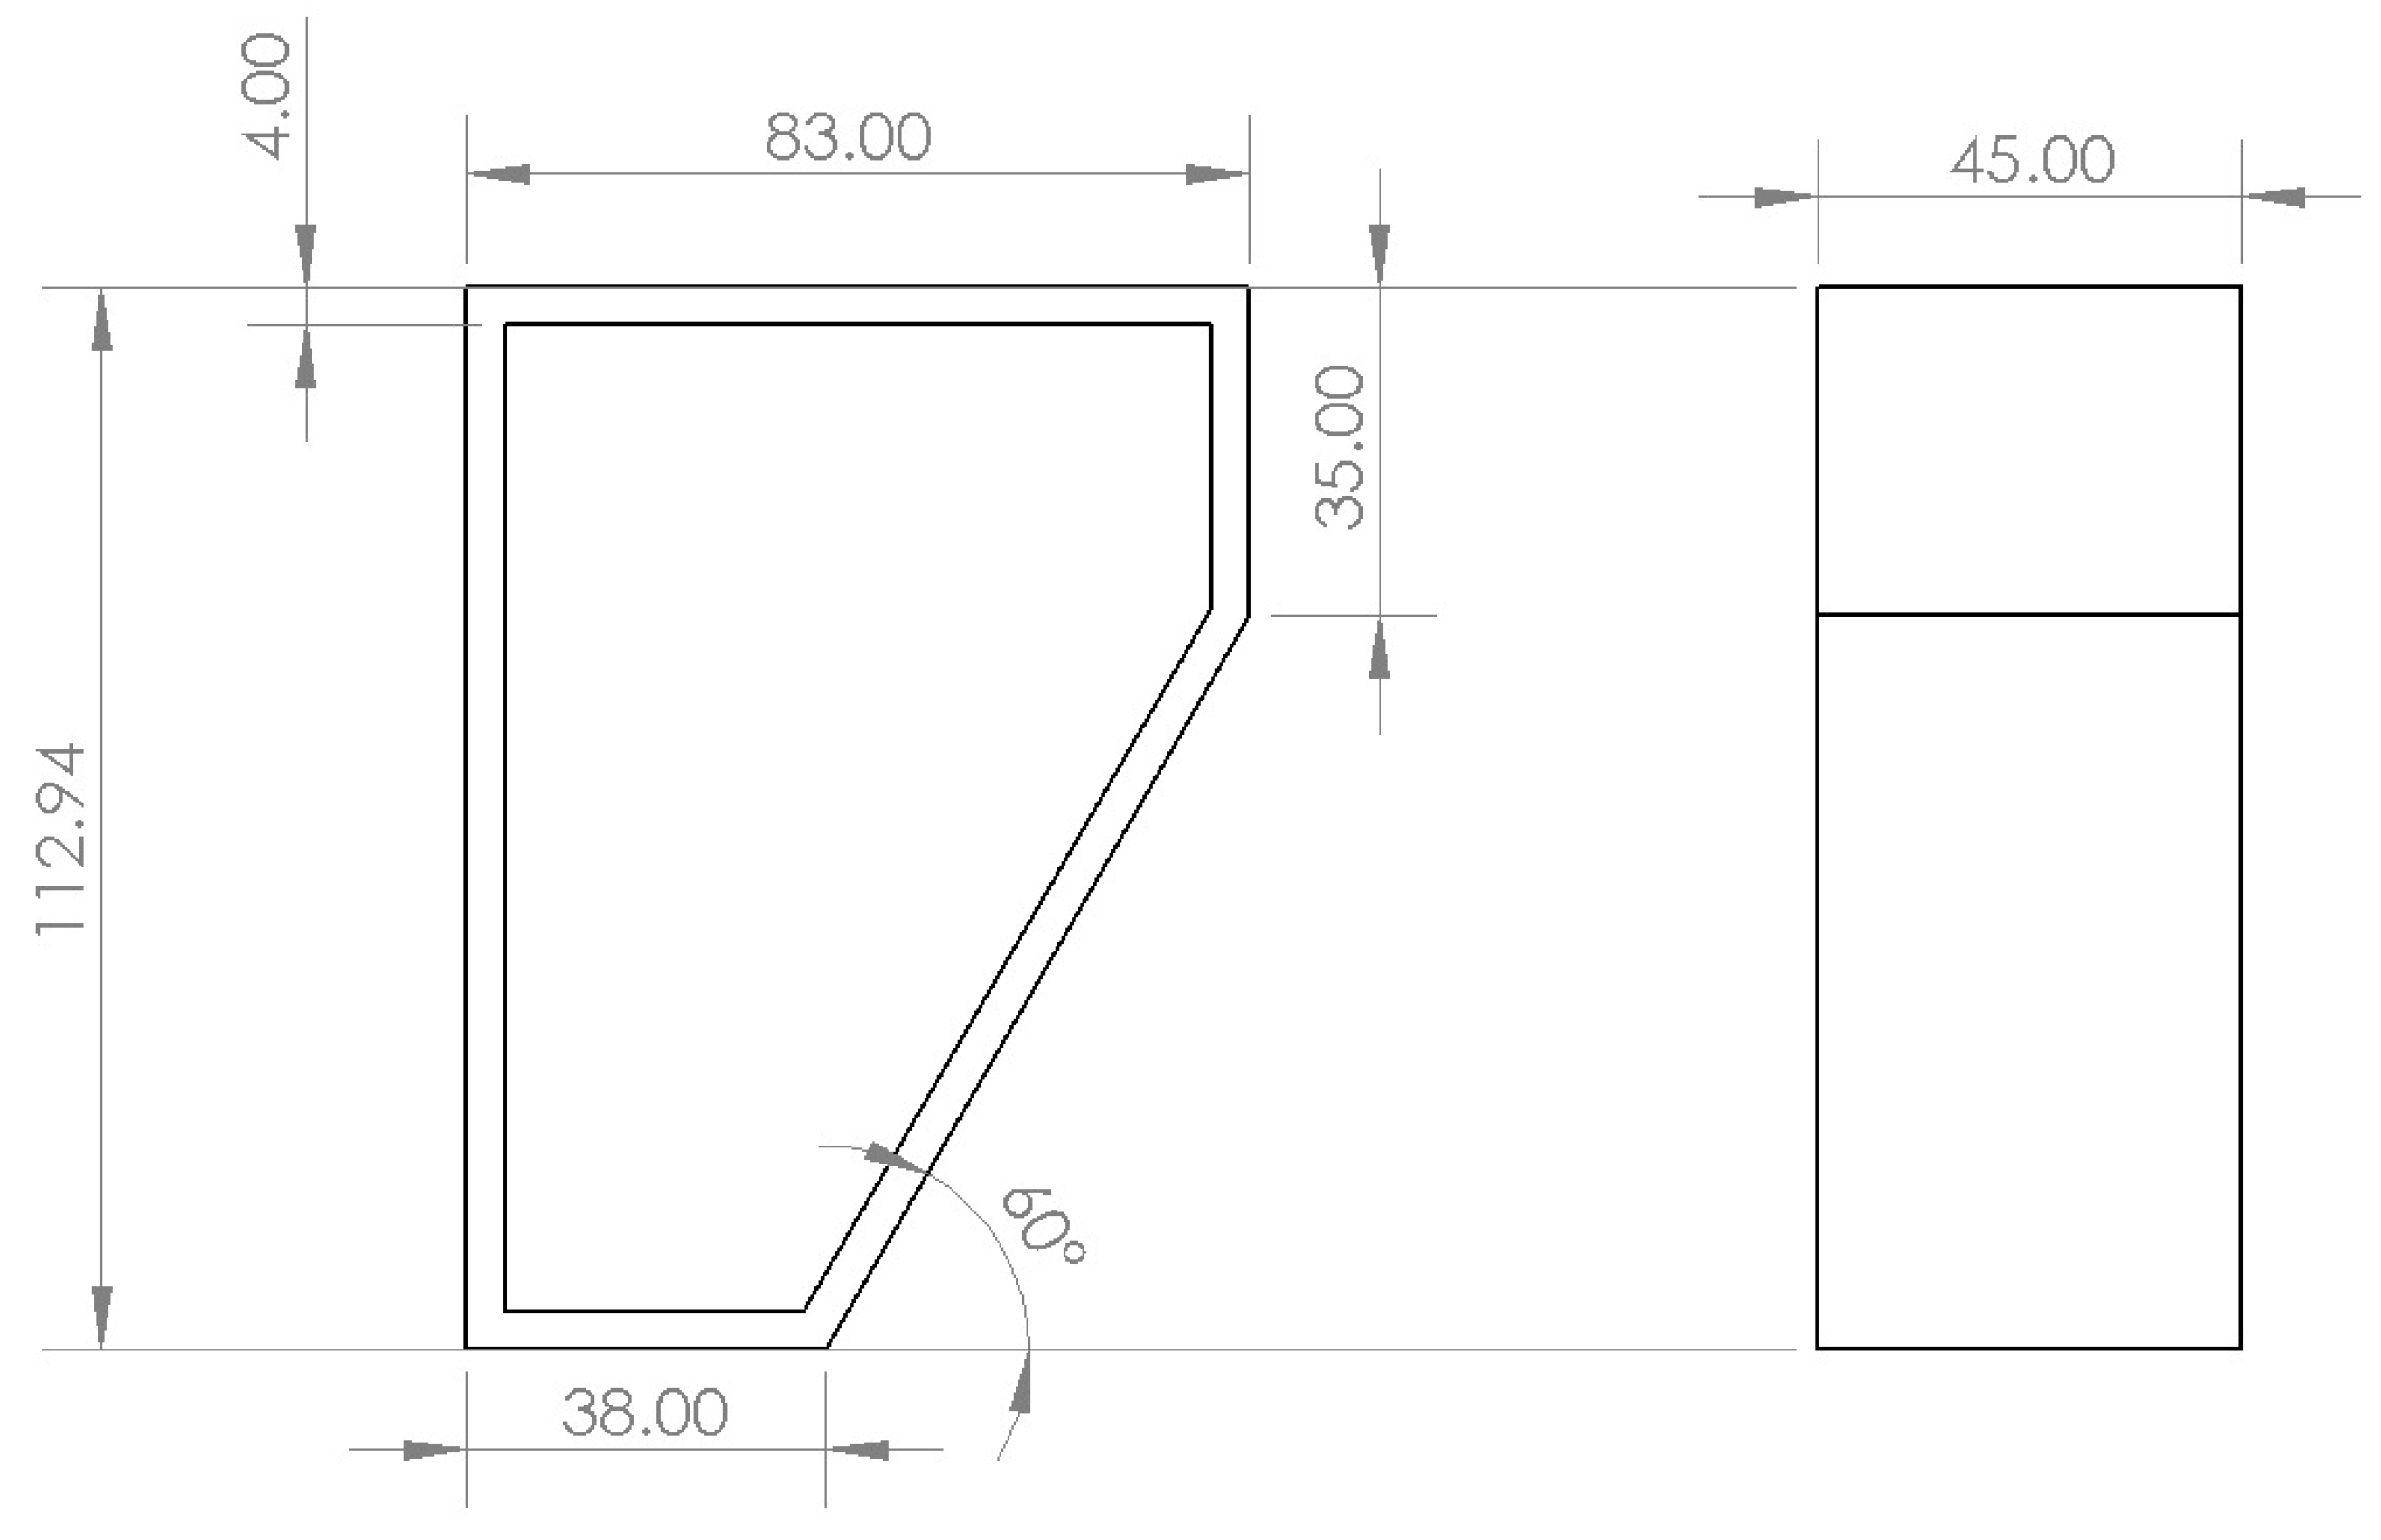
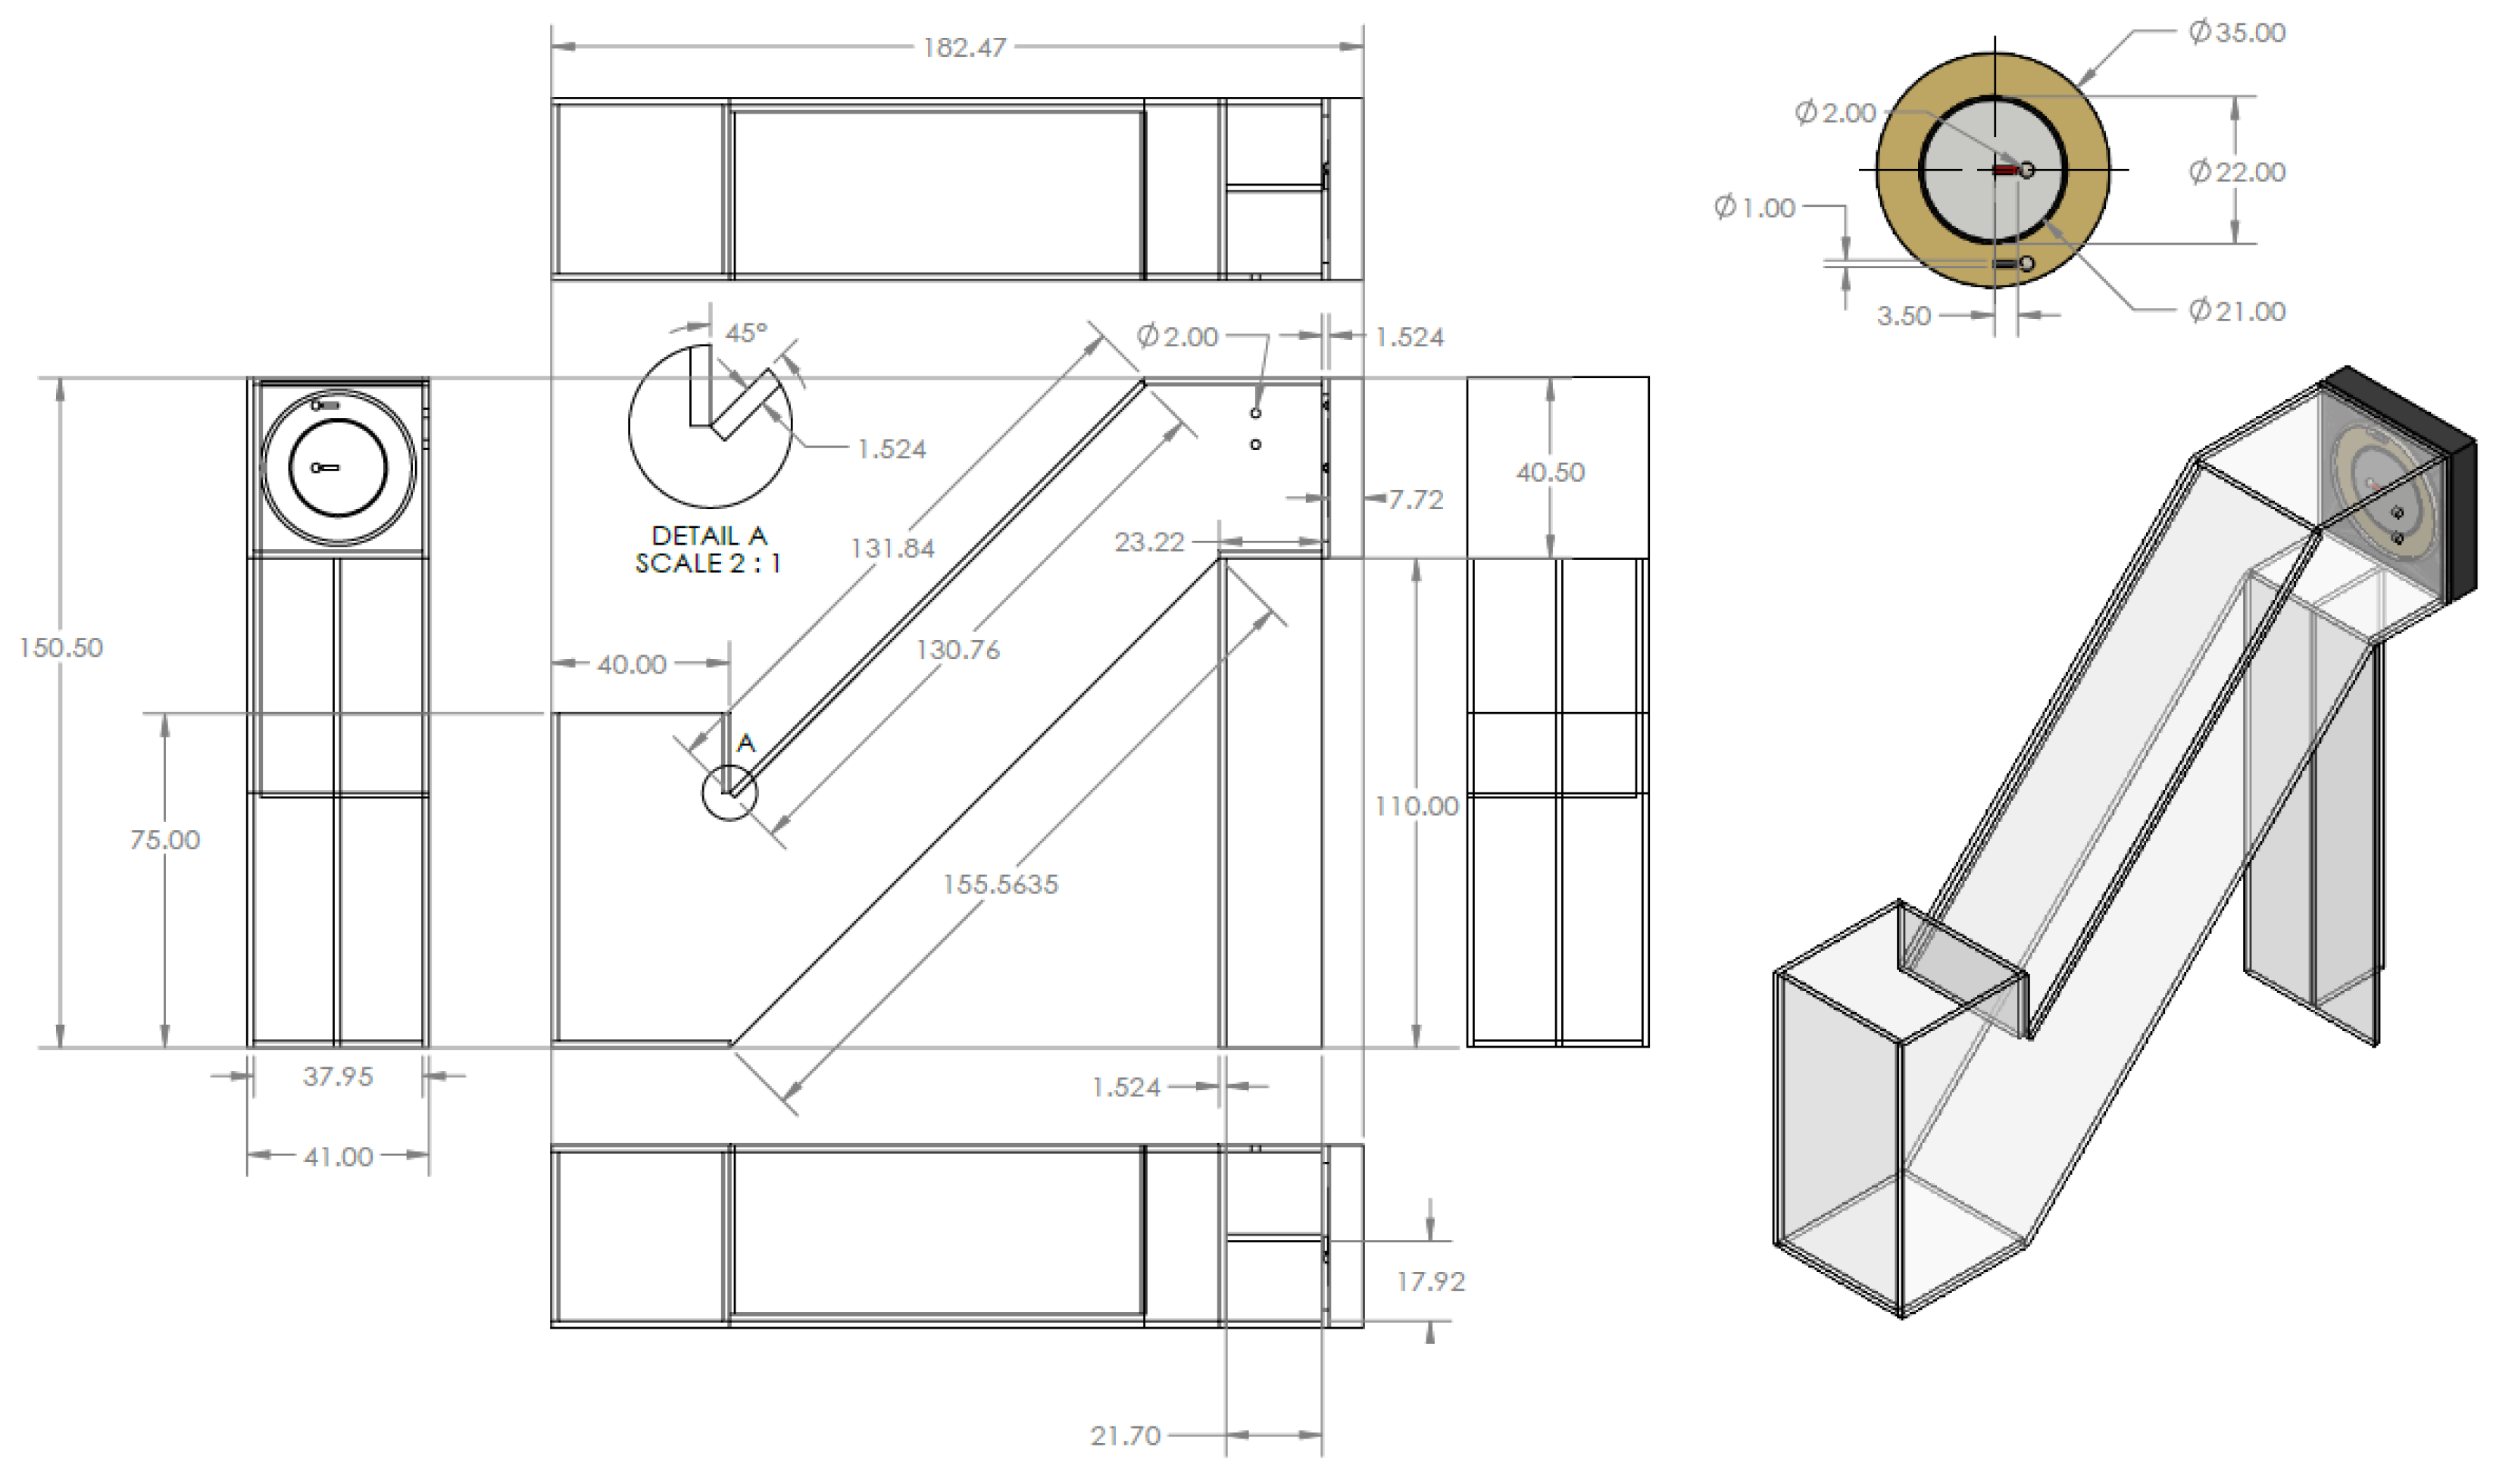
Figure 2 presents the design details of the plunger-type wave maker mechanism. It is important to mention here that all the dimensions are in millimeters.
The plunger-type wave maker was chosen based on its advantages, in shallow waters, over piston-type and flap-type wave makers [65,66]. Thus, the plunger-type wave maker presents several advantages, such as its use for shallow water experimental studies, generation of regular waves, generation of good wave height and period, and suitability for small-scale wave flumes [65,66]. The frequency of the plunger-type wave maker used in this research is 2.5 Hz, while the stroke of the plunger wave maker is 6.5 cm. The frequency and stroke of the plunger are controlled by the motor speed. Thus, increasing the supply voltage will increase the motor speed.
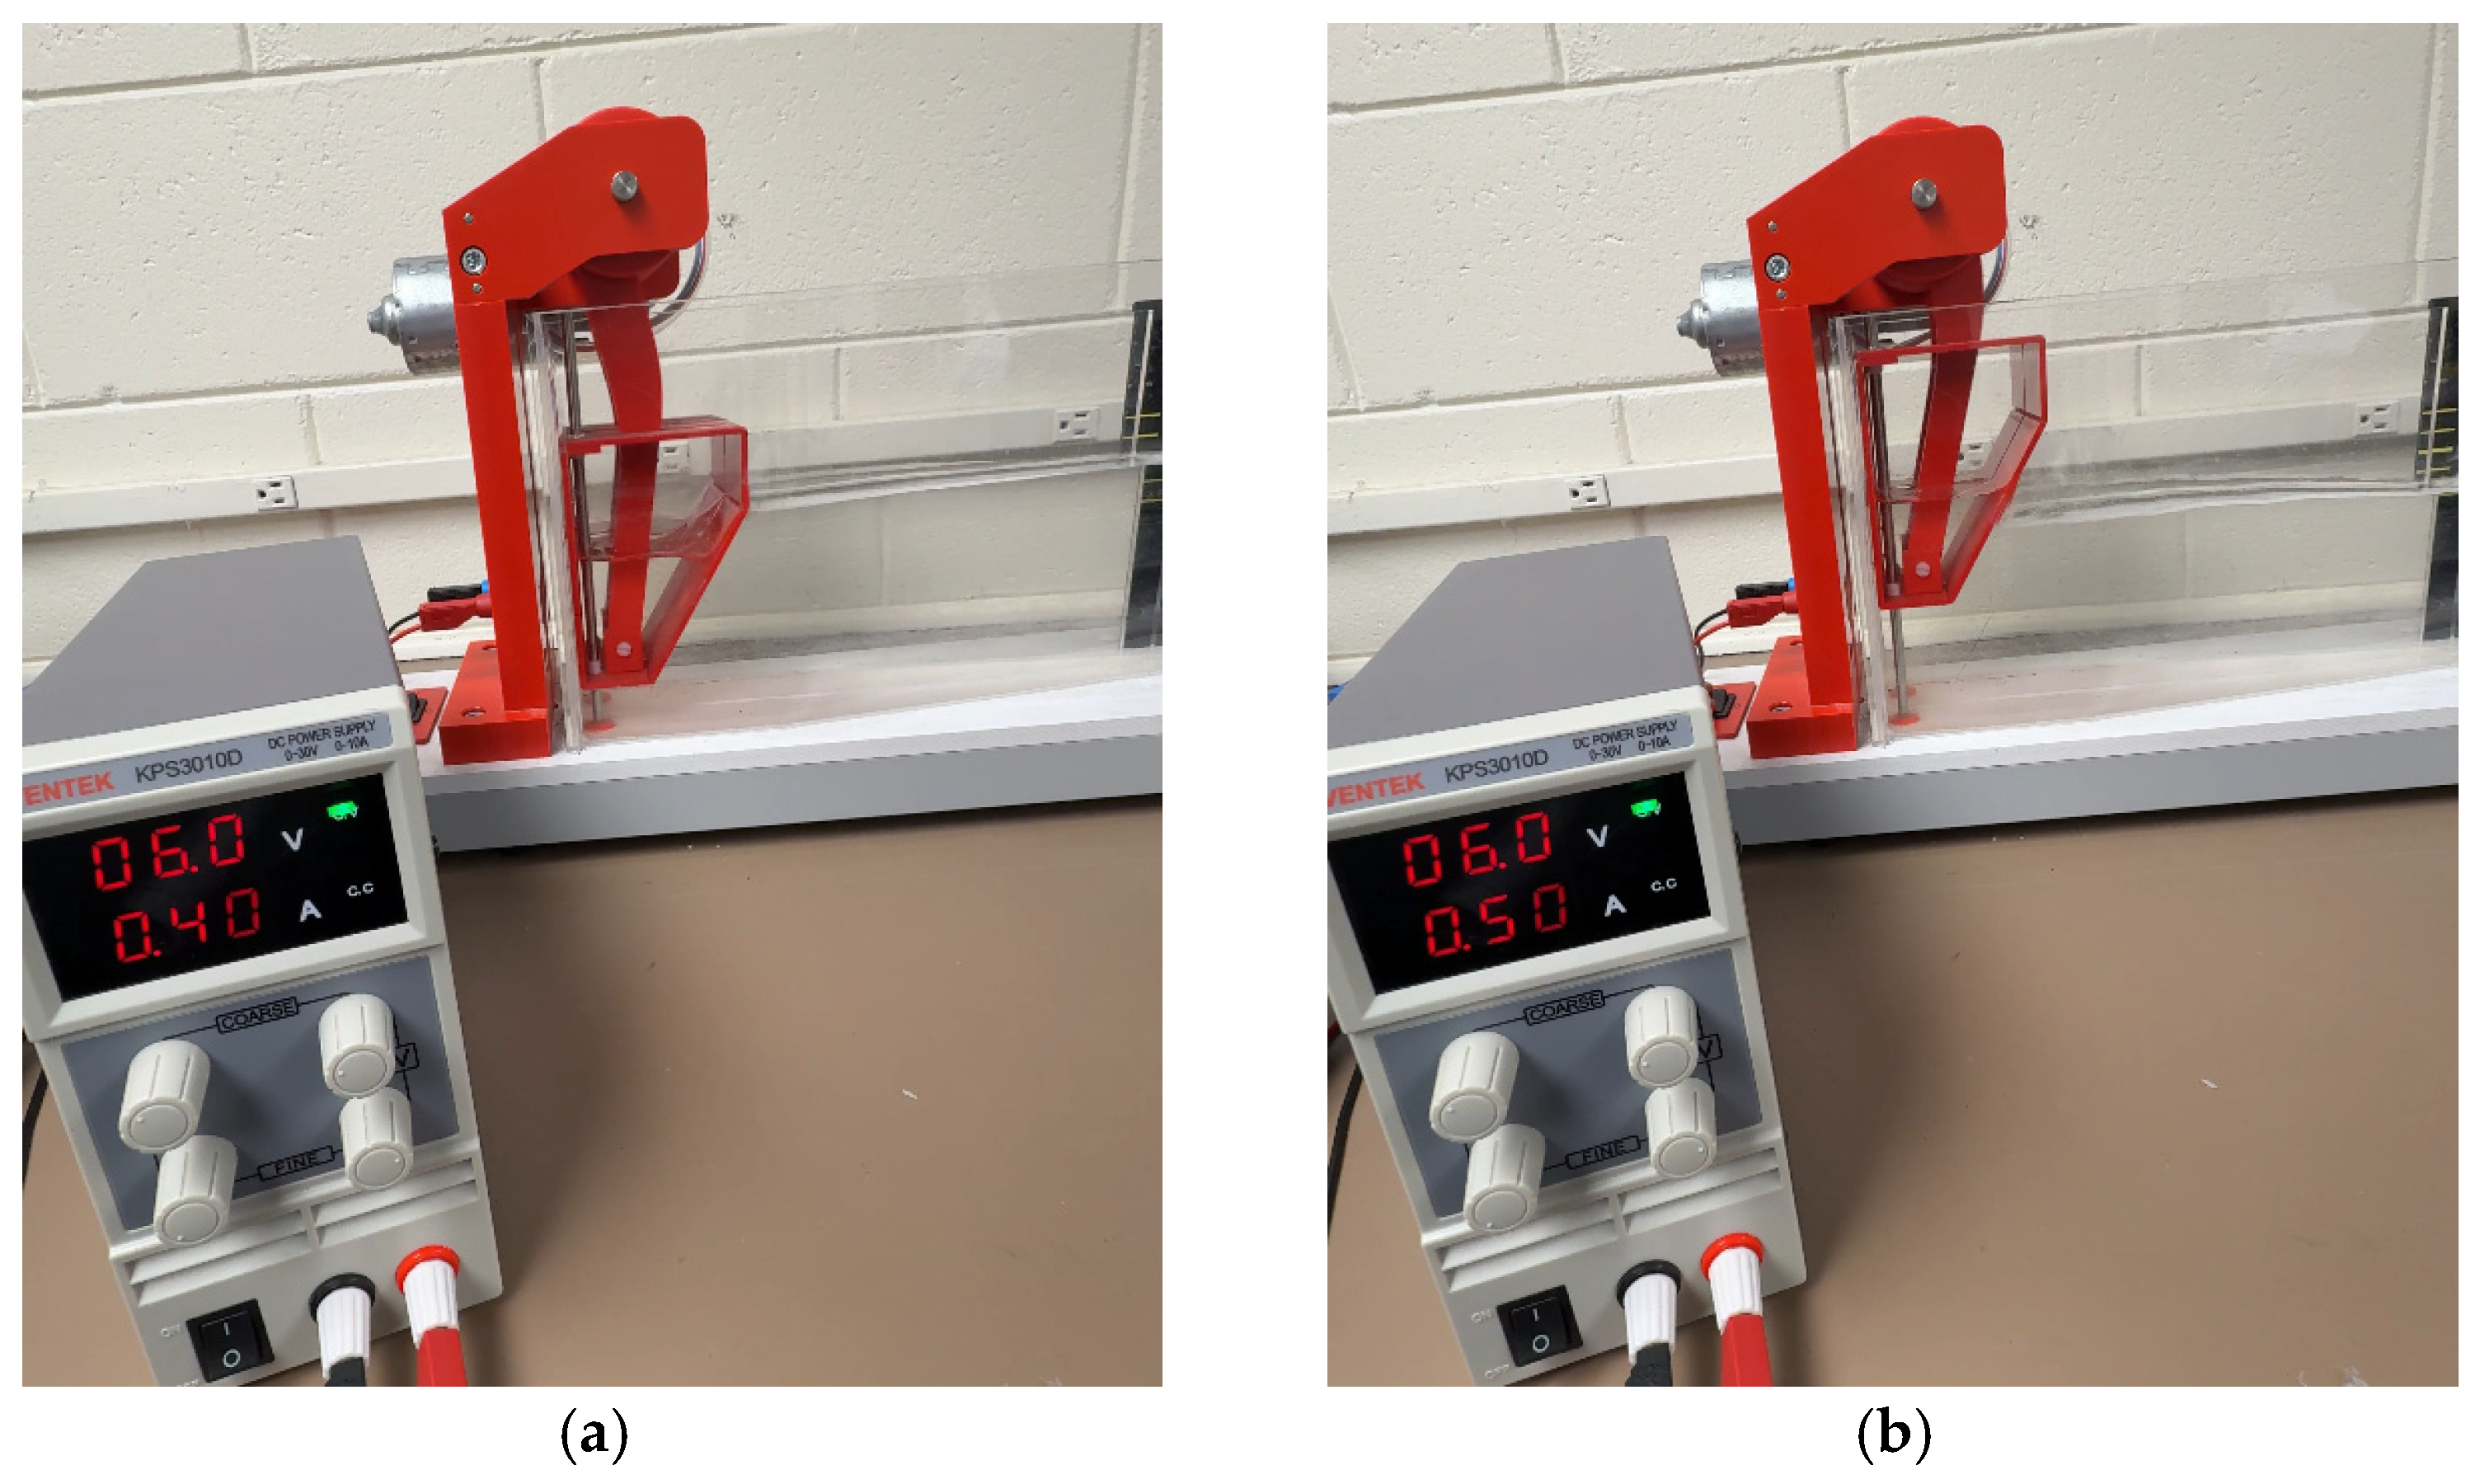
Figure 3 presents the plunger-type wave maker mechanism at the two maximum ends of the stroke displacements. It is important to mention here that the total stoke length is 6.5 cm.
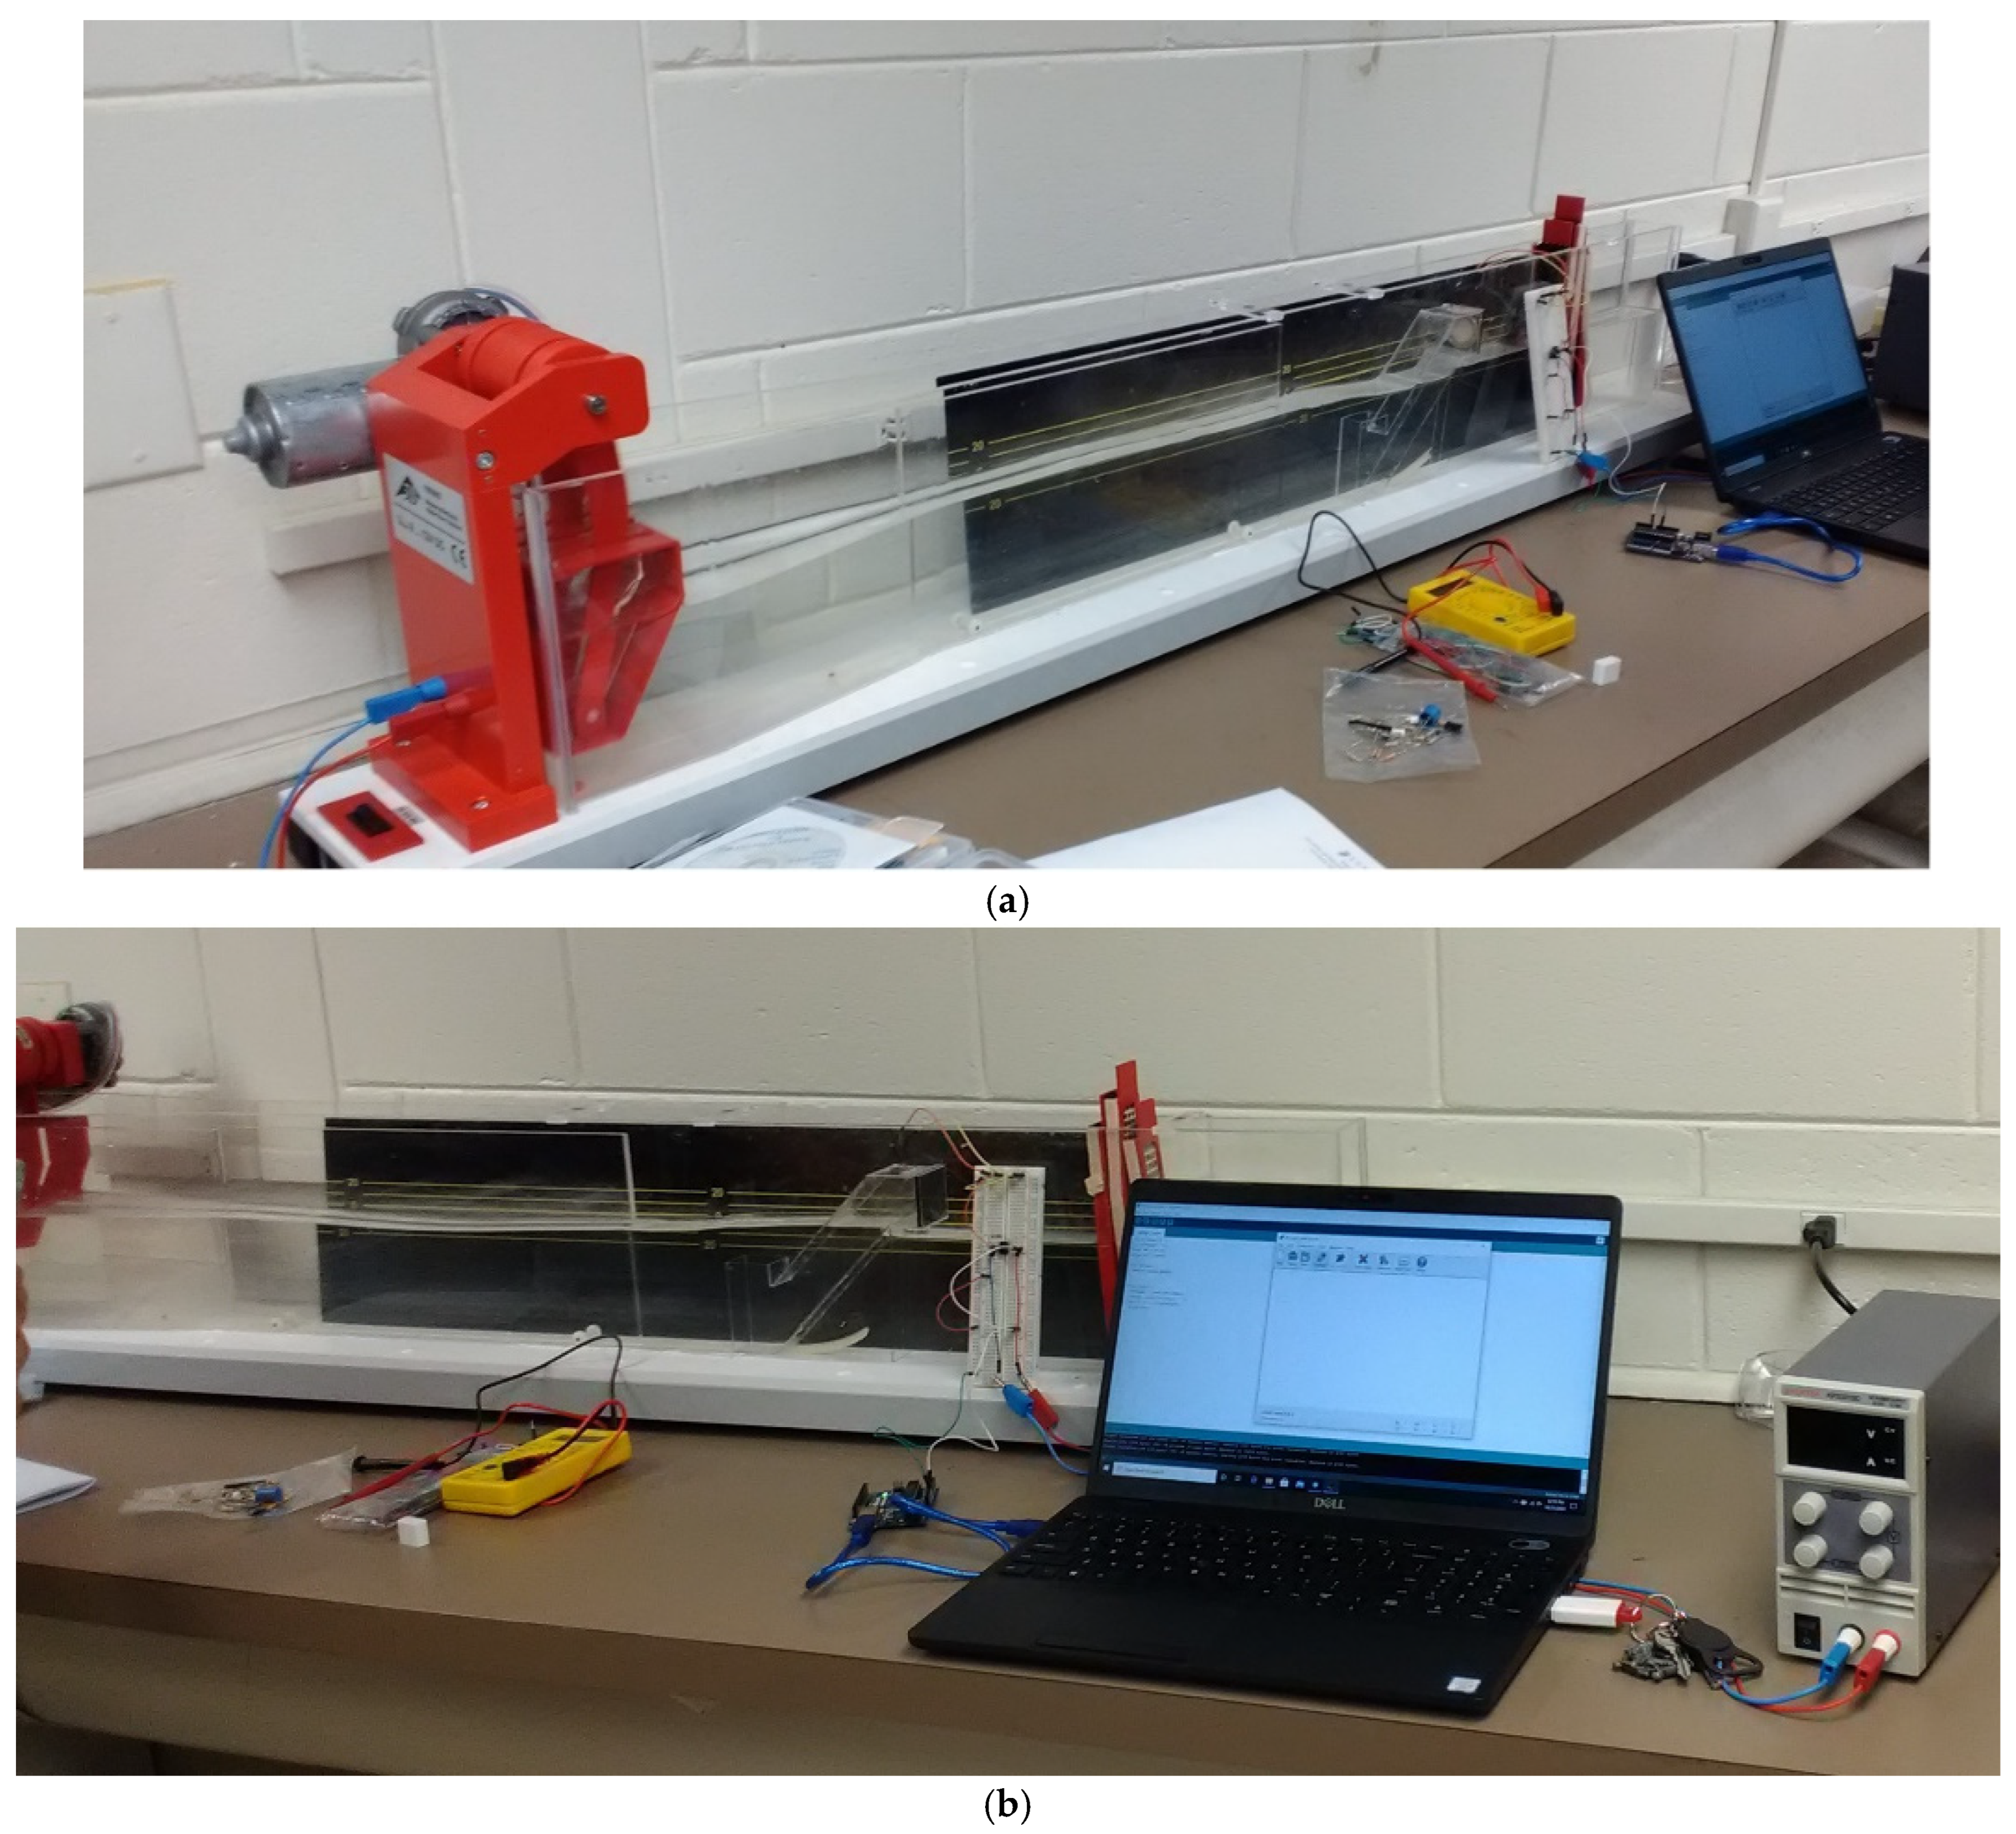
As already mentioned, this research concerns the impact of the wave characteristics on the voltage output. The lab-scale experimental setup used in the present research is presented in Figure 4. Therefore, Figure 4 presents the experimental setup consisting of the wave tank and wave-maker, OWC, piezoelectric membrane, and data acquisition system (Arduino). The dimensions of the wave channel are 1500 mm × 150 mm × 290 mm. The data is transferred to a laptop/PC in the Excel format and further post-processed, as shown in Figure 4b. In the present experimental configuration, a piezoelectric disc transducer (part No. TS1352) was utilized, selected for its increased sensitivity associated with its larger geometry. The transducer has a diameter of 35 mm (1.37 in.) and is equipped with wire leads of approximately 110 mm (4.3 in.) in length.
The electrical circuit diagram is presented in Figure 5.
For effective integration into renewable energy systems, the electrical output from a piezoelectric energy harvester must be conditioned before it can be stored or utilized by downstream loads. Piezoelectric generators convert mechanical strain into electrical energy, typically yielding an alternating current (AC) output—especially when operating at or near their resonant frequency in dynamic environments, such as ocean wave energy systems. However, most energy storage devices (e.g., lithium-ion batteries and supercapacitors) and power management circuits require a stable direct current (DC) input. Therefore, appropriate power conditioning circuitry is essential to rectify, filter, and regulate the harvested energy. As shown in Figure 5, the standard signal conditioning architecture comprises a full-wave bridge rectifier using four diodes, a high-capacitance smoothing capacitor, and a voltage regulation module. The rectifier converts the AC voltage into a pulsating DC waveform. The filtering capacitor then smooths the output by reducing ripple voltage. Finally, a voltage regulation stage adjusts the output to match the voltage requirements of the storage medium or connected electrical load. In the present circuitry, the resistive element is a Yageo MFR-25FBF52-1R0 (Yageo, Taipei) characterized by a nominal resistance of 1 Ω, a power dissipation capacity of 0.25 W, and a manufacturing tolerance of ±1%. The capacitive element is a Murata GRM1885C2A102JA01D (Murata Manufacturing Co., Nagaokakyo, Japan), implemented in a 0603SMD package, with a capacitance of 1000 pF (1 nF), a tolerance of ±5%, a rated voltage of 100 V, and a C0G/NP0 dielectric composition. This power management approach enables efficient capture, conversion, and storage of energy from piezoelectric sources, allowing for reliable integration into hybrid renewable energy systems and autonomous power platforms.
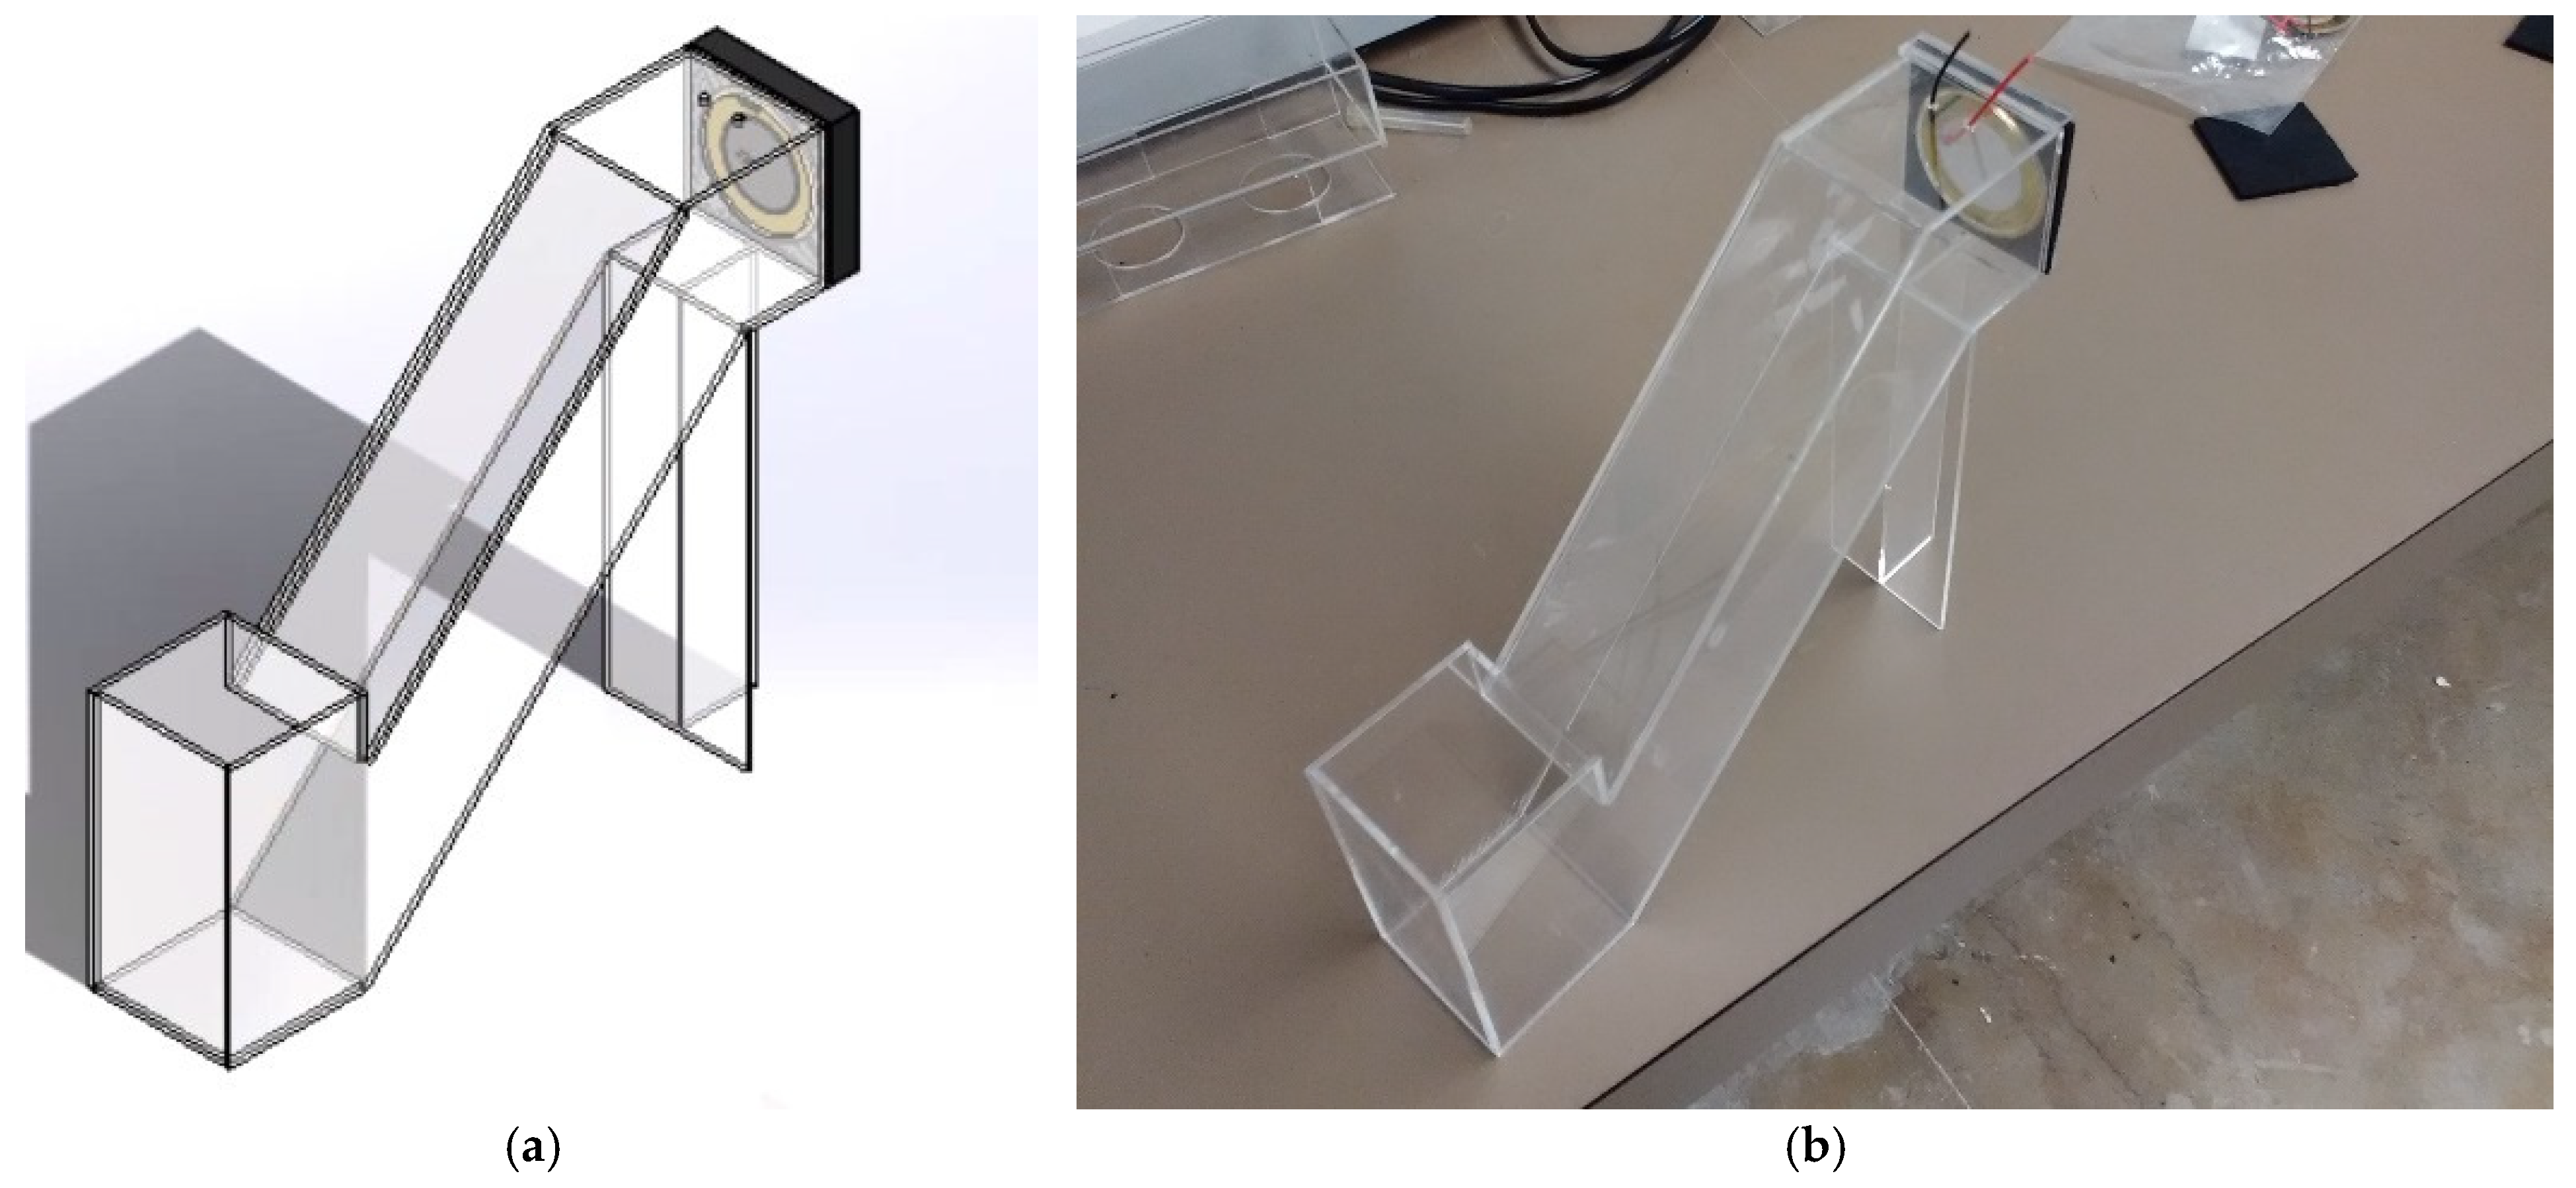
Additional details of the experimental design of the OWC are shown in Figure 6 and Figure 7, where the CAD model and physical lab-scale oscillating water column are presented. It is important to mention here that all the dimensions of the OWC design are in millimeters (mm).

3.2. Experimental Method

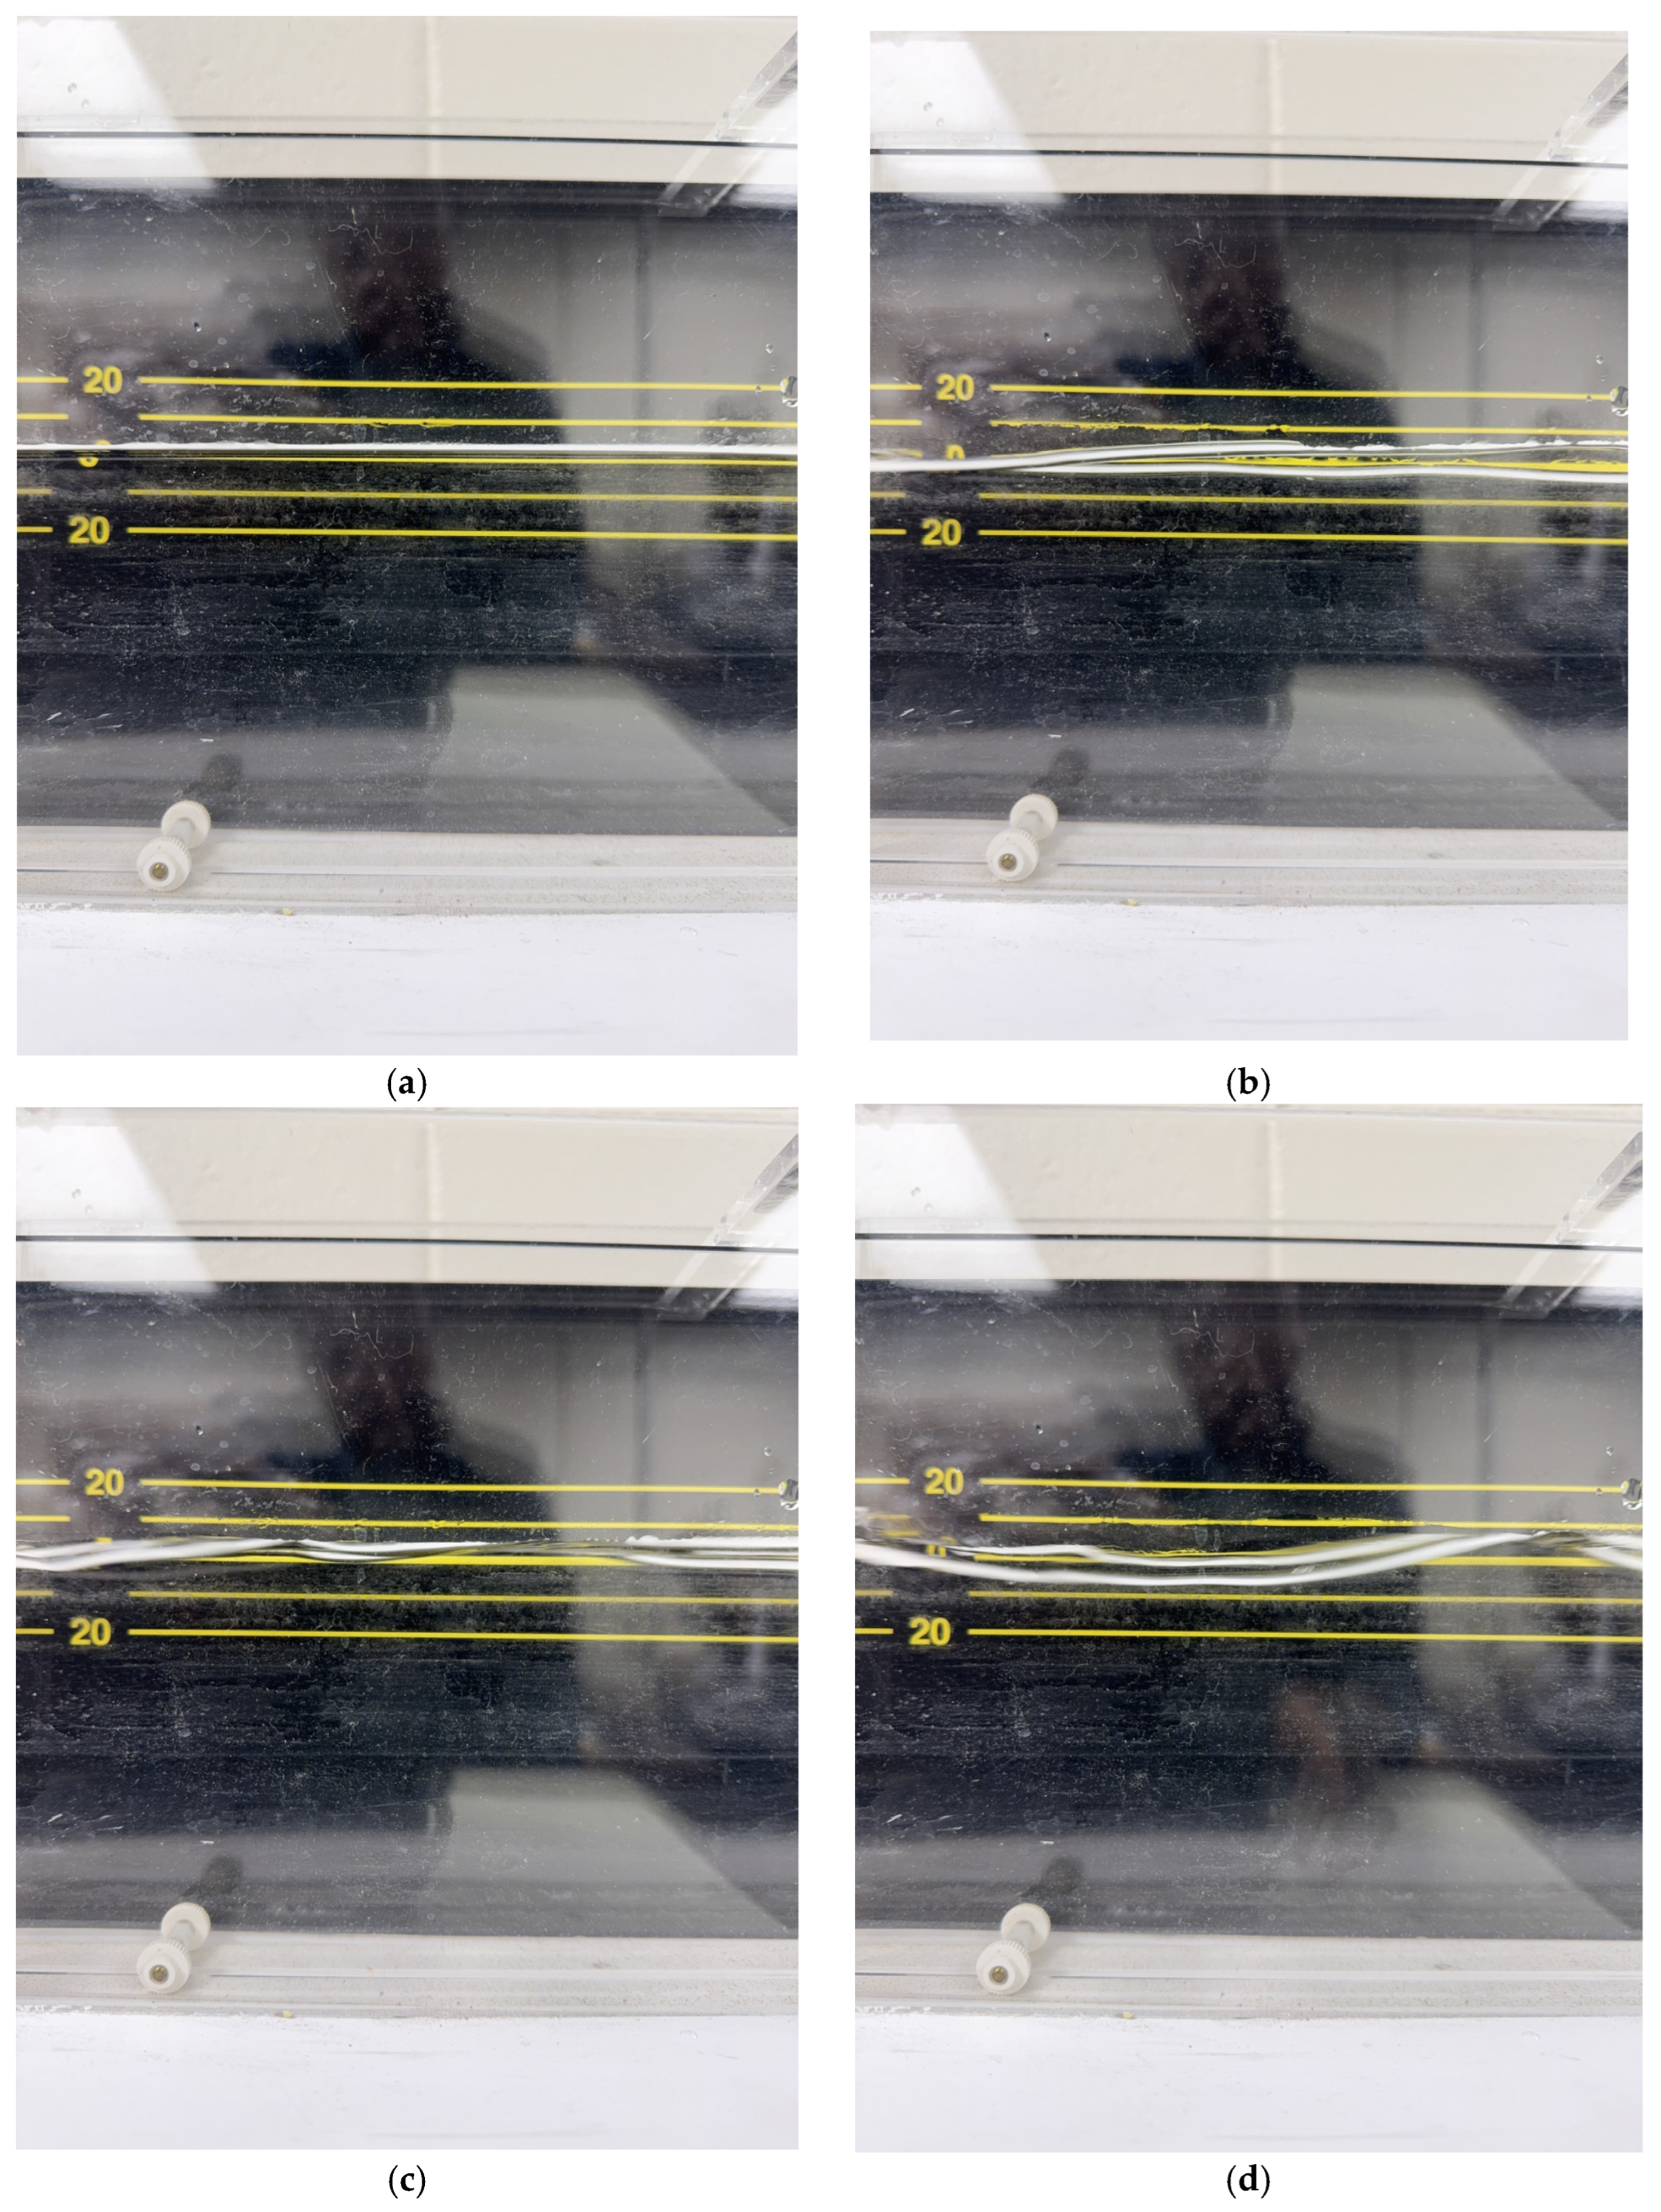
As already mentioned, the impact of the four different wave signatures and their impact on the voltage output of the oscillating water column are the subject of investigation in this research. Therefore, the wave signature is recorded and used in the analysis of the voltage output, as shown in Figure 8. Figure 8 shows samples of the four wave signatures analyzed in this study, namely wave signatures A, B, C, and D, respectively.
It is important to mention here that the wave signature was recorded with a camera, and its features (crest and trough) were measured and analyzed at relatively small time-steps of 3 s during the data post-processing phase. The features of the wave signature, crest and trough, were recorded at a location half-length of the wave channel, about 0.75 cm downstream of the plunger-type wave maker. The location was chosen such that it gives enough length to the wave to be fully developed and also not to be altered by the plunger’s motion. Therefore, the location was chosen to be not in close proximity to the wave maker. At the same time, the location was chosen to be away from the OWC such that the reflective waves generated by the wave–structure interactions would not alter the incoming wave. Potential measurement error may exist and is mainly due to the human recording/reading error. However, extensive uncertainty research studies have shown that if the same OWC model test were carried out in multiple similar wave experimental setups, the results would not be consistent, and currently, the wave energy field lacks a definitive answer [67]. Samples of four different wave signatures are presented in Figure 8. It is worth mentioning here that the four wave signatures exhibit different characteristics (amplitudes), as shown in Figure 8.
The four different kinds of wave signatures were obtained based on the voltage input of the electric motor. It is worth mentioning here that the motor speed is controlled by the voltage input. Thus, higher voltage input causes higher motor speed and, thus, higher frequency and larger plunger strokes. The four different strokes are generated by the different displacements of the plunger, as shown in Figure 3. Thus, higher plunger displacement causes the generation of waves of higher amplitudes. The initial conditions are characterized by a zero-voltage input. Based on the amplitude of the desired wave, the voltage input of the wave maker can be set to any value in the range of 1–10 (V). Once the voltage-input value was decided, the DC power supply was turned on, and an up/down plunger displacement was obtained, generating the waves. Also, it is worth mentioning here that SWL is set at a zero value, such that it is easier to post-process and analyze the recorded wave data. The experiments were run for 120 s. Three different trials were performed for each test case for the four wave signatures. The collected data was averaged for the three different trials. The wave characteristics were video-recorded, and the data was further post-processed for a time-dependent representation of the wave characteristics.

4. Results

In the following section, the results of the study are presented. The results of the present research are structured in two parts, as follows. In the first part, the results concerning the analysis of the wave signature are presented. The second part of the results section concerns the impact of the incident wave on the voltage output of the oscillating water column.

4.1. Analysis of Wave Signature

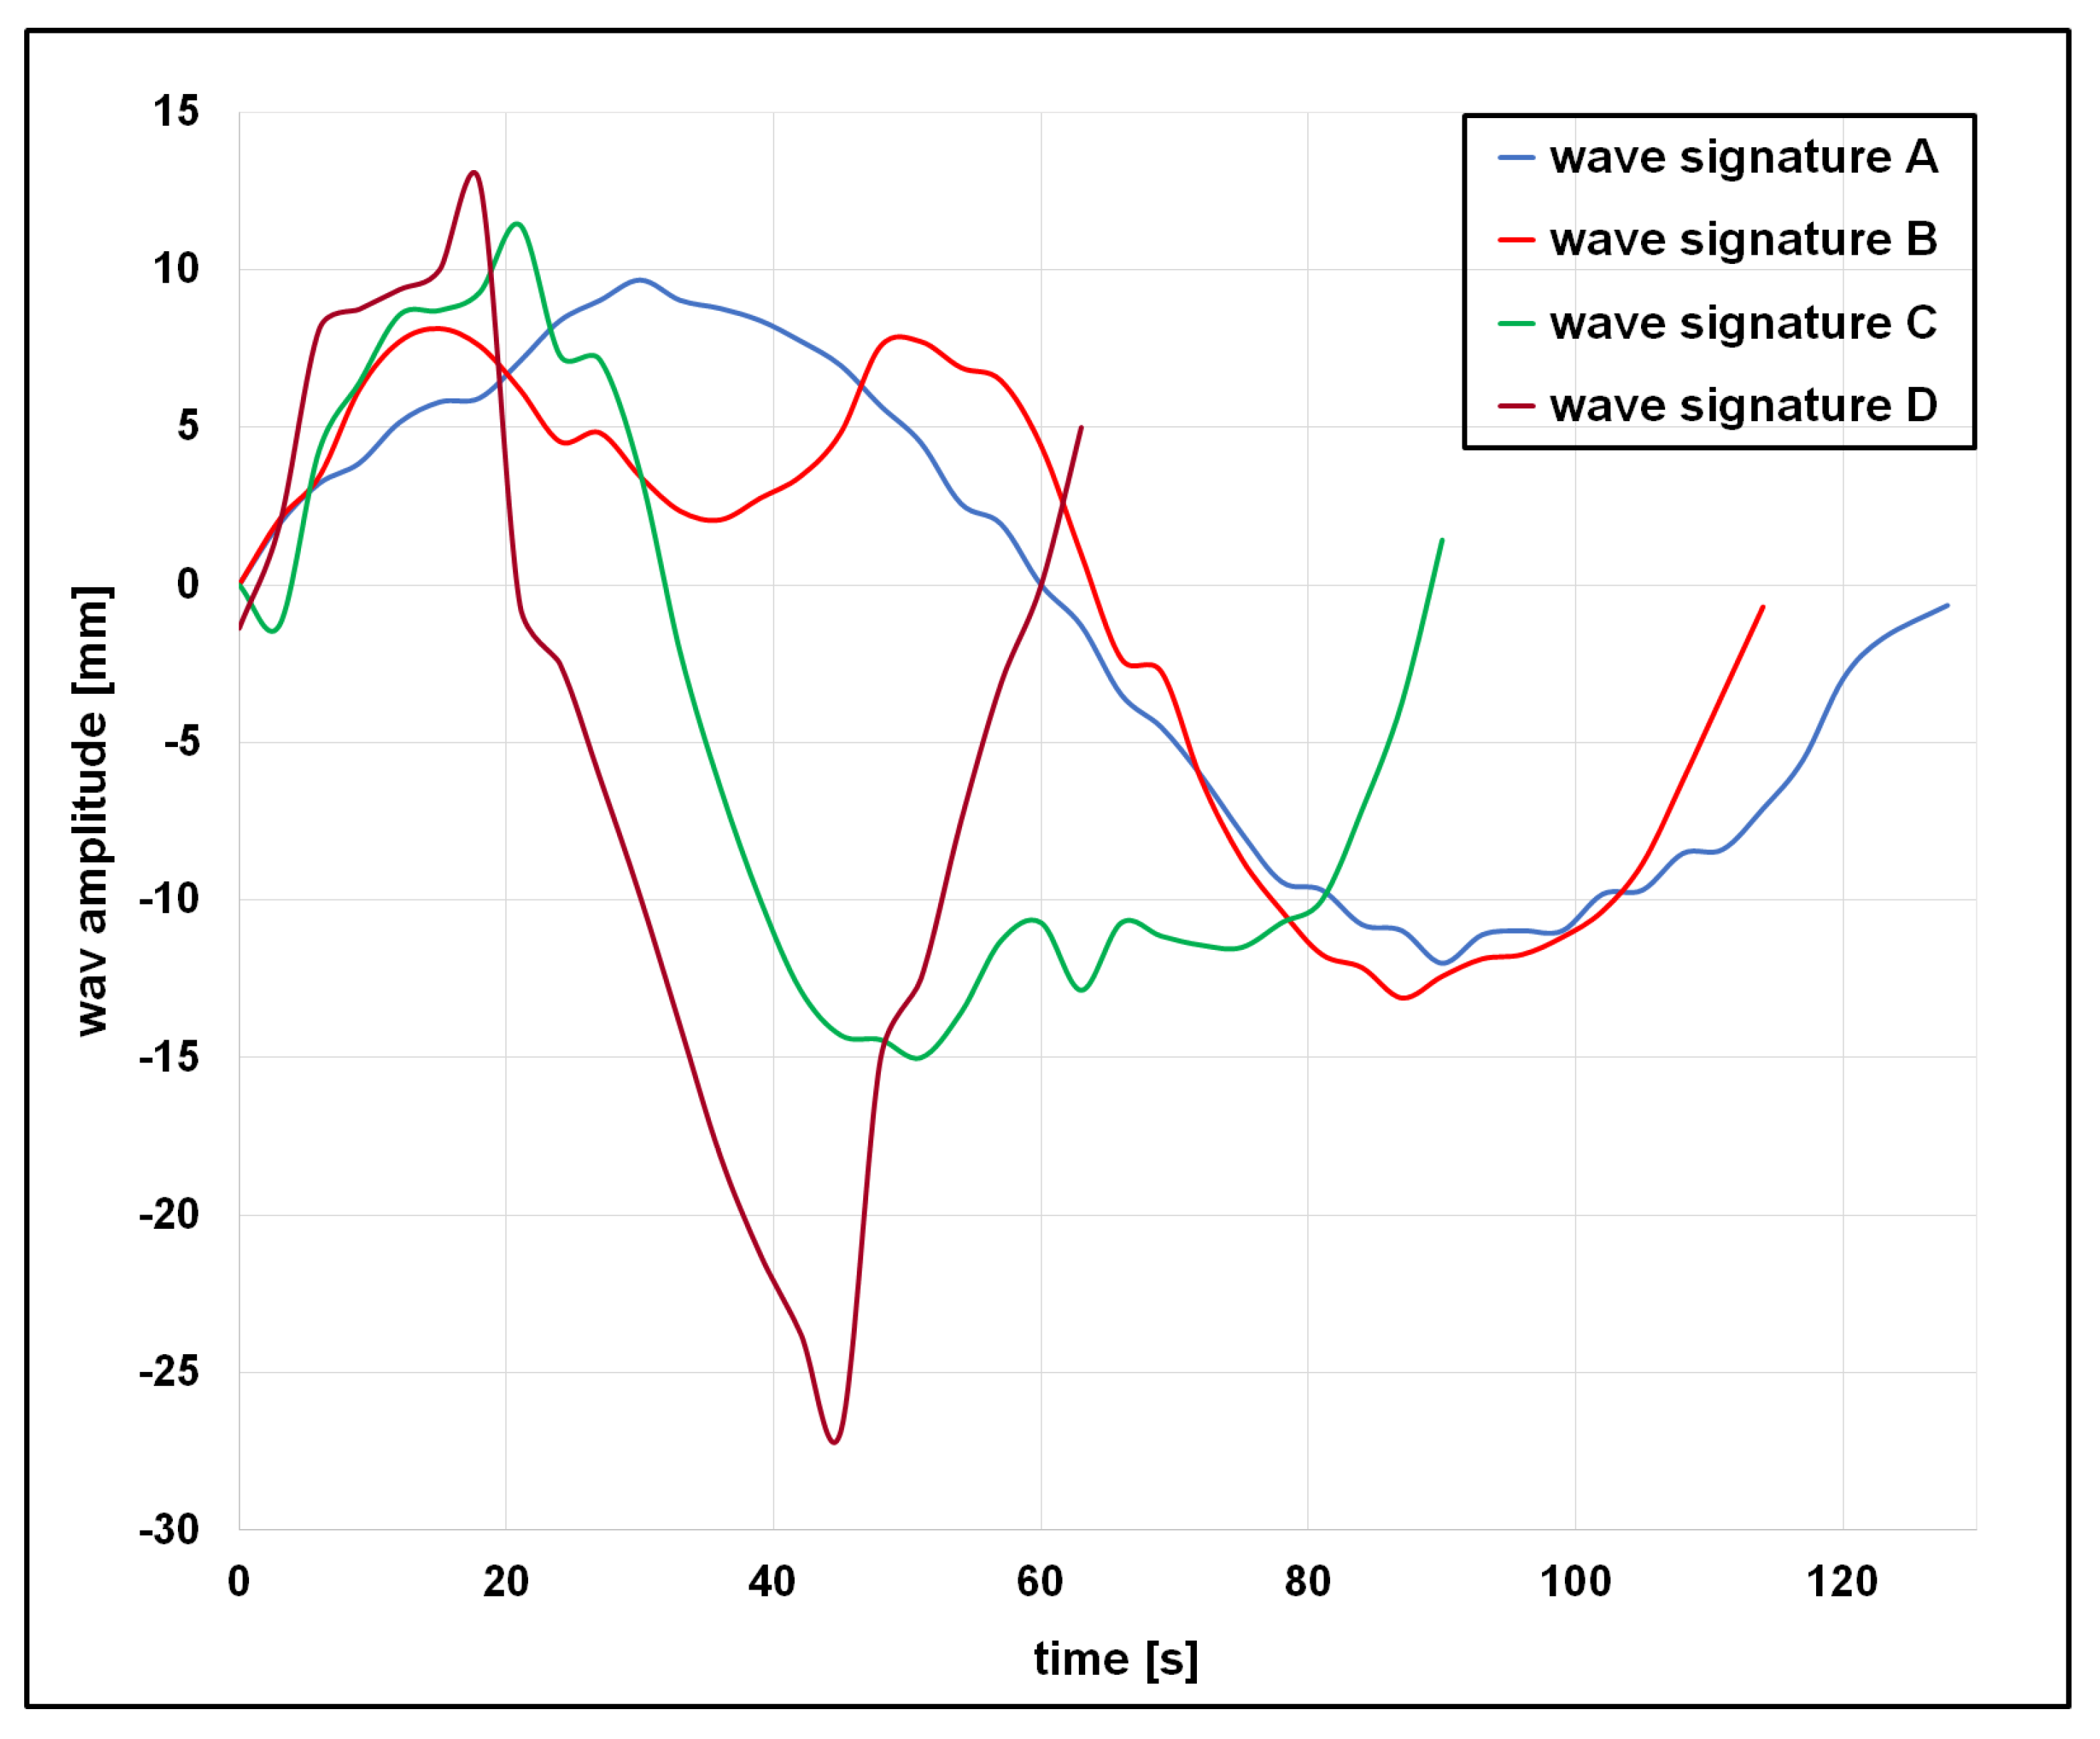
In the following section, the characteristics of four different wave signatures, namely, A, B, C, and D, are analyzed. The hypothesis of this research is that the wave signature impacts the OWC voltage output. It is worth mentioning here that tracking the crest and trough of the wave is challenging, and therefore, we present a relatively short time range of the wave characteristics. Figure 9 presents a comparison of the characteristics of the four different wave signatures, namely, A, B, C, and D, respectively. The comparison emphasizes the fact that the four wave signatures exhibit wave crests and troughs of different amplitudes and slopes, and it is expected that these wave characteristics will impact the efficiency of the oscillating water column, and thus the OWC voltage output.
The analysis of wave signature A reveals that it exhibits a relatively symmetric behavior, as shown in Figure 9. The analysis also reveals that wave signature A exhibits a laminar-like flow behavior, in the sense that the wave’s crest and trough present symmetry relative to the still water level (SWL) zero-level. Moreover, the study reveals that the fluctuations in the wave signature A are also insignificant, and thus, it is expected that the wave fluctuations would have a minimum impact on the OWC voltage output. However, the study shows that the wave signature B exhibits higher wave amplitudes due to the higher hydrostatic pressure exerted upon the water column by the wave-maker, and thus, a more nonlinear behavior of the wave signature is observed. The analysis of the wave signature, in Figure 9, shows the highly nonlinear behavior of the wave signature, and it is expected that this nonlinear behavior of the wave signature to be reflected in the voltage output of the lab-scale oscillating water column.
The comparison of the wave signatures A and B shows that there is an increase in the wave’s amplitudes and frequency. Thus, the trough of the wave signature B reaches a larger amplitude of about h = −13 mm compared with an amplitude of about h = −12 mm for wave signature A. The study also shows that the wave signatures exhibit different wavelengths and frequencies, and this is well-illustrated by the comparison of the wave signatures A and B at the time-instants in the range of 0–36 s.
The analysis of wave signatures A and B also shows the presence of fluctuations in the wave crest. Another important characteristic of the wave signature is the fact that the trough of the wave occurs at an earlier instant in time for wave signature B compared with wave signature A. Therefore, the analysis shows that for wave signature A, the trough is encountered at instant t = 90 s, while for wave signature B, the trough is encountered at instant t = 51 s. Besides this, the wave crest is also encountered at earlier instants in time for wave signature B compared with wave signature A. Therefore, for wave signature A, the first crest is encountered at instant t = 30 s, while for wave signature B, the first crest is encountered at instant t = 9 s. These early shifts in the occurrences of the wave crest and trough are caused by the increased hydrostatic force acting on the water column inside the wave tank. The first crest is generated at an early instant in time due to the higher hydrodynamic force, compared with the wave signature A. Also, due to the higher hydrostatic force, the first crest is not subject to quick dissipation and thus, it is followed by a second crest of similar amplitude. This train of wave crests generates a high resistance hydrostatic force, and thus, the incoming wave’s trough exhibits a higher amplitude of about −14 mm for wave signature C. Thus, the trough amplitude is −12 mm for wave signature A, while for wave signature B, the trough amplitude is −13.1 mm. Thus, it is expected that this overrun of the wave motion would augment the nonlinear behavior of the incident wave, and thus, it will impact the voltage output.
A similar trend of the wave signature was further observed for wave signatures C and D. Therefore, the analysis of the wave signature C shows that the trough of the incident wave is encountered at an even earlier instant of time t = 27 s compared with instant t = 51 s for wave signature B. However, it is worth mentioning here that the wave’s crests exhibit different behaviors in the sense that due to the nonlinear nature of the wave, the wave crest is encountered at an earlier instant of time for wave signature B when compared with wave signature C. Thus, the first wave crest is encountered at instant t = 9 s for wave signature B, while for wave signature C, it is encountered at instant t = 10.5 s. This is shown by the analysis of the wave signatures in Figure 9.
It is worth mentioning here that the wave signatures are dominated by turbulence through the increase in the hydrostatic force exerted on the water column, and thus, a nonlinear behavior of the wave crest is observed.
The study shows that wave signature C exhibits a higher amplitude of the wave crest when compared with wave signature B. Therefore, the comparison of the amplitudes of the first crest for wave signatures B and C shows that the wave amplitude reaches a maximum of about 11.5 mm for wave signature C, while for wave signature B, the amplitude reaches a maximum of about 8.13 mm. Wave signature C also exhibits an increase in the amplitude of the trough. Therefore, the comparison of the wave signatures B and C shows that the trough reaches an amplitude of about h = −13 mm for wave signature B, while for wave signature C, the trough reaches an amplitude of h = −15 mm. A deeper analysis of the wave signature also shows that there are significant differences in the trough behavior for wave signatures B and C. Thus, the analysis reveals that for wave signature C, the trough exhibits a more nonlinear behavior that is characterized by larger amplitude fluctuations compared with the wave trough for wave signature B. The analysis shows that wave signature D exhibits even higher amplitudes. Therefore, for wave signature D, the wave’s trough exhibits a larger amplitude of about h = −27 mm. The wave crest also exhibits a larger amplitude of about h = 12.7 5 mm, which is higher than the 11.5 mm for wave signature C.
The analysis of wave signature D reveals the presence of two adjacent wave crests, the first at instant t = 0.075 s and the second at instant t = 0.15 s. As observed in the case of wave signature B, due to the high hydrostatic force on the water column, the first wave crest does not dissipate, and thus it augments the amplitude of the second wave crest through the hydrostatic resistance force exerted on it. The analysis of the wave signature also reveals that the trough exhibits strong convexity defined by deep slopes, as shown in Figure 9.
Overall, the analysis also shows that for the case of wave signatures A and B, the wave troughs exhibit very similar trends, and thus similar convexities. However, steeper convexities are observed for wave signature B, and thus the wave trough exhibits steeper slopes than the wave trough of wave signature A. Similarly, wave signatures C and D exhibit troughs of even larger convexities, and thus troughs of steeper slopes. This is well-illustrated by the comparison of the wave signatures C and D. Therefore, the wave signature D exhibits the steepest convex trough, as shown in Figure 9.
A summary of this result is also presented in Table 1.
In this study, three different measurements were performed for each wave signature. The data was obtained using the equipment described in Section 2. The analysis shows that the wave signatures exhibit a nonlinear behavior, and thus, it is expected that the OWC voltage output would also exhibit a nonlinear behavior. Overall, the incident waves are characterized by asymmetric maximum and minimum amplitudes corresponding to the wave’s crest and trough. Thus, it is expected that the nonlinear characteristics of the incident waves will cause a nonlinear voltage output. Moreover, there is a time delay (phase-lag) between the compressed air inside the chamber of OWC and the pressure exerted on the piezoelectric. This was also observed in previous studies and indicated that this time delay should be used in assessing the power output efficiency of the OWC [7,8,9,10]. It is worth mentioning here that there are two main factors that affect the OWC efficiency, namely, the air nonlinear damping forces and the nonlinear damping force of the power take-off, respectively. These two damping forces cause a nonlinear response of the wave elevation inside the chamber of the OWC.
This study reveals that each wave signature exhibits different wave periods, as shown in Table 2. The analysis also shows that the increase in the amplitude and hydrodynamic forces of the wave causes decay in the wave period, and thus, it results in steeper waves, as reflected in the wave steepness data shown in Table 3.
As already mentioned, the wave signature is also reflected in the wave steepness, as shown in Table 3.
It is worth mentioning here that the wave steepness is a good indicator of the wave’s nonlinear features [68,69]. There are a couple of qualitative and quantitative identifiers of wave nonlinearity [20,68,69]. The literature shows that generally, shallow waters are dominated by steep waves and thus, the waves exhibit a nonlinear behavior [68,69]. Moreover, studies showed that nonlinearity is an intrinsic feature of wave dynamics in small-scale laboratory experiments [20,68,69]. The analysis of the wave’s features in the present research also shows the nonlinear nature of the waves by analyzing the wave profile and steepness. Thus, a sharper shape of the wave crest and flatter trough indicates nonlinear behavior of the wave [68,69]. As the wave steepness increases, the assumptions of linear wave theory break down, and nonlinear effects become dominant. The analysis of the wave steepness shows that all four wave signatures exhibit high steepness, as shown in Table 3, and thus nonlinear wave behavior can be identified. Besides this, as the water surface oscillates inside the chamber, it compresses and expands the air above it, and this was also observed in research studies [70]. The pressure–volume relationship of air follows a nonlinear equation, and it is usually modeled as an isentropic process p V γ = c o n s t a n t , where p is the air pressure, V is the air volume, and ϒ is the specific heat ratio (1.4 for air). The wave–wave interaction is also a nonlinear phenomenon [68,69]. The water column moves in response to incoming waves, which are themselves nonlinear, especially in intermediate or shallow water depths [68,69]. The free surface motion and wave forcing also introduce nonlinearities in the hydrodynamic behavior of the water column, and this was also observed in research studies of OWC [70]. Studies also showed a nonlinear induced hydro-aerodynamic response [70]. Moreover, the voltage output also shows nonlinear behavior as a result of the combined nonlinear processes mentioned above.
The wave power density for a realistic-sized OWC depends on its location [56,58,64]. Therefore, for good geographical locations in Europe, Australia, or Chile, the wave power density is about 24.5 kW/m [67]. The typical sizes of an OWC include a length (inclined face) of 10–25 m, width (wave-facing) of 5–20 m, height (vertical) of 5–15 m, and inclination of 30–60° [67]. However, the literature review revealed that the typical size of OWC used in laboratory experiments is in the range of 0.8 m × 0.5 m × 0.25 m [71,72], 0.18 m × 0.283 m × 0.54 m [73], 0.6 m × 0.45 m × 0.9 m [74], and 0.286 m × 0.579 m × 1.2 m [75]. The literature review also revealed that the wave power density for small-scale laboratory experiments is in the range of 0.01–1 (W/m) depending on the wave characteristics [67]. The wave power densities of the four waves investigated in this research are presented in Table 4. The analysis shows that the values of the wave power density are in the range reported in the literature [38,39,47,48,51].
The wave power density was calculated based on the formula given in Equation (1):
P = ρ g 2 H 2 T 64 π
where ρ is water density, g is gravity, H is the significant wave height, and T is the peak period. The data analysis reveals the nonlinear behavior of the wave power density, which is an expected result, since it is well-known that the increase in wave steepness generates nonlinear behavior of the wave [68,69].

4.2. Analysis of the OWC Voltage Output

In the following section, an analysis of the OWC voltage output function of the wave signature is presented. Three different trials are conducted for each wave signature. Thus, in the following section, the measurements of OWC voltage output are presented for three different trials, as well as their averaged values, for wave signatures A, B, C, and D, respectively.
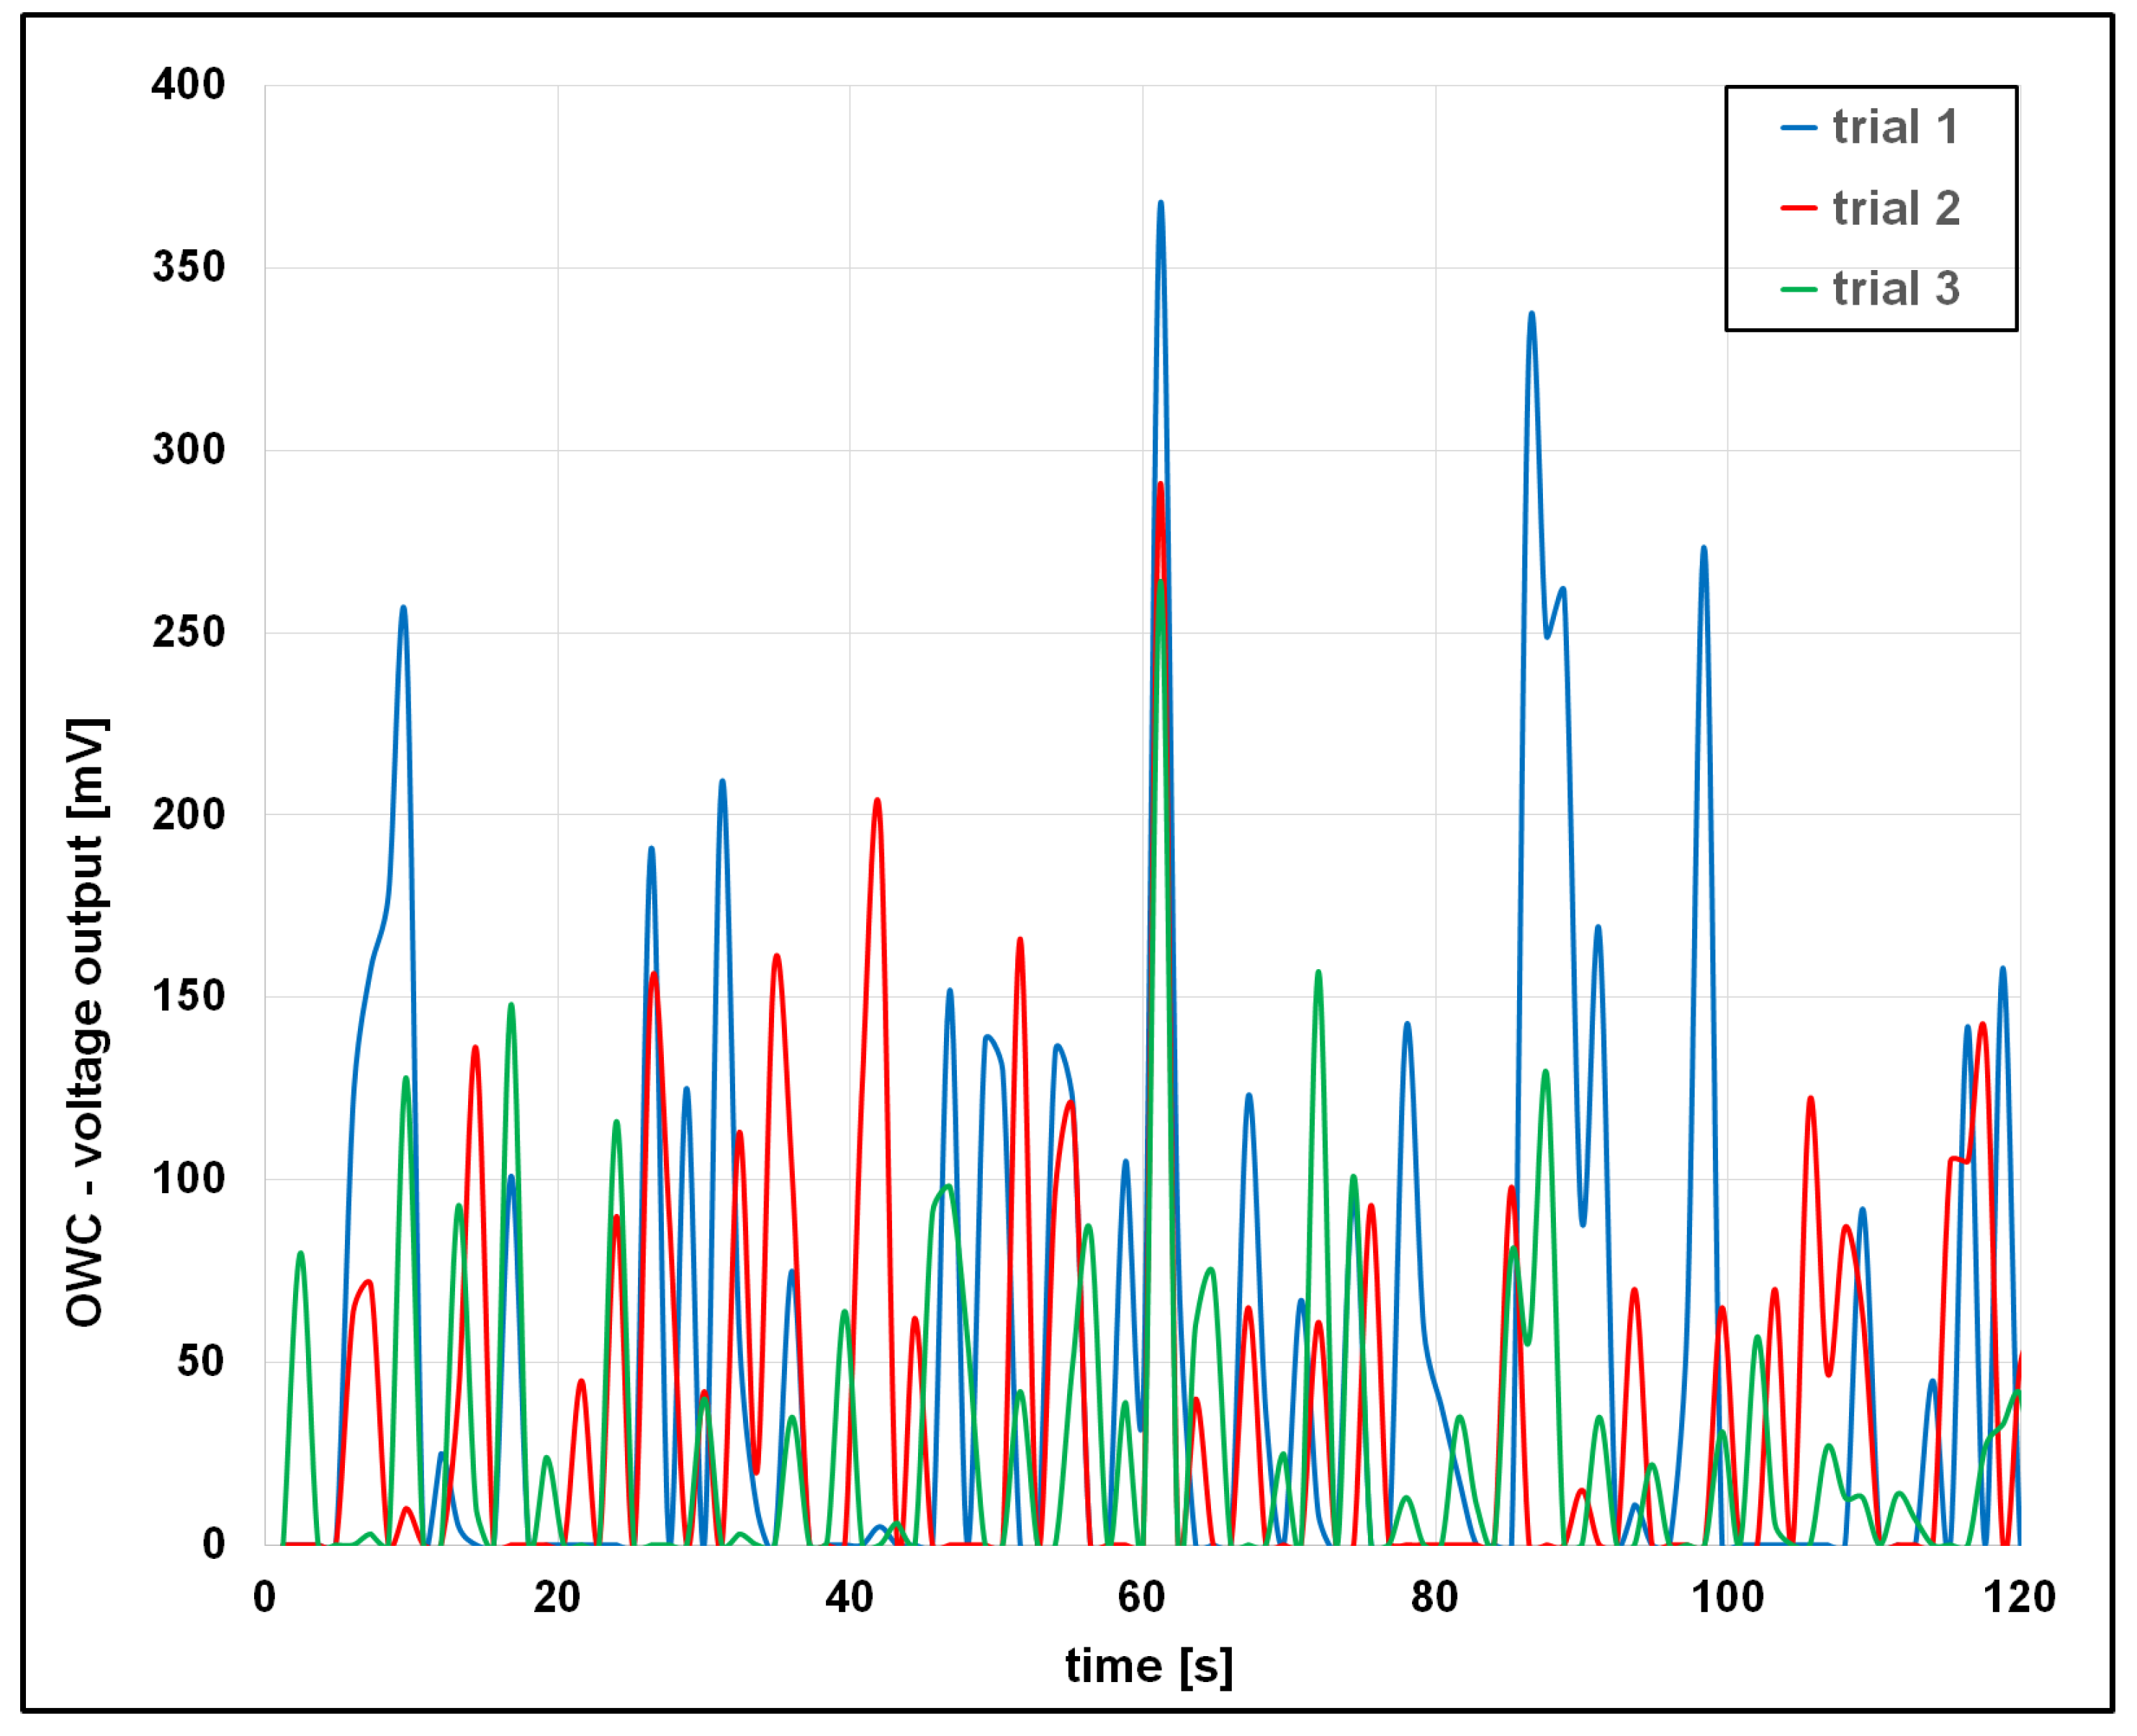
Therefore, Figure 10 presents a comparison of the voltage output for the three different trials for wave signature A. The comparison of the voltage output for the three trials reveals the nonlinear nature of the voltage output due to the nonlinear characteristics of the wave signature and air compressibility. The analysis of the OWC voltage output of trial 1 reveals the highly nonlinear behavior of the voltage output. The maximum voltage output in this case is measured to be 368 mV. It is worth mentioning here that the nonlinear behavior of the voltage output is due to the nonlinear behavior of the incident wave and the compressibility effects of the airflow inside the OWC chamber. Moreover, the nonlinear behavior of the airflow inside the OWC chamber acts like a nonlinear damping force on the free surface of the incident wave inside the chamber, and thus, they compete against each other. The nonlinear interaction between the water column and compressible air inside the OWC chamber causes a further highly complex nonlinear behavior of the voltage output.
The pressure drop caused by the airflow inside the OWC chamber impacts the motion of the water column inside the OWC chamber, which further impacts the hydrodynamic energy conversion efficiency. It is worth mentioning here that the interactions between incident waves and the OWC structure are also highly nonlinear. Usually, the interaction between the incident waves and the front wall of the OWC causes wave breakage and large slamming loads. Besides the nonlinear nature of the incident waves, their interaction with the OWC structure generates vortices of different strengths and magnitudes, which also affect the hydrodynamic efficiency of the OWC and thus affect the voltage output. It is worth mentioning here that the interaction between the incident wave and the OWC structure is governed by complex fluid dynamics mechanisms such as turbulence and air entrainment.
The voltage output for trial 2 also exhibits a nonlinear behavior, while the maximum voltage output is 291 mV. A similar trend was observed for trial 3, where the maximum voltage output was measured to be 264 mV, as shown in Figure 10. It is worth mentioning here that the maximum OWC voltage output occurs at the same instant of time t = 61.2 s.
As shown in all three trials, the voltage out presents a nonlinear behavior, and this is due to the nonlinear characteristics of the wave signature, water column, and air compressibility inside the OWC chamber, respectively. Thus, the voltage output presents large oscillations before the maximum peak voltage is achieved. As already mentioned, these voltage output oscillations are due to the nonlinear nature of the wave signature, water column, and compressible air inside the OWC chamber. The maximum voltage output corresponds to the maximum air compressibility and its associated aerodynamic force inside the OWC chamber. Thus, as the water column moves up inside the OWC chamber, it generates a hydrodynamic force that compresses the airflow inside the OWC chamber, generating a high aerodynamic force exerted on the piezoelectric membrane, thus generating a voltage output. Therefore, the maximum compressibility corresponds to the maximum voltage output. As the column of water retreats and moves down, the air inside the OWC chamber is decompressed, and thus, a decrease in the voltage output is observed. As the column of water retreats and moves down, the air inside the OWC chamber is decompressed, and thus, there is a decay in the aerodynamic force, which is associated with a decrease in the voltage output, as shown in Figure 10. It is worth mentioning here that, besides the maximum voltage output, lower voltage outputs are generated during the compression and decompression of the air, as shown in Figure 10.
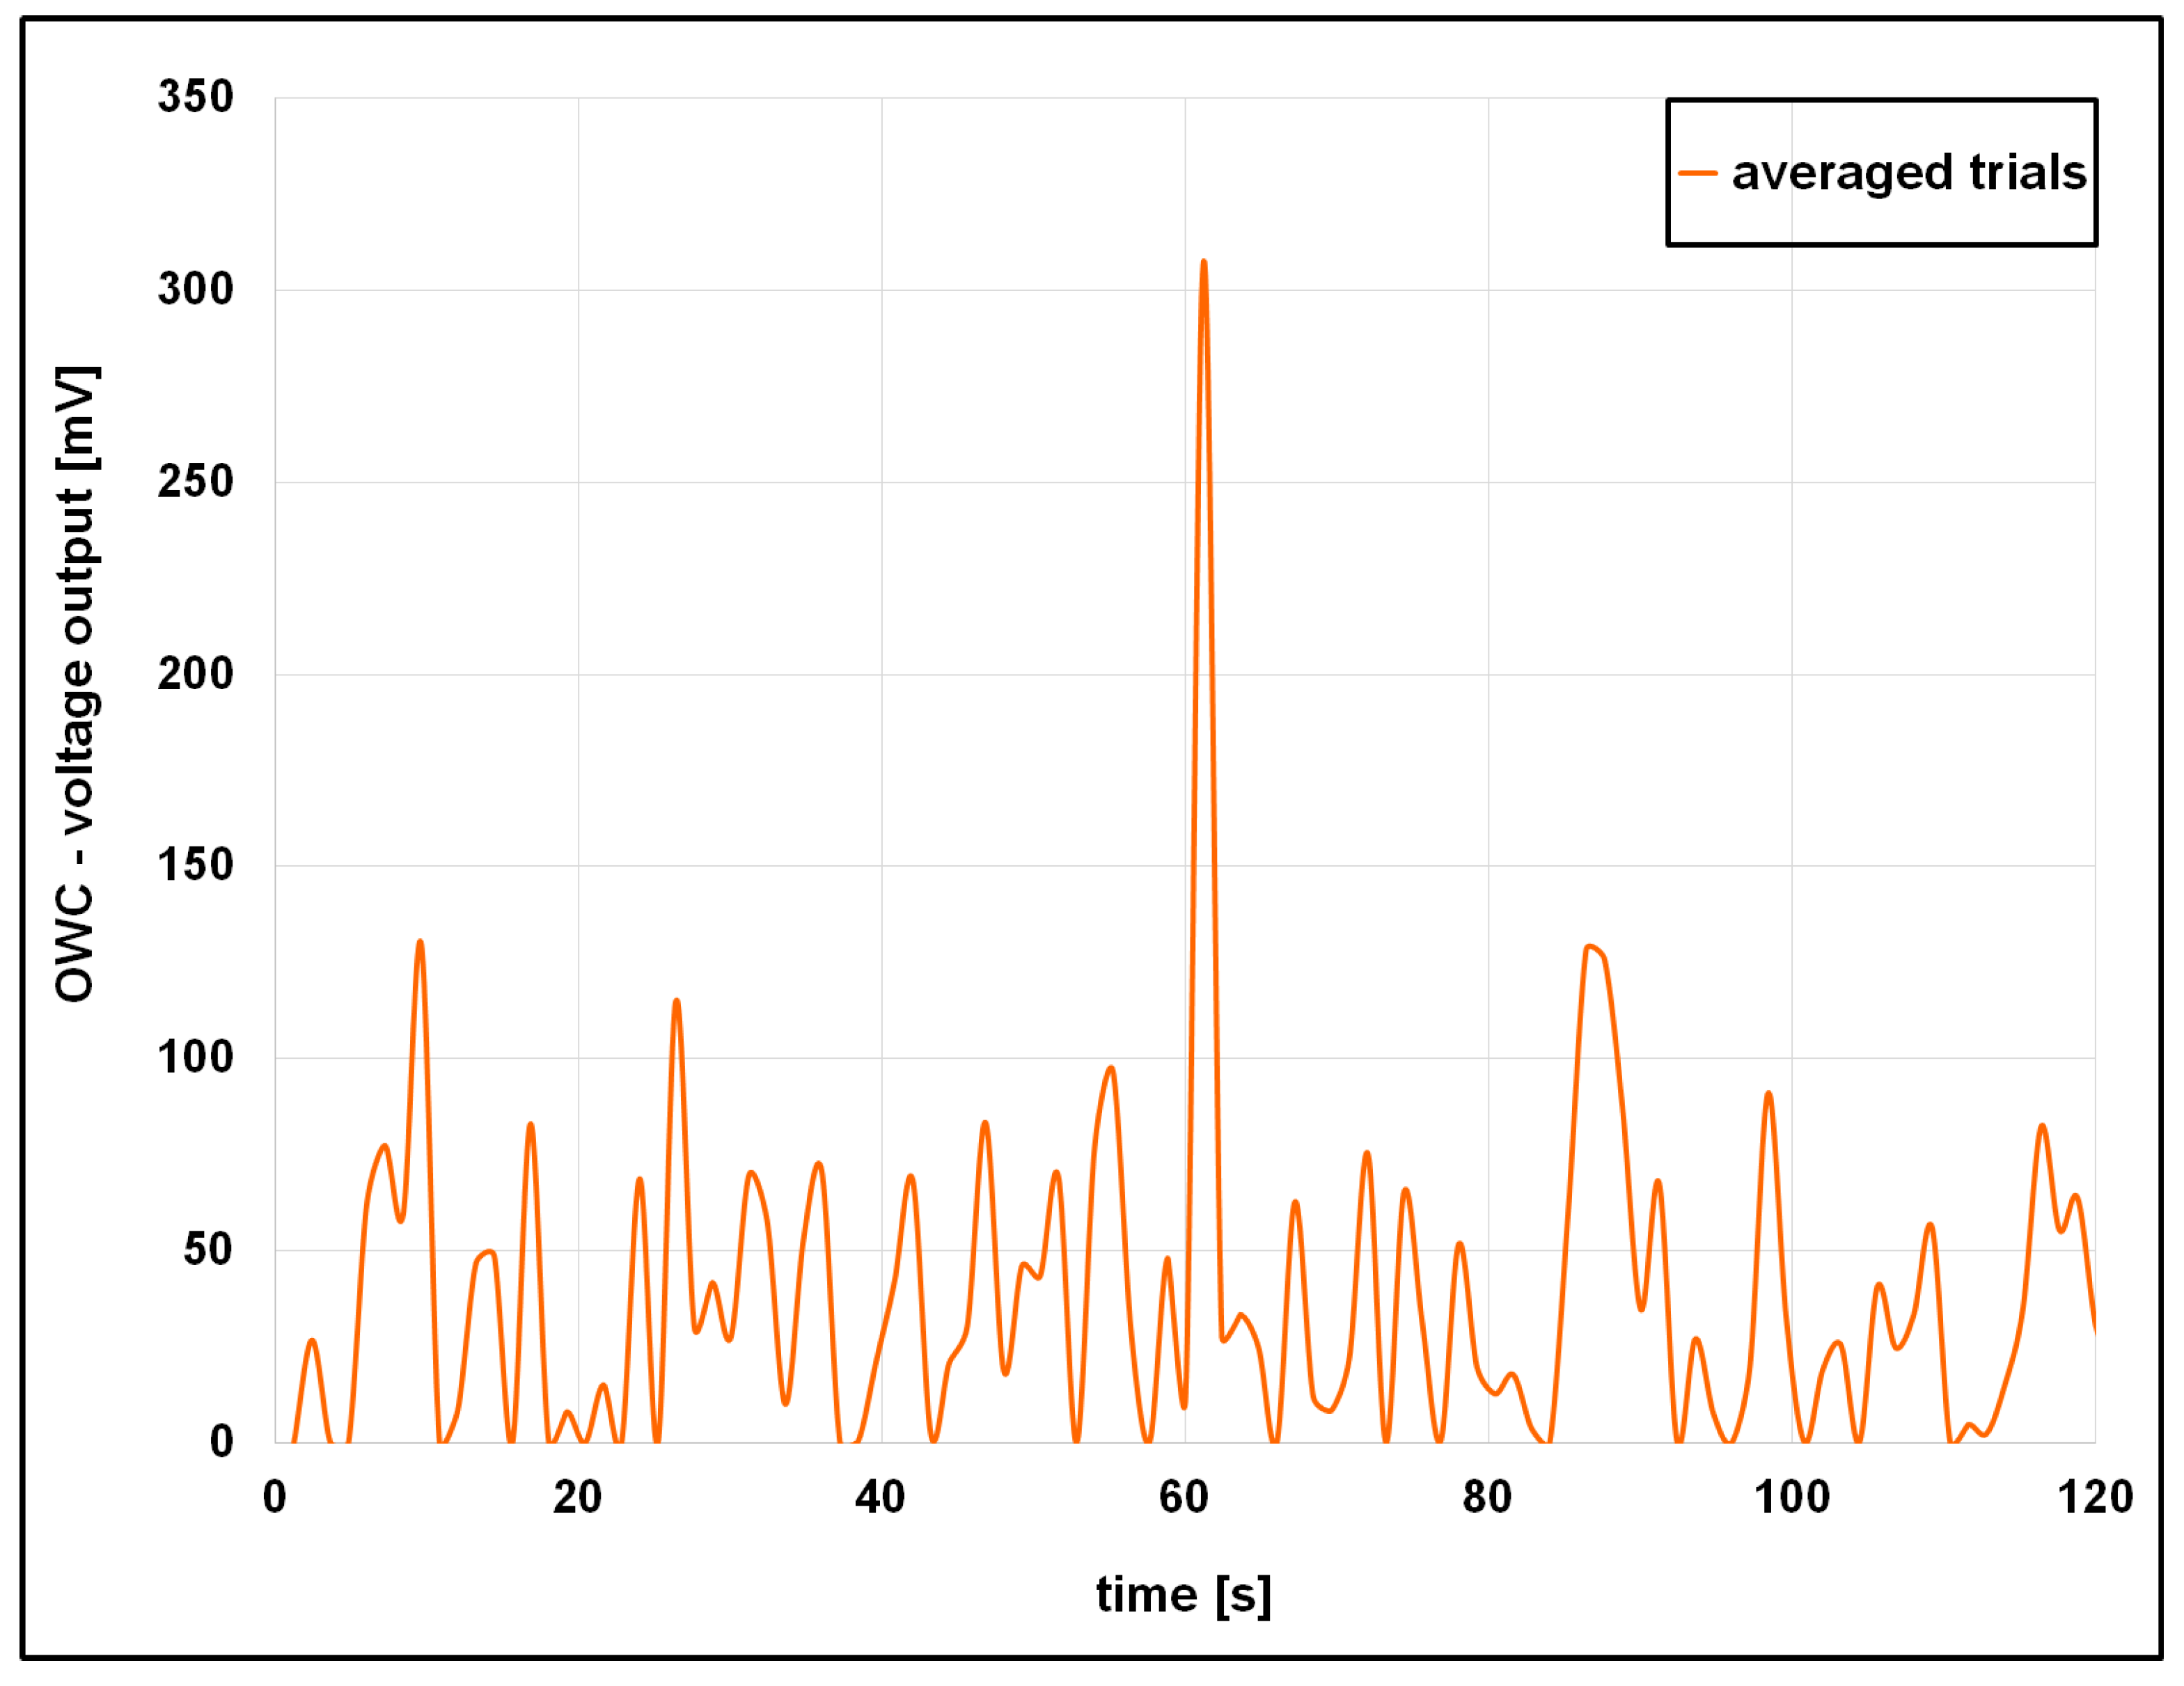
Figure 11 presents the averaged voltage output of the three trials for wave signature A. The analysis shows that the voltage output exhibits a maximum value of 308 mV at instant t = 61.2 s. The analysis of the averaged voltage output once again reveals the impact of the nonlinear nature of the air compressibility and wave signature on the voltage output, and thus, a nonlinear behavior of the hydrodynamic efficiency and voltage output. As mentioned above, the maximum voltage output is associated with the maximum air compressibility. However, the analysis reveals the presence of lower voltage outputs before and after the maximum voltage output, and these lower voltage outputs are due to the air compression and decompression phenomena that occur inside the OWC chamber. It is worth mentioning here that the first series of voltage outputs, before the maximum voltage output, is due to the upwards motion of the water column inside the OWC chamber, while the second series of voltage outputs, after the maximum voltage output, is due to the downwards motion of the water column inside the OWC chamber. The nonlinear nature of the wave signature and air compressibility, and their interaction, cause a highly nonlinear voltage output.
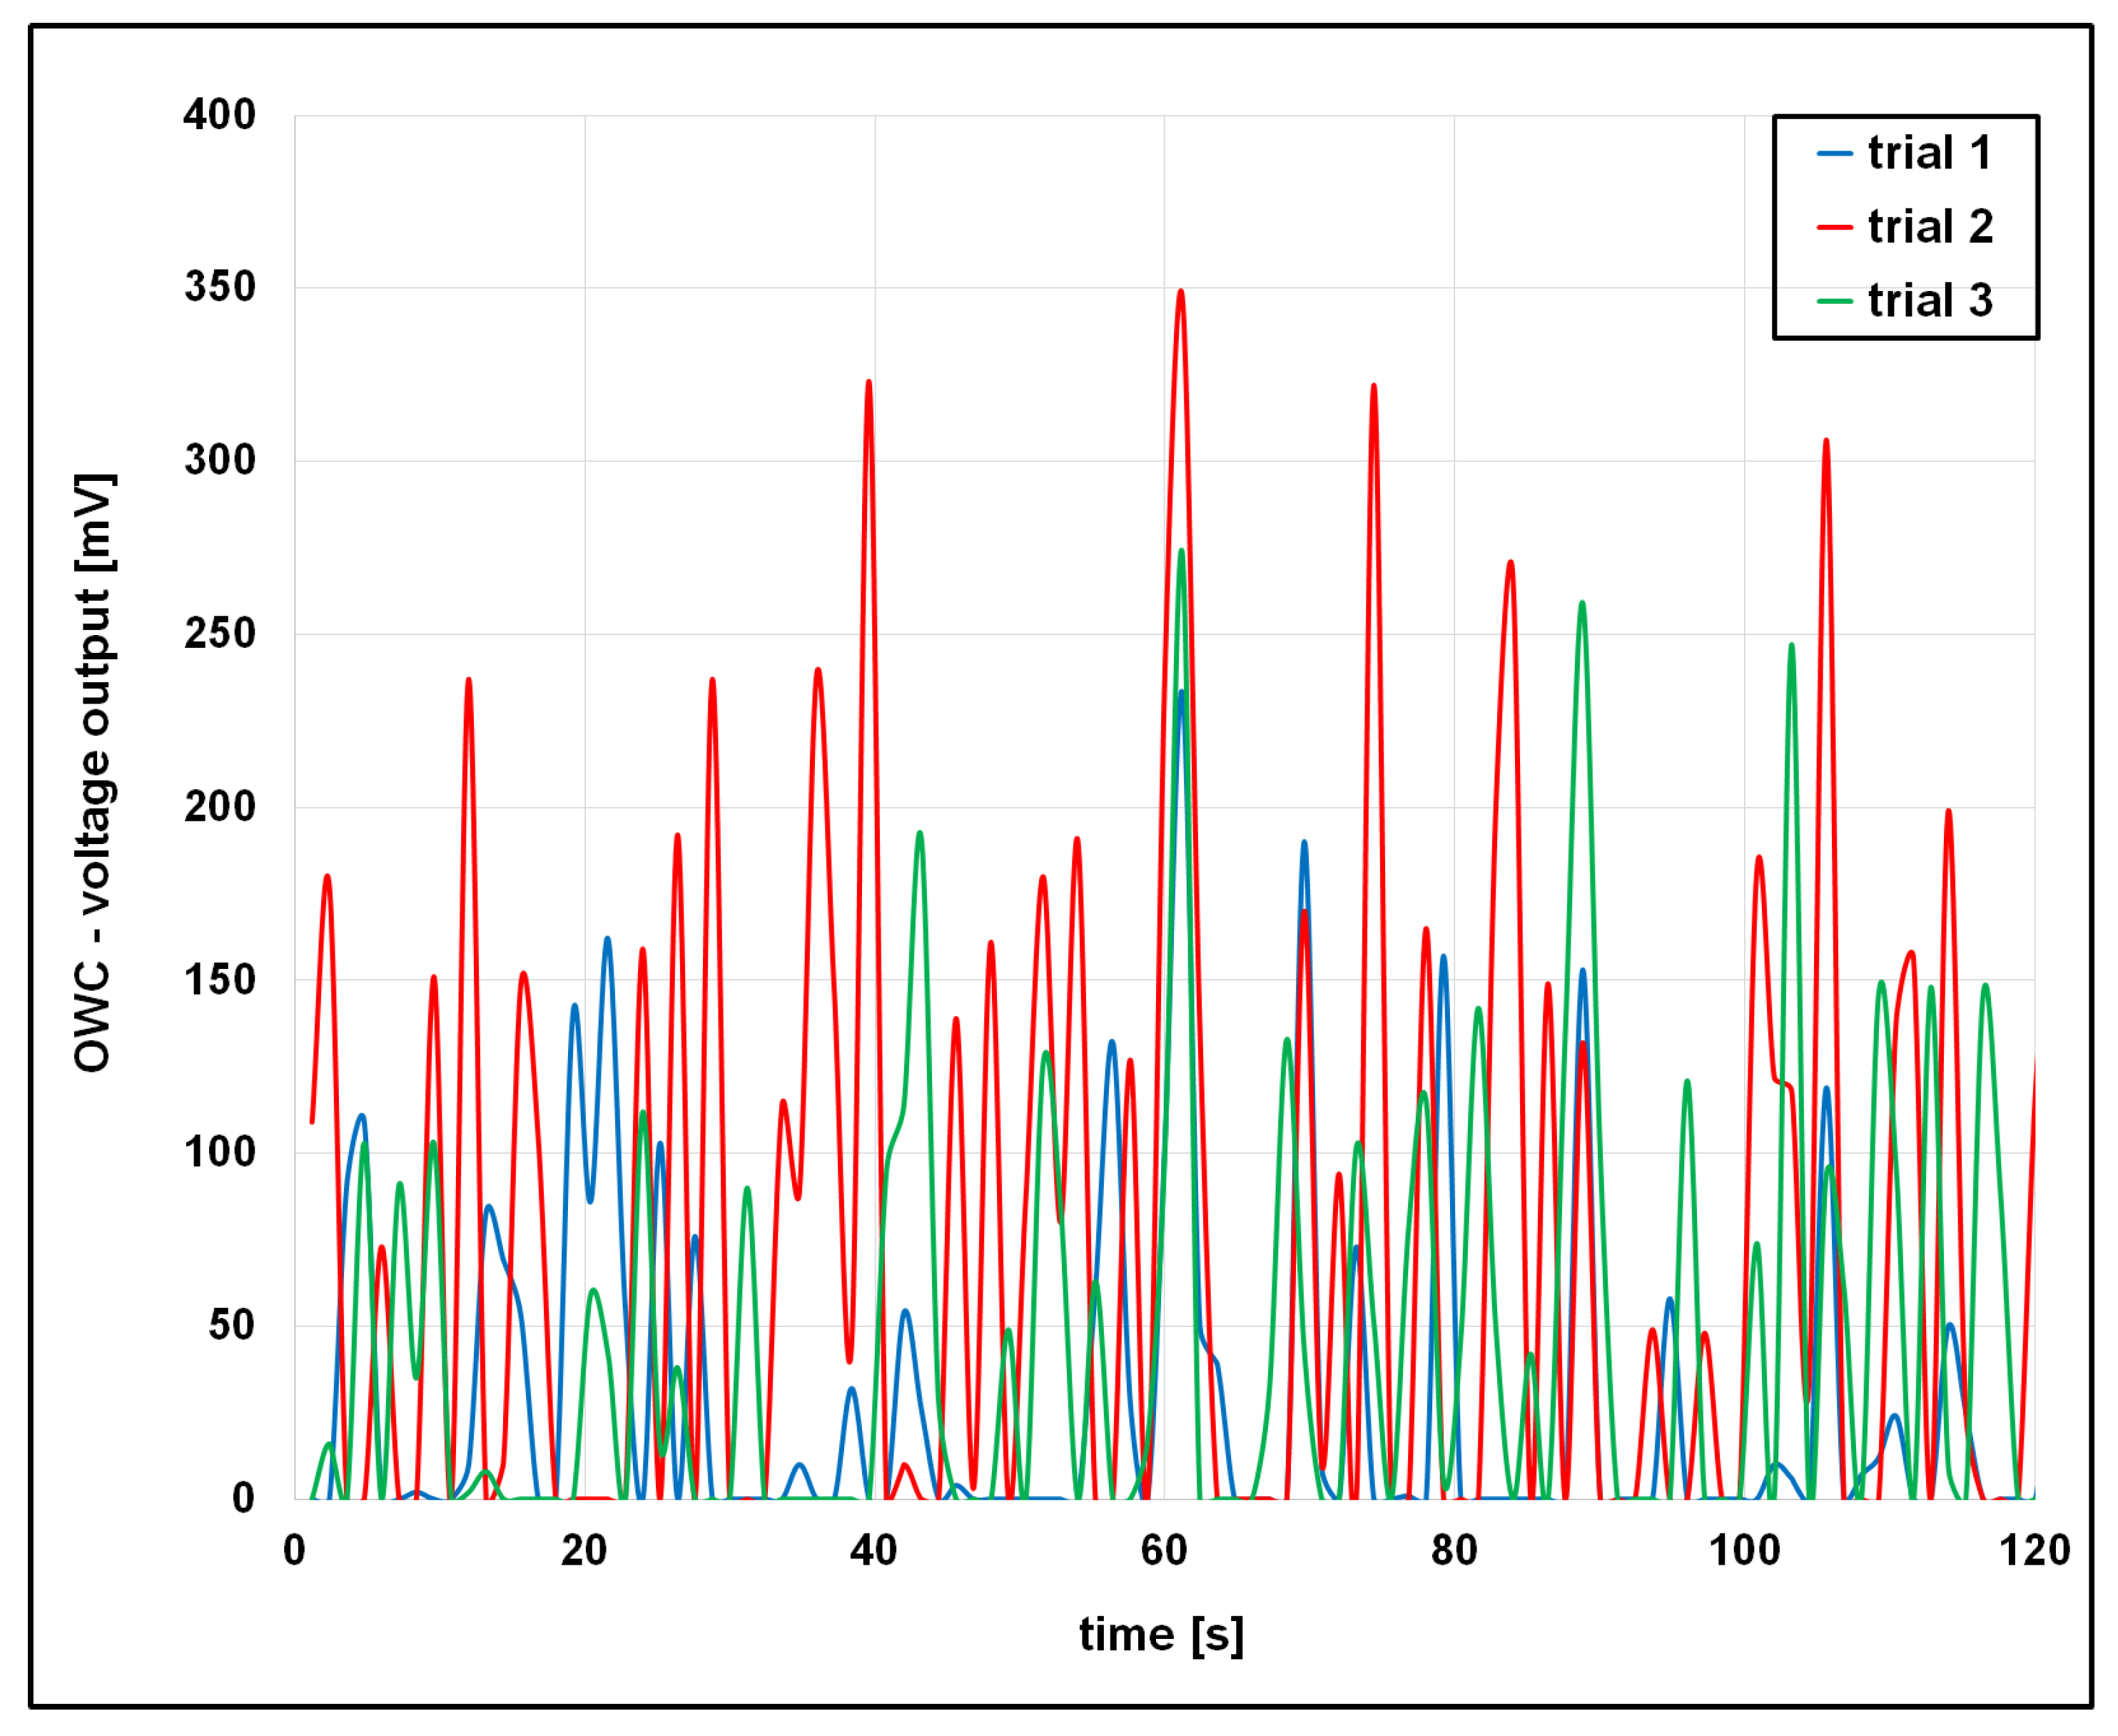
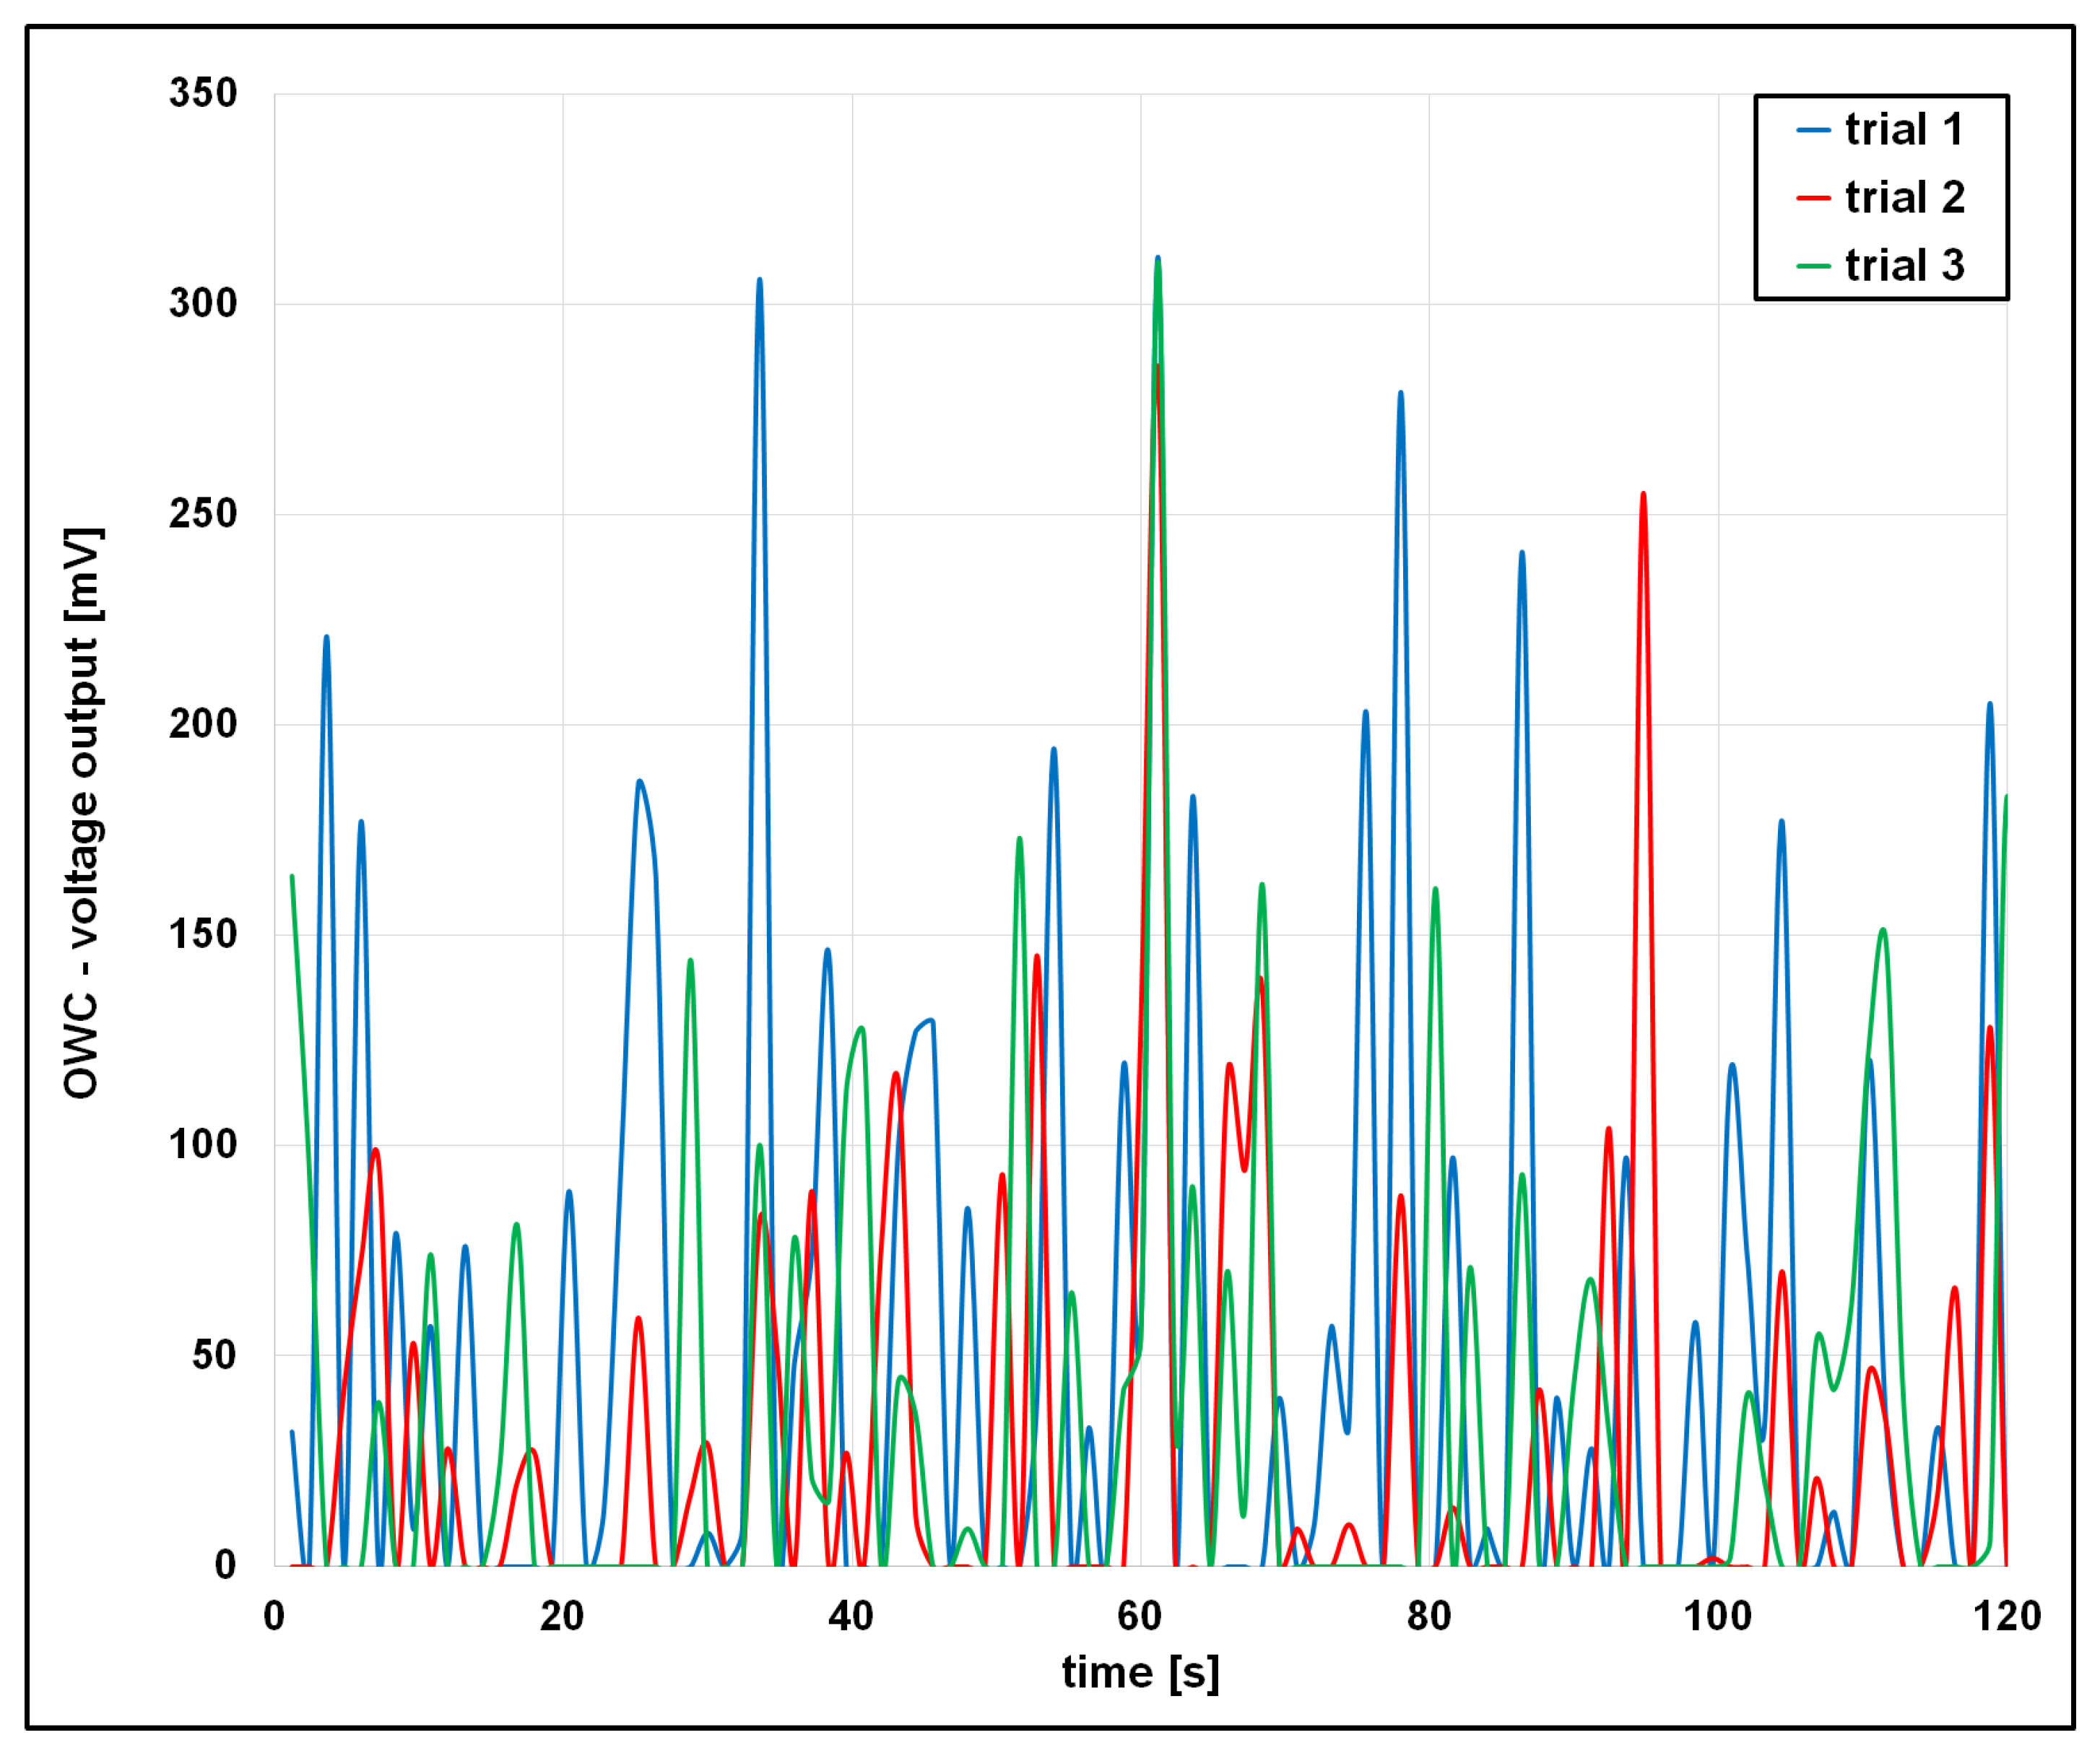
Figure 12 presents a comparison of the voltage output for three different trials, for wave signature B. The analysis shows that the voltage output reaches a maximum at instant t = 61.2 s for all trials. However, the magnitude of the peaks varies from trial to trial due to the nonlinear nature of the wave, compressible air, and their interaction, and this is detailed in the following section. The analysis shows that the voltage output for trial 1, for wave signature B, also exhibits a nonlinear behavior similar to the voltage output observed for wave signature A. The maximum voltage output for trial 1 of 233 mV is also achieved at instant t = 61.2 s. It is worth mentioning here that the maximum voltage output is lower than the corresponding value for wave signature A. This is also a result of the nonlinear behavior of the incident wave, water column, and airflow inside the OWC chamber.
Similar nonlinear behavior was observed for the other two trials, and thus, trial 2 exhibits a maximum voltage output of 347 mV, while for trial 3, a maximum voltage output of 273 mV was observed, as shown in Figure 12, respectively. It is worth mentioning here that for all trials, the maximum voltage output is encountered at the same instant of time t = 61.2 s. The instant of t = 61.2 s corresponds to the moment when the maximum air compressibility is achieved.
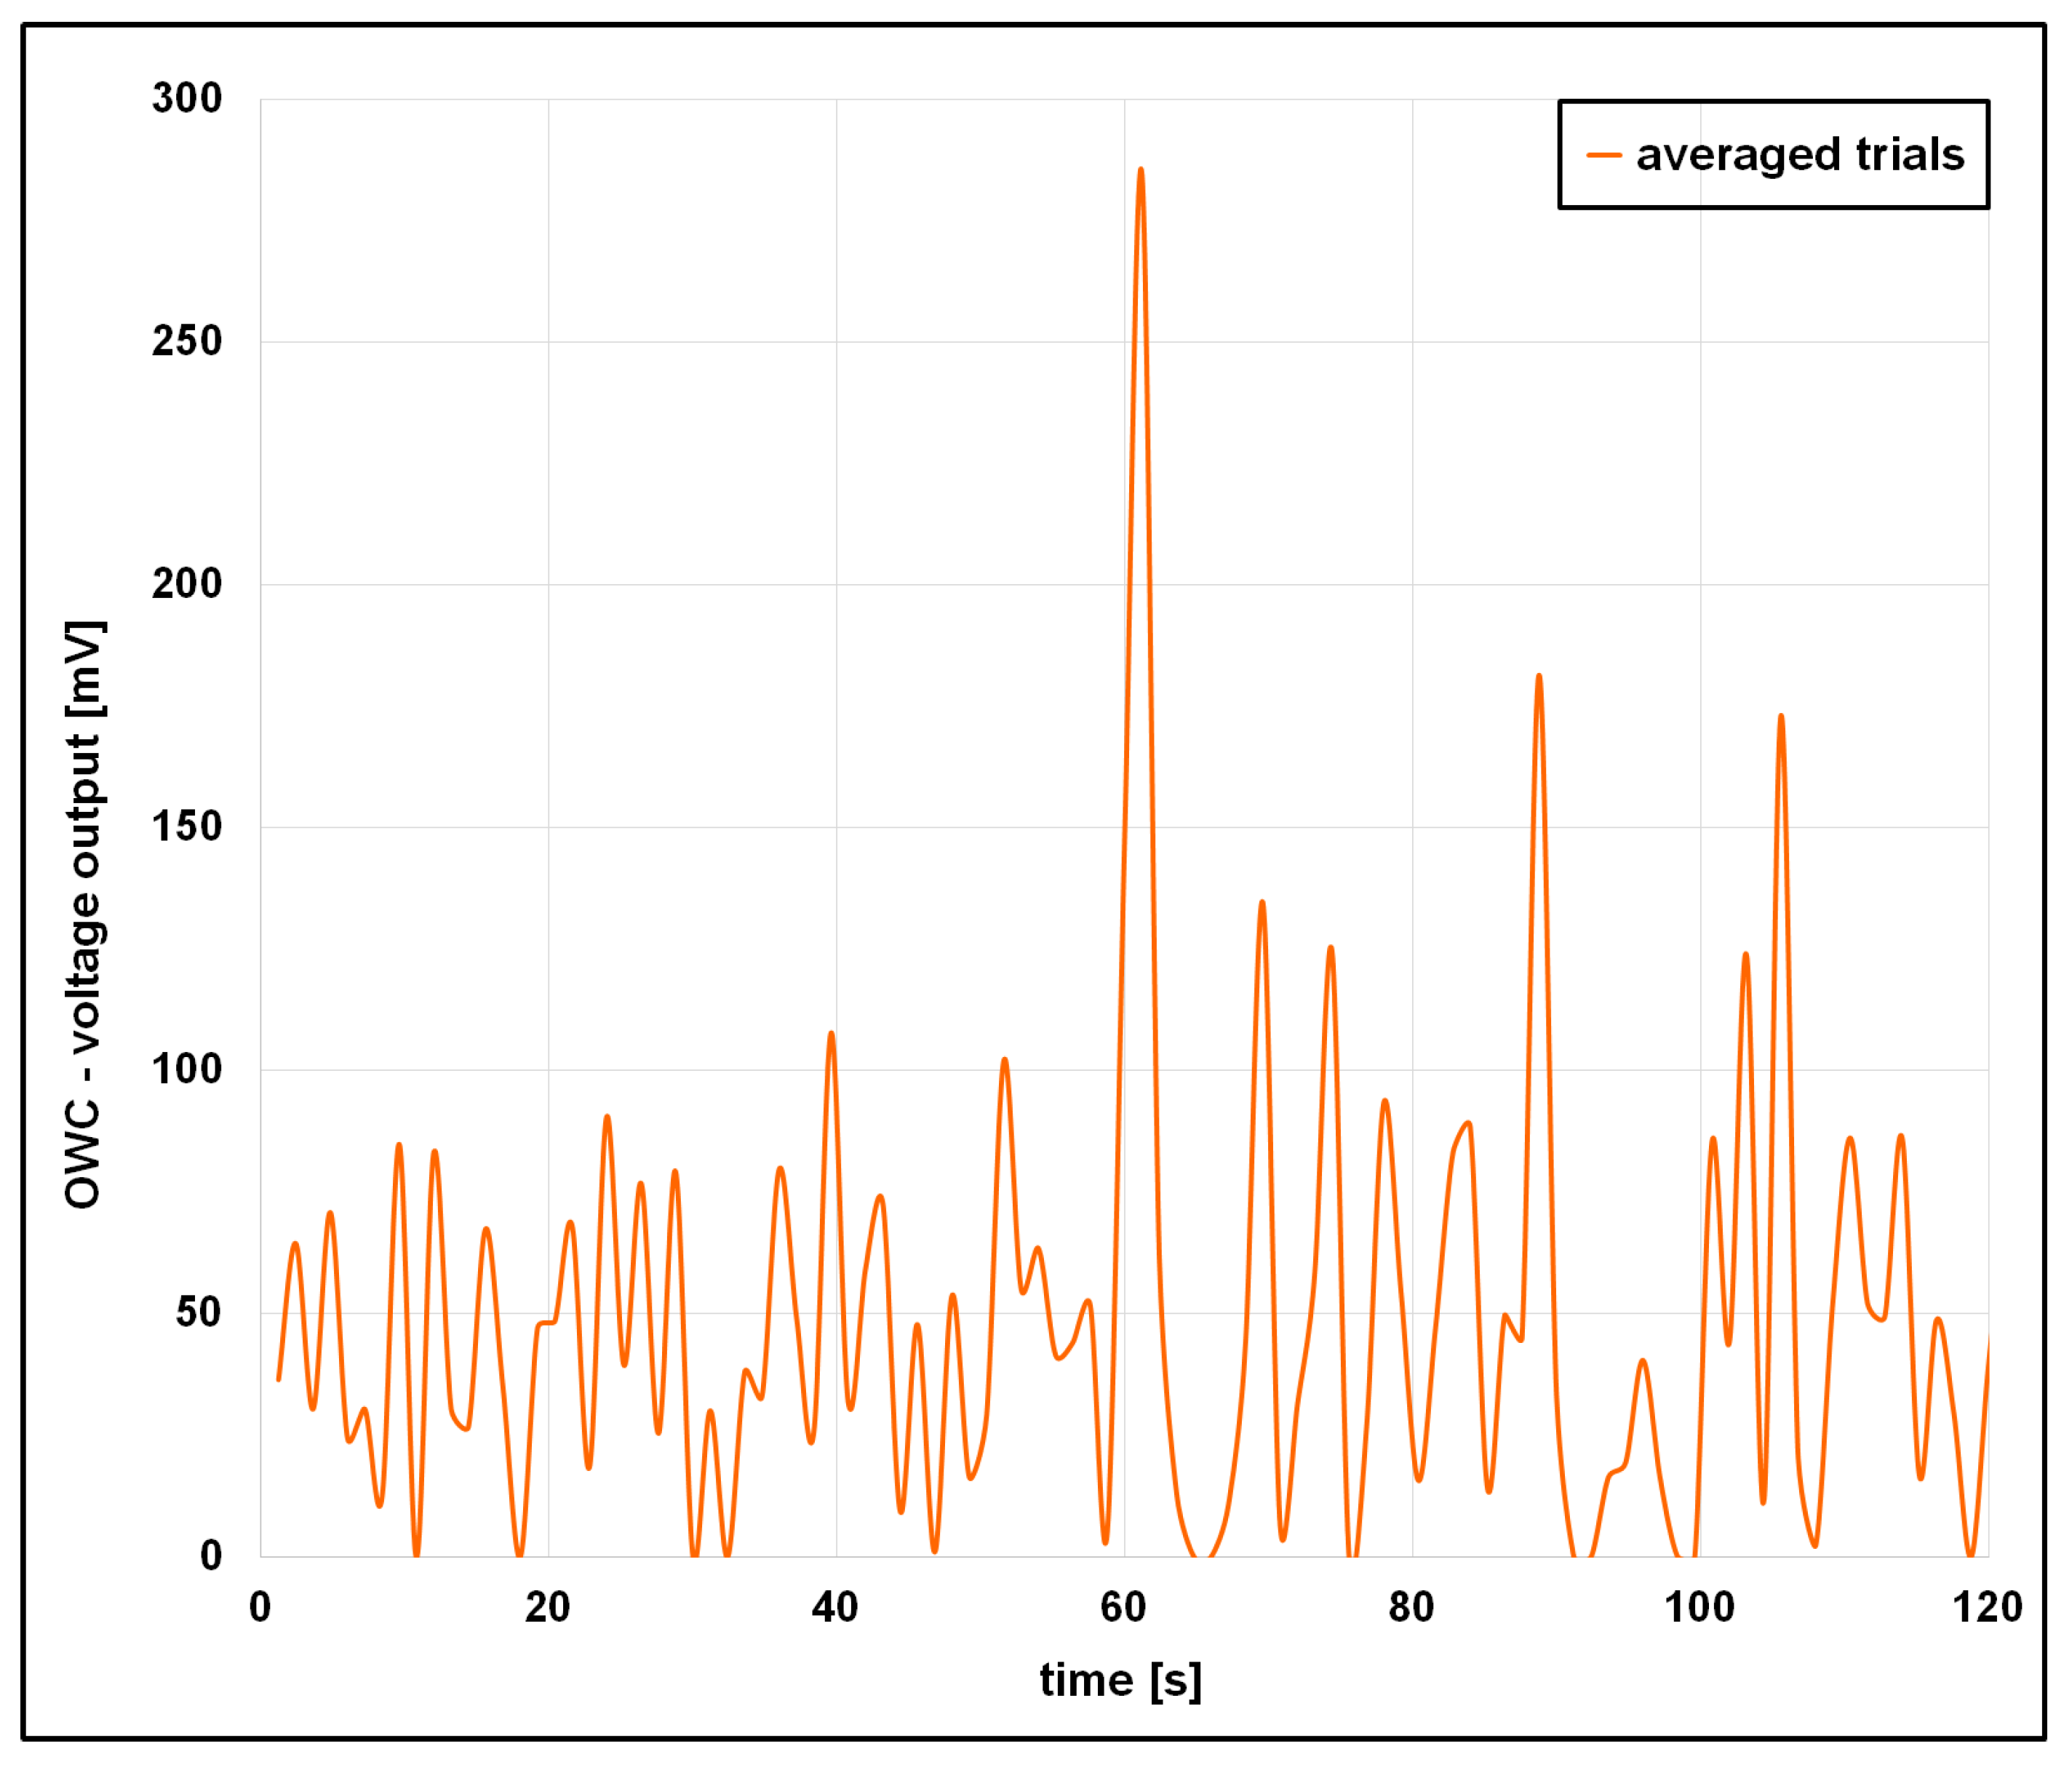
Figure 13 presents the average voltage output for the three trials, where a maximum voltage output of 284 mV was encountered at instant t = 61.2 s. It is worth mentioning here that the maximum voltage output, 284 mV, for wave B is lower than the voltage output of 308 mV for wave signature A. This is due mainly to the wave signature, which showed lower crest peaks, 8.14 mm, for wave signature B compared with the crest peak of 9.7 mm for wave signature A.
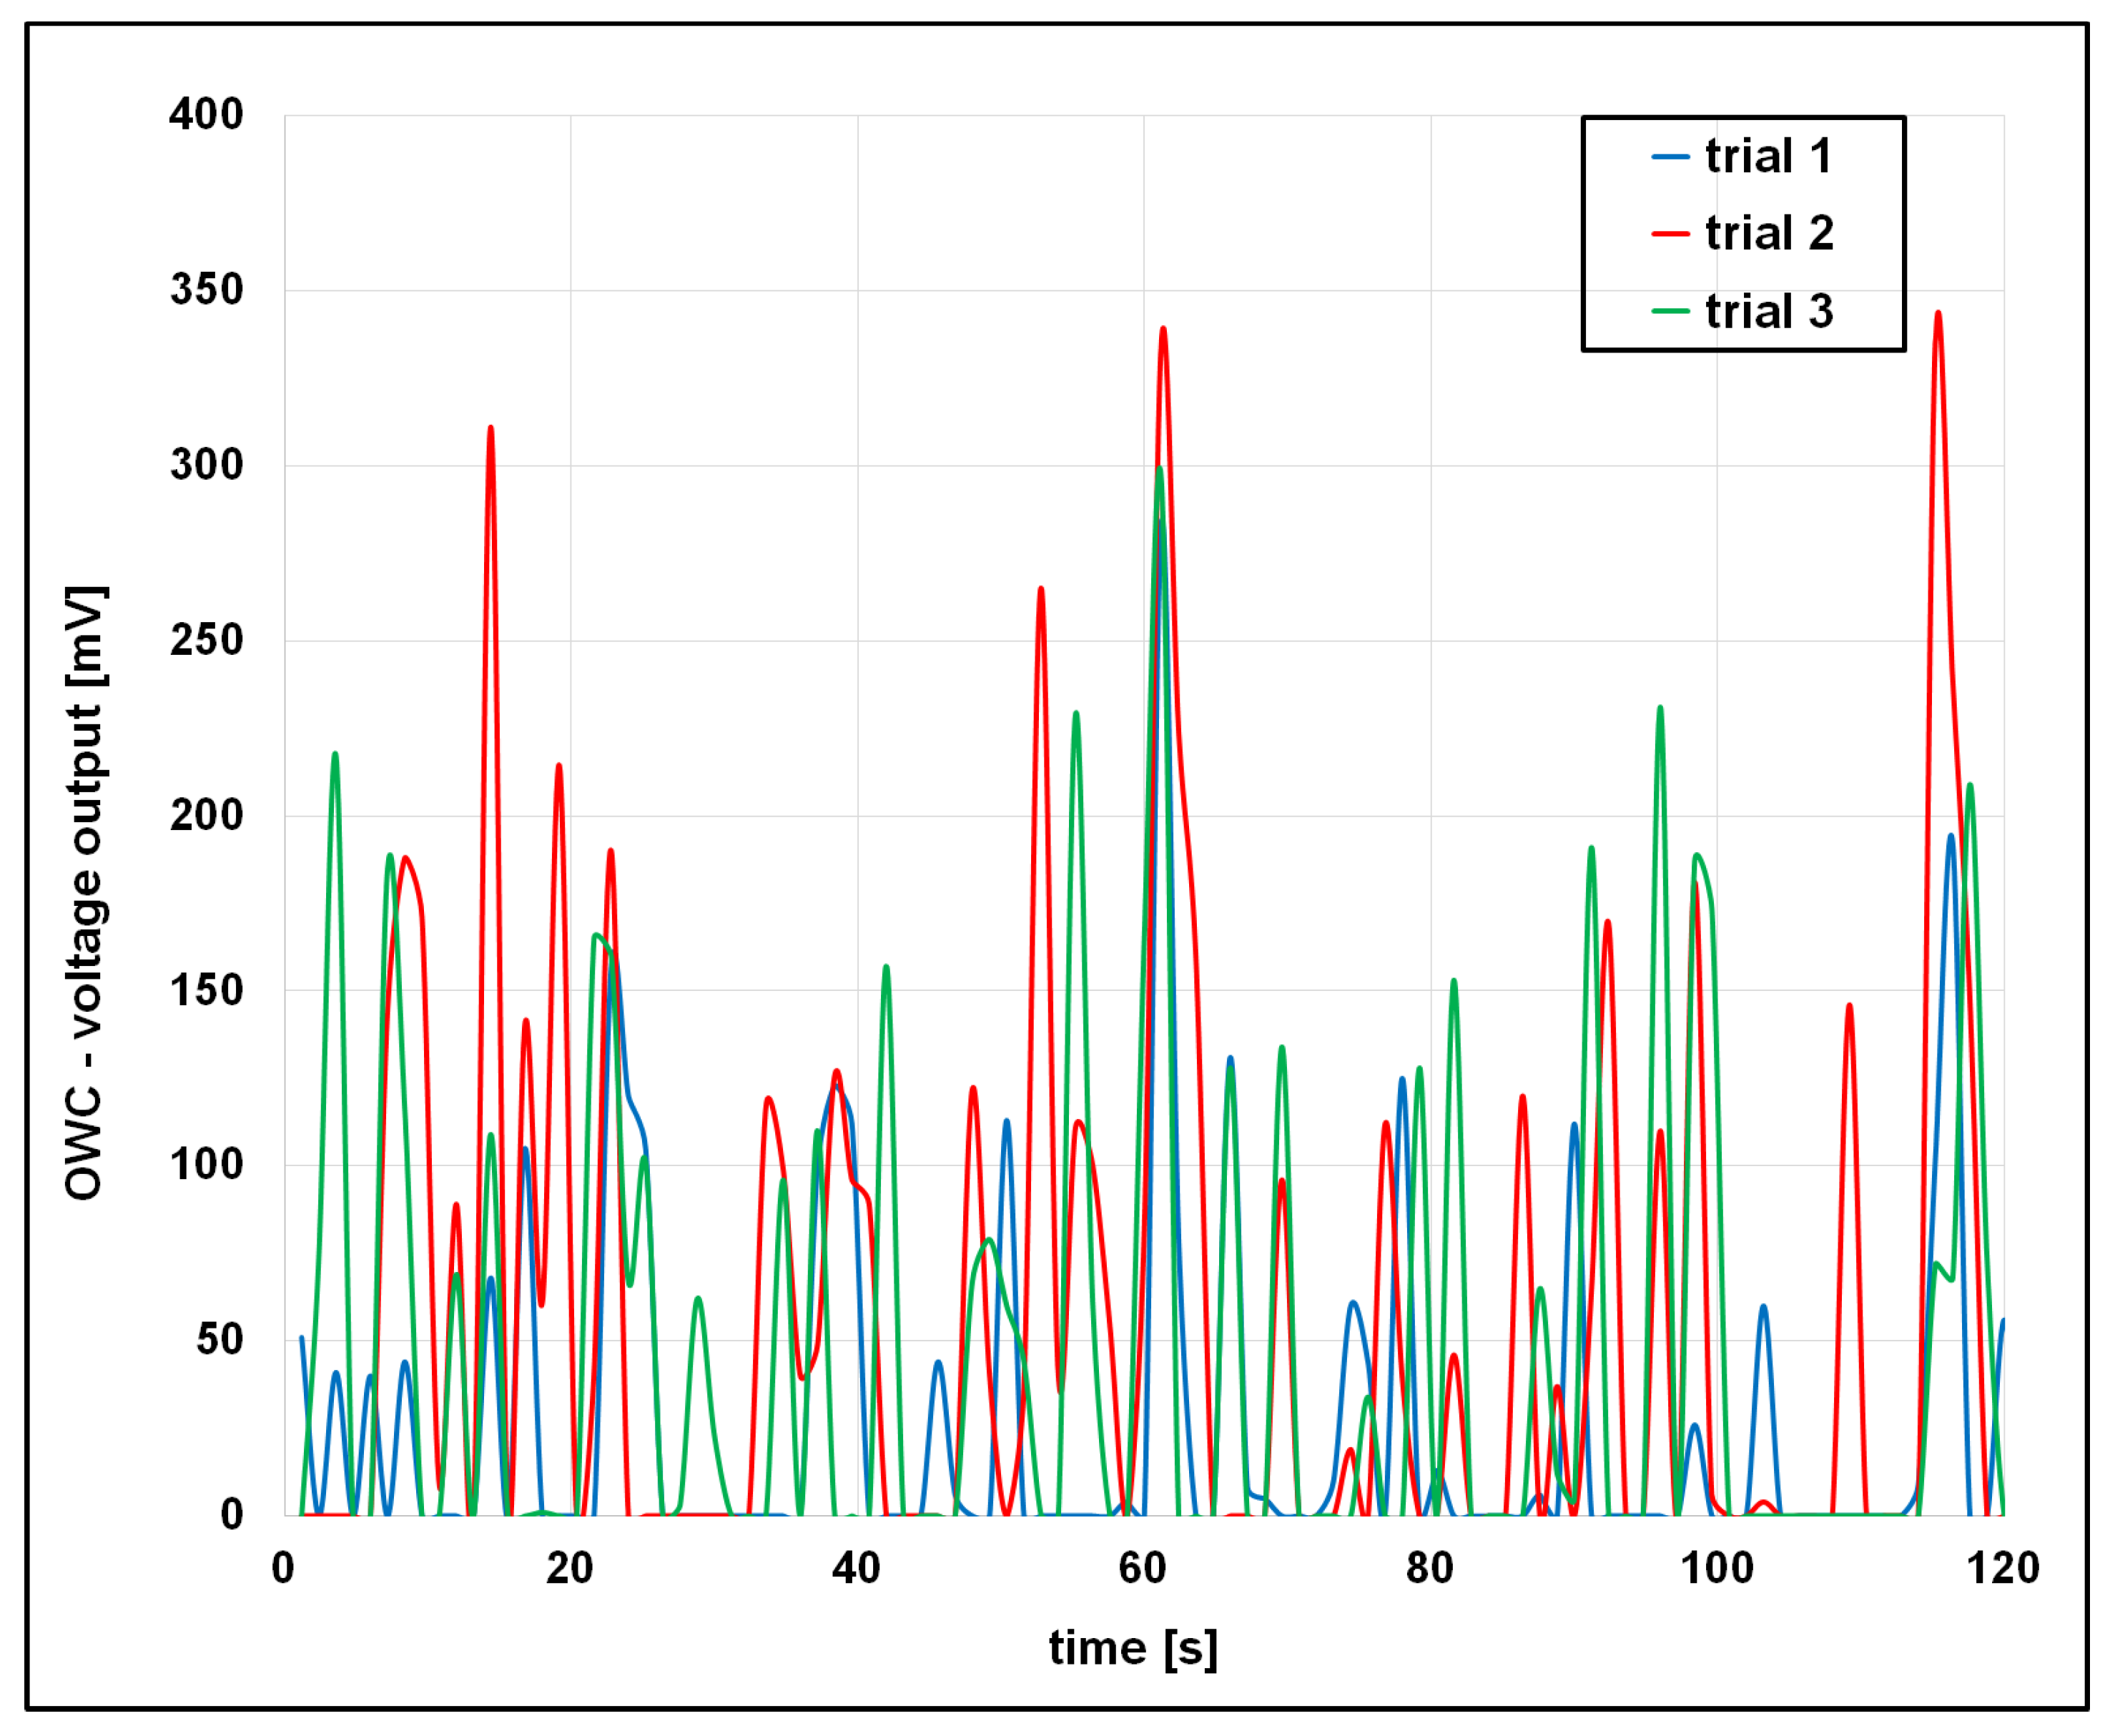
Similar to the previous test cases of wave signatures A and B, the OWC voltage output for wave signature C also shows nonlinear behavior due to the nonlinear behavior of the incident wave and compressible air inside the chamber of the oscillating water column. The analysis shows that the voltage output of trial 1 exhibits a maximum value of 284 mV at instant t = 61.2 s. Similarly, trials 2 and 3 exhibit the same nonlinear behaviors, and the corresponding maximum voltage outputs are 336 mV and 295 mV, as shown in Figure 14. It is worth mentioning here that this secondary maximum voltage output is caused by air decompression as the water column, inside the OWC chamber, moves downwards. The downwards movement of the water column causes a hydrodynamic force that decompresses the air, and thus, it exerts a force on the piezoelectric membrane, which in turn generates a voltage output. This secondary maximum voltage output shows that waves of higher amplitudes cause higher hydrodynamic forces inside the OWC chamber, and thus higher air compressibility, which in turn generates higher voltage output.
Figure 14 presents a comparison of the voltage output for the three trials for wave signature C. The analysis shows that all three trials exhibit a maximum voltage output at the same instant of time t = 61.2 s. However, compared with the previous test cases for wave signatures A and B, the voltage output for wave signature C exhibits a secondary maximum voltage output at instant t = 116.4 s, as shown in Figure 14.
Figure 15 presents the averaged values of the time-varying voltage output of the three different trials for wave signature C. The averaged voltage output exhibits a maximum value of 305 mV at instant t = 61.2 s. It is worth mentioning here that the maximum voltage output of 305 mV for wave signature C is higher than the voltage outputs of 300 mV and 284 mV for wave signatures A and B, respectively. This result also confirms that the OWC voltage output is dependent on the wave signature.
Similar to the time-varying voltage output for wave signatures A, B, and C, the voltage output for wave signature D also shows a nonlinear behavior due to the nonlinear behavior of the incident wave, compressible air, and their interaction. This is well-illustrated in Figure 16, where the comparison of the voltage output for three different trials is presented. The analysis of the voltage output from trial 1 reveals that the voltage output reaches a maximum value of 311 mV at instant t = 61.2 s, while trials 2 and 3 exhibit maximum voltage outputs of 283 mV and 310 mV, respectively, as shown in Figure 16.
It is worth mentioning here that these maximum voltage output values are reached at the same instant of time t = 61.2 s. The analysis of trials 1 and 2, Figure 16, reveals once again the presence of secondary maximum peaks during the downwards movement of the water column inside the OWC chamber, which corresponds to the air decompression inside the OWC chamber. The analysis also reveals that the secondary maximum peaks occur at earlier instants of time compared with the previous cases, and this is due to the increased strength of the incident wave. As shown in the analysis of the wave signature, Figure 9, the incident wave exhibits the largest amplitudes for wave signature D and thus, it generates a larger displacement of the water column inside the OWC.
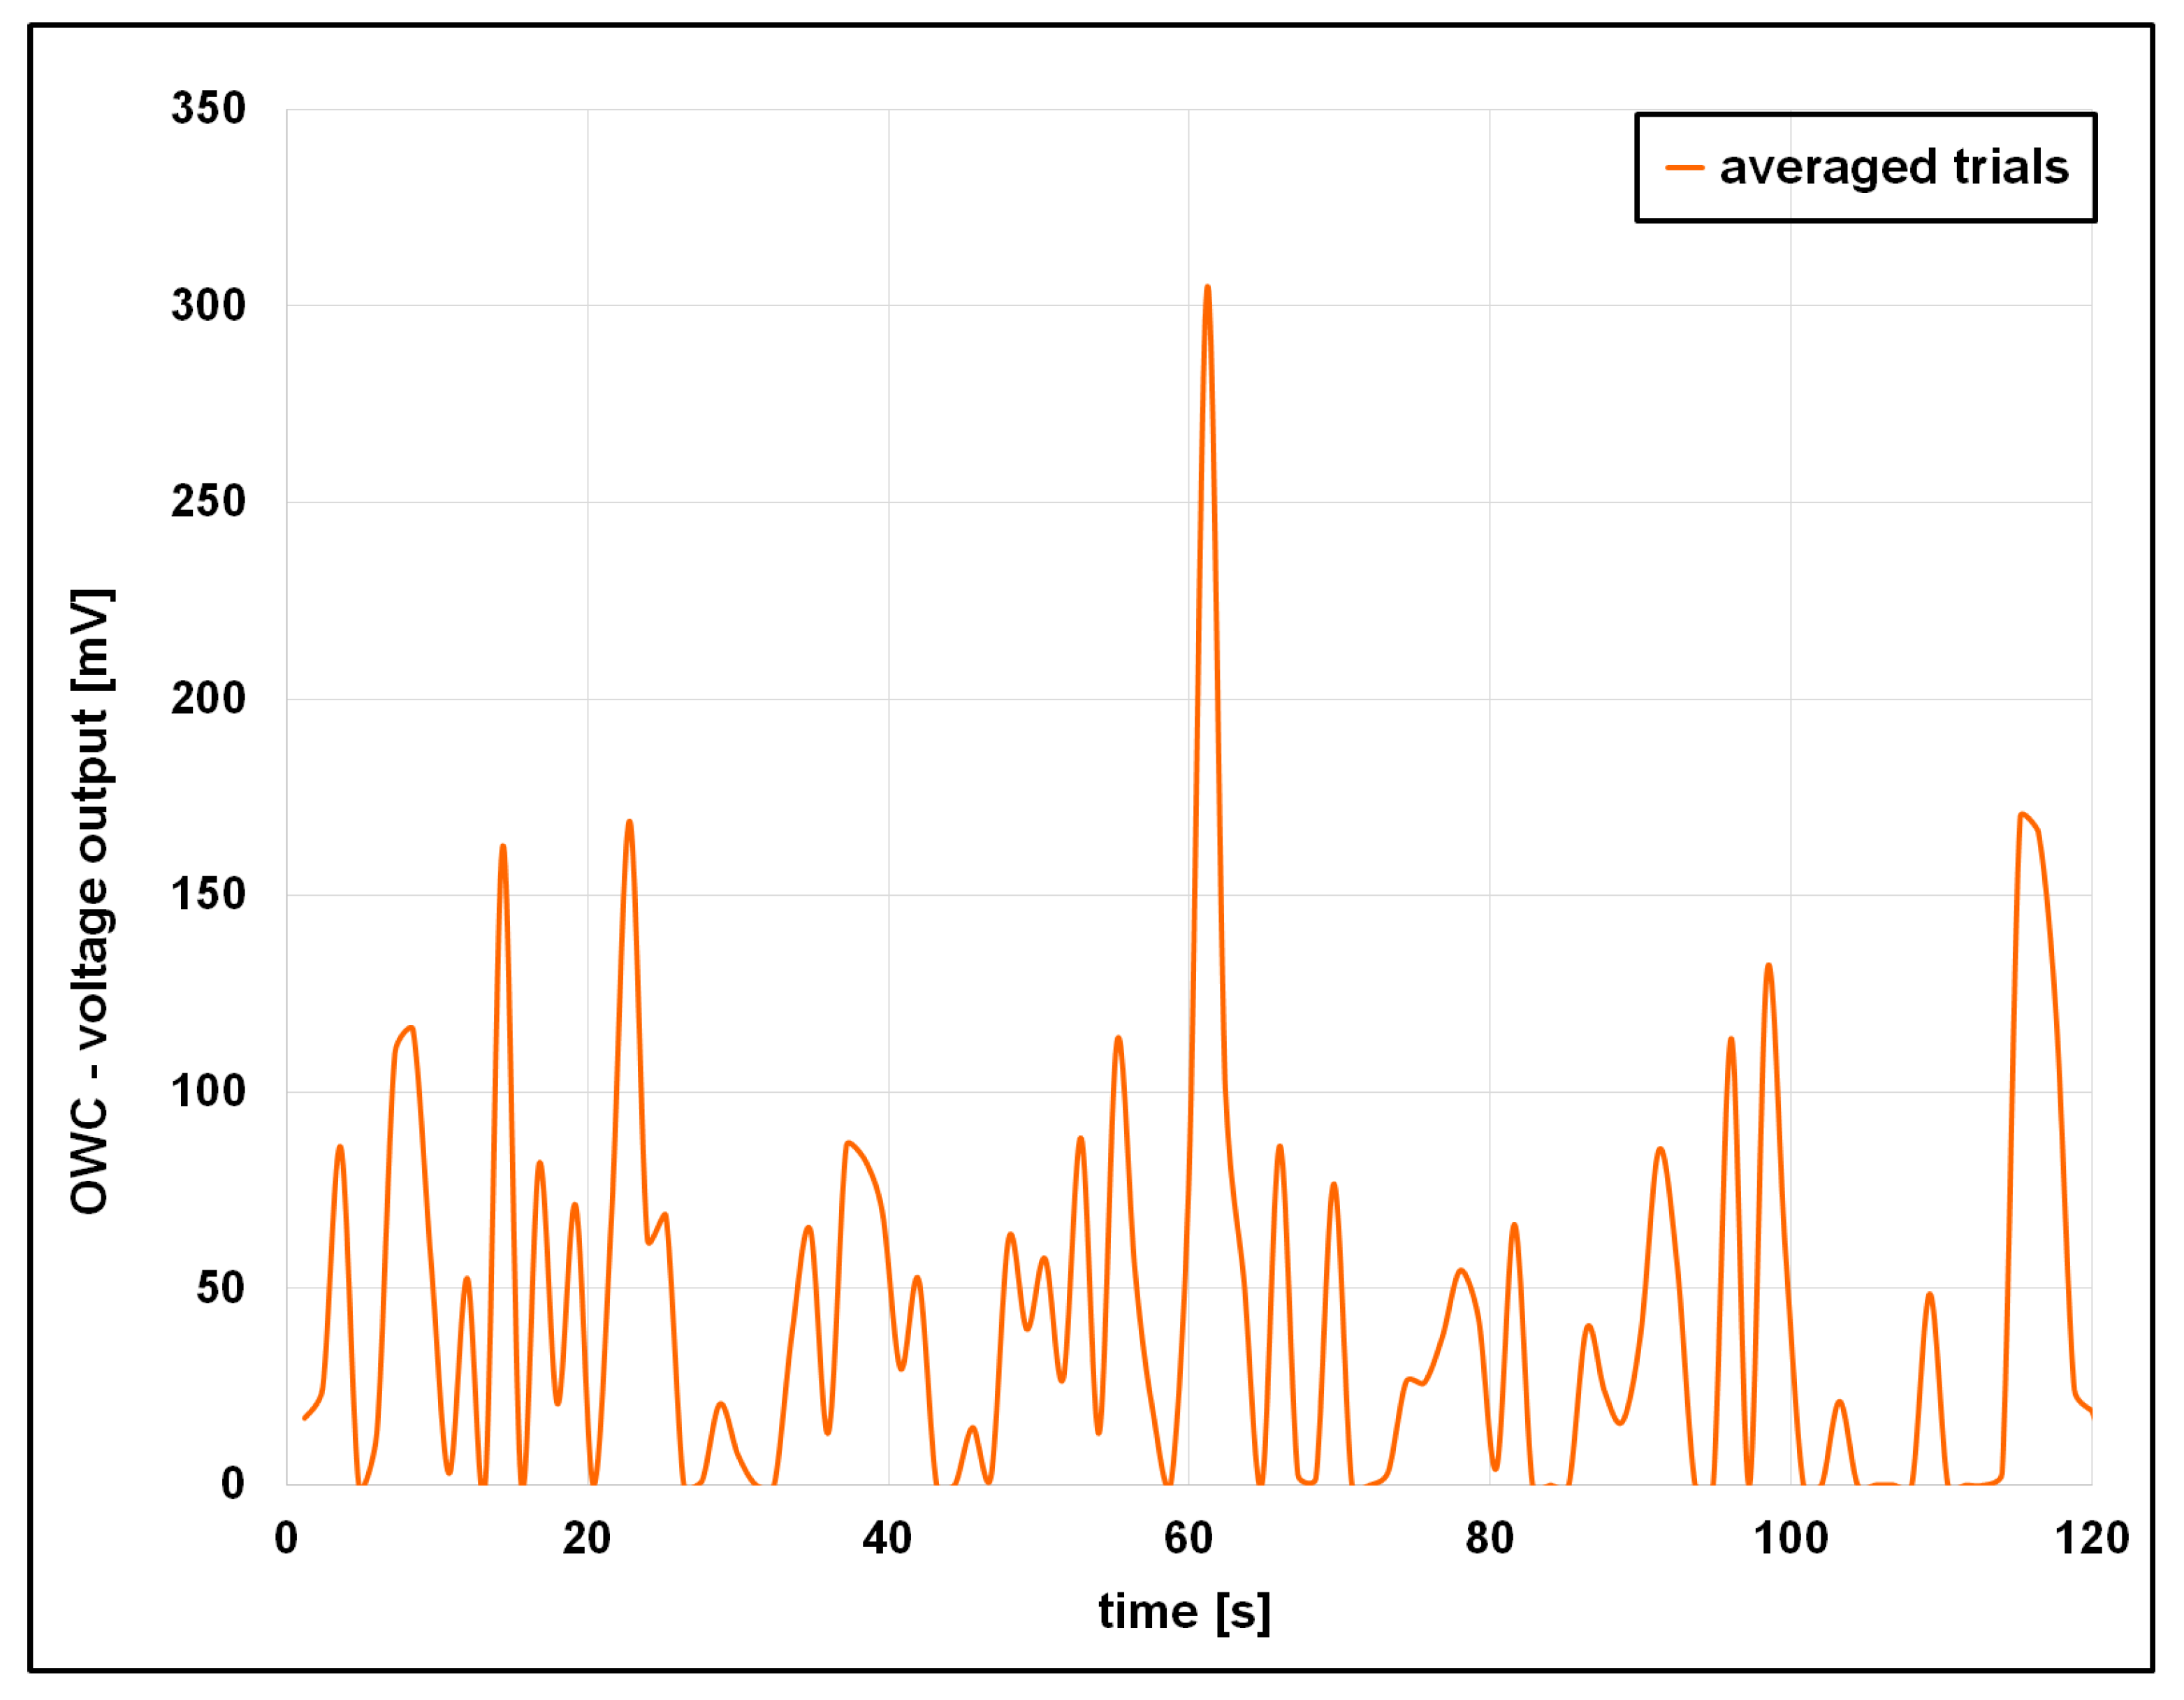
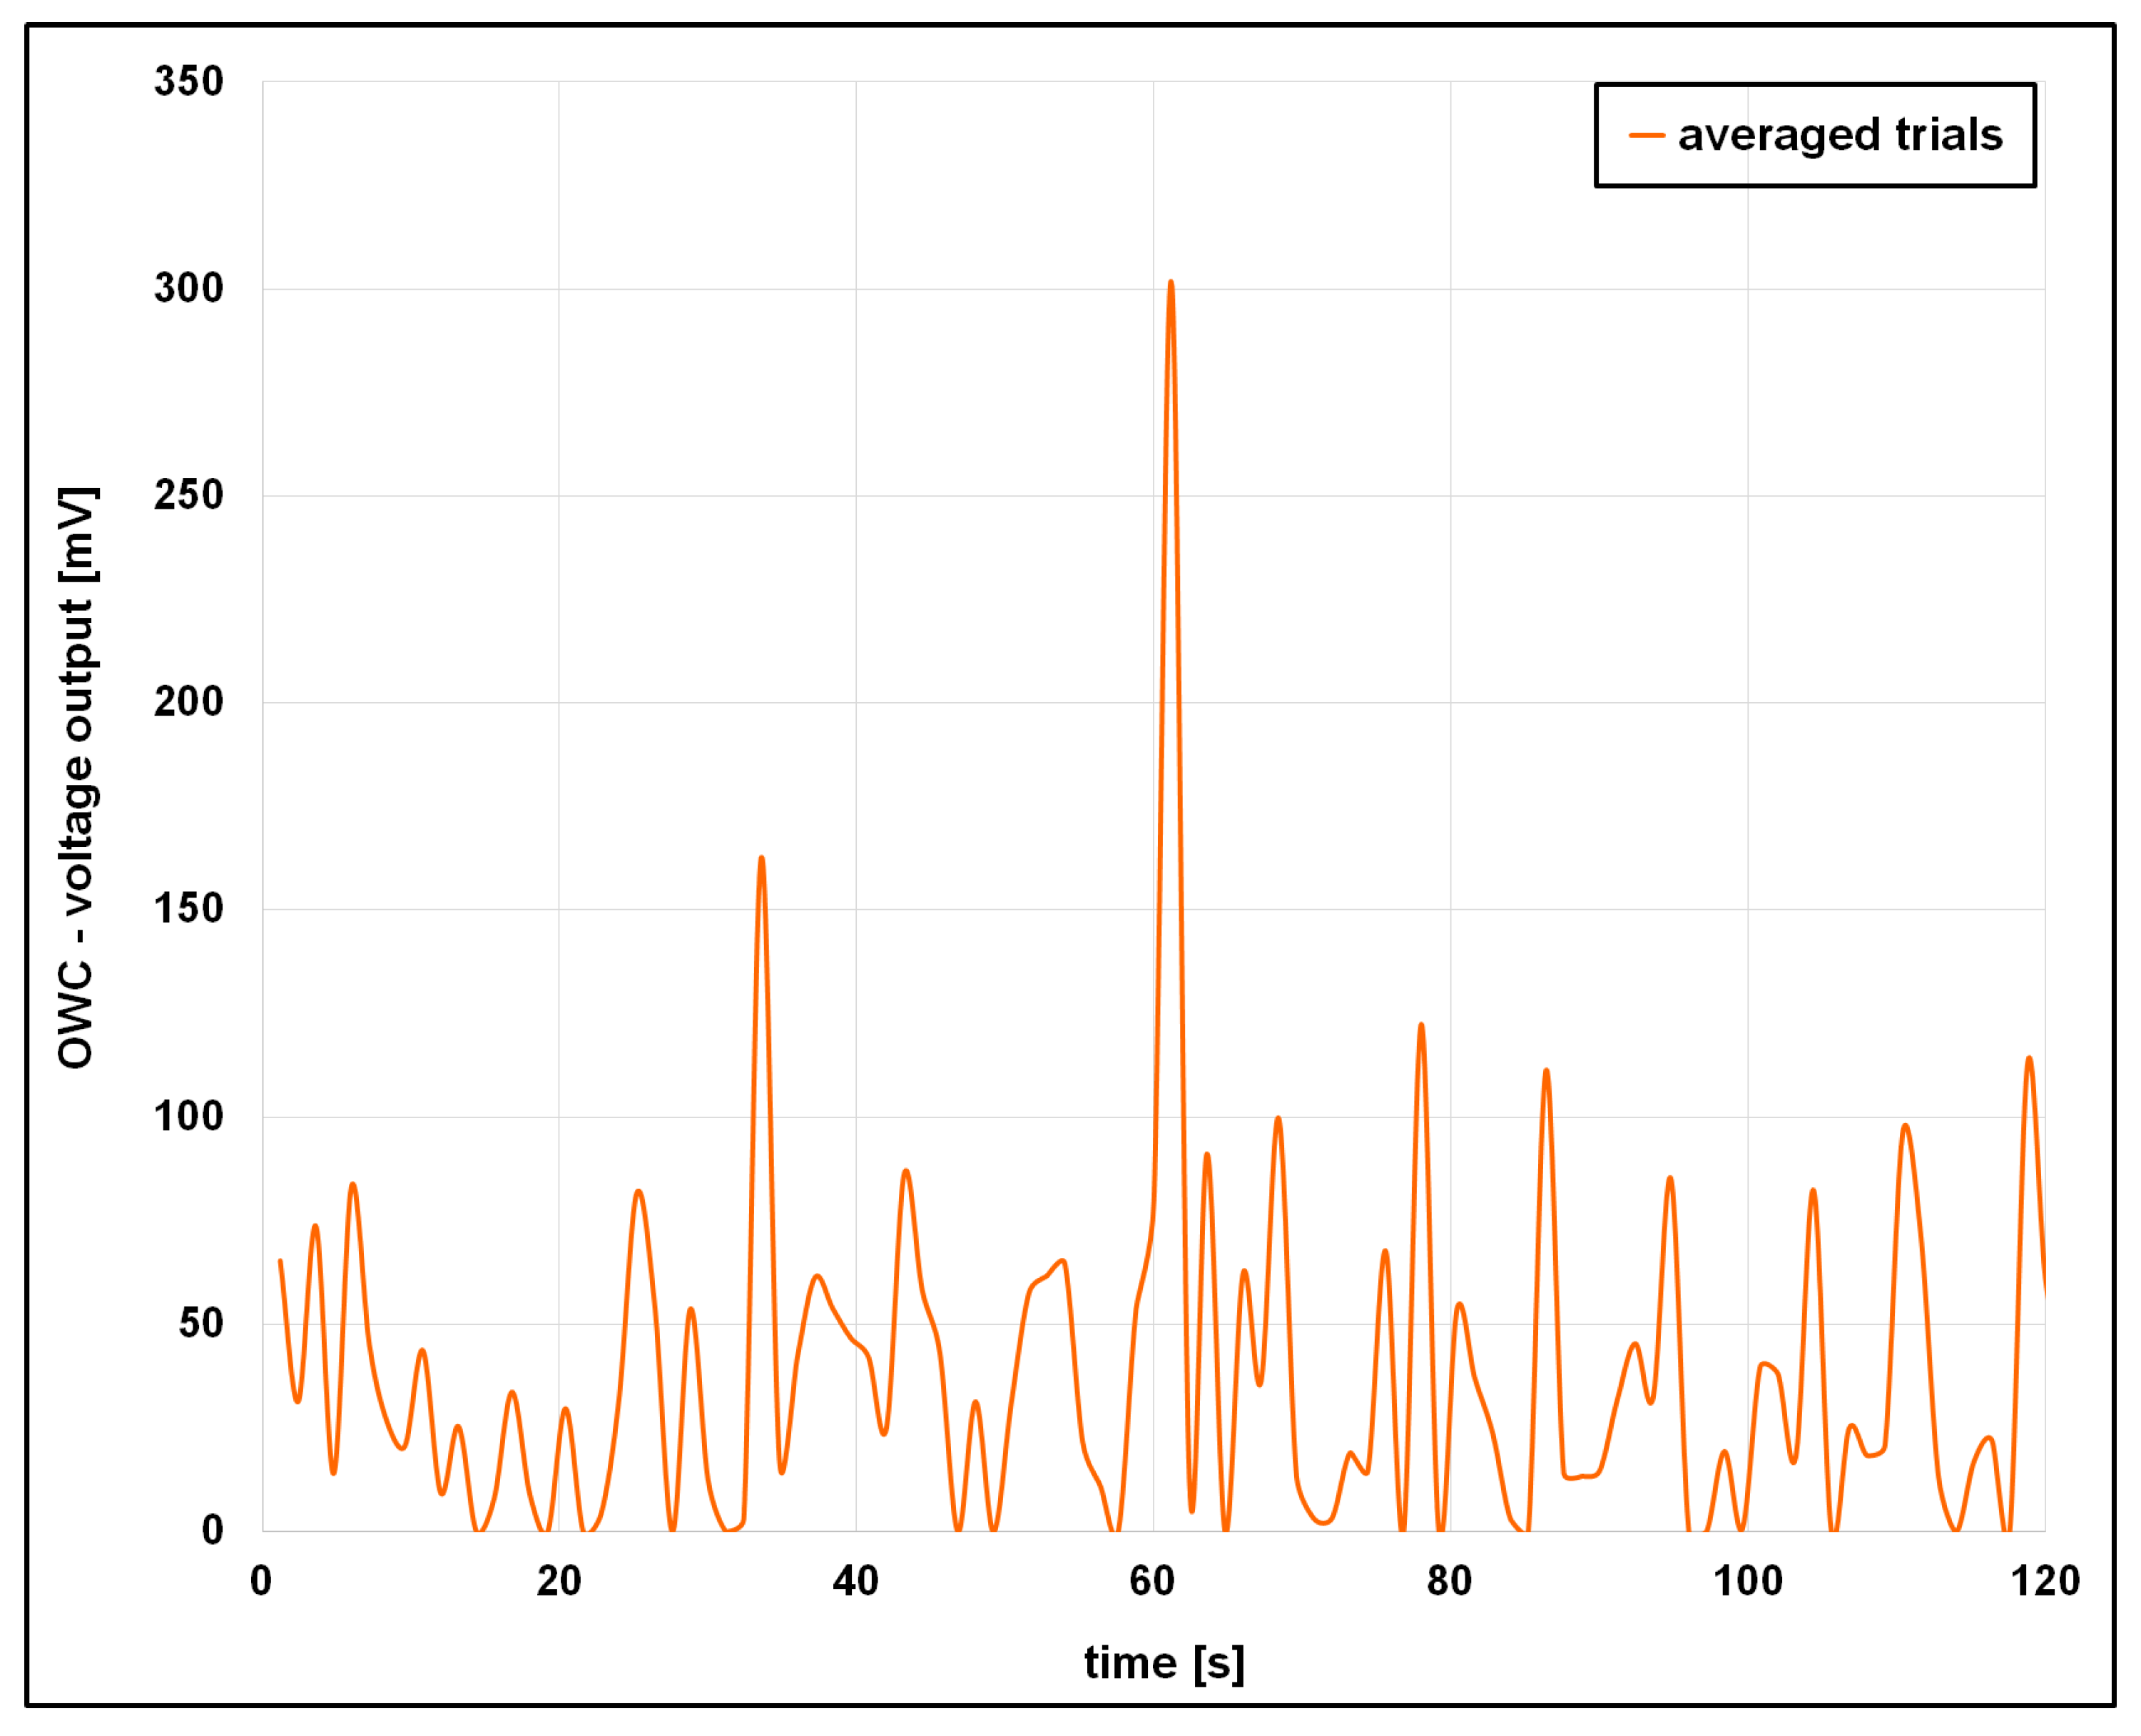
Figure 17 presents the time-averaged voltage output for wave signature D. The analysis of the time-averaged voltage output shows that the maximum voltage output of 302 mV is encountered at the instant t = 61.2 s. This time-averaged maximum voltage output of 302 mV is lower than the averaged maximum voltage output of 307 mV observed for wave signature C, and this is due to the nonlinear nature of the incident wave, compressible air, and their interaction.
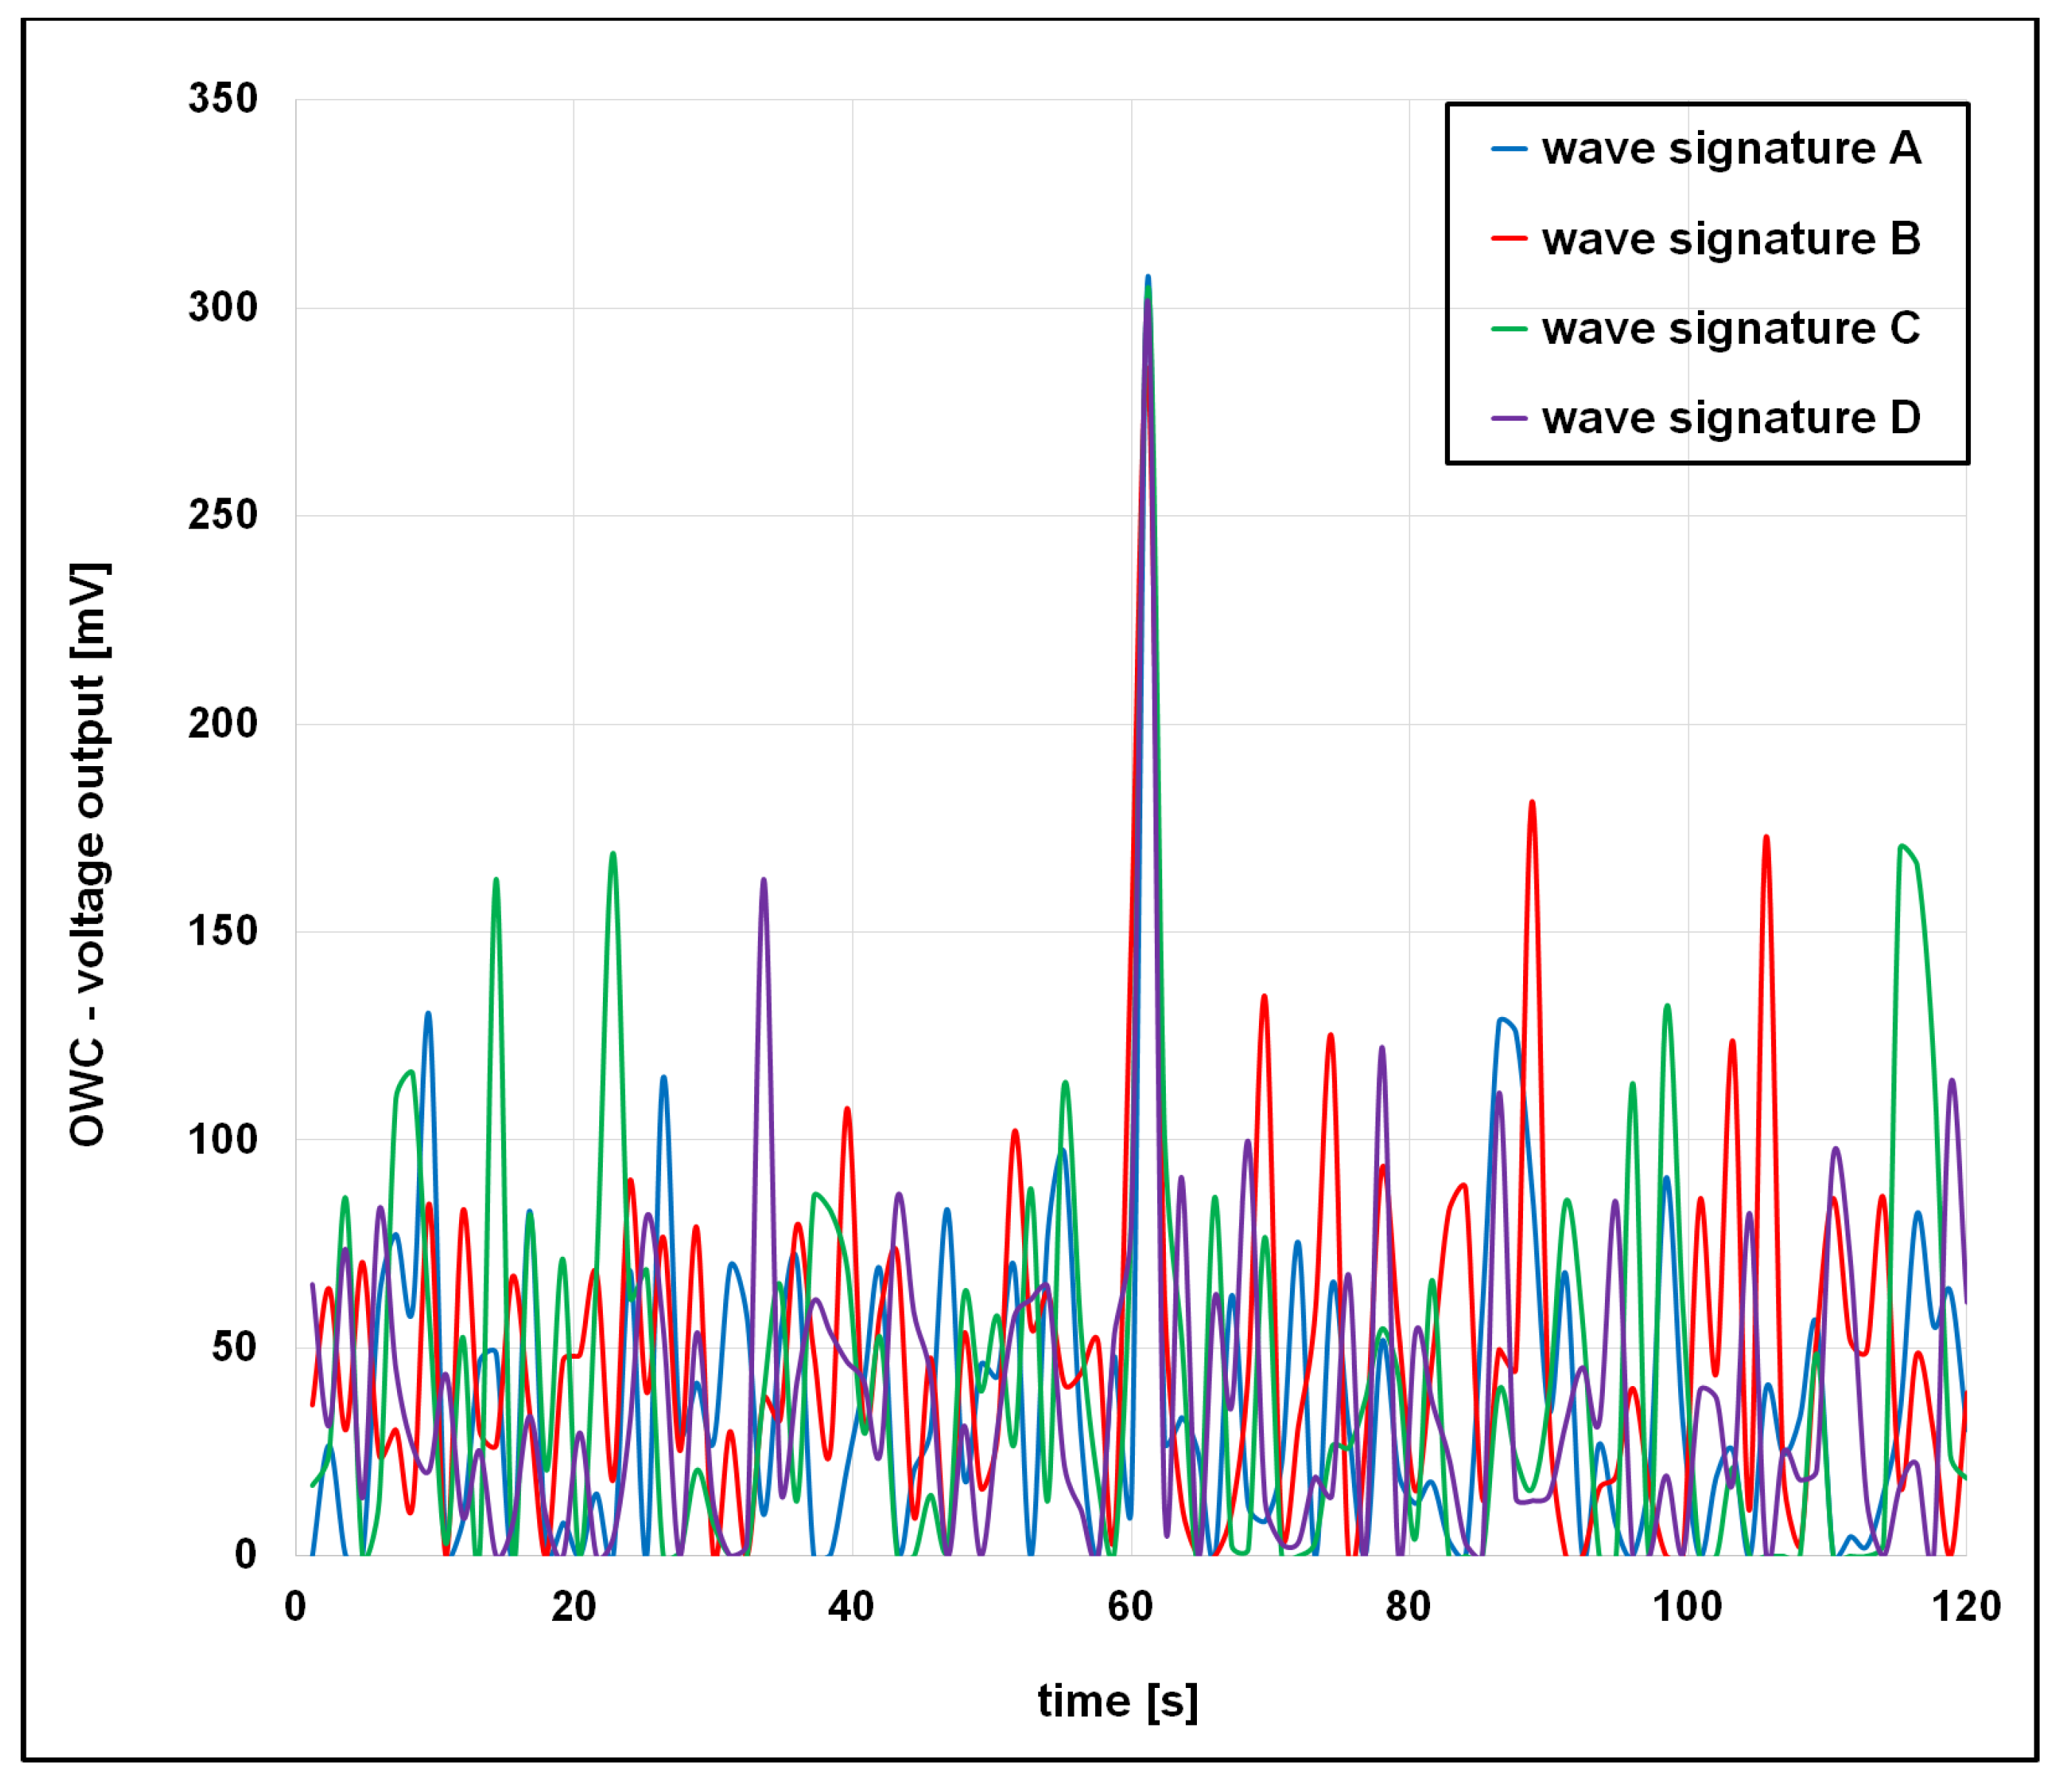
Figure 18 presents the comparison of the time-varying OWC voltage output for four different wave signatures, A, B, C, and D, respectively. The comparison of the OWC voltage output emphasizes once again the nonlinear nature of the incident wave, compressible air, and hydrodynamic efficiency. The analysis also reveals that the maximum voltage output is encountered at the same instant of time for all wave signatures. The comparison also shows the presence of lower peaks of voltage output for both compression and decompression of air processes inside the OWC chamber, and thus, these peaks are observed before and after the maximum voltage output.
The lower voltage outputs before the maximum voltage output at instant t = 61.2 s are due to the upwards motion of the water column inside the OWC chamber, while the lower voltage outputs after the instant t = 61.2 s are due to the downwards motion of the water column. Thus, the lower peaks observed before instant t = 61.2 s are due to air compression, while the lower peaks observed after the instant t = 61.2 s are due to air decompression inside the OWC chamber. Besides these differences, the analysis also shows that the wave signature and air compressibility impact the voltage output differently. Thus, for wave signature C, the lower voltage output peaks occur before the maximum voltage output peak, instant t = 61.2 s, while for wave signature B, the lower voltage output peaks occur after the maximum voltage output peak.
This result suggests that for wave signature B, the lower peaks of voltage output are caused by air decompression, or downwards movement of the water column, while for wave signature C, the lower peaks of voltage output are caused by air compression, or upwards movement of the water column. Due to the nonlinear nature of the incident wave, the peaks of voltage output also show a nonlinear behavior, as shown in Figure 18.
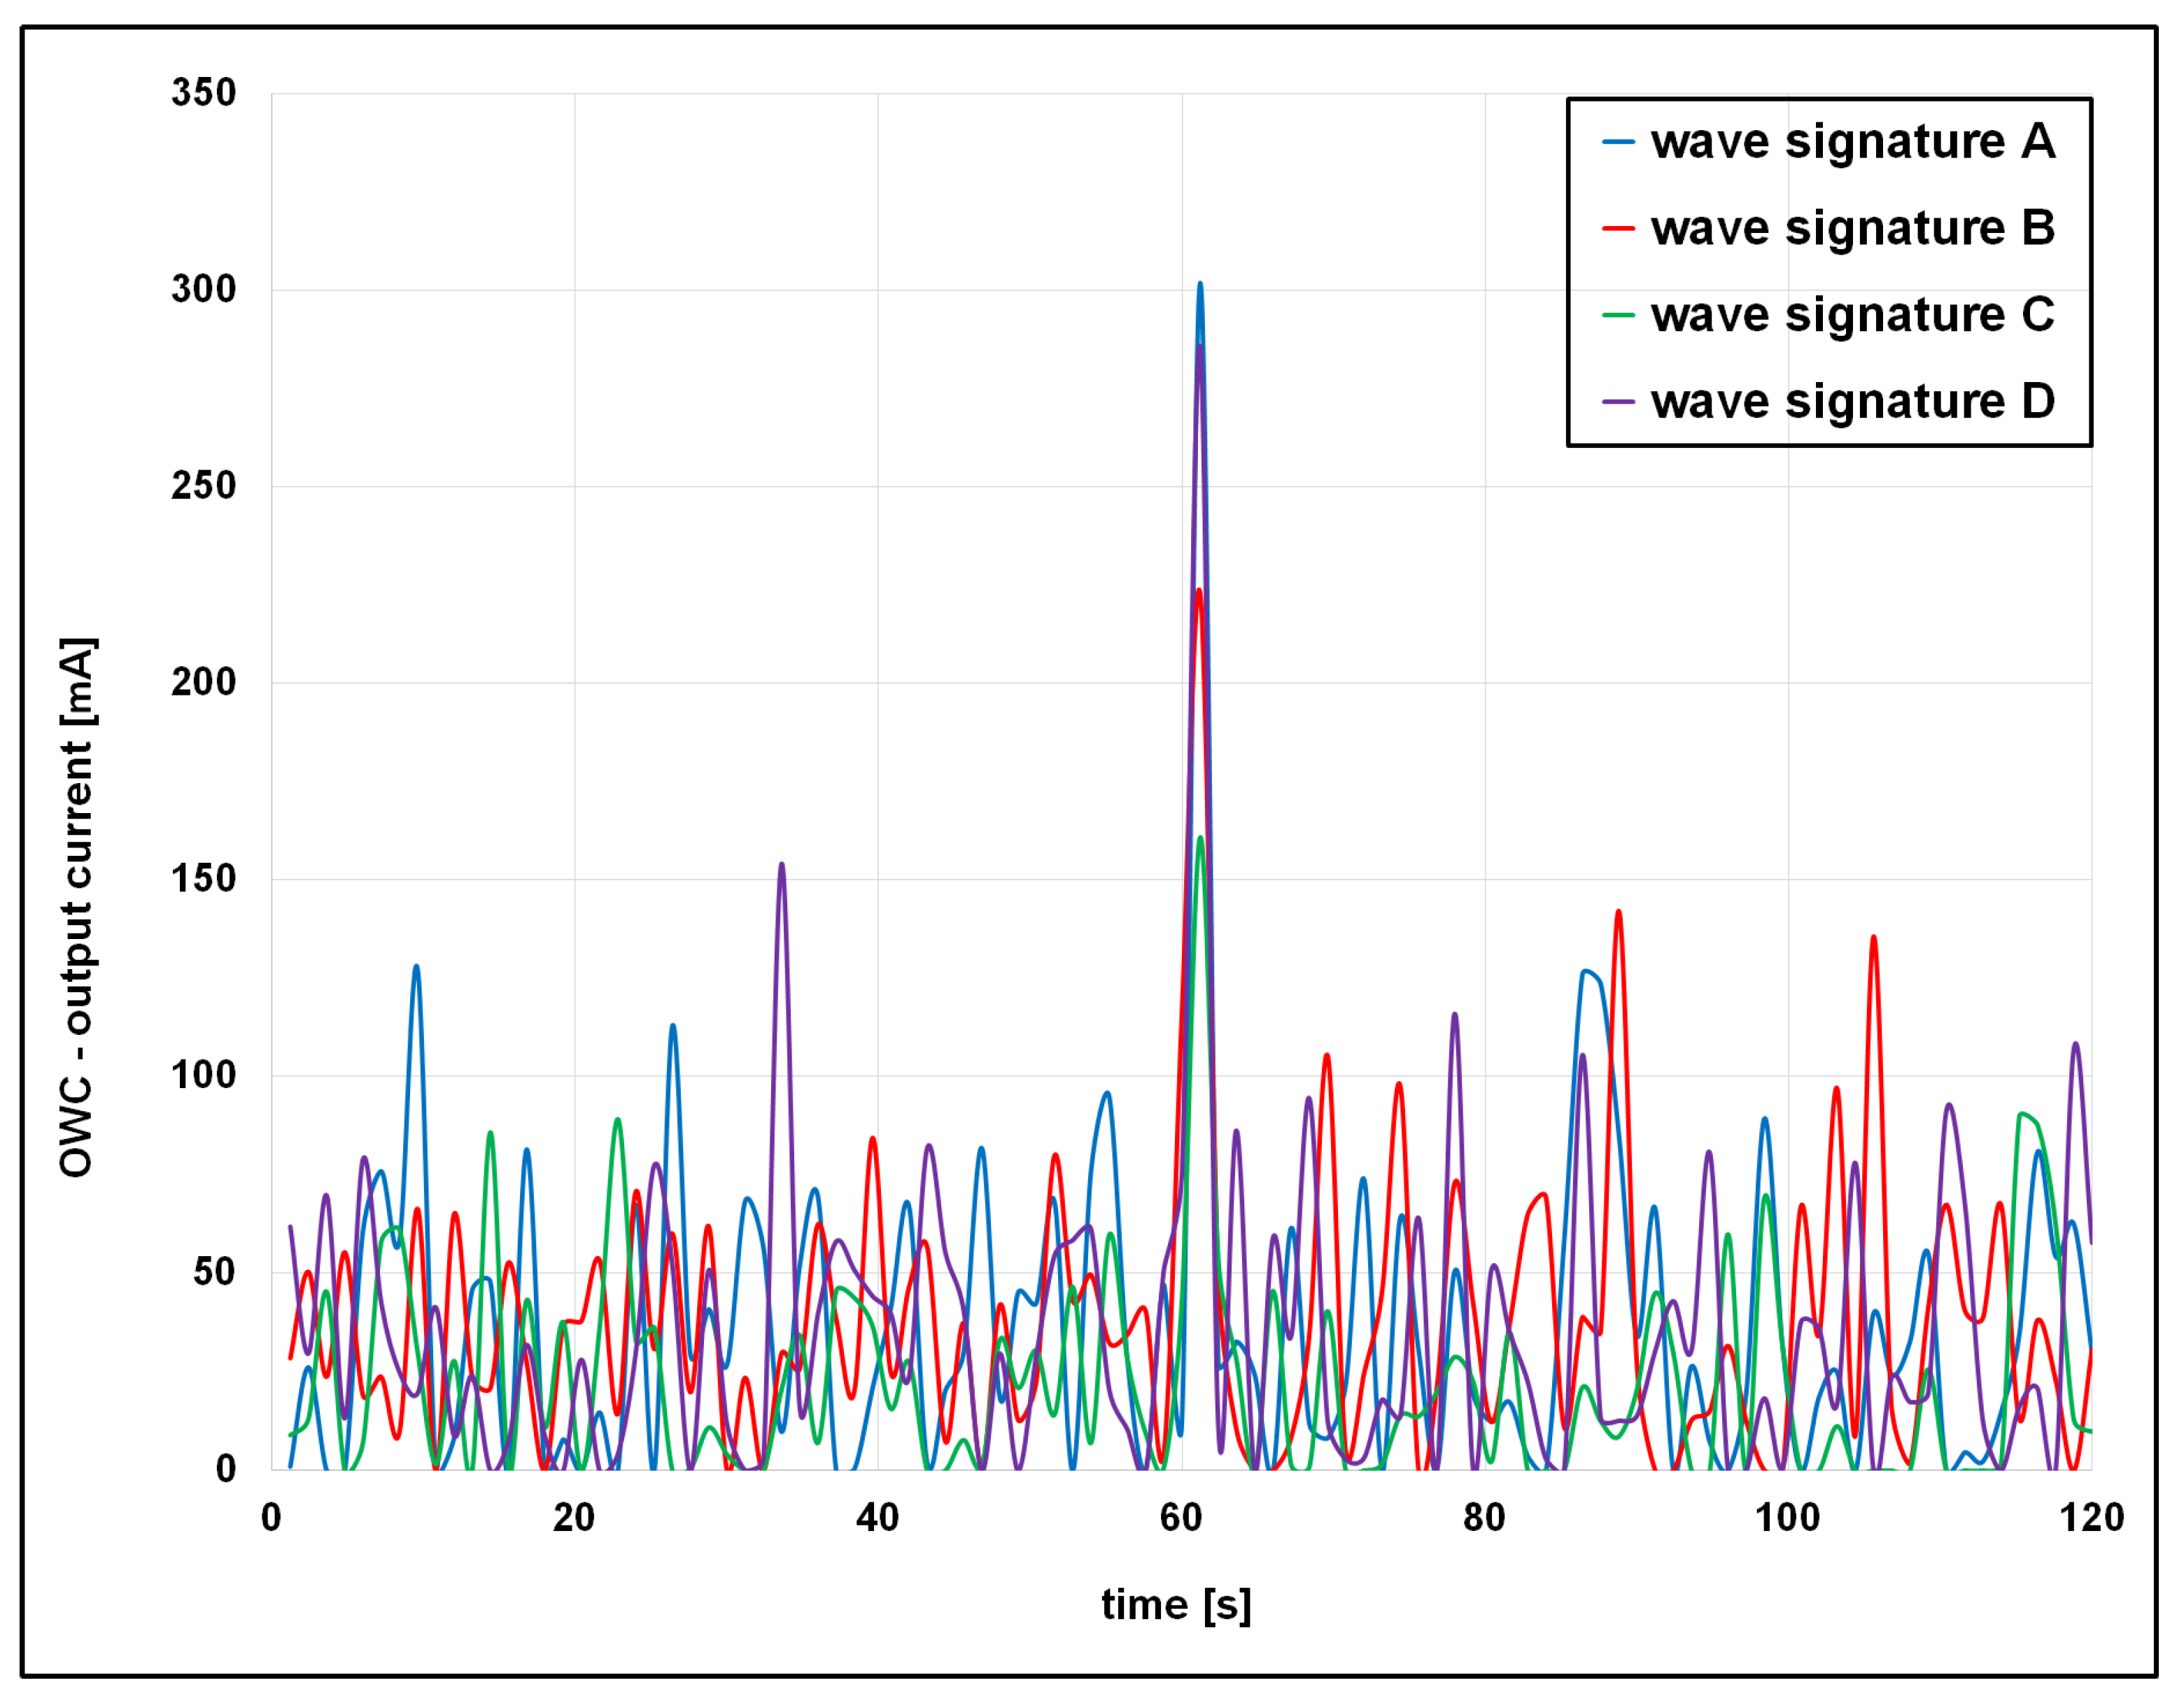
Figure 19 depicts the influence of the wave signature on the OWC current output. Consistent with the voltage output, the current output exhibits temporal variations arising from the nonlinear characteristics of the incident wave, air compressibility, and hydrodynamic efficiency. The current output attains maximum peaks concurrently with those of the voltage output, while additional minor peaks are observed during both compression and decompression phases. The low output current of the OWC arises from the intrinsic behavior of piezoelectric membranes, which function primarily as charge generators. Mechanical deformation induces electrical polarization, yielding voltage levels from tens to hundreds of millivolts under laboratory excitation and up to several volts under strong dynamic loading [66,67,76]. However, their high internal impedance limits current delivery, making them more suitable for voltage sensing, signal detection, and small-scale energy harvesting than for supplying substantial electrical power [66,67,76].
A statistical analysis was performed to assess the uncertainty of the experimental data and identify the factors contributing to the experimental uncertainty. Thus, the statistical analysis was carried out using the experimental standard deviation of the mean, given by Equation (2). Studies showed that this provides an accurate estimation of the experimental uncertainties associated with the oscillating water column [20,67,76].
s x ¯ = 1 n 1 i = 1 n ( x i x ¯ ) 2 n
The analysis was conducted for the wave signature and voltage output for three different trials for four wave signatures. The values of the experimental standard deviation of the mean s ( x ¯ ) are presented in Table 5.
The analysis shows that the standard deviation of the mean presents different values for the three different trials, for all wave signatures. Therefore, the experimental standard deviation of the mean s ( x ¯ ) suggests that there are variances among the three trials for each wave signature. The analysis also reveals an increase in variability of experiments with the increase in wave amplitudes. These variances may arise from (i) wave conditions (wave amplitude and period), (ii) wave–structure interaction, (iii) hydrodynamic and hydro-aerodynamic nonlinearities, and (iv) the scale effect. Uncertainty studies of experimental lab-scale OWC showed that even when experiments were conducted according to international guidelines, in exactly the same experimental conditions, differences of 15–30% were observed between laboratory experiments [20,67,76]. Studies also showed that the scalability of the experiments plays a key role in the uncertainties associated with the experimental studies [20,67,76]. Although the differences in the standard deviation of the mean s ( x ¯ ) for the different trials are not large, the present analysis suggests that it is important to account for them in the uncertainty analysis and design of the experimental studies and real-world designs.
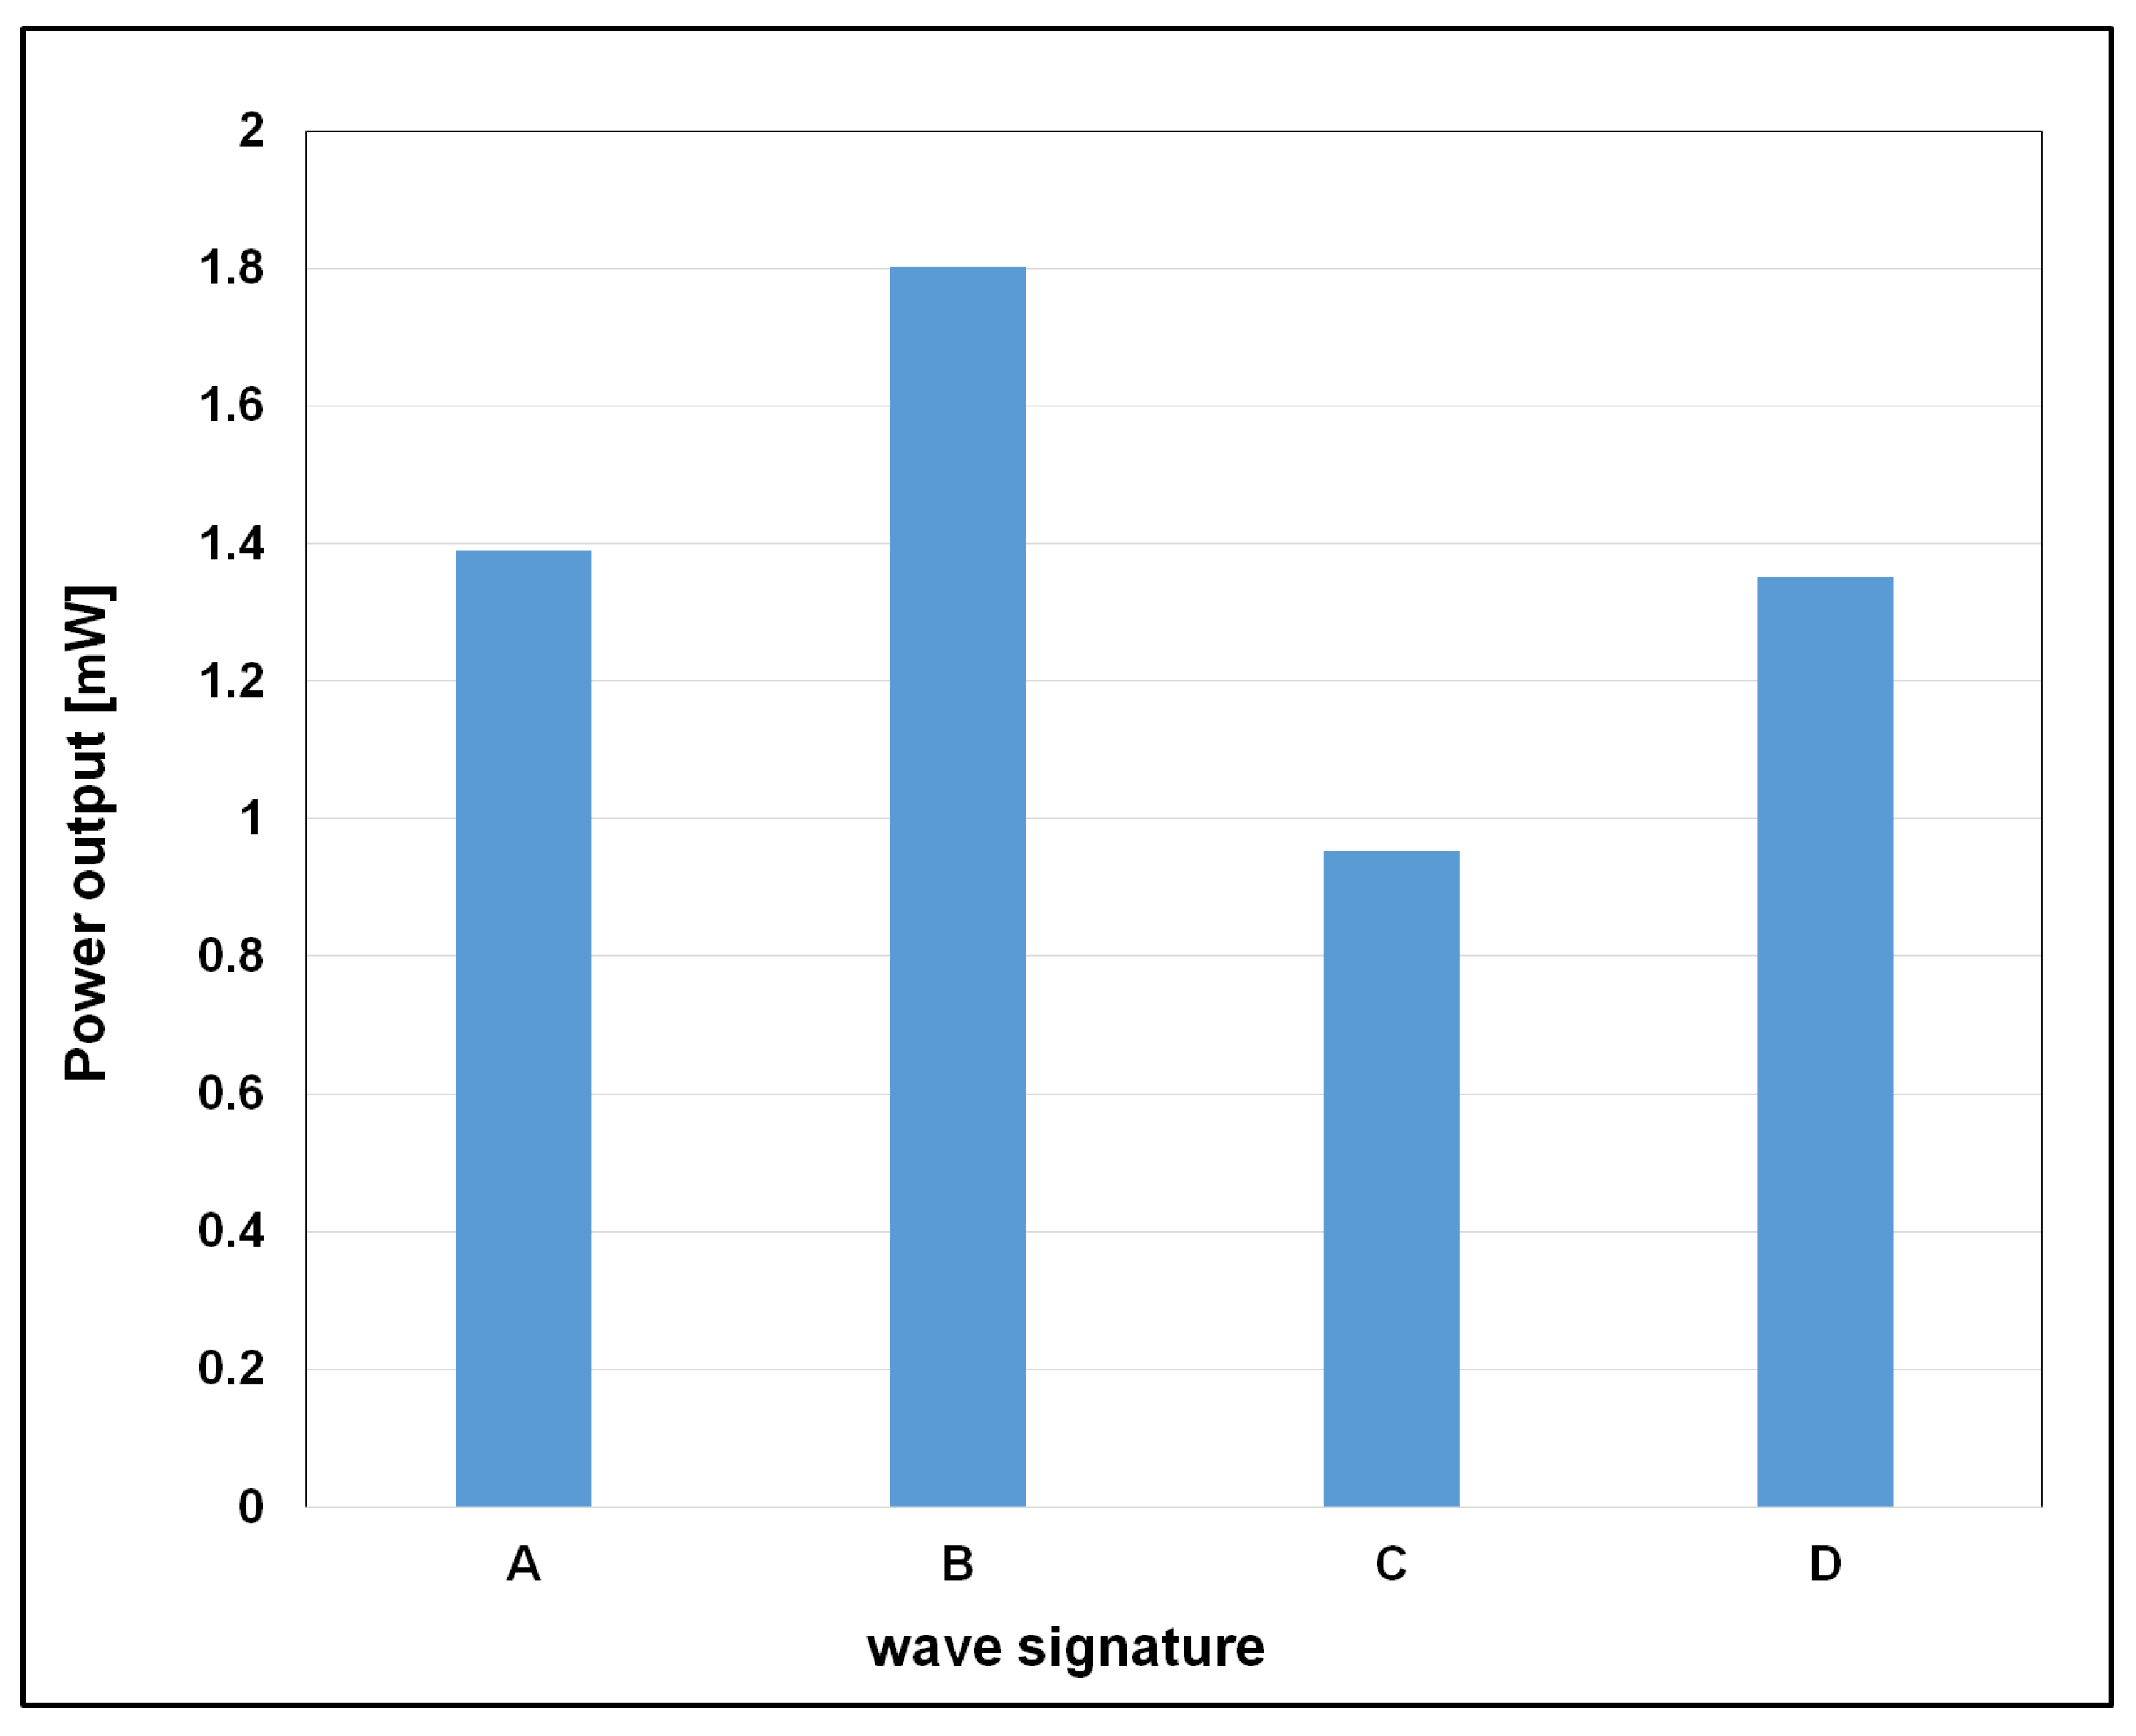
Figure 20 presents the impact of the wave signature on the power output. It is worth mentioning here that the power output was calculated based on formula P = VI, where V is voltage, and I is the current. The estimation of power output was based on the time-averaged values of the measured voltage and current. To ensure representative results, averaging was carried out over a 185 s interval, while the initial 15 s of data was excluded. This omission was intended to minimize the influence of transient effects associated with wave initialization, which could otherwise introduce irregularities or outliers into the dataset.
The findings of the present research indicate that the power output of the proposed oscillating water column (OWC) system lies within the range of 0.95 mW to 1.8 mW. When compared to values reported in the literature, which typically range from 0.002 mW to 1.14 mW for piezoelectric energy-harvesting OWCs [67,76], the results obtained here demonstrate a noticeable improvement. This discrepancy can be attributed to the novel structural configuration adopted in this study, in which a vertical OWC is combined with an inclined OWC. This hybrid configuration enhances the hydrodynamic interaction between the incident waves and the air column, leading to greater pressure fluctuations and consequently higher energy transfer to the piezoelectric membranes. The higher output observed, therefore, not only corroborates the validity of the design concept but also provides experimental evidence supporting the initial hypothesis of this research: that coupling vertical and inclined OWCs can significantly improve overall performance. In this context, the present results contribute to advancing the understanding of design strategies for maximizing the efficiency of piezoelectric energy-harvesting OWCs.
The analysis of the power output shows once again the impact of the nonlinear incident wave, air compressibility, and their interaction on the nonlinear hydrodynamic efficiency of the oscillating water column and thus, the OWC’s nonlinear power output. As shown in Figure 20, the OWC power output exhibits nonlinear behavior due to the nonlinear behavior of the wave signature. However, in spite of the quasi-linear increase in the wave’s amplitude, the OWC power output exhibits a nonlinear trend, as shown in Figure 20, and this is due to the air compressibility effects.
In order to prove that the air is compressible inside the OWC chamber, an analysis was performed based on the analytical approach developed for the quantification of air compressibility in [77]. Therefore, in [77], an analytical approach was developed for the calculation of the compressibility number (Ω) inside the OWC chamber. The study showed that the compression number is a good indicator of the importance of air compressibility, with respect to the OWC characteristics [77]. The study also showed that the energy efficiency of the OWC depends on the compressibility number (Ω) [77]. However, the study also showed that there are certain limitations of the analytical approach, mainly due to the nonlinearities in the air compression response, nonlinearities associated with the incident wave, the absence of the free-surface dynamics, and lastly, the assumption of regular waves [77]. Since most of the waves are random, these assumptions may provide slightly different results.
The compression number is given by Equation (3):
Ω = tan 1 π 2 α η
where α η is calculated as the phase difference between the signal of the pressure and the free surface elevation, considering the primary harmonic of the wave motion [77]. The compression number was derived based on the linear theory, using the thermodynamic equations of the air phase. The study showed that when Ω < 0.1 , the air flow is incompressible, while for Ω 0.1 , the air flow is compressible. The experimental calculation of the phase difference α η was performed as follows. A pressure sensor was used to measure the pressure inside the chamber, while the wave elevation was recorded. The Fast Fourier Transform (FFT) was applied to both signals to identify the primary harmonic. Next, the phase (argument of complex FFT output) was extracted for each signal at that frequency according to Equation (4).
α η = ϕ p r e s s u r e ϕ e l e v a t i o n
A summary of the results of the present research is presented in Table 6. Based on the assumption that for Ω 0.1 , the air flow is compressible, the current analysis shows that the air flow is compressible for all wave signatures. It is worth mentioning here that due to the nonlinear nature of the turbulence, which is the dominant feature of the incident wave, the compression number also exhibits a nonlinear behavior with the wave signature. However, in spite of its nonlinear behavior, the compression number is higher than 0.1 for all wave signatures, and thus, it proves that the air is compressible for all wave signatures. The nonlinear behavior of the compression number is also reflected in the energy output, since the air compressibility is an important factor in the energy conversion efficiency. Although the values of compression number are in the lower range of compressibility, the present research shows that the air compressibility is an important parameter that needs to be taken into account in the design of OWC.

5. Discussion

The present study investigates the influence of wave signature characteristics on the performance of an oscillating water column (OWC) wave energy converter. The results reveal complex and nonlinear interactions between the incident wave, the water column motion, the compressible air phase within the OWC chamber, and the energy conversion mechanism. The discussion is structured around key findings regarding wave signature effects, nonlinear system behavior, air compressibility, and implications for energy efficiency and OWC design.

5.1. Influence of Wave Signature Characteristics on OWC Response

The analysis of four distinct wave signatures (A–D) demonstrates that wave shape, amplitude, and frequency play a pivotal role in determining the voltage output of the OWC. Each wave profile exhibited a unique set of features, including symmetry, steepness, and crest–trough timing, all of which contributed to varied hydrodynamic responses. Wave signature A, exhibiting relatively symmetric and low-amplitude behavior, resulted in the most stable voltage response with minimal fluctuations and an average peak output of 308 mV. In contrast, wave signatures B, C, and D introduced increased asymmetry and nonlinearities, primarily through earlier trough encounters, sharper slopes, and higher amplitudes. Notably, wave signature C produced the highest average voltage output of 307 mV, suggesting that a moderate increase in wave steepness and hydrodynamic force enhances energy conversion. However, wave signature D, despite exhibiting the highest wave amplitude (crest: 12.75 mm; trough: −27 mm), did not yield the highest voltage. This observation emphasizes the nonlinear nature of the OWC response and indicates the presence of dissipative mechanisms, such as turbulent losses, that may reduce effective energy capture. The wave signature profiles are in good agreement with those observed in previous studies of OWC [67,76]. However, the differences in wave amplitude and wave period are due to scaling effects, since those experiments were conducted in larger wave tanks. These studies also showed the presence and importance of hydrodynamic wave nonlinearities in the OWC model test experiments [67]. Moreover, the study showed that the control of nonlinearities in OWC laboratory experiments is a challenging task [66,67,76]. Similar observations were made in the present study, which showed that the nonlinearities increase with the wave height, a result that was also observed in [20,67,76]. Our study also showed that variation of the wave shape profile is also governed by the degree of wave nonlinearity, and this was also observed in previous studies [67,76].

5.2. Nonlinearities in the OWC System

Across all wave conditions, the system exhibited strongly nonlinear behavior in both hydrodynamic response and voltage output. Several coupled effects are responsible for this:
  • Wave asymmetry and steep slopes introduced rapid transitions in hydrodynamic loading, affecting water column motion.
  • Air compressibility within the OWC chamber contributed to phase lags and damping, altering pressure propagation and energy conversion timing.
  • Wave–structure interactions, particularly wave impact on the OWC front wall and slamming loads, result in energy dissipation.
The observed voltage profiles in each trial showed large oscillations before and after the maximum output, attributed to complex water–air interactions. The timing of the peak voltage output, consistently observed at t = 61.2 s across all signatures, corresponds to the moment of maximum air compressibility and pressure exerted on the piezoelectric membrane. Overall, the present study identified that hydro-aerodynamic interactions between the water column and air impact the OWC performance, and thus the power output. This result is consistent with the findings in previous studies that also showed that nonlinear hydro-aerodynamics interaction is of critical importance in the design of OWC [20,67,76].

5.3. Air Compressibility and Compression Number Analysis

The role of air compressibility was further examined using the dimensionless compression number (Ω). Values of Ω ranging from 0.437 to 0.513 were obtained across all wave signatures, confirming that air behaves as a compressible medium (Ω > 0.1) within the chamber. While wave signature B exhibited the highest Ω (0.513), it did not yield the highest energy output, indicating that compressibility alone does not govern energy conversion efficiency. This suggests that air compressibility must be interpreted within the context of wave dynamics, chamber geometry, and transient flow behavior. Moreover, the nonlinear variation in Ω reflects the influence of turbulent structures and unsteady airflow, which were not fully captured by linearized theoretical models used in prior work [77]. The present study shows that the air compressibility plays a critical role in the overall performance of the OWC since it is the main driver of the PTO. The study also showed that the wave signature has a significant impact on the air compressibility and further impacts the OWC performance. Studies showed that the magnitude of the air compressibility at the laboratory experimental scale can be amplified by 15% at the prototype scale [20].

5.4. Secondary Voltage Peaks and Bidirectional Energy Capture

In addition to the primary voltage peak, secondary peaks were consistently observed following the initial air compression. These are attributed to the decompression phase as the water column descends and releases pressure from the chamber. Particularly in wave signatures C and D, these secondary peaks were significant and occurred at earlier times compared to A and B, aligning with the more energetic nature of the incident waves. This bidirectional energy contribution—compression during ascent and decompression during descent—represents an opportunity for future OWC designs to improve energy capture by optimizing for both phases of water column motion.

5.5. Energy Output Behavior and Design Implications

The power output, as illustrated in Figure 19, followed a nonlinear trend with respect to wave amplitude. Although a general increase in energy output was observed with increasing wave intensity, the response was not linear, particularly beyond the conditions associated with wave signature C. The reduced performance of wave signature D suggests a threshold beyond which additional wave energy leads to enhanced dissipation rather than productive conversion.
These findings have several implications for OWC system design:
  • Wave profile tuning is essential; optimal energy capture may occur under moderate wave conditions rather than extreme wave heights.
  • Chamber design should account for compressibility-induced phase shifts, enabling better synchronization between wave forcing and pressure buildup.
  • Structural resilience to hydrodynamic-induced loads must be considered to avoid performance degradation under highly nonlinear wave conditions.
  • Energy recovery from decompression cycles could be harnessed with bidirectional turbines or adaptive damping systems.

5.6. Uncertainty Analysis

The statistical analysis of the experimental data revealed a degree of variability across the three trials for all wave signatures, as reflected in the calculated experimental standard deviation of the mean   s ( x ¯ ) in Table 5. These results indicate that although the experimental setup and procedures remained consistent across trials, some degree of experimental uncertainty persists. The differences in   s ( x ¯ ) between trials can be attributed to several factors. Firstly, wave conditions such as amplitude and period are inherently dynamic and can introduce inconsistencies even under controlled laboratory conditions. Secondly, wave–structure interactions in oscillating water column (OWC) systems are governed by complex hydrodynamic and hydro-aerodynamic phenomena, many of which are nonlinear and sensitive to initial and boundary conditions. Thirdly, scale effects may also contribute to the observed variability, especially when translating physical model results to real-world applications. These findings align with previous studies that have demonstrated similar levels of variability in laboratory-scale OWC experiments [20]. Notably, differences in the range of 15–30% have been reported in controlled experimental conditions across different laboratories, despite adherence to international testing standards [20,67,76]. Such findings emphasize the need for rigorous uncertainty quantification in experimental hydrodynamics, particularly when data is used for design validation or numerical model calibration. While the variability observed in this study is not excessively large, its presence reinforces the necessity of including uncertainty assessments in experimental designs. Failure to do so may lead to overconfidence in performance predictions or inadequate design margins. The values of s ( x ¯ ) observed here provide a useful benchmark for future experimental campaigns and highlight the importance of repeatability, sensitivity analysis, and comprehensive error propagation methods in the testing of wave energy conversion devices. Ultimately, the inclusion of statistical uncertainty metrics strengthens the overall reliability of experimental findings and ensures that the performance assessments of OWC systems are robust and transferable to practical applications.

5.7. Summary of Key Findings

  • The voltage output of an OWC system is highly sensitive to wave signature characteristics, including amplitude, steepness, and frequency.
  • Nonlinear system behavior is driven by interactions among the water column, compressible air, and incident wave, with air compressibility playing a significant but not singular role.
  • The compression number Ω, ranging between 0.437 and 0.513, confirms the compressible nature of the airflow in all tested cases.
  • Secondary voltage peaks, arising from air decompression, suggest that both phases of water motion contribute to energy generation.
  • Wave signature C yielded the highest voltage and energy output, while signature D, despite larger amplitudes, underperformed due to increased turbulence and energy losses.
  • OWC design should prioritize not only wave height but also control of nonlinear dynamics and air–water phase interactions.
  • The trials exhibited variability in results, indicating the presence of experimental uncertainty despite consistent procedures.
  • This study identified several sources of uncertainty: (i) dynamic wave conditions (amplitude and period fluctuations), (ii) complex, nonlinear wave–structure interactions in OWC systems, and (iii) scale effects.
  • The observed variability aligns with previous studies, which reported 15–30% variation even under standardized experimental conditions, underscoring a common challenge in hydrodynamic testing [20].
Overall, this study shows that in spite of the nonlinear behavior of the voltage output, the oscillating water column is a promising wave energy converter that deserves further exploration and development.

6. Conclusions

This study examined the impact of wave signature characteristics on the performance of an oscillating water column (OWC) wave energy converter, with a focus on voltage output, system nonlinearities, and the role of air compressibility. The findings demonstrate that OWC performance is governed by complex, nonlinear interactions between wave dynamics, water column motion, and air behavior within the chamber.
Wave signature analysis revealed that moderate wave conditions with balanced asymmetry and steepness, such as those represented by wave signature C, result in optimal energy conversion. In contrast, extremely energetic waves, exemplified by signature D, induced increased turbulence and energy dissipation, ultimately reducing efficiency despite higher amplitudes. This highlights that maximum wave energy does not necessarily translate to maximum electrical output.
Nonlinearities arising from rapid hydrodynamic transitions and compressible airflow played a central role in shaping the system’s voltage response. The observed compression numbers (Ω ranging from 0.437 to 0.513) confirmed significant compressibility effects across all trials, though these effects alone did not dictate energy performance. Secondary voltage peaks, driven by decompression dynamics, underscored the untapped potential of bidirectional energy harvesting.
The analysis of experimental data in this study underscores the inherent variability present in oscillating water column (OWC) system testing, even under controlled laboratory conditions. The observed standard deviations across trials reflect the influence of dynamic wave conditions, complex wave–structure interactions, and potential scale effects. Despite consistent procedures, these sources of uncertainty highlight the need for rigorous statistical treatment in experimental hydrodynamics. The findings are consistent with prior research and reinforce the importance of including uncertainty quantification in experimental design.
Overall, this study provides valuable insights for the optimization of OWC systems, indicating that design strategies should prioritize not only wave height and frequency, but also chamber geometry, air–water coupling, and energy capture during both compression and decompression phases. These results support the development of more efficient, adaptive, and resilient wave energy converters suitable for a range of ocean environments.

Funding

This research received no funding.

Data Availability Statement

Data is contained within the article.

Conflicts of Interest

The author declares no conflicts of interest.

References

  1. Aderinto, T.; Li, H. Review on power performance and efficiency of wave energy converters. Energies 2019, 12, 4329. [Google Scholar]
  2. Altunkaynak, A.; Çelik, A. A novel Geno-Nonlinear formula for oscillating water column efficiency estimation. Energy 2022, 241, 122513. [Google Scholar]
  3. Amini, E.; Golbaz, D.; Asadi, R.; Nasiri, M.; Ceylan, O.; Nezhad, M.M.; Neshat, M. A comparative study of metaheuristic algorithms for wave energy converter power take-off optimization: A case study for Eastern Australia. J. Mar. Sci. Eng. 2021, 9, 490. [Google Scholar]
  4. Brendmo, A. Linear modelling of oscillating water columns including viscous loss. Appl. Ocean Res. 1997, 18, 65–75. [Google Scholar] [CrossRef]
  5. Çelik, A.; Altunkaynak, A. An in depth experimental investigation into effects of incident wave characteristics front wall opening and PTO damping on the water column displacement and air differential pressure in an OWC chamber. Energy 2021, 230, 120–827. [Google Scholar]
  6. Çelik, A.; Altunkaynak, A. Determination of hydrodynamic parameters of a fixed OWC by performing experimental and numerical free decay tests. Ocean Eng. 2020, 204, 106827. [Google Scholar]
  7. Falcao, A.F.O. Wave energy utilization: A review of the technologies. Renew. Sustain. Energy Rev. 2010, 14, 899–918. [Google Scholar] [CrossRef]
  8. Falcao, A.F.O.; Henriques, J.C.C. Oscillating water column wave energy convertors and air turbines: A review. Renew. Energy 2016, 85, 1391–1424. [Google Scholar]
  9. Falcao, A.F.O.; Henriques, J.C.C. Model-Prototype similarity of oscillating-water-column wave energy converters. Int. J. Marine Energy 2014, 6, 18–34. [Google Scholar] [CrossRef]
  10. Falcao, A.F.O.; Henriques, J.C.C. The spring-like air compressibility effect in oscillating- water-column wave energy converters: Review and analyses. Renew. Sustain. Energy Rev. 2019, 112, 483–498. [Google Scholar] [CrossRef]
  11. Hsieh, M.; Lin, I.; Dorrell, D.G.; Hsieh, M.; Lin, C. Development of a wave energy converter using a two chamber oscillating water column. IEEE Trans. Sustain. Energy 2012, 3, 482–497. [Google Scholar]
  12. Kinoshita, T.; Masuda, K.; Miyajima, S.; Kato, W. Research on the system simulation for a fixed, O.W.C. type wave energy absorber. J. Soc. Nav. Archit. Jpn. 1984, 156, 255–263. [Google Scholar] [CrossRef] [PubMed]
  13. Lopez, I.; Castro, A.; Iglesias, G. Hydrodynamic performance of an Oscillating Water Column wave energy converter by means of particle imaging velocimetry. Energy 2015, 83, 89–103. [Google Scholar] [CrossRef]
  14. Mandev, M.B.; Altunkaynak, A.; Çelik, A. Enhancing wave energy harvesting: Performance analysis of a dual chamber oscillating water column. Energy 2024, 290, 130191. [Google Scholar] [CrossRef]
  15. Mitsumasa, I.; Takeaki, M.; Hiroshi, S.; Makoto, I. Effect of inclination on oscillation characteristics of an oscillating water column wave energy converter. Ocean. Eng. 2016, 116, 226–235. [Google Scholar]
  16. Mora, A.; Bautista, E.; Mendez, F. Influence of a tapered and slender wave collector on the increment of the efficiency of an oscillating water column wave-energy converter. Ocean Eng. 2017, 129, 20–30. [Google Scholar] [CrossRef]
  17. Ning, D.; Wang, R.; Zhang, C. Numerical simulation of a dual-chamber oscillating water column wave energy converter. Sustainability 2017, 9, 1599. [Google Scholar] [CrossRef]
  18. Ning, D.; Wang, R.; Chen, L.; Sun, K. Experimental investigation of a land-based dual chamber OWC wave energy converter. Renew. Sustain. Energy Rev. 2019, 105, 48–60. [Google Scholar] [CrossRef]
  19. Payne, G.S.; Taylor, J.R.M.; Bruce, T.; Parkin, P. Assessment of boundary- element method for modelling a free-floating sloped wave energy device. Part 1: Numerical modelling. Ocean Eng. 2008, 35, 333–341. [Google Scholar] [CrossRef]
  20. Orphin, J. Uncertainty in Hydrodynamic Model Test Experiments of Wave Energy Coverters. Ph.D. Thesis, University of Tasmania, Dynnyrne, Australia, 2020. [Google Scholar] [CrossRef]
  21. Sheng, W. Wave energy conversion and hydrodynamics modelling technologies: A review. Renew. Sustain. Energy Rev. 2019, 109, 482–498. [Google Scholar] [CrossRef]
  22. Sheng, W.; Alcorn, R.; Lewis, T. Physical modelling of wave energy converters. Ocean Eng. 2014, 84, 29–36. [Google Scholar] [CrossRef]
  23. Suzuki, M. Numerical methods to predict characteristics of oscillating water column for terminator-type wave energy converter. Int. J. Offshore Polar Eng. 2005, 15, 5381. [Google Scholar]
  24. Vicinanza, D.; Di Lauro, E.; Contestabile, P.; Gisonni, C.; Lara, J.L.; Losada, I.J. Review of innovative harbor breakwaters for wave-energy conversion. J. Waterw. Port Coast Ocean Eng. 2019, 145, 3119001. [Google Scholar] [CrossRef]
  25. Viviano, A.; Naty, S.; Foti, E. Scale effects in physical modelling of a generalized OWC. Ocean Eng. 2018, 162, 248–258. [Google Scholar] [CrossRef]
  26. Zhang, Y.; Zou, Q.-P.; Greaves, D. Air-water two phase flow modelling of hydrodynamic performance of an oscillating water column device. Renew. Energy 2012, 41, 159–170. [Google Scholar] [CrossRef]
  27. Zhou, Y.; Ning, D.; Chen, L.; Iglesias, G. Nonlinear hydrodynamic modeling of an offshore stationary multi-oscillating water column platform. Ocean Eng. 2021, 227, 108–919. [Google Scholar] [CrossRef]
  28. Wang, C.; Zhang, Y. Performance enhancement for a dual-chamber OWC conceived from side wall effects in narrow flumes. Ocean Eng. 2022, 247, 110552. [Google Scholar] [CrossRef]
  29. Dimakopoulos, A.S.; Cooker, M.J.; Bruce, T. The influence of scale on the air flow and pressure in the modelling of Oscillating Water Column Wave Energy Converters. Int. J. Mar. Energy 2017, 19, 272–291. [Google Scholar] [CrossRef]
  30. Mia, M.R.; Zhao, M.; Wu, H.; Palmer, H. Numerical simulation of a stationary offshore multi-chamber OWC wave energy converter. Ocean Eng. 2022, 265, 112546. [Google Scholar] [CrossRef]
  31. Rezanejad, K.; Gadelho, J.; Xu, S.; Soares, C.G. Guedes Soares, Experimental investigation on the hydrodynamic performance of a new type floating Oscillating Water Column device with dual-chambers. Ocean Eng. 2021, 234, 109307. [Google Scholar] [CrossRef]
  32. Boccotti, P. Comparison between a U-OWC and a conventional OWC. Ocean Eng. 2007, 34, 799–805. [Google Scholar] [CrossRef]
  33. Ning, D.; Zhou, Y.; Zhang, C. Hydrodynamic modeling of a novel dual-chamber OWC wave energy converter. Appl. Ocean. Res. 2018, 78, 180–191. [Google Scholar] [CrossRef]
  34. Samak, M.M.; Elgamal, H.; Elmekawy, A.M.N. Nagib Elmekawy, The contribution of L-shaped front wall in the improvement of the oscillating water column wave energy converter performance. Energy 2021, 226, 120421. [Google Scholar] [CrossRef]
  35. Qu, M.; Yu, D.; Xu, Z.; Gao, Z. The effect of the elliptical front wall on energy conversion performance of the offshore OWC chamber: A numerical study. Energy 2022, 255, 124428. [Google Scholar] [CrossRef]
  36. Yamaç, H.I.; Koca, A. Shore type effect on onshore wave energy converter performance. Ocean Eng. 2019, 190, 106494. [Google Scholar] [CrossRef]
  37. Hayati, M.; Nikseresht, A.H.; Haghighi, A.T. Sequential optimization of the geometrical parameters of an OWC device based on the specific wave characteristics. Renew. Energy 2020, 161, 386–394. [Google Scholar] [CrossRef]
  38. Guo, B.; Ning, D.; Wang, R.; Ding, B. Hydrodynamics of an oscillating water column WEC—Breakwater integrated system with a pitching front-wall. Renew. Energy 2021, 176, 67–80. [Google Scholar] [CrossRef]
  39. Wang, C.; Zhang, Y.; Deng, Z. Wave power extraction for an oscillating water column device consisting of a surging front and back lip-wall: An analytical study. Renew. Energy 2022, 184, 100–114. [Google Scholar] [CrossRef]
  40. Wang, C.; Zhang, Y. Wave power extraction analysis for an oscillating water column device with various surging lip-walls. Ocean Eng. 2021, 220, 108483. [Google Scholar] [CrossRef]
  41. Deng, Z.; Wang, C.; Wang, P.; Higuera, P.; Wang, R. Hydrodynamic performance of an offshore-stationary OWC device with a horizontal bottom plate: Experimental and numerical study. Energy 2019, 187, 115941. [Google Scholar] [CrossRef]
  42. Hasanabad, M.G. Free Surface Modeling in OWC Chamber with Parabolic Side Walls Using 3D BEM. AIP Conf. Proc. 2015, 1648, 770005. [Google Scholar]
  43. Mia, M.R.; Zhao, M.; Wu, H.; Munir, A. Numerical investigation of offshore oscillating water column devices. Renew. Energy 2022, 191, 380–393. [Google Scholar] [CrossRef]
  44. Malmo, O.; Reitan, A. Wave-power absorption by an oscillating water column in a reflecting wall. Appl. Ocean. Res. 1986, 8, 842–848. [Google Scholar] [CrossRef]
  45. Rezanejad, K.; Bhattacharjee, J.; Guedes Soares, C. Analytical and numerical study of dual-chamber oscillating water columns on stepped bottom. Renew. Energy 2015, 75, 272–282. [Google Scholar] [CrossRef]
  46. Rashidi, S.; Nikseresht, A.H. Numerical investigation of the response of the hybrid wave energy converter including oscillating water column and horizontal floating cylinder to irregular waves. Energy 2024, 301, 131717. [Google Scholar] [CrossRef]
  47. Felice, A.; Malara, G.; Romolo, A.; Vannucchi, V. Monitoring of the REWEC3 full scale model for the energy conversion from the motion of sea waves. In Proceedings of the 11th European Wave and Tidal Energy Conference (EWTEC), Nantes, France, 6–11 September 2015. [Google Scholar]
  48. Boccotti, P. On a new wave energy absorber. Ocean Eng. 2007, 34, 772–779. [Google Scholar] [CrossRef]
  49. Henriques, C.; Gato, L.; Falcão, A. Dynamics and optimization of the U-OWC (U-shaped oscillating water column) wave energy converter. Renew. Energy 2012, 39, 371–379. [Google Scholar]
  50. Moretti, G.; Tognarelli, M.; Vicinanza, D. CFD analysis of air chamber dynamics in U-shaped OWC seawalls. Appl. Ocean Res. 2020, 96, 102006. [Google Scholar]
  51. Setoguchi, T.; Santhakumar, S.; Maeda, H.; Takao, M.; Kaneko, K. A review of impulse turbines for wave energy conversion. Renew. Energy 2001, 23, 261–271. [Google Scholar] [CrossRef]
  52. Takahashi, S.; Utsunomiya, T.; Hotta, H. Development of wave energy converter combined with breakwater. In Proceedings of the International Conference on Coastal Engineering, Venice, Italy, 4–9 October 1992; pp. 2902–2915. [Google Scholar]
  53. Vicinanza, D.; Contestabile, P.; Ferrante, V. Wave energy potential in the north-west of Sardinia (Italy). Renew. Energy 2014, 50, 506–521. [Google Scholar] [CrossRef]
  54. Whittaker, T.; Raghunathan, S. The Wells air turbine: A review. Int. J. Ambient Energy 1996, 17, 81–92. [Google Scholar]
  55. Mandev, M.B.; Altunkaynak, A. Cylindrical frontwall entrance geometry optimization of an oscillating water column for utmost hydrodynamic performance. Energy 2023, 280, 128147. [Google Scholar] [CrossRef]
  56. Li, Y.; Liu, S.; Xu, C.; Li, D.; Shi, H. Experimental study on the cylindrical oscillating water column device. Ocean Eng. 2022, 246, 110523. [Google Scholar] [CrossRef]
  57. Mia, M.R.; Zhao, M.; Wu, H.; Munir, A. Numerical investigation of scaling effect in two-dimensional oscillating water column wave energy devices for harvesting wave energy. Renew. Energy 2021, 178, 1381–1397. [Google Scholar] [CrossRef]
  58. Moretti, G.; Malara, G.; Scialo, A.; Daniele, L.; Romolo, A.; Vertechy, R.; Fontana, M.; Arena, F. Modelling and field testing of a breakwater-integrated U-OWC wave energy converter with dielectric elastomer generator. Renew. Energy 2020, 146, 628–642. [Google Scholar] [CrossRef]
  59. Ahmed, R.; Hasan, M.N.; Rahman, M.T.; Lee, S.; Kim, H.S. Recent advances in piezoelectric energy harvesting technologies for biomedical applications. Micromachines 2023, 14, 345. [Google Scholar]
  60. Pradhan, A.; Chen, Z.; Pan, C. Recent advances in flexible piezoelectric energy harvesters for self-powered wearable devices. Adv. Compos. Hybrid. Mater. 2025, 8, 123–138. [Google Scholar]
  61. Yao, Y.; Li, H.; Wang, J.; Xu, Y. Design and performance of flexible piezoelectric energy harvesters for wearable electronics. Nano Energy 2023, 110, 107456. [Google Scholar]
  62. Naqvi, A.; Ali, A.; Altabey, W.A.; Kouritem, S.A. Energy Harvesting from Fluid Flow Using Piezoelectric Materials: A Review. Energies 2022, 15, 7424. [Google Scholar] [CrossRef]
  63. Baghbani Kordmahale, S.; Do, J.; Chang, K.-A.; Kameoka, J. A Hybrid Structure of Piezoelectric Fibers and Soft Materials as a Smart Floatable Open-Water Wave Energy Converter. Micromachines 2021, 12, 1269. [Google Scholar] [CrossRef]
  64. Du, X.; Chen, H.; Li, C.; Li, Z.; Wang, W.; Guo, D.; Yu, H.; Wang, J.; Tang, L. Wake galloping piezoelectric-electromagnetic hybrid ocean wave energy harvesting with oscillating water column. Appl. Energy 2024, 353, 122081. [Google Scholar] [CrossRef]
  65. Li, X.; Sui, Y.; Meng, Y.; Zhang, X.; Khayyer, A.; He, M.; Liang, D. Theory for plunger-type wavemakers to generate second-order Stokes waves and Smoothed Particle Hydrodynamics verification. Appl. Ocean. Res. 2024, 153, 104244. [Google Scholar] [CrossRef]
  66. Boccotti, P.; Filianoti, P.; Fiamma, V.; Arena, F. Caisson breakwaters embodying an OWC with a small opening—Part II: A small-scale field experiment. Ocean Eng. 2007, 34, 820–841. [Google Scholar] [CrossRef]
  67. Orphin, J.; Schmitt, P.; Nader, J.; Penesis, I. Experimental investigation into laboratory effects of an OWC wave energy converter. Renew. Energy 2022, 186, 250–263. [Google Scholar] [CrossRef]
  68. Dean, R.G.; Dalrymple, R.A. Water Wave Mechanics for Engineers & Scientists, Advanced Series on Ocean Engineering—Volume 2; World Scientific Publishing Company: Singapore, 1991. [Google Scholar]
  69. Holthuijsen, L.H. Waves in Oceanic and Coastal Waters, 1st ed.; Cambridge University Press: Cambridge, UK, 2010. [Google Scholar]
  70. Lowell, S.; McPhee, J.; Irani, R.A. Plunger-type wave makers with flow: Sensitivity analysis and experimental validation. Appl. Ocean Res. 2022, 121, 103065. [Google Scholar] [CrossRef]
  71. Çelik, A.; Altunkaynak, A. Experimental investigations on the performance of a fixed-oscillating water column type wave energy converter. Energy 2019, 188, 116071. [Google Scholar] [CrossRef]
  72. Mandev, M.B.; Çelik, A.A.; Altunkaynak, A. Maximizing oscillating water column efficiency: The impact of vertical plate and guide vane. Energy 2024, 308, 132901. [Google Scholar] [CrossRef]
  73. Raj, D.D.; Sundar, V.; Sannasiraj, S.A. Enhancement of hydrodynamic performance of an Oscillating Water Column with harbor walls. Renew. Energy 2019, 132, 142–156. [Google Scholar]
  74. Xu, C.; Liu, Z.; Tang, G. Experimental study of the hydrodynamic performance of a U-oscillating water column wave energy converter. Ocean Eng. 2022, 265, 112598. [Google Scholar] [CrossRef]
  75. Zhu, G.; Samuel, J.; Zheng, S.; Hughes, J.; Simmonds, D.; Greaves, D. Numerical investigation on the hydrodynamic performance of a 2D U-shaped Oscillating Water Column wave energy converter. Energy 2023, 274, 127357. [Google Scholar] [CrossRef]
  76. Orphin, J.; Nader, J.; Penesis, I. Uncertainty analysis of a WEC model test experiment. Renew. Energy 2021, 168, 216–233. [Google Scholar] [CrossRef]
  77. Wang, C.; Zhang, Y.; Deng, Z.A. A novel dual-chamber oscillating water column system with dual lip-wall pitching motions for wave energy conversion. Energy 2022, 246, 123319. [Google Scholar] [CrossRef]
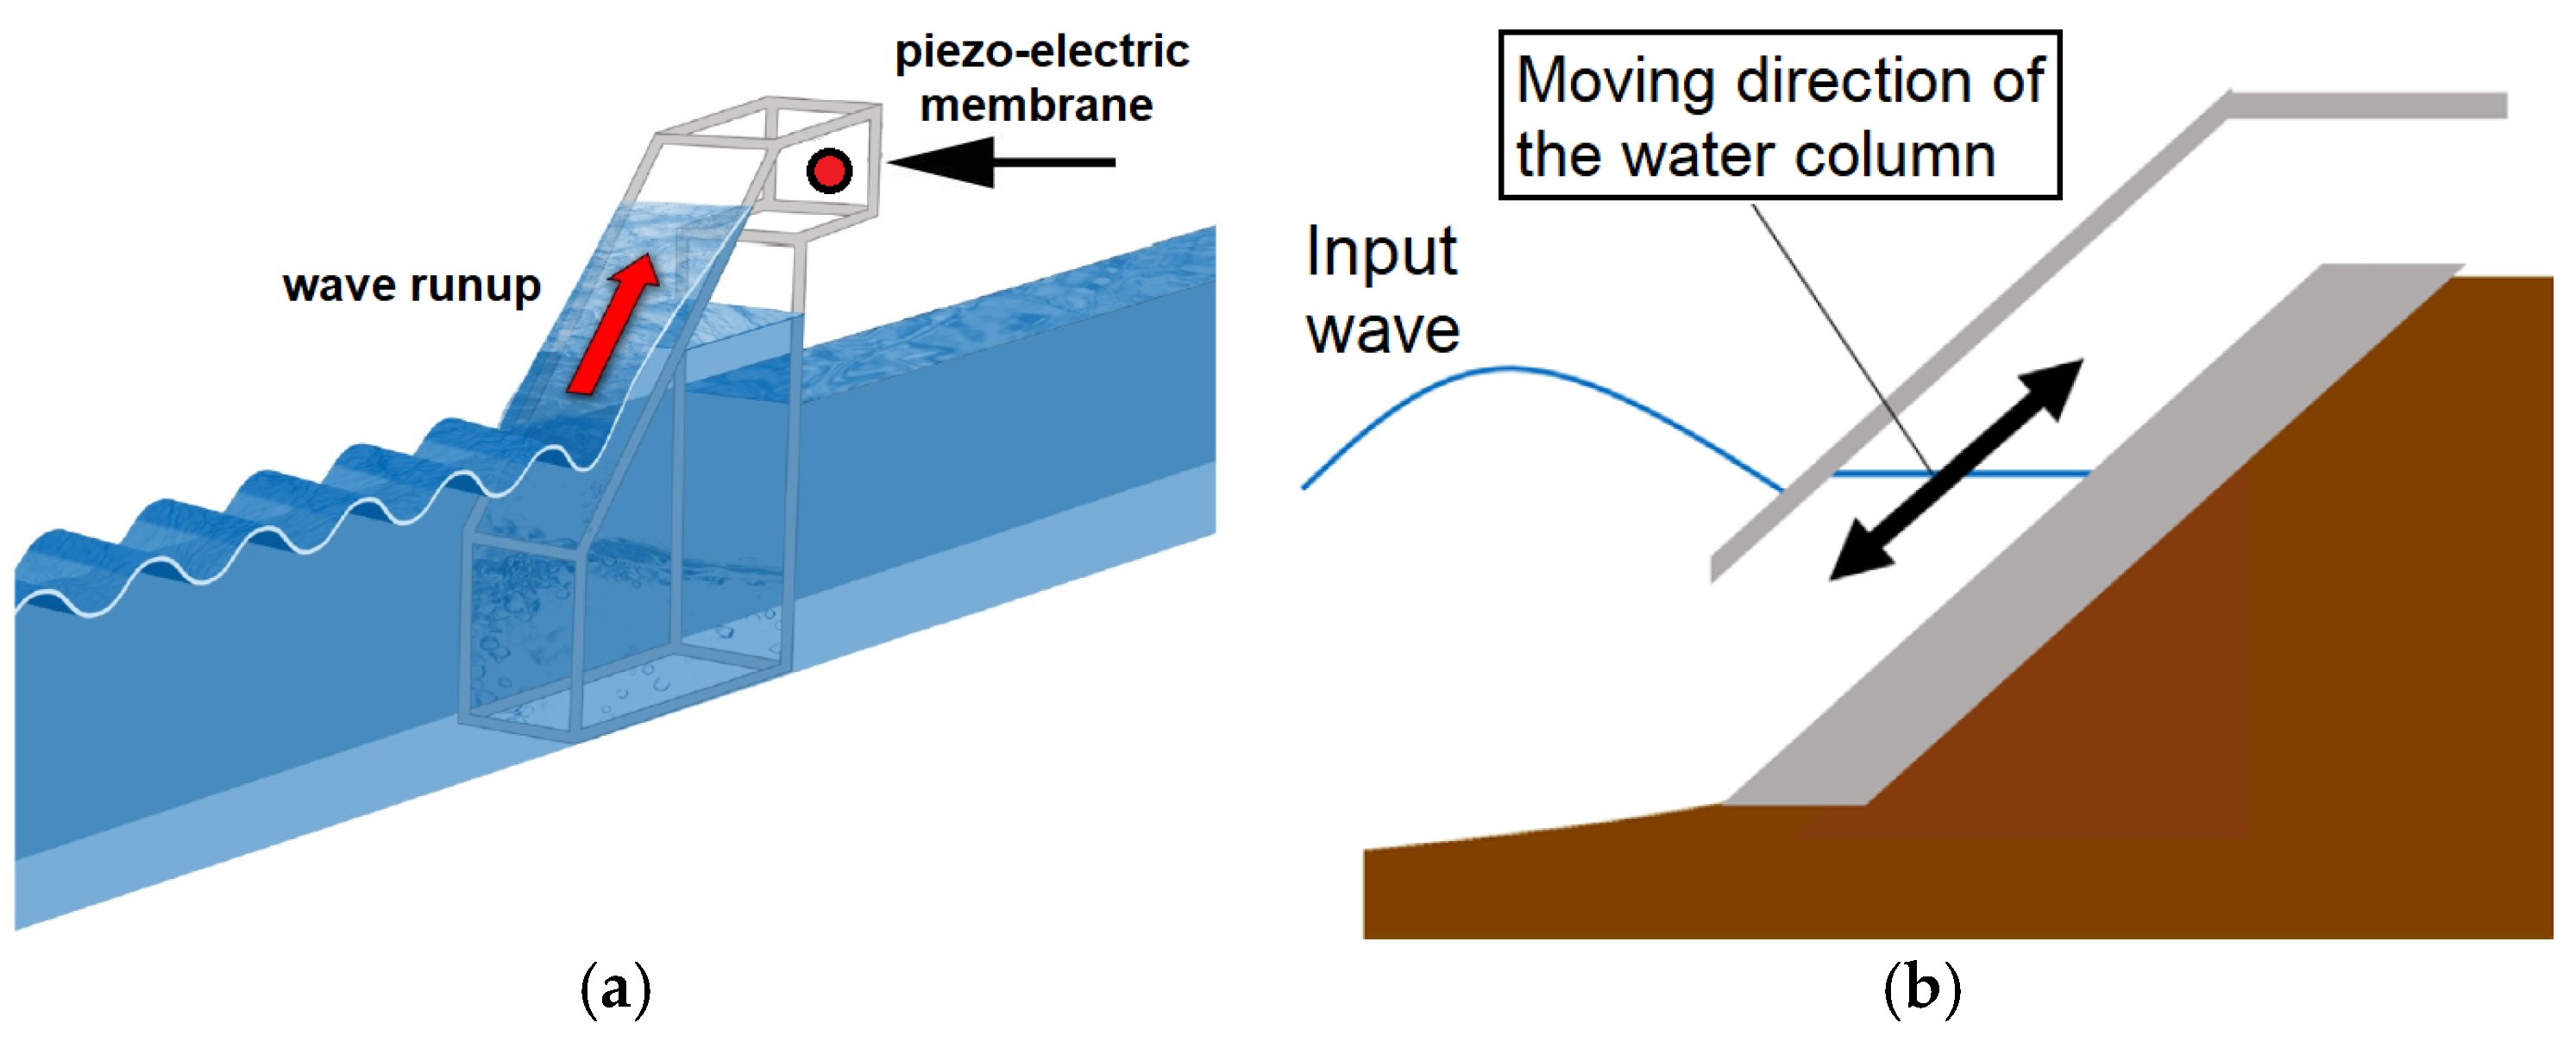
Figure 1. Schematic of the experimental setup for the study of oscillating water column. (a) Schematic of OWC [14]. (b) Schematic of the water column [15].
Vibration 08 00054 g001
Figure 2. Design details of the plunge-type wave maker.
Vibration 08 00054 g002
Figure 3. Plunger-type wave maker; min/max stoke displacements. (a) Plunger’s downward displacement. (b) Plunger’s upward displacement.
Vibration 08 00054 g003
Figure 4. Experimental setup for the study of oscillating water column. (a) Wave tank. (b) Data-acquisition.
Vibration 08 00054 g004
Figure 5. Electrical circuit diagram.
Vibration 08 00054 g005
Figure 6. Design of the lab-scale oscillating water column. (a) Iso-view of the CAD model. (b) Iso-view of the lab-scale model.
Vibration 08 00054 g006
Figure 7. Detailed design of the lab-scale oscillating water column.
Vibration 08 00054 g007
Figure 8. Wave signature. (a) Wave signature A. (b) Wave signature B. (c) Wave signature C. (d) Wave signature D.
Vibration 08 00054 g008
Figure 9. Characteristics of time-varying wave signatures.
Vibration 08 00054 g009
Figure 10. Comparsion of time-varying OWC voltage output for wave signature A.
Vibration 08 00054 g010
Figure 11. Averaged time-varying OWC voltage output for wave signature A.
Vibration 08 00054 g011
Figure 12. Comparison of time-varying OWC voltage output for wave signature B.
Vibration 08 00054 g012
Figure 13. Averaged time-varying OWC voltage output for wave signature B.
Vibration 08 00054 g013
Figure 14. Comparison of time-varying OWC voltage output for wave signature C.
Vibration 08 00054 g014
Figure 15. Averaged time-varying OWC voltage output for wave signature C.
Vibration 08 00054 g015
Figure 16. Comparison of time-varying OWC voltage output for wave signature D.
Vibration 08 00054 g016
Figure 17. Average time-varying OWC voltage output for wave signature D.
Vibration 08 00054 g017
Figure 18. The impact of wave signature on the OWC voltage output.
Vibration 08 00054 g018
Figure 19. The impact of wave signature on the OWC current output.
Vibration 08 00054 g019
Figure 20. OWC power output function of wave signature.
Vibration 08 00054 g020
Table 1. Encounter times of wave’s crest and trough.
Wave SignatureEncounter Times (s)
CrestTroughTime Span (s)
A30 s90 s60 s
B31.5 s51 s19.5 s
C10.5 s27 s16.5 s
D9 s27 s18 s
Table 2. Wave period.
Wave SignatureWave Period (T)
A126 s
B105 s
C84 s
D54 s
Table 3. Wave steepness.
Wave SignatureWave Steepness
Descending Ascending
A−87.36°86.83°
B−88.54°87.92°
C−89.20°87.27°
D−89.35°89.46°
Table 4. Wave power density.
Wave SignatureWave Power Density (W/m)
A0.1
B0.069
C0.0886
D0.0673
Table 5. Wave standard deviation of the mean s ( x ¯ ) .
Trial Number Wave   Standard   Deviation   of   the   Mean   s ( x ¯ )
AB CD
13.723.894.234.93
24.834.175.125.82
34.274.344.826.12
Table 6. Analysis of compression number.
Wave SignatureW
A0.461
B0.513
C0.437
D0.453
Disclaimer/Publisher’s Note: The statements, opinions and data contained in all publications are solely those of the individual author(s) and contributor(s) and not of MDPI and/or the editor(s). MDPI and/or the editor(s) disclaim responsibility for any injury to people or property resulting from any ideas, methods, instructions or products referred to in the content.