Article

Damage Identification in Beams via Contourlet Transform of Shearography Modal Data

by
Ali Mohammad Mohammadi
1,
Atefeh Soleymani
1,
Hashem Jahangir
2,*,
Mohsen Khatibinia
2,
José Viriato Araújo dos Santos
3,* and
Hernâni Miguel Lopes
4
1
Department of Civil Engineering, University of Birjand, Birjand 97174-34765, Iran
2
Department of Civil Engineering, Research Group of Novel Technologies in Civil Engineering, University of Birjand, Birjand 97174-34765, Iran
3
IDMEC, Instituto Superior Técnico, Universidade de Lisboa, 1049-001 Lisbon, Portugal
4
Department of Mechanical Engineering, DEM-ISEP, Instituto Politécnico do Porto, 4249-015 Porto, Portugal
*
Authors to whom correspondence should be addressed.
Vibration 2025, 8(3), 53; https://doi.org/10.3390/vibration8030053
Submission received: 18 July 2025 / Revised: 27 August 2025 / Accepted: 16 September 2025 / Published: 21 September 2025

Abstract

This paper presents a novel method for damage identification in aluminum beams using the contourlet transform. Four aluminum beams were used in the study: one was undamaged, while the other three had different damage scenarios. The damage included middle and side slots with depth-to-thickness ratios of 7% and 28%. Damage is identified using the proposed index of contourlet transform of the modal rotations and modal curvatures of the beams for the free-free condition. The beam’s first three modal rotations are directly measured with digital shearography, and the corresponding modal curvatures are obtained through their numerical differentiation. The results indicated that to detect the exact locations and identify damage severities using the proposed damage indices, instead of modal rotations, the modal curvatures should be introduced as the input. Moreover, they revealed that the proposed damage indices need modal data of the undamaged state as a baseline to identify smaller damage. In addition, comparing the proposed contourlet-based damage indices with previously suggested wavelet-based damage detection methods revealed that, although the wavelet-based damage index is more sensitive to damage severity, it also exhibits higher noise levels in undamaged locations. The Tukey windowing process was introduced to address the boundary effect problem.

1. Introduction

Structural health monitoring (SHM) has emerged as a key technology for ensuring structural safety, reliability, and longevity, from bridges to wind turbines [1]. At the core of most SHM systems lies damage identification, which aims to detect, locate, quantify the severity, and predict the effects of material degradation or sudden changes in structural integrity [2]. Timely and accurate damage identification not only prevents human catastrophes but also enables cost-effective maintenance strategies [3]. Among various methods, vibration-based techniques hold a privileged position due to their non-destructive nature, potential for continuous monitoring, and inherent sensitivity of dynamic structural responses to changes in physical parameters (e.g., stiffness, mass, damping) [3,4]. These methods rely on extracting modal parameters, such as natural frequencies, mode shapes, and damping ratios. Variations in these parameters, which are evaluated from structural responses under ambient or controlled excitations, with variations in these parameters serving as damage indicators [5,6]. While significant shifts in natural frequencies may indicate global damage, this parameter often fails to pinpoint localized failures, as local damage might minimally affect dominant low-frequency modes [7]. In contrast, mode shapes and their higher-order derivatives (e.g., modal curvatures) provide richer spatial information about stiffness distribution, offering greater potential for localizing damage [8,9]. Nevertheless, accurately extracting these parameters from complex structures presents a persistent challenge. These include noise interference and the requirement for high sensor density [10]. In recent years, several studies have focused on estimating parameters of uncertain structures using probabilistic approaches, including Bayesian optimal estimation [11,12]. In many SHM scenarios, surface access for impact excitation or sensor installation is impossible in some practical cases [13]. This motivates alternative modal data acquisition methods like digital shearography. This is a non-contact, full-field, high-resolution optical technique that directly measures the derivative of out-of-plane displacements. This derivative serves as a good approximation of the rotation field [14]. As a result, the modal curvature field can be obtained by computing only the first-order derivative of the modal rotation field. This is a significant advantage over other optical techniques that measure only mode shapes, which require a second-order derivative to obtain the modal curvature. Consequently, computing only the first derivative significantly mitigates the propagation and amplification of experimental noise, leading to a better signal-to-noise ratio in the resulting modal curvatures. Moreover, digital shearography presents high sensitivity to damage [15]. Eliminating surface-mounted sensors reduces testing time/costs versus traditional methods [16]. Developed in 1970, its unique advantages establish it as an effective non-destructive testing method today, and utilized in many research works [17,18,19]. Modal analysis plays a critical role in structural health monitoring and damage identification by extracting dynamic characteristics such as natural frequencies, mode shapes, and damping ratios. Recent advancements in automated operational modal identification have enhanced the robustness and accuracy of modal parameter extraction. Notably, Mostafaei and Ghamami [20] provide a comprehensive review of state-of-the-art algorithms, applications, and future perspectives in this field, emphasizing methods like Stochastic Subspace Identification (SSI) and the integration of machine learning techniques. Incorporating these developments strengthens the foundation for vibration-based damage detection methods, including those utilizing shearography and advanced signal transforms such as contourlet and wavelet transforms.
Advanced signal processing is essential for isolating the subtle changes in modal data caused by local damage, such as Wavelet transforms (WT) and Contourlet transform (CT). The WT revolutionized non-stationary signal processing through multiresolution analysis and simultaneous time-frequency (or space-scale) localization [21]. Over the past decade, wavelets have been extensively applied to analyze mode shapes [22]. The WT effectively identified damage by detecting discontinuities in mode shapes or time-domain responses [23,24]. However, their classical version has inherent limitations: First, in higher dimensions (e.g., 2D mode shape images), it only captures information in three directions (horizontal, vertical, diagonal), which is insufficient for detecting damage-related directional features, like crack orientations [25]. Second, the lack of shift-invariance causes result dependency on damage-sensor positioning [26]. Though successful in discontinuity detection, these methods showed serious constraints in identifying directional damage features (e.g., curved cracks in plates) and sensitivity to sensor placement [27]. These shortcomings have driven the development of multidirectional transformations like the contourlet.
The CT, introduced by Do and Vetterli in 2002 [28], combines a Laplacian pyramid (generating multiple scale levels) and a directional filter bank (decomposing each scale into discrete directions). This structure efficiently approximates curve-shaped defects (e.g., crack-induced edges) with far fewer coefficients than the 2D WT [28,29]. Unlike conventional 2D wavelets, which are limited to three directions, contourlets produce up to 2 k distinct directions per scale level–a decisive advantage for detecting oblique damage. This sparse edge representation and high directional sensitivity make contourlets exceptionally powerful for analyzing 2D mode shapes [30]. Experimental studies consistently demonstrate the superiority of contourlets over classical wavelets. Early contourlet applications in SHM focused on processing experimental/simulated mode shapes. For instance, Xu and Chen [31] showed that directional sub-band coefficients could locate transverse cracks in steel beams with less than 3% error, outperforming 2D WT in localization accuracy. Similarly, Zhang et al. [32] proved that contourlets could distinguish adjacent damage zones in concrete slabs, whereas wavelets suffered from merging errors. Rucka [33] introduced a sub-band energy-based damage index that detects cracks as small as 5% of the beam span under 15% noise. Zhou et al. [34] presented the nonsubsampled contourlet transform, which captured geometric information to distinguish noise from weak edges and achieve superior image enhancement compared to wavelet-based methods. Li et al. [35] developed a framework that synergizes precise modal estimation with directional sensitivity by first using accelerometer data to estimate high-resolution mode shapes, then employing contourlet-based feature extraction. Recent work explores advanced contourlet variants and hybrid approaches. He et al. [36] extended contourlets to dynamic time-response data (beyond mode shapes) for complex structures under operational loads, enabling time-frequency-space analysis. Hajizadeh et al. [37] applied the contourlet transform on the first mode shapes of a plate structure and indicated that their proposed damage index can detect the existence, location, and approximate shape of single and multiple damage scenarios in finite element models of plate structures.
While CT shows immense promise in SHM, specifically in damage identification, its application to modal data from digital shearography requires particular attention. Two primary approaches exist for damage identification: baseline and baseline-free. The baseline approach compares a structure’s response in a damaged state to its undamaged state. Conversely, the more challenging baseline-free approach identifies damage solely by detecting anomalies in the damaged state’s response, assuming the structure’s behavior is typically smooth. To address the boundary effect problem and assess the CT ability to detect damage compared to the WT, the current study tests four aluminum beams in undamaged, single-damage, and double-damage states. Figure 1 provides a flowchart of experimental and analytical processes. The modal rotation of the beams for the undamaged θ i and damage θ ~ i states are measured using the digital shearography technique. These measurements were numerically differentiated to obtain the corresponding modal curvatures ( k i   ,   k ~ i ). The modal rotations and curvatures then served as the basis for several proposed damage indices. To identify damage in the beams, these indices were post-processed using the CT and WT, and the results were compared to identify the most effective method. To improve the quality of damage identification and suppress the well-known boundary effect problem, a windowing process was also proposed.

2. Materials and Methods

This section describes the characteristics of the aluminum beams tested for different damage scenarios. It also details the measurement of modal rotation using digital shearography and the computation of modal curvatures. Finally, it introduces the CT as a novel image processing system and defines the proposed damage indices based on it.

2.1. Tested Aluminum Beams

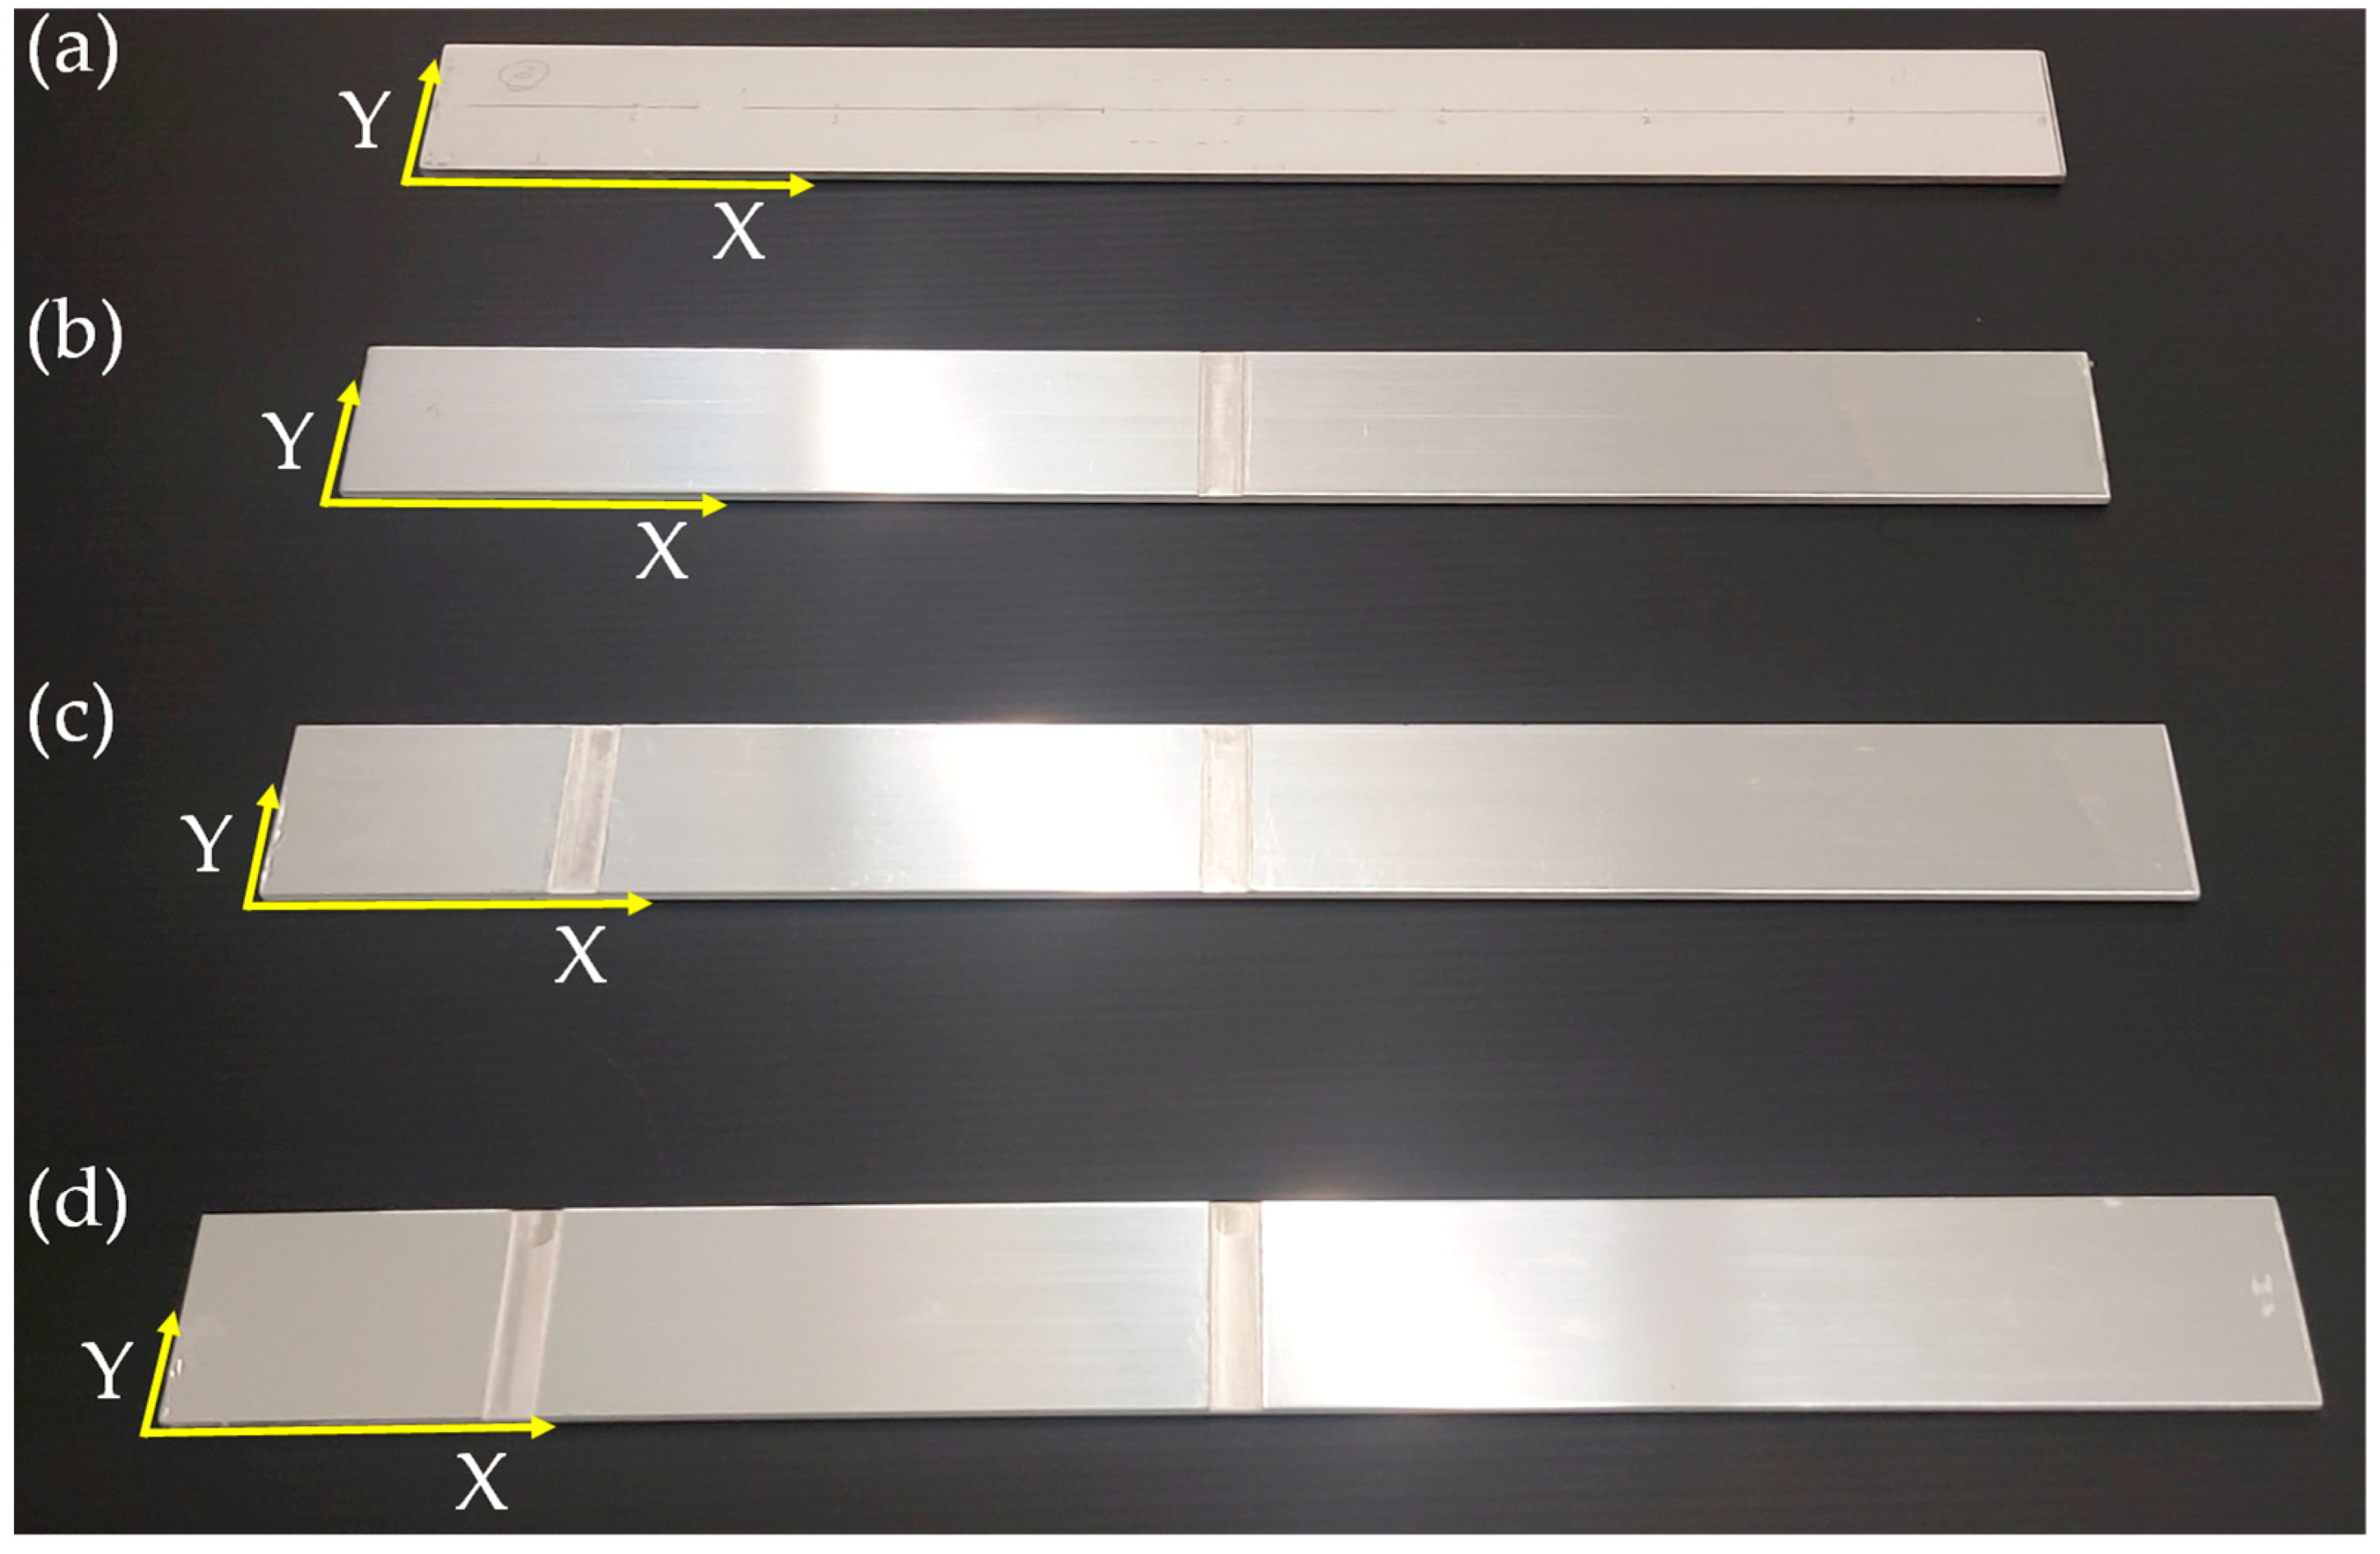
The four aluminum beams tested, as shown in Figure 2, have a length of 400 mm, a width of 40 mm, and a thickness of 2.85 mm. Their mechanical properties are a Young’s modulus of 67.8 GPa and a mass density of 2700 kg/m3. Table 1 provides the geometrical properties for four distinct damage scenarios: an undamaged beam (B0), a single damage at the midpoint (X = 200 mm) with a 7% depth ratio (B1), and two damages with either a 7% depth ratio (B2) or a 28% depth ratio (B3). For the last two scenarios, the damages are located at the midpoint (X = 200 mm) and on the left side (X = 64.5 mm) [38].

2.2. Digital Shearography

2.2.1. Introduction

The use of vibration-based excitation for damage detection presents several advantages over static loading, particularly within the context of the proposed method. The fundamental principle of shearography-based damage detection relies on inducing strain or curvature fields that are significantly influenced by the presence of damage. A critical challenge lies in generating sufficiently high strain concentrations in damaged regions to enhance detectability. Static loading requires a trial-and-error process to identify appropriate conditions for effectively stressing the damaged area. In contrast, modal vibration excitation offers a controlled and systematic means to generate strain and curvature fields. Each vibration mode exhibits a distinct spatial strain distribution, enabling a comprehensive scanning of the structure by exciting multiple modes. This approach ensures that high strain fields occur at varying locations, improving the likelihood of detecting damage across the entire structure. In this study, only the first three modal rotations and modal curvatures were considered. This is because the slots 1 and 2 correspond to the location of the maximum curvature for the first and second bending mode shapes of the beams. For a more general analysis, where the damage location is unknown, a higher number of modes should be considered.
Curvature is considered a preferable field for damage identification because it is closely related to strain concentrations. One of the major advantages of the digital shearography technique is that it directly measures the modal rotation field, which corresponds to the first spatial derivative of the mode shape. Consequently, only a single numerical differentiation step is required to calculate the modal curvatures. This minimizes the adverse effects associated with numerical differentiation, thereby enhancing the reliability of the damage identification process. In contrast, other optical techniques that measure mode shapes (displacement fields) would require two differentiation steps to obtain the curvature.

2.2.2. Modal Data

The Digital Shearography technique was chosen to extract the modal rotation of the operational mode shapes. Initially, several Frequency Response Functions (FRFs) were measured for the four beams under free-free boundary conditions to identify their natural frequencies [38,39]. The tests were performed by suspending the beams with two flexible wires to create a nearly free-free condition. A small impact hammer was used to excite the beams, and a microphone measures the acoustic pressure response at various locations to avoid adding mass to the beam. The first three natural frequencies of the four beams were identified by observing the frequency at the peaks of the computed FRFs, which correspondents to a maximum error of 0.25 Hz due to the frequency resolution of the measurement. Table 2 presents the first three natural frequencies identifying the four beams tested. As expected, the induced damage causes a decrease in the natural frequencies. This decrease is dependent on both the location and severity of the damage.
The operational modal rotation of the beams for the free-free conditions was then measured using a shearography system [14,39]. This system, developed based on a Michelson optical interferometer, uses a continuous-wave laser with an output power of 1.3 W and a wavelength of 532 nm to illuminate the beams’ surface. The surface was pre-coated with a thin layer of white powder to produce a more uniform reflection of the laser light. The Michelson interferometer creates an interference pattern by splitting the wavefront reflected from the beams’ surface into two laterally shifted wavefronts, which are then recombined. The lateral shift, also known as the shearing amount, is introduced by a small tilting of one of the mirrors in the Michelson interferometer. This shearing amount is equivalent to the step or increment of the finite difference method and allows for controlling the accuracy of the derivative and sensitivity of measurement. A 4-megapixel CCD camera captures the intensity of the interference pattern. Each pixel on the camera’s sensor corresponds to a measurement point on the object’s surface. In this specific case, the spatial resolution was 0.17 mm. The phase of the interference pattern is then extracted using a temporal phase-shifting technique, which significantly increases the measurement’s resolution. For this process, we applied the four-image method, which uses a constant phase step of π/2 between the two wavefronts created by the interferometer [40]. Since this method requires the interference pattern to be static during the four-image acquisition, we used stroboscopic laser illumination. This was achieved by using an acousto-optical modulator to pulse the laser, synchronizing the light pulses with the beams’ vibration and effectively “freezing” their motion at specific moments in time [14]. The evaluation of the raw phase maps, corresponding to the beams’ modal rotation, requires correlating the measured phase data from both static and harmonic vibration states. These raw phase maps contain noise and discontinuities, requiring a three-step processing sequence: phase filtering, unwrapping, and scaling. A sine/cosine average phase filter is first applied to remove high-frequency noise, which prepares the maps for unwrapping [41]. The Goldstein unwrapping algorithm then removes phase discontinuities from the filtered data, yielding continuous phase maps [42]. Finally, the modal rotation, θ i x , y ,   is determined by scaling the continuous phase maps, ϕ i ( x , y ) , according to the following relationship [43],
θ i x , y = λ 4 π x · ϕ i ( x , y )
where λ is the laser wavelength, Δx is the shearing amount in the x-direction, and the subscript i represents the ith beam frequency order.
To measure the operational modal rotations, the beams were suspended by two flexible wires with the coated surface facing the digital shearography system. The beams were then uniformly illuminated with laser light. A loudspeaker was mounted near the back surface of the beam to provide non-contact acoustic excitation at its natural frequencies, thus avoiding the addition of mass, stiffness, or damping to the beam that could interfere with its free vibration. The measurement procedure begins by measuring the interference phase of the static beam. The beam is then acoustically excited at its natural frequencies, and once a steady-state vibration is reached, the corresponding interference phase is measured. Finally, the interference phases from both the static and vibrating states are processed according to the previously described procedure to extract the beam’s operational modal rotations. A more comprehensive description of the shearography system and the process of measuring modal rotations can be found in dos Santos and Lopes [44]. In this specific case, the modal rotation fields were measured with a spatial resolution of 2300 × 225 points in the x and y directions, respectively, an amplitude resolution of 1/20 of the laser wavelength, and by using a shearing amount in the x-direction of 5 mm. The modal curvatures κ i ( x , y ) can be considered as good approximation of the first spatial derivative of the modal rotations θ i x , y [44] and are computed by applying a combined smoothing and differentiation process [45].
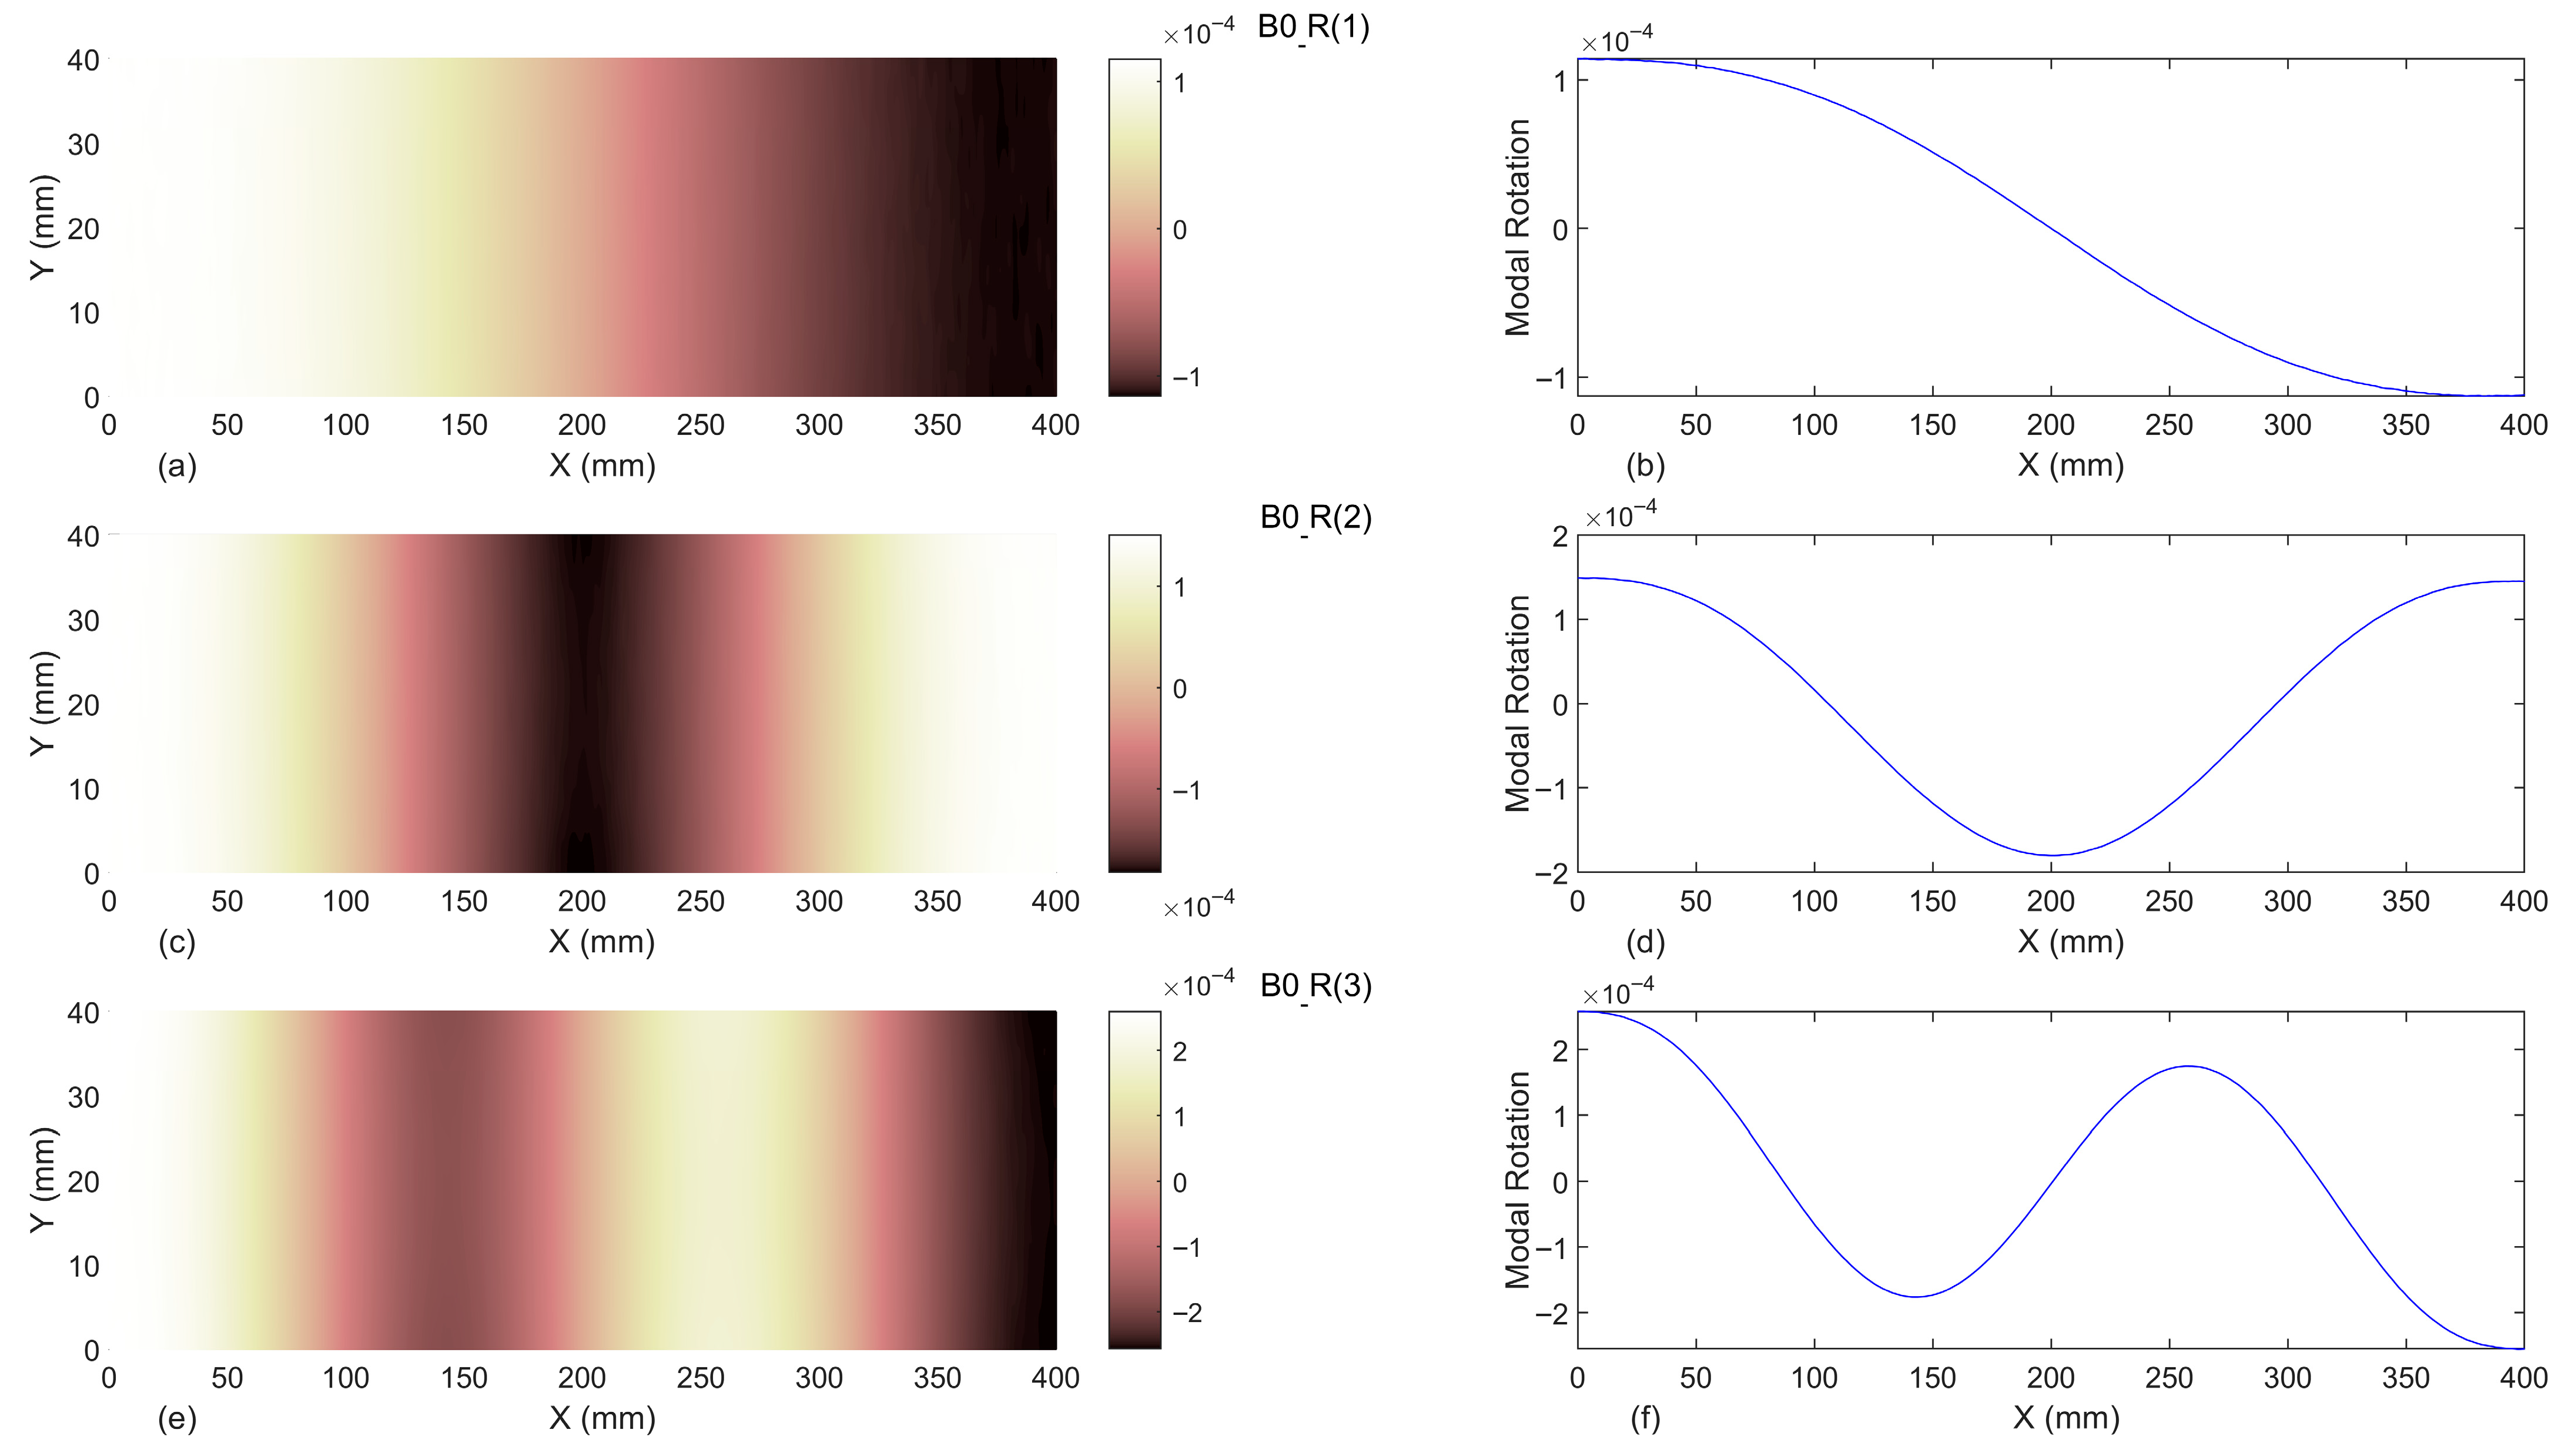
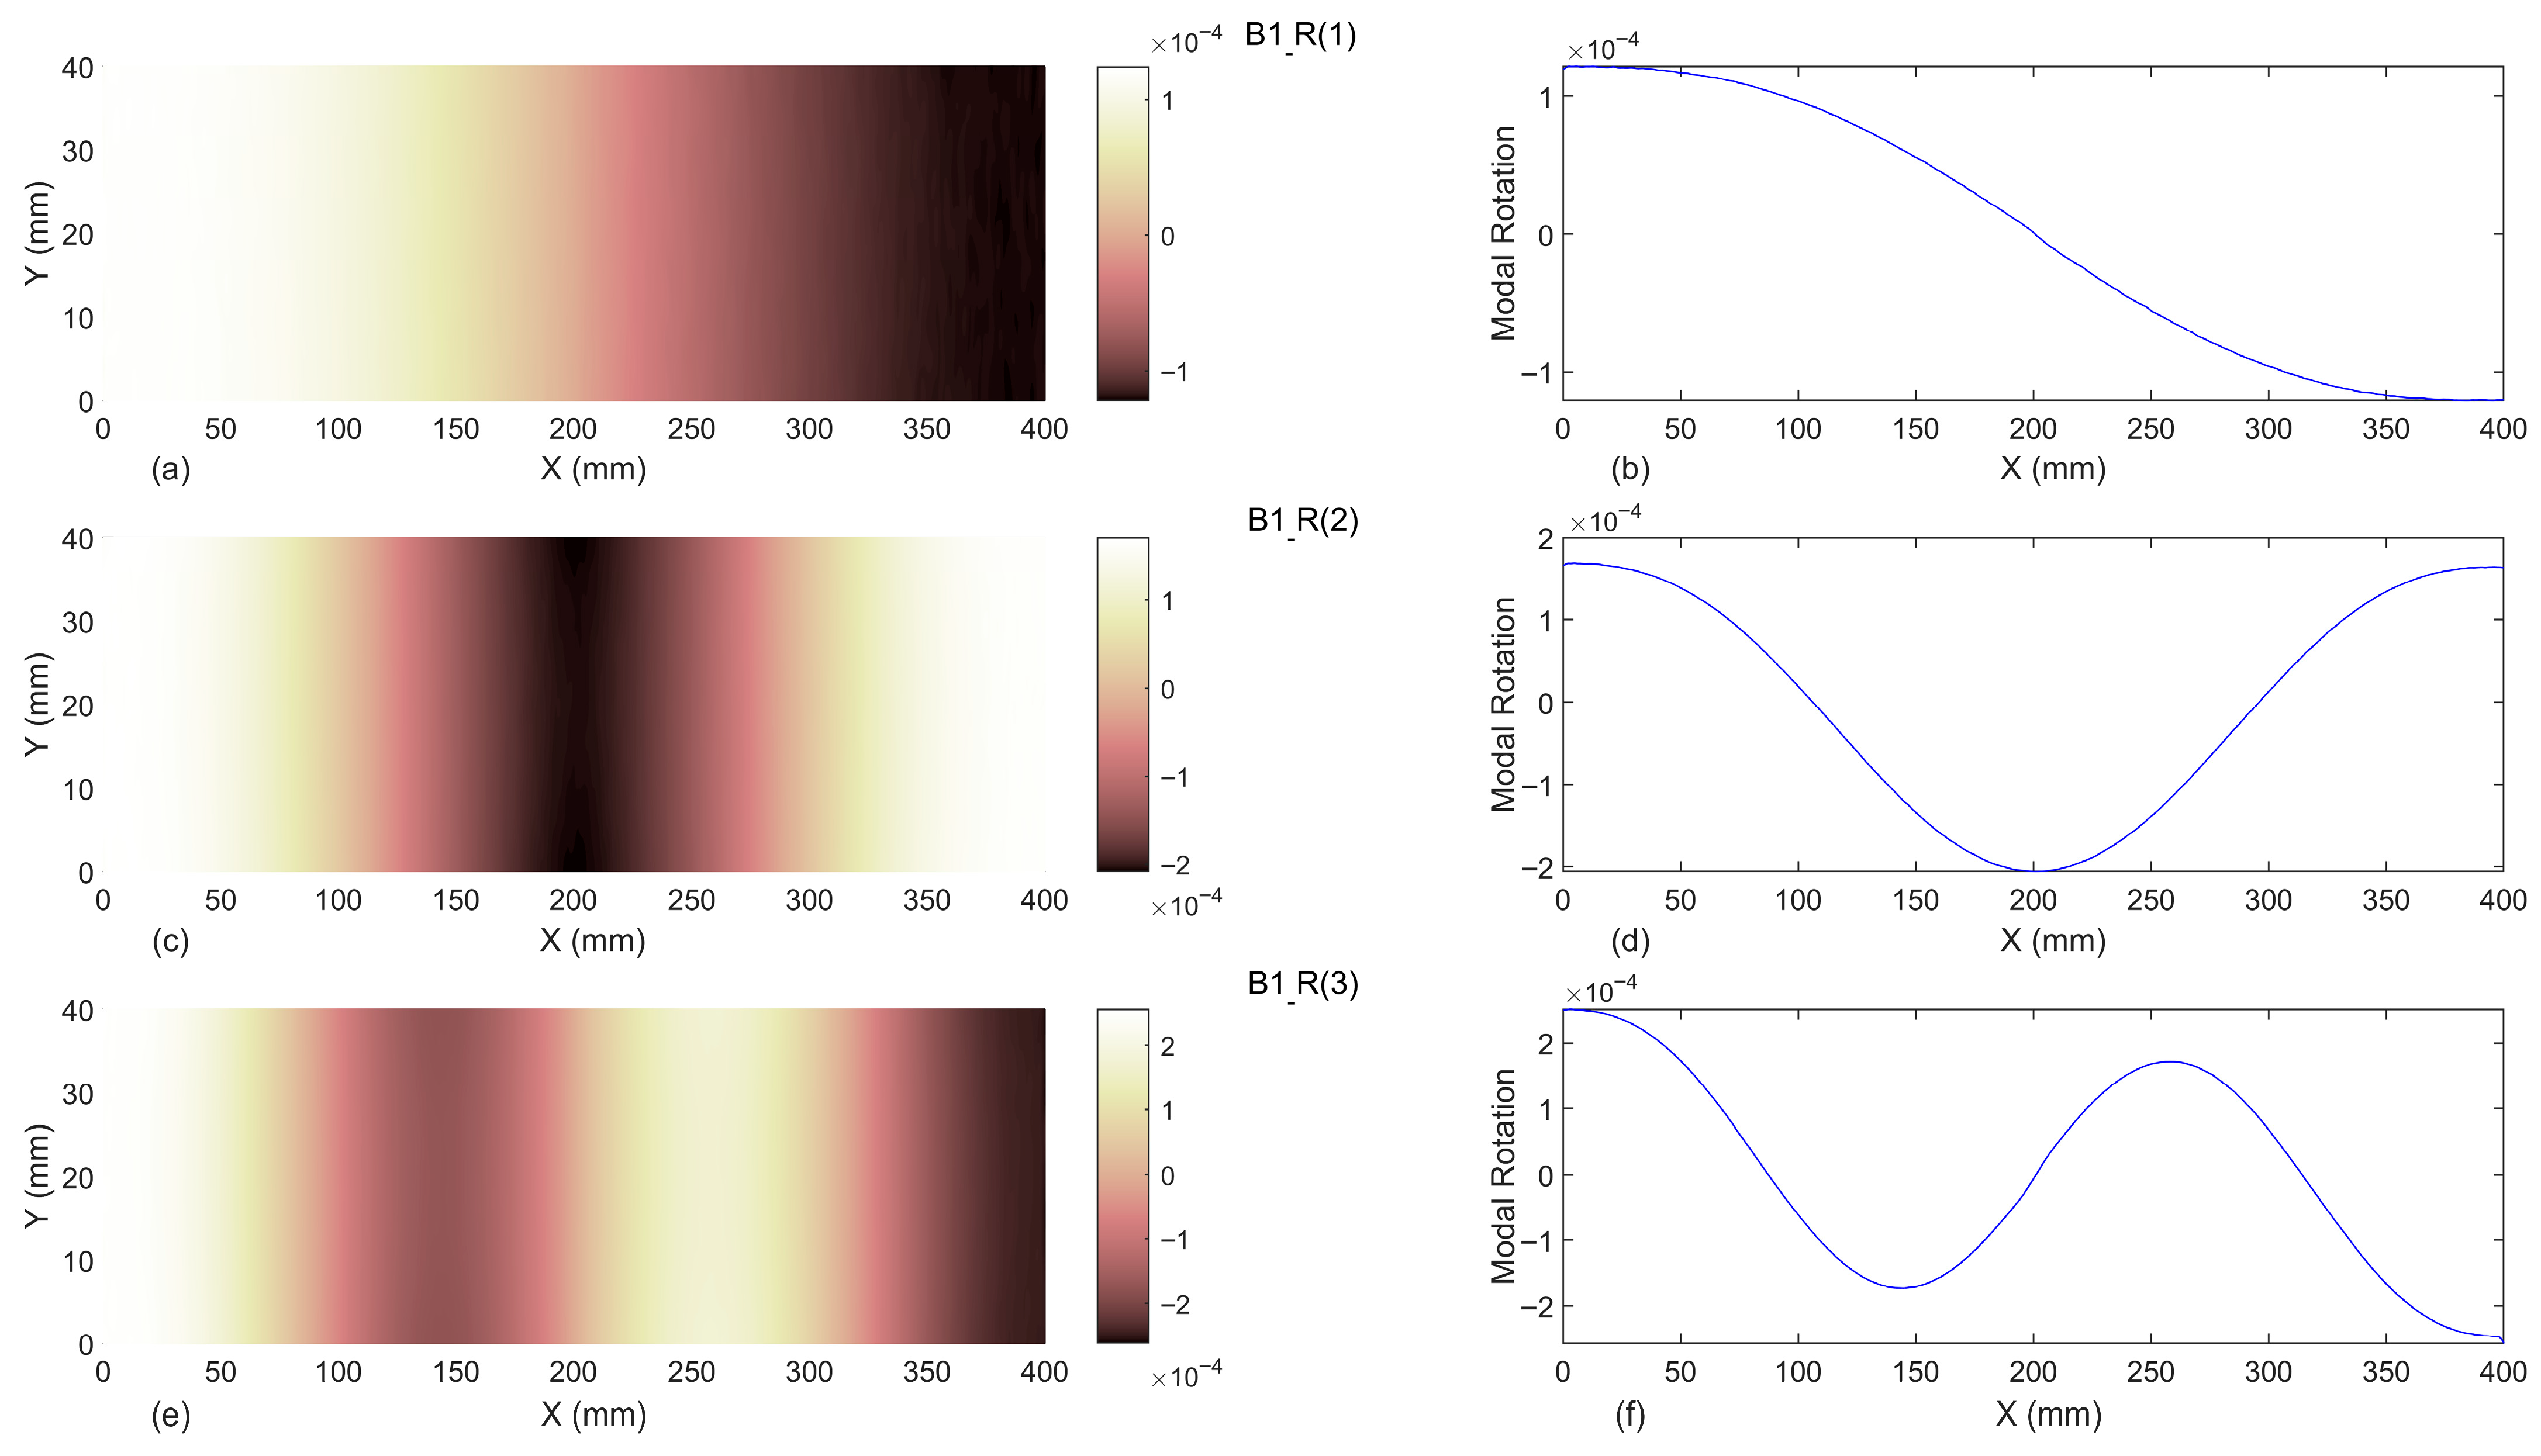
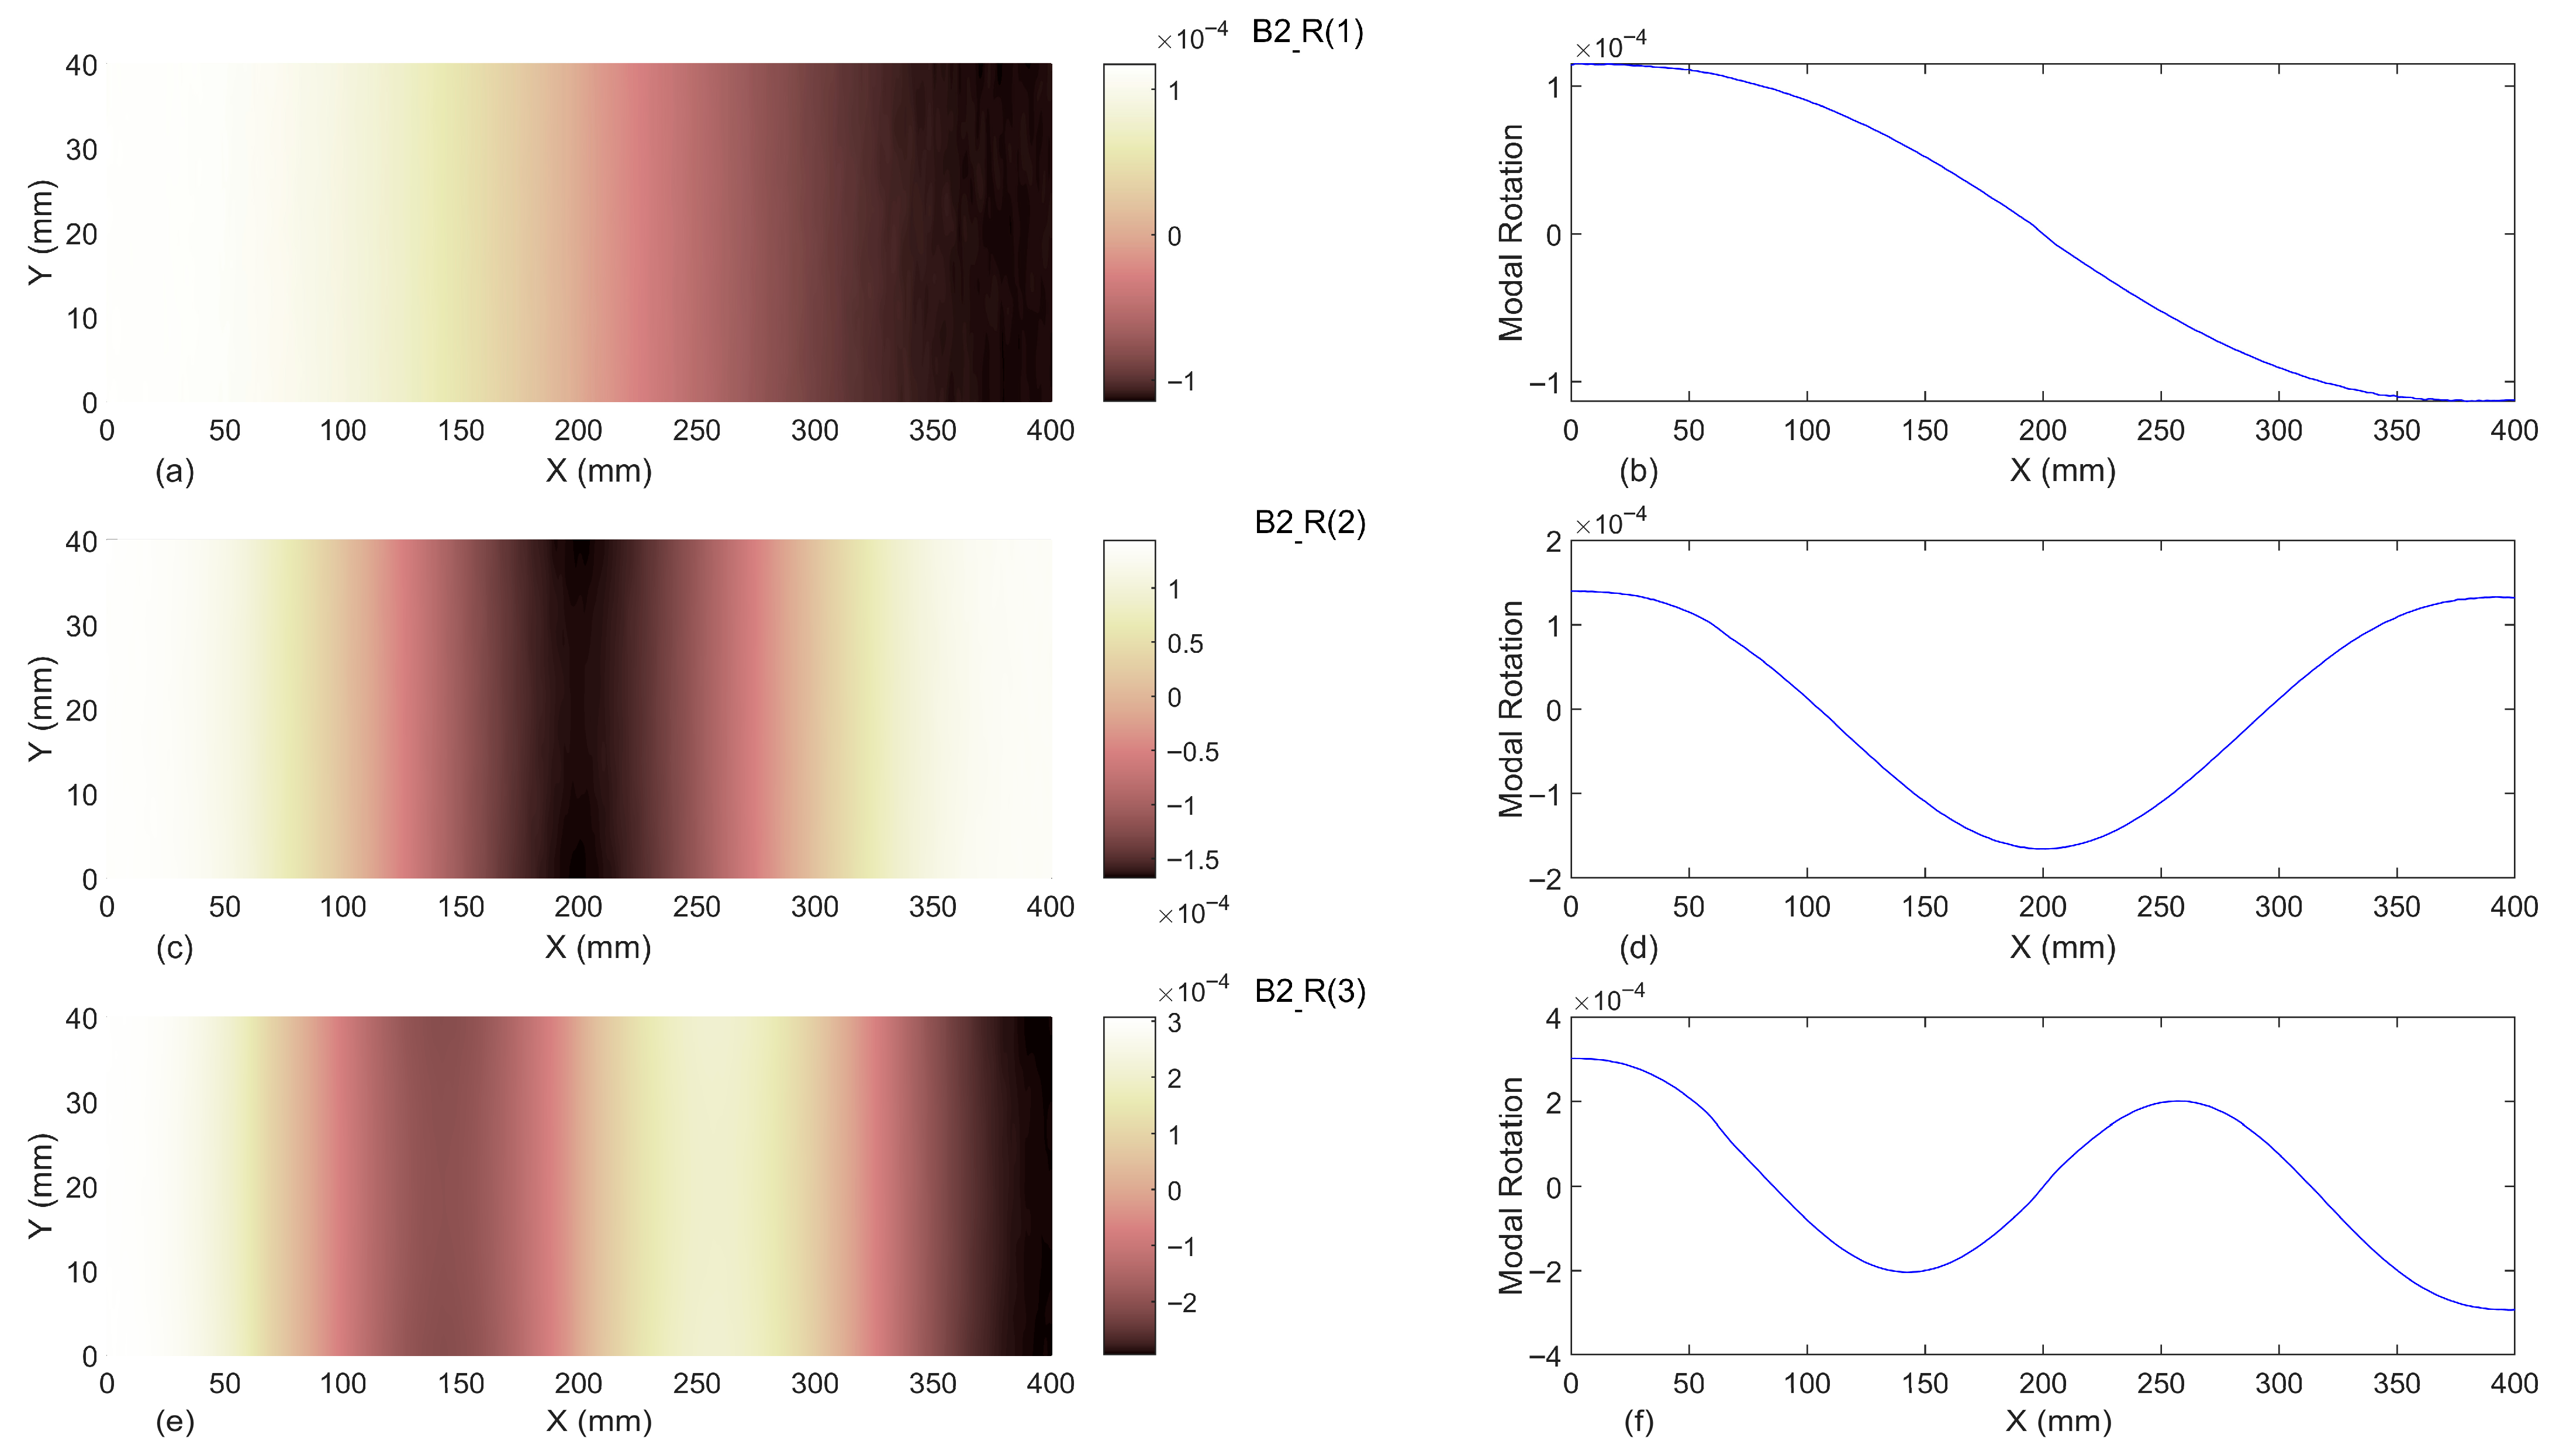
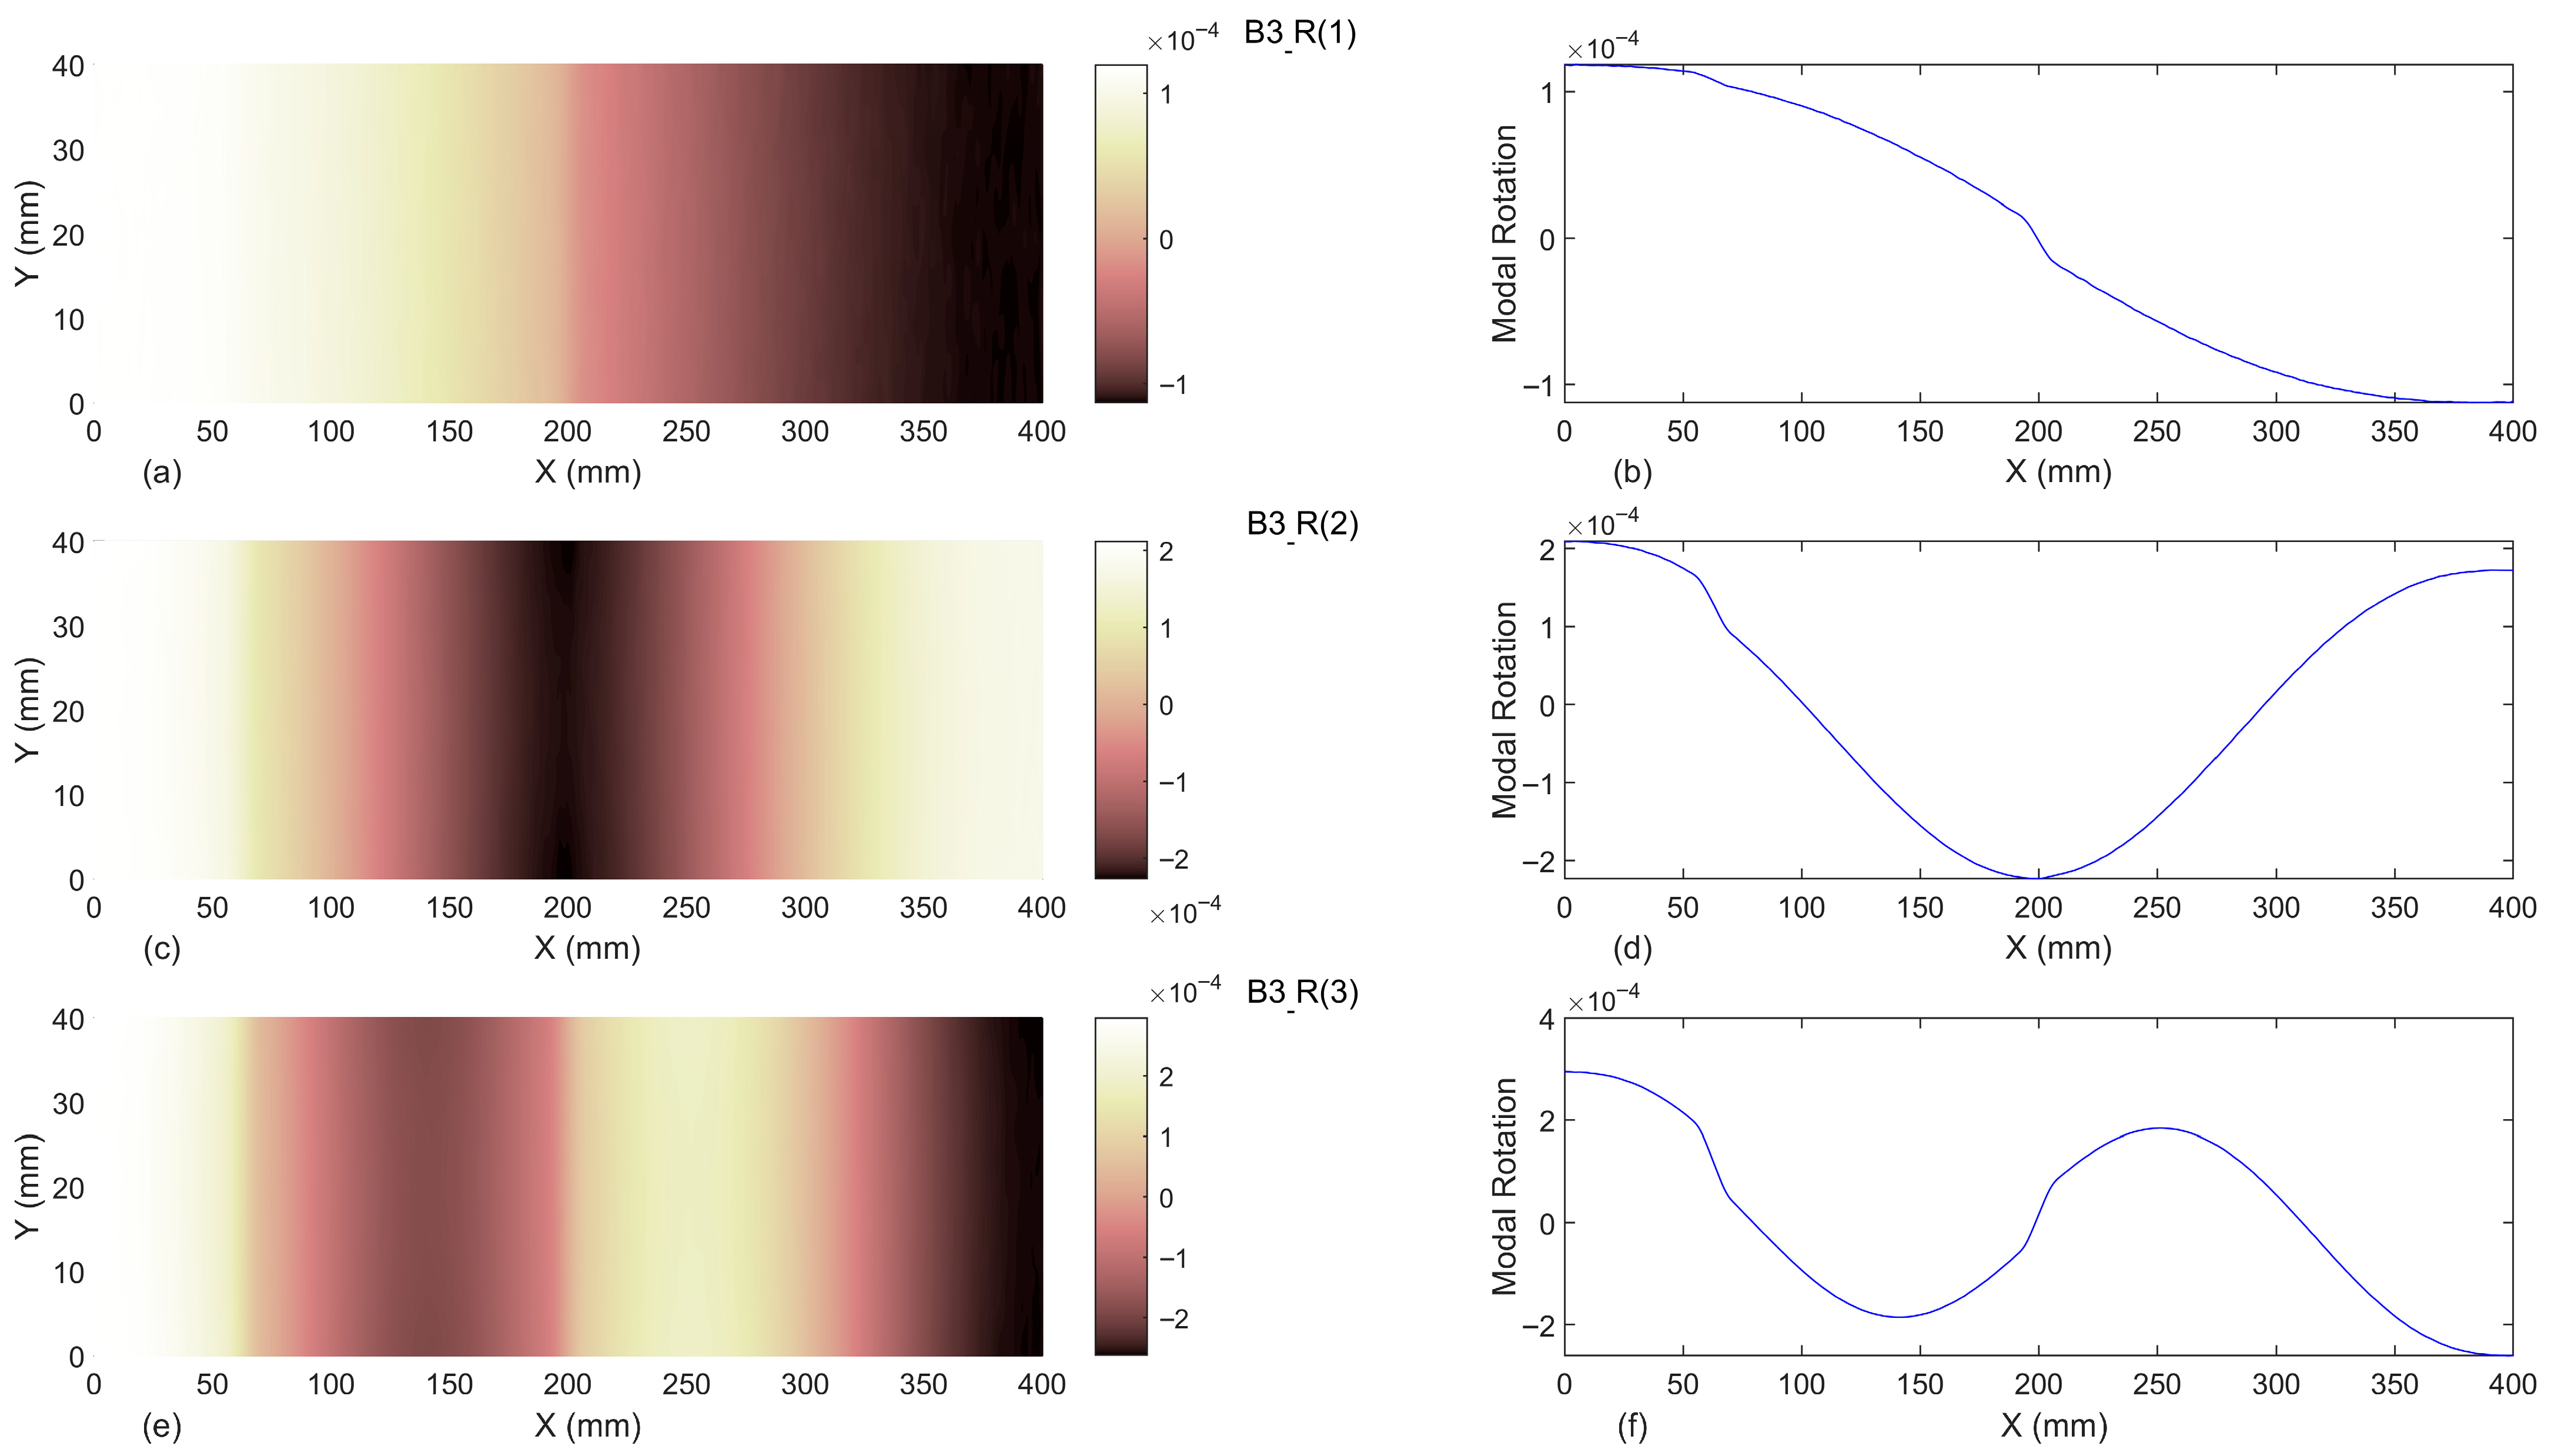
Figure 3, Figure 4, Figure 5 and Figure 6 illustrate the measured modal rotations ( θ i ,   i = 1 ,   2 ,   3 ) of the tested aluminum beams (B0, B1, B2, and B3). In this paper, the modal rotations are shown as colormaps and also as profiles. These profiles consist of average values of the modal rotation for different Ys for each X.

2.3. Contourlet Transform

The contour transform is an advanced image processing tool that utilizes two main steps, namely Laplacian Pyramid (LP) decomposition and Directional Filter Bank (DFB), to extract complex geometric features such as edges, cracks, and stiffness variations from an input image with high accuracy [28].
As illustrated in Figure 7, in the first step, the input image is divided into two frequency bands through LP decomposition: a low-pass subband that provides a general view of the image and a band-pass subband that contains more details. This decomposition is performed iteratively at different levels to obtain multi-resolution information from the image [46].
In the second stage, the band-pass obtained from the LP is fed to a directional filter bank (DFB). The DFB uses directional filters to extract frequency information in different directions defined as contourlet coefficients, which simulate complex geometric structures such as edges and cracks. This step is especially important in identifying local damage in structural elements [46]. The combination of these two steps, namely LP and DFB, forms the contourlet transform structure, which can extract complex geometric features in images. These features are particularly useful in analyzing the dynamic behavior of structures and identifying local damage, such as cracks or stiffness changes in beams [46]. More details regarding the contourlet transform can be found in [30].
In the current study, both modal rotations   θ i ( x , y ) , and modal curvatures κ i ( x , y ) , denoted by θ i and κ i were considered as the input of the contourlet transform to build the proposed damage indices, which are introduced in the next subsection. In the current study, the contourlet transform was not applied in its generic form; instead, to optimize the performance of the contourlet transform on shearography-derived modal data, the authors carefully adjusted the low- and high-pass filter parameters, enhancing its ability to capture damage-related features. In this study, the Contourlet transform was implemented using a pyramidal directional filter bank (PDFB) with specific parameter settings to achieve efficient multiscale and multidirectional image decomposition. The chosen pyramidal filter, denoted as ‘9-7’, corresponds to the Cohen-Daubechies-Feauveau 9/7 biorthogonal filter, which is well-known for its near-perfect reconstruction and smooth frequency response, making it suitable for capturing image details at multiple scales. For the directional filter bank (DFB), the Haar filter was selected due to its simplicity and computational efficiency, providing effective directional decomposition with minimal complexity. The decomposition level vector was set as nlevs = [0, 0], indicating no additional multiscale decomposition stages beyond the initial level, thus focusing the analysis on the finest scale directional features. These parameter choices balance the trade-off between decomposition accuracy and computational cost, aligning with the objectives of the study.

2.4. Proposed Damage Indices

The proposed damage identification process requires the measurement of modal rotations ( θ i ) and modal curvatures ( κ i ) of an undamaged beam (B0), illustrated by θ i and κ i , respectively, to be used as baseline, and the equivalent modal rotations of the three damaged beams (B1, B2, and B3), denoted by θ ~ i and κ ~ i , respectively. This leads to the definition of damage indices based on differences in modal rotations and differences in modal curvatures of the undamaged and damaged beams. A contourlet transform denoted by CT is applied to these differences, such that [38]:
M R & D ( i ) = C T ( θ ~ i )
M R & D U ( i ) = C T ( θ ~ i θ i )
M C & D ( i ) = C T ( κ ~ i )
M C & D U ( i ) = C T ( κ ~ i κ i )
for the damage indices based on modal rotations M R & D ( i ) and modal curvatures M C & D ( i ) , respectively, of the ith mode. In this paper, the first three modes ( i = 1 ,   2 ,   3 ) and also their summation, denoted by ( i =   S U M ) , were considered as inputs of the proposed damage indices to detect the location and severity of damage scenarios.

3. Results and Discussion

In this section, the results of proposed damage indices calculated based on the modal rotations and modal curvatures. Baseline-free (ignoring the undamaged beam as the reference) and baseline-included (considering the undamaged beam as the reference) approaches (B1, B2, and B3) are reported. Finally, the best damage index is proposed and compared with the results of wavelet-based damage identification reported in a previous study conducted by the authors.

3.1. Modal Rotations

In this section, the results of applying the contourlet transform on modal rotations of damaged beams (B1, B2, and B3) with baseline-free,   M R & D ( i ) , and baseline-included, M R & D U ( i ) , approaches, for the first three modes ( i = 1 ,   2 ,   3 ) and their summation ( S U M ), are reported. In this paper, the proposed damage indices are shown in 2D format as a colormap and also as profiles, which consists of average values of the damage indices for different Ys for each X.

3.1.1. Baseline-Free

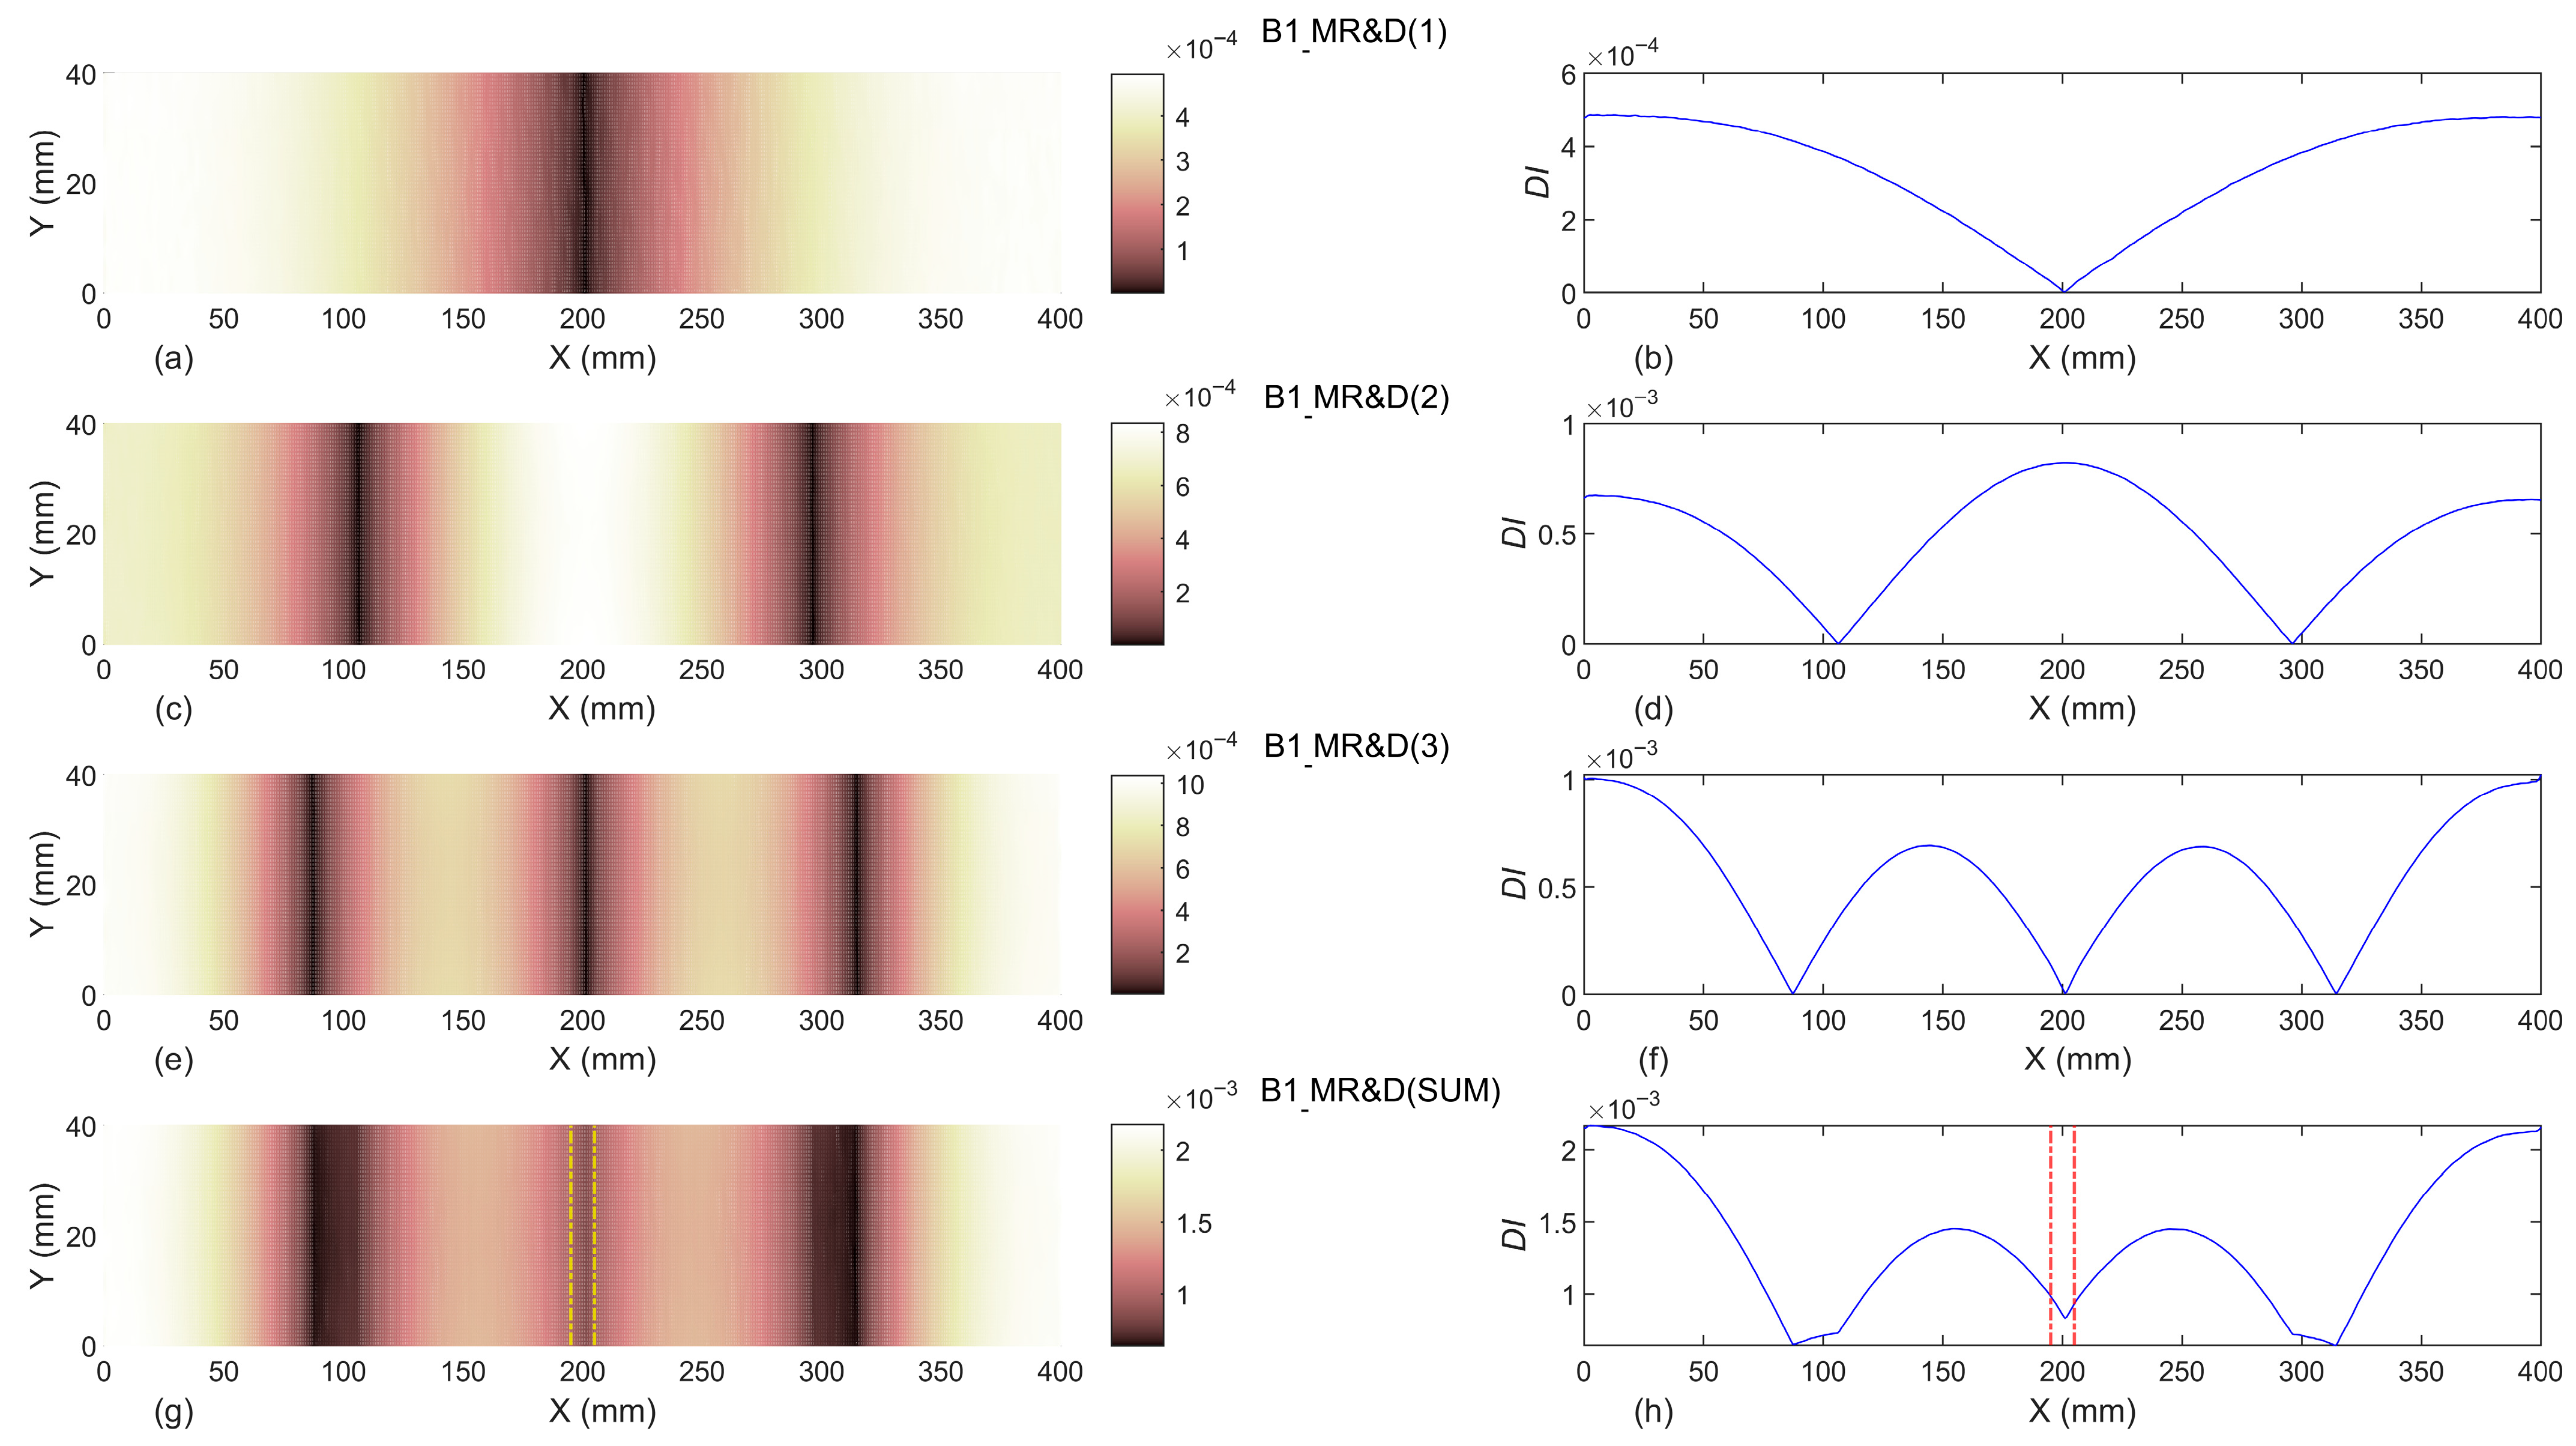
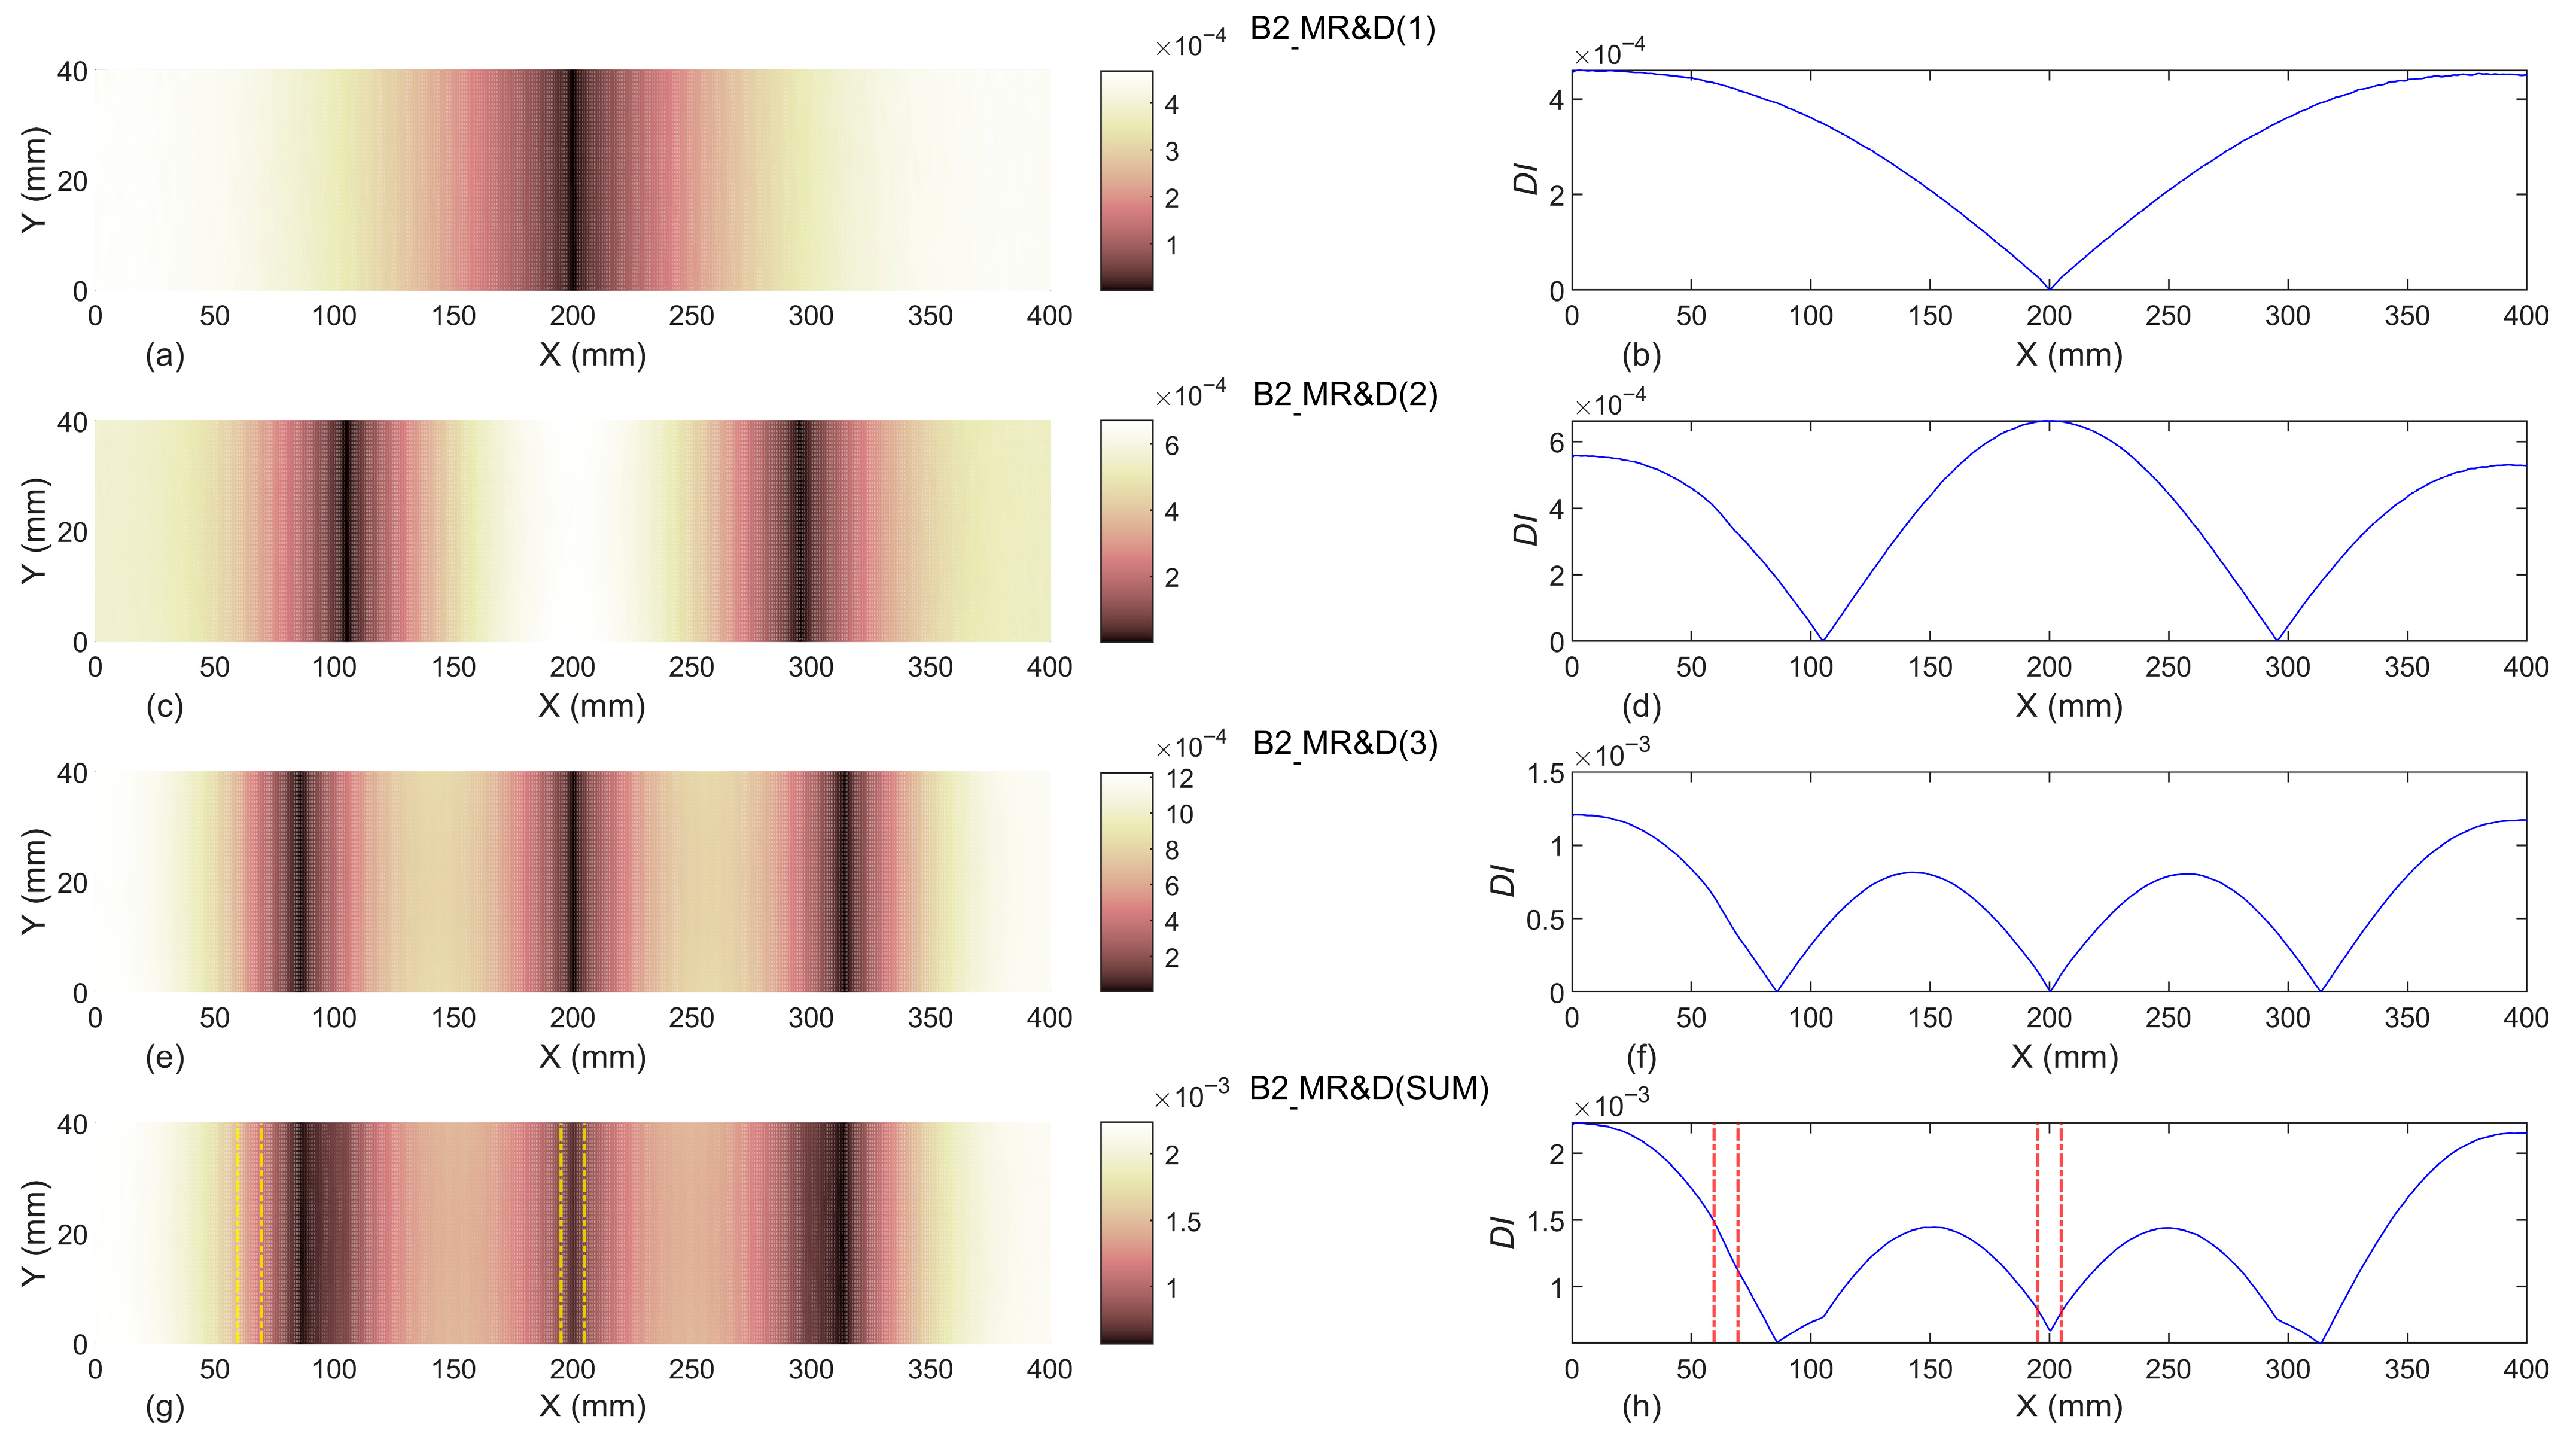
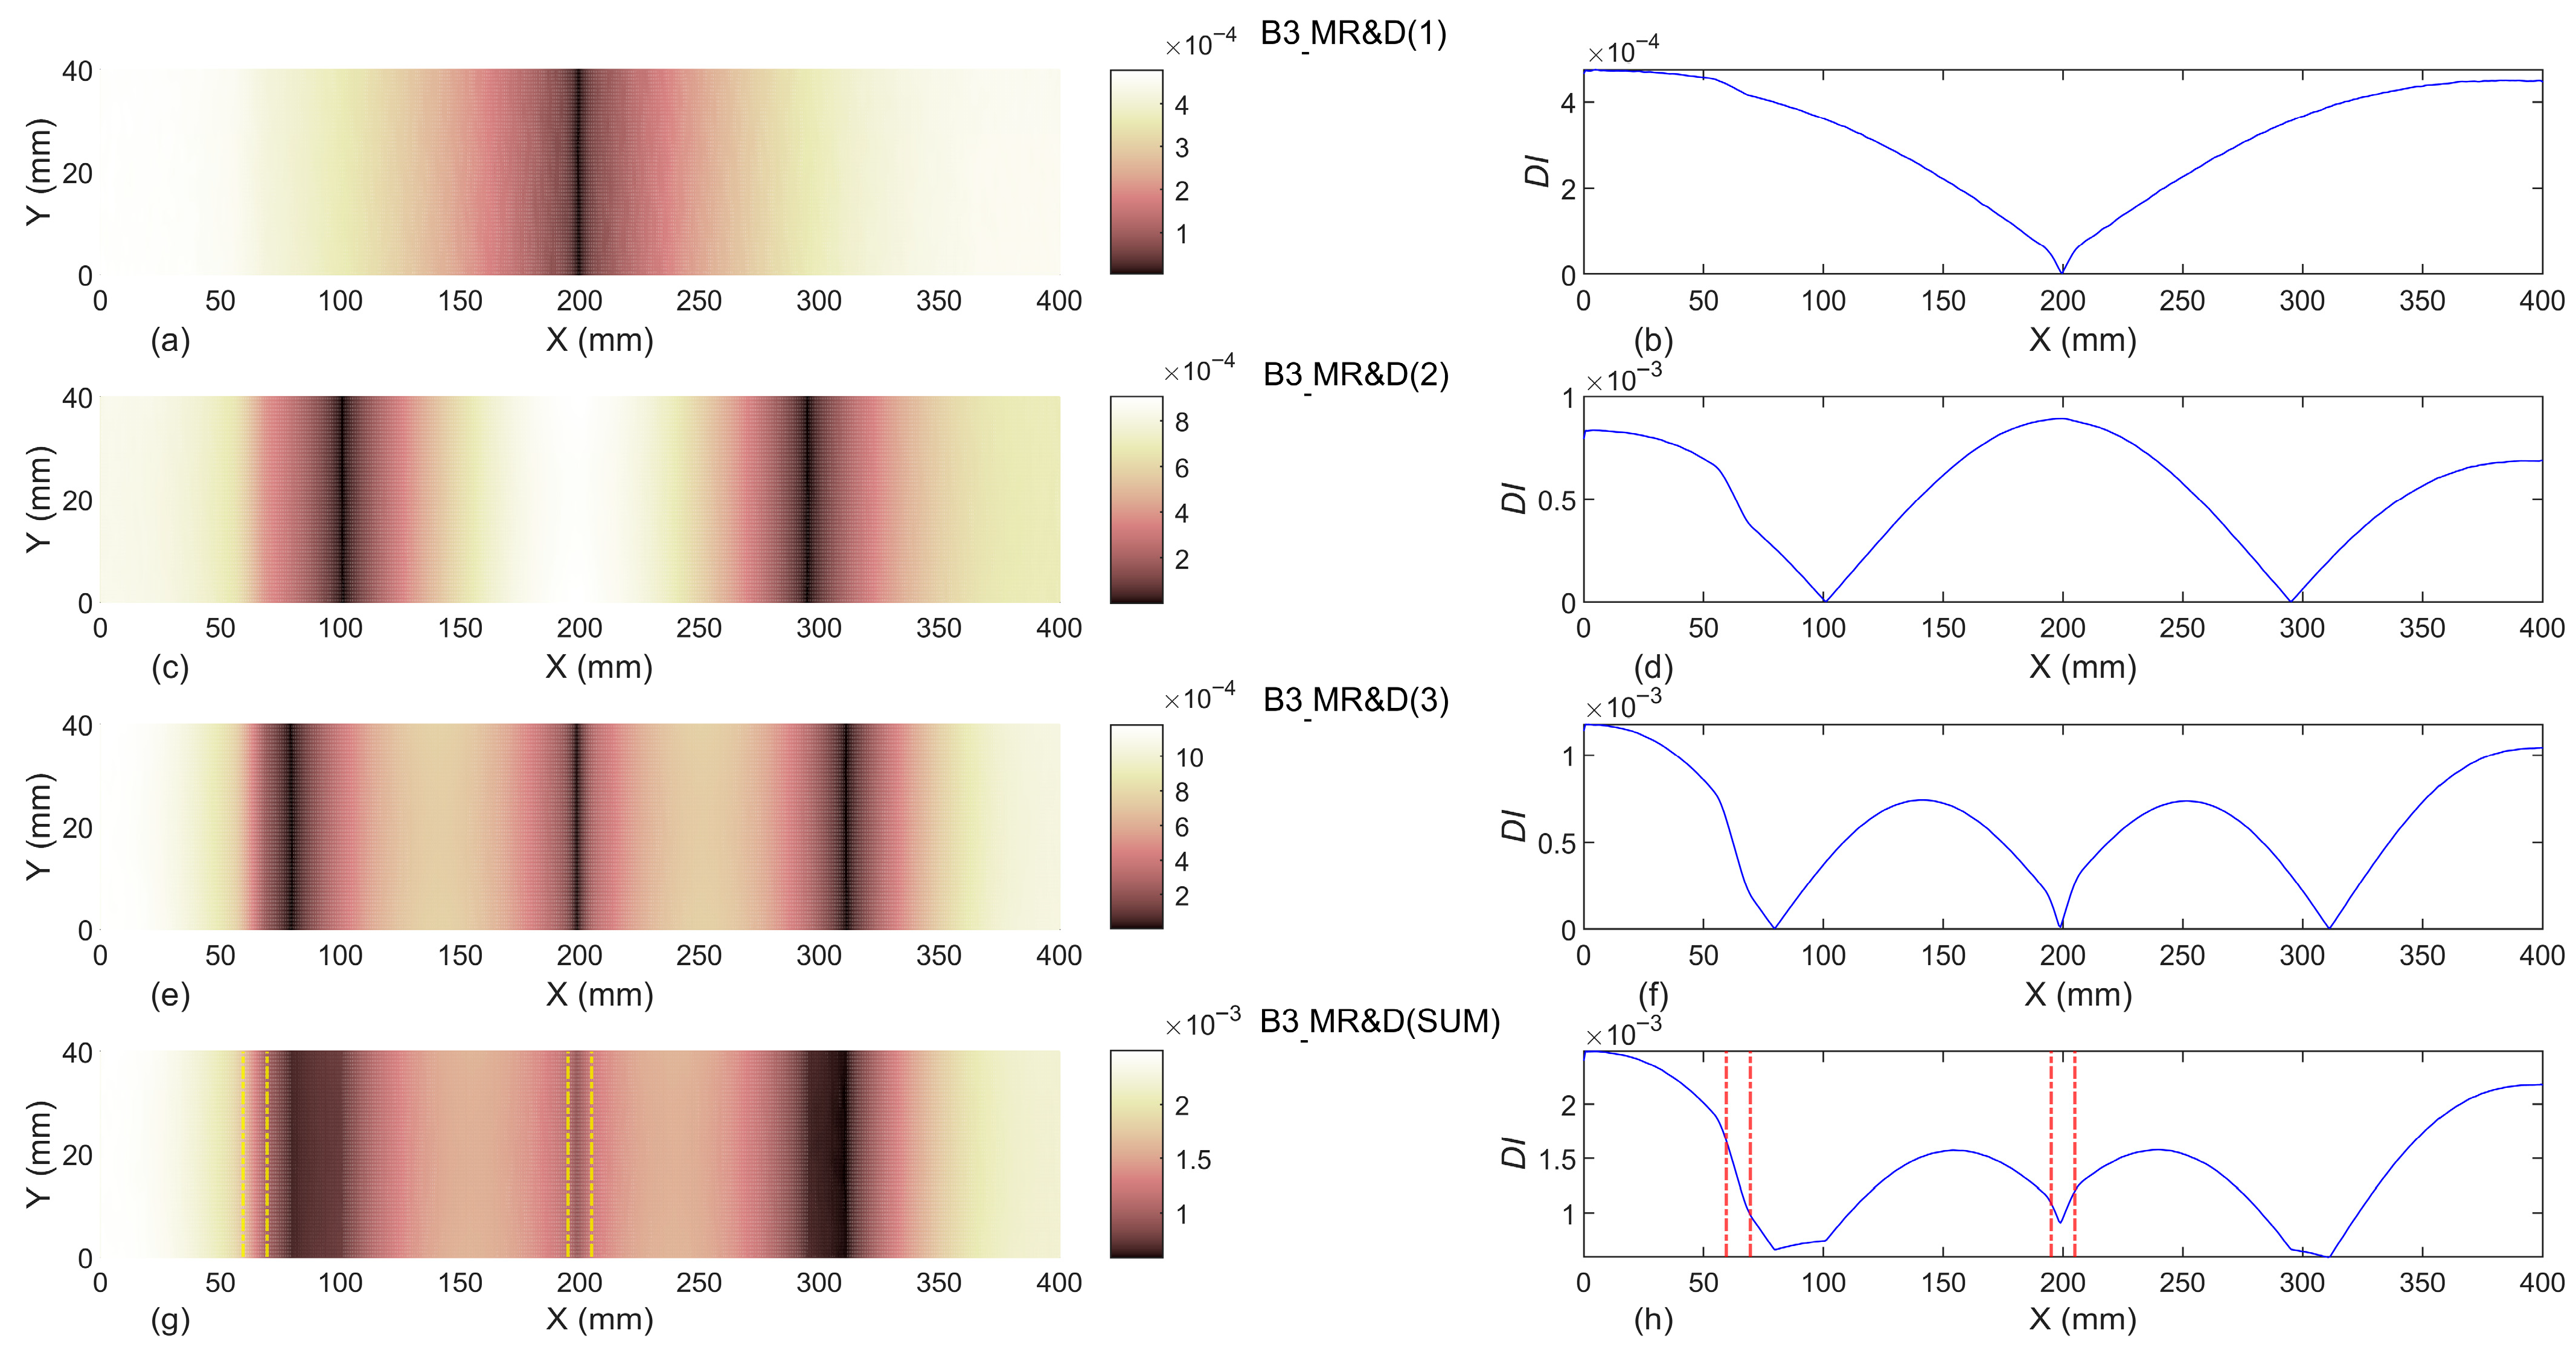
Figure 8, Figure 9 and Figure 10 show the results of damage identification considering the first three modal rotations ( i = 1 ,   2 ,   3 ) and their summation ( S U M ) of damaged beams as the input of proposed damage indices, without considering the undamaged beam as the reference, M R & D ( i ) , in beams B1, B2 and B3, respectively. In Figure 8, Figure 9 and Figure 10, the exact location(s) of slot(s) are illustrated by dash-dot lines (-.).
The illustrated results in Figure 8, Figure 9 and Figure 10 show that introducing the first three modal rotations to the proposed damage indices in baseline-free format is not a proper damage identification process.

3.1.2. Baseline-Included

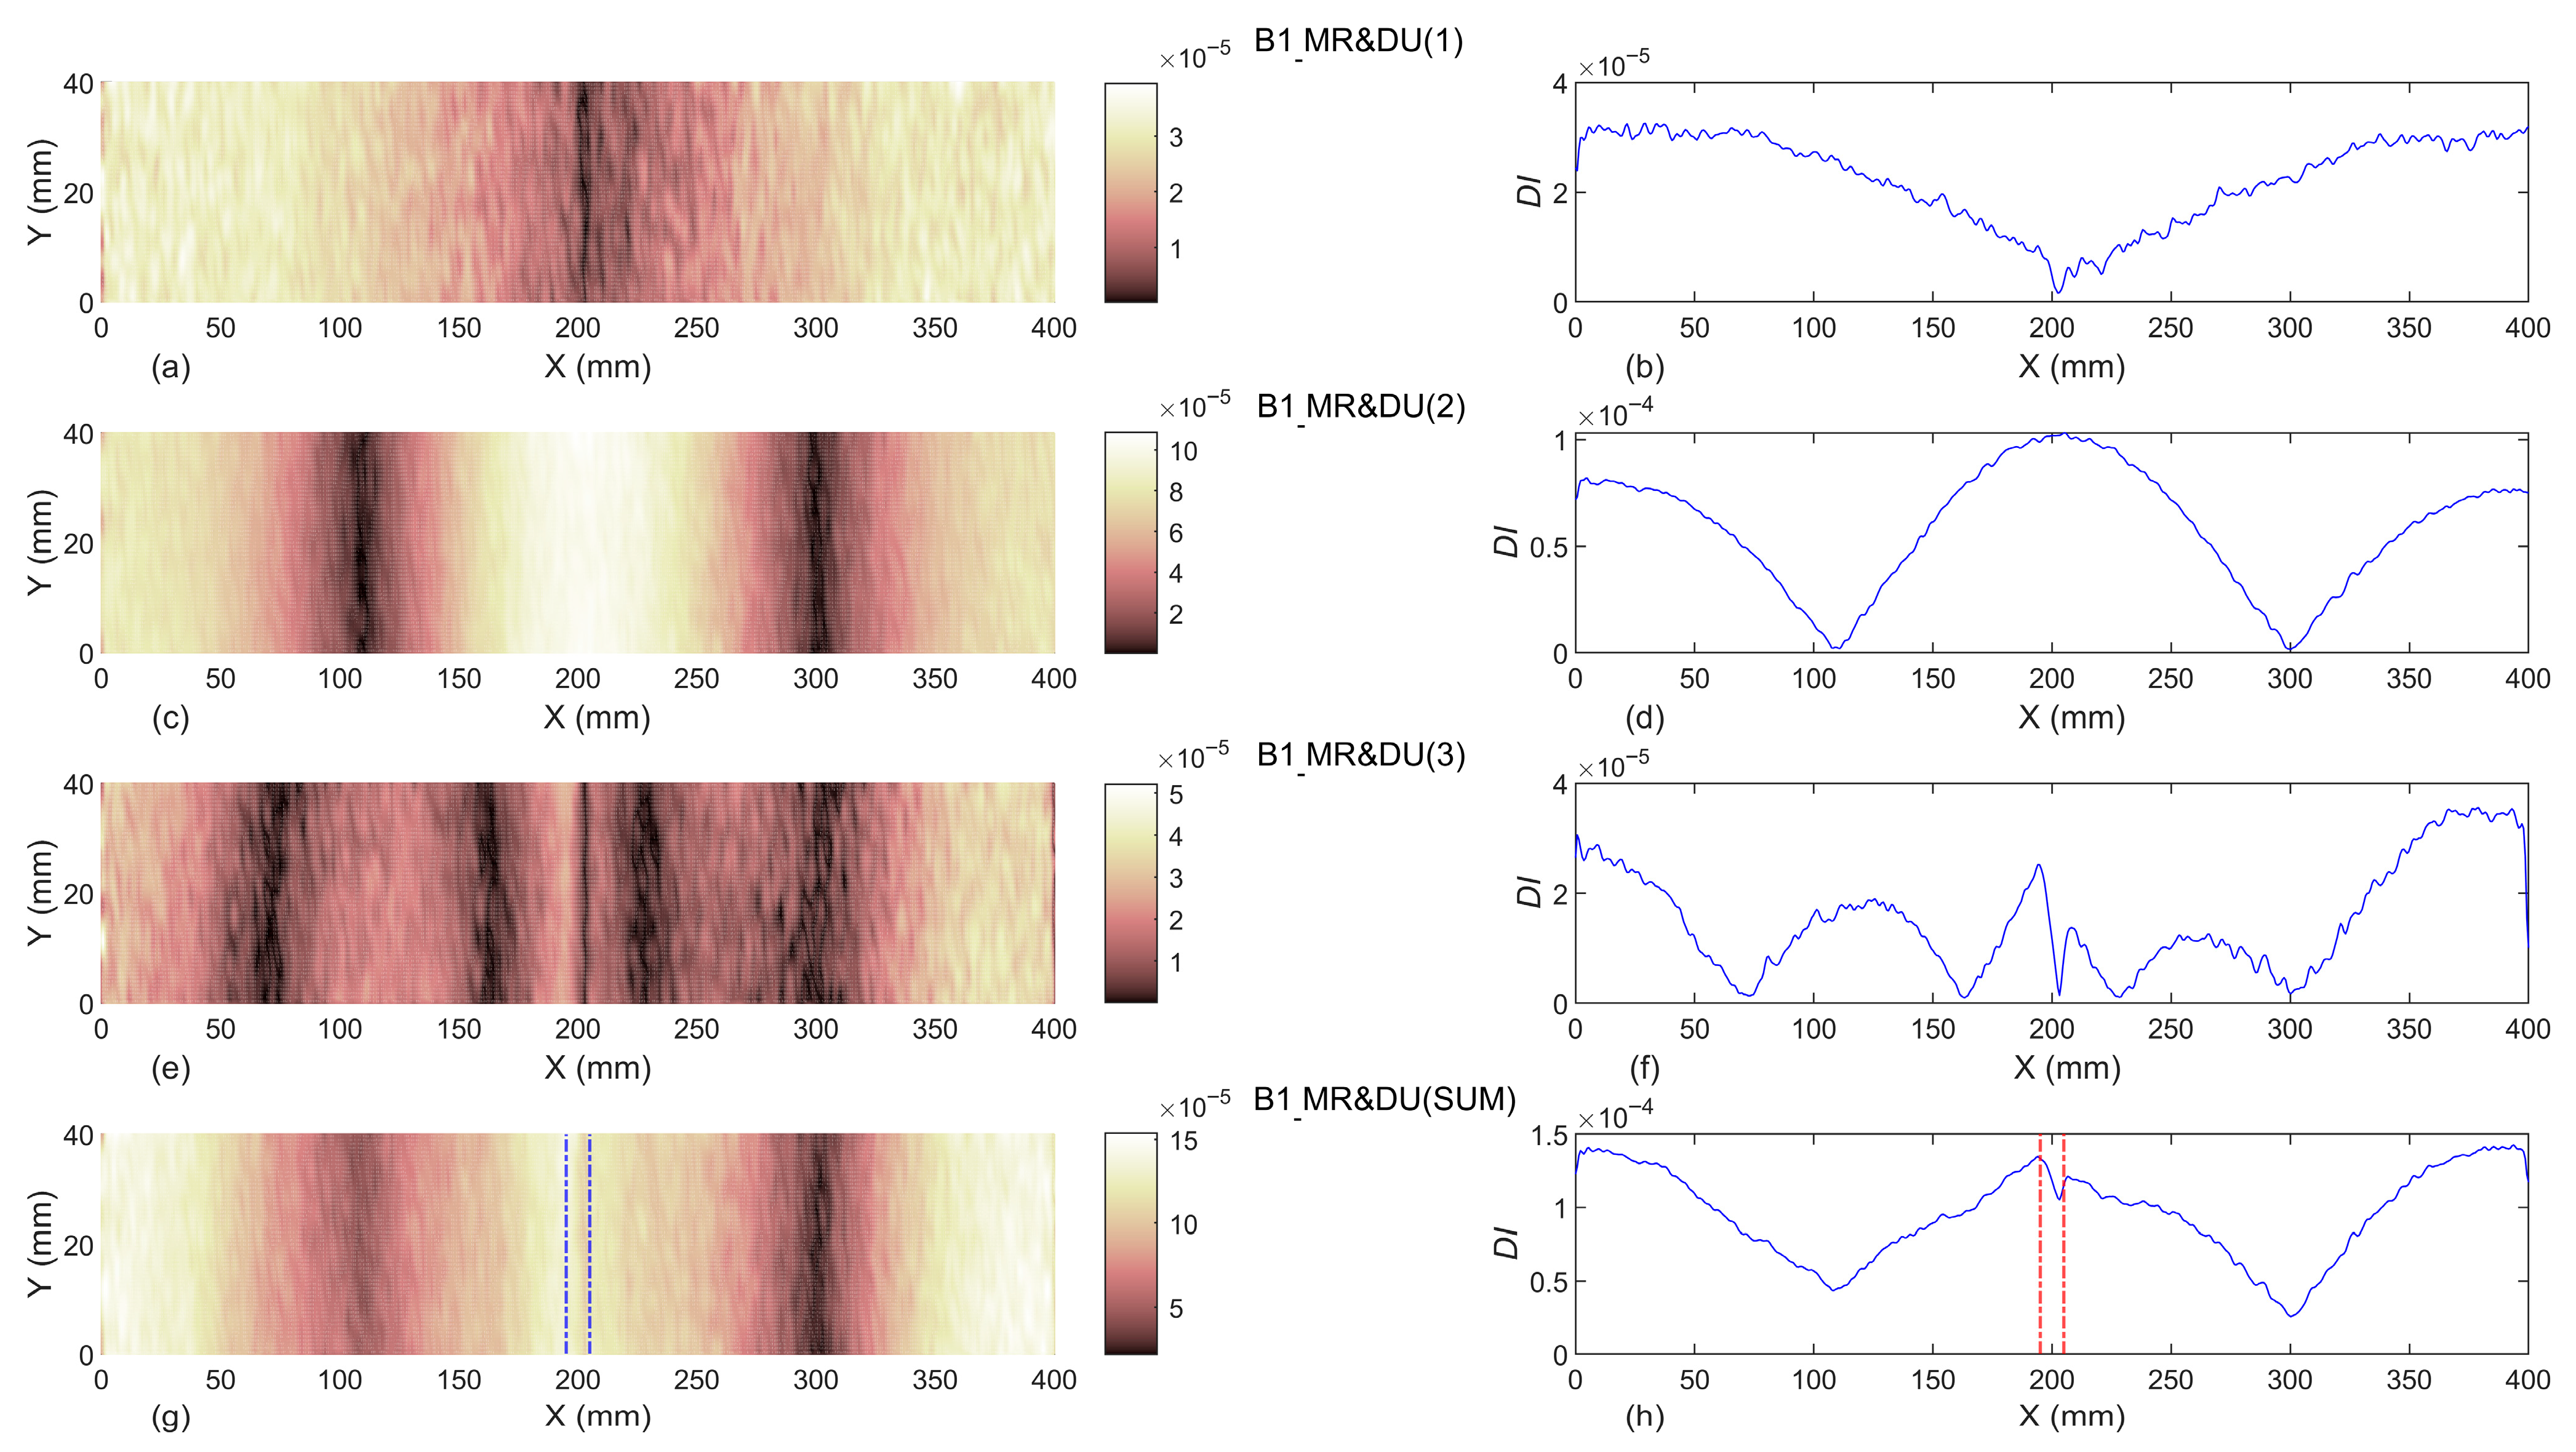
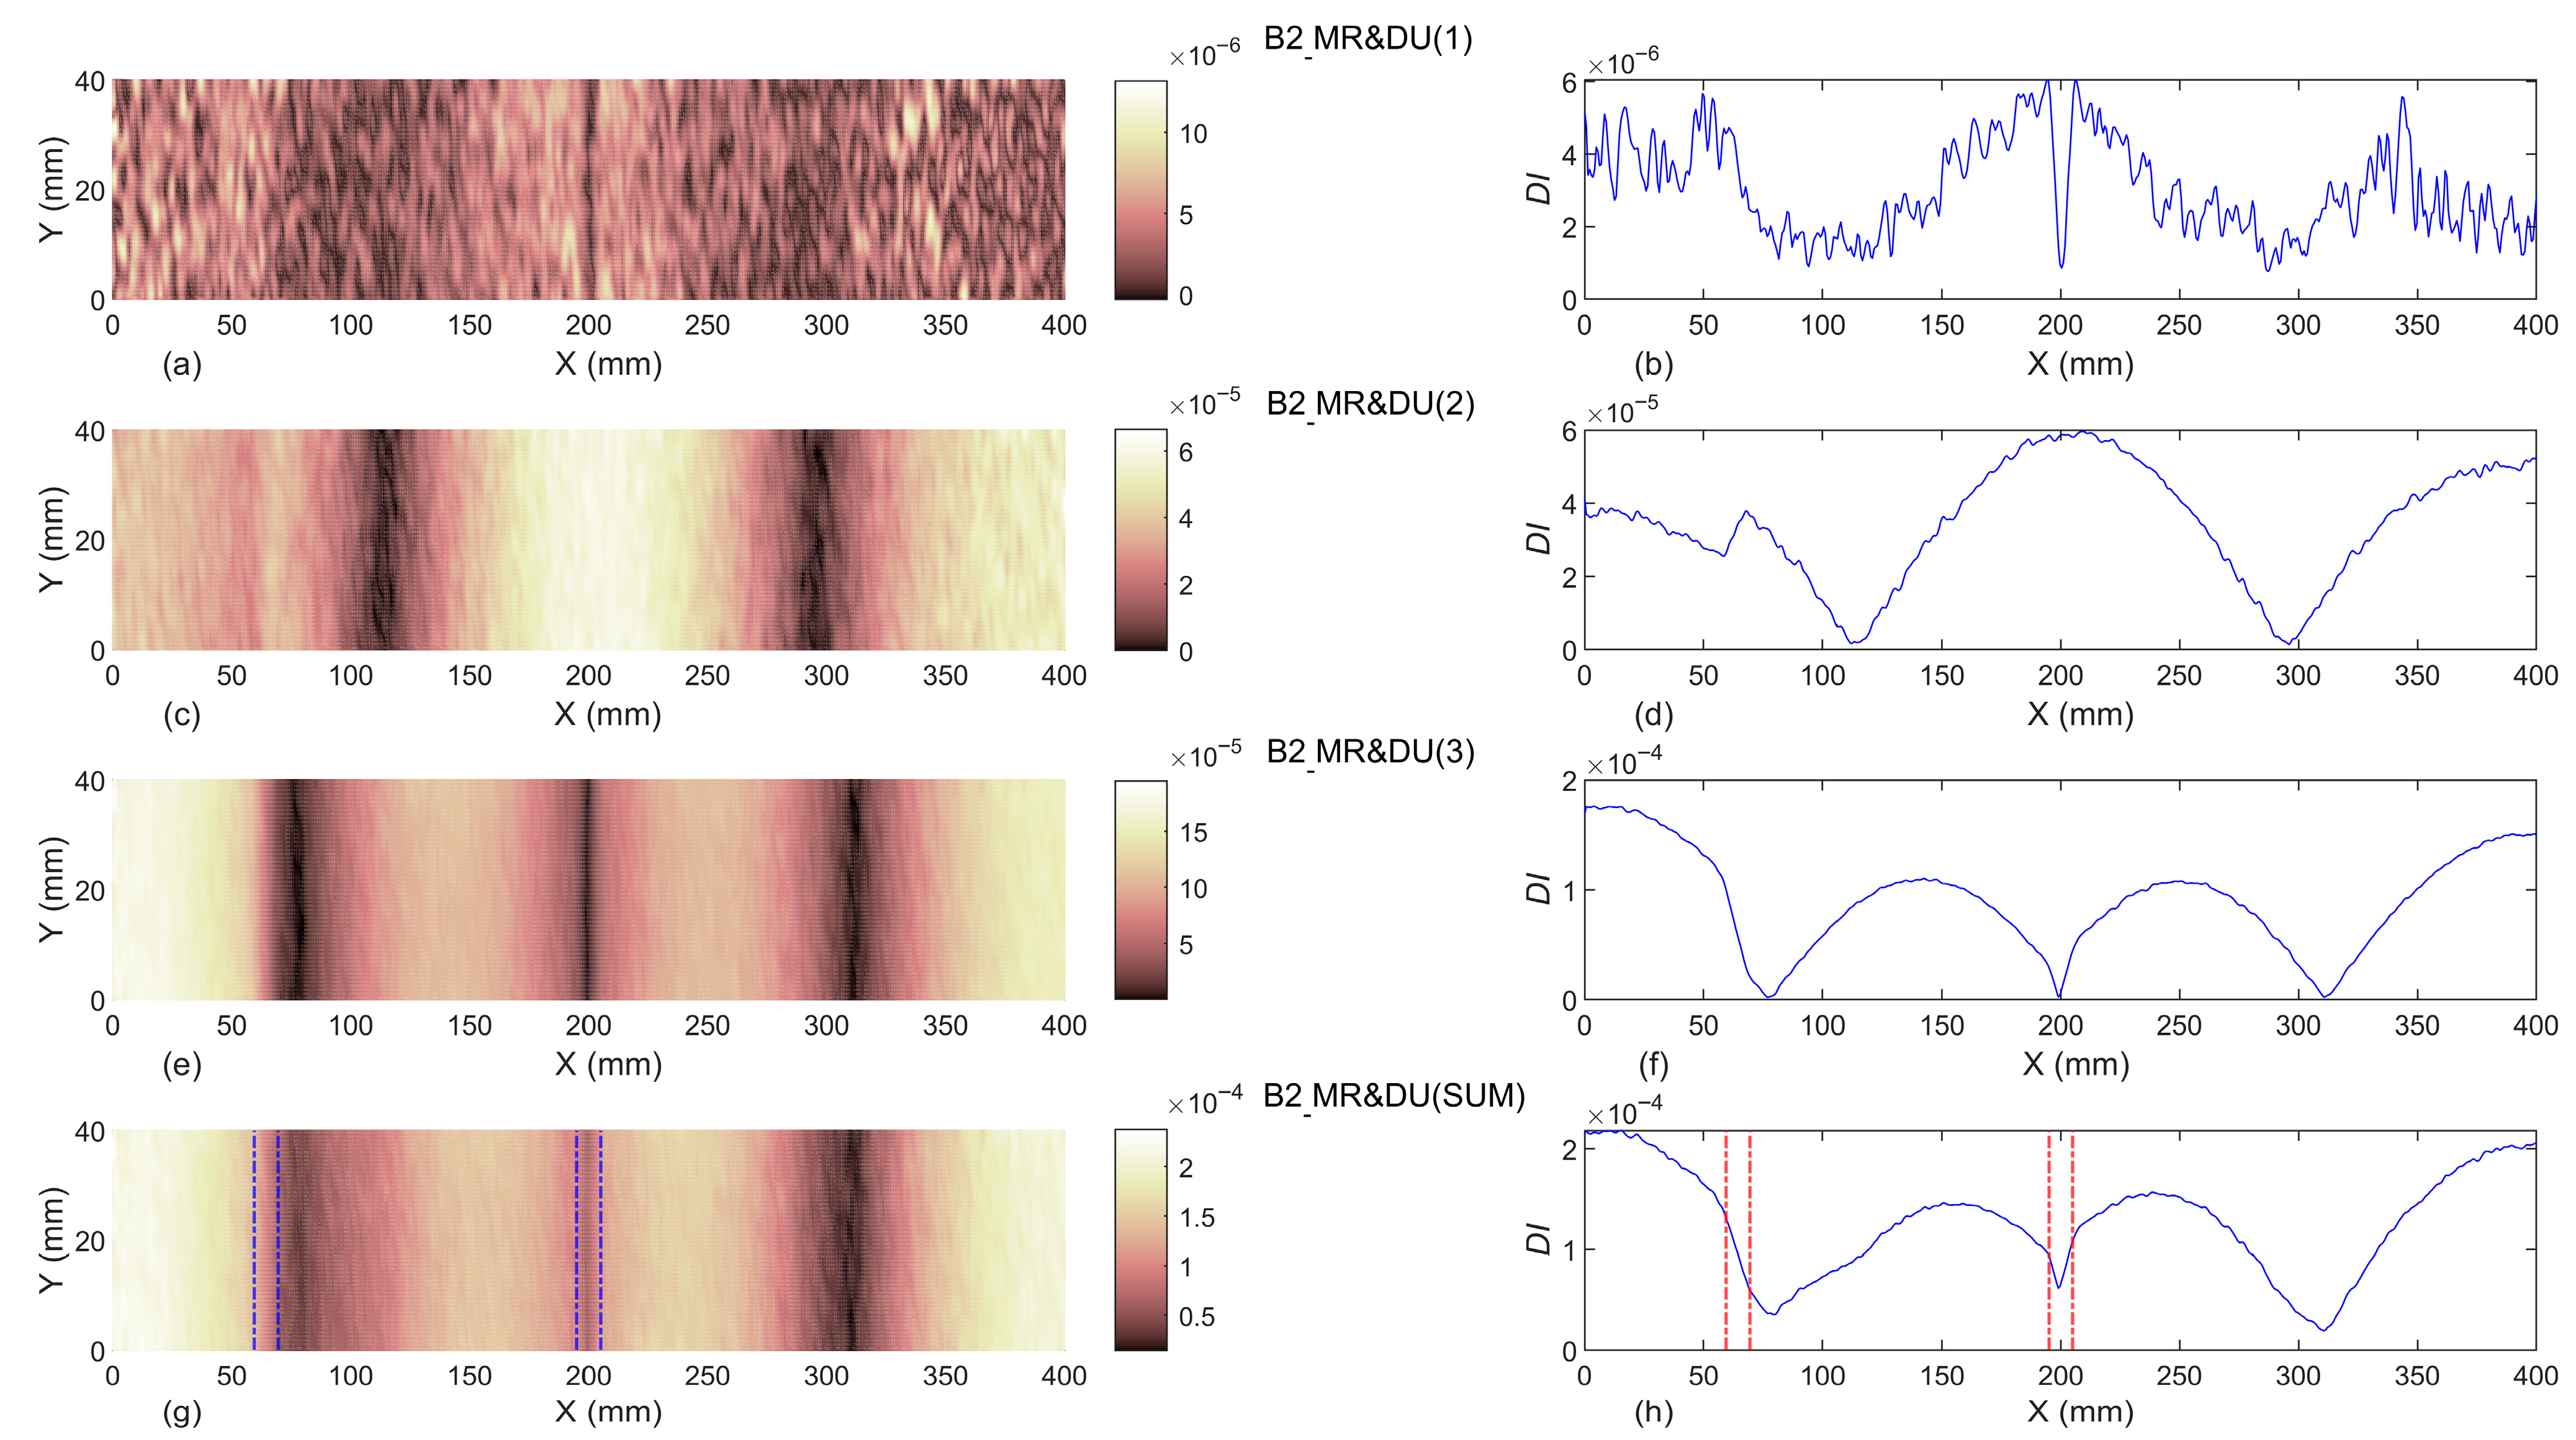
The results of the proposed damage indices M R & D U ( i ) , considering the first three modal rotations ( i = 1 ,   2 ,   3 ) and their summation ( S U M ) including the undamaged beam as the reference, in beams B1, B2, and B3 are respectively presented in Figure 11, Figure 12 and Figure 13. The exact location(s) of slot(s) are presented by dash-dot lines (-.) in these figures.
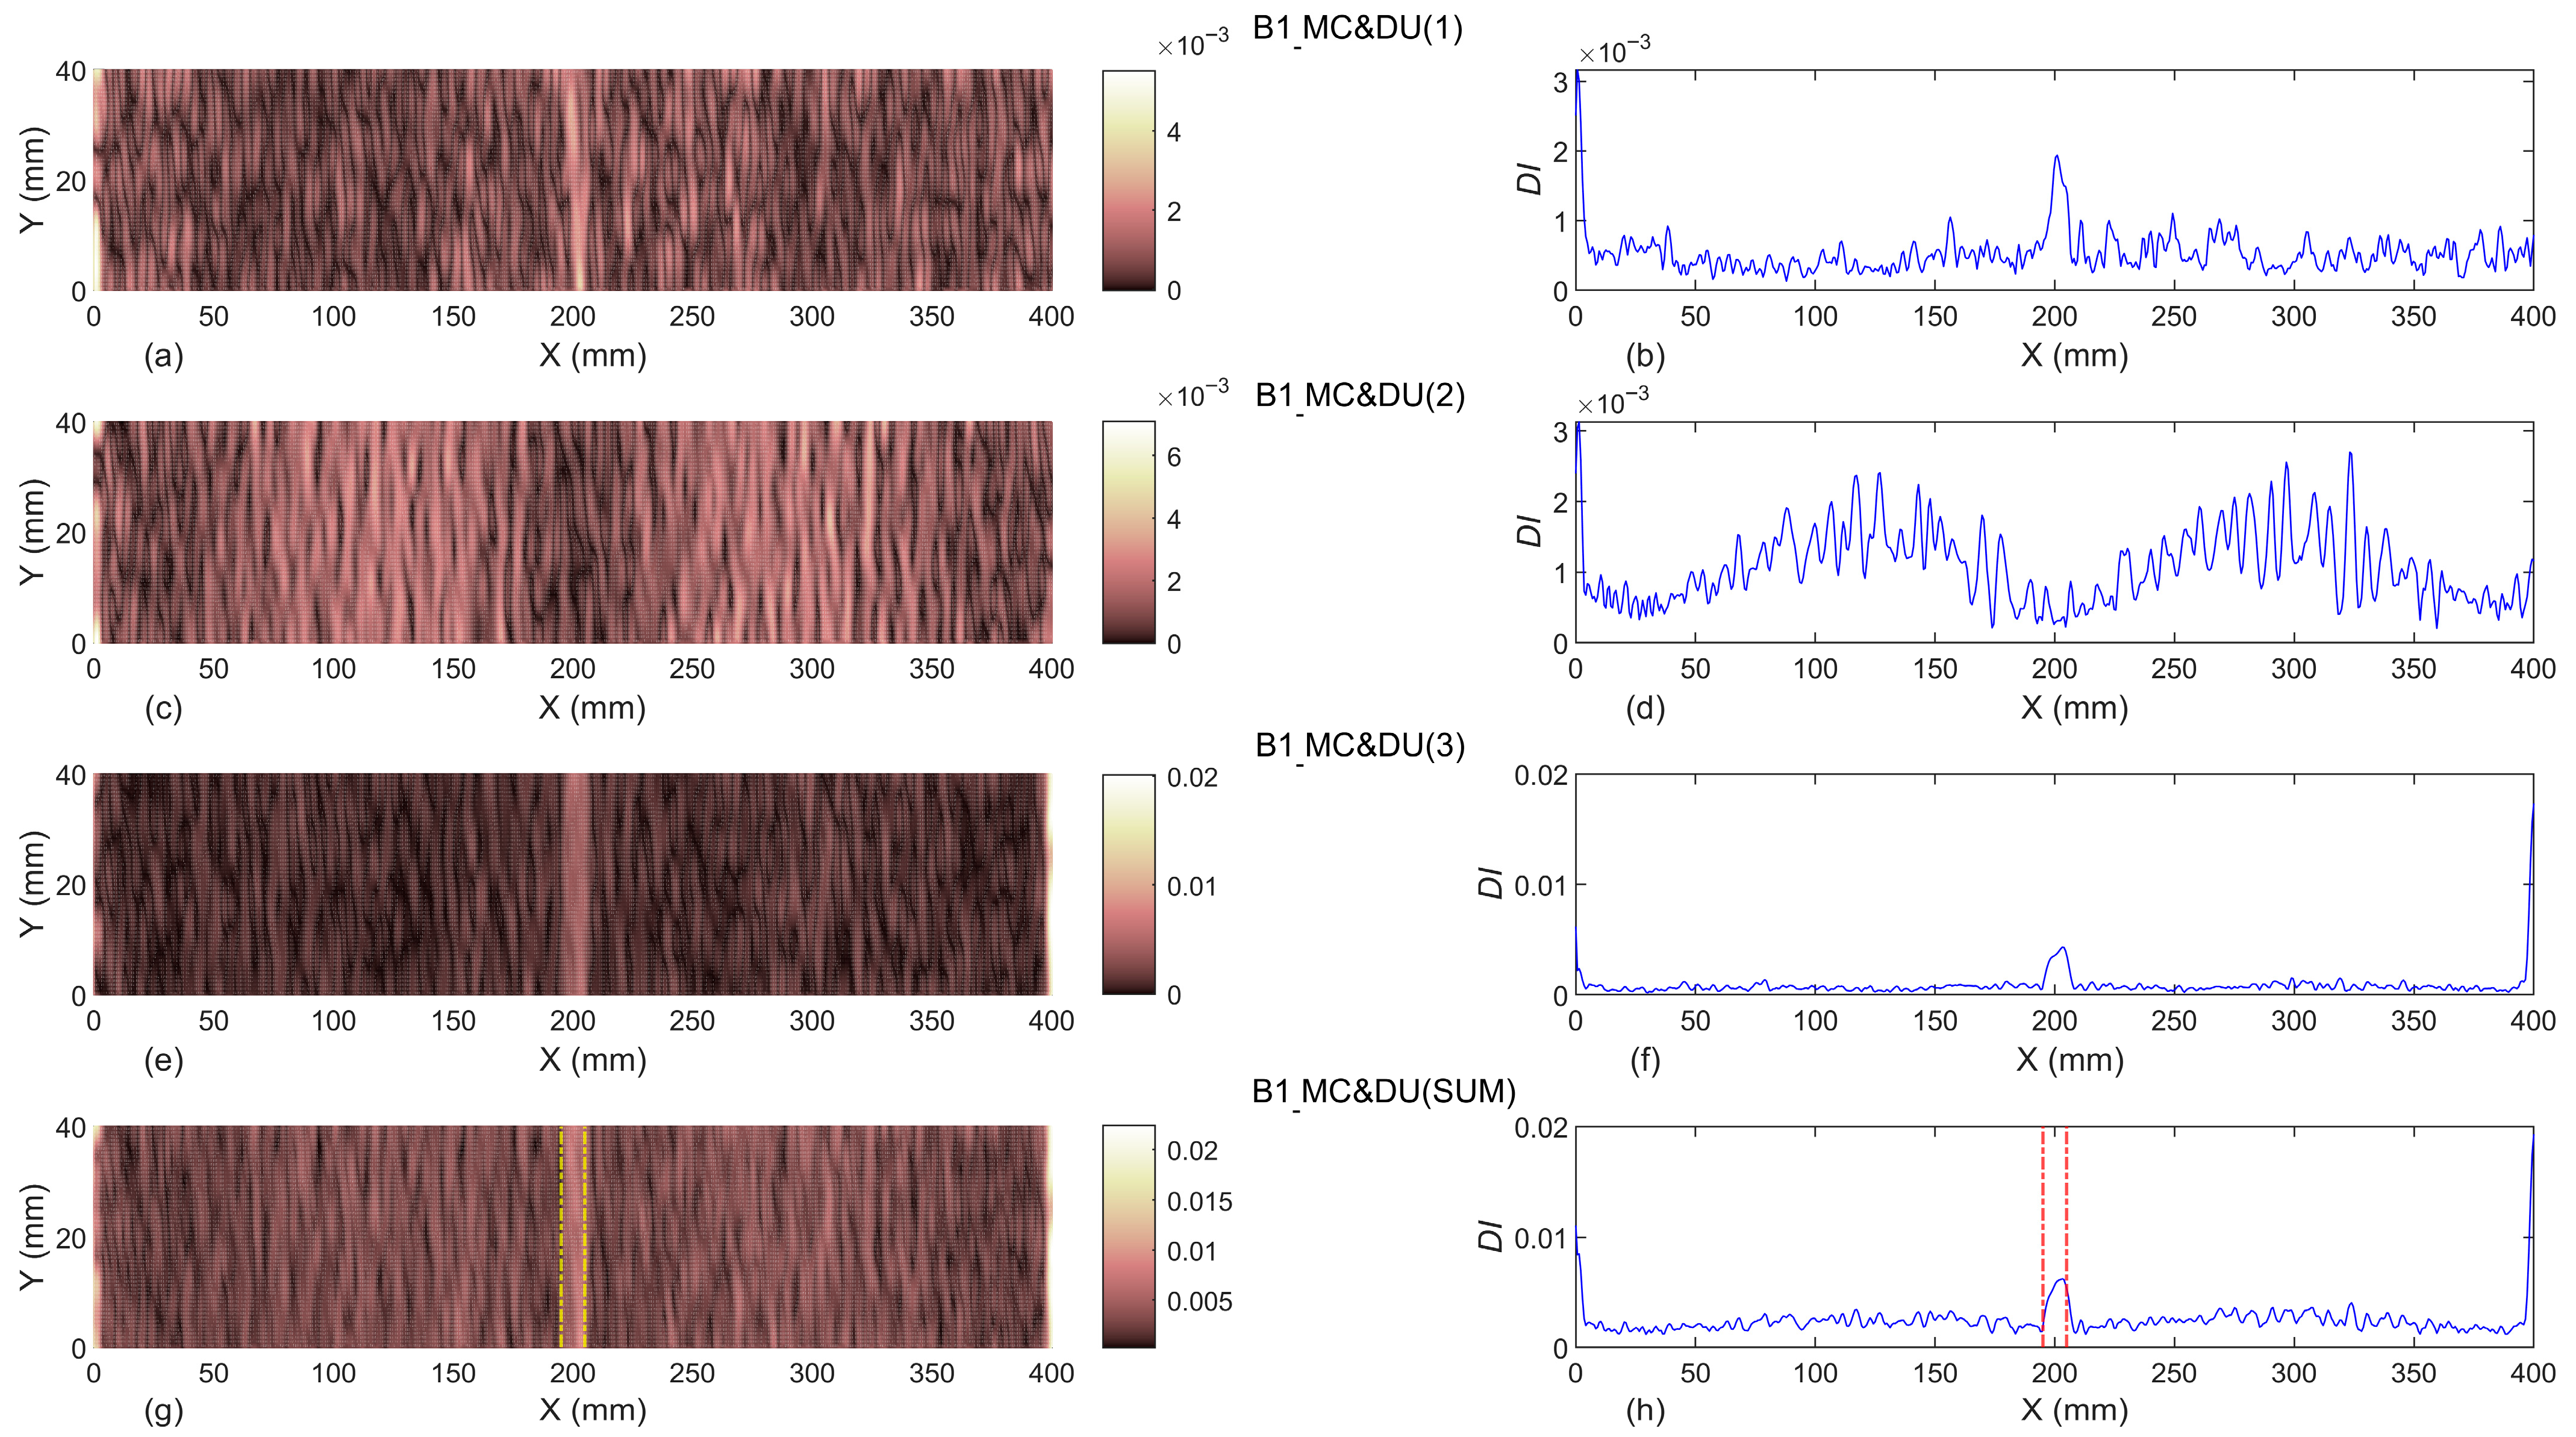
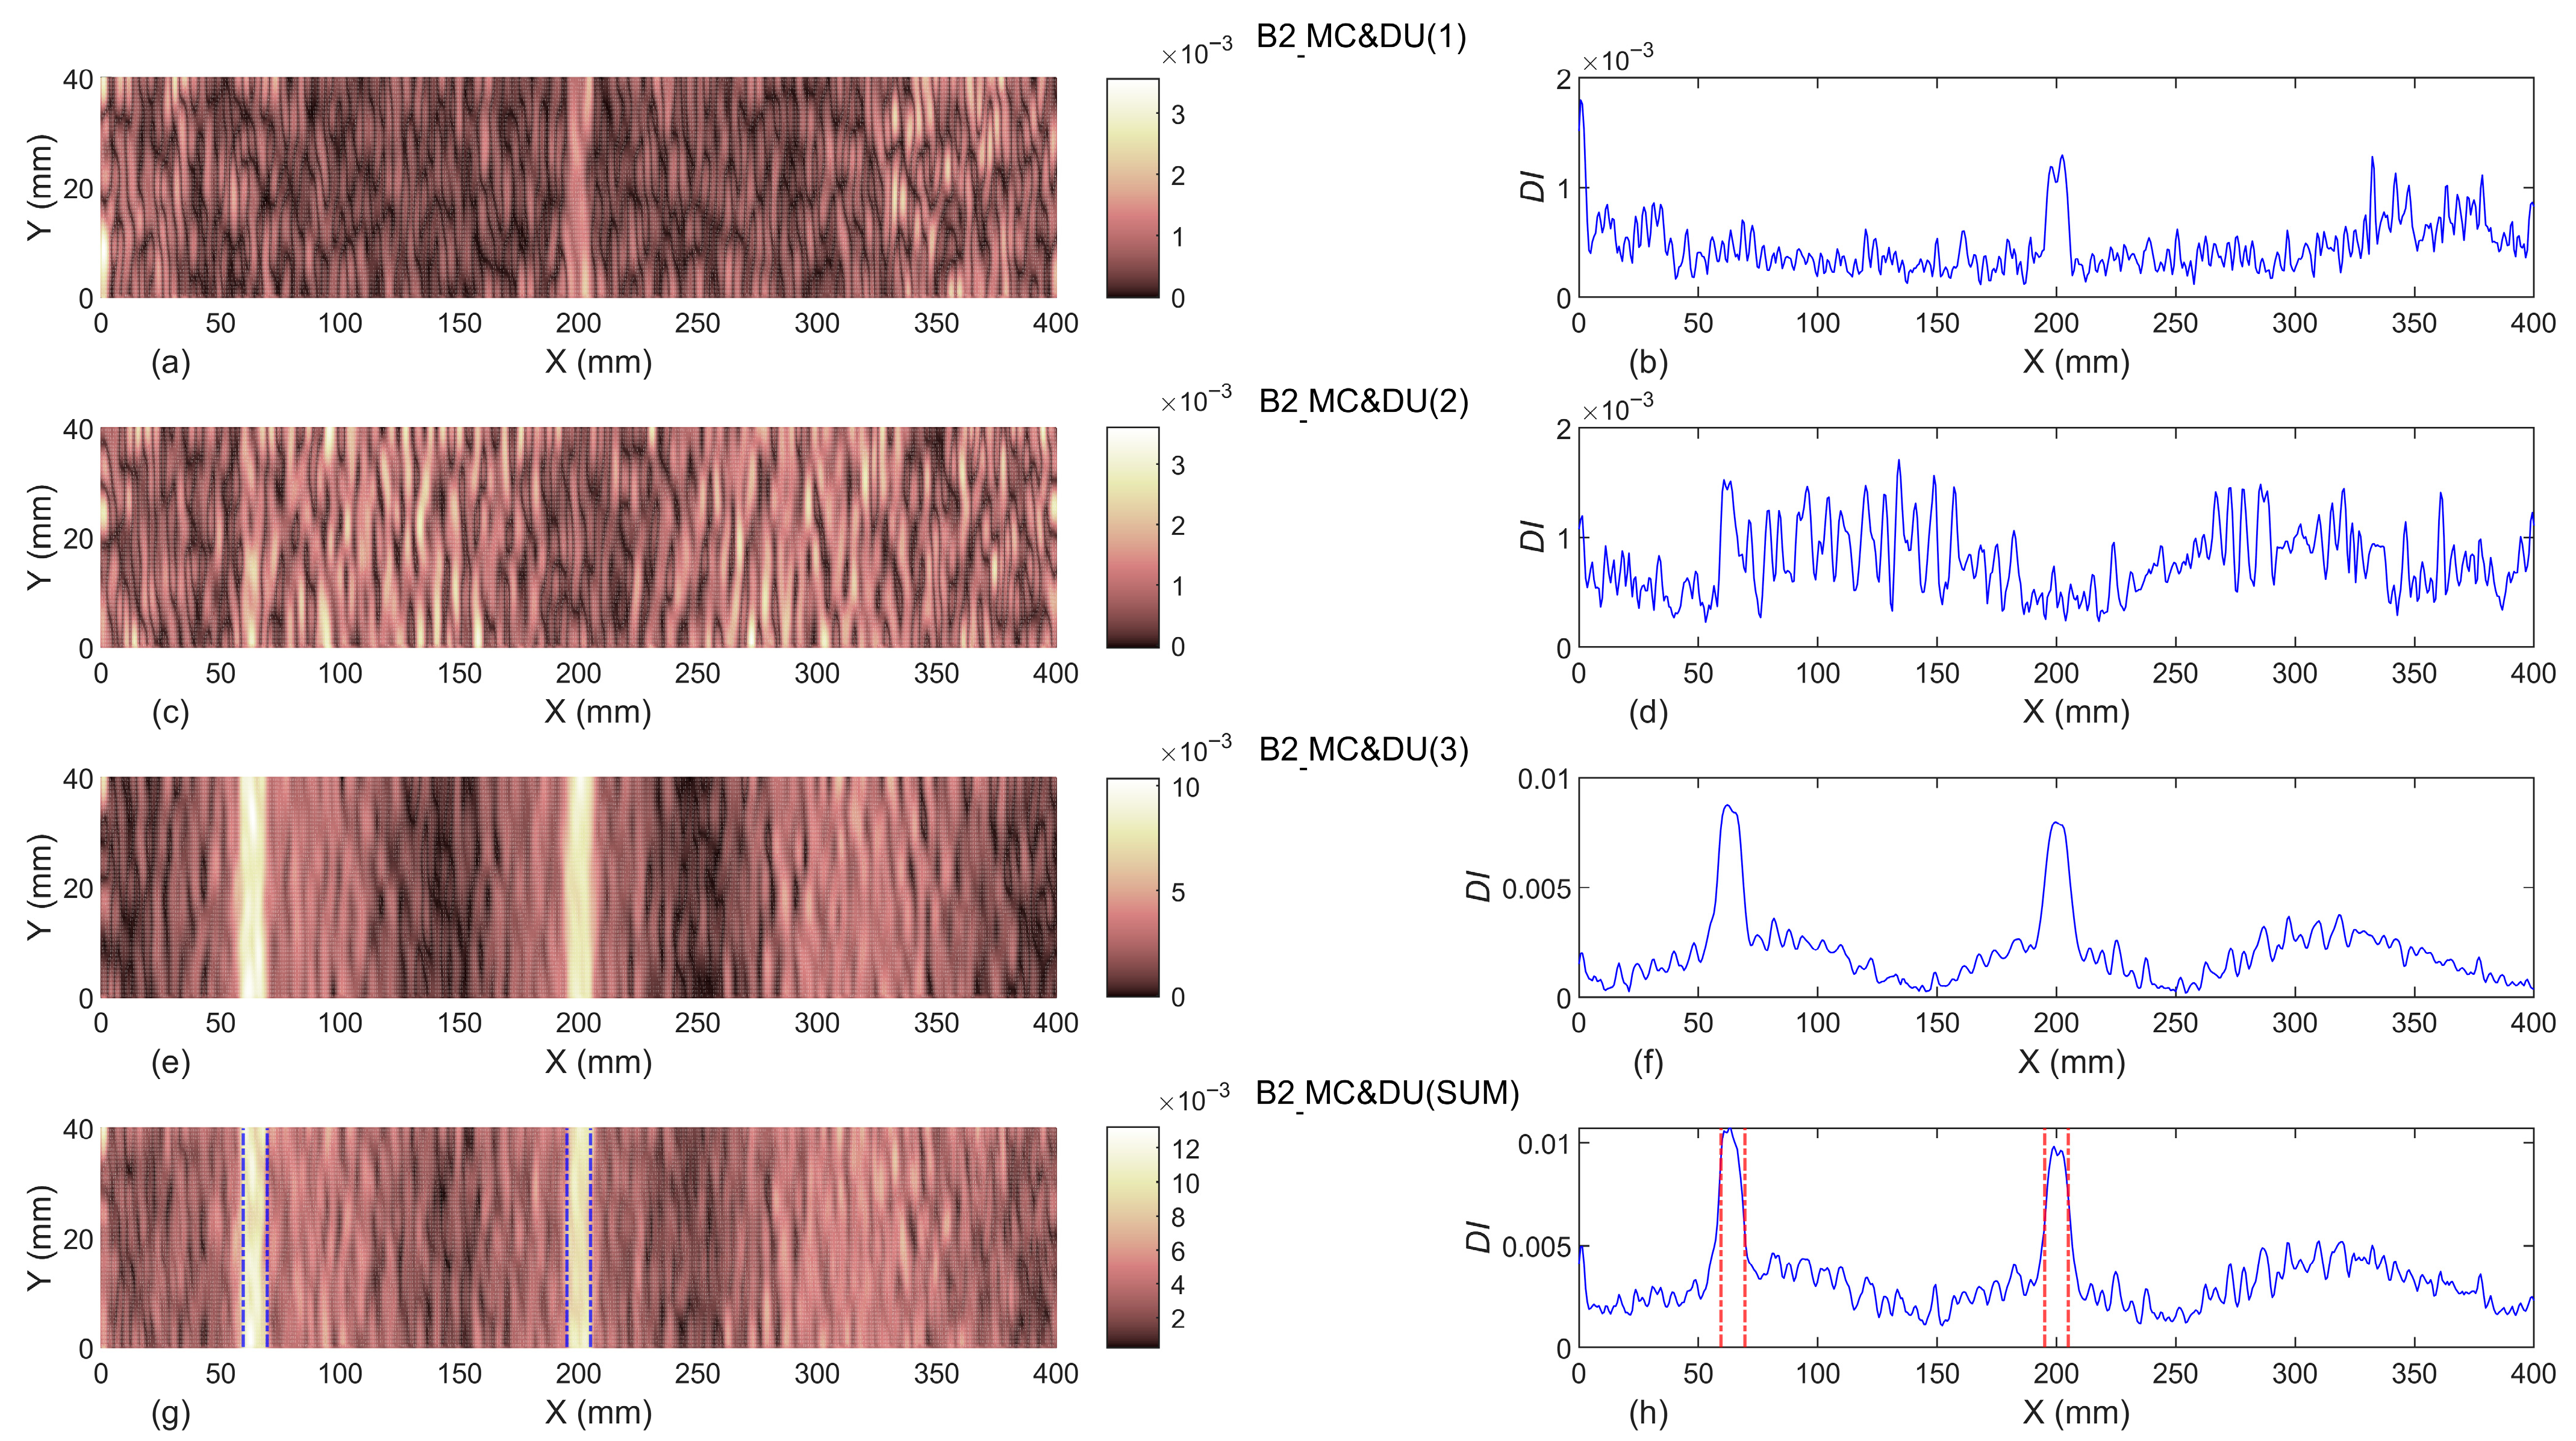
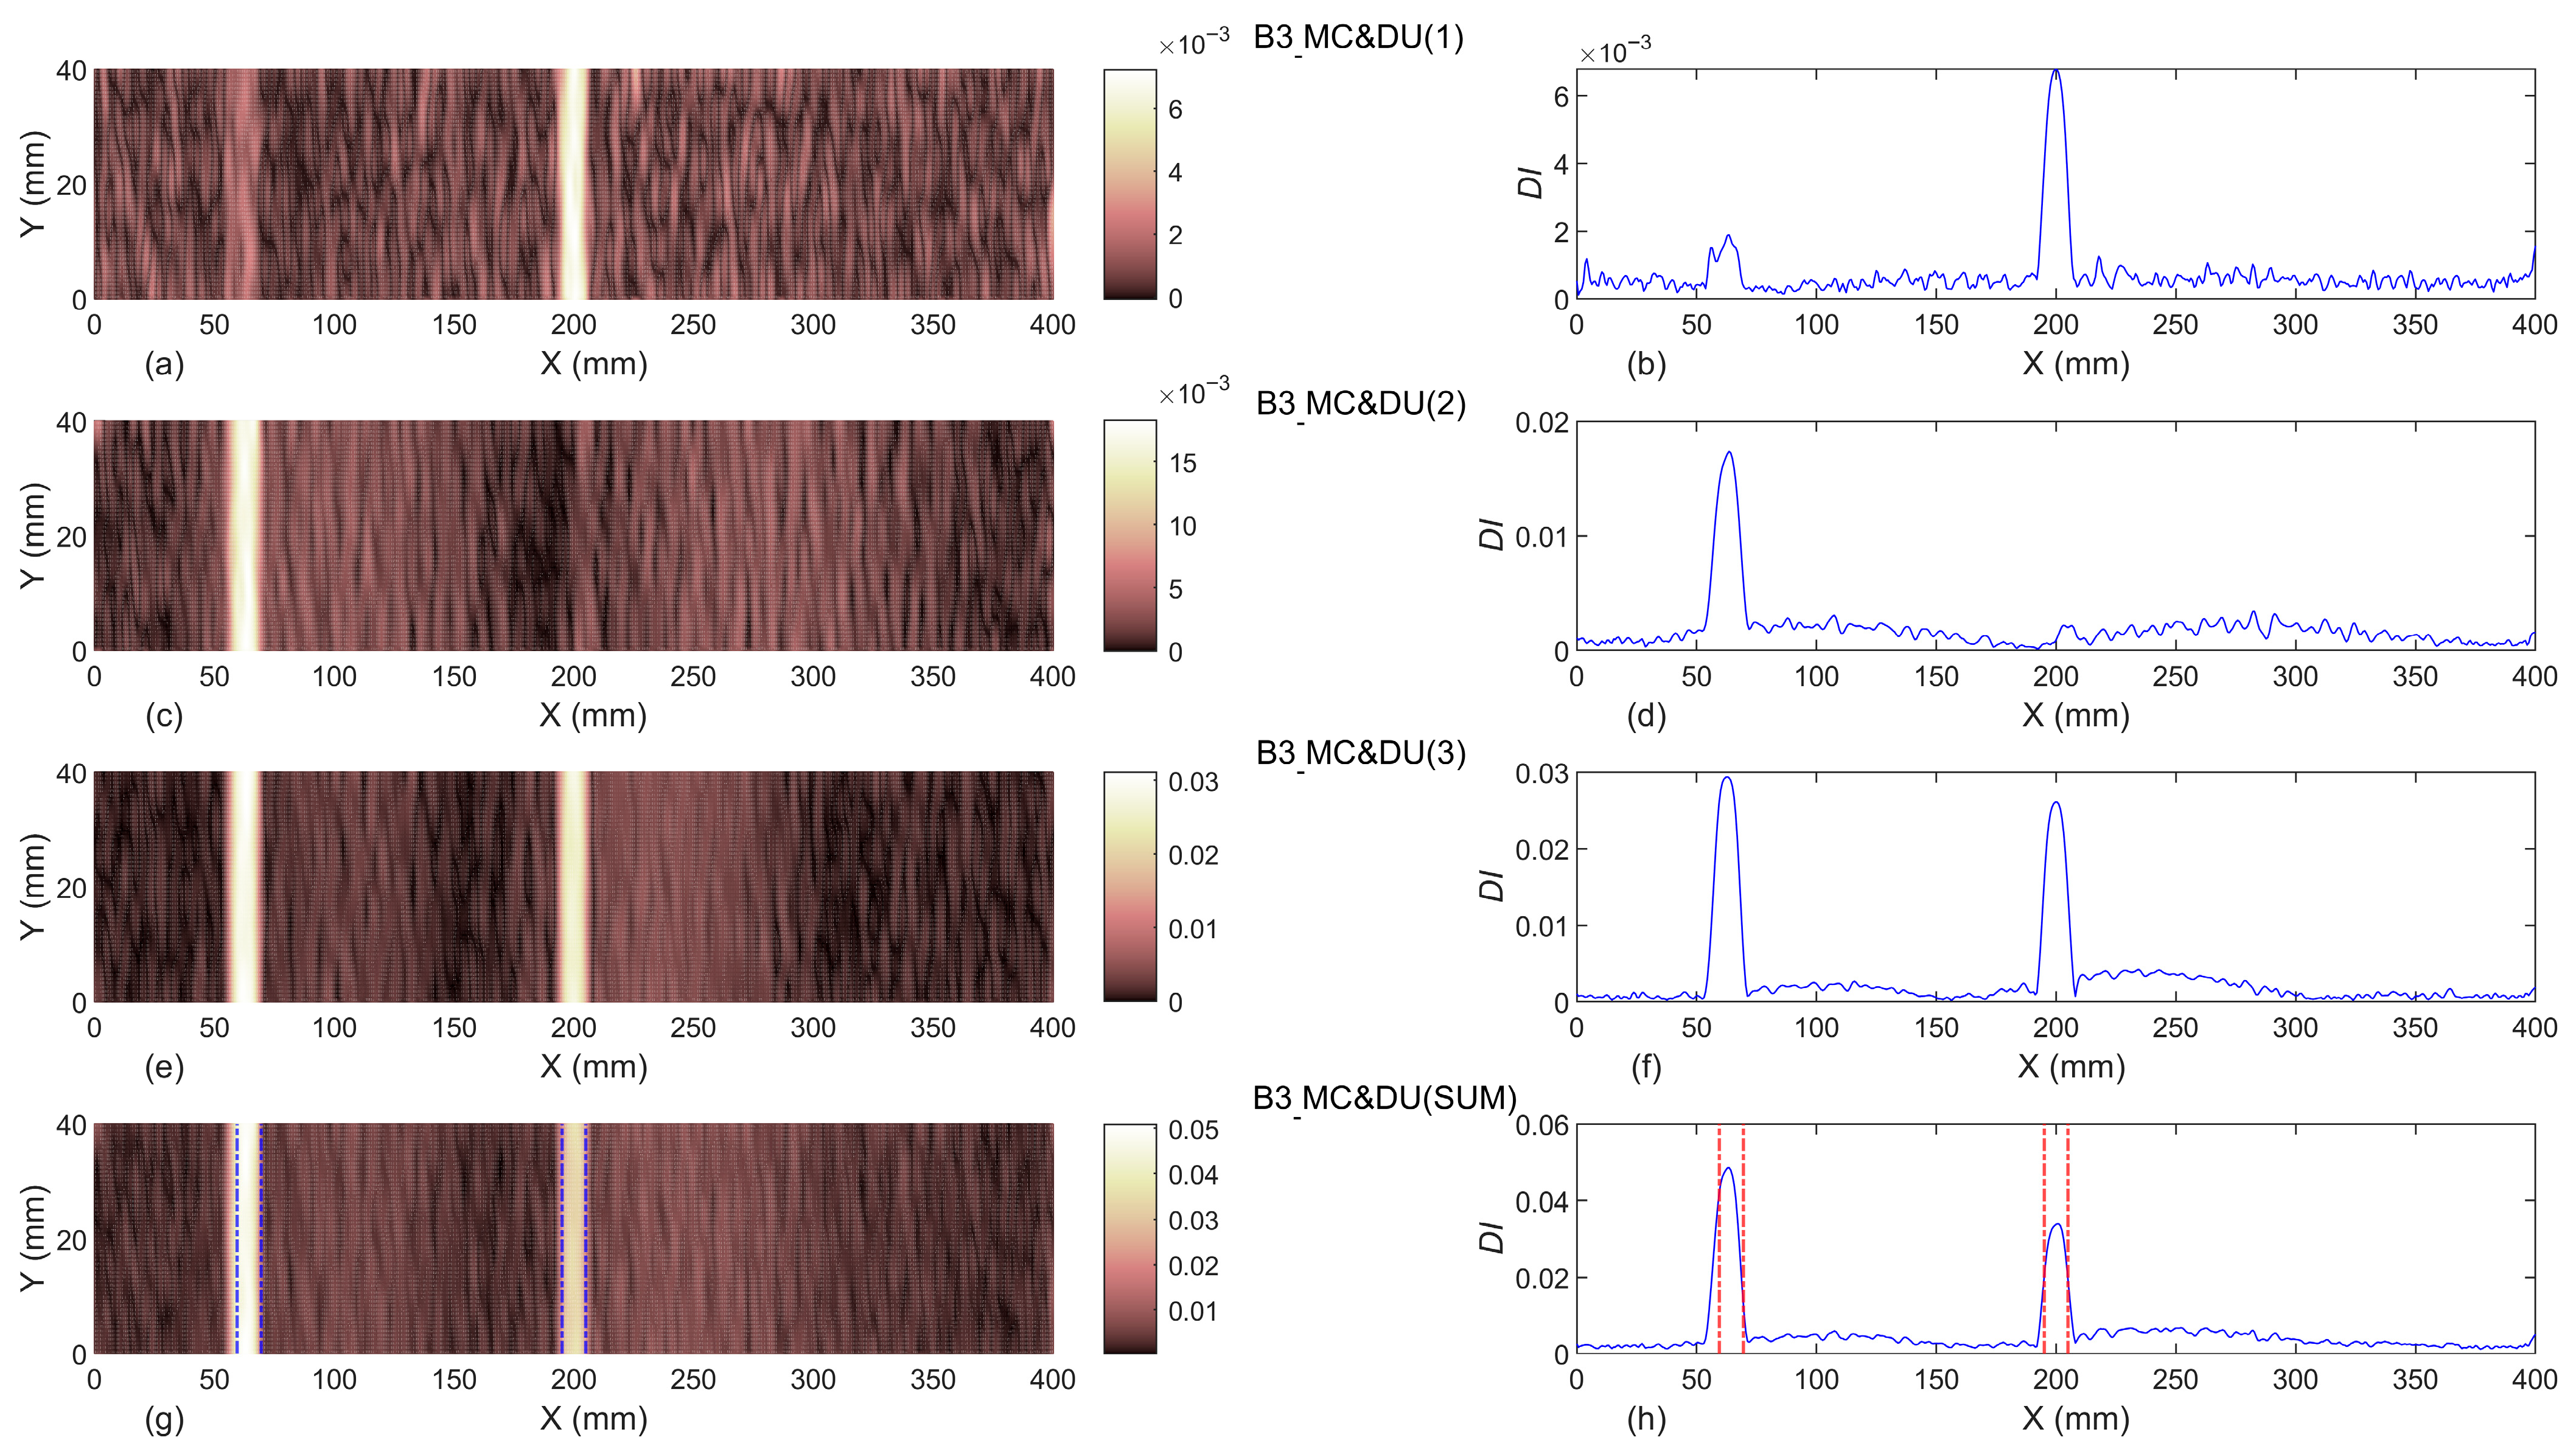
Investigations of the obtained results of the proposed damage indices M R & D U ( i ) for Beams B1, B2 and B3 in Figure 11, Figure 12 and Figure 13 show that even considering the undamaged beam (B0) as the baseline, utilizing the first three modal rotations cannot reveal the location of damage scenarios in damaged beams.

3.2. Modal Curvatures

After investigating the modal rotations in Section 3.1, in this section, the modal curvatures of damaged beams (B1, B2, and B3) are introduced to the contourlet transform to compute the proposed damage indices, with baseline-free and baseline-included approaches for the first three modes ( i = 1 ,   2 ,   3 ) and their summation ( S U M ), named M C & D ( i ) and M C & D U ( i ) , respectively.

3.2.1. Baseline-Free

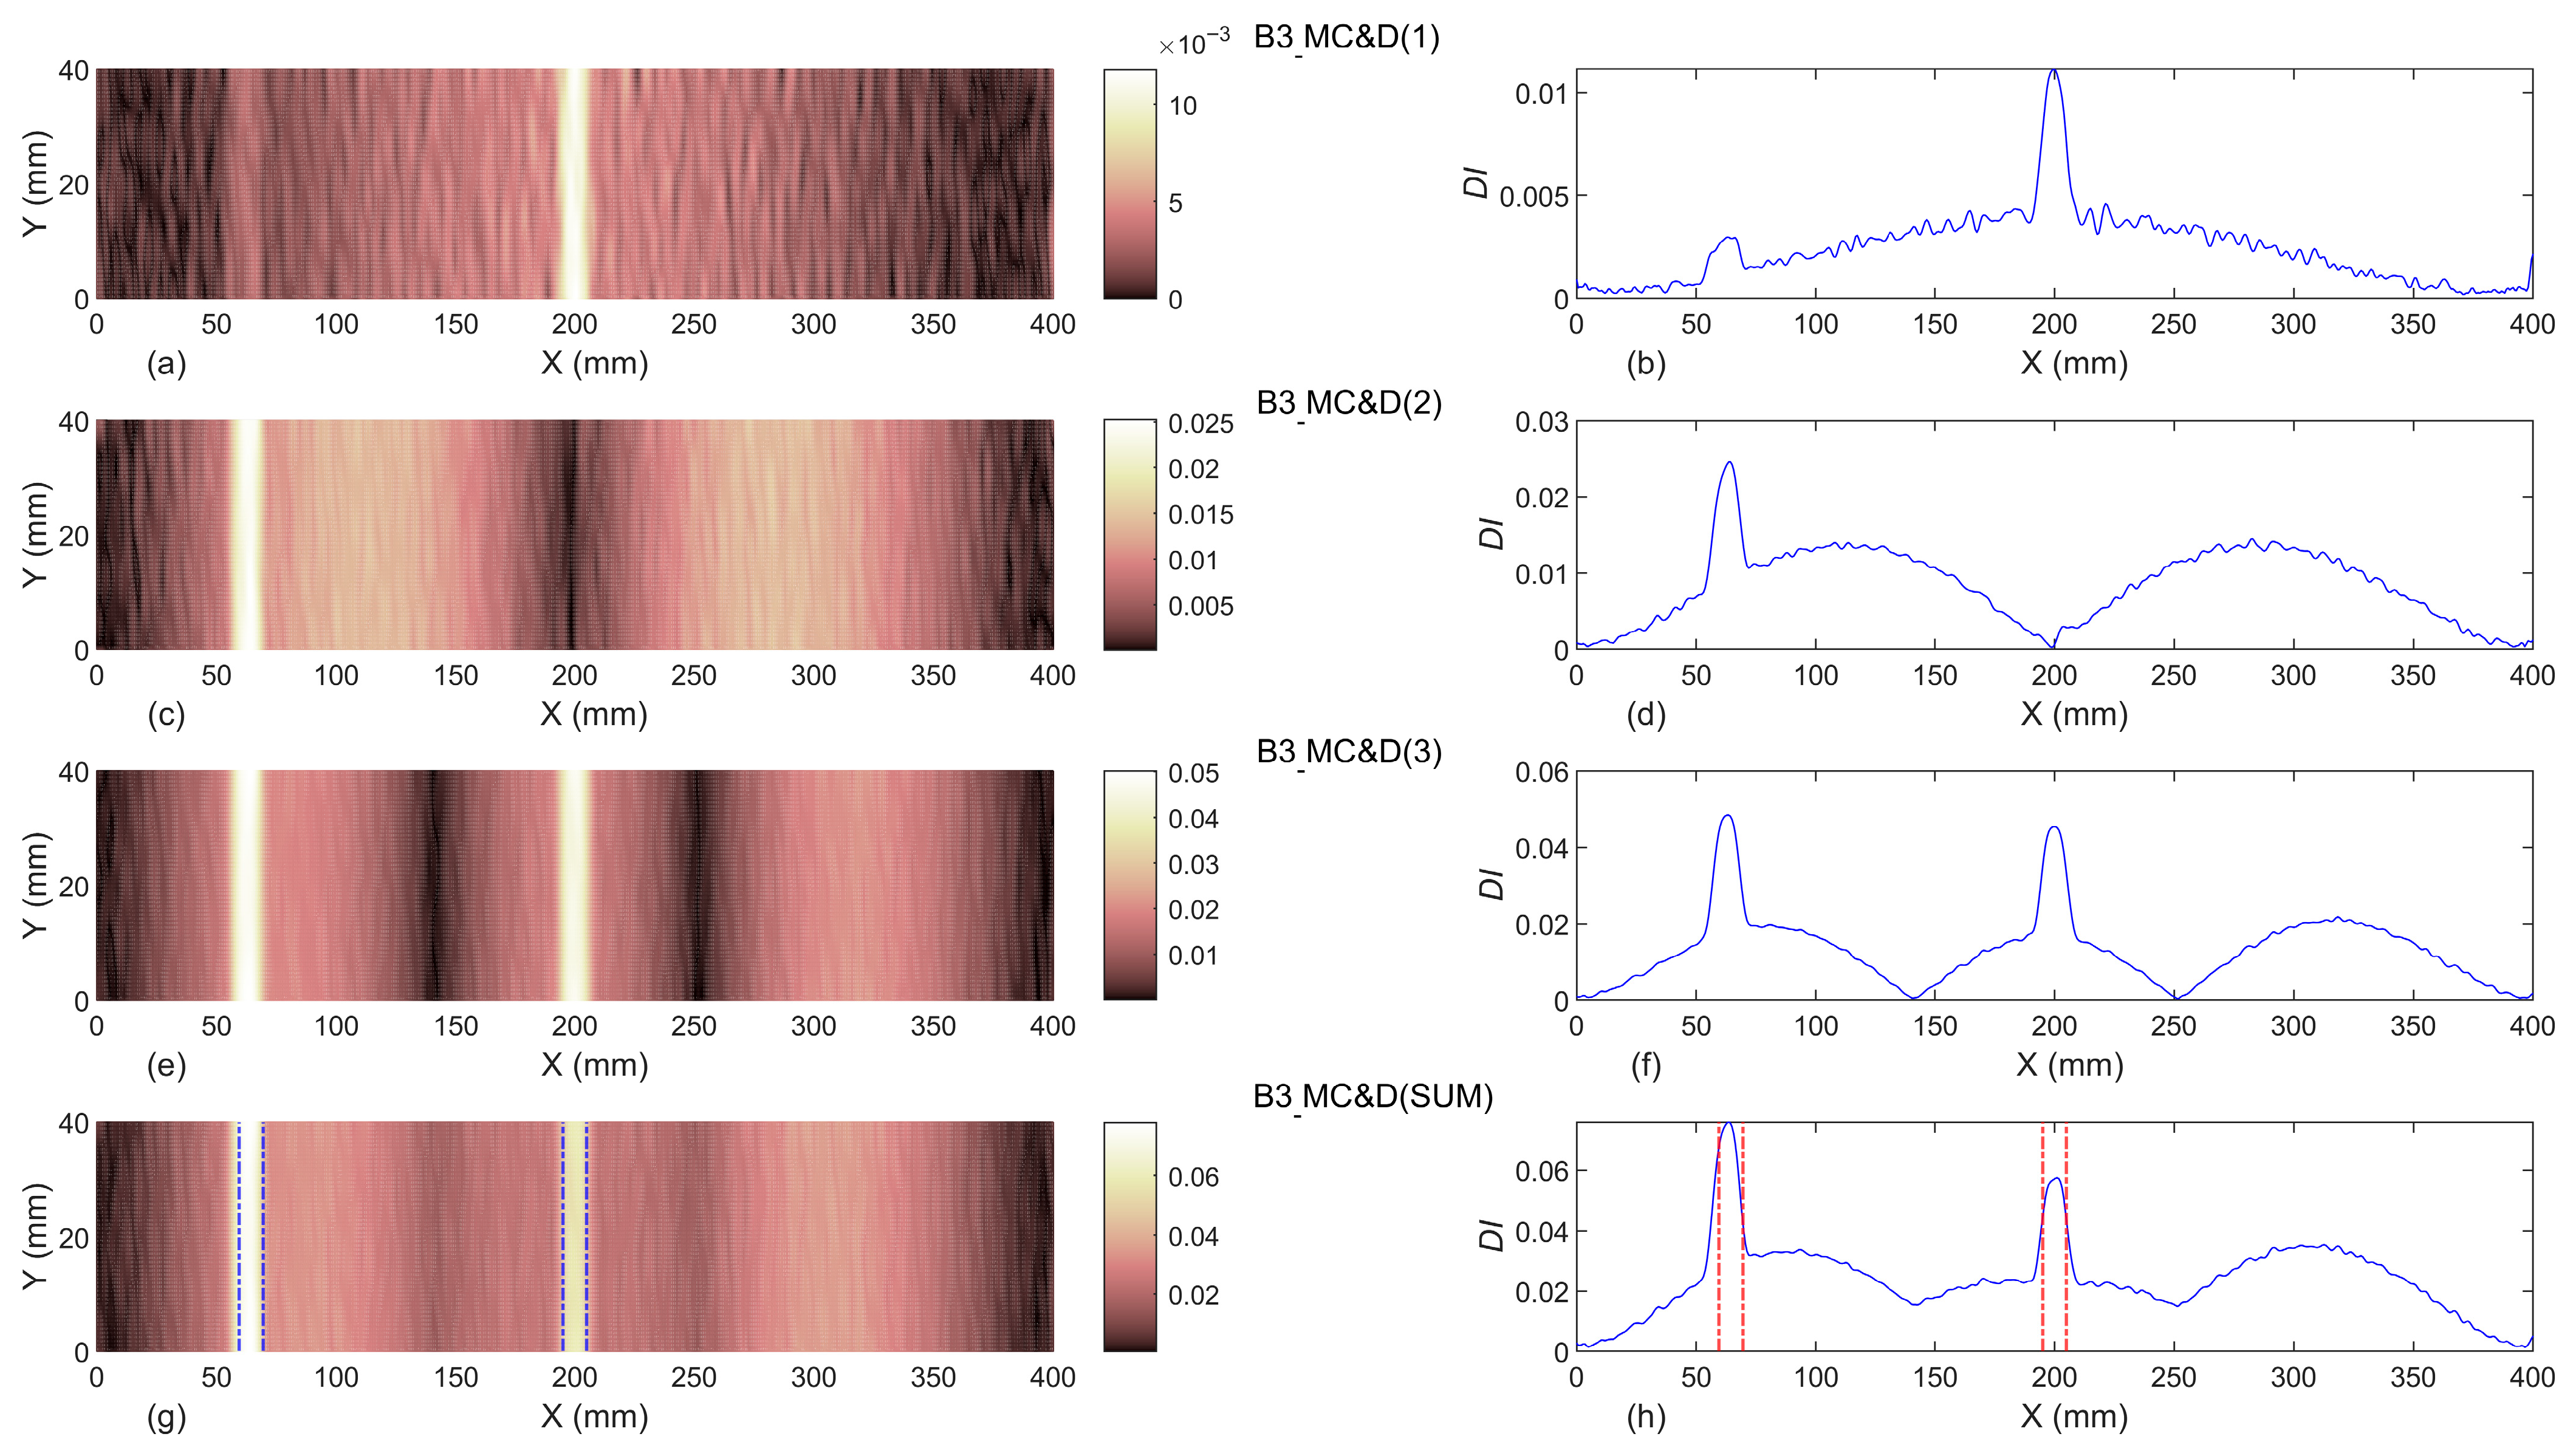
By introducing the first three modal curvatures ( i = 1 ,   2 ,   3 ) and their summation ( S U M ) of damaged beams, without considering the undamaged beam as the reference, to the contourlet transform, the proposed baseline-free damage indices, M C & D ( i ) , can be computed for beams B1, B2, and B3 which, in addition to the exact location(s) of slot(s) by dash-dot lines (-.), are depicted in Figure 14, Figure 15 and Figure 16.
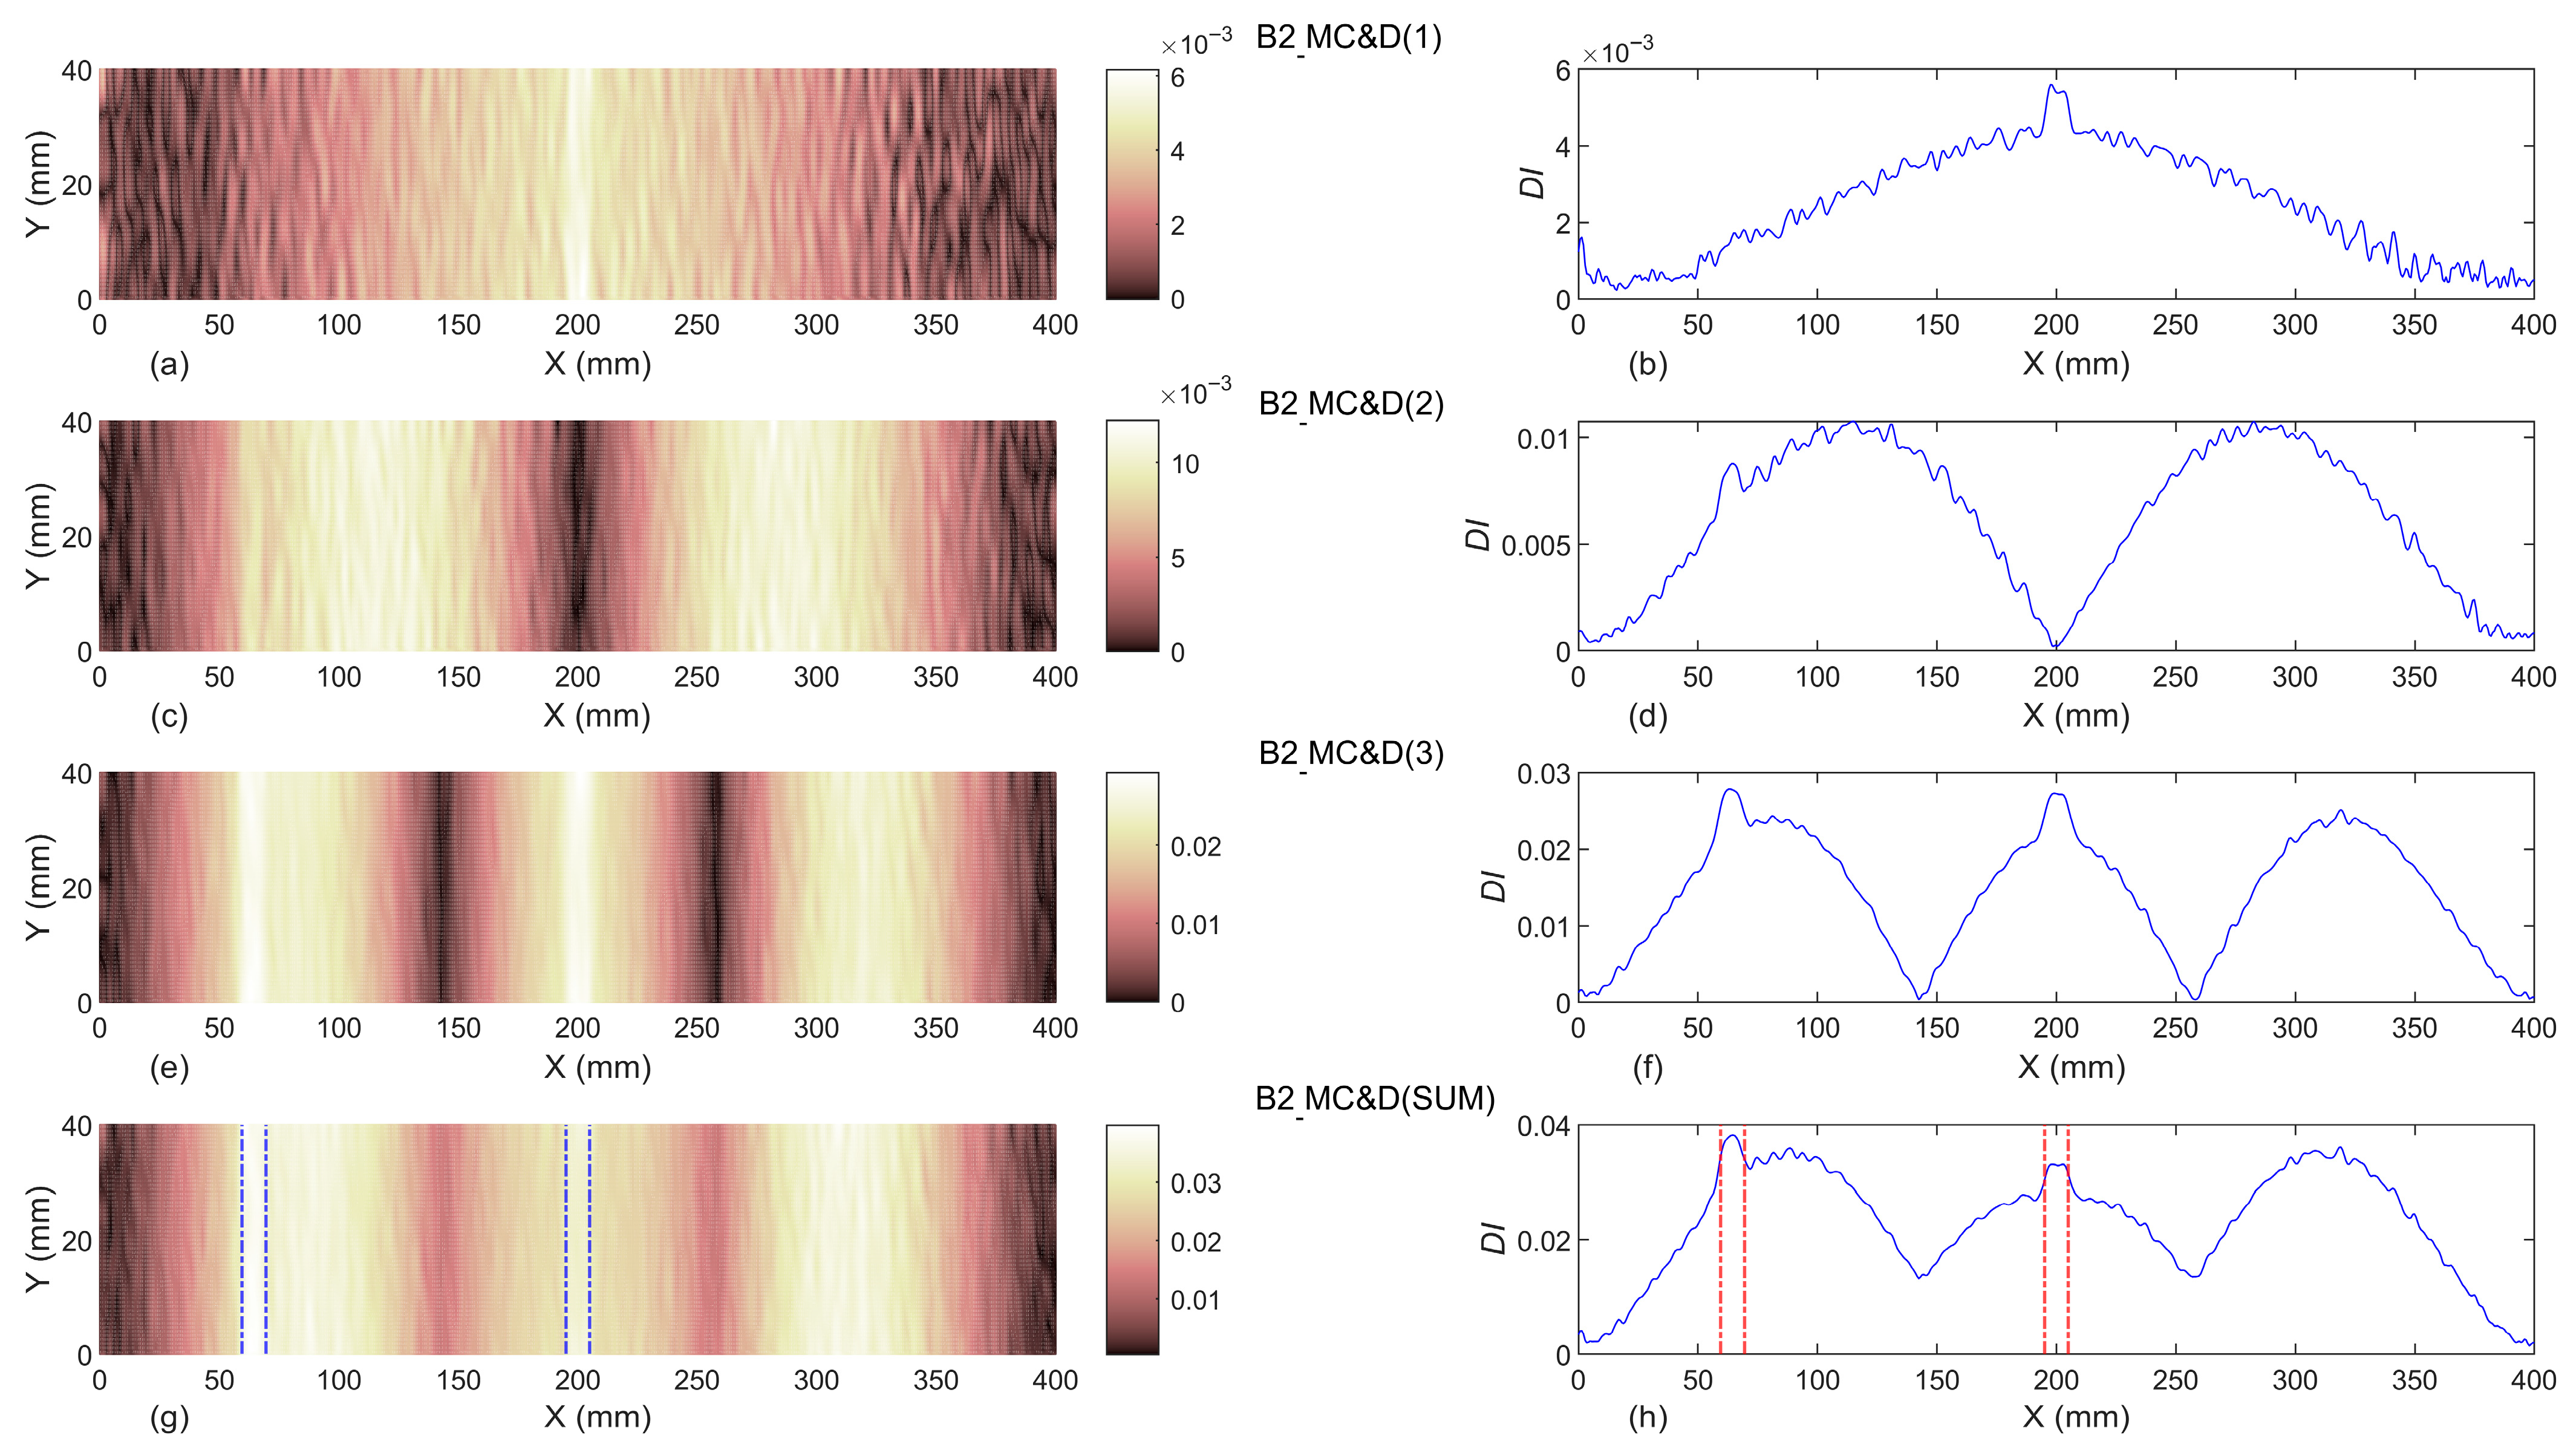
The presented results in Figure 14, Figure 15 and Figure 16 show that the location of damage in beams B1 and B2 cannot be accomplished utilizing the first three modal curvatures as the input of the proposed baseline-free damage indices. On the other hand, the proposed baseline-free damage index using the first three modal curvatures detected the exact location of damage in beam B3. A well match can be found between the width of identified damage scenarios and the exact experimental width of slots in B3. As a result, it can be mentioned that in the current study, the baseline-free damage index is not capable of identifying the damage in beams B1 and B2, but can detect the damage location of damage in beam B3, which has the higher damage level.

3.2.2. Baseline-Included

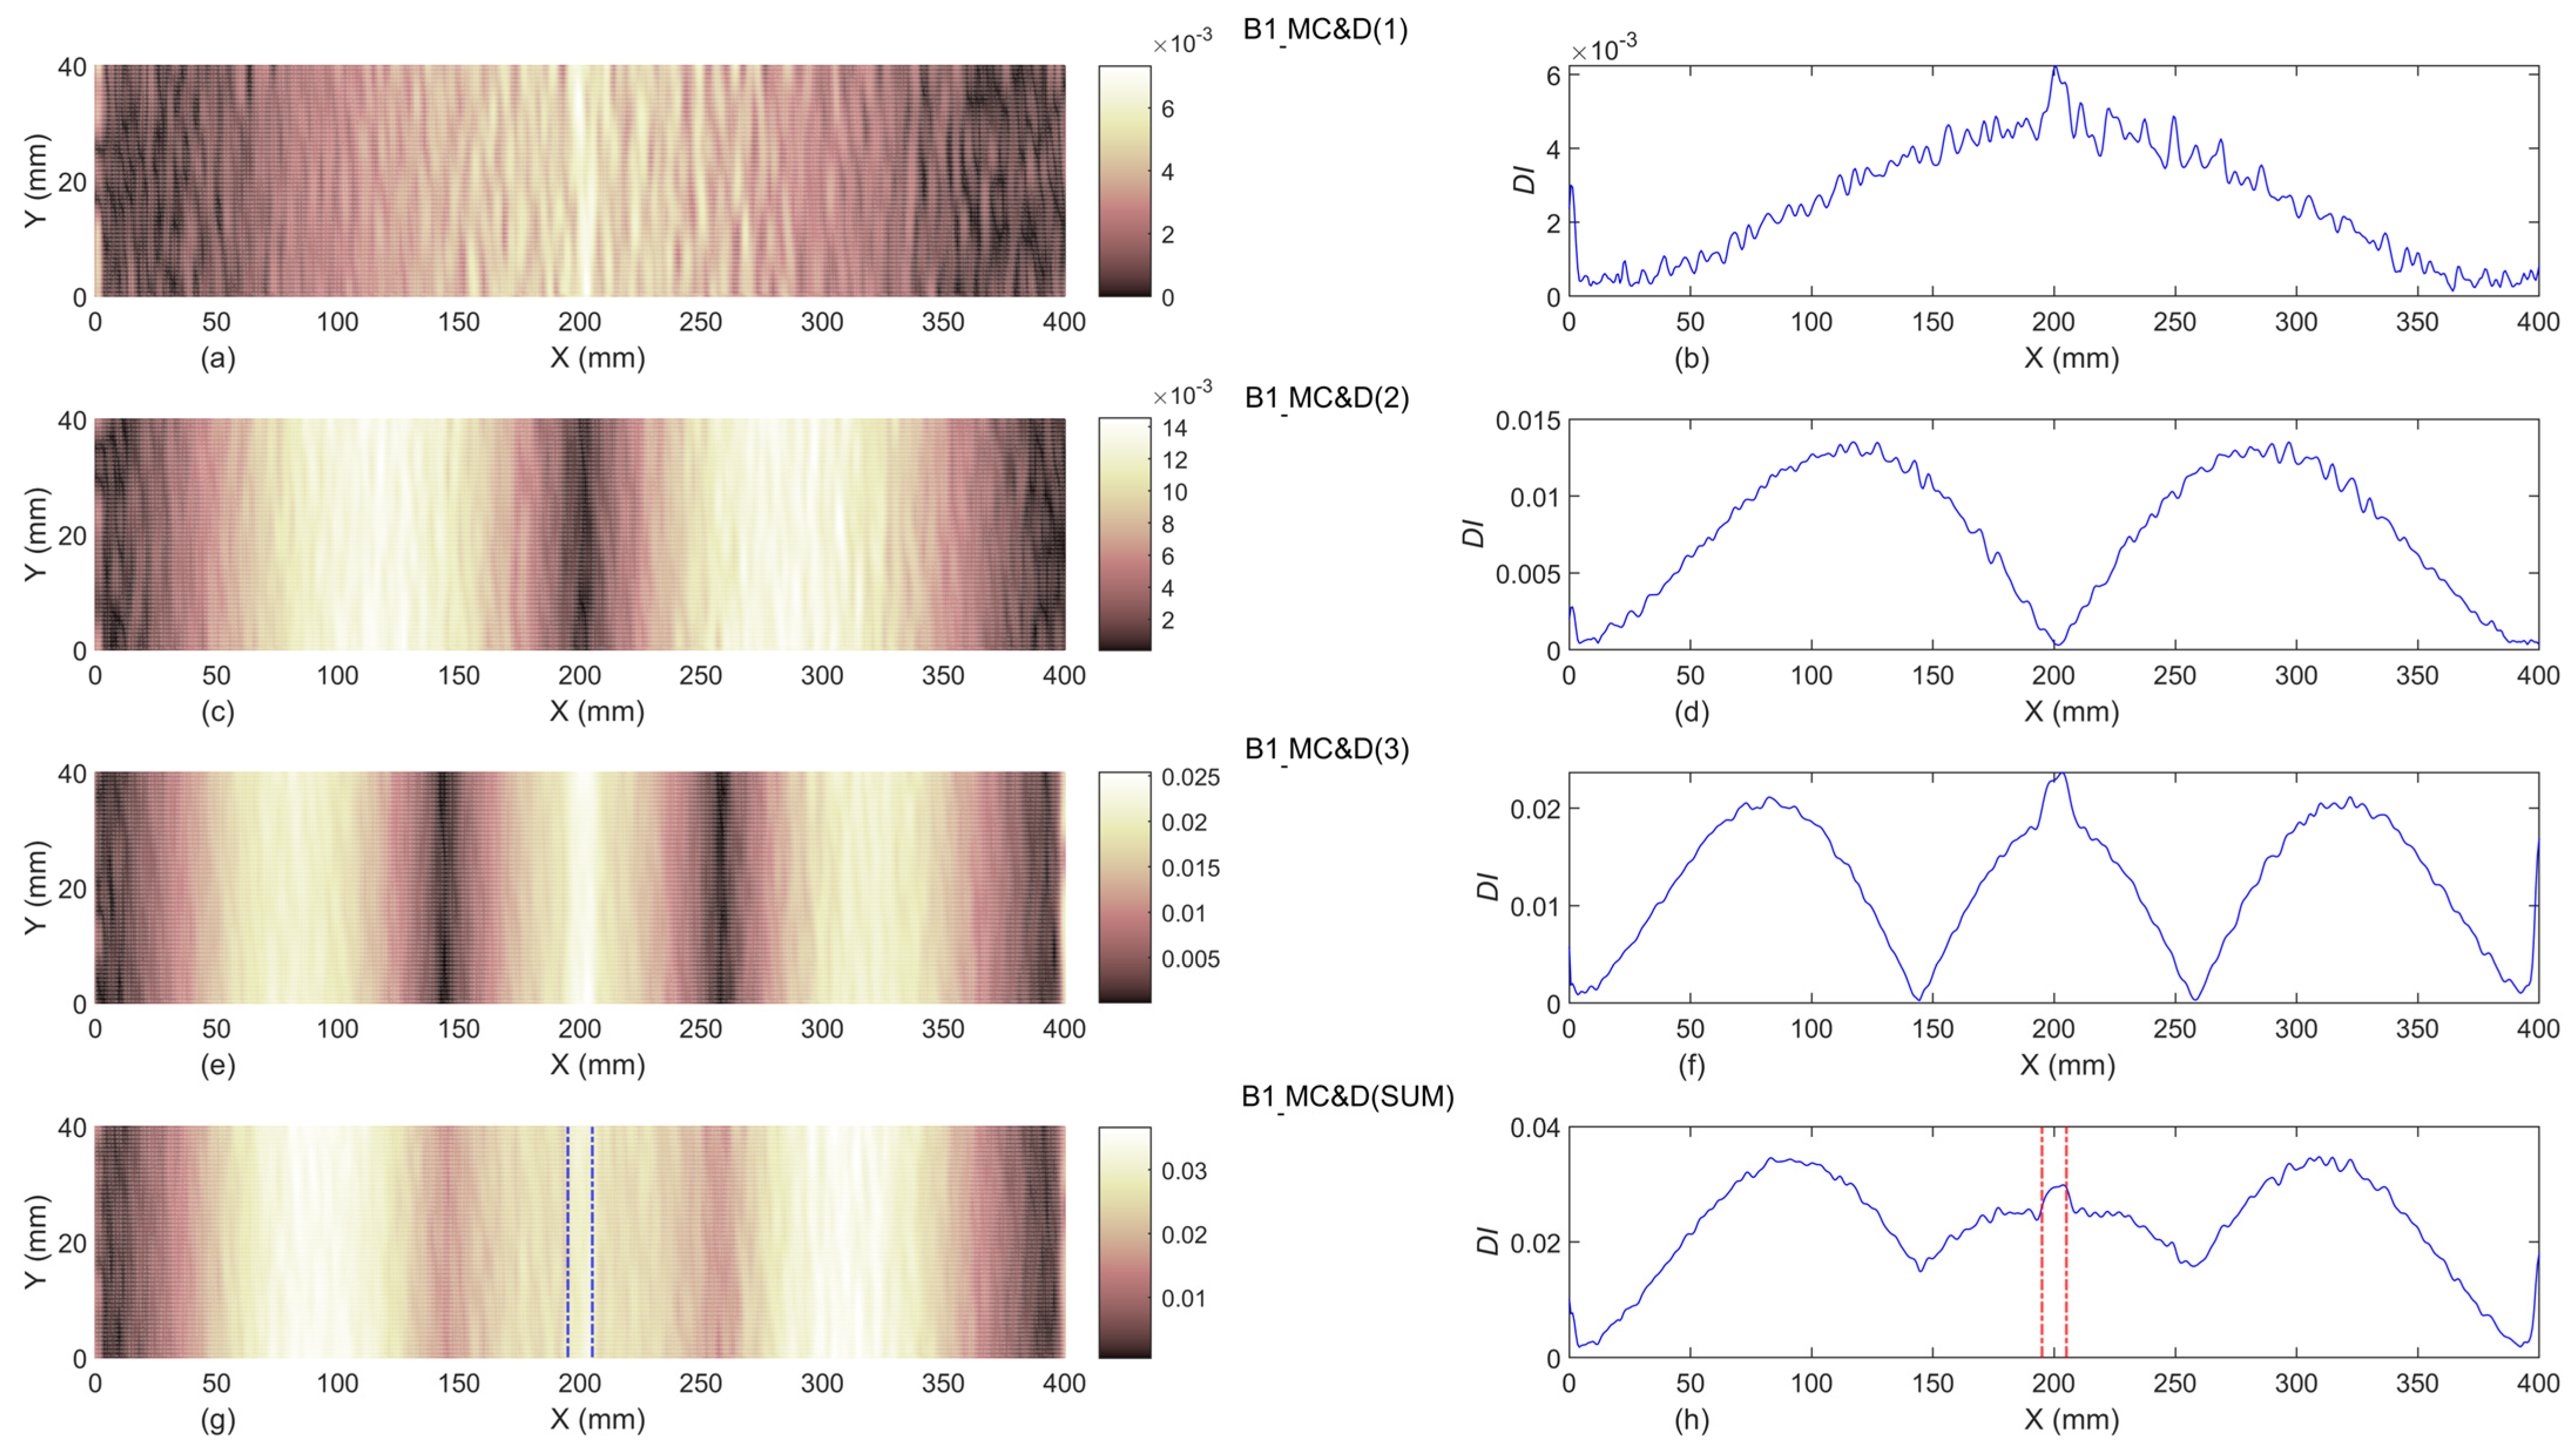
Figure 17, Figure 18 and Figure 19 show the exact location(s) of slot(s) by dash-dot lines (-.) and the results of the proposed damage indices M C & D U ( i ) , computed by introducing the first three modal curvatures ( i = 1 ,   2 ,   3 ) and their summation ( S U M ) to the contourlet transform, including the undamaged beam as the reference, respectively, in beams B1, B2, and B3.
Reviewing the illustrated results in Figure 17, Figure 18 and Figure 19 shows that for all damaged beams (B1, B2, and B3), the proposed damage indices M C & D U ( S U M ) can successfully identify the exact location of single and double damage, even if the damage is small (beams B1 and B2). In addition, the width of identified damage scenarios in all damaged beams (B1, B2, and B3) are totally compatible with the exact experimental width of slot(s). Moreover, it can be observed that by increasing the depth to thickness ratios (7% to 28% from beams B1 and B2 to B3), as well as the type of damage scenario (from single to double in beams B1 to B2 and B3), the values of the proposed damage indices were increased. Therefore, it can be concluded that the proposed damage indices, M C & D U ( S U M ) , are capable of damage localization and reveal damage severities at the same time.

3.3. Contourlet and Wavelet Comparison

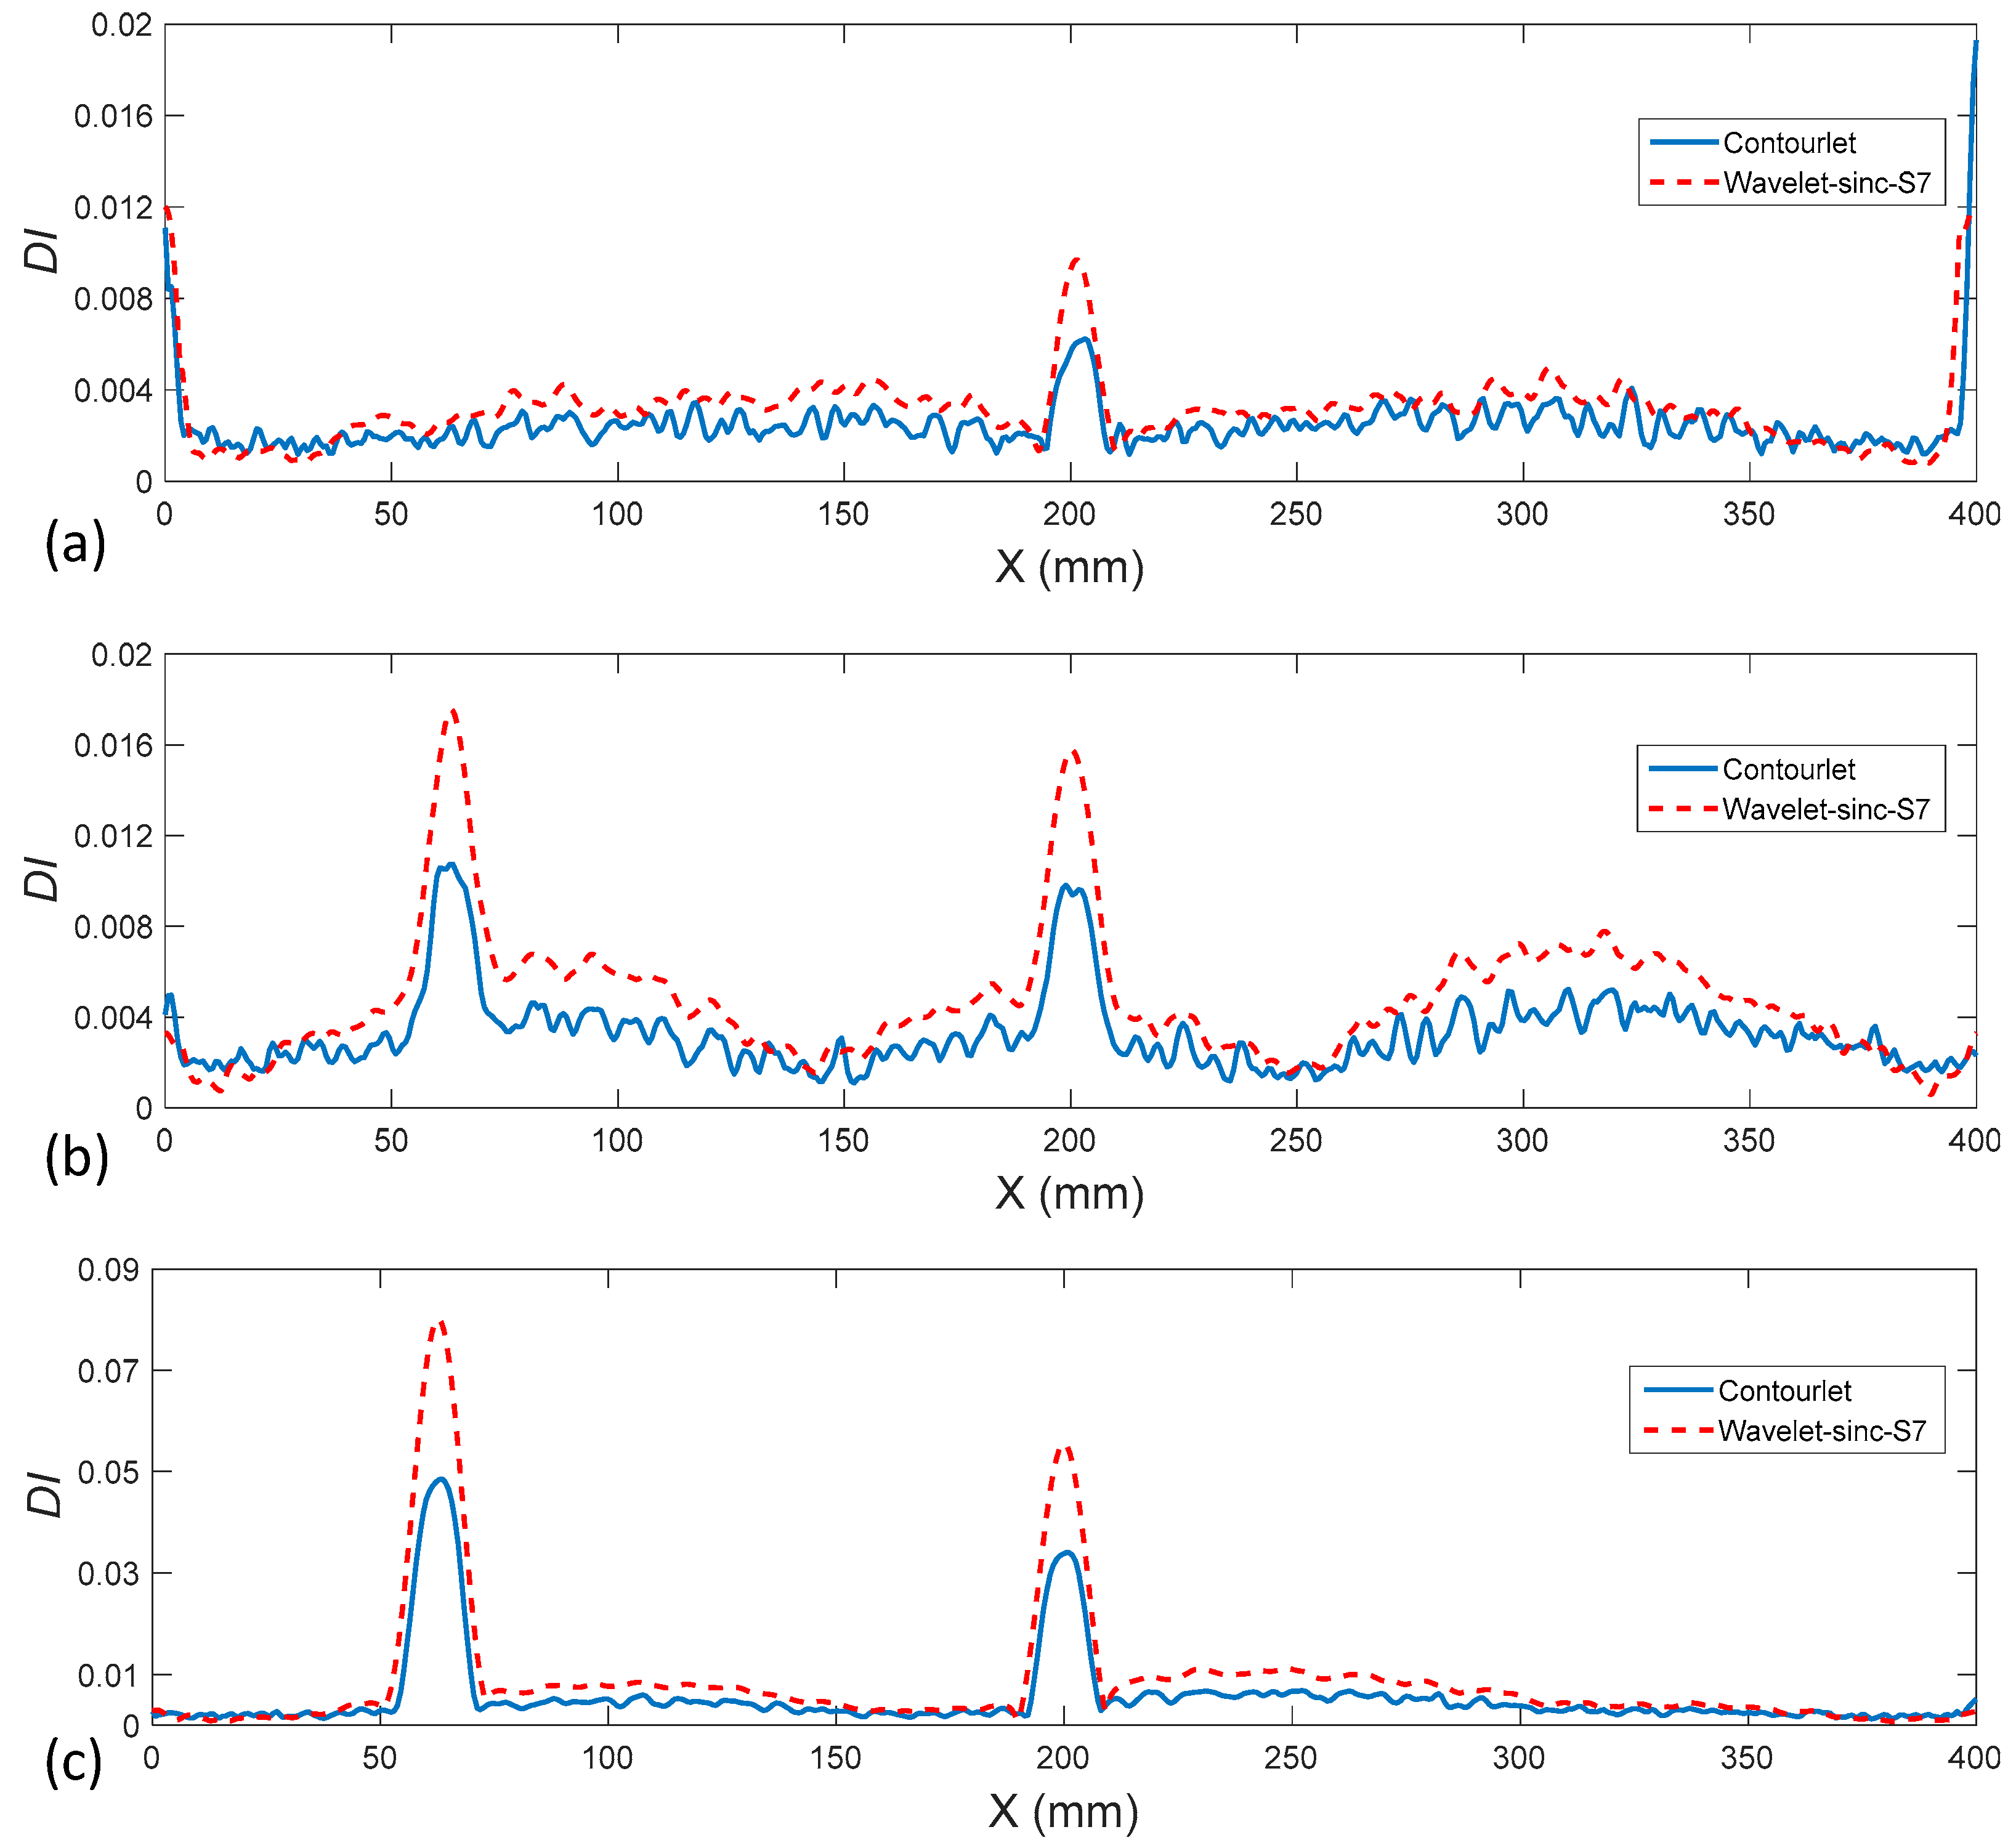
In a previously published research work by the authors [47], the process of damage identification of the same aluminum beams in the current study was conducted by using the wavelet transform. In that study, the authors introduced the first three modal curvatures of damaged beams (B1, B2, and B3) as the input of 22 different families of 2D wavelet transforms with three different scales (1, 7 and 15) and concluded that sinc wavelet with scale 7 (sinc-S7) was the best among other wavelet families to identify damage scenarios. In this section, as presented in Figure 20, the obtained results of the presently proposed damage index, M C & D U ( S U M ) , applied on damaged beams B1, B2, and B3, are compared with the corresponding outcomes of the wavelet-based damage index in the previous study.
The comparison of results obtained from the contourlet-based damage index in the current study M C & D U ( S U M ) and the corresponding previously published wavelet-based damage index (sinc-S7) in Figure 20 shows that both contourlet- and wavelet-based damage indices can identify the exact locations of damage scenarios in beams B1, B2 and B3.
The wavelet-based index (sinc-S7) exhibits higher sensitivity to damage severity, producing larger damage index values at the damaged regions. This heightened response can facilitate clearer identification of severe damage. However, this advantage is accompanied by increased noise levels in undamaged areas, which may lead to false positives or reduced confidence in damage detection. In contrast, the contourlet-based index maintains comparatively lower noise levels in undamaged regions, improving the robustness and reliability of damage localization. These differences stem from the intrinsic properties of the contourlet transform, which offers enhanced directional and multi-scale decomposition capabilities relative to traditional wavelet transforms. This allows the contourlet method to better capture anisotropic features and complex damage patterns, which are common in structural defects. Furthermore, while the presented results of damaged beams B2 and B3 in Figure 20b,c show no existence of boundary effect, the boundary effect in damaged beam B1 has occurred for both contourlet- and wavelet-based damage indices, as can be seen in Figure 20a. The boundary effect of the proposed damage index in the current study has been solved by applying a windowing process as presented in the next section.
Overall, this expanded comparison underscores the strengths and limitations of both approaches, demonstrating that while wavelet-based methods offer high sensitivity, the contourlet-based method provides improved noise resilience and directional feature representation, making it a valuable alternative or complement for structural damage identification.

3.4. Windowing Process

In this paper, to address the problem of boundary effect in the proposed damage indices, the Tukey window, W is used for removing the noise on their left and right sides. As shown in Figure 21, this window has a conical-cosine shape and is defined based on the length of the vector and the ratio of conical part to constant part as below [48]:
W x = 1 2 1 + cos 2 π α x α 2 0 x < α 2 1 α 2 x < 1 α 2 1 2 1 + cos 2 π α x 1 + α 2 1 α 2 x 1
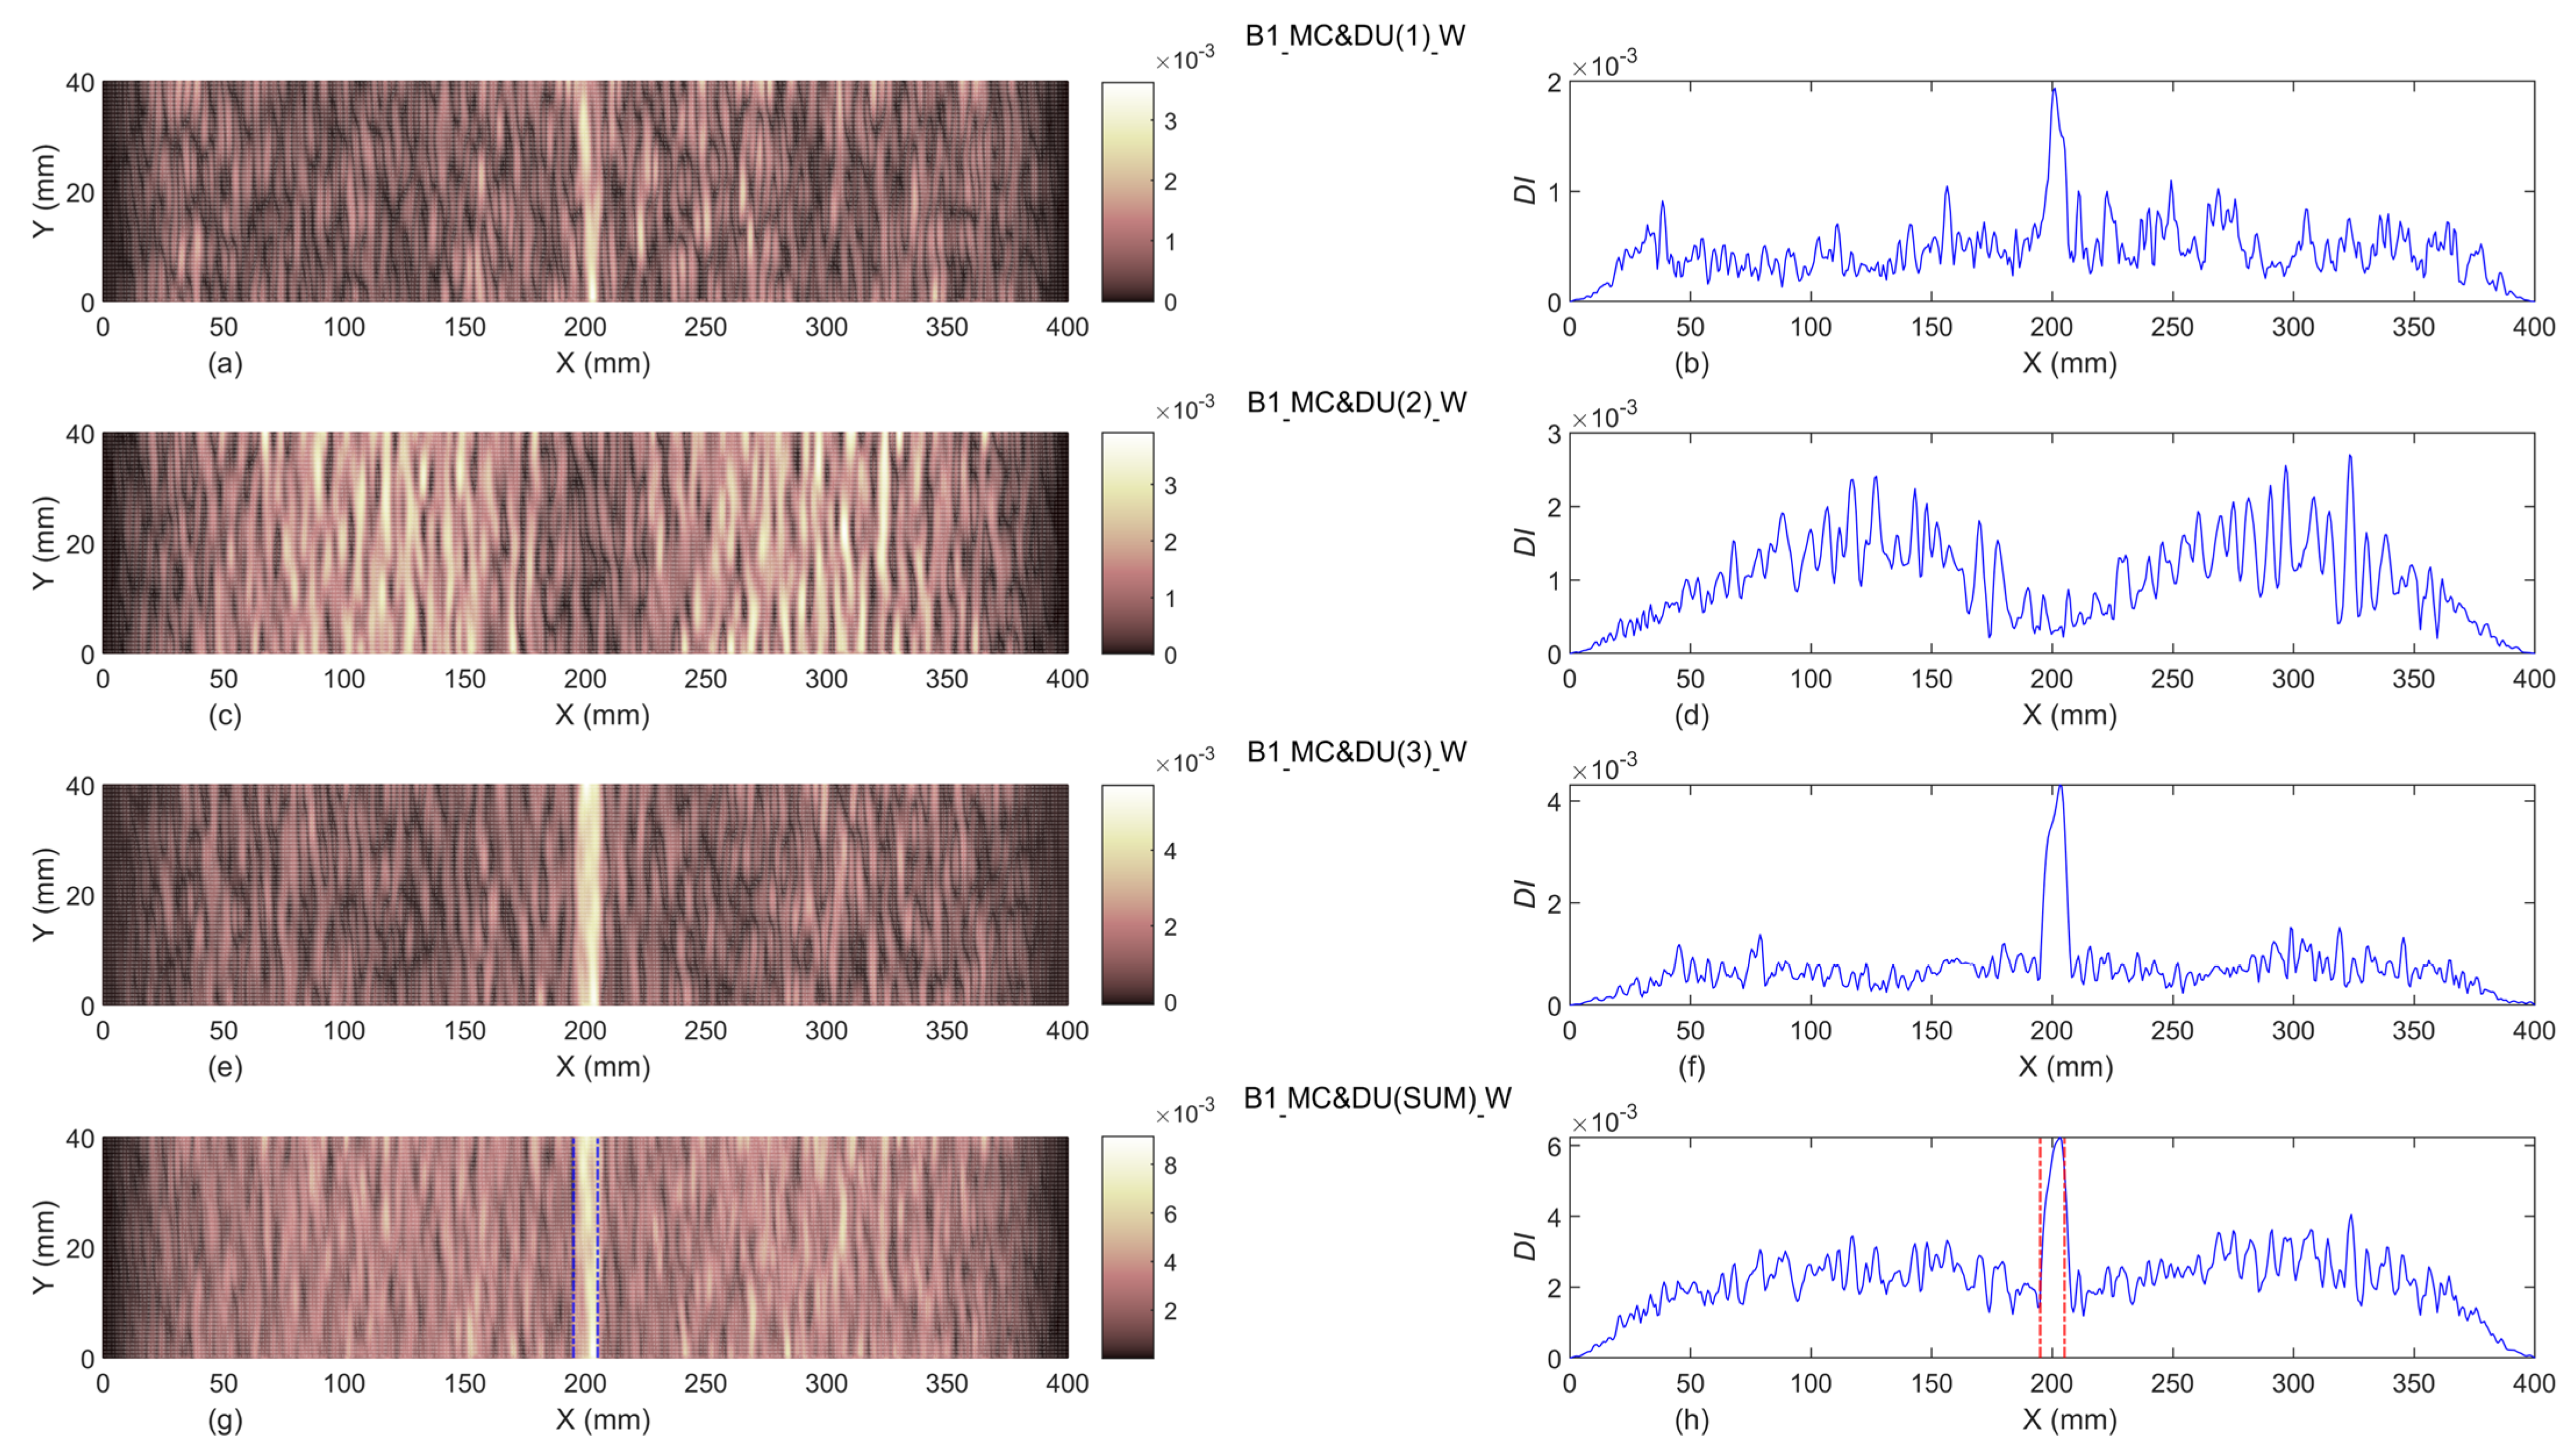
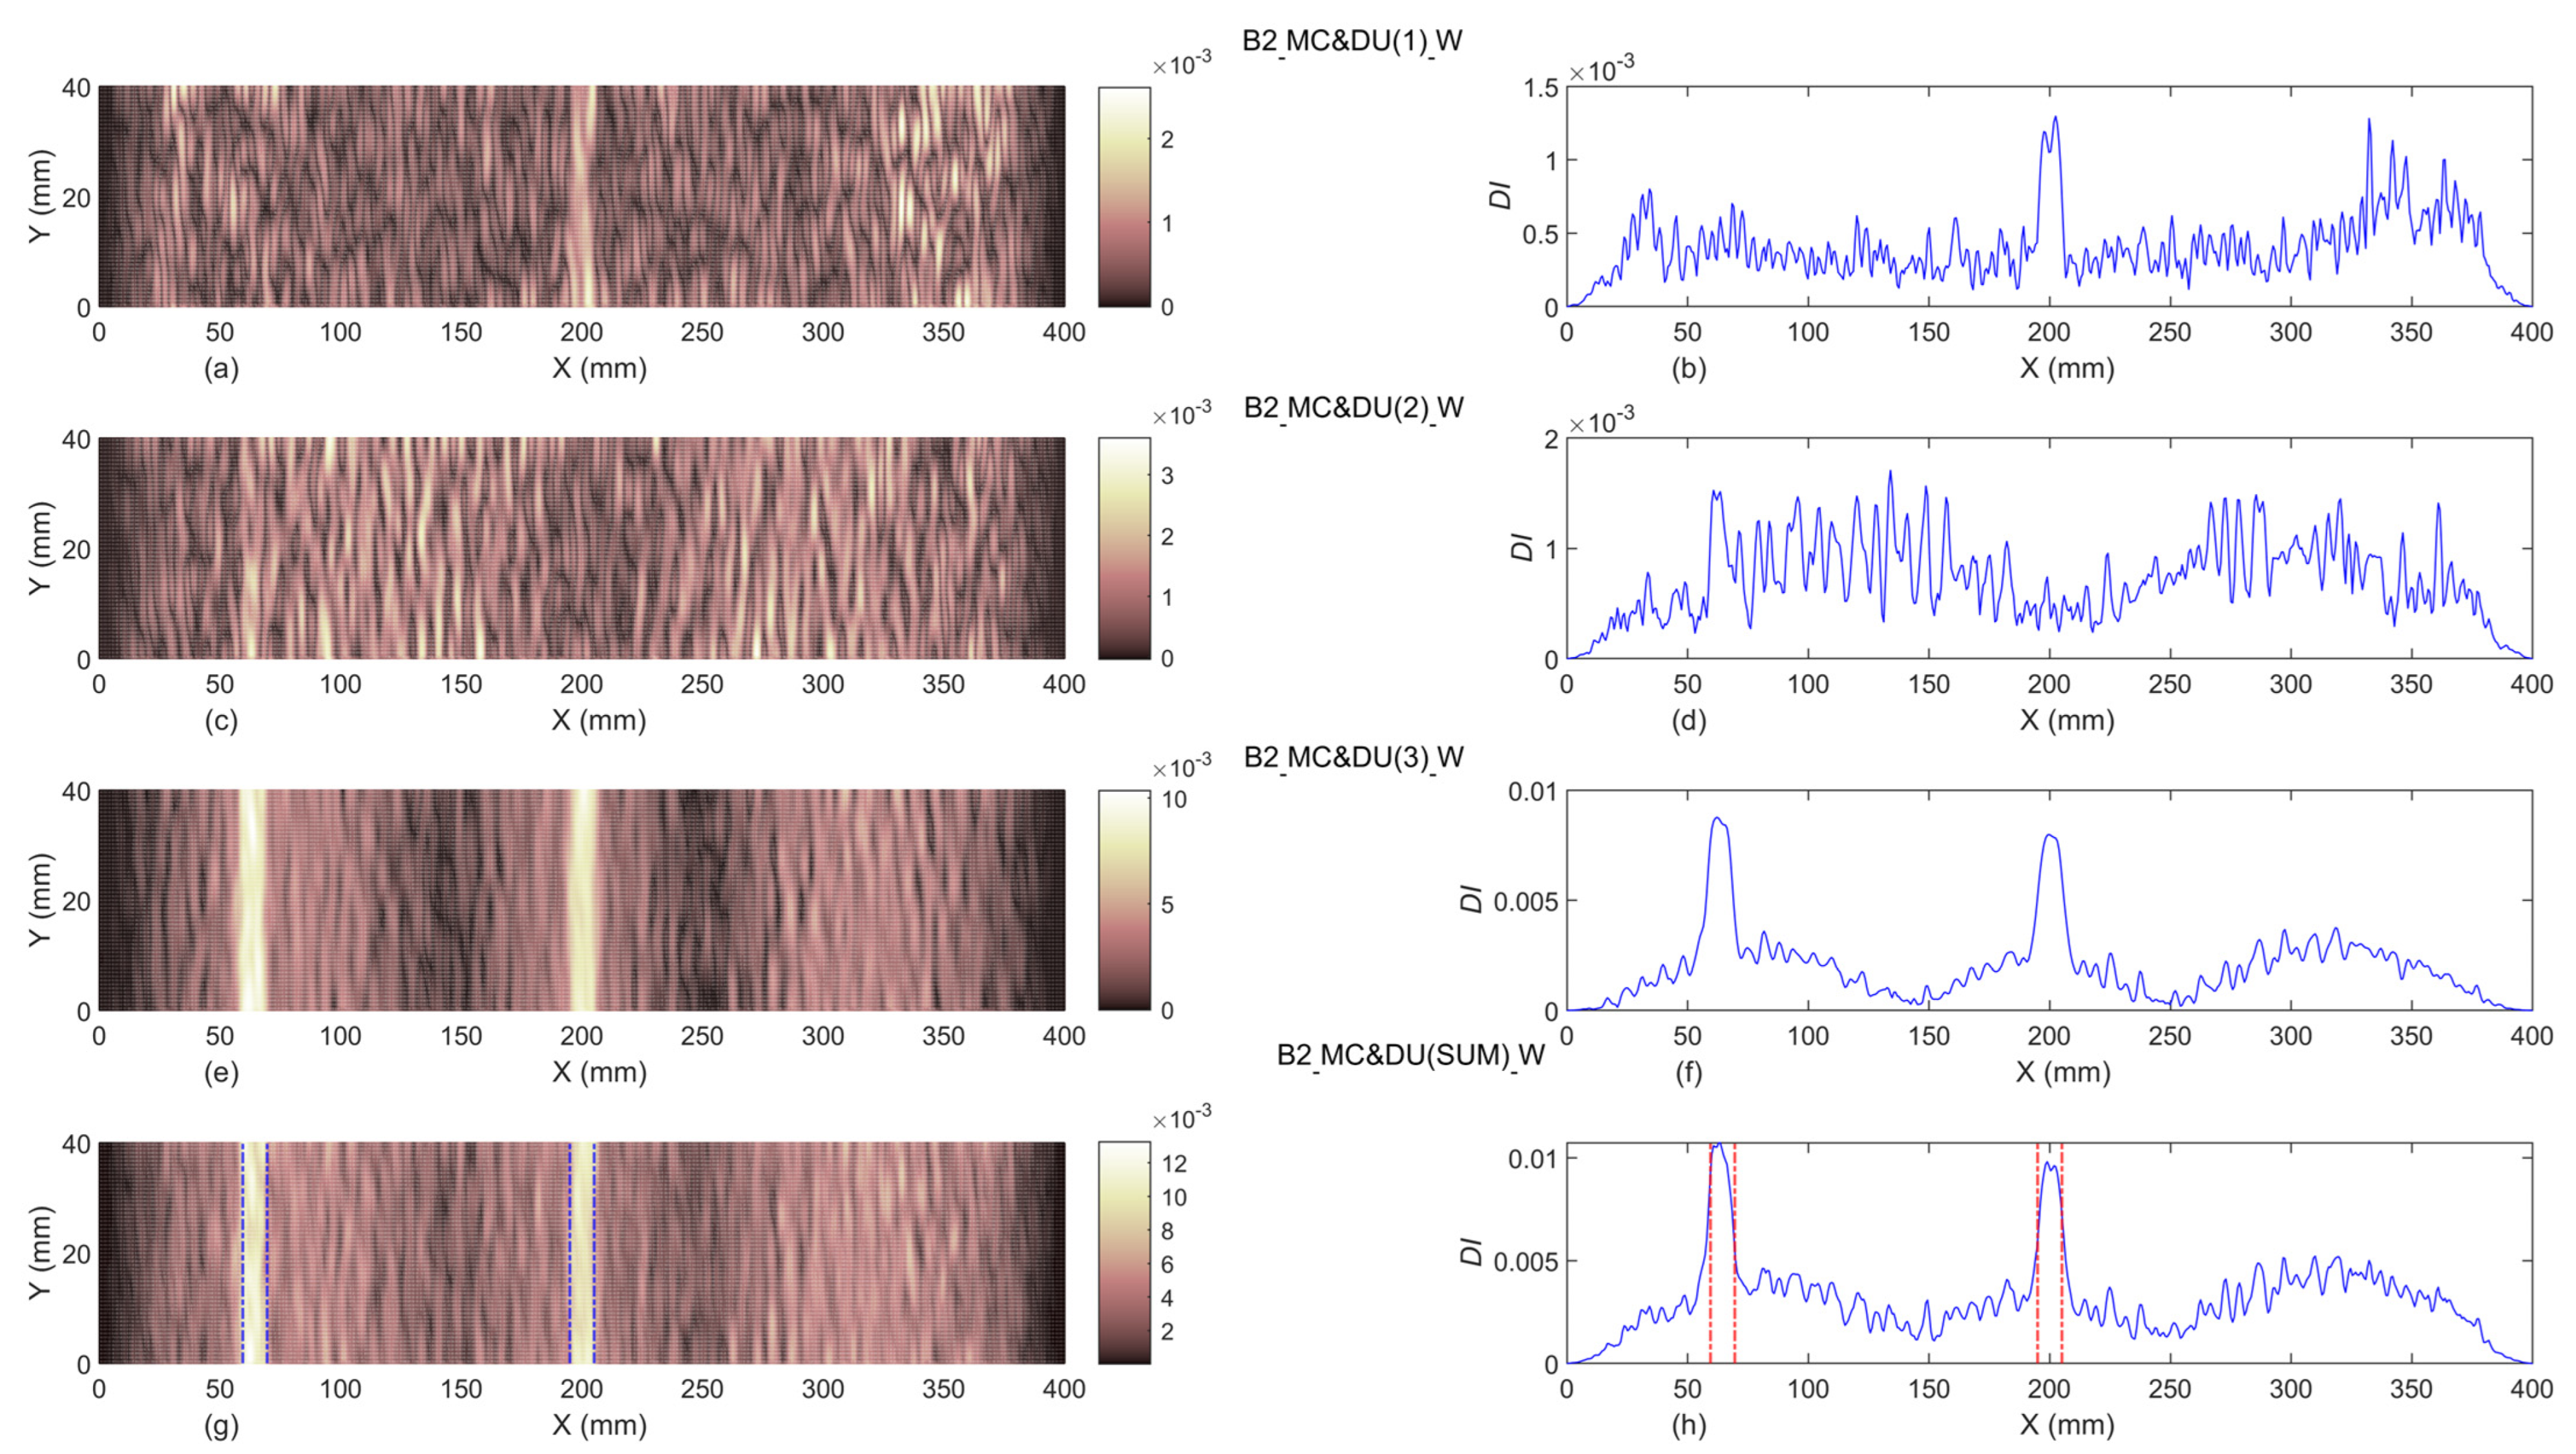
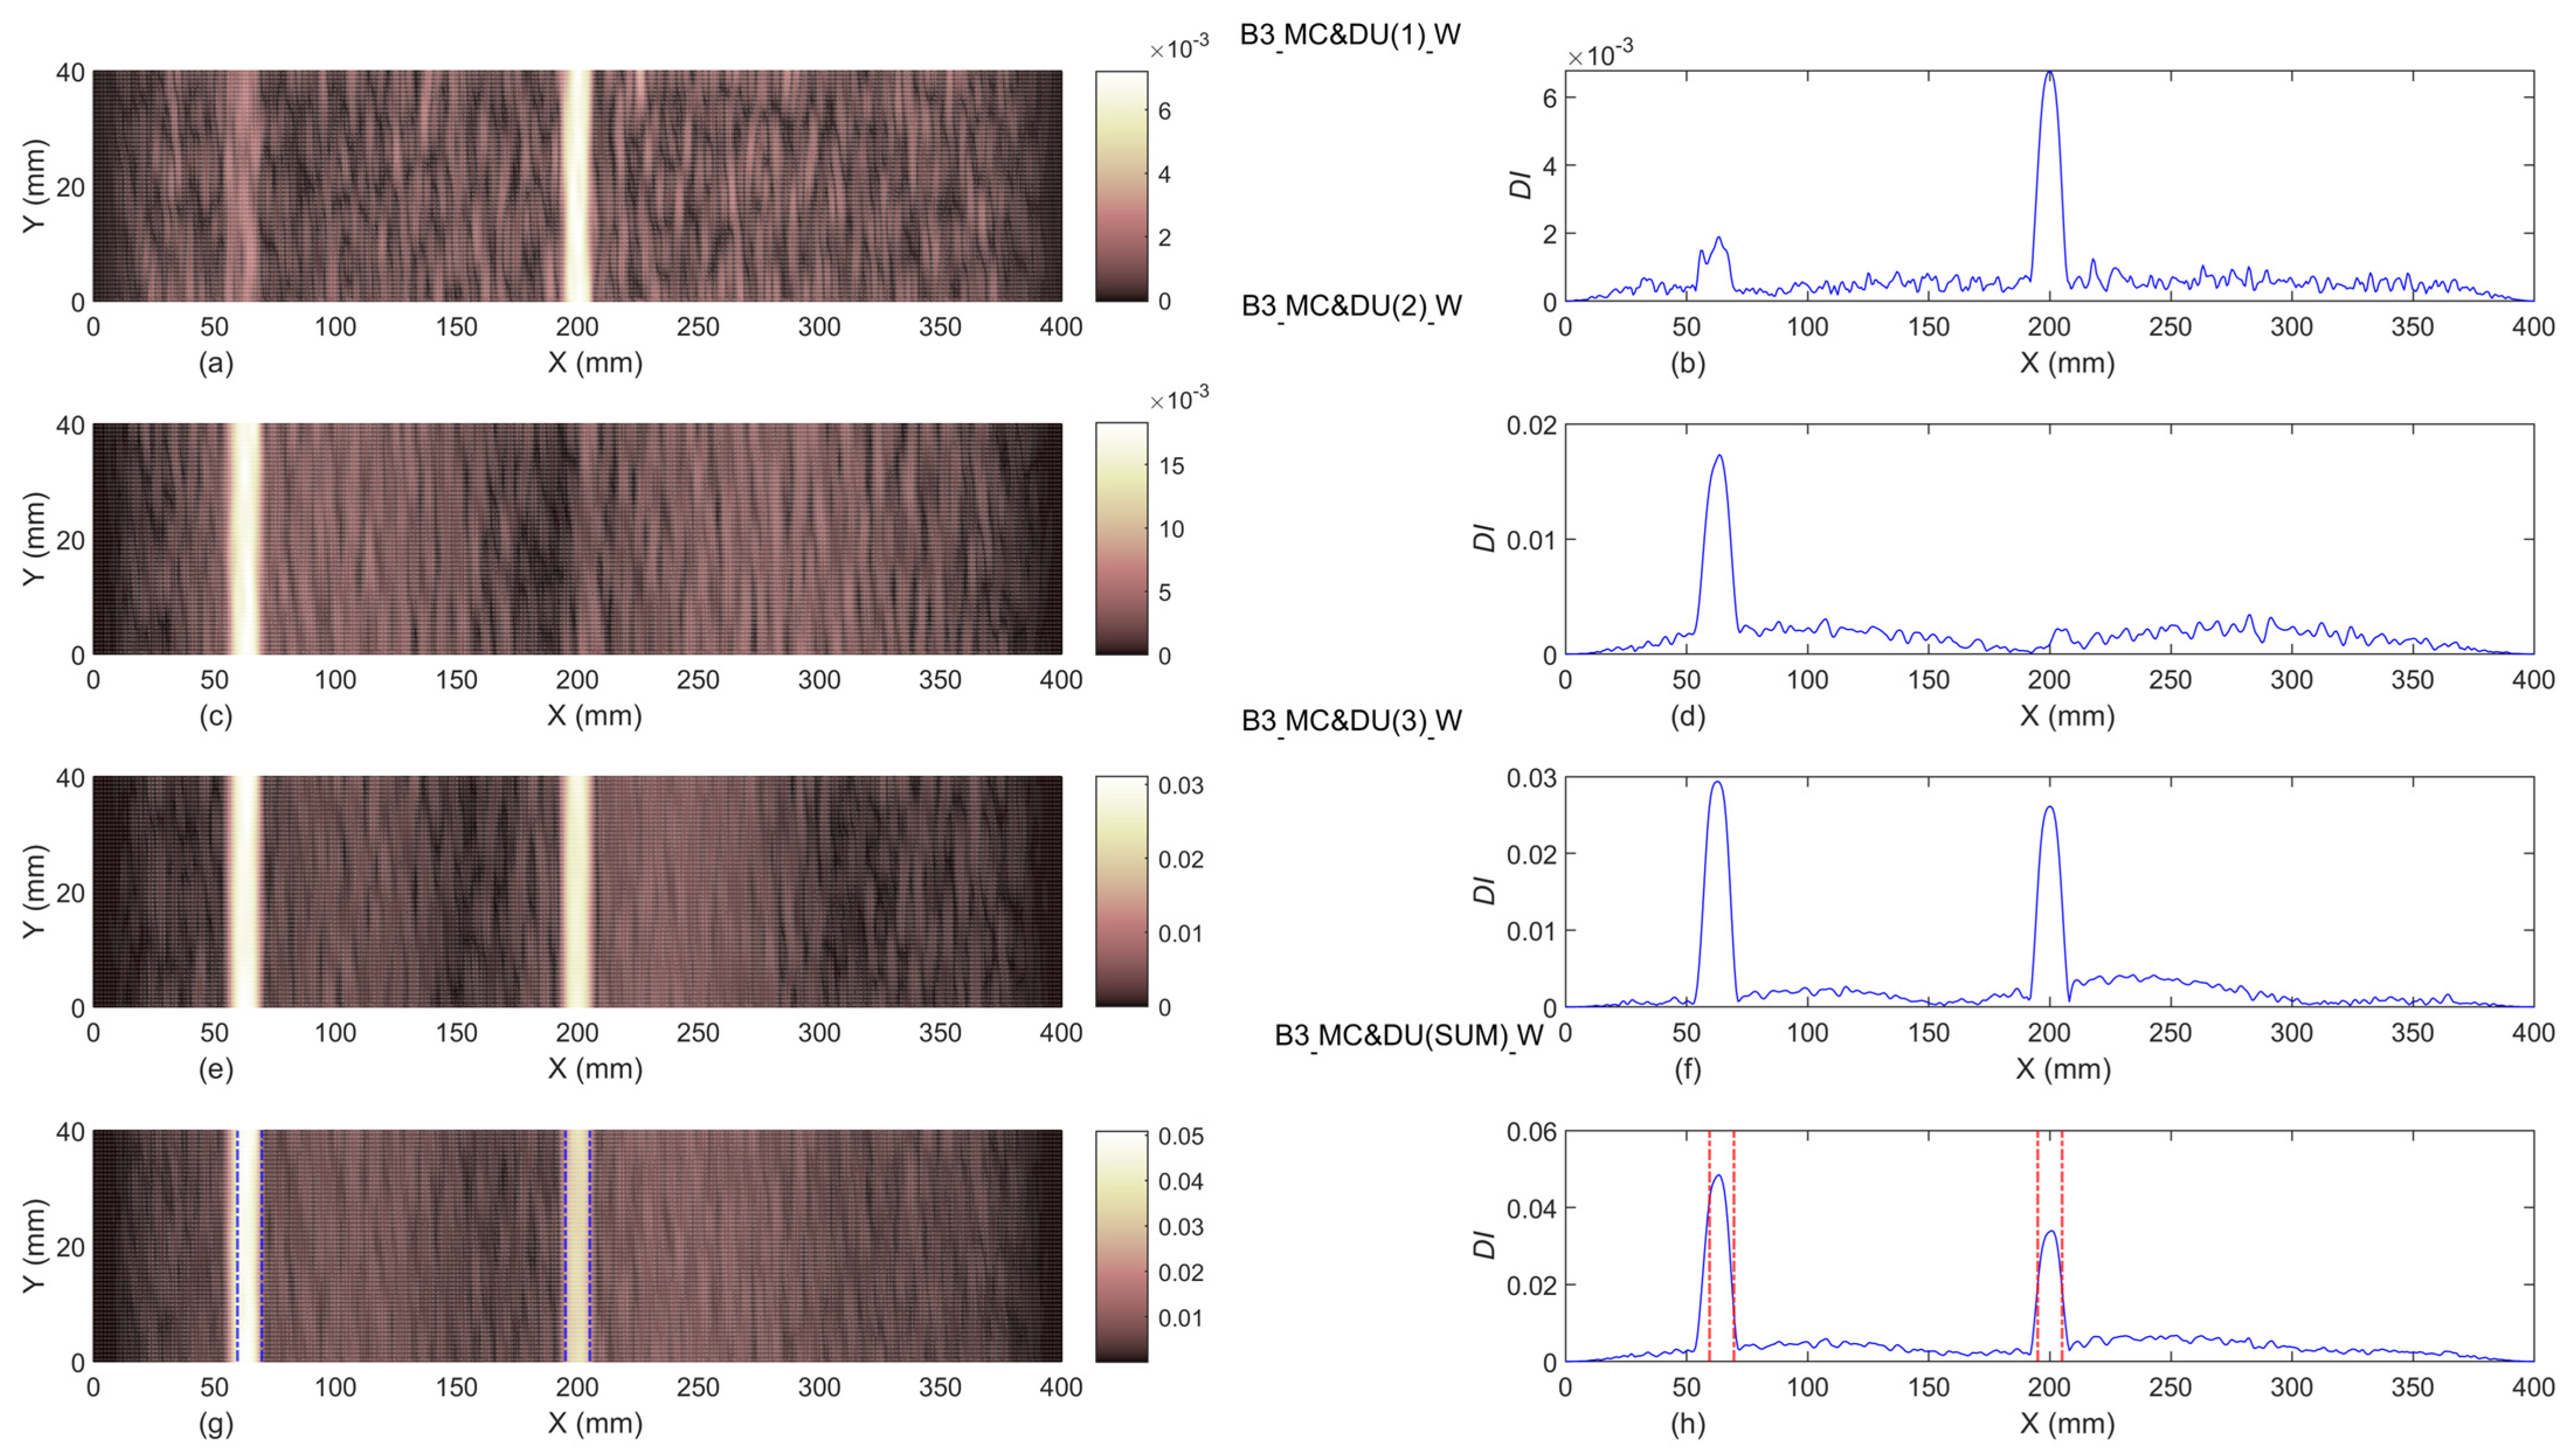
where x is a length-based vector which can be coordinated with any input length and α is the ratio of the conical part to the constant part; and its value varies 0 to 1 (i.e., 0 α 1 ) [48]. In this paper, the Tukey window with α = 0.2 was applied on the proposed damage index by multiplying the window vector to the damage indices. The resulting post-windowing damage indices, M C & D U ( i ) _ W , for beams B1, B2 and B3 respectively shown in Figure 22, Figure 23 and Figure 24. In Figure 8, Figure 9 and Figure 10, the exact location(s) of slot(s) are illustrated by dash-dot lines (-.).
As the results of Figure 22, Figure 23 and Figure 24 show, by applying a Tukey window with α = 0.2 on proposed damage indices, the boundary effects of these indices were removed, and the resulting post-windowing damage indices M C & D U ( i ) _ W can identify damage locations and severities very well in all damaged beams, and especially small damage, as in beams B1 and B2.

3.5. Limitations and Future Work

This study primarily focused on the first three low-order modes to balance experimental feasibility and effective damage detection. While these modes capture global structural behavior and were sufficient for identifying the slot damages tested, they may have limited sensitivity to highly localized or small-scale damages. Additionally, the damage scenarios considered involved slots extending fully across the beam width, which simplified the experimental conditions. Real-world damages often vary in length and location, especially in the width direction, potentially requiring higher spatial resolution for detection.
Future research will explore the applicability of the proposed contourlet-based damage indices to more complex and localized damage types, including partial-width or short-length defects. This will likely involve incorporating higher-order modes or integrating complementary sensing techniques to enhance spatial resolution. Further investigations will also examine the robustness of the method under varying boundary conditions and operational environments, aiming to advance the practical deployment of non-contact structural health monitoring for beam-like structures.

4. Conclusions

In this paper, aluminum beams were constructed in four damage states, including undamaged (B0), with single damage as slot in the middle of the beam with crack depth-to-thickness ratio of 7% (B1), with double damage as two slots in the middle and on the left side with depth-to-thickness ratio of 7% and 28% (B2 and B3, respectively). Then, the first three modal rotations were measured by a shearography system, and the corresponding modal curvatures were calculated. The modal rotations and modal curvatures of the undamaged beam were considered as the baseline, and besides, the corresponding modal data of damaged beams were introduced as input for damage indices defined based on the contourlet transform. Moreover, the proposed contourlet-based damage indices were compared with a previously wavelet-based damage detection method. Finally, the Tukey windowing process was introduced to address the boundary effect problem in the presently proposed damage indices. The following results were obtained in the current study:
  • The results indicated that introducing the first three modal rotations to the proposed damage indices in baseline-free format is not a proper damage identification process. Moreover, even considering the undamaged beam as the baseline, utilizing the first three modal rotations cannot reveal the location of damage.
  • It can also be concluded that in the current study, the baseline-free damage indices using the first three modal curvatures are not capable of identifying the damage in beams B1 and B2, but can detect the location of damage in beam B3.
  • The baseline-included proposed damage indices can successfully identify the exact location of single and double damage, even in beams B1 and B2. In addition, the width of identified damage scenarios in all damaged beams are totally compatible with the exact experimental width of slot(s). Moreover, it can be concluded that the proposed damage indices are capable of detecting damage localization and reveal damage severities with an increase of the slot’s depths.
  • The comparison of contourlet-based damage index in the current study and the corresponding previously published wavelet-based damage index with 2D sinc wavelet family and scale of 7, showed that both damage indices can identify the exact locations of damage scenarios. Regarding the damage varieties, although the wavelet-based damage index (sinc-S7) was more sensitive to damage severities and obtained higher values in damage locations, its noise values in undamaged locations were also higher in comparison to the contourlet-based damage index in the current study.
  • The boundary effects of proposed damage indices were removed by applying the Tukey window, and the resulting post-windowing damage indices can identify damage locations and severities very well in all damaged beams.

Author Contributions

Conceptualization, A.M.M., A.S., H.J., J.V.A.d.S. and H.M.L.; methodology, H.J., M.K., J.V.A.d.S. and H.M.L.; software, A.M.M., A.S., H.J., M.K., J.V.A.d.S. and H.M.L.; validation, A.M.M., A.S. and H.J.; formal analysis, A.M.M., A.S., H.J., J.V.A.d.S. and H.M.L.; investigation, A.M.M., A.S., H.J. and J.V.A.d.S.; resources, J.V.A.d.S. and H.M.L.; data curation, H.J., J.V.A.d.S. and H.M.L.; writing—original draft preparation, A.M.M., A.S. and H.J.; writing—review and editing, A.S., H.J., M.K., J.V.A.d.S. and H.M.L.; visualization, A.M.M., A.S. and H.J.; supervision, H.J. and J.V.A.d.S.; project administration, H.J., M.K., J.V.A.d.S. and H.M.L.; funding acquisition, J.V.A.d.S. and H.M.L. All authors have read and agreed to the published version of the manuscript.

Funding

This research received no external funding.

Data Availability Statement

The original contributions presented in this study are included in the article. Further inquiries can be directed to the corresponding author.

Acknowledgments

J.V.A.d.S. and H.M.L acknowledge Fundação para a Ciência e a Tecnologia (FCT) for its financial support via the project LAETA Base Funding (DOI: 10.54499/UIDB/50022/2020).

Conflicts of Interest

The authors declare no conflict of interest.

References

  1. Farrar, C.R.; Worden, K. Structural Health Monitoring: A Machine Learning Perspective; John Wiley & Sons: Hoboken, NJ, USA, 2012; ISBN 9781119994336. [Google Scholar]
  2. Sohn, H.; Farrar, C.R.; Hemez, F.M.; Shunk, D.D.; Stinemates, D.W.; Nadler, B.R.; Czarnecki, J.J. A Review of Structural Health Monitoring Literature: 1996–2001; Los Alamos National Laboratory: Los Alamos, NM, USA, 2003; Volume 1, pp. 10–12989.
  3. Doebling, S.W.; Farrar, C.R.; Prime, M.B.; Shevitz, D.W. Damage Identification and Health Monitoring of Structural and Mechanical Systems from Changes in Their Vibration Characteristics: A Literature Review; Los Alamos National Laboratory: Los Alamos, NM, USA, 1996.
  4. Rashid, S.M.P.; Soleymani, A.; Jahangir, H.; Nehdi, M.L. Detection of Damages in Concrete Structures by Signal Processing and Image Processing Techniques: A Critical Review. In Damage Detection and Structural Health Monitoring of Concrete and Masonry Structures; Springer: Singapore, 2025; pp. 249–270. ISBN 978-981-97-8975-7. [Google Scholar]
  5. Ewins, D.J. Modal Testing: Theory, Practice and Application; John Wiley & Sons: Hoboken, NJ, USA, 2009. [Google Scholar]
  6. Daneshvar, M.H.; Saffarian, M.; Jahangir, H.; Sarmadi, H. Damage Identification of Structural Systems by Modal Strain Energy and an Optimization-Based Iterative Regularization Method. Eng. Comput. 2023, 39, 2067–2087. [Google Scholar] [CrossRef]
  7. Salawu, O.S. Detection of Structural Damage through Changes in Frequency: A Review. Eng. Struct. 1997, 19, 718–723. [Google Scholar] [CrossRef]
  8. Pandey, A.K.; Biswas, M.; Samman, M.M. Damage Detection from Changes in Curvature Mode Shapes. J. Sound Vib. 1991, 145, 321–332. [Google Scholar] [CrossRef]
  9. Hamidi, S.; Soleymani, A.; Rashidi, M. A Review of Structural Health Monitoring and Damage Detection Techniques in Frames and Bridges. In Damage Detection and Structural Health Monitoring of Concrete and Masonry Structures; Springer: Singapore, 2025; pp. 295–311. ISBN 978-981-97-8975-7. [Google Scholar]
  10. Jahangir, H.; Hasani, H.; Esfahani, M.R. Wavelet-Based Damage Localization and Severity Estimation of Experimental RC Beams Subjected to Gradual Static Bending Tests. Structures 2021, 34, 3055–3069. [Google Scholar] [CrossRef]
  11. Ying, Z.-G.; Ni, Y.-Q. Optimal Parameter Estimation for Uncertain Structural Systems under Unknown Random Excitations. J. Vib. Control 2025, 31, 2058–2074. [Google Scholar] [CrossRef]
  12. Lei, H.; Ying, Z.-Z.; Ying, Z.-G. Stochastic Optimal Control for Uncertain Structural Systems Under Random Excitations Based on Bayes Optimal Estimation. Buildings 2025, 15, 1579. [Google Scholar] [CrossRef]
  13. Ubertini, F.; D’Alessandro, A.; Downey, A.; García-Macías, E.; Laflamme, S.; Castro-Triguero, R. Recent Advances on SHM of Reinforced Concrete and Masonry Structures Enabled by Self-Sensing Structural Materials. In Proceedings of the 4th International Electronic Conference on Sensors and Applications, Online, 15–30 November 2017; MDPI: Basel, Switzerland, 2017; p. 119. [Google Scholar]
  14. Araújo dos Santos, J.V.; Lopes, H. Assessment of Impact Damage of Composite Structures Using Digital Shearography. In Non-destructive Testing of Impact Damage in Fiber-Reinforced Polymer Composites; Elsevier: Oxford, UK, 2024; pp. 87–113. [Google Scholar]
  15. Abdel-Latif, A.M. An Overview of the Applications of NDI/NDT in Engineering Design for Structural Integrity and Damage Tolerance in Aircraft Structures. In Damage and Fracture Mechanics: Failure Analysis of Engineering Materials and Structures; Springer: Dordrecht, The Netherland, 2009; pp. 93–100. [Google Scholar] [CrossRef]
  16. Feng, D.; Feng, M.Q. Computer Vision for SHM of Civil Infrastructure: From Dynamic Response Measurement to Damage Detection—A Review. Eng. Struct. 2018, 156, 105–117. [Google Scholar] [CrossRef]
  17. dos Santos, J.V.A.; Lopes, H. Damage Localization Based on Modal Response Measured with Shearography. In Vibration-Based Techniques for Damage Detection and Localization in Engineering Structures; Nobari, A.S., Aliabadi, F.M.H., Eds.; World Scientific Publishing: Hackensack, NJ, USA, 2018; pp. 141–172. [Google Scholar]
  18. Wang, S.; Shi, P.; Xiong, J.; Feng, Y.; Huang, P.; Dong, B.; Chang, Q.; Wang, J.; Hanson, S.G.; Gao, S. Single-Shot Time-Averaged Shearography for Vibration Strain Mode Shape Visualization. IEEE Sens. J. 2024, 24, 9639–9646. [Google Scholar] [CrossRef]
  19. Tu, Y.; Liu, L.; Cao, B.; Mei, H.; Wang, L. Infrared-Induced Laser Shearography: Enhanced Multimodal Features Recognition for Interfacial Defects in SIR/GFRP Composite Structures. IEEE Trans. Instrum. Meas. 2024, 73, 1–13. [Google Scholar] [CrossRef]
  20. Mostafaei, H.; Ghamami, M. State of the Art in Automated Operational Modal Identification: Algorithms, Applications, and Future Perspectives. Machines 2025, 13, 39. [Google Scholar] [CrossRef]
  21. Mallat, S. A Wavelet Tour of Signal Processing; Academic Press: London, UK, 1999. [Google Scholar]
  22. Soleymani, A.; Jahangir, H.; Rashidi, M.; Mojtahedi, F.F.; Bahrami, M.; Javanmardi, A. Damage Identification in Reinforced Concrete Beams Using Wavelet Transform of Modal Excitation Responses. Buildings 2023, 13, 1955. [Google Scholar] [CrossRef]
  23. Douka, E.; Loutridis, S.; Trochidis, A. Crack Identification in Plates Using Wavelet Analysis. J. Sound Vib. 2004, 270, 279–295. [Google Scholar] [CrossRef]
  24. Douka, E.; Loutridis, S.; Trochidis, A. Crack Identification in Beams Using Wavelet Analysis. Int. J. Solids Struct. 2003, 40, 3557–3569. [Google Scholar] [CrossRef]
  25. Starck, J.-L.; Candès, E.J.; Donoho, D.L. The Curvelet Transform for Image Denoising. IEEE Trans. Image Process. 2002, 11, 670–684. [Google Scholar] [CrossRef]
  26. Kingsbury, N. Complex Wavelets for Shift Invariant Analysis and Filtering of Signals. Appl. Comput. Harmon. Anal. 2001, 10, 234–253. [Google Scholar] [CrossRef]
  27. Katunin, A. Damage Identification in Composite Plates Using Two-Dimensional B-Spline Wavelets. Mech. Syst. Signal Process. 2011, 25, 3153–3167. [Google Scholar] [CrossRef]
  28. Do, M.N.; Vetterli, M. The Contourlet Transform: An Efficient Directional Multiresolution Image Representation. IEEE Trans. Image Process. 2005, 14, 2091–2106. [Google Scholar] [CrossRef]
  29. Da Cunha, A.L.; Zhou, J.; Do, M.N. The Nonsubsampled Contourlet Transform: Theory, Design, and Applications. IEEE Trans. Image Process. 2006, 15, 3089–3101. [Google Scholar] [CrossRef]
  30. Jahangir, H.; Khatibinia, M.; Kavousi, M. Application of Contourlet Transform in Damage Localization and Severity Assessment of Prestressed Concrete Slabs. J. Soft Comput. Civ. Eng. 2021, 5, 39–68. [Google Scholar] [CrossRef]
  31. Xu, Y.L.; Chen, J. Structural Damage Detection Using Empirical Mode Decomposition and Contourlet Transform. In Proceedings of the Sensors and Smart Structures Technologies for Civil, Mechanical, and Aerospace Systems, San Diego, CA, USA, 27 February–2 March 2006; SPIE: Bellingham, WA, USA, 2006; Volume 6174, p. 61742J. [Google Scholar]
  32. Zhang, Q.; Chen, S.; Zhao, Y.; Wang, D. Structural Damage Detection Using Contourlet Transform. In Proceedings of the Proceedings of SPIE—Sensors and Smart Structures Technologies for Civil, Mechanical, and Aerospace Systems, San Diego, CA, USA, 9–13 March 2008; SPIE: Bellingham, WA, USA, 2008; Volume 6932, p. 69322D. [Google Scholar]
  33. Rucka, M. Damage Detection in Beams Using Wavelet Transform on Higher Vibration Modes. J. Theor. Appl. Mech. 2011, 49, 399–417. [Google Scholar]
  34. Zhou, J.; Cunha, A.L.; Do, M.N. Nonsubsampled contourlet transform: Construction and application in enhancement. In Proceedings of the IEEE International Conference on Image Processing, Genova, Italy, 14 November 2005; Volume 1, p. I-469. [Google Scholar] [CrossRef]
  35. Li, H.; Li, S.; Chen, J.; Zhang, Q. Damage Detection of Structures Using Contourlet Transform and Fractal Dimension. J. Vibroeng. 2014, 16, 3945–3956. [Google Scholar]
  36. He, Y.; Chen, H.; Liu, D.; Zhang, L. A Framework of Structural Damage Detection for Civil Structures Using Fast Fourier Transform and Deep Convolutional Neural Networks. Appl. Sci. 2021, 11, 9345. [Google Scholar] [CrossRef]
  37. Hajizadeh, A.R.; Khatibinia, M.; Hamidian, D. Performance Assessment of Contourlet Transform in Damage Detection of Plate Structures. Int. J. Optim. Civ. Eng. 2024, 14, 423–444. [Google Scholar] [CrossRef]
  38. Jahangir, H.; Hasani, H.; dos Santos, J.V.A.; Lopes, H.M. A Comprehensive Study on the Selection of Mother Wavelets and Mode Shapes for Multiple Damage Identification. Iran. J. Sci. Technol. Trans. Civ. Eng. 2024, 48, 1313–1327. [Google Scholar] [CrossRef]
  39. Cinque, D.; dos Santos, J.V.A.; Gabriele, S.; Marfia, S.; Lopes, H. Improvement on Modal Curvatures Methods for Multiple Damage Identification in Beams. Multidiscip. Model. Mater. Struct. 2021, 17, 1061–1080. [Google Scholar] [CrossRef]
  40. Kreis, T. Handbook of Holographic Interferometry: Optical and Digital Methods; Wiley-VCH: Weinheim, Germany, 2005; ISBN 9783527405466. [Google Scholar]
  41. Aebischer, H.A.; Waldner, S. A Simple and Effective Method for Filtering Speckle-Interferometric Phase Fringe Patterns. Opt. Commun. 1999, 162, 205–210. [Google Scholar] [CrossRef]
  42. Ghiglia, D.C.; Pritt, M.D. Two-Dimensional Phase Unwrapping: Theory, Algorithms, and Software; Wiley-Interscience: New York, NY, USA, 1998; ISBN 978-0-471-24935-1. [Google Scholar]
  43. Zhao, Q.; Dan, X.; Sun, F.; Wang, Y.; Wu, S.; Yang, L. Digital Shearography for NDT: Phase Measurement Technique and Recent Developments. Appl. Sci. 2018, 8, 2662. [Google Scholar] [CrossRef]
  44. Araújo dos Santos, J.V.; Lopes, H.; Moreno-García, P. Numerical Study on Damage Identification Using Shearography with Different Shearing Amounts. Procedia Struct. Integr. 2017, 5, 1198–1204. [Google Scholar] [CrossRef]
  45. Lopes, H.M.R.; Guedes, R.M.; Vaz, M.A. An Improved Mixed Numerical-Experimental Method for Stress Field Calculation. Opt. Laser Technol. 2007, 39, 1066–1073. [Google Scholar] [CrossRef]
  46. Nguyen, T.T.; Liu, Y.; Chauris, H.; Oraintara, S. Implementational Aspects of the Contourlet Filter Bank and Application in Image Coding. EURASIP J. Adv. Signal Process. 2008, 2008, 373487. [Google Scholar] [CrossRef]
  47. Abbasi, A.; Khatibinia, M.; Jahangir, H.; Dos Santos, J.V.A.; Lopes, H.M.R. Shearography-Wavelet-Based Damage Detection Methodology for Aluminum Beams. Rehabil. Civ. Eng. 2023, 11, 22–43. [Google Scholar]
  48. Bloomfield, P. Fourier Analysis of Time Series; Wiley Series in Probability and Statistics; John Wiley & Sons, Inc.: Hoboken, NJ, USA, 2000; ISBN 9780471889489. [Google Scholar]
Figure 1. Flowchart of the experimental and analytical processes of the current study.
Vibration 08 00053 g001
Figure 2. Tested aluminium beams: (a) B0; (b) B1; (c) B2; and (d) B3.
Vibration 08 00053 g002
Figure 3. Colormap and profile of the first three modal rotations in beam B0: (a,b) first mode; (c,d) second mode; and (e,f) third mode.
Vibration 08 00053 g003
Figure 4. Colormap and profile of the first three modal rotations in beam B1: (a,b) first mode; (c,d) second mode; and (e,f) third mode.
Vibration 08 00053 g004
Figure 5. Colormap and profile of the first three modal rotations in beam B2: (a,b) first mode; (c,d) second mode; and (e,f) third mode.
Vibration 08 00053 g005
Figure 6. Colormap and profile of the first three modal rotations in beam B3: (a,b) first mode; (c,d) second mode; and (e,f) third mode.
Vibration 08 00053 g006
Figure 7. The decomposition process of the contourlet transform.
Vibration 08 00053 g007
Figure 8. Colormap and profile of the damage index M R & D in beam B1: (a,b) first mode; (c,d) second mode; (e,f) third mode; and (g,h) summation of first three modes.
Vibration 08 00053 g008
Figure 9. Colormap and profile of the damage index M R & D in beam B2: (a,b) first mode; (c,d) second mode; (e,f) third mode; and (g,h) summation of first three modes.
Vibration 08 00053 g009
Figure 10. Colormap and profile of the damage index M R & D in beam B3: (a,b) first mode; (c,d) second mode; (e,f) third mode; and (g,h) summation of first three modes.
Vibration 08 00053 g010
Figure 11. Colormap and profile of the damage index M R & D U in beam B1: (a,b) first mode; (c,d) second mode; (e,f) third mode; and (g,h) summation of first three modes.
Vibration 08 00053 g011
Figure 12. Colormap and profile of the damage index M R & D U in beam B2: (a,b) first mode; (c,d) second mode; (e,f) third mode; and (g,h) summation of first three modes.
Vibration 08 00053 g012
Figure 13. Colormap and profile of the damage index M R & D U in beam B3: (a,b) first mode; (c,d) second mode; (e,f) third mode; and (g,h) summation of first three modes.
Vibration 08 00053 g013
Figure 14. Colormap and profile of the damage index M C & D in beam B1: (a,b) first mode; (c,d) second mode; (e,f) third mode; and (g,h) summation of first three modes.
Vibration 08 00053 g014
Figure 15. Colormap and profile of the damage index M C & D in beam B2: (a,b) first mode; (c,d) second mode; (e,f) third mode; and (g,h) summation of first three modes.
Vibration 08 00053 g015
Figure 16. Colormap and profile of the damage index M C & D in beam B3: (a,b) first mode; (c,d) second mode; (e,f) third mode; and (g,h) summation of first three modes.
Vibration 08 00053 g016
Figure 17. Colormap and profile of the damage index M C & D U in beam B1: (a,b) first mode; (c,d) second mode; (e,f) third mode; and (g,h) summation of first three modes.
Vibration 08 00053 g017
Figure 18. Colormap and profile of the damage index M C & D U in beam B2: (a,b) first mode; (c,d) second mode; (e,f) third mode; and (g,h) summation of first three modes.
Vibration 08 00053 g018
Figure 19. Colormap and profile of the damage index M C & D U in beam B3: (a,b) first mode; (c,d) second mode; (e,f) third mode; and (g,h) summation of first three modes.
Vibration 08 00053 g019
Figure 20. Comparison of the profile of the proposed contourlet-based damage index in the current study ( M C & D U ( S U M ) ) and corresponding previously published research wavelet-based (sinc-S7) in beams: (a) B1; (b) B2; and (c) B3.
Vibration 08 00053 g020
Figure 21. Tukey window using different α values.
Vibration 08 00053 g021
Figure 22. Colormap and profile of the post-windowing damage index M C & D U ( i ) _ W in beam B1: (a,b) first mode; (c,d) second mode; (e,f) third mode; and (g,h) summation of first three modes.
Vibration 08 00053 g022
Figure 23. Colormap and profile of the post-windowing damage index M C & D U ( i ) _ W in beam B2: (a,b) first mode; (c,d) second mode; (e,f) third mode; and (g,h) summation of first three modes.
Vibration 08 00053 g023
Figure 24. Colormap and profile of the post-windowing damage index M C & D U ( i ) _ W in beam B3: (a,b) first mode; (c,d) second mode; (e,f) third mode; and (g,h) summation of first three modes.
Vibration 08 00053 g024
Table 1. Geometrical properties of damage in the four tested beams [38].
Tested
Beams
Damage ScenarioSlot 1Slot 2
Location (X)
(mm)
Width
(mm)
Depth/Thickness
(%)
Location (X)
(mm)
Width
(mm)
Depth/Thickness
(%)
B0undamaged- - -- - -- - -- - -- - -- - -
B1single damage200107- - -- - -- - -
B2double damage20010764.50107
B3double damage200102864.501028
Table 2. The natural frequencies of the beams for the free-free condition [38].
Frequency OrderB0 (Hz)B1 (Hz)B2 (Hz)B3 (Hz)
1st92.0091.2591.2587.00
2nd254.25254.00253.00248.50
3rd449.50496.50493.00465.00
Disclaimer/Publisher’s Note: The statements, opinions and data contained in all publications are solely those of the individual author(s) and contributor(s) and not of MDPI and/or the editor(s). MDPI and/or the editor(s) disclaim responsibility for any injury to people or property resulting from any ideas, methods, instructions or products referred to in the content.