Article

Prediction of Local Vibration Analysis for Ship Stiffened Panel Structure Using Artificial Neural Network Algorithm

by
Mahardika Rizki Pynasti
and
Chang-Yong Song
*
School of Mechanical and Ocean Engineering, Mokpo National University, Muan 58554, Jeonnam, Republic of Korea
*
Author to whom correspondence should be addressed.
Vibration 2025, 8(3), 52; https://doi.org/10.3390/vibration8030052
Submission received: 7 August 2025 / Revised: 8 September 2025 / Accepted: 10 September 2025 / Published: 13 September 2025
(This article belongs to the Special Issue Machine Learning Applications to Vibration Problems)

Abstract

Ship stiffened panels, typically flat plates reinforced with various types of stiffeners, form a substantial part of a ship’s structure and are susceptible to resonance, especially in areas such as the after peak structure, engine room, and accommodation compartments. These vibrations are primarily excited by main engine and propeller forces. Conventional methods such as finite element analysis (FEA) and plate theory are widely used to estimate vibration frequencies, but they are time-consuming and computationally intensive when applied to numerous stiffened panels. This study proposes a machine learning approach using an artificial neural network (ANN) algorithm to efficiently predict the vibration frequencies of ship stiffened panels. A crude oil tanker is chosen as the case study, and FEA is conducted to generate the vibration frequency and mass data for panels across critical regions. The input layer features for the ANN include panel area, thickness, number and area of stiffeners, fluid density, number of fluid contact sides, and overall structural stiffness. The ANN model predicts two outputs: the fundamental vibration frequency and the mass of the panel structure. To evaluate the model performance, hyperparameters such as the number of hidden neurons are optimized. The results indicate that the ANN achieves accurate predictions while significantly reducing the time and resources required compared with conventional methods. This approach offers a promising tool for accelerating the local vibration analysis process in ship structural design.

1. Introduction

Stiffened panels are one of the most common structural elements in all types of ships. The stiffened panel has the crucial function of supporting ship structure, since it has stiffeners, girders, brackets, and other supporting structural elements to resist various load conditions, and maintaining the ship structural integrity. Stiffened panels are spread into all regions of a ship, especially in crucial regions such as the after peak structure, engine room, and accommodation compartments. These regions are known to experience severe vibrational excitation due to main engine operations and propeller excitation forces, which can lead to resonance, resulting in fatigue damage, reduced operational safety, and increased maintenance demands.
The solution to mitigate such risk, commonly FEA or an analytical method based on plate theory, needs to be performed to estimate the vibration frequency that happens on the ship stiffened panel. Such solutions have been found to be accurate at estimating the vibration frequency. However, if there are a vast number of panels that need to be analyzed, such methods can become computationally expensive, time consuming, and labor intensive.
Recent developments in machine learning have introduced powerful alternatives to conventional numerical and analytical approaches, particularly in engineering applications. Machine learning models, when trained on diverse and high-quality datasets, have demonstrated high accuracy and efficiency in predicting physical phenomena, including ship resistance and structural performance [1]. Specifically, neural networks have shown strong potential for approximating complex nonlinear relationships, reducing computational costs, and maintaining high prediction accuracy once trained. ANNs have proven effective in various engineering scenarios. For instance, one study successfully applied deep neural networks to predict power output from flow-induced vibration energy harvesters, achieving R2 values exceeding 0.98. This highlighted the model’s strength in enabling rapid and accurate performance evaluation across different system setups [2]. Another study integrated FEA with machine learning to predict and optimize the strength of double-strap adhesively bonded joints. Deep neural networks and genetic programming were particularly effective, offering a balance between accuracy and computational efficiency [3]. However, model performance may depend heavily on dataset diversity and the quality of training labels, a recurring limitation across data-driven approaches. In the domain of structural dynamics, a radial basis function neural network outperformed other architectures in predicting vortex-induced vibration damage in flexible cylinders. The study not only showcased predictive power but also provided physical insights, such as the influence of yaw angles on helical strake performance, challenging traditional assumptions like the independence principle [4]. Similarly, in additive manufacturing, a combined ANN and FEA model successfully predicted residual stress in directed metal deposition components, achieving results comparable to traditional FEA while requiring only a fraction of the computational time [5]. Machine learning also aids in fracture mechanics. A back propagation neural network trained on FEA data accurately predicted the non-uniform J-integral in welded plates, offering a fast alternative to time-consuming simulations with an R2 value exceeding 0.99 [6]. In the realm of subjective analysis, neural networks have outperformed classical regression in predicting perceived loudness and annoyance levels of shipboard noise, suggesting their suitability for human-centered design in marine environments [7]. Several recent studies emphasize the synergy between finite element methods and machine learning. A finite element-informed neural network incorporated physics-based constraints into the learning process, resulting in improved generalization and robustness, especially with limited or noisy data [8]. Similarly, the deep finite element method integrates FEA and deep learning to solve partial differential equations more efficiently than traditional FEA, achieving up to 87.5% speed improvements [9]. A hybrid finite element-informed neural network framework was also introduced to tackle boundary value problems, showing that the use of first-order quadrilateral elements and transfer learning especially for material and load conditions can significantly cut training costs up to 90% in some cases, while preserving accuracy. However, limitations were noted in scale transfer effectiveness [10]. Yang et al. showed that machine learning can be combined with reliability analysis to achieve faster computations without sacrificing precision [11]. Similarly, Zhou et al. demonstrated that embedding physical laws into ANN models greatly improved the accuracy and reliability of fatigue life predictions under irregular loading conditions [12]. In the field of renewable energy, Meng et al. emphasized through their review of offshore wind turbine gearboxes that ANN-based and other data-driven approaches are becoming indispensable for improving reliability and managing uncertainty [13].
Ban et al. [14] demonstrated the capability of deep neural networks in predicting the ultimate strength of ship bottom structures, showing their potential in structural safety assessment. Similar approaches have been applied to optimize ship hull design for reduced wave resistance and emissions [15]. In other engineering fields, machine learning combined with Bayesian optimization has improved tire design efficiency [16], while neural networks have been used to predict added resistance of container ships in waves [17]. They have also been applied to resistance and trim prediction in motorboats [18] and to assess structural damage in submerged structures [19].
Despite the recent advancements in recent studies, the concept of the application of ANNs to vibration analysis focused on ship structural components is still unexplored. Because of that this study addresses that gap by developing an ANN-based prediction model designed for the local vibration analysis of ship stiffened panels. The model will be trained using a dataset of FEA results that represents fundamental vibration frequencies from various panel configurations. This study will focus on analyzing the panels that are located after the peak structure, engine room, and accommodation compartments of a crude oil tanker.
The main objective of this study is to develop an ANN-based predictive model for estimating the fundamental vibration frequency and structural model mass with high accuracy and computational efficiency. To achieve the objective, this study focuses on developing a comprehensive dataset of panel configuration through FEA simulation, which includes key structural parameters that correlated with or affected both vibration frequency and structural model mass. Input layer features for the ANN model include panel area, thickness, number and area of stiffeners, fluid density, number of fluid contact sides, and overall structural stiffness. The ANN model predicts two outputs: the fundamental vibration frequency and the mass of the stiffened panel. To evaluate the model performance, hyperparameters such as the number of hidden neurons are optimized. The developed ANN model is verified by an actual vibration analysis model from a case study. This study proposes the development of a reliable and scalable prediction framework that can be featured in the structural design and inspection workflow of ships. The proposed ANN model is designed to provide rapid and precise vibration frequency prediction for ship stiffened panels, allowing for the early detection of resonance concerns. This paper comprises the following sections. Section 2 addresses the local vibration analysis of the stiffened ship panel. Section 3 addresses the ANN model for the local vibration analysis prediction and parameter setup. Section 4 addresses the ANN modeling results and its validation from a case study. Section 5 presents the concluding remarks of this study.

2. Local Vibration Analysis of Ship Stiffened Panel

2.1. Local Vibration of Ship Structure

To ensure the health and safety of both crew members and passengers, and to prevent the fatigue failure of ship structures caused by excessive vibration, international standards and classification societies have continuously tightened the permissible vibration limits for large passenger and cargo vessels [20,21,22,23,24]. In ship vibration, low-frequency vibrations induced by the excitation forces of the main engine and propeller are closely related to resonance phenomena involving the local structures of the hull [23]. Resonance occurs when the excitation frequency of rotating machinery coincides with the natural frequency of the receiving structure. If appropriate resonance avoidance measures are not implemented, structural fatigue failure may result. In particular, excessive vibration at structural panels located near bulkheads or at the boundaries of tanks can be a significant source of structural damage.
Figure 1 illustrates the key factors influencing ship vibration. By modifying some of the elements presented in Figure 1, the adverse effects of vibration on the crew, passengers, ship structure, and onboard outfitting can be minimized.
Among various mitigation strategies for ship vibration, reducing local structural vibration is most effectively achieved by controlling the frequency ratio through the appropriate consideration of structural stiffness and mass during the design stage [25]. The frequency ratio is defined as the ratio of the excitation frequency to the natural frequency of the structure. Resonance occurs when this ratio equals 1.0, which must be strictly avoided. The frequency ratio can be adjusted either by altering the excitation frequency or by changing the structural natural frequency. In practice, the most common and effective method to avoid local structural resonance is to modify the stiffness or mass of the structure. Increasing stiffness, in particular, is a widely preferred technique to shift the natural frequency of local vibrations.
The natural frequency of ship stiffened panels can be evaluated using analytical methods or FEA simulation. Such evaluations must account for both the outfitting mass attached to the stiffened panel and the added mass effect of the surrounding fluid. To avoid resonance, the stiffened panel can be reinforced by increasing the plate thickness or the number of stiffeners to raise its stiffness.
Vibration mitigation measures should be incorporated from the earliest design phase, especially during the concept design stage, where cost-effective solutions can be most efficiently implemented. At this stage, the expertise and experience of engineers and designers play a critical role. Employing simple yet effective tools for the early identification of potential vibration issues is essential for the overall success of ship design [25]. Moreover, advanced machine learning techniques, such as ANN, may offer promising alternatives to support or even partially replace expert judgment during early-stage vibration assessments.

2.2. Local Vibration Analysis of Stiffened Panel

An ANN model will be trained using an FEA result dataset that represents the fundamental natural frequency from various stiffened panel configurations. This study will focus on analyzing the stiffened panels that are located after the peak structure, engine room, and accommodation compartments of a deadweight 157 K ton class crude oil tanker. Since the neural network needs a sample dataset consisting of the value of natural frequency and a variable value that affects the local vibration of a stiffened panel, a vibration analysis using FEA simulation needs to be performed. The panels were modeled using Hypermesh version 2022.3 [26] and were analyzed using the MSC Nastran solver version 2022.1 [27].
The purpose of this local vibration analysis is to determine the natural frequency of various stiffened panels located in different structural regions of the ship, as shown in Table 1. Among the stiffened panels that are chosen in this study, some panels are characterized as fluid tanks on the ship, which are significantly influenced by the dynamic effect of the contained fluid; this can be a major reason for vibration resonance occurring on that panel. The vibration analysis in this study covers a total of 156 stiffened panels extracted from a crude oil tanker structure.
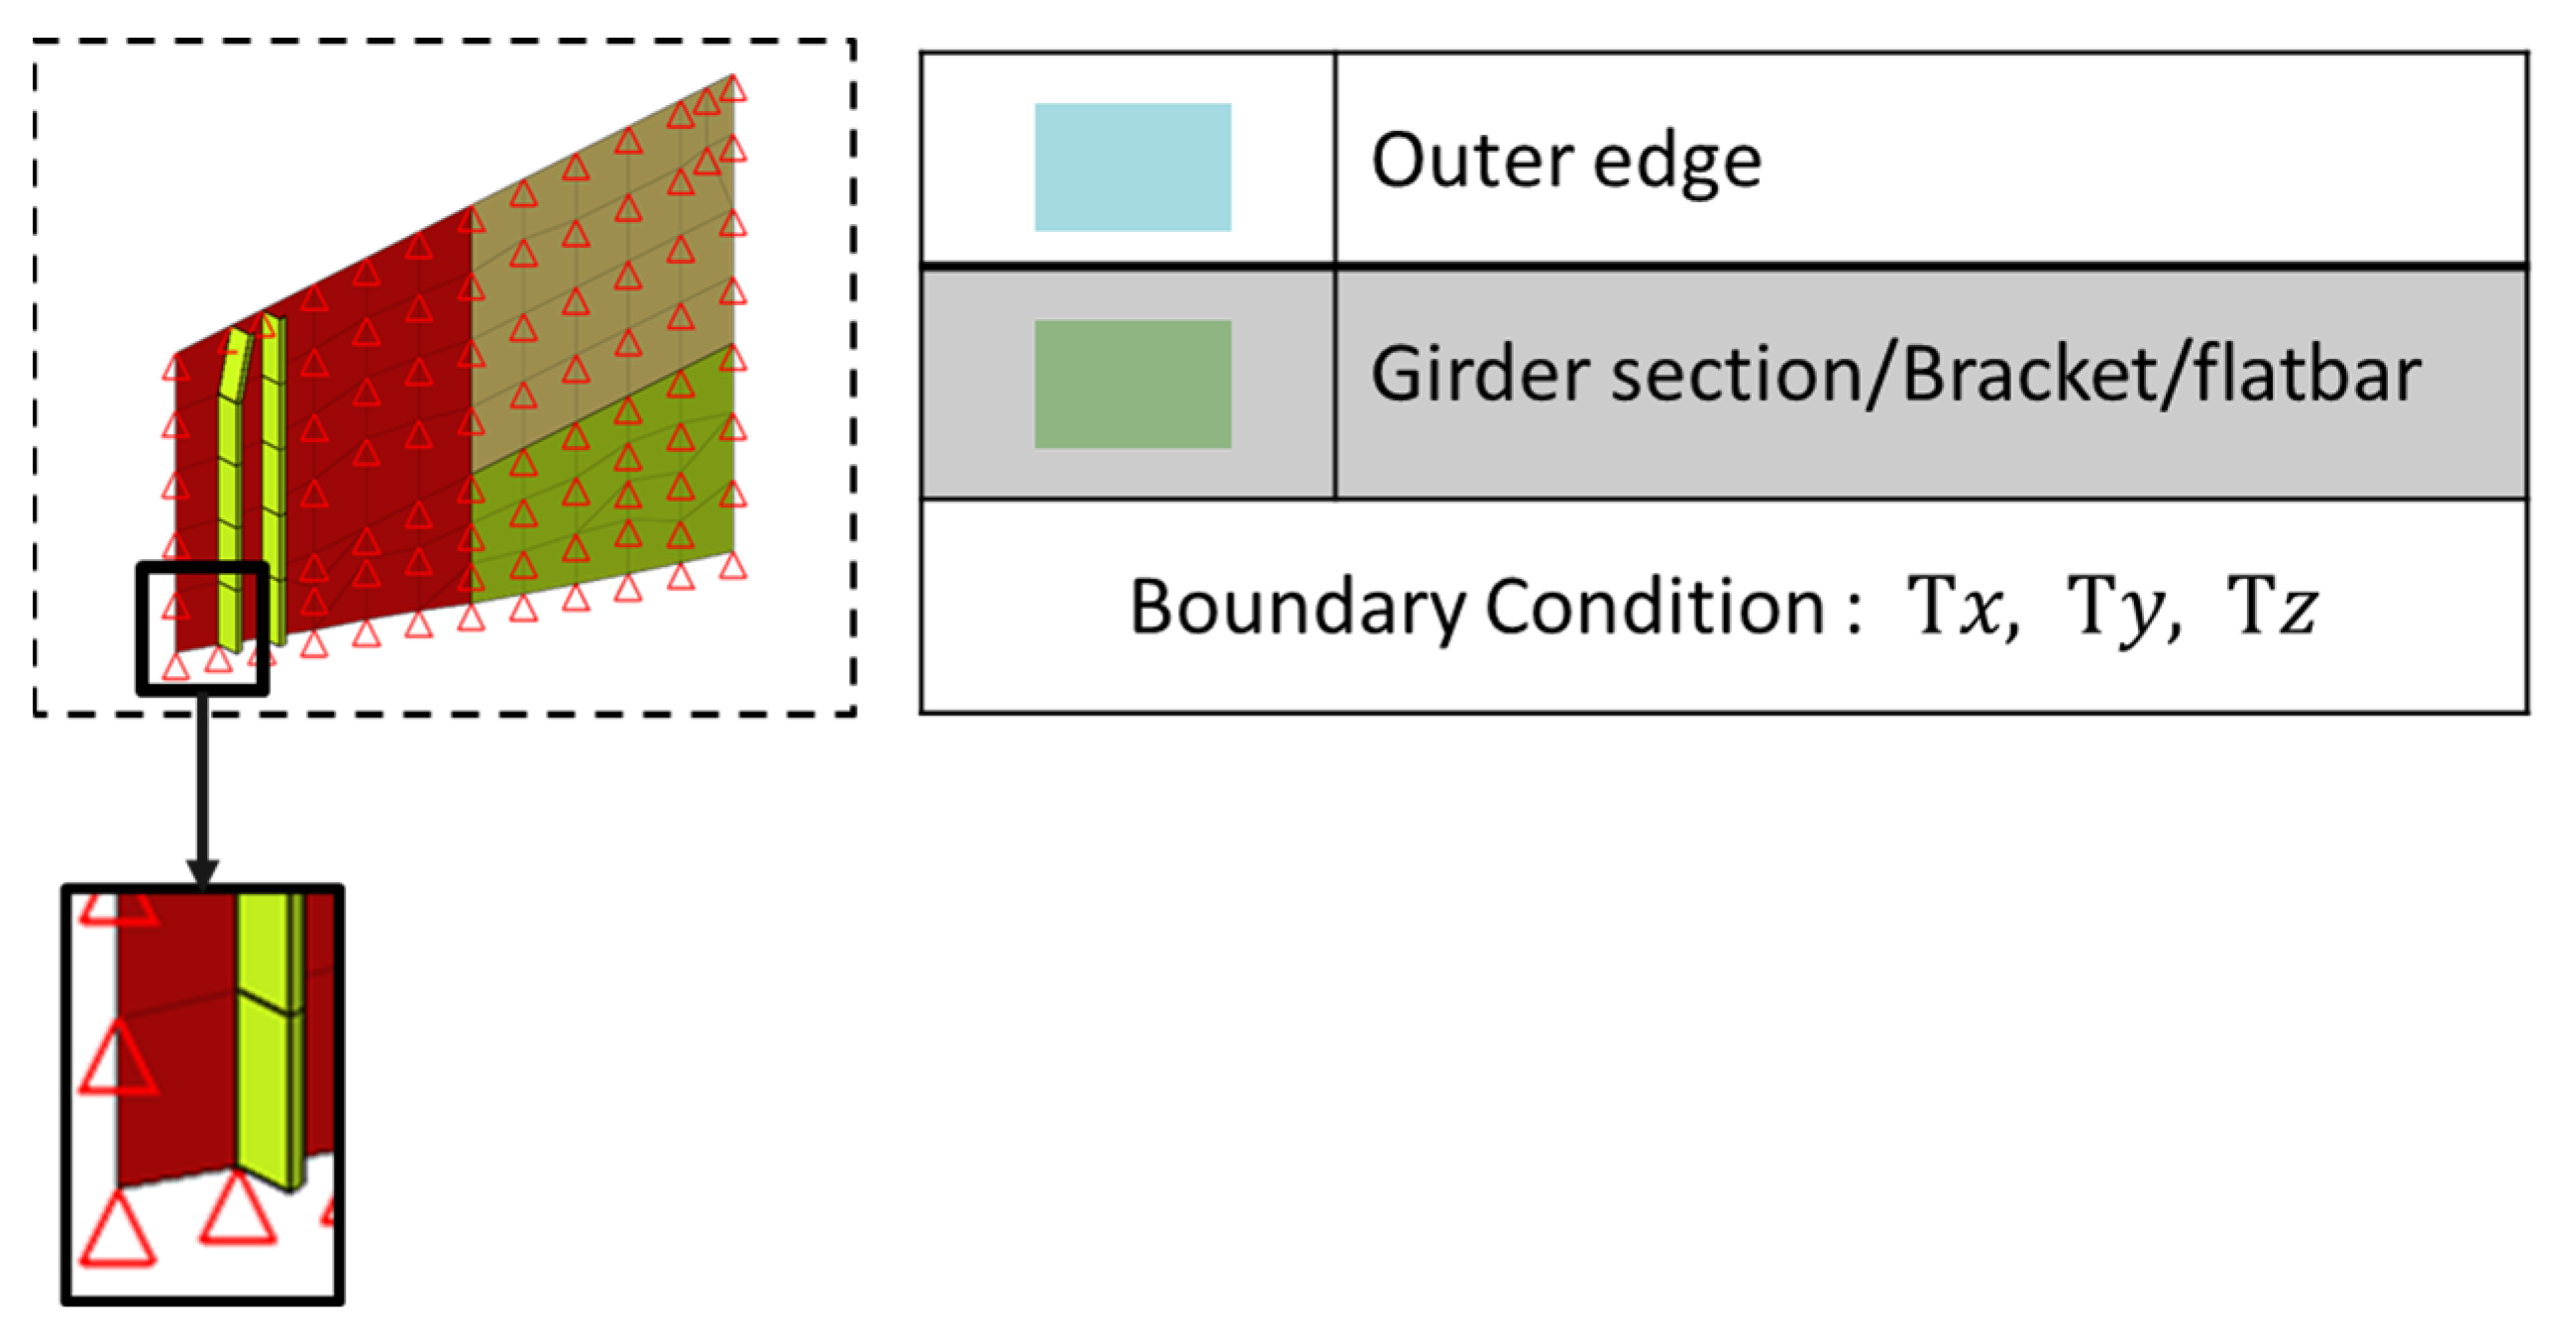
Each stiffened panel demonstrates different structural behaviors and characteristics, such as being welded to other panels, the variety of stiffener, and panel size. For that reason, an appropriate boundary condition was defined and applied. All stiffened panels are supported along their outer edges, representing the interface with surrounding structural members such as girders or frames. In addition, lines with girders, brackets, and flat bars within the panel surface were also considered as fixed constraints to reflect typical support behavior in welded ship hull structures. The boundary condition applied to these edges and lines consists of fully fixed translational constraints in the X, Y, and Z directions, as shown in Figure 2.
The vibration of the ship hull structure interacts with fluid with distinct features due to the effect of added mass, which is generated by the fluid pressure on the wetted sur-face of the fluid tank. The added mass effect must be considered in the local vibration analysis of stiffened panels inside the tank. The MSC Nastran solver facilitates vibration analysis with added mass through the use of the MFLUID card [27]. This card requires the specifications of the wetted surface region, the height of the fluid, and the fluid density. The type and value of density is input based on MARPOL regulation [28], as shown in Table 2.
After making sure the boundary condition and fluid condition are applied, the vibration analysis can be performed, and the variable affecting the natural frequency and structural model mass can be collected. Figure 3 presents representative results of the local vibration analysis of stiffened panels in tanks located in the after peak and engine room where the added mass effect must be considered. The vibration analysis result of a stiffened panel located in the accommodation compartments is also shown in Figure 3.
In Figure 3, the stiffened panel in the after peak is installed in a freshwater tank, the panel in the engine room corresponds to a heavy fuel oil storage tank, and the panel in the accommodation compartment is located on the navigation deck. The fundamental natural frequencies of the stiffened panels installed in the tanks appeared in a relatively low frequency range due to the effect of added mass.

3. ANN Model Generation

3.1. Theoretical Background

An ANN is a form of machine learning algorithm that operates and processes in a systematically similar way to the human brain, which is constructed out of interconnected processing units known as neurons that are organized into layers. The most common architecture of an ANN is an MLP model architecture with SL that consist of a feedforward pass and a backpropagation pass, where a feedforward pass is where data flows in one direction, from the input layer through one or more hidden layer to the output layer. Neurons in the hidden layer and output layer perform a weighted and biased summation of the input variable and apply a nonlinear activation function in each layer. Mathematically, the concept is shown in the formula as follows [29]:
Z j ( l ) = i = 1 n ( l 1 ) w j i l a i l 1 + b j l
a j ( l 1 ) = F Z j ( l )
In this step, the network will compute the output for a given input using weighted connections and activation functions. The final output is compared to the true output using a loss function. To calculate loss function, regression tasks need to be performed using Mean Squared Error (MSE).
L = 1 m k = 1 m y k + 1 y k 2
The next step is backpropagation pass: in this step the network will compute the gradients of the loss function with respect to each weight and bias in the network using the chain rule. These gradients indicate how to adjust each parameter to reduce the loss. The error at the output layer L is given by
δ j L = L a j L   ·   f Z j L
For hidden layers, the error is propagated backward recursively as follows:
δ j L = f Z j L K = 1 n ( l + 1 ) w K j ( l + 1 ) + δ K ( l + 1 )
The gradients of the loss with respect to weights and biases are
L w j i ( l ) = δ j L + a i ( l 1 )
L b j i ( l ) = δ j L
The parameters are updated using a gradient descent-based optimization rule as follows:
W ( l ) W ( l ) η · L W ( l ) b ( l ) b ( l ) η · L b ( l )
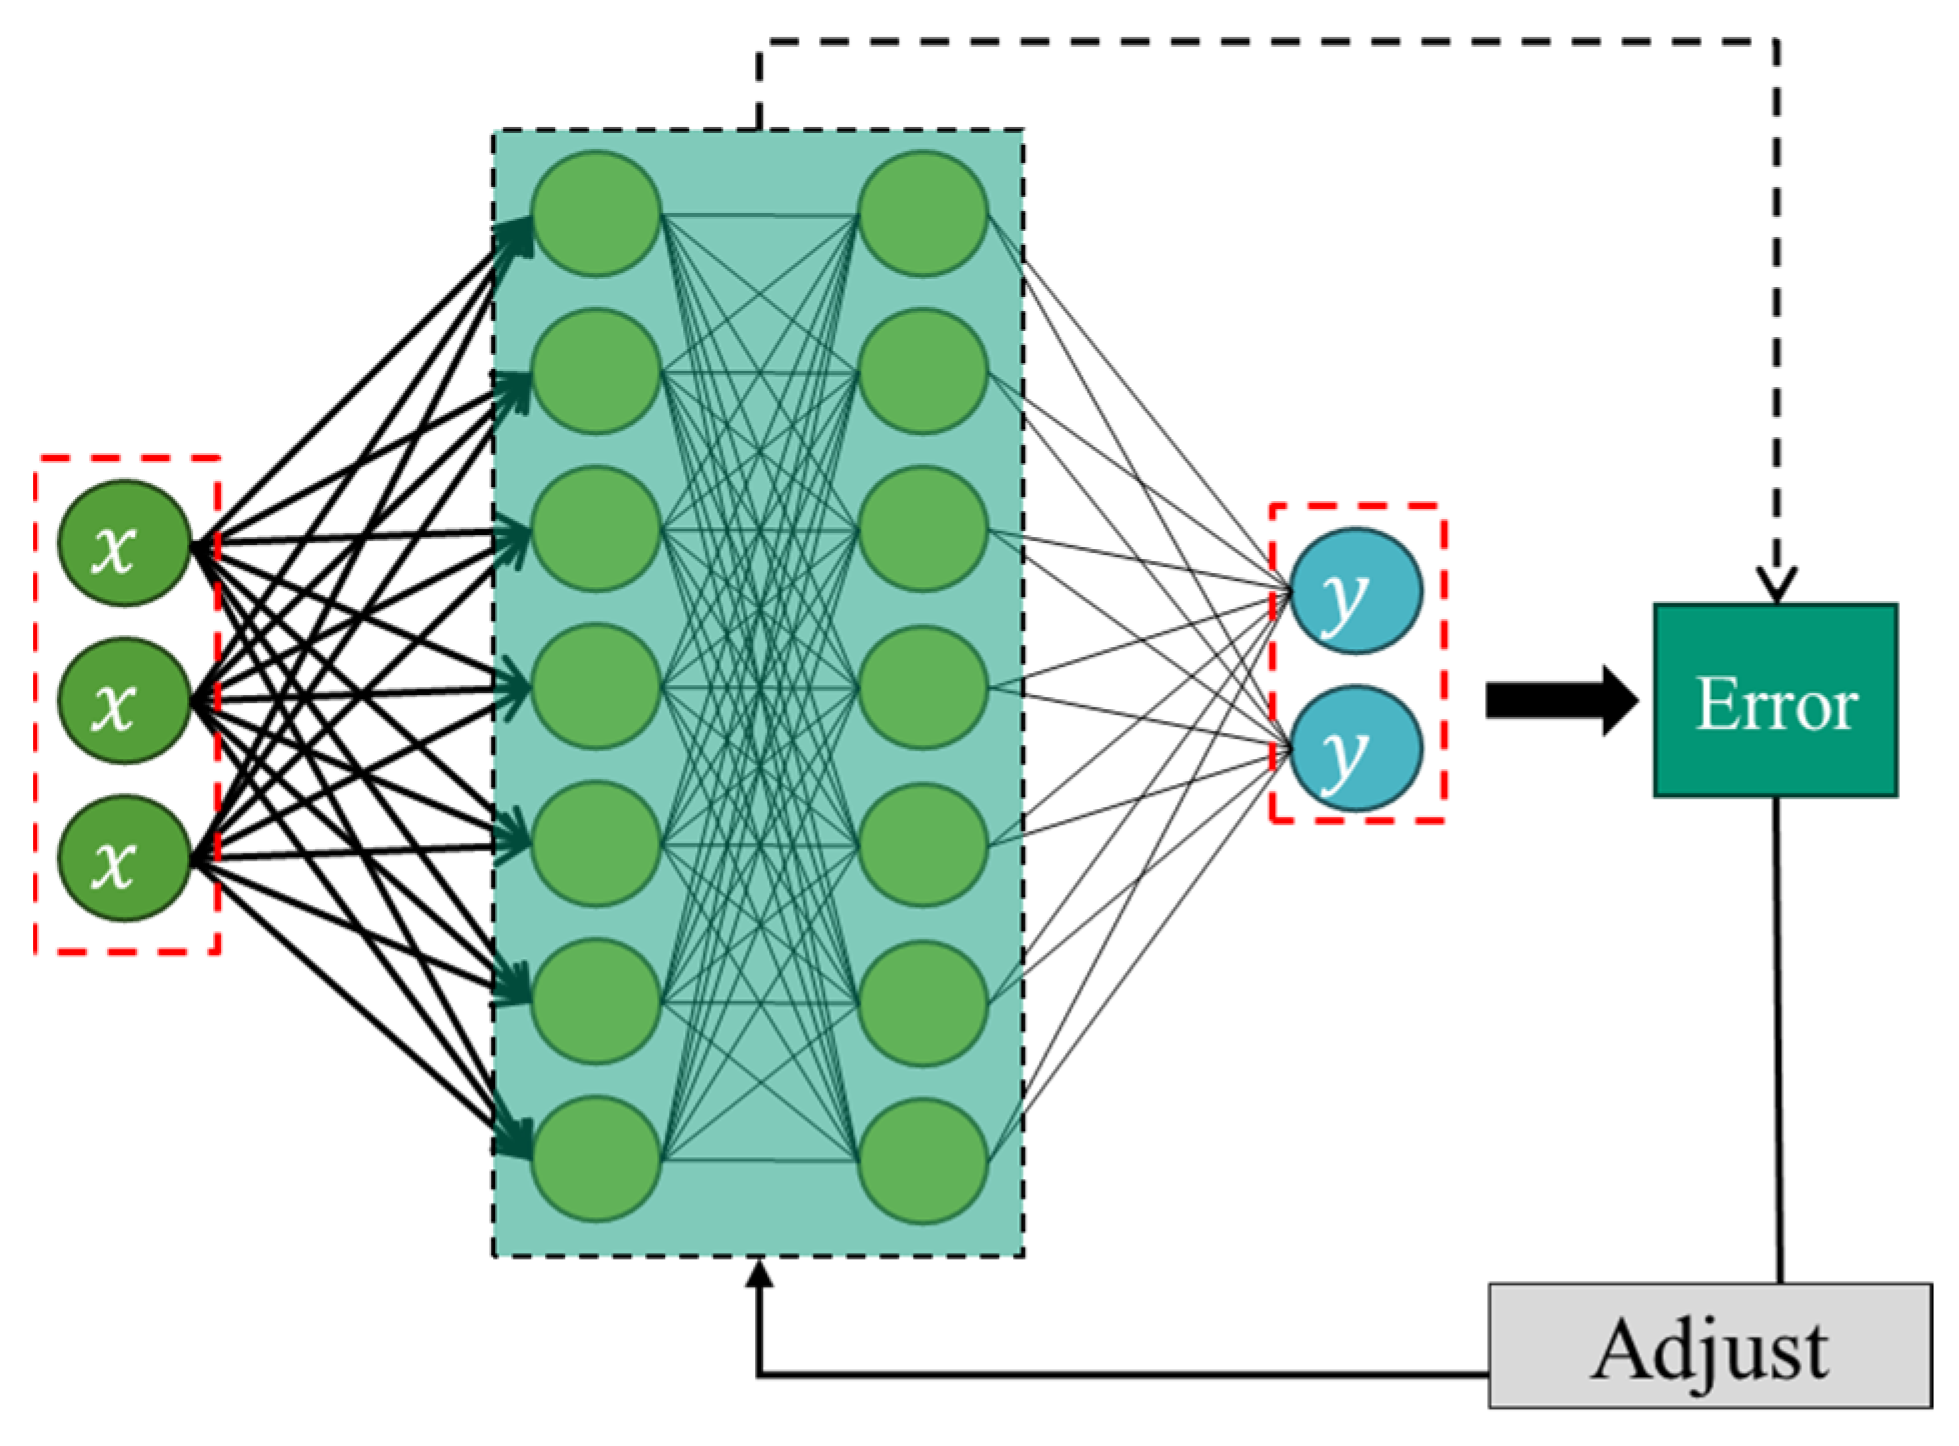
where η is the learning rate, which is a hyperparameter that controls how much the parameters are adjusted during each update. An illustration of the neural network model is shown in Figure 4.
This study will apply an artificial neural network with an MLP model architecture and SL algorithm; the output of this network will be the result of the vibration analysis of natural frequency and structural model mass. Because of that, the input variable will be correlated to the output variable; in this case the variable will be chosen based on the natural frequency value calculated as follows:
F n =   1 2 π k m
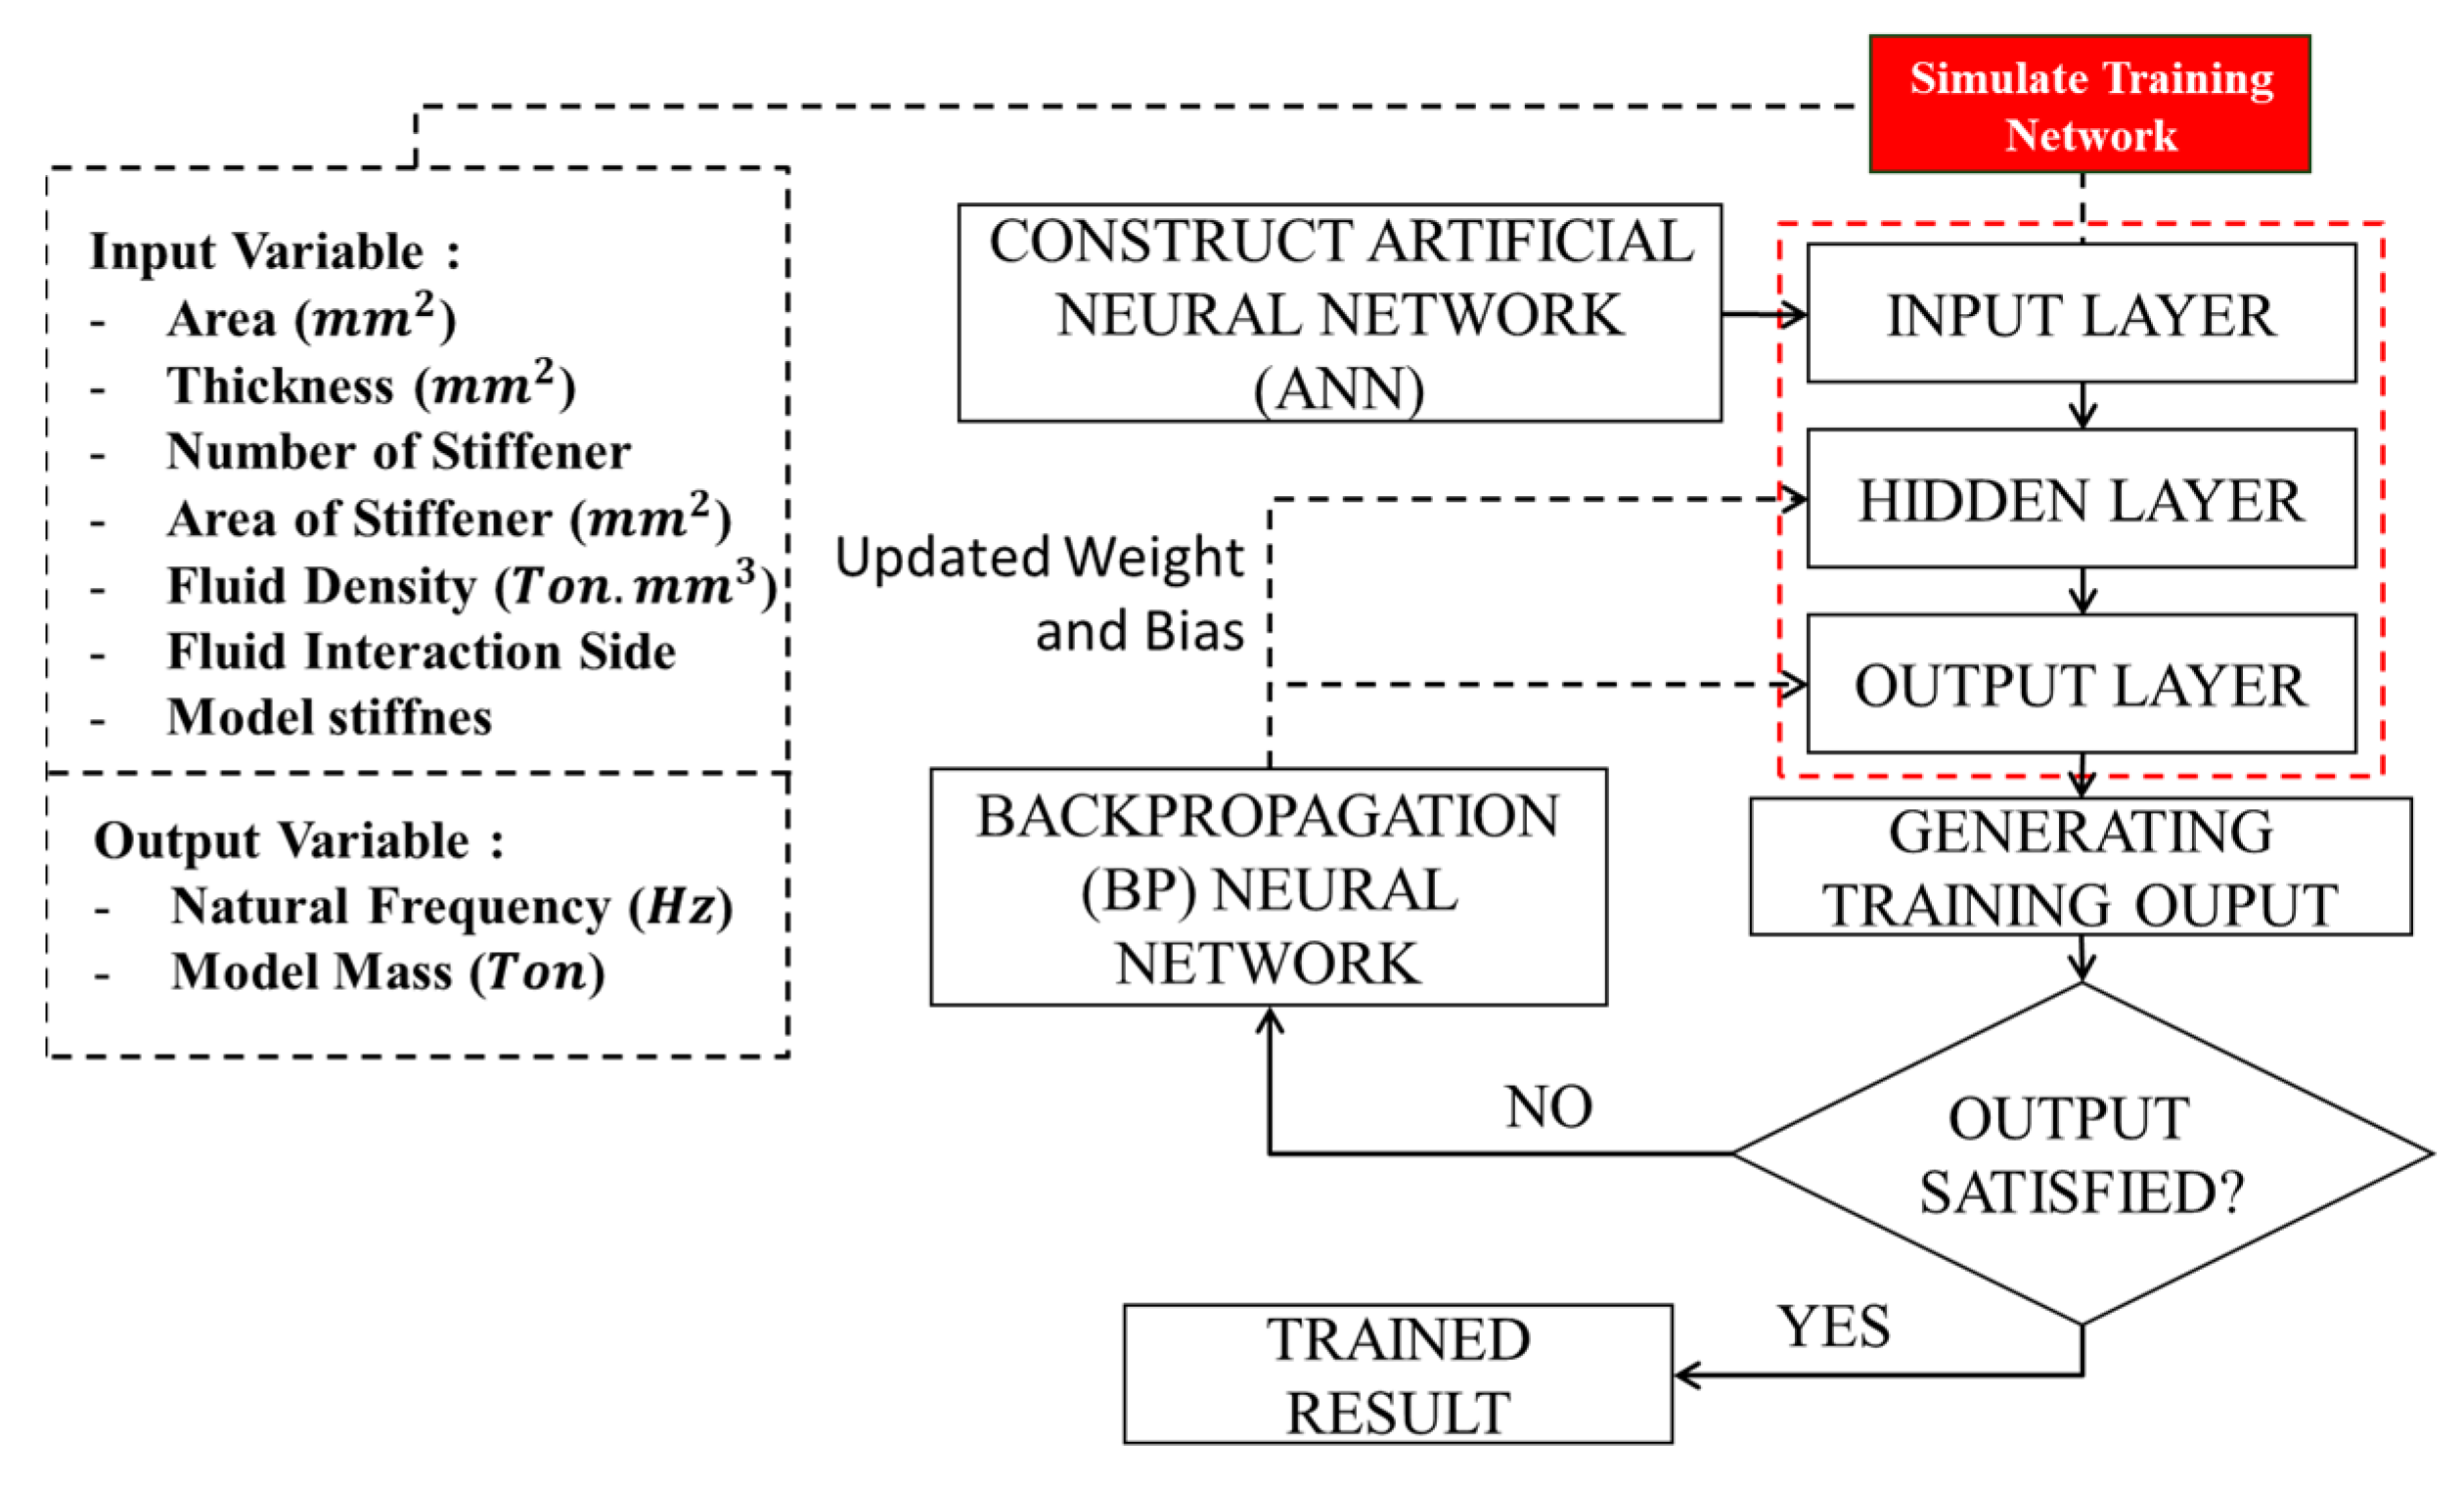
Based on the above equation, seven input variables will be chosen such as panel dimensions, plate thickness, stiffener number and area, fluid density, fluid interaction, and model stiffness. The model stiffness was calculated using Equation (9) after obtaining the fundamental normal mode frequency and mass through FEA in order to extract consistent stiffness from the FEA model. The network will train the sample data based on the variable obtained from FEA simulations, making it a computationally efficient surrogate model for vibration prediction—the workflow of the neural network is shown in Figure 4. The network learns to generalize the mapping from input to output, allowing for faster predictions for novel panel combinations.
From the Figure 5 shown that the approach starts with the creation of the MLP architecture, which consists of three main parts, which are the input layer, hidden layers, and output layer. After the network is structured, it is simulated for training, with the starting weights assigned and changed repeatedly. During the training phase, input data is fed into the network, and the resulting output is generated. This output is compared to the aimed target, and the error is propagated backward through the network through the backpropagation process, which updates the weights. This cycle repeats until the output reaches a predefined satisfaction criterion. This model will be applied using the Visual Studio Code program version 1.99 [30] and trained using Python version 3.11.9 [31].

3.2. ANN Model Setting

With respect to sample data distribution, 156 stiffened panels are successfully analyzed using FEA simulation. The output variable resulted in a big variety of sample data, with the natural frequency ranging from 7 Hz to 59 Hz and the structural model mass ranging from 0.9 Ton to 17.2 Ton. These data samples were used in the training process, and 10% to 15% of the sample size was applied to the validation set. The input variable for each panel is also very diverse because the characteristics of each panel are different; this means that the network will have a chance to create high accuracy predictions [1].
In the context of data processing, before the sample dataset is inputted into a network model, the dataset has to be scaled first to enhance learning efficiency and model stability. The MinMaxScaler normalization function is applied to re-scale each feature to a fixed range of [0, 1] based on the following formula:
X s c a l e d = x x m i n x m a x x m i n
This method helps to improve the performance of the training and the training speed of the network.
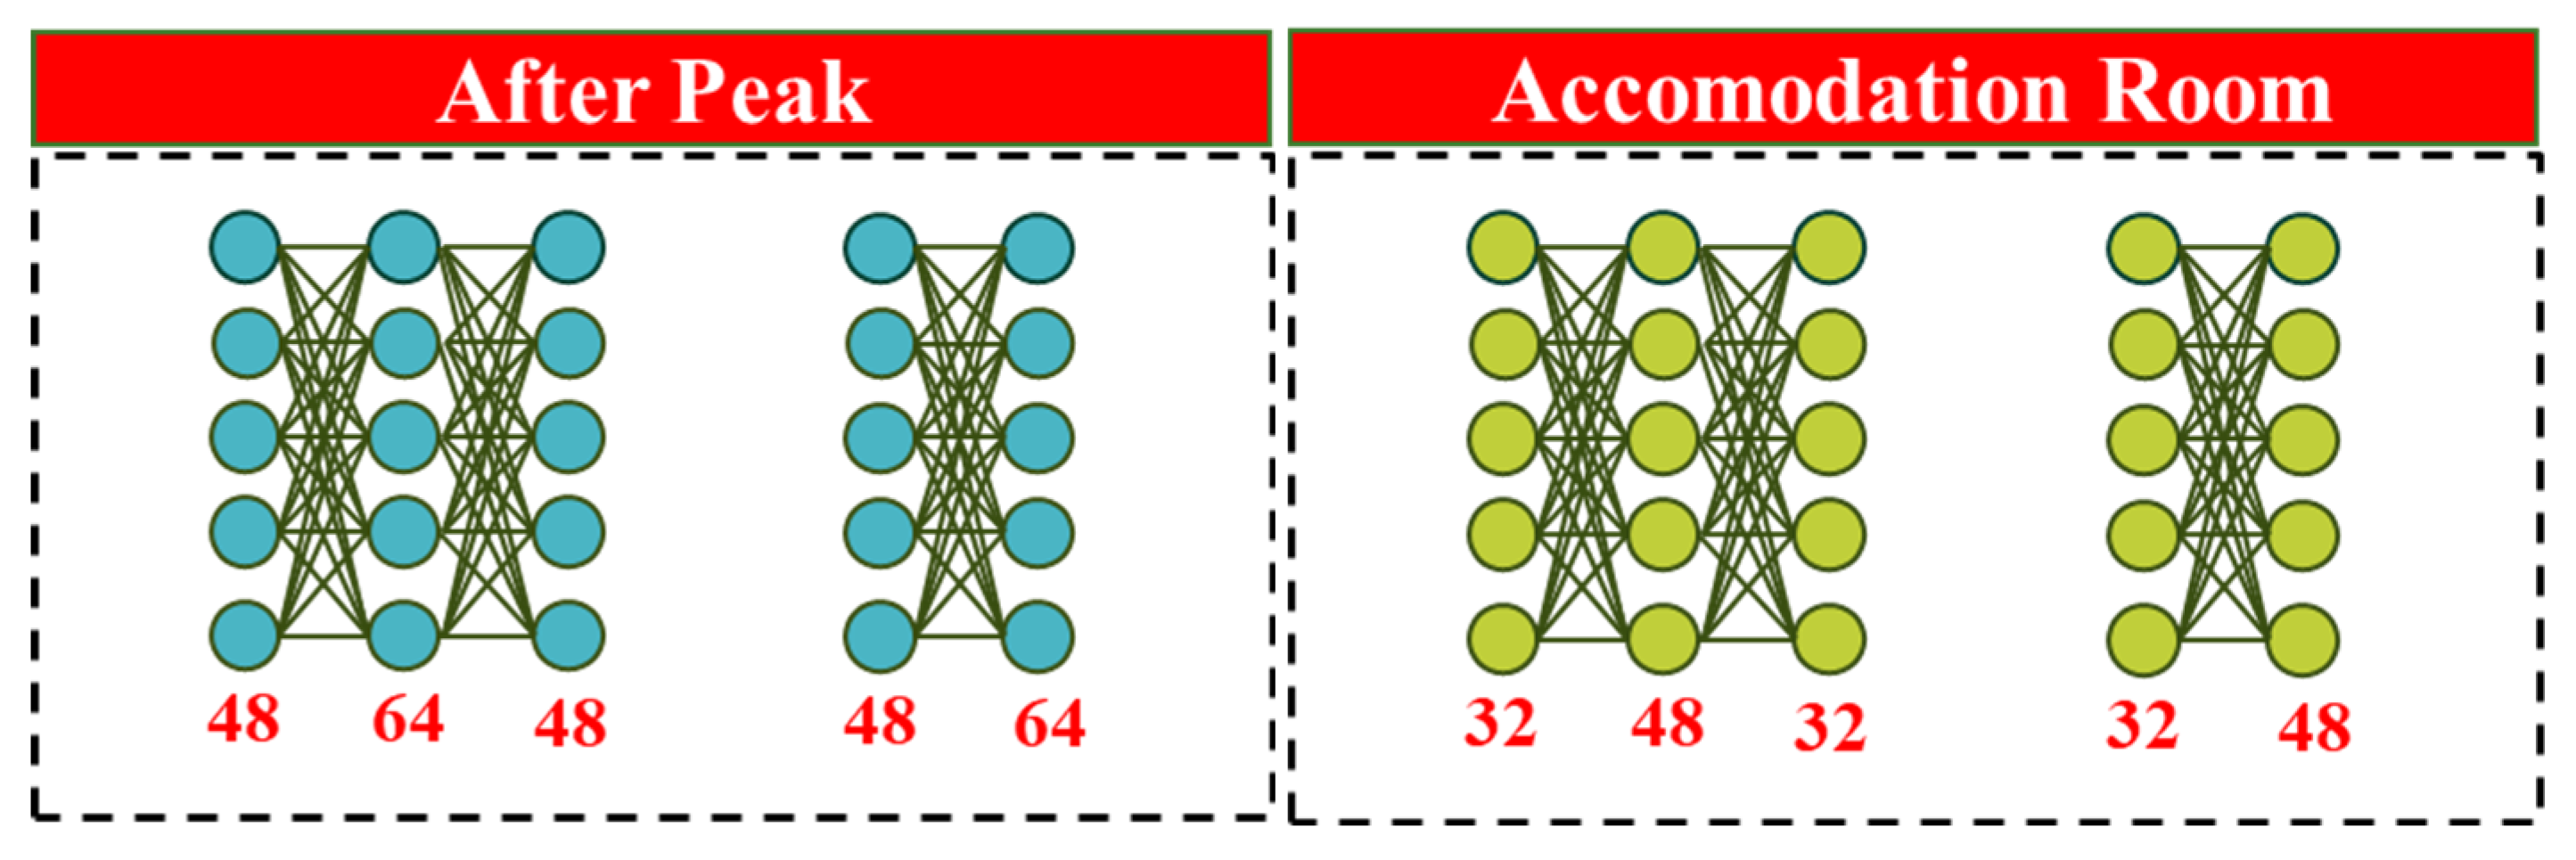
The model will be trained with four different training sets based on its panel location, with one being a combination of all panels. The four training sets are as follows: entire panel training set, engine room training set, after peak training set, and accommodation room training set. Each training set will have different architecture models, including different numbers of hidden layers, neurons, and hyperparameters. In this study, the reason for proposing neural network models with four different training sets according to the ship’s compartments is that, in the case of medium- and large-sized cargo vessels, the hull form and structural configuration do not undergo significant changes when the type of transported cargo is the same. Therefore, once the proposed neural network models achieve a reasonable level of accuracy, the trained models can generally be applied to predict the fundamental normal mode vibration of local panels installed in a deadweight 157 K ton class medium-sized crude oil tanker. In addition, since this study incorporated all variables related to the mass and stiffness of the local panel that are required to calculate the fundamental normal mode frequency into the input layer data for training the neural network models, it can be considered that the trained models have secured a fundamental level of rationality in predicting the output layer results depending on the characteristics of the training set. The development of a more broadly generalized neural network model, however, requires an extensive amount of training data covering a wide variety of ship types. Hence, this study is expected to serve as a starting point for future research aimed at establishing more generalized neural network models for predicting local panel vibrations in ships.
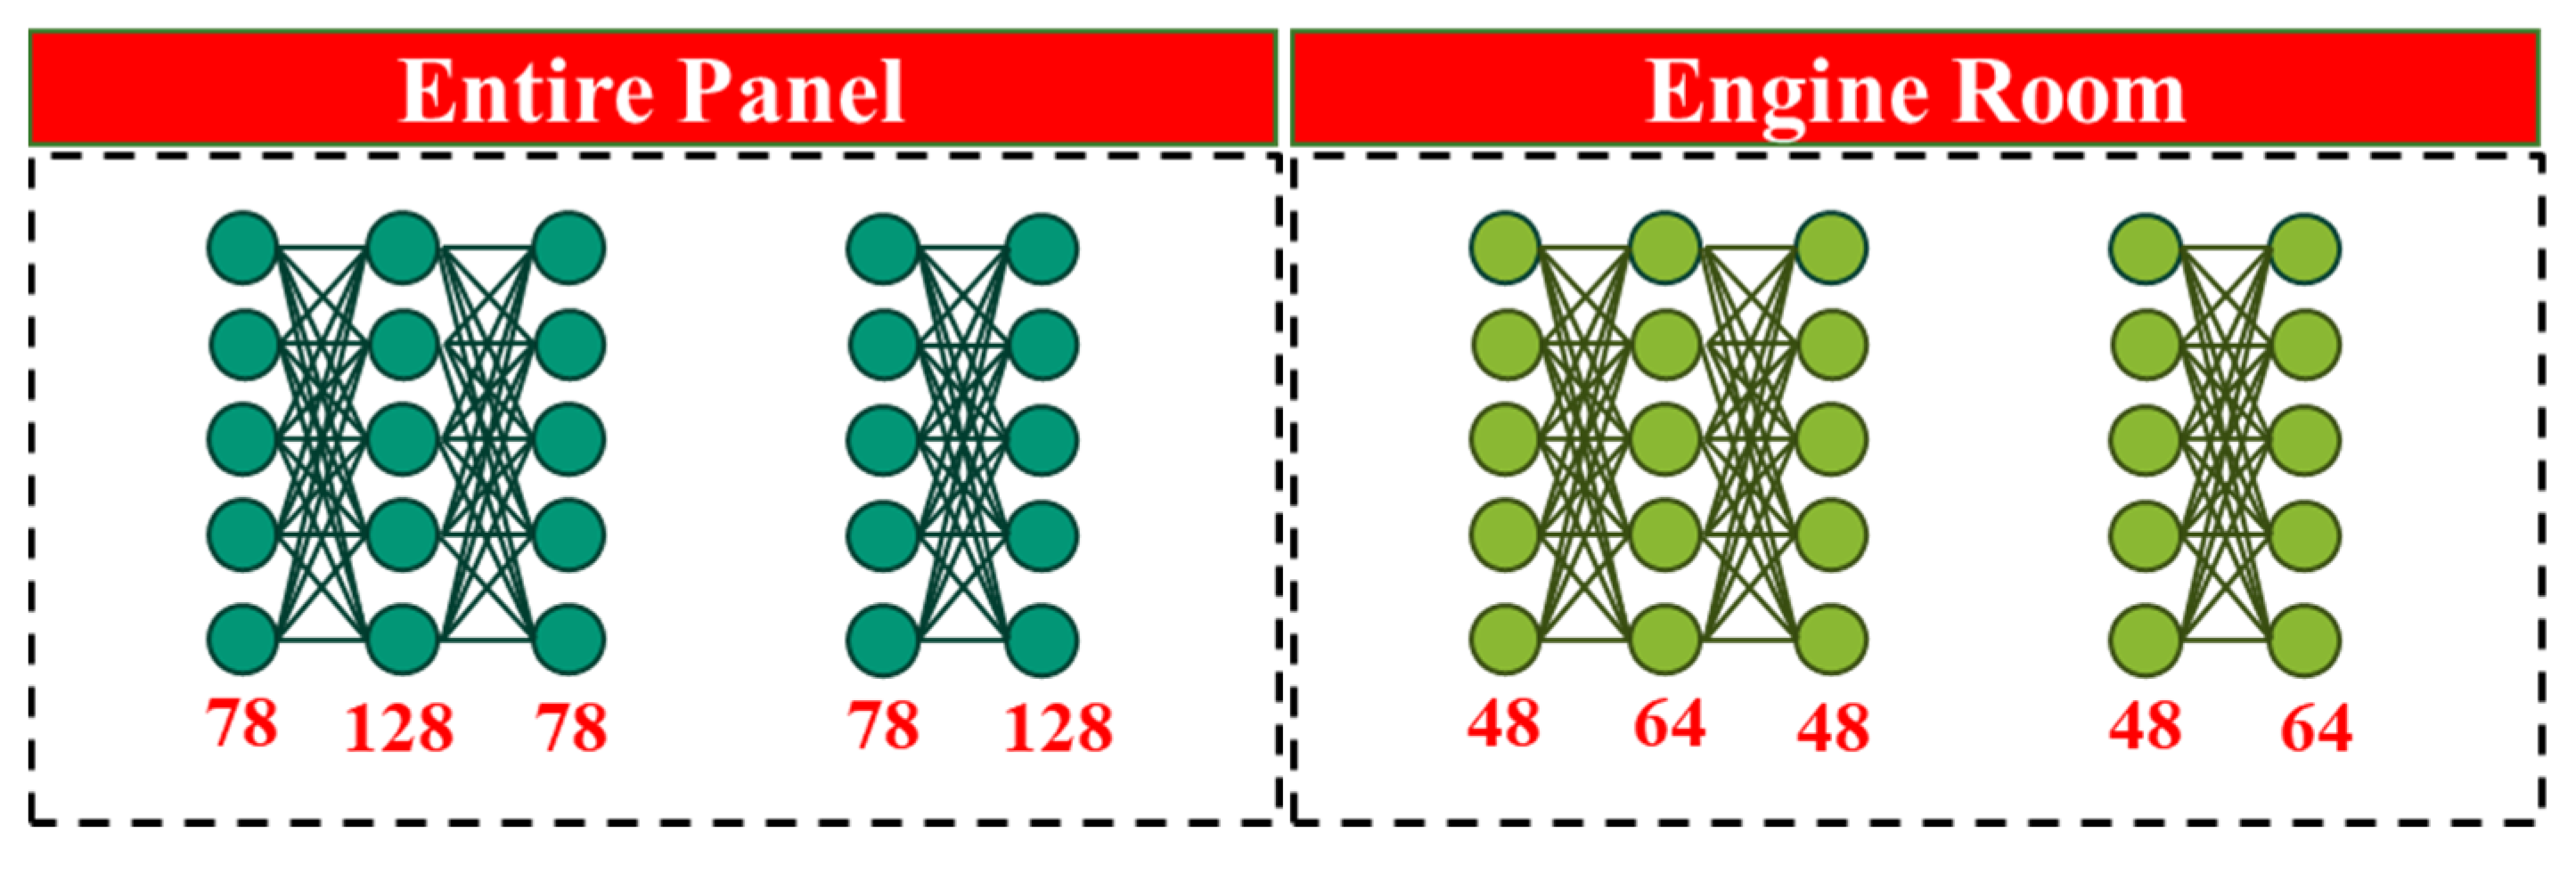
The network starts with an input layer consisting of seven neurons that correspond to the structural characteristics and vibrations, such as panel length, panel width, plate thickness, number of stiffeners, stiffener area, fluid density, fluid interaction side, and model stiffness. Each of these variables has a direct influence on the dynamic behavior of the panel and is essential for accurate vibration prediction. For the hidden layer, this study will train each training set with two to three hidden layers, and each hidden layer will consist of 24 to 128 neurons based on its network characteristics and sample data size in each network set. The model settings for each network training set is shown in Figure 6.
The final output layer consists of two neurons representing the predicted natural frequency and the structural model mass of each panel. Because both outputs are continuous numerical values, the linear activation function is used in the output layer; this activation function allows the network to produce unrestricted real valued outputs suitable for engineering predictions.
Each neuron in the hidden layers employs the Rectified Linear Unit (ReLU) activation function. This function introduces nonlinearity into the model while maintaining computational simplicity. ReLU was selected due to its training efficiency and ability to reduce the vanishing gradient problem, which may occur in deep networks. Since the neural network learning model considered in this study is limited to predicting only the fundamental normal mode frequency and mass of local panels in restricted hull structures, the sensitivity to the choice of activation function is expected to be low. However, in future studies on expanded learning models, it will be necessary to investigate the influence of various activation functions such as Swish, Tanh, and so on.
To reduce the likelihood of overfitting, dropout layers are implemented after each hidden layer. Dropout randomly disables a subset of neurons throughout each training cycle, preventing the network from becoming excessively dependent on specific network paths. This study adopts a dropout rate of 0.2 to 0.3, which means that 20% to 30% of neurons are eliminated at random during each forward and backward pass.
To optimize the model during training, the Adam optimizer (Adaptive Moment Estimation) is applied. It calculates distinct adaptive learning rates for each parameter utilizing first and second moment estimates of the gradients [32]. This study utilizes a learning rate of 0.0005, which provides a reasonable balance of convergence speed and training stability. Adam is particularly well suited to problems with weak gradients or noisy data, making it a great fit for the panel vibration prediction task.
The model will be separated into a training set and validation set; this method is applied to ensure that the result is valid. Since the sample data is considered a small sample size, in this study 0.1 to 0.15 will be defined as the validation split, which means 10% to 15% of the sample size will become the validation set and 85% to 90% of the sample size will become the training set. After the consideration of all factors and hyperparameters, there will be 16 network variations that consist of a combination of the training set, hidden layers, and the validation split. All 16 variations are shown in Table 3.

4. Results and Discussion

4.1. Training Loss

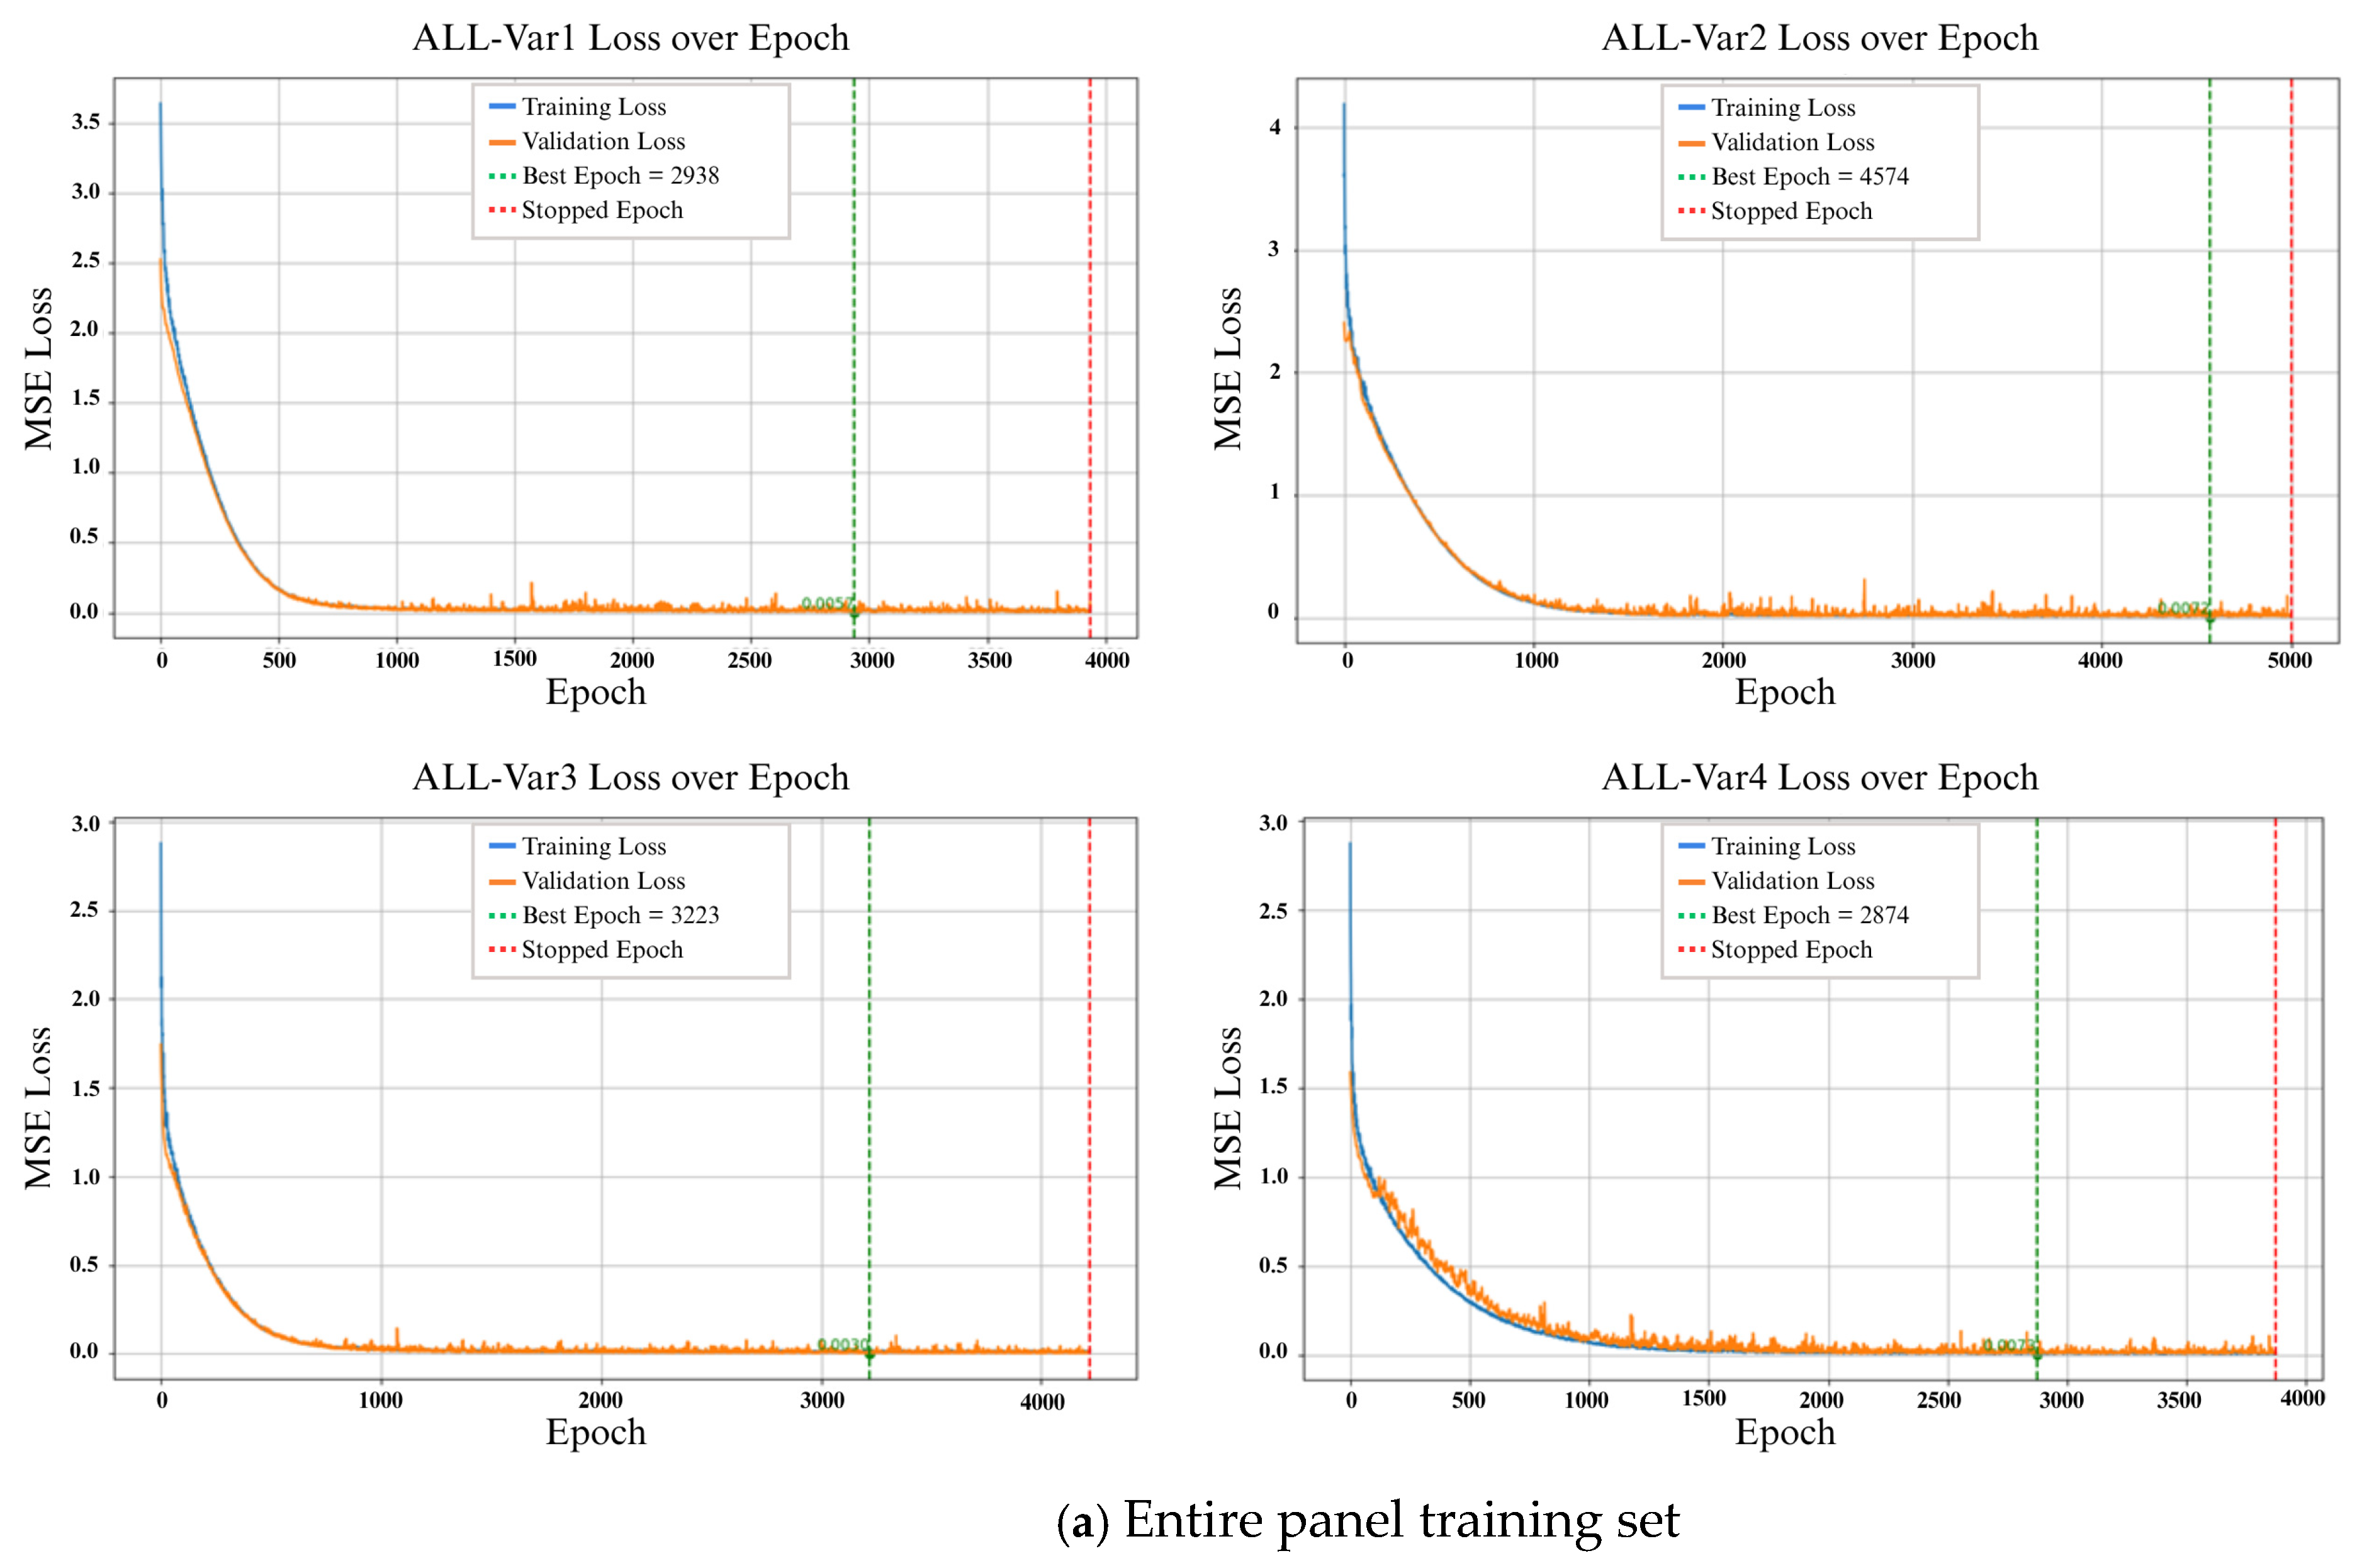
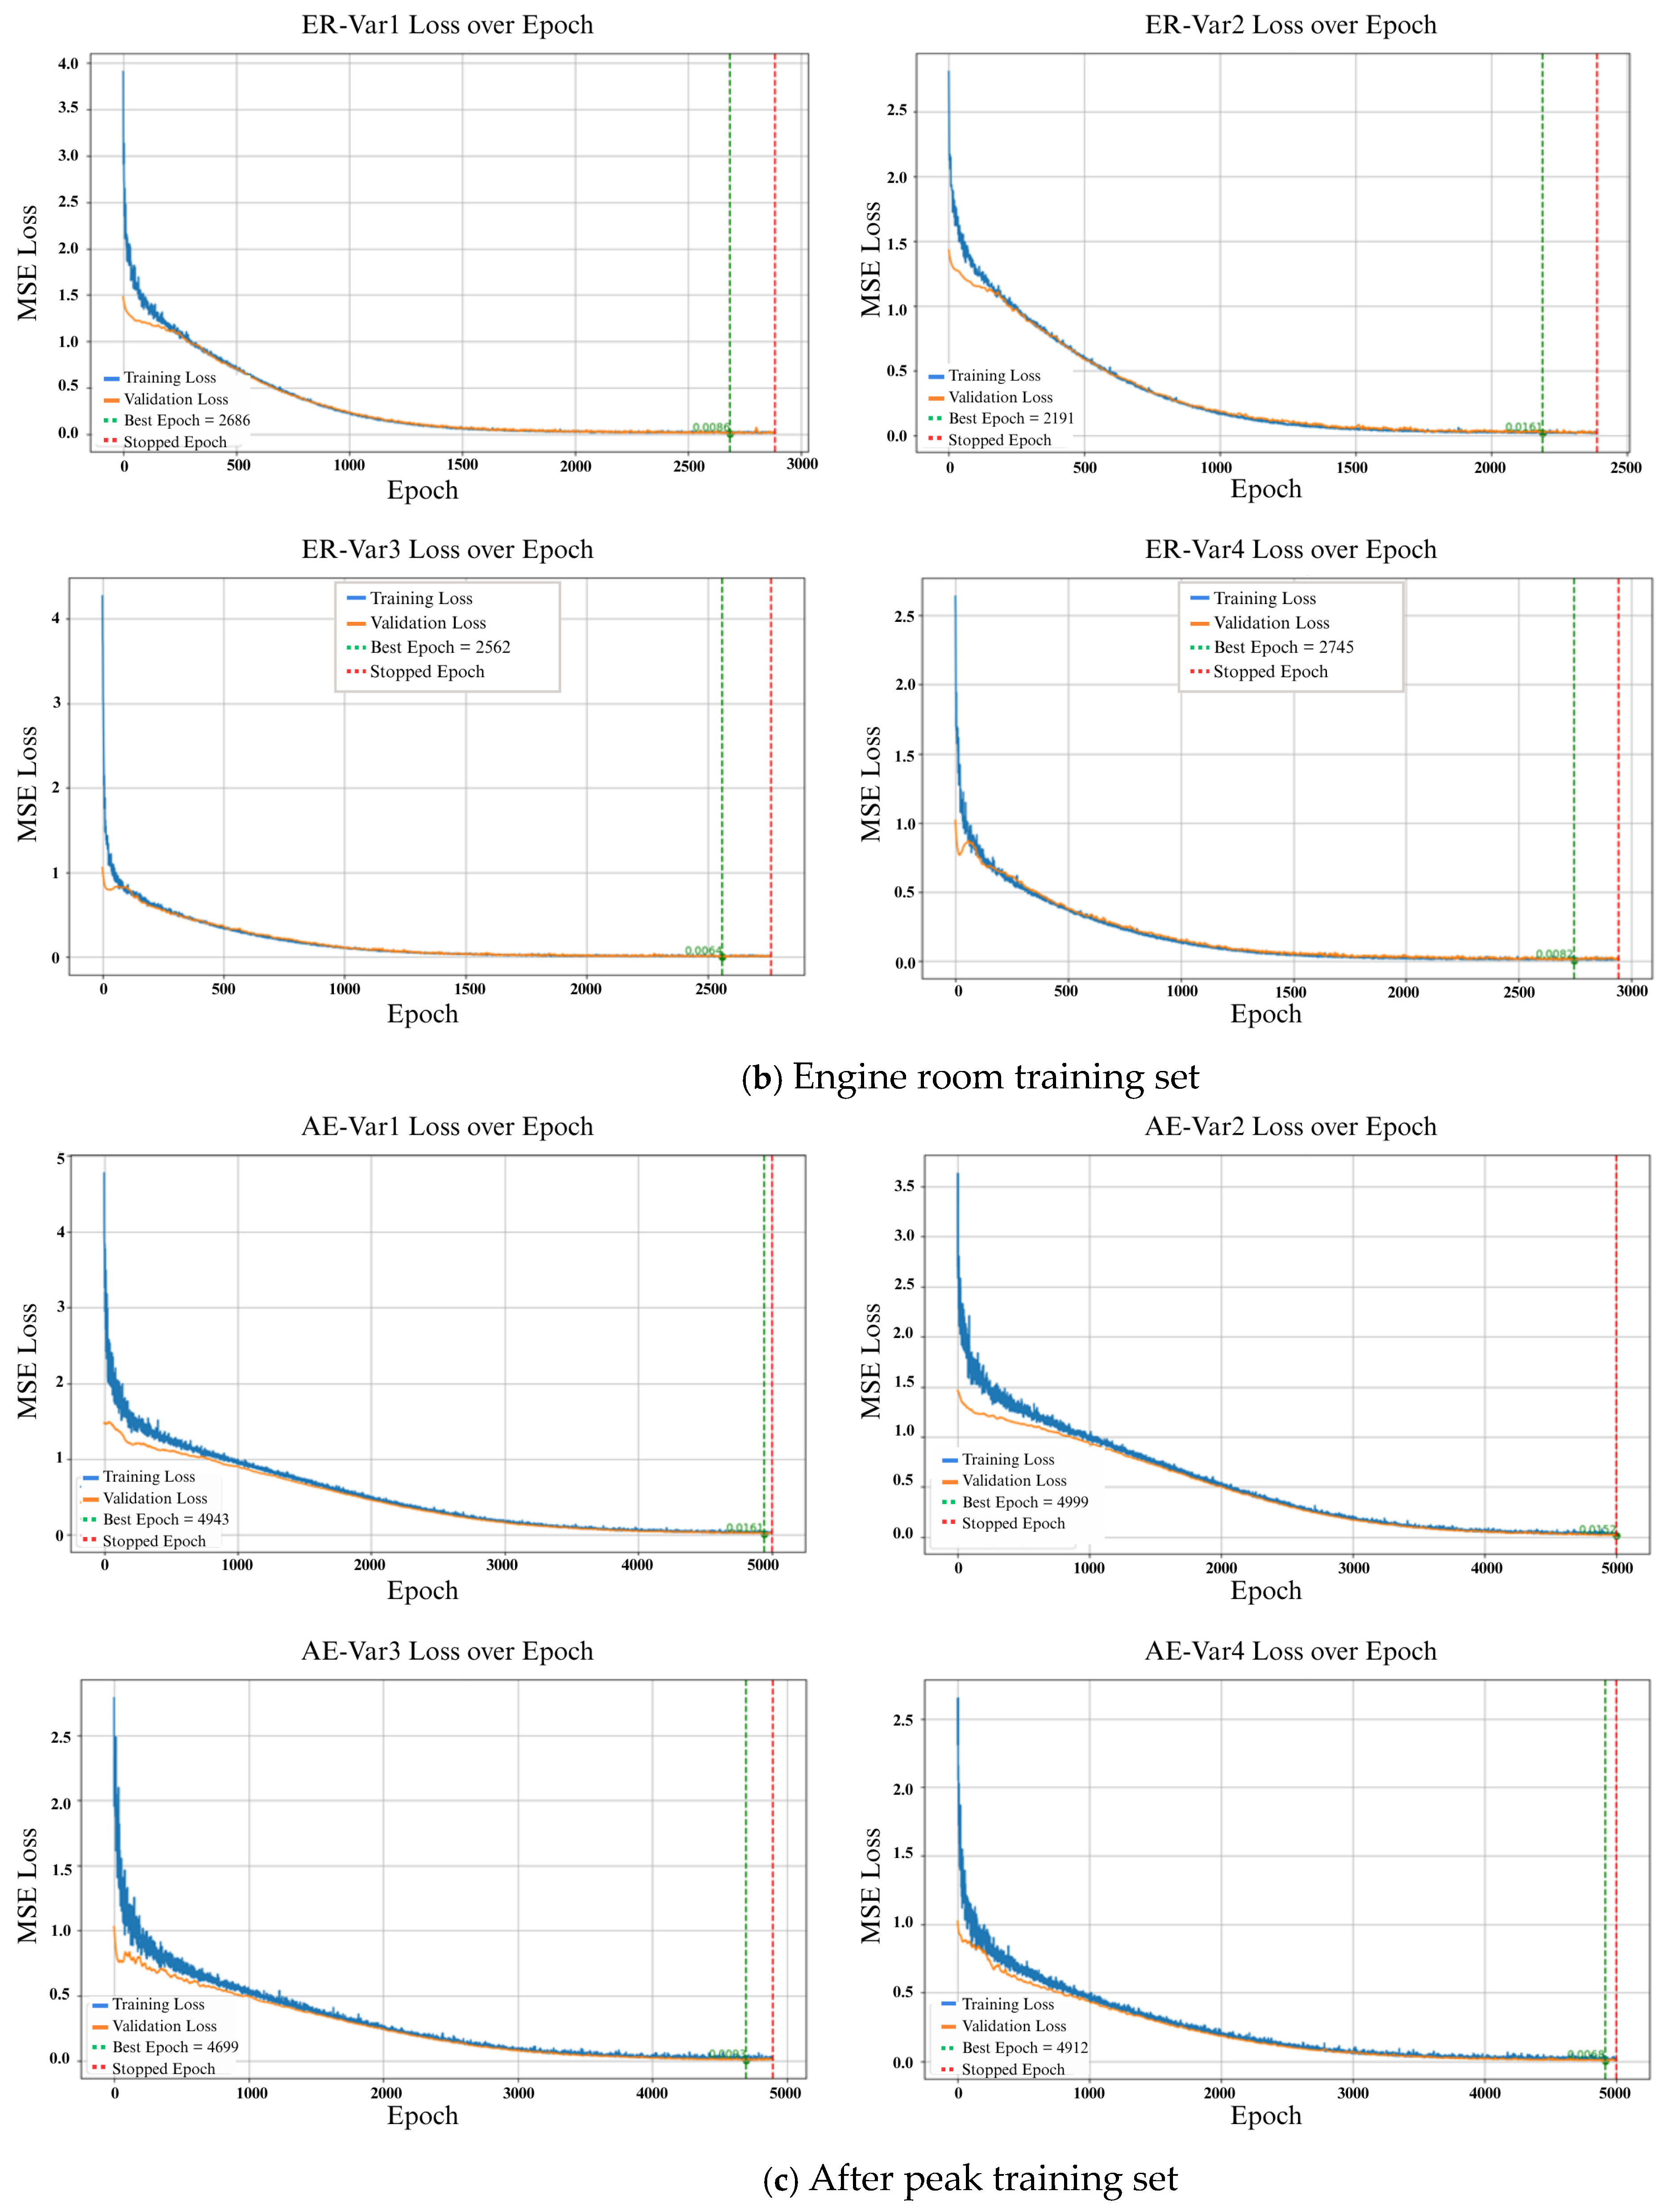
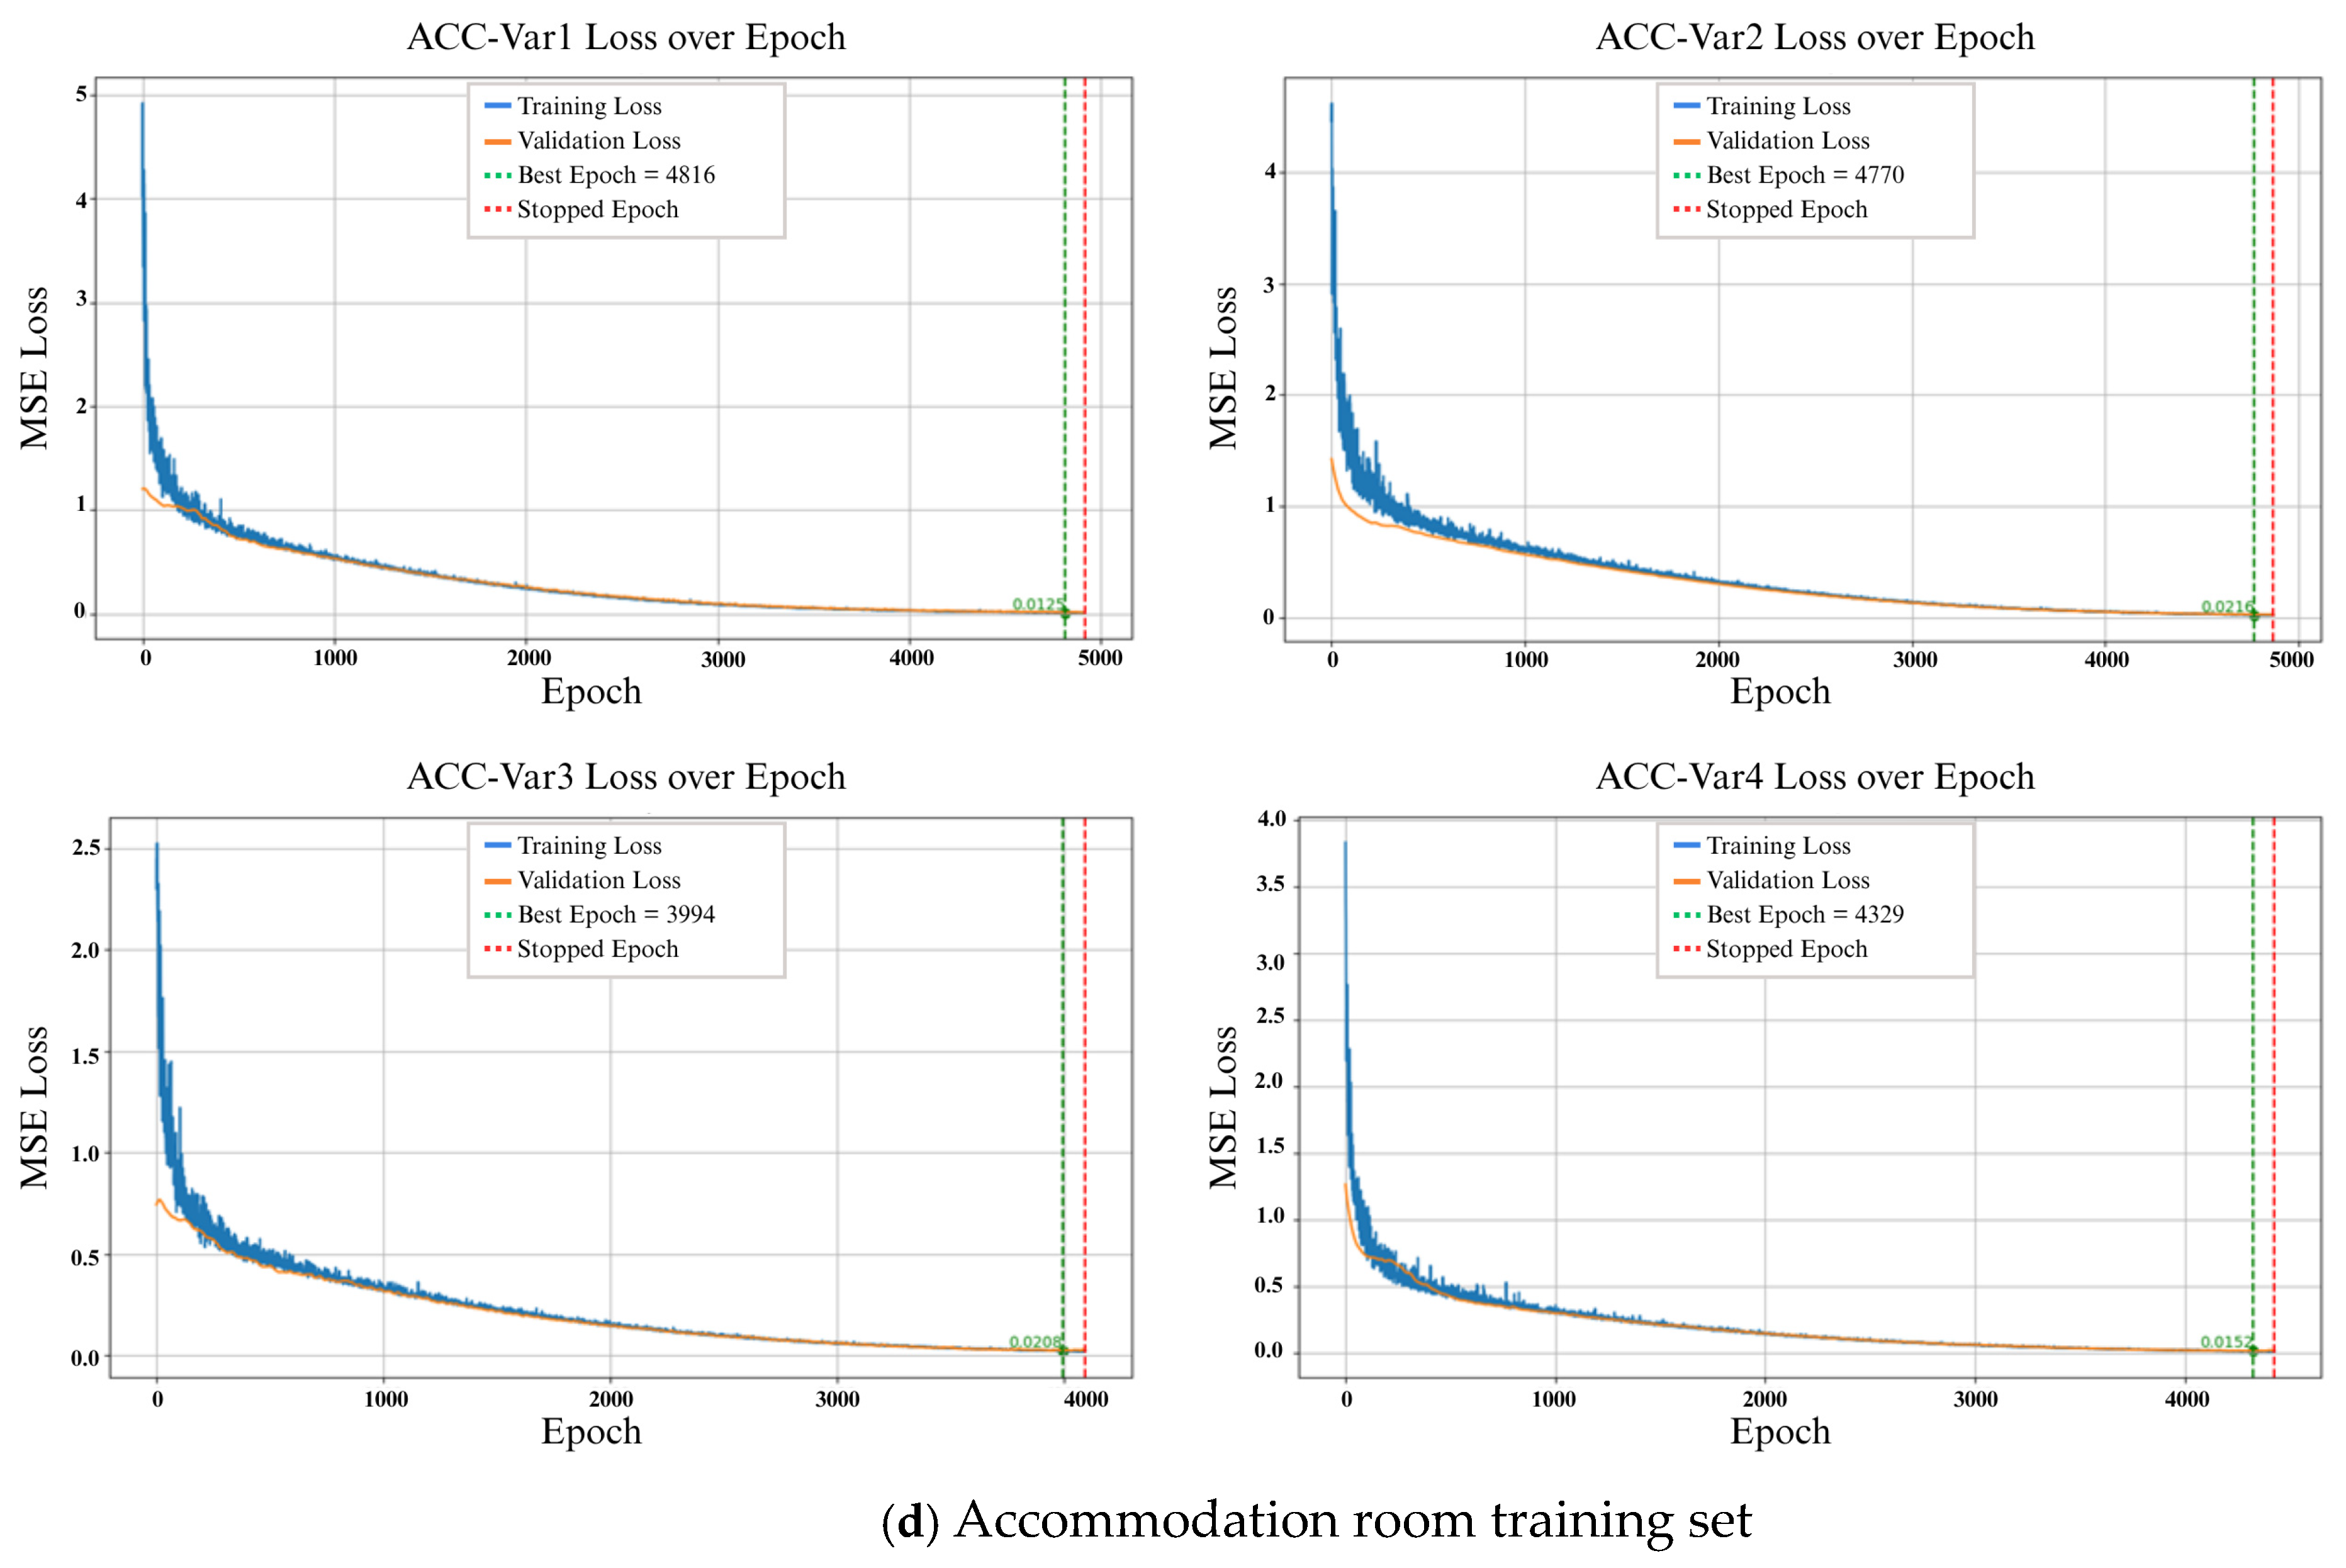
The 16 network models were trained until more than 2000 epochs for each network elapsed. Each of the networks have different length of training based on its network hyperparameters. In each epoch, the MSE and Mean Absolute Error (MAE) will be calculated to find out the loss or error value for each epoch. After the model has finished training, the model loss over curve can be applied. The curve is shown in Figure 7.
From the loss over graphs above, it can be shown that the entire panel variant 1 to 4 and engine room variant 1 to 4 network models have a very smooth graph, which indicates the optimum generalization of sample data, compared with the after peak variant 1 to 4 and accommodation room variant 1 to 4 network models, which have very rough lines in each epoch, which means that the sample data is not generated well because the sample data is noisy.

4.2. Output Prediction Performance

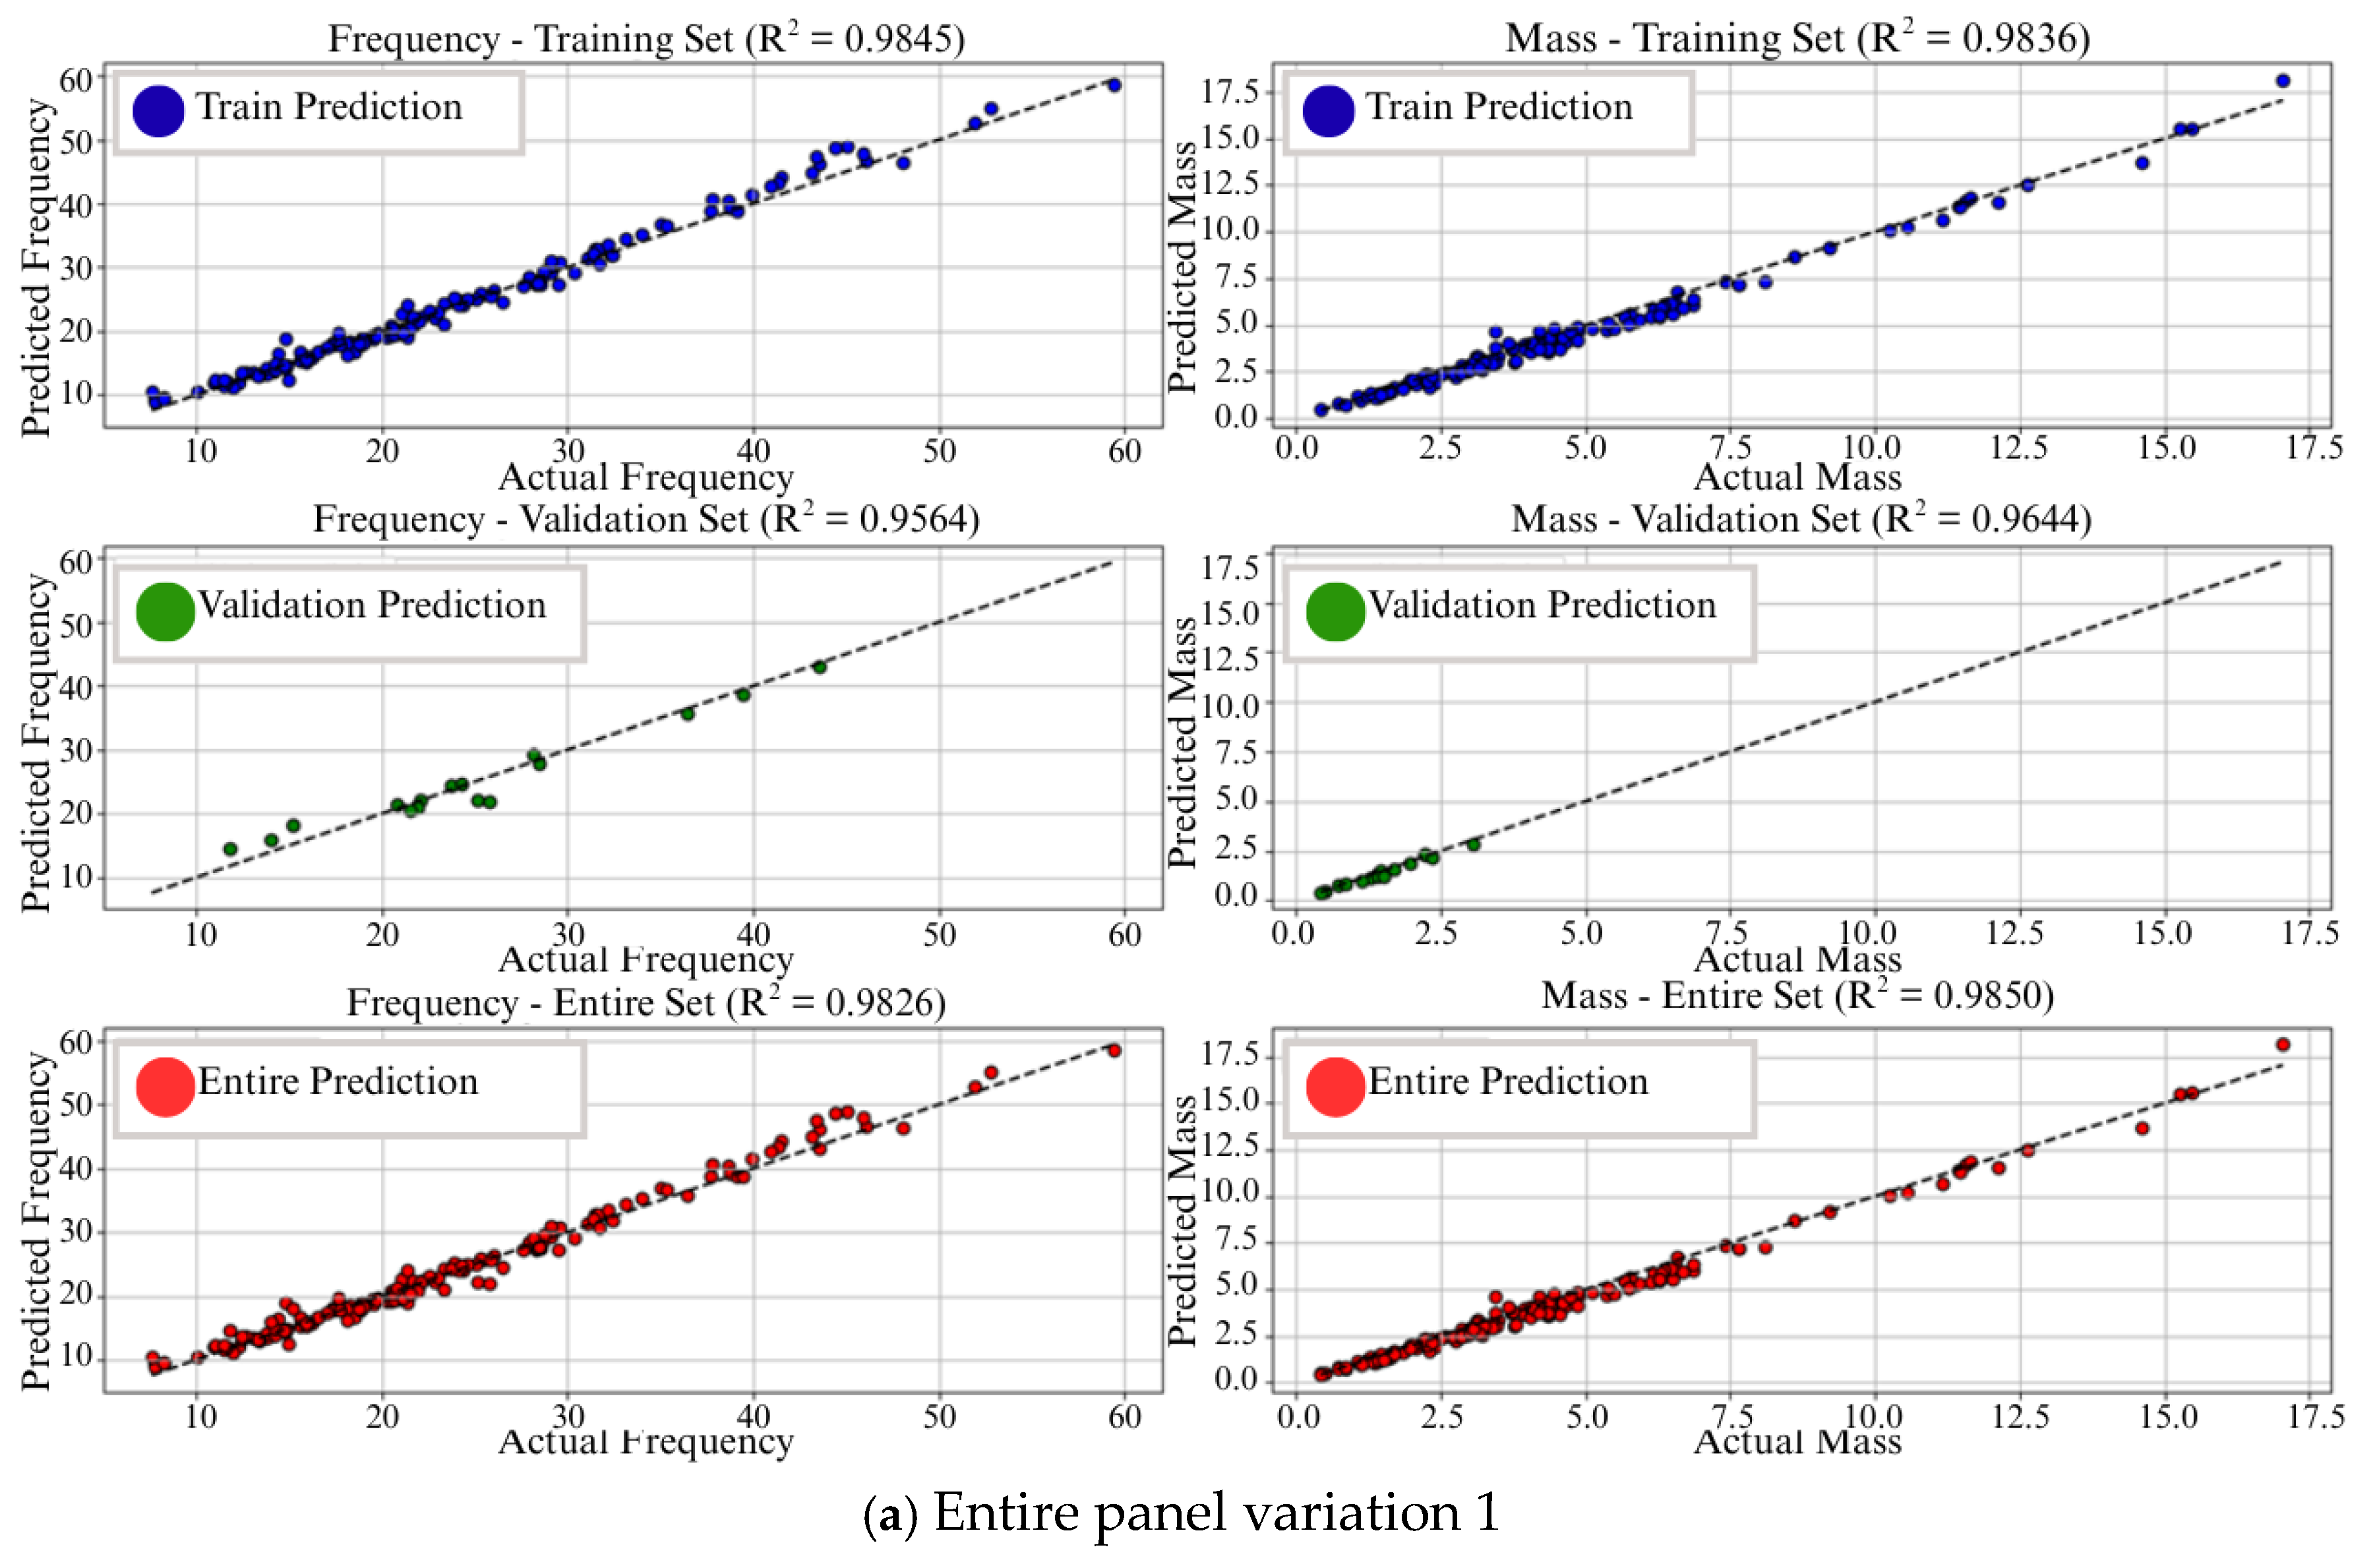
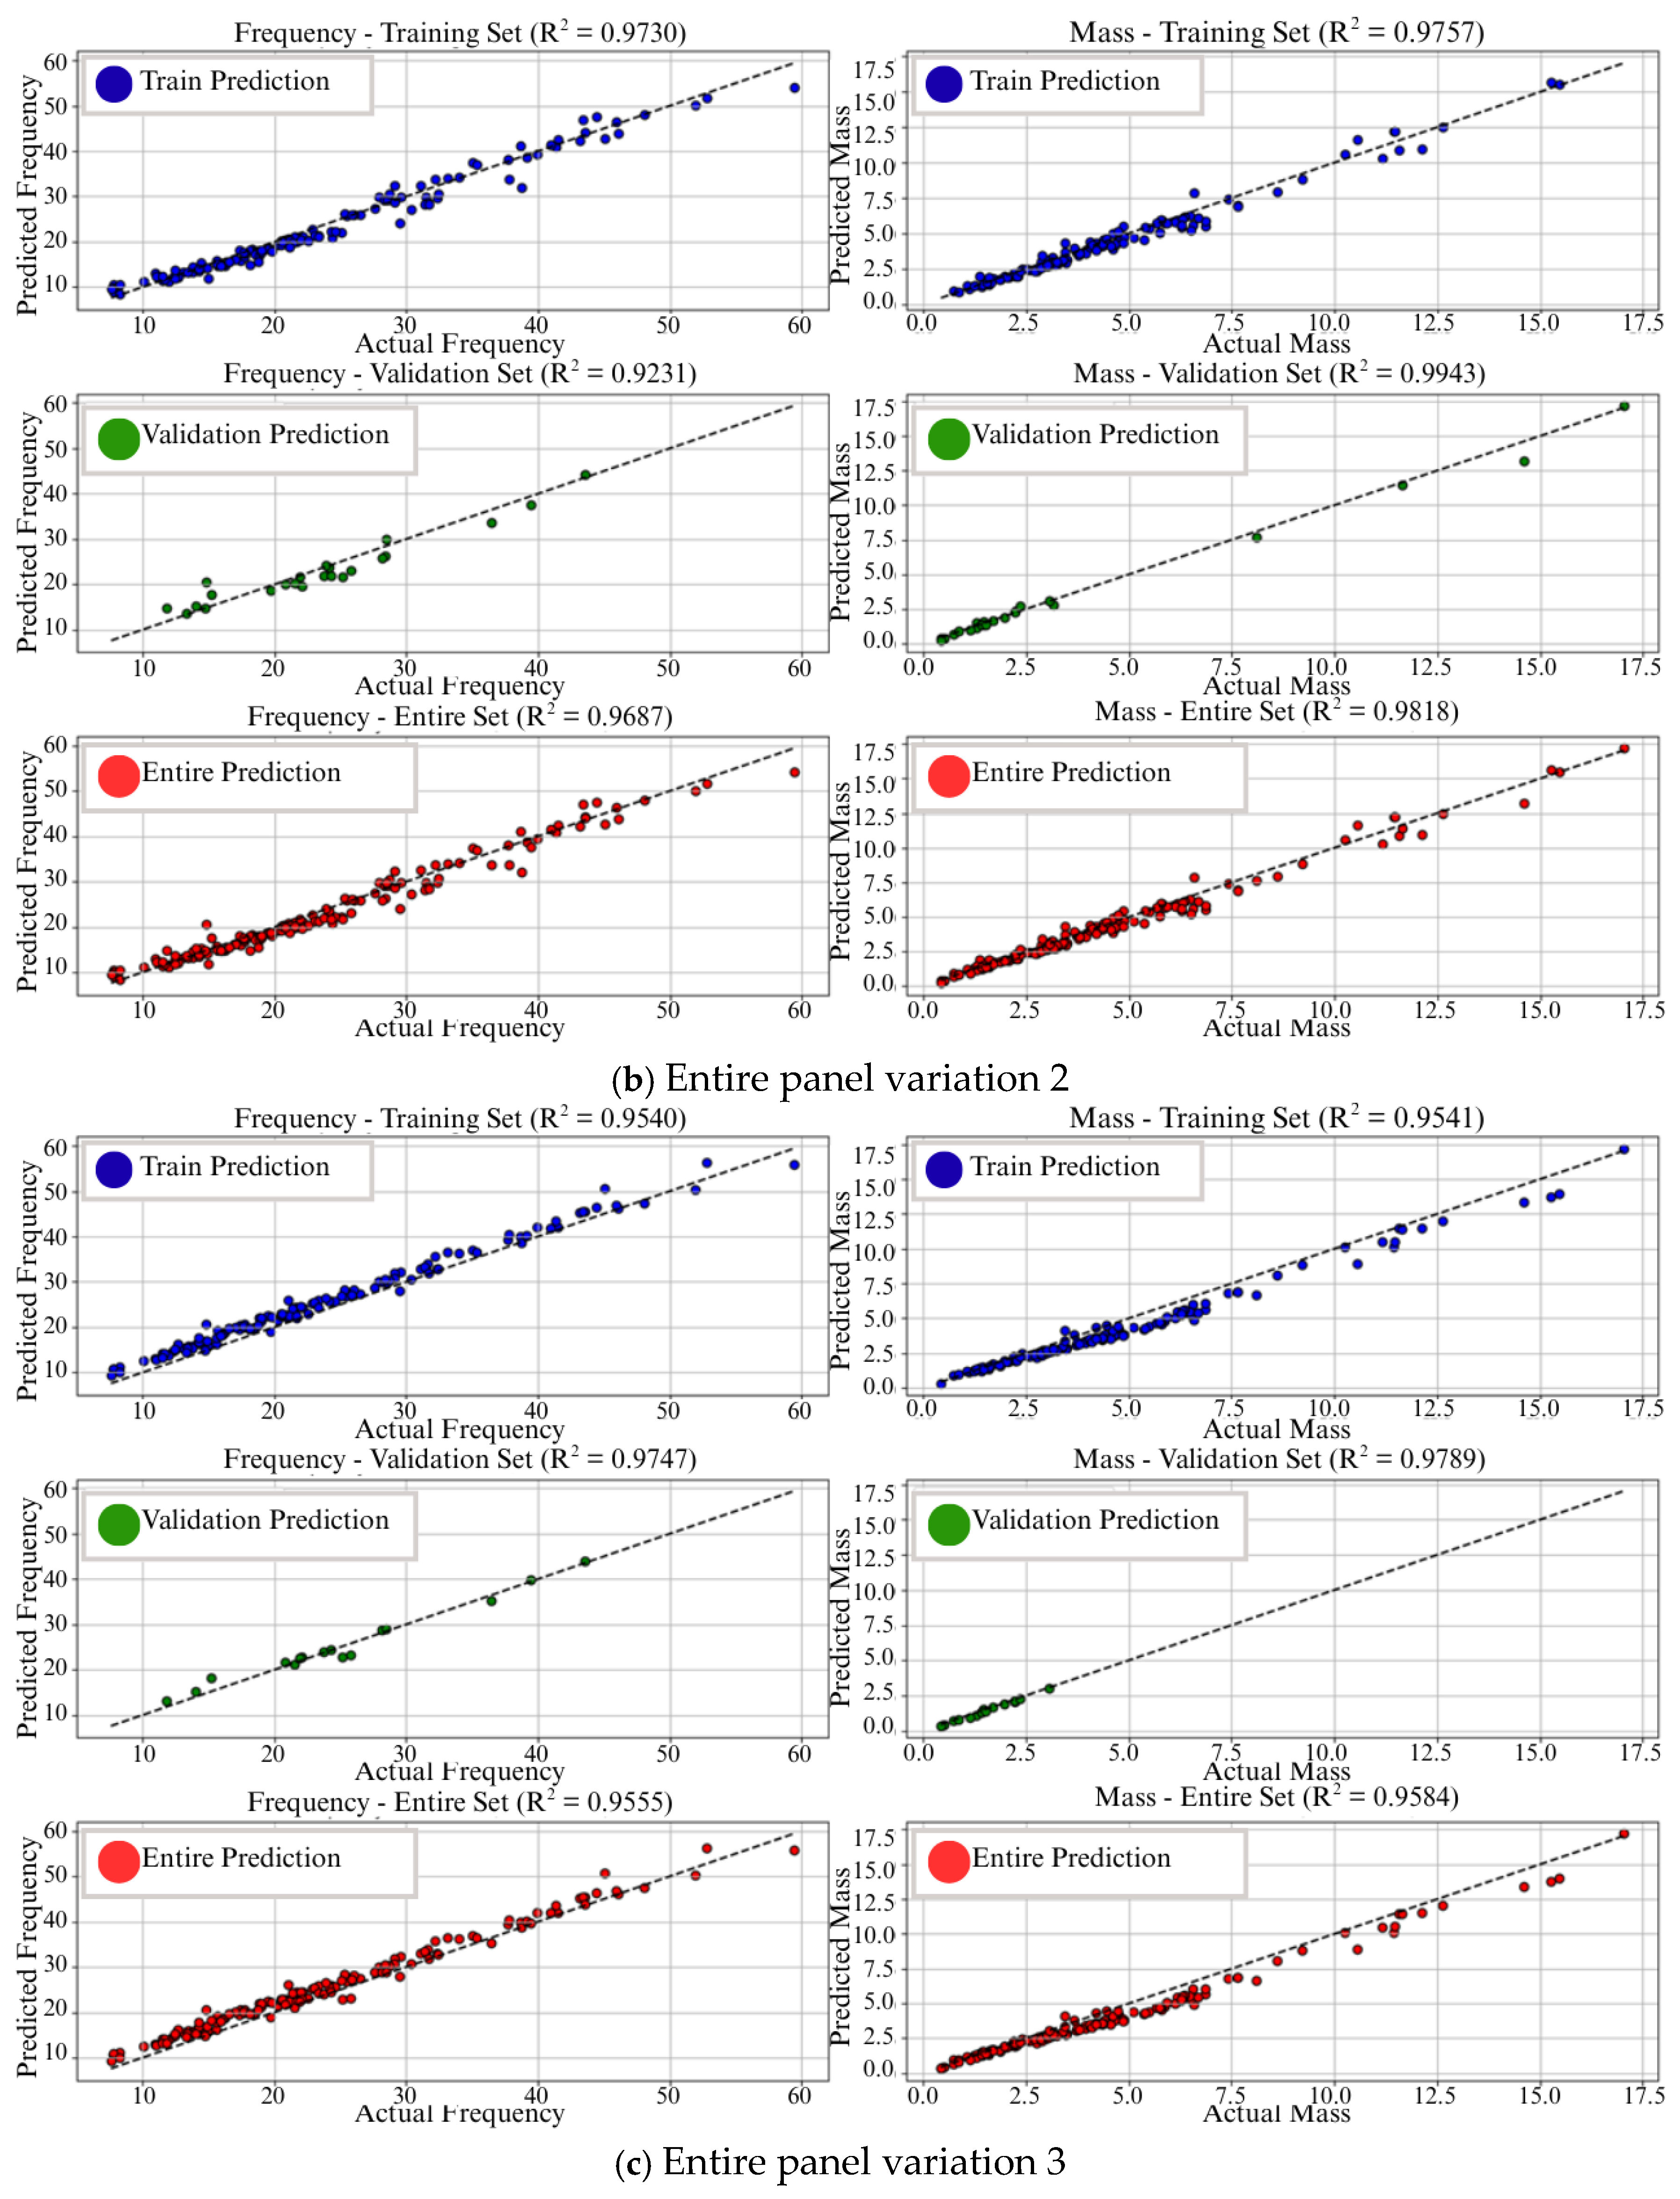
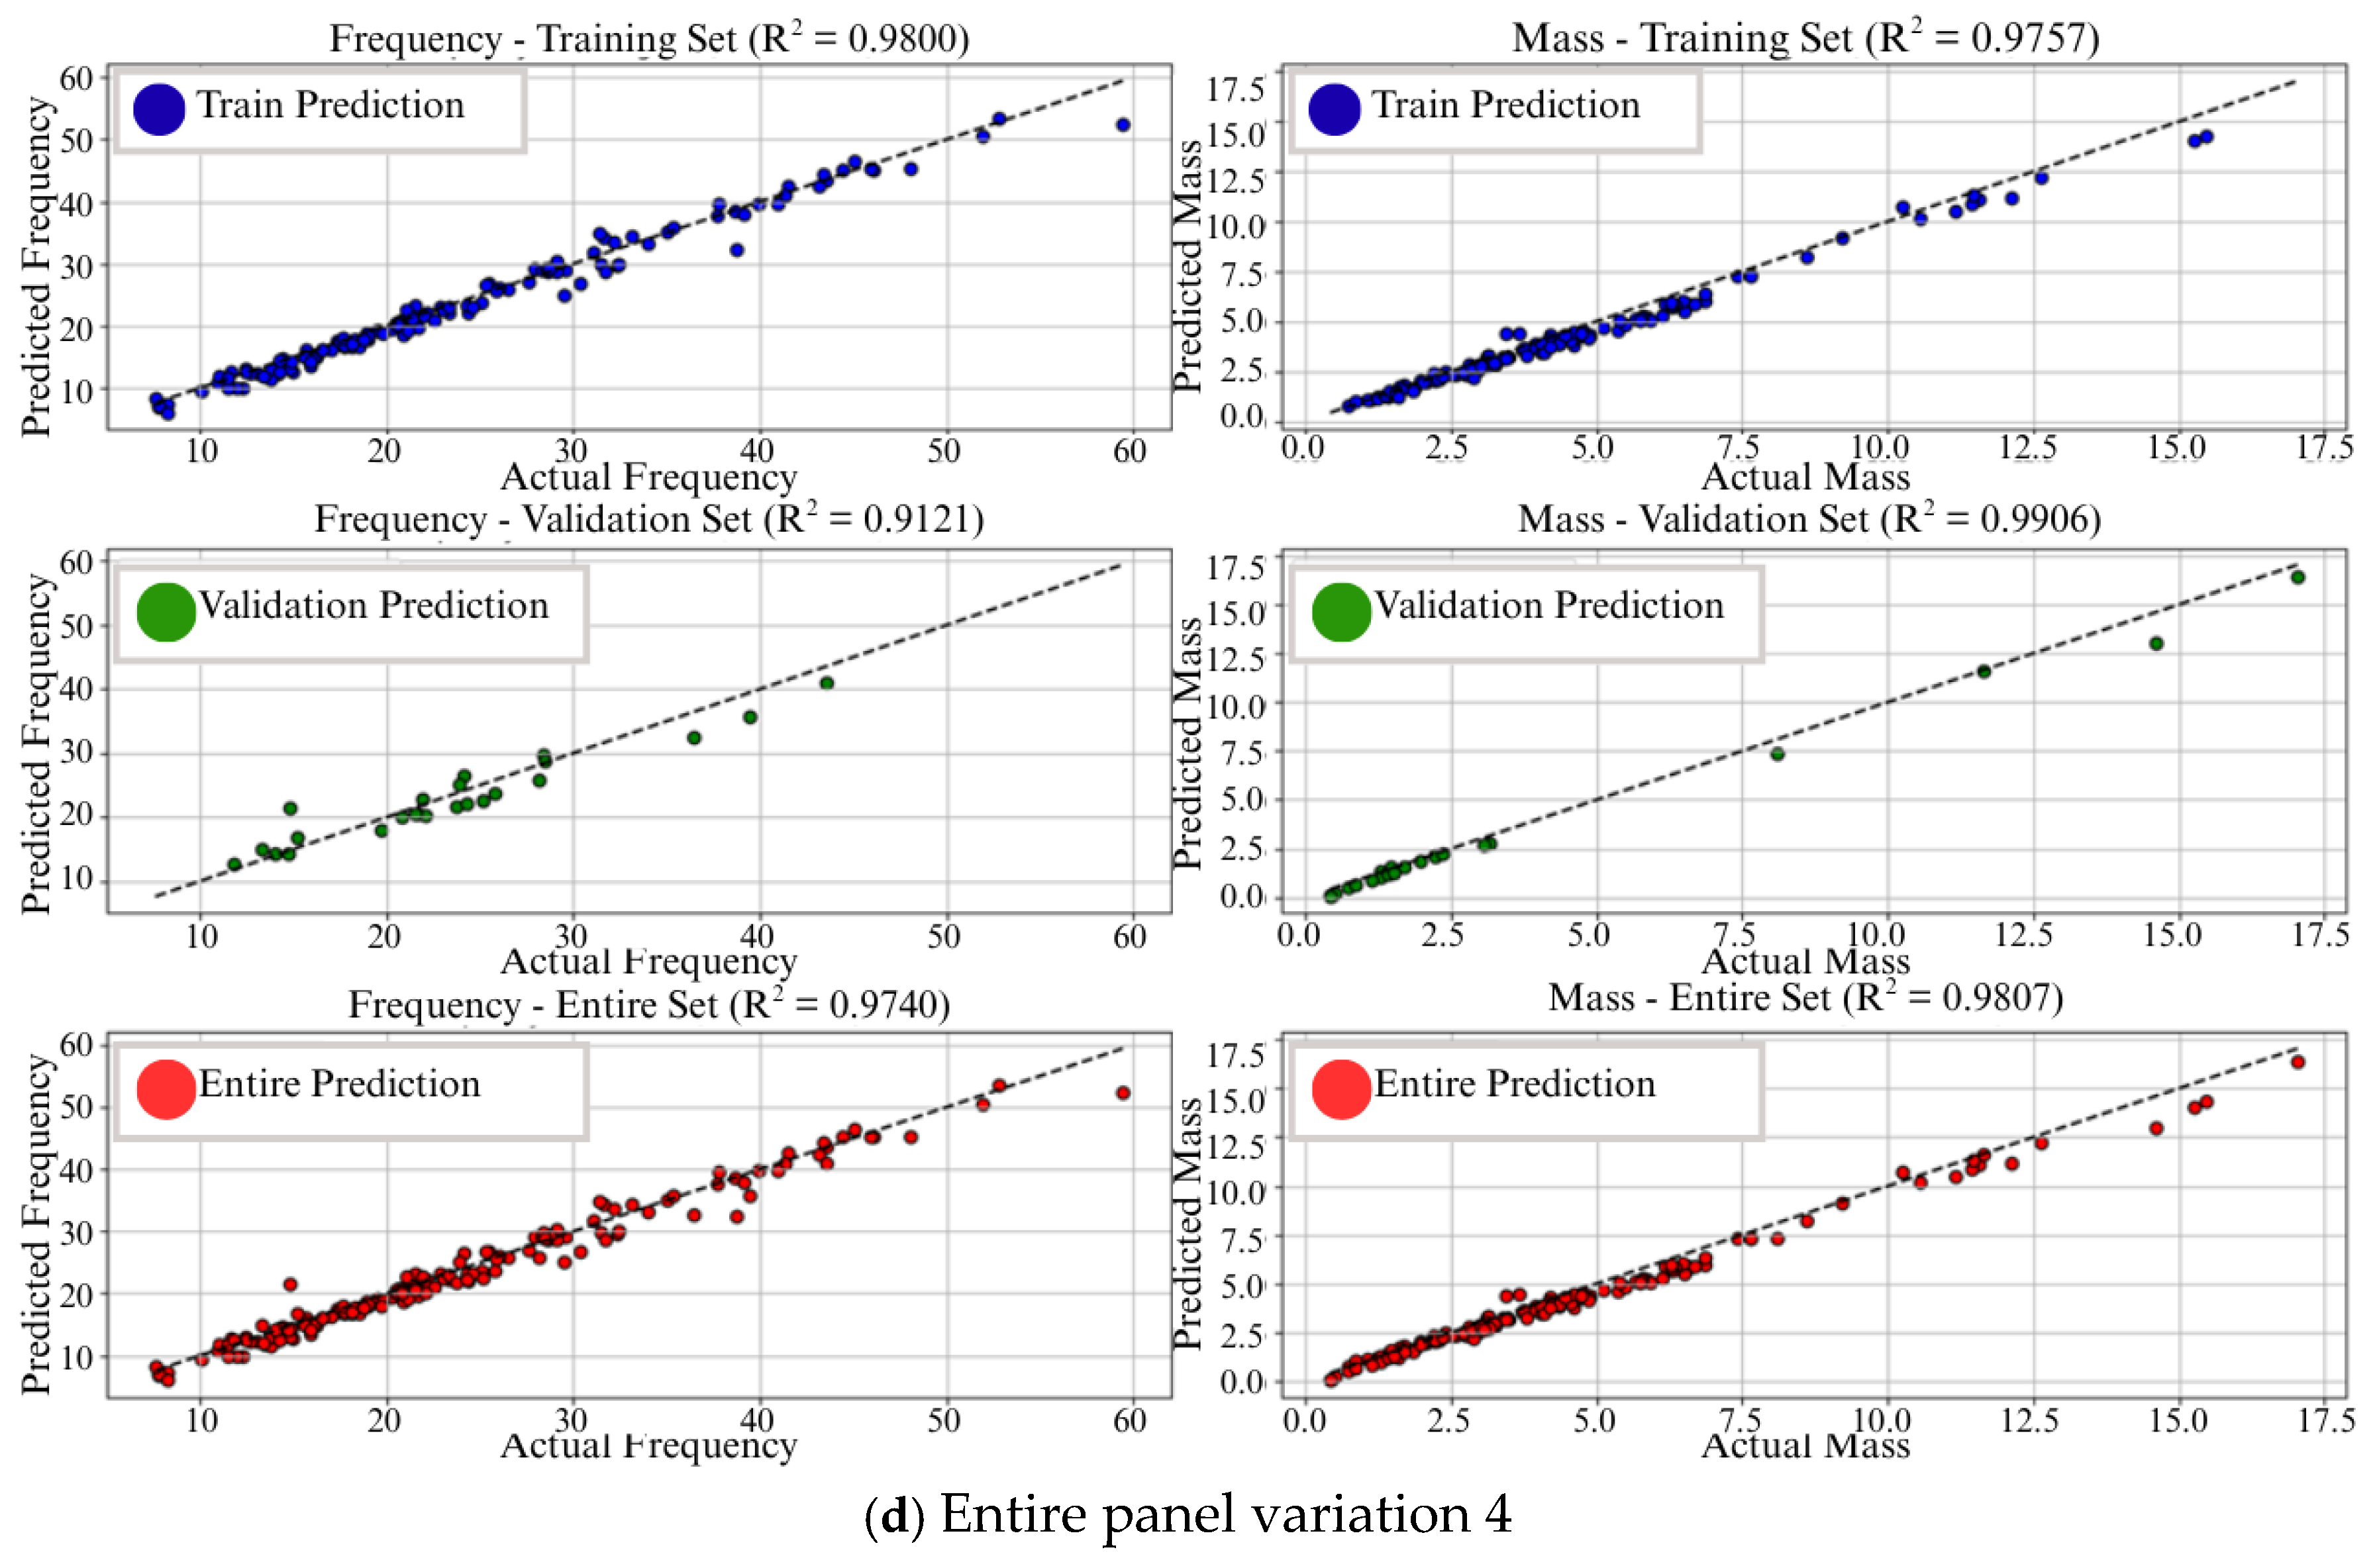
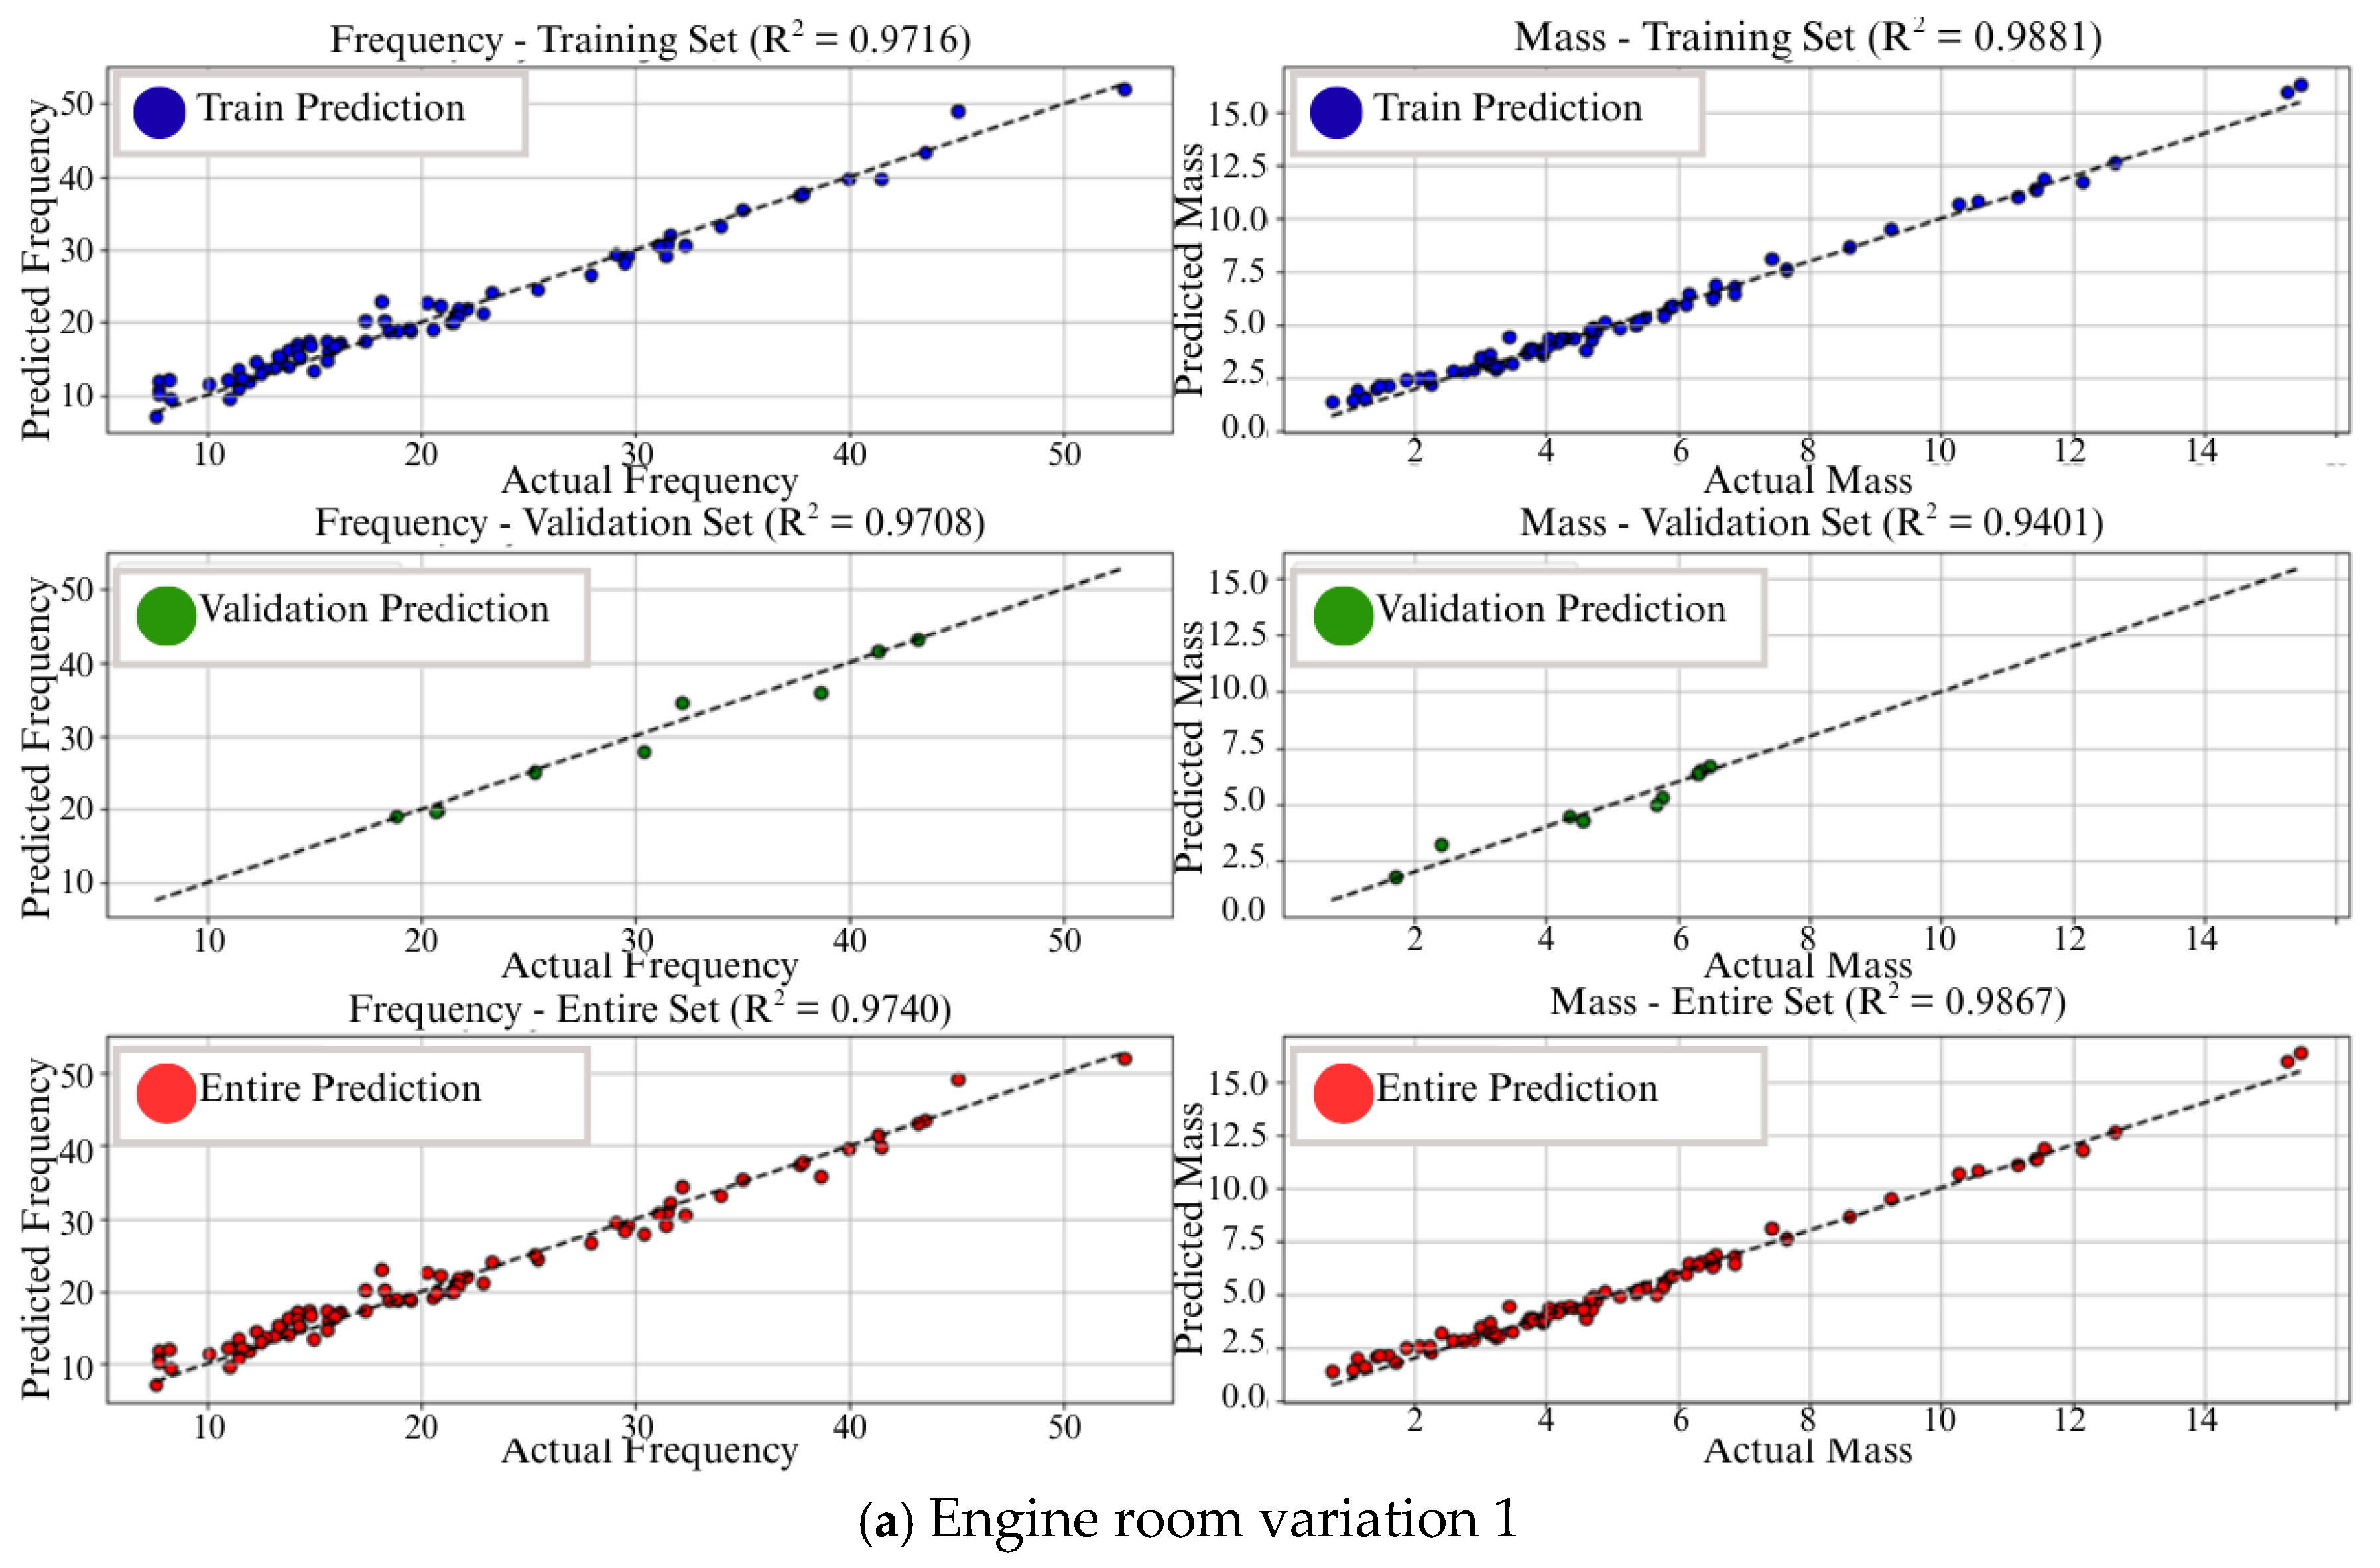
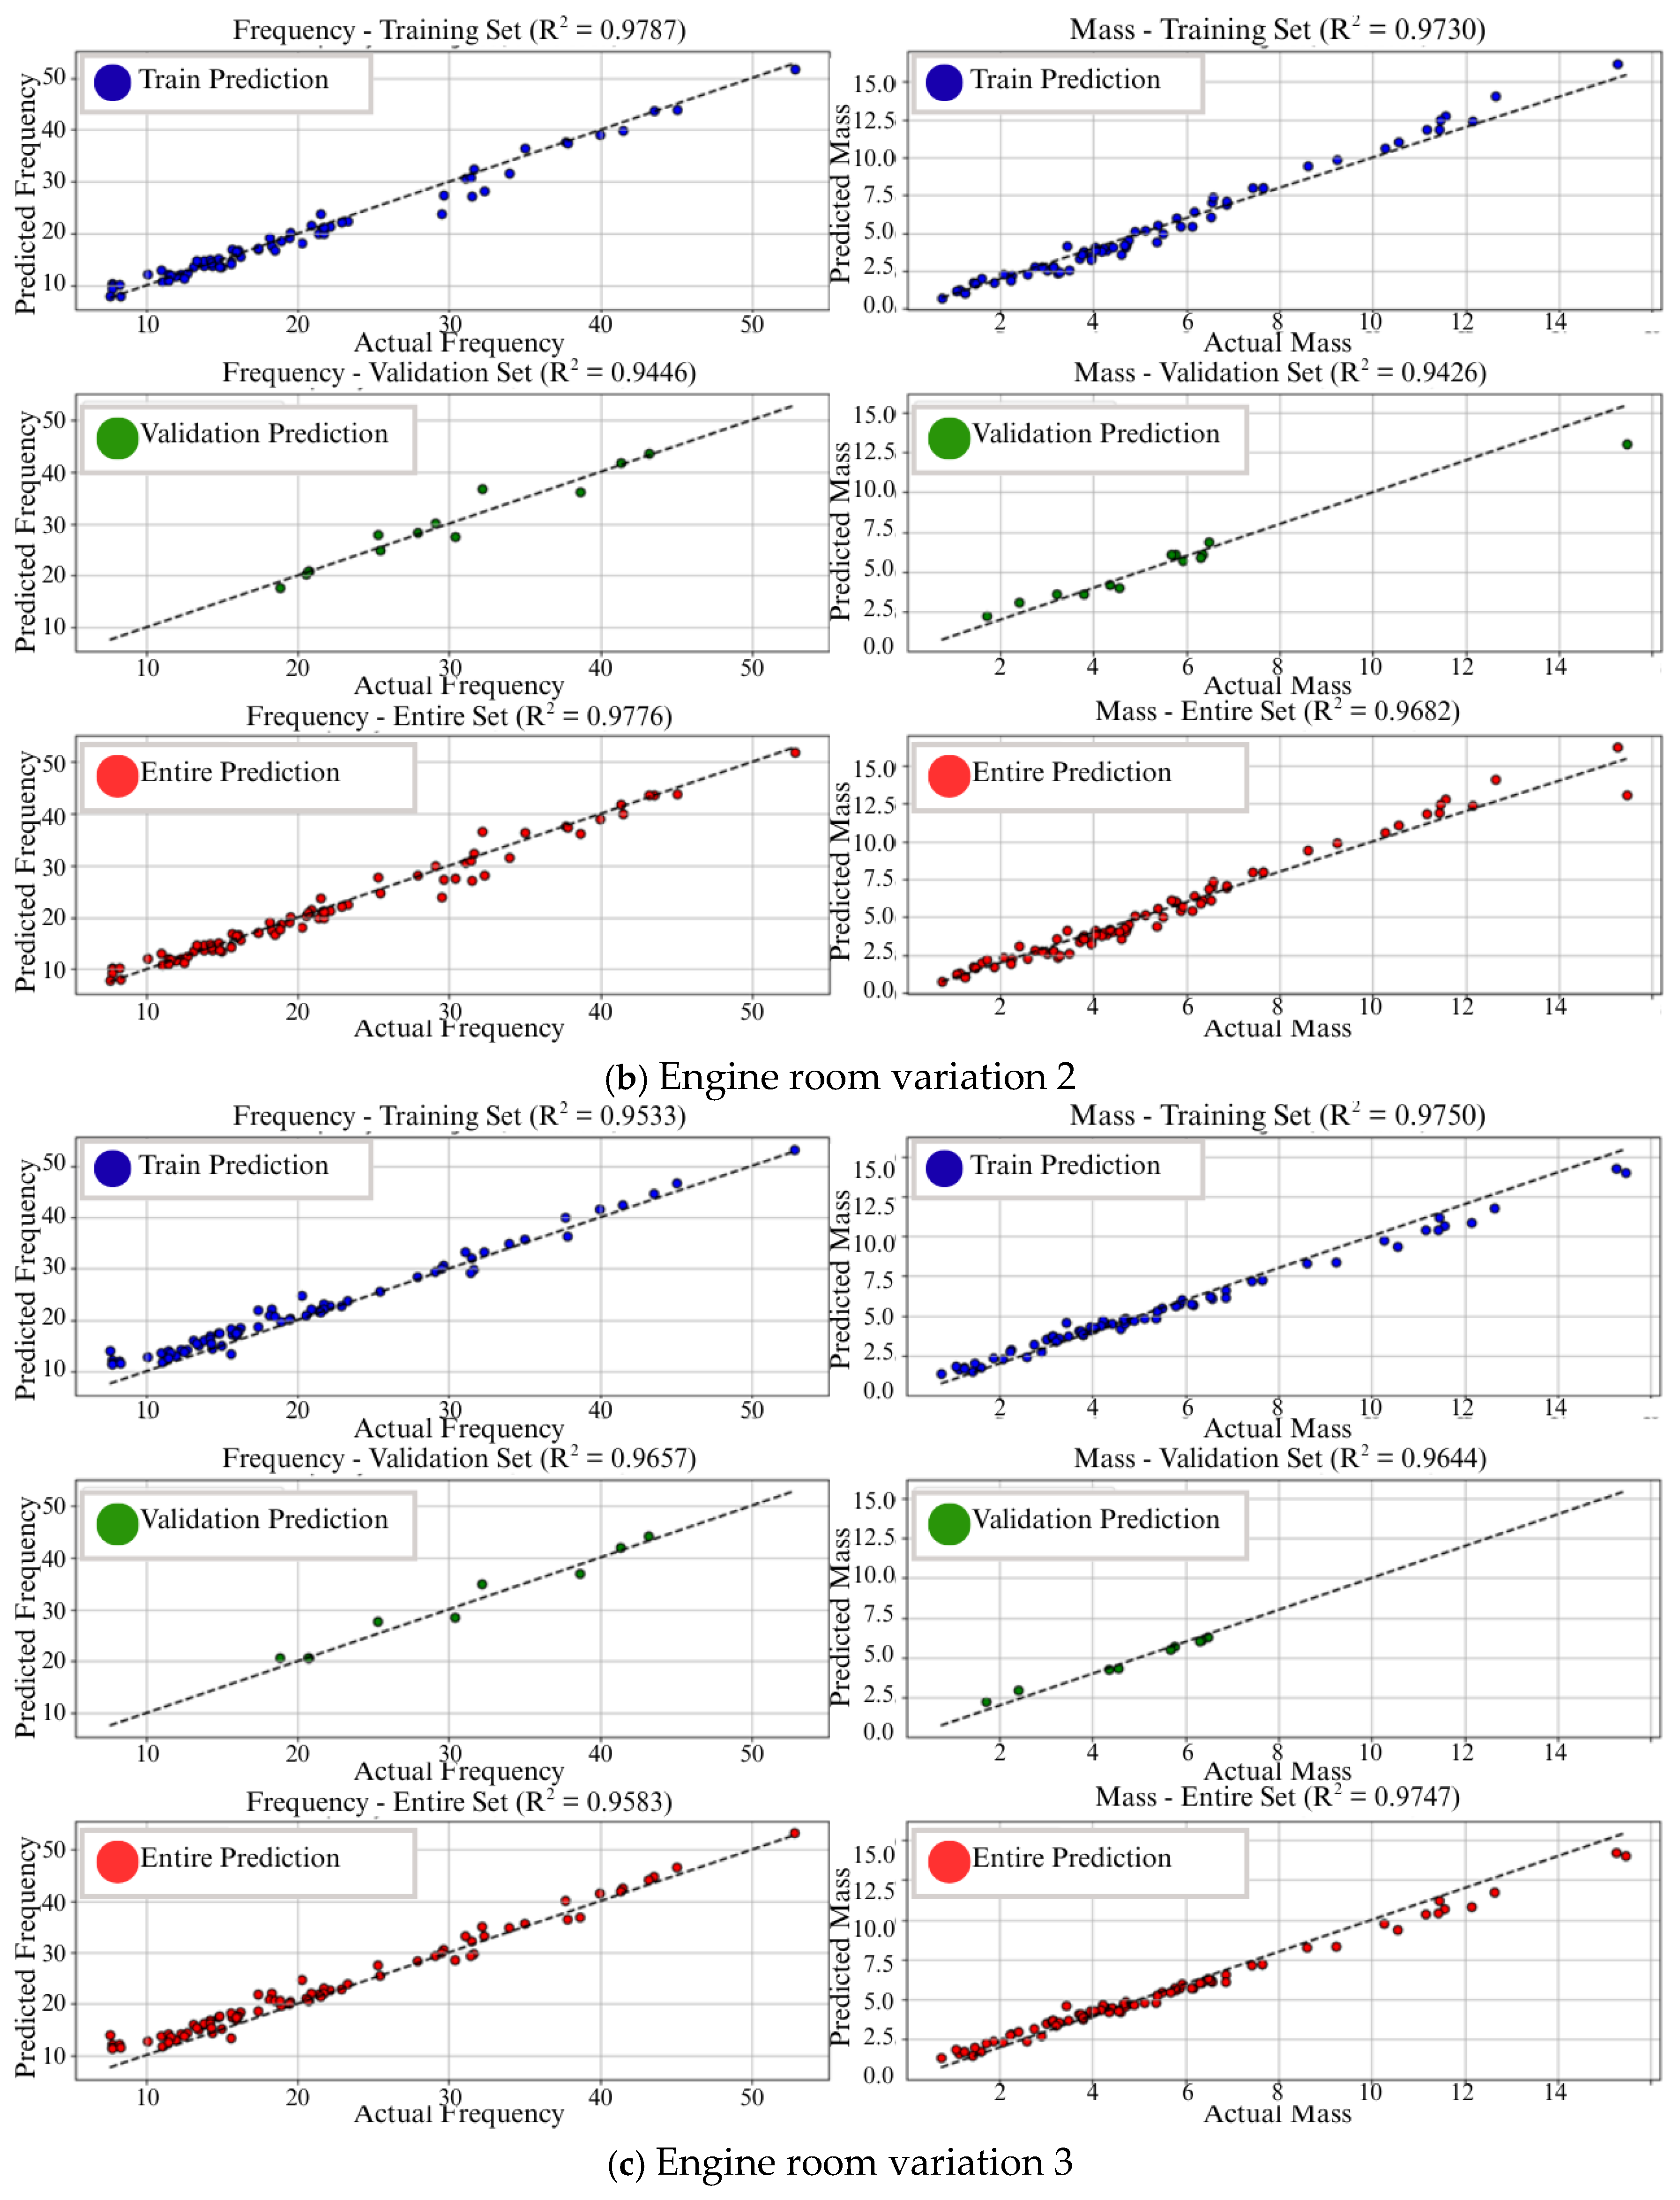
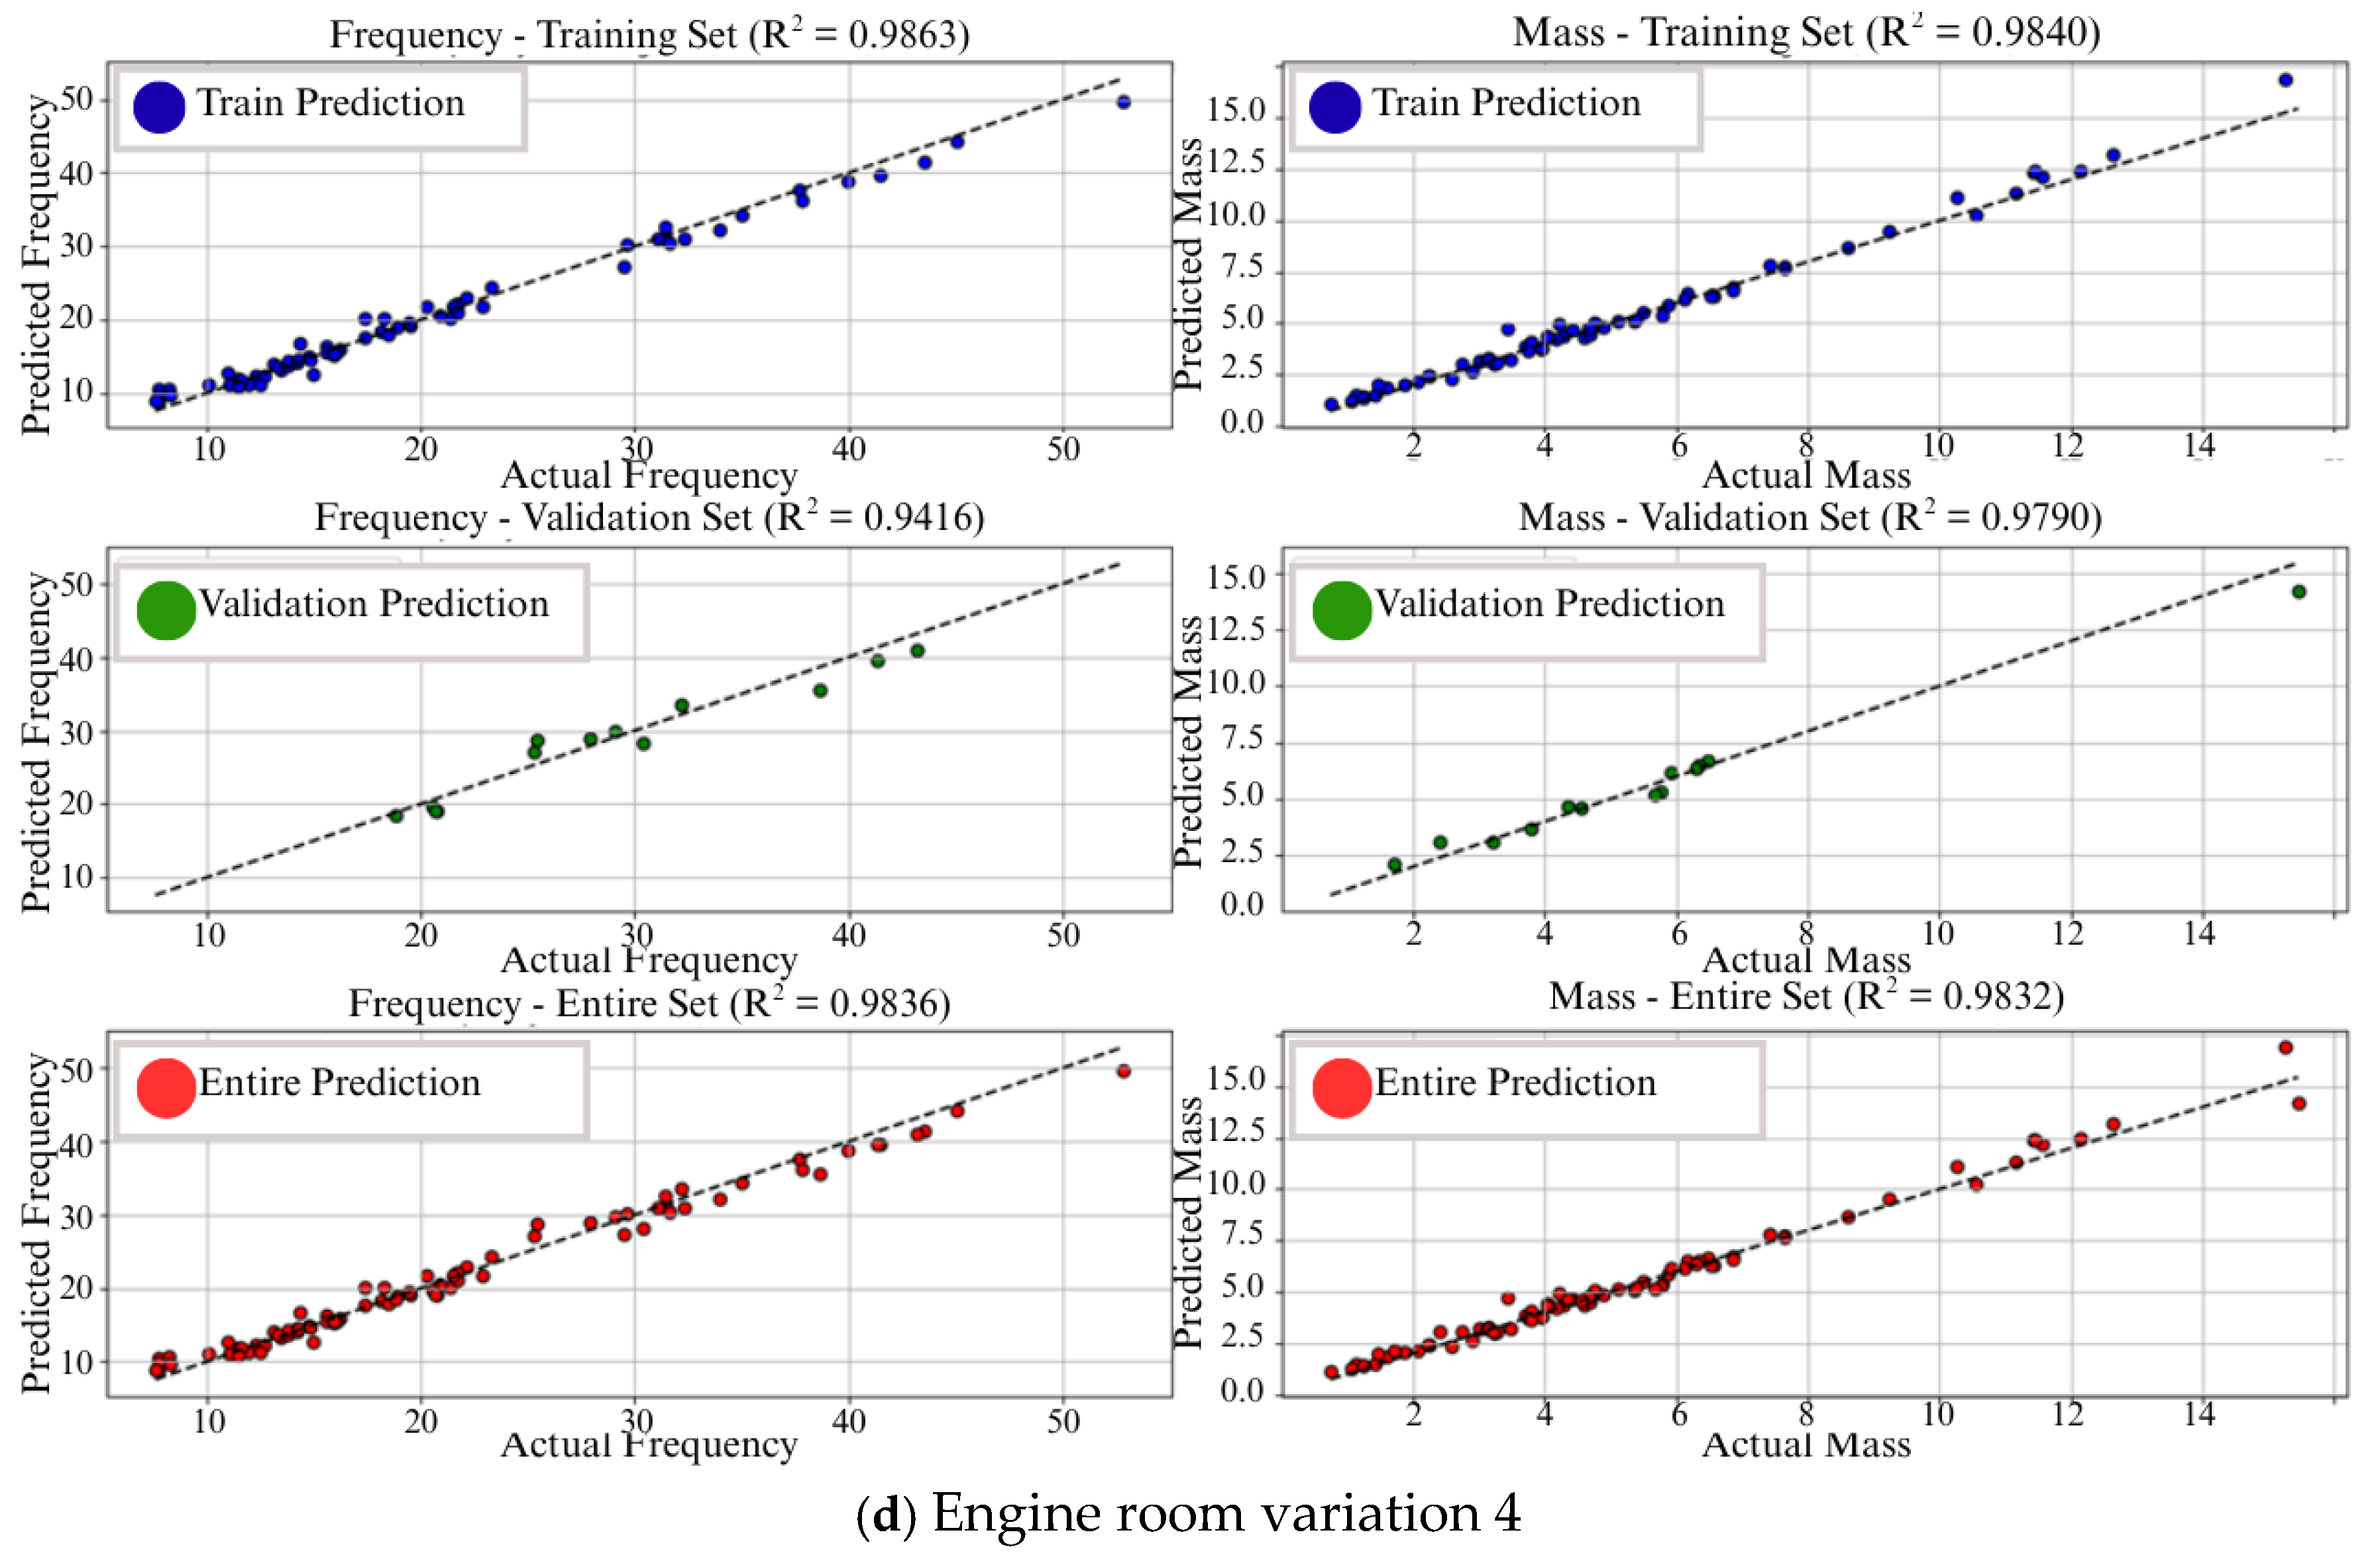
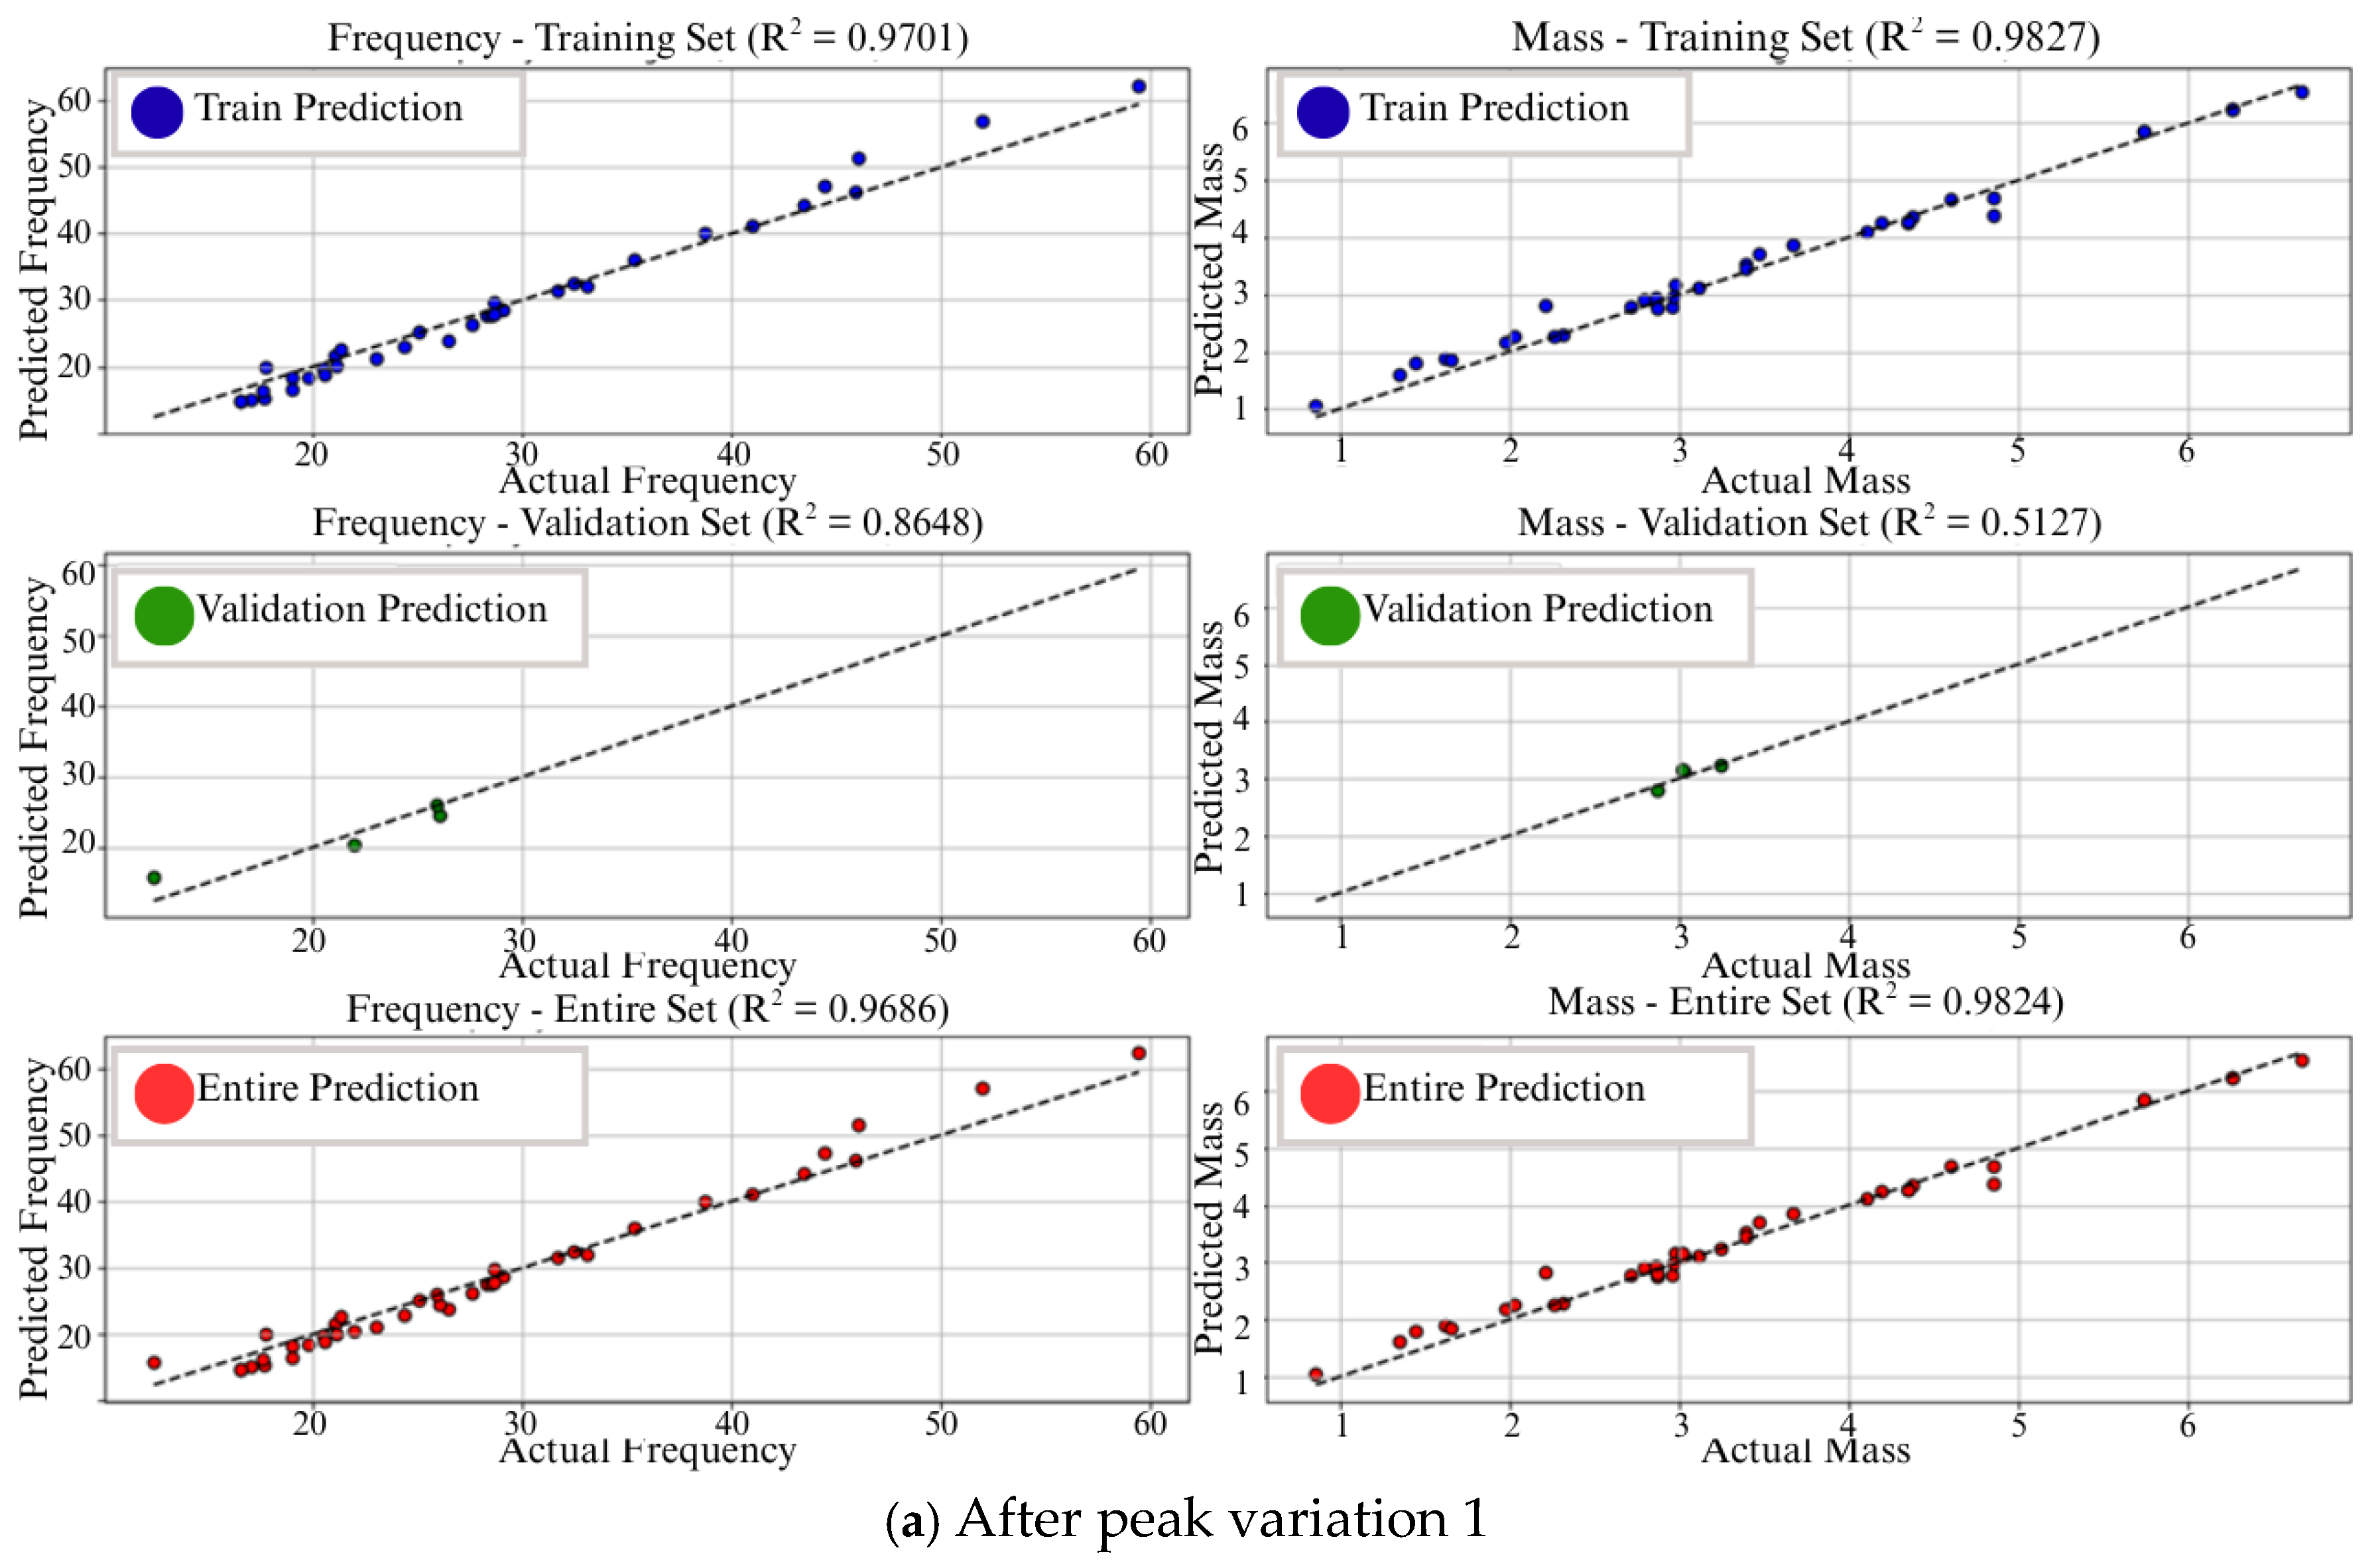
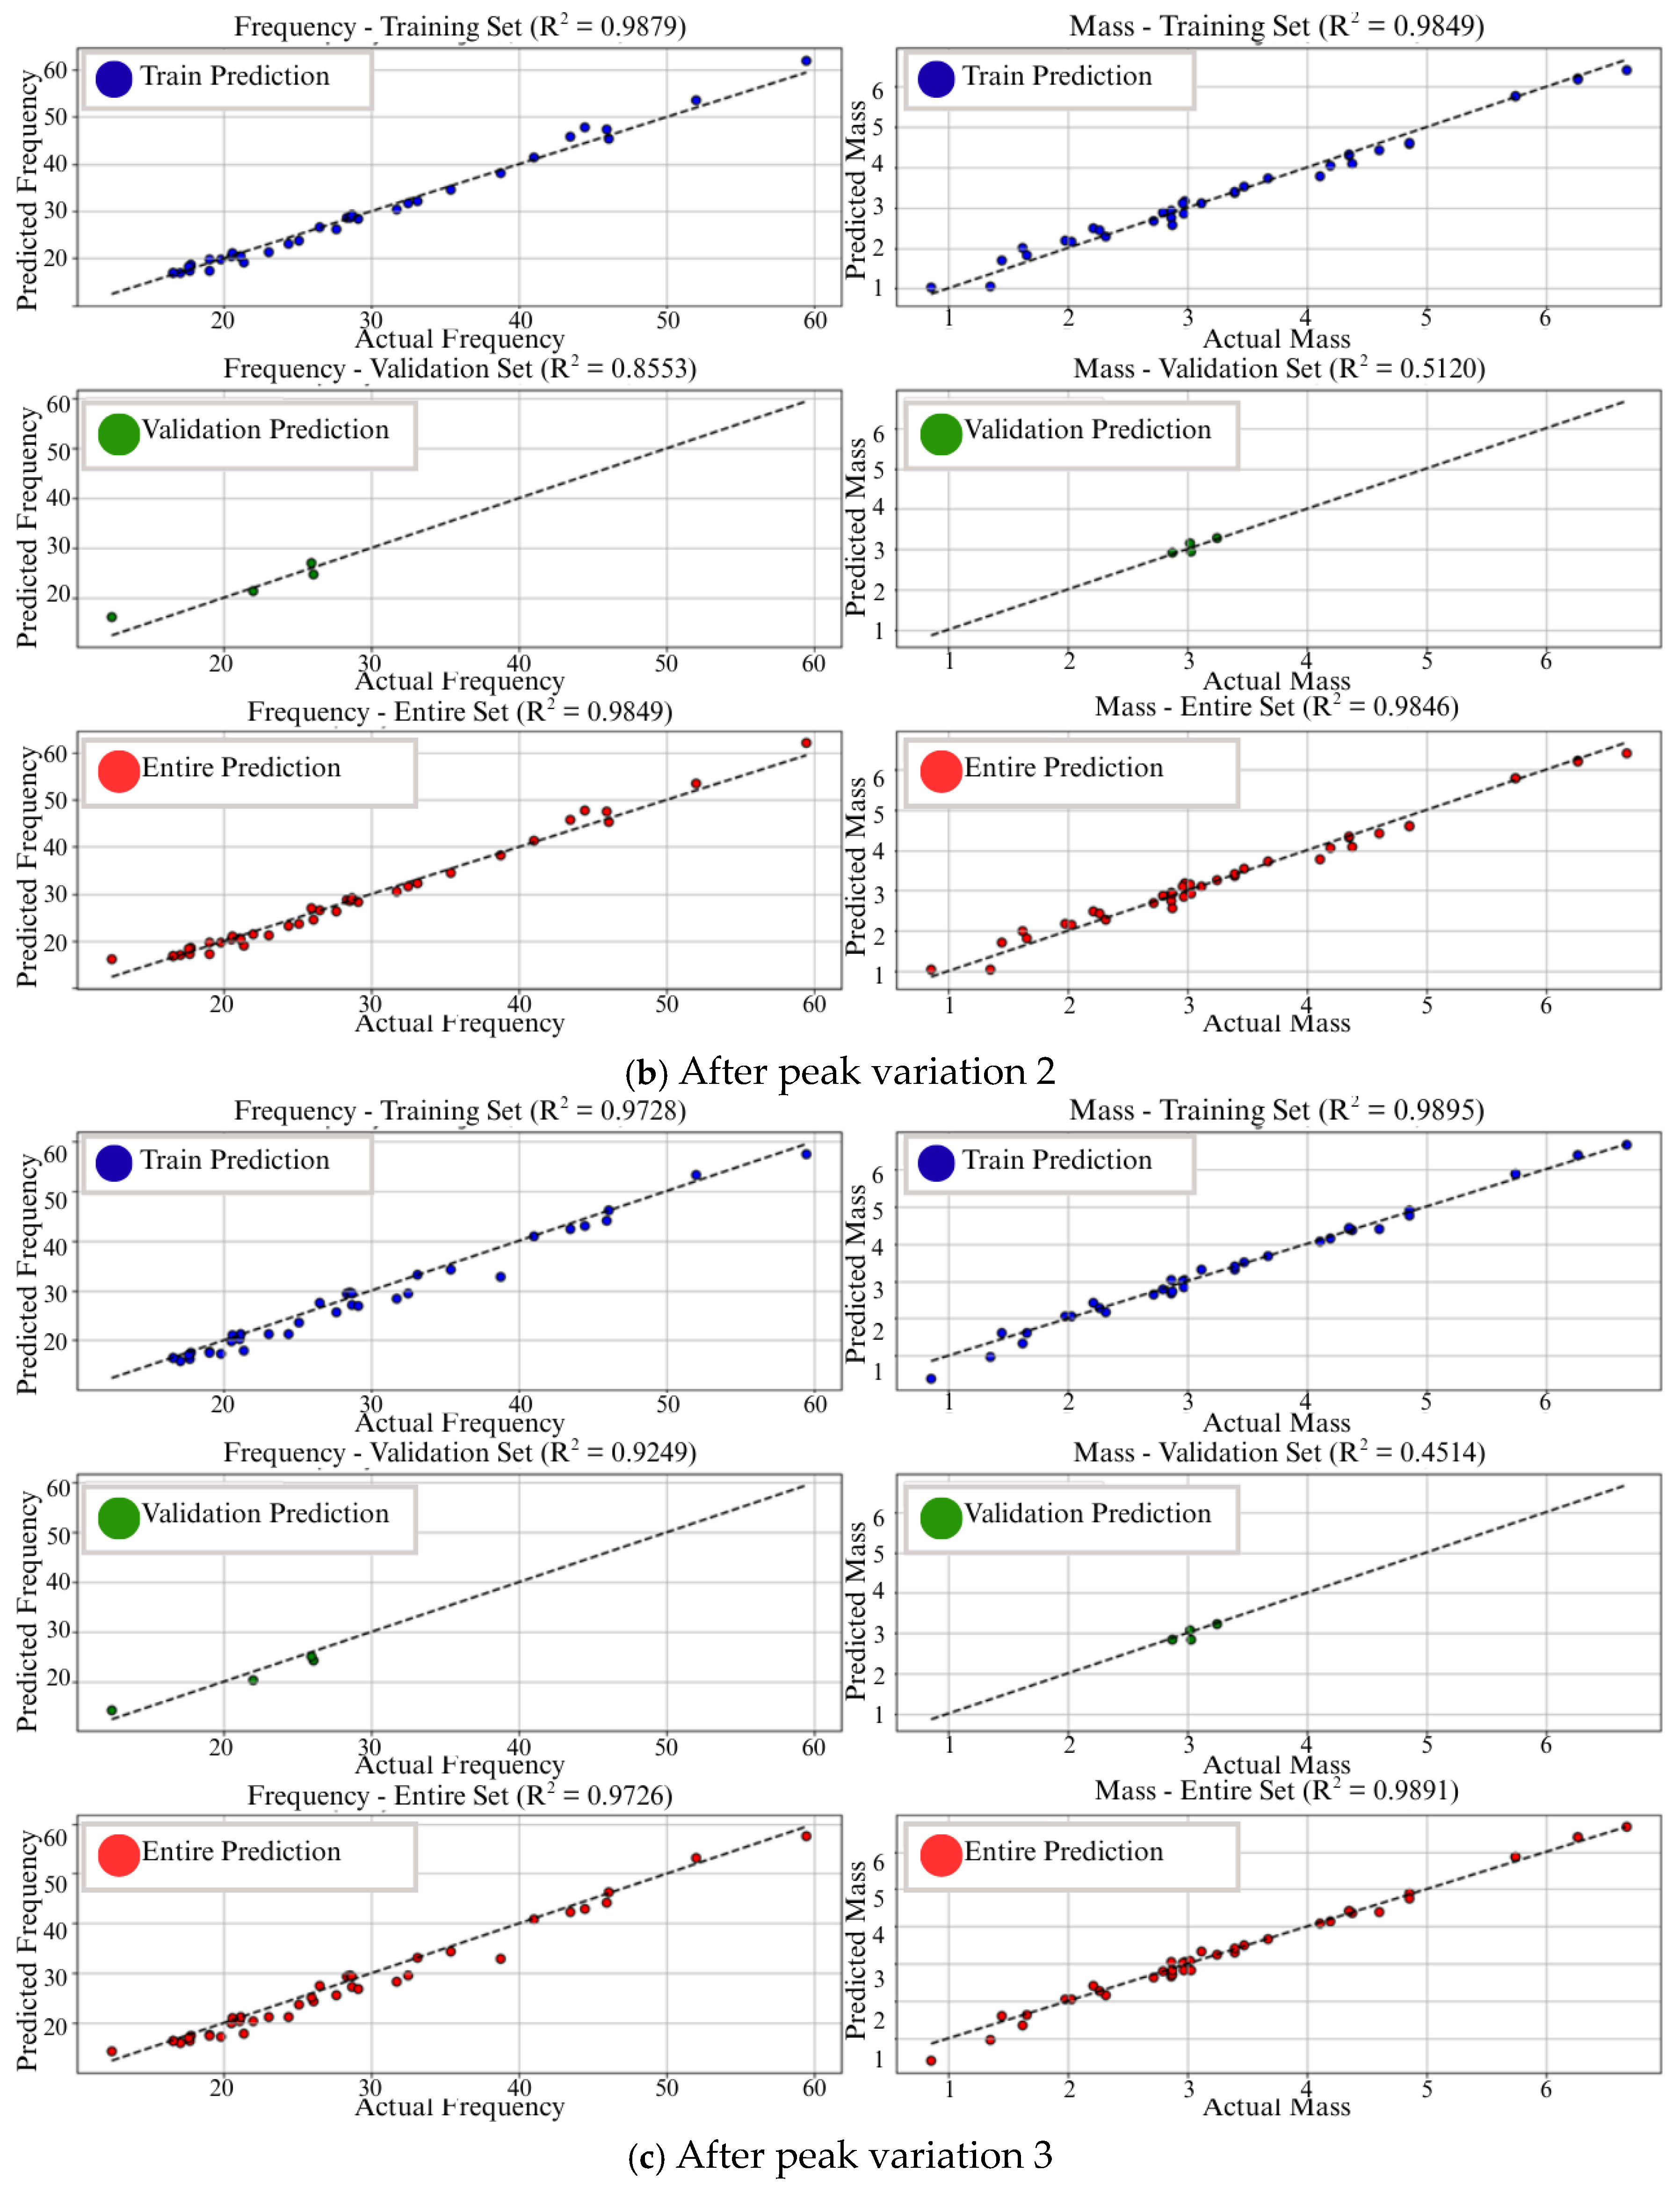
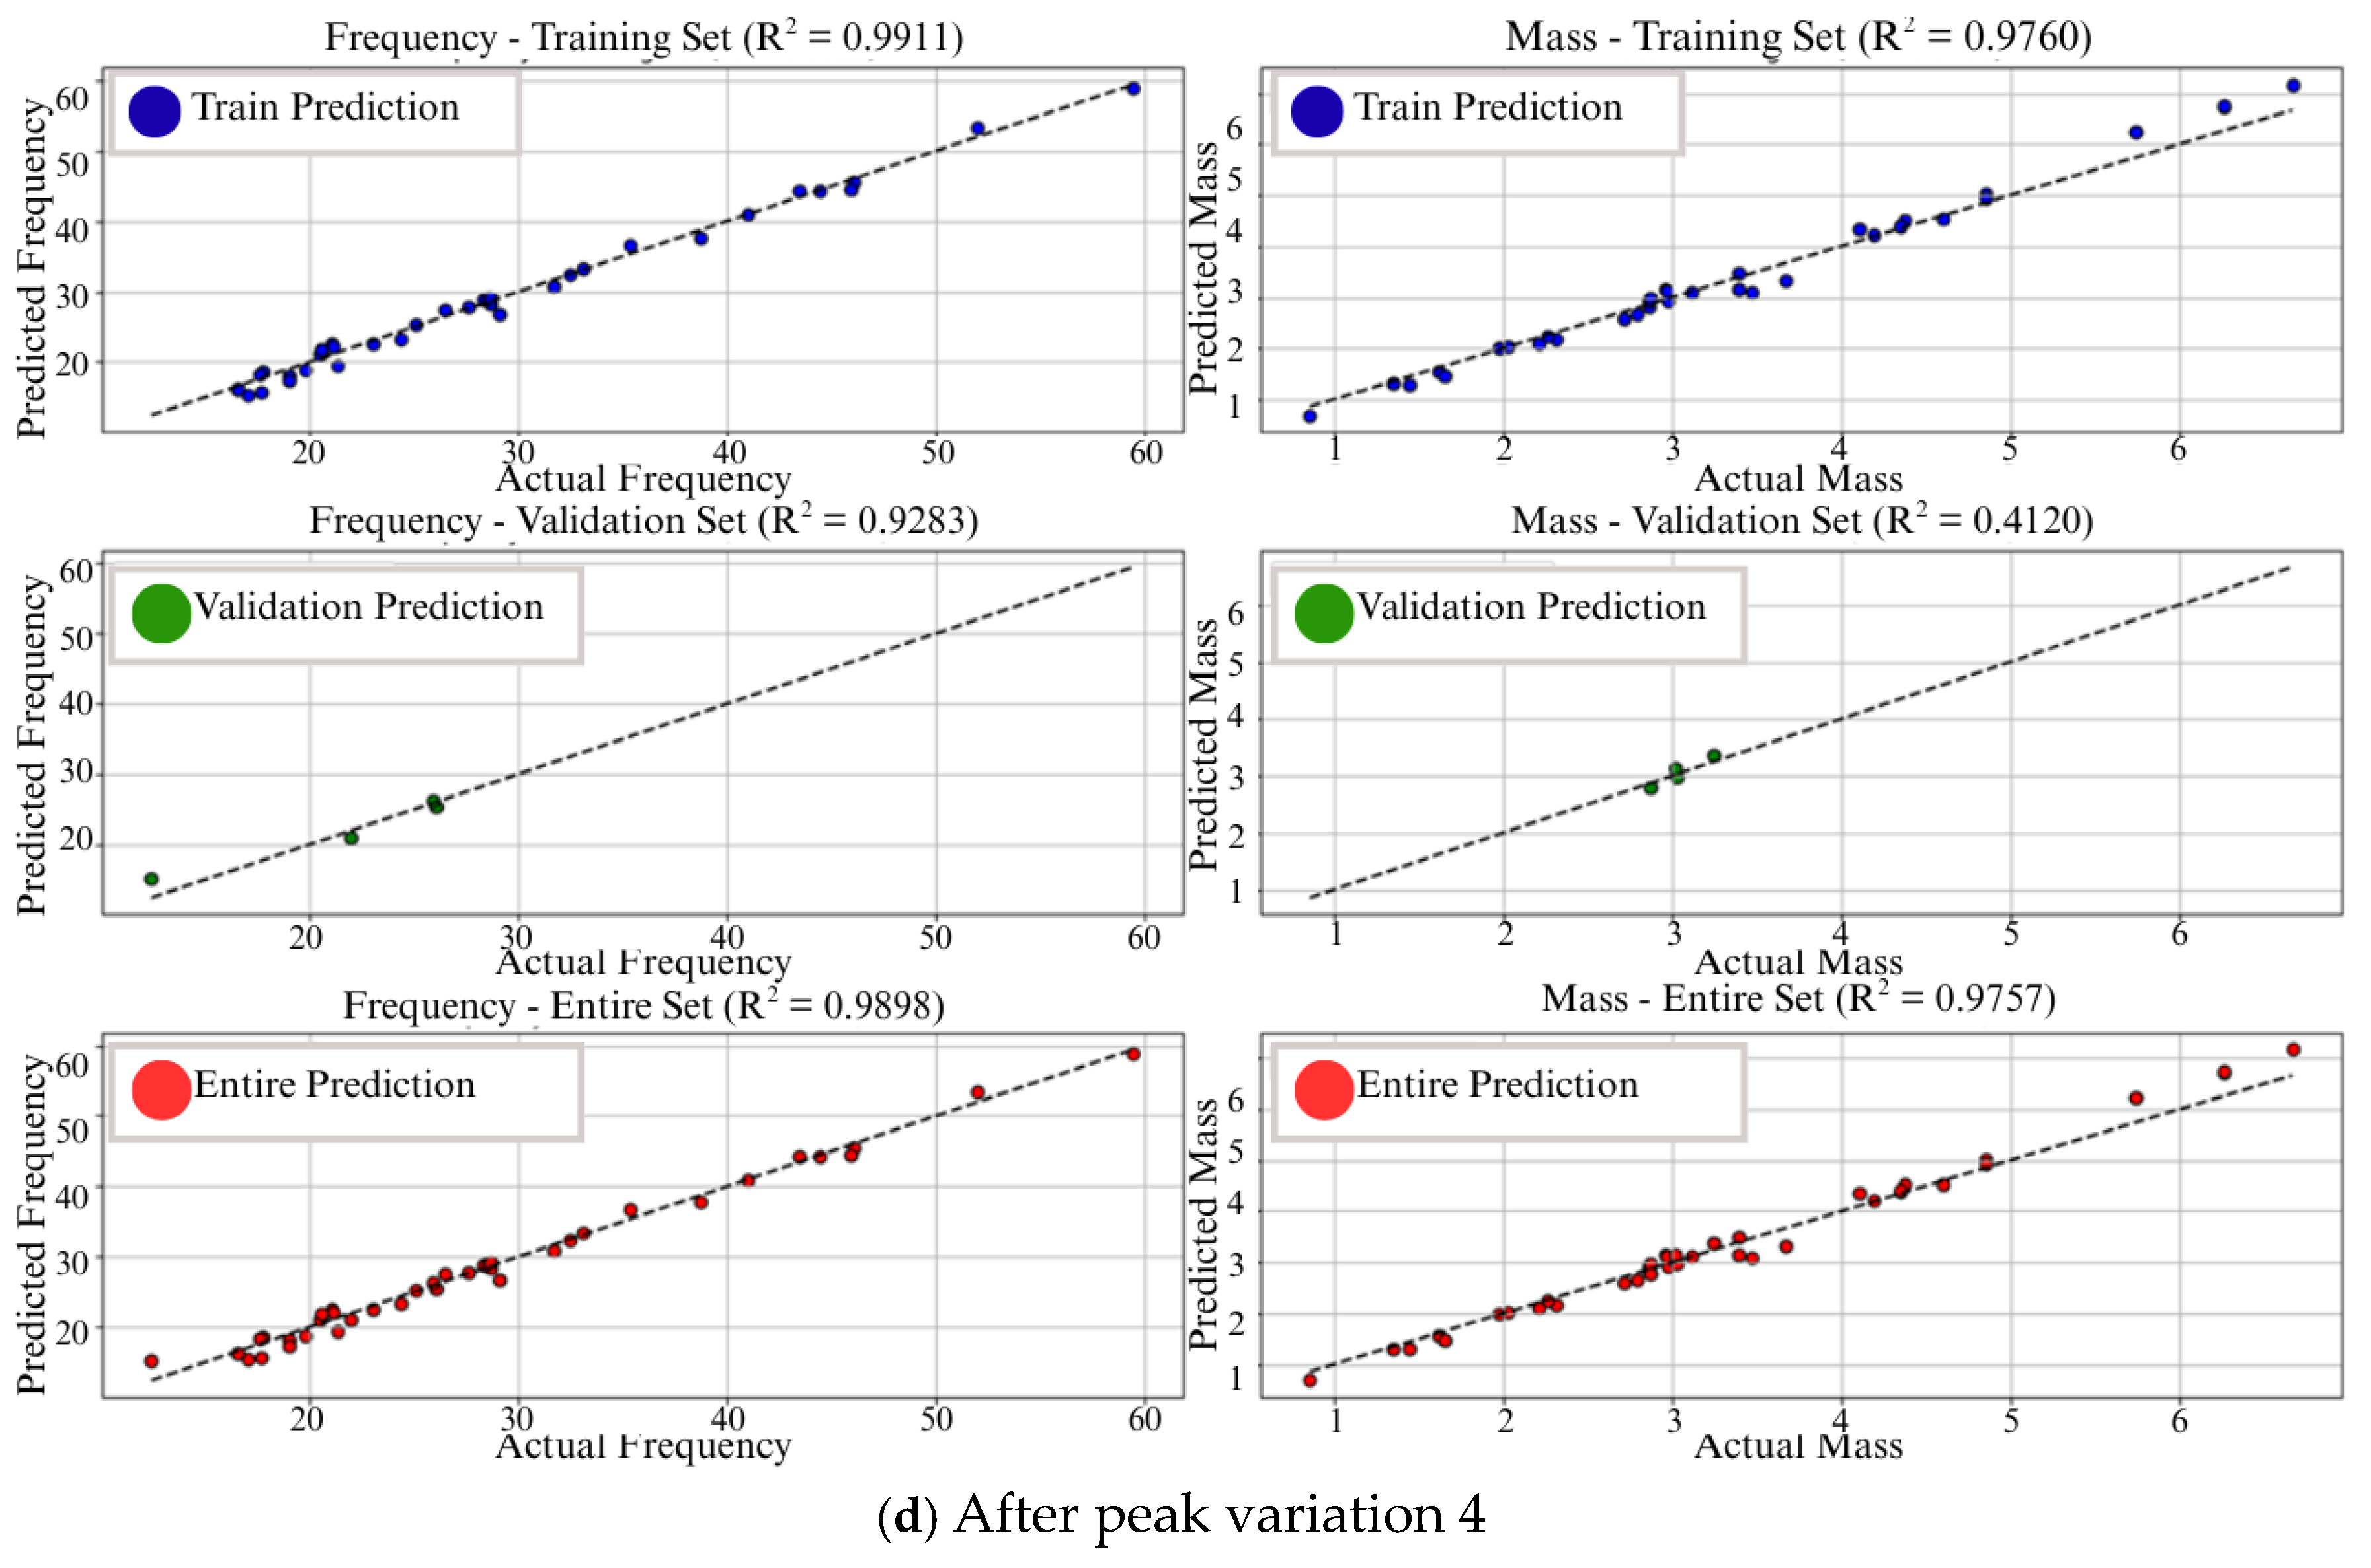
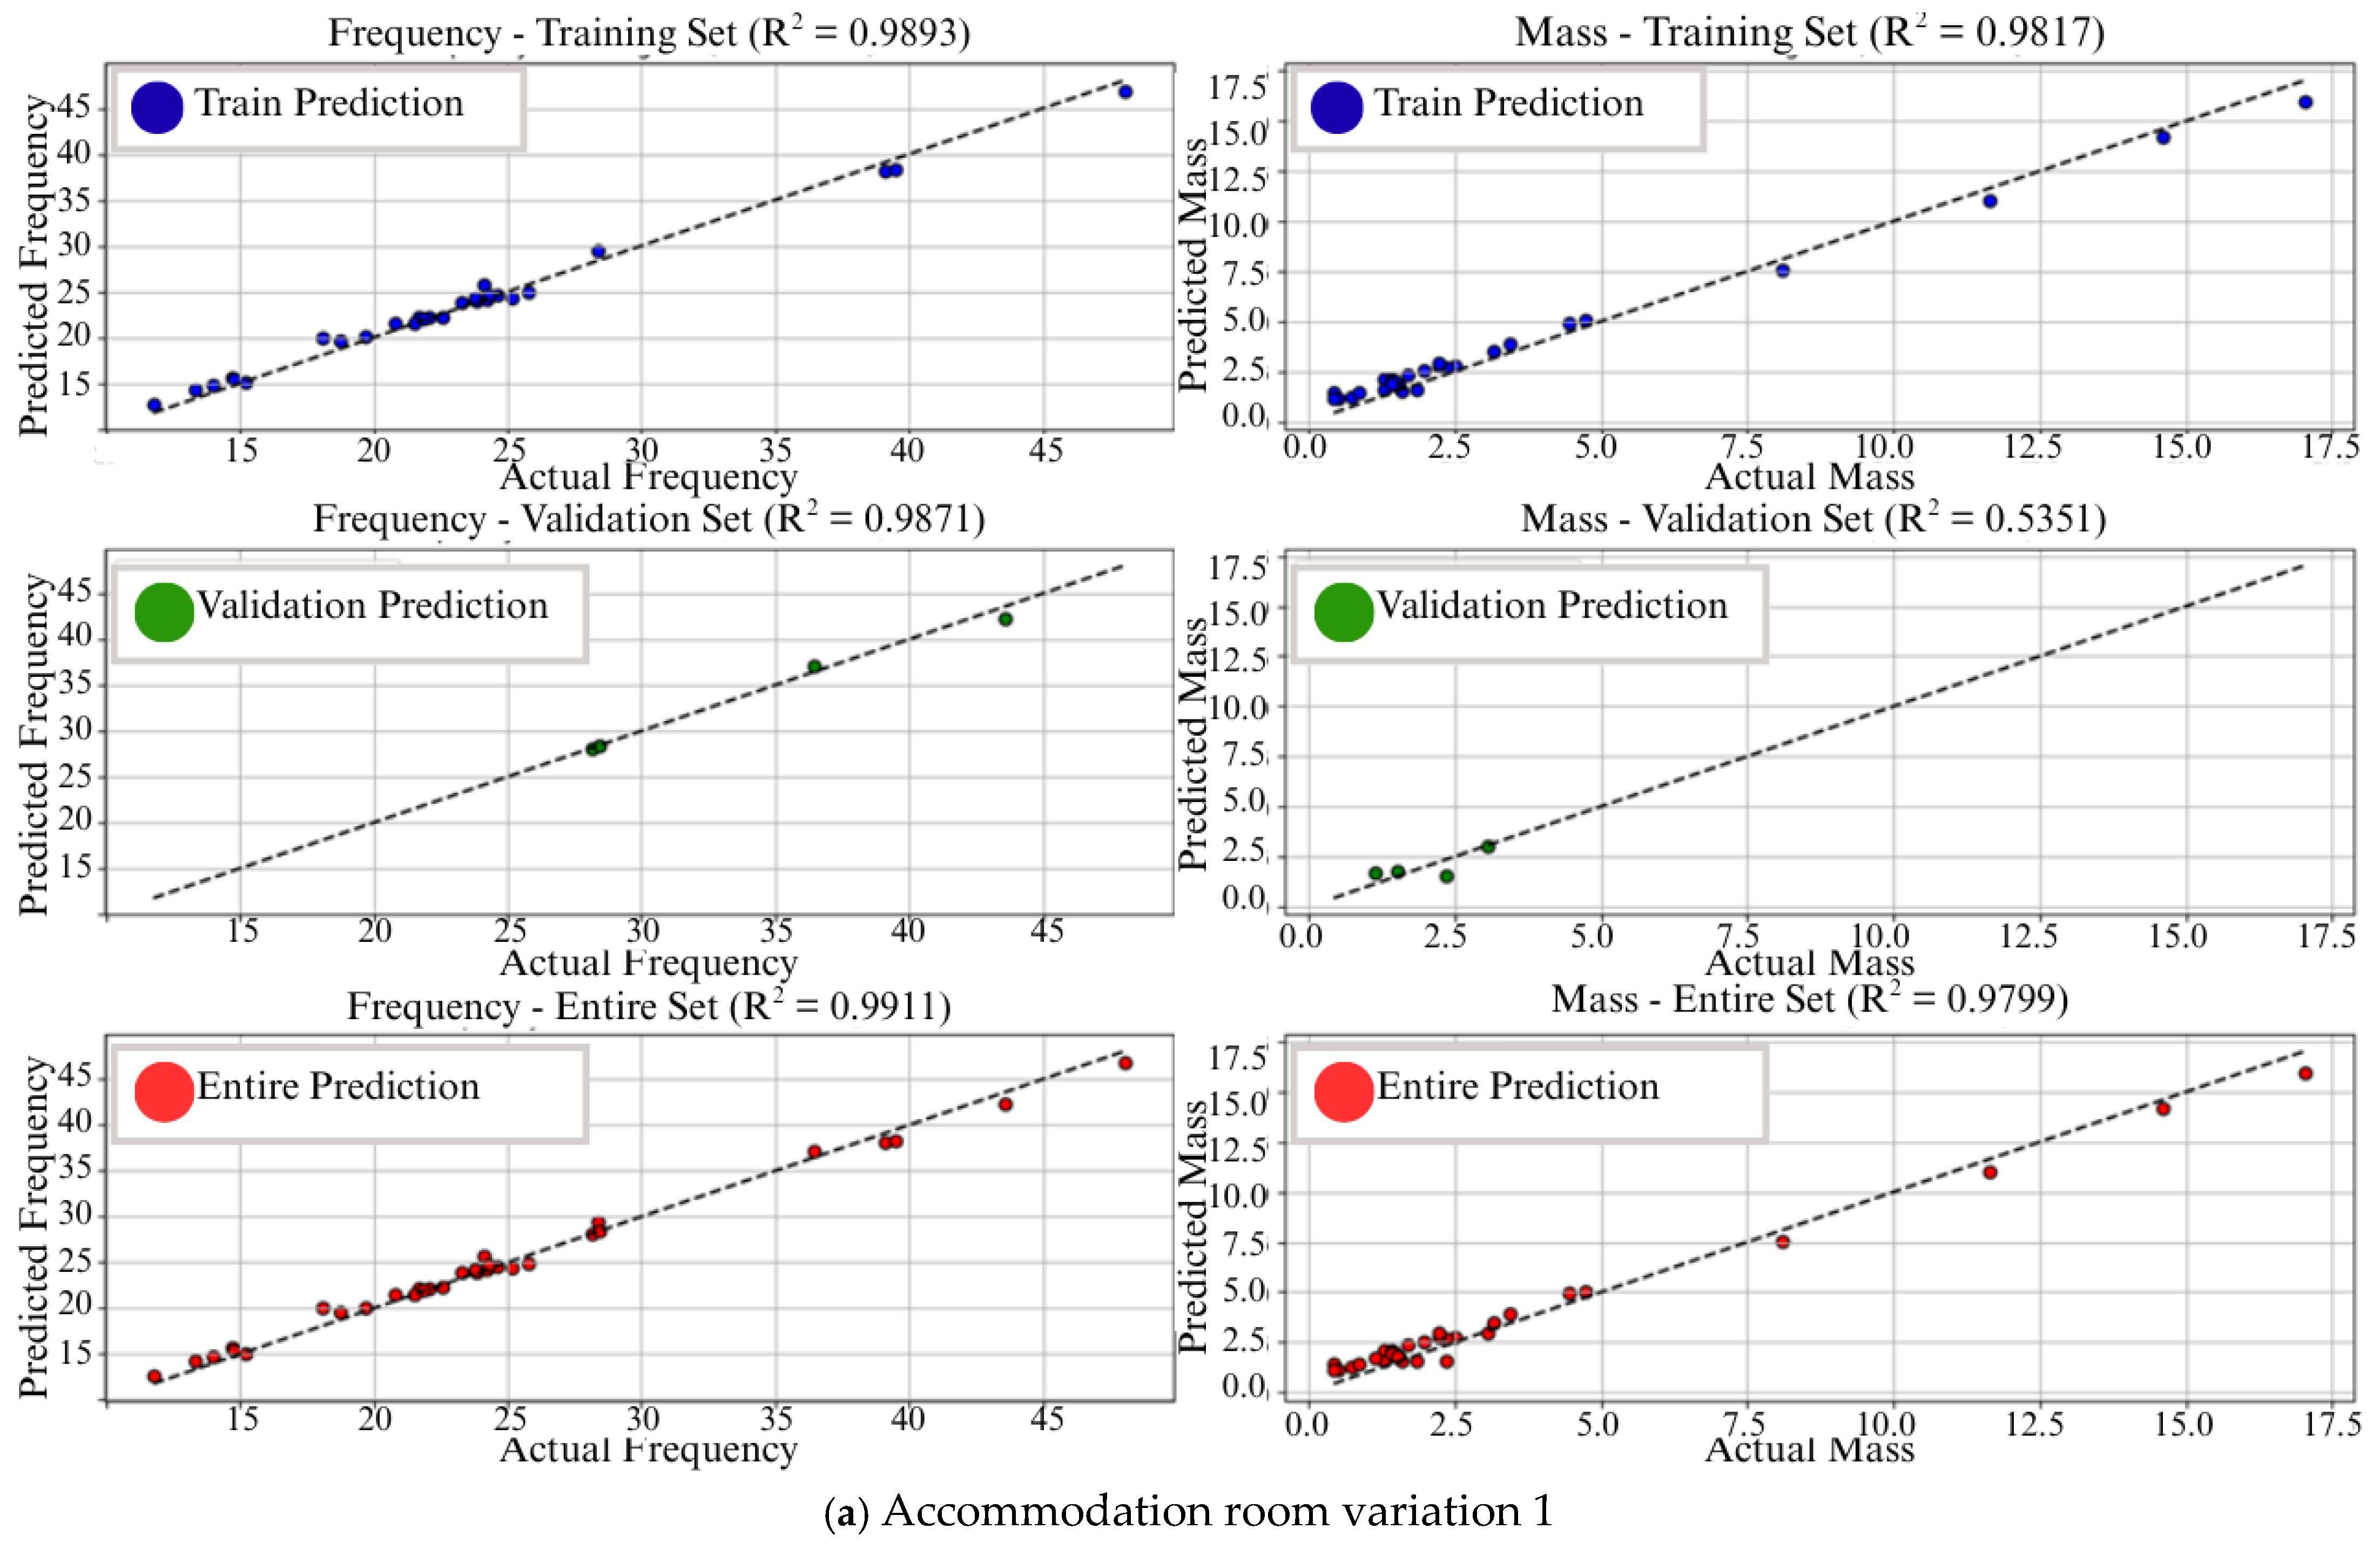
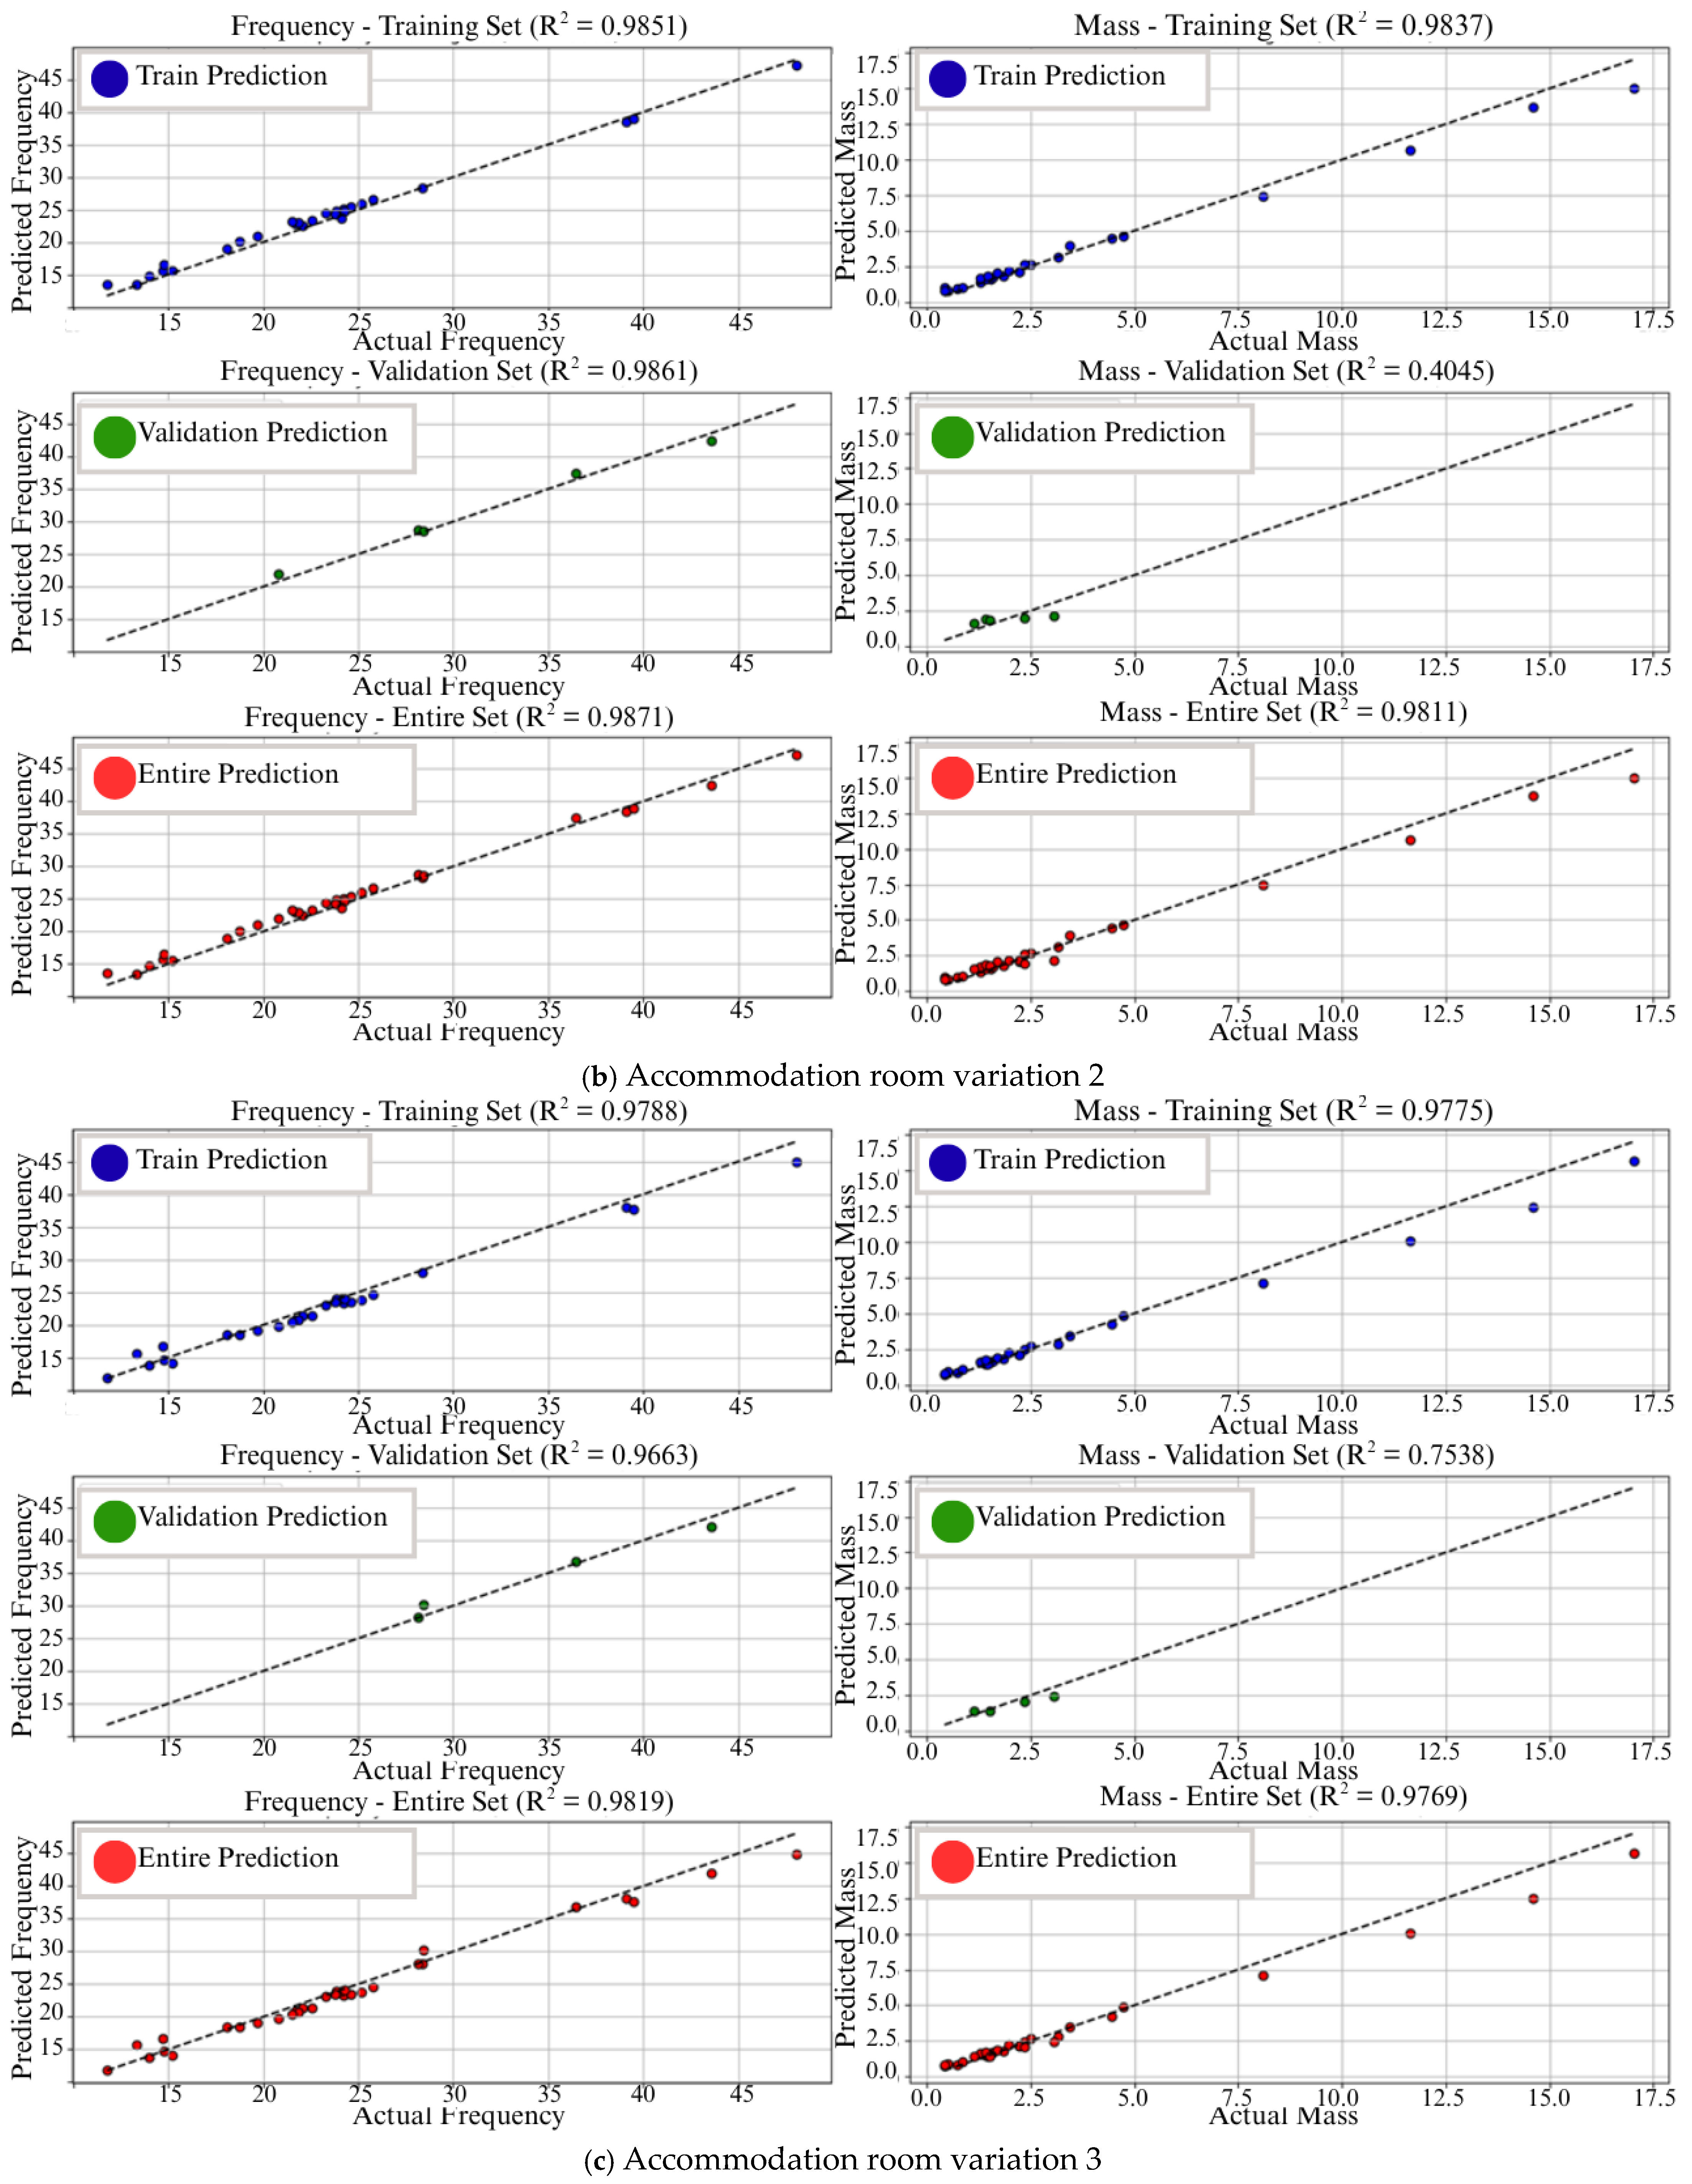
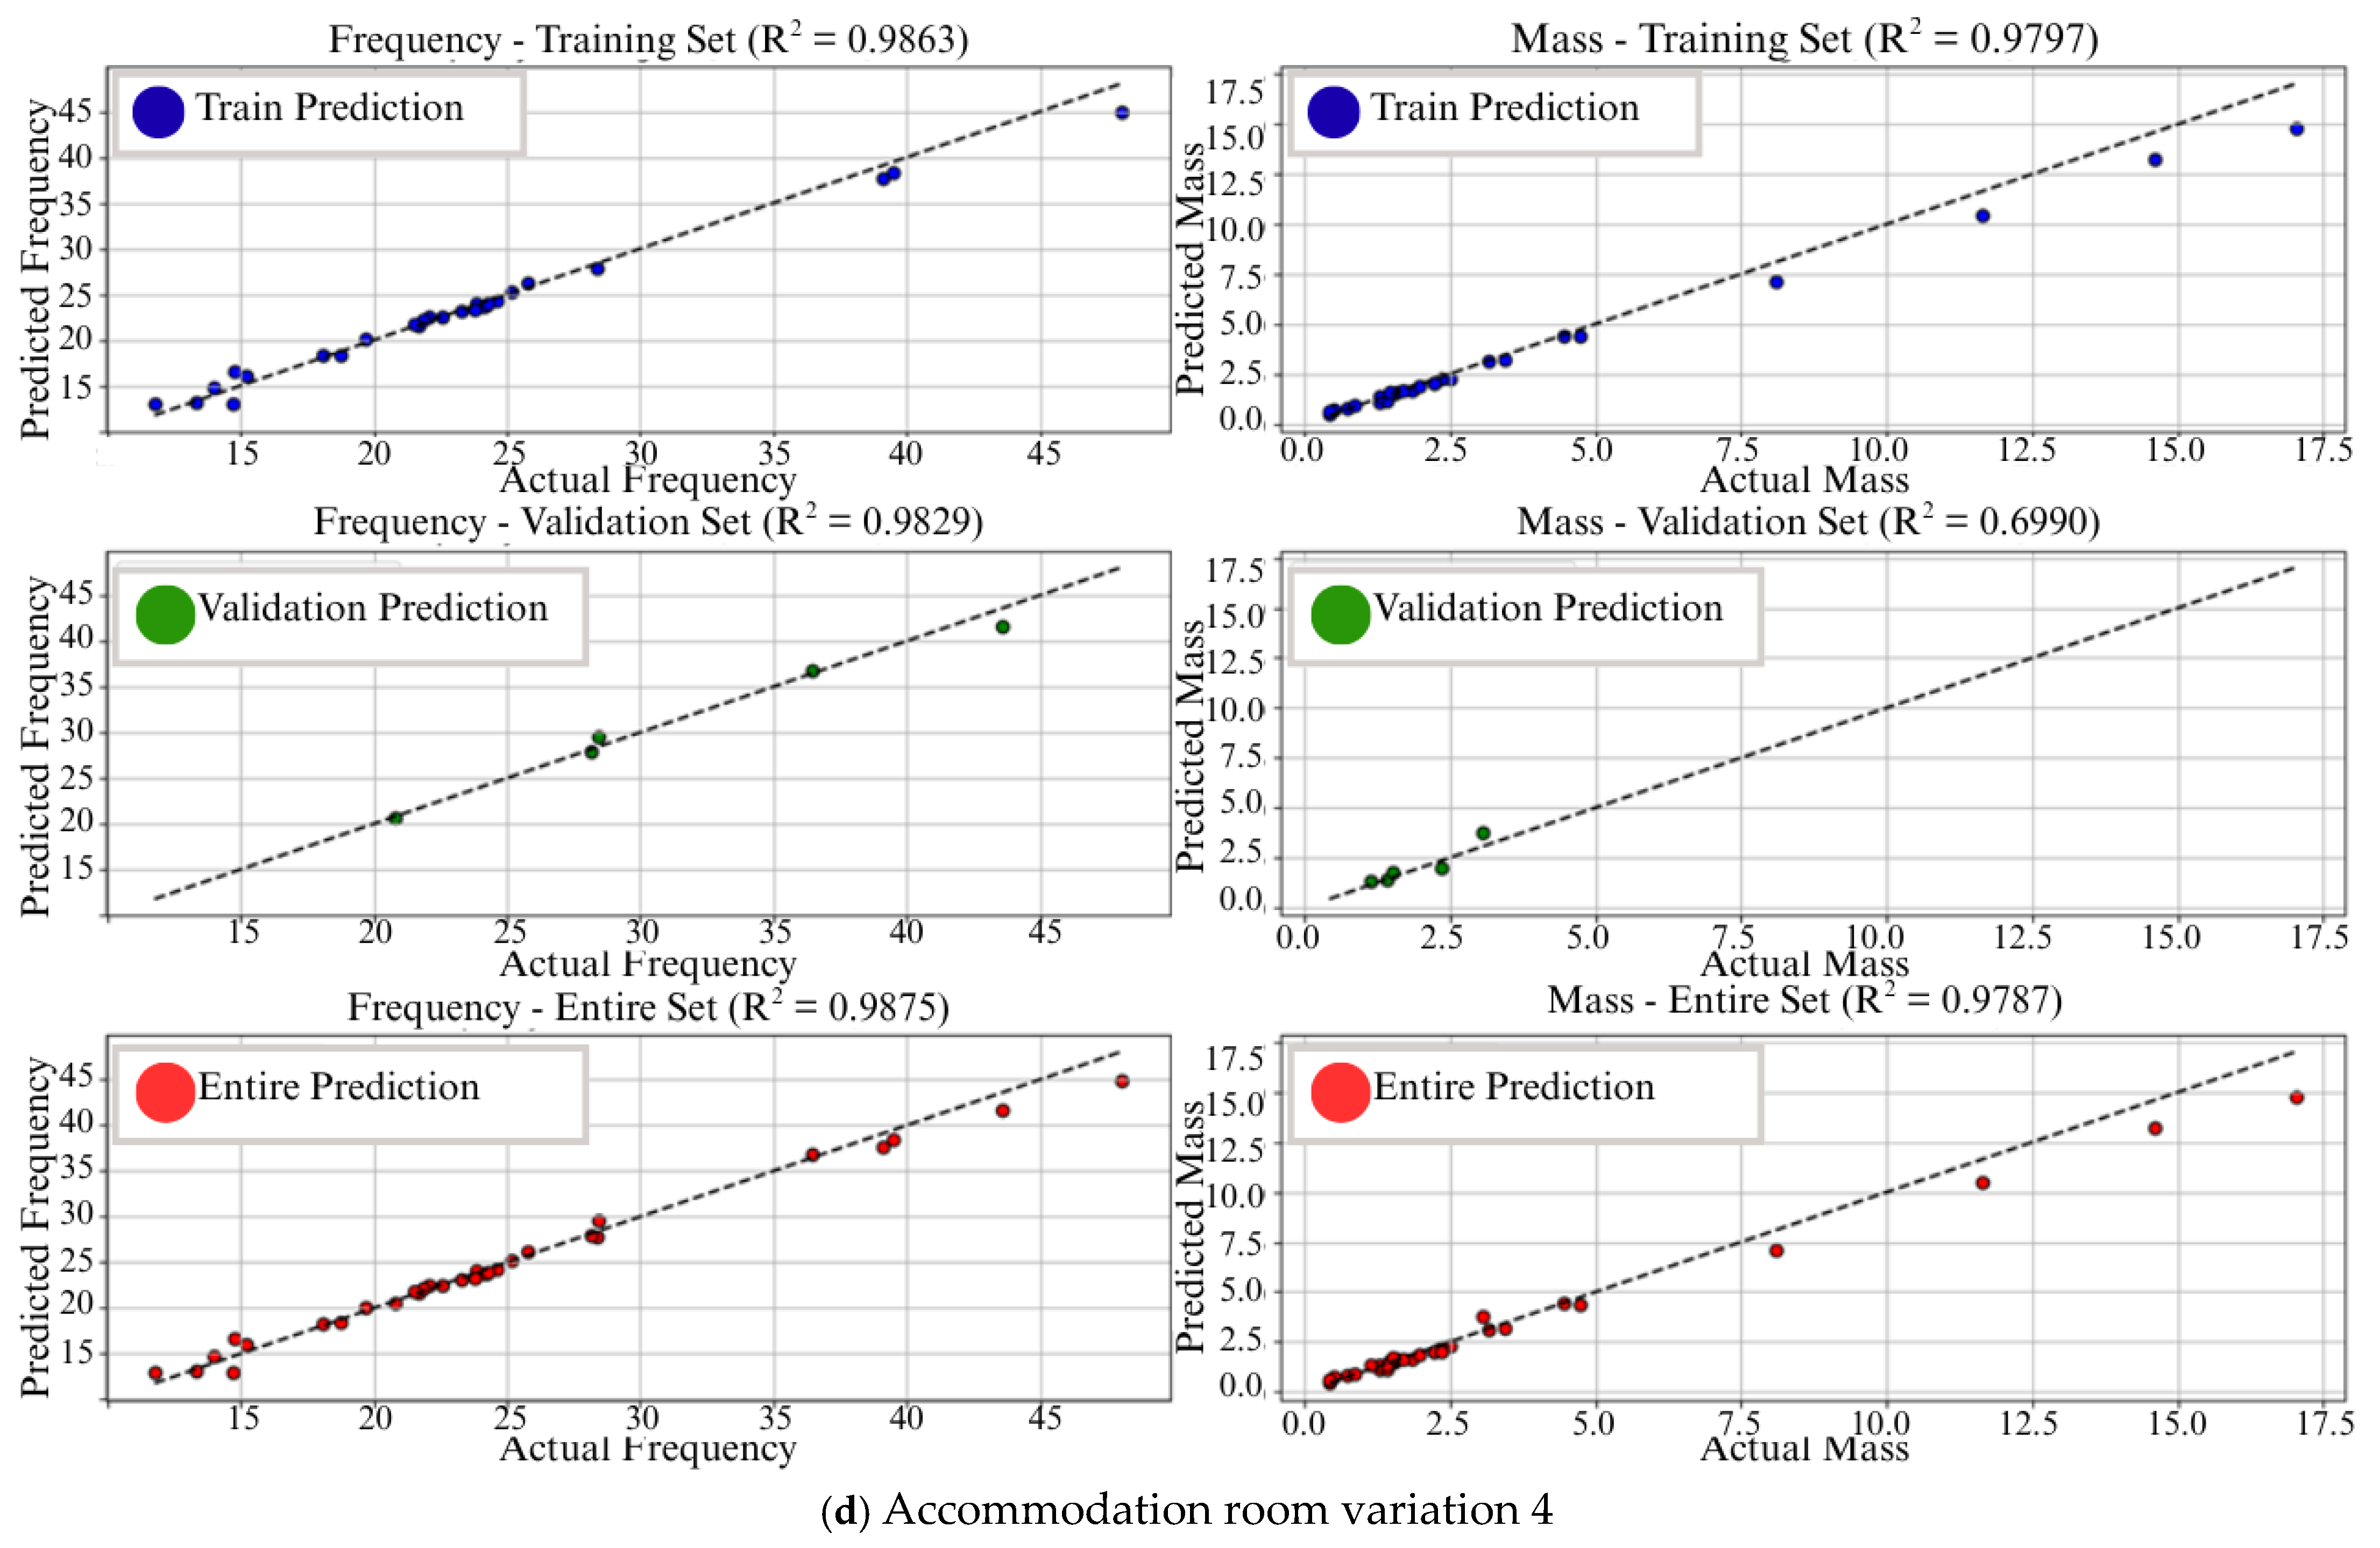
The performance of each network will be validated to see if the network is demonstrating optimal generation. The regression graph will be applied to each network training period to show the accuracy for each training period. Each network will be divided into two output variable graphs and each output variable will be divided into the training set, validation set, and entire set to see if the network training is overfitting. The prediction accuracy results are presented in Figure 8, Figure 9, Figure 10 and Figure 11.
The graphs in Figure 8 show that the entire panel network model is training very well, with an entire set accuracy range of frequency R2 = 0.95 to 0.98 and mass R2 = 0.95 to 0.98.
The graph in Figure 9 show that the engine room network model is training very well, with an entire set accuracy range of frequency R2 = 0.95 to 0.98 and mass R2 = 0.96 to 0.98.
The graphs in Figure 10 show that the after peak network model is trained well but is demonstrating overfitting, with an entire set accuracy range of frequency R2 = 0.96 to 0.98 and mass R2 = 0.97 to 0.98, which is not acceptable.
The graphs in Figure 11 show that the accommodation room network model is trained well but is demonstrating overfitting, with an entire set accuracy range for Frequency R2 = 0.97 to 0.99 and mass R2 = 0.97 to 0.98, which is not acceptable.
Overall, the results demonstrate a high degree of alignment between the predicted and actual values across all variations based on the prediction graphs, but the regression graphs show that the after peak variation 1 to 4 and accommodation room variation 1 to 4 models show signs of overfitting. This is shown in the validation training accuracy, which is under 80%, and the gap between the training and validation set accuracy, which is more than 10%. This means that the credibility of the prediction accuracy is not fully acceptable. For the entire panel variation 1 to 4 and engine room variation 1 to 4 models, it is shown that the network model generated very well and that the accuracy is acceptable, as seen in the accuracy results of frequency and mass all being above 90%.

4.3. Summary

After all of the network training is completed, each network will be compared to each other to find out the best network and to define the model fit, overfit, or underfit. A summary of the network prediction accuracy results is shown in Table 4.
From Table 4, it can be shown that the entire panel variation 1 to 4 and engine room variation 1 to 4 models generated very well and in comparison with the after peak variation 1 to 4 and accommodation room variation 1 to 4 network models which demonstrated overfitting, since the prediction gap is more than 20% different. The table also shows that the entire set variation 1 (ALL-Var1) it the best network model because both frequency and mass are predicted with 98% accuracy and all training and validation are predicted above 95%. Also, the prediction gap of the network model is stable to 2% to 3%. Since the entire set variation 1 (ALL-Var1) is the best network model, each prediction result of all sample data is shown in Table 5.
From the sample data prediction results shown in Table 5, the best prediction happens for the engine room–82 panel with the margin between the percentage of the actual value and prediction value for frequency being 0.97% and for mass being 0%; this means that the sample data is generated very well.

4.4. Case Study

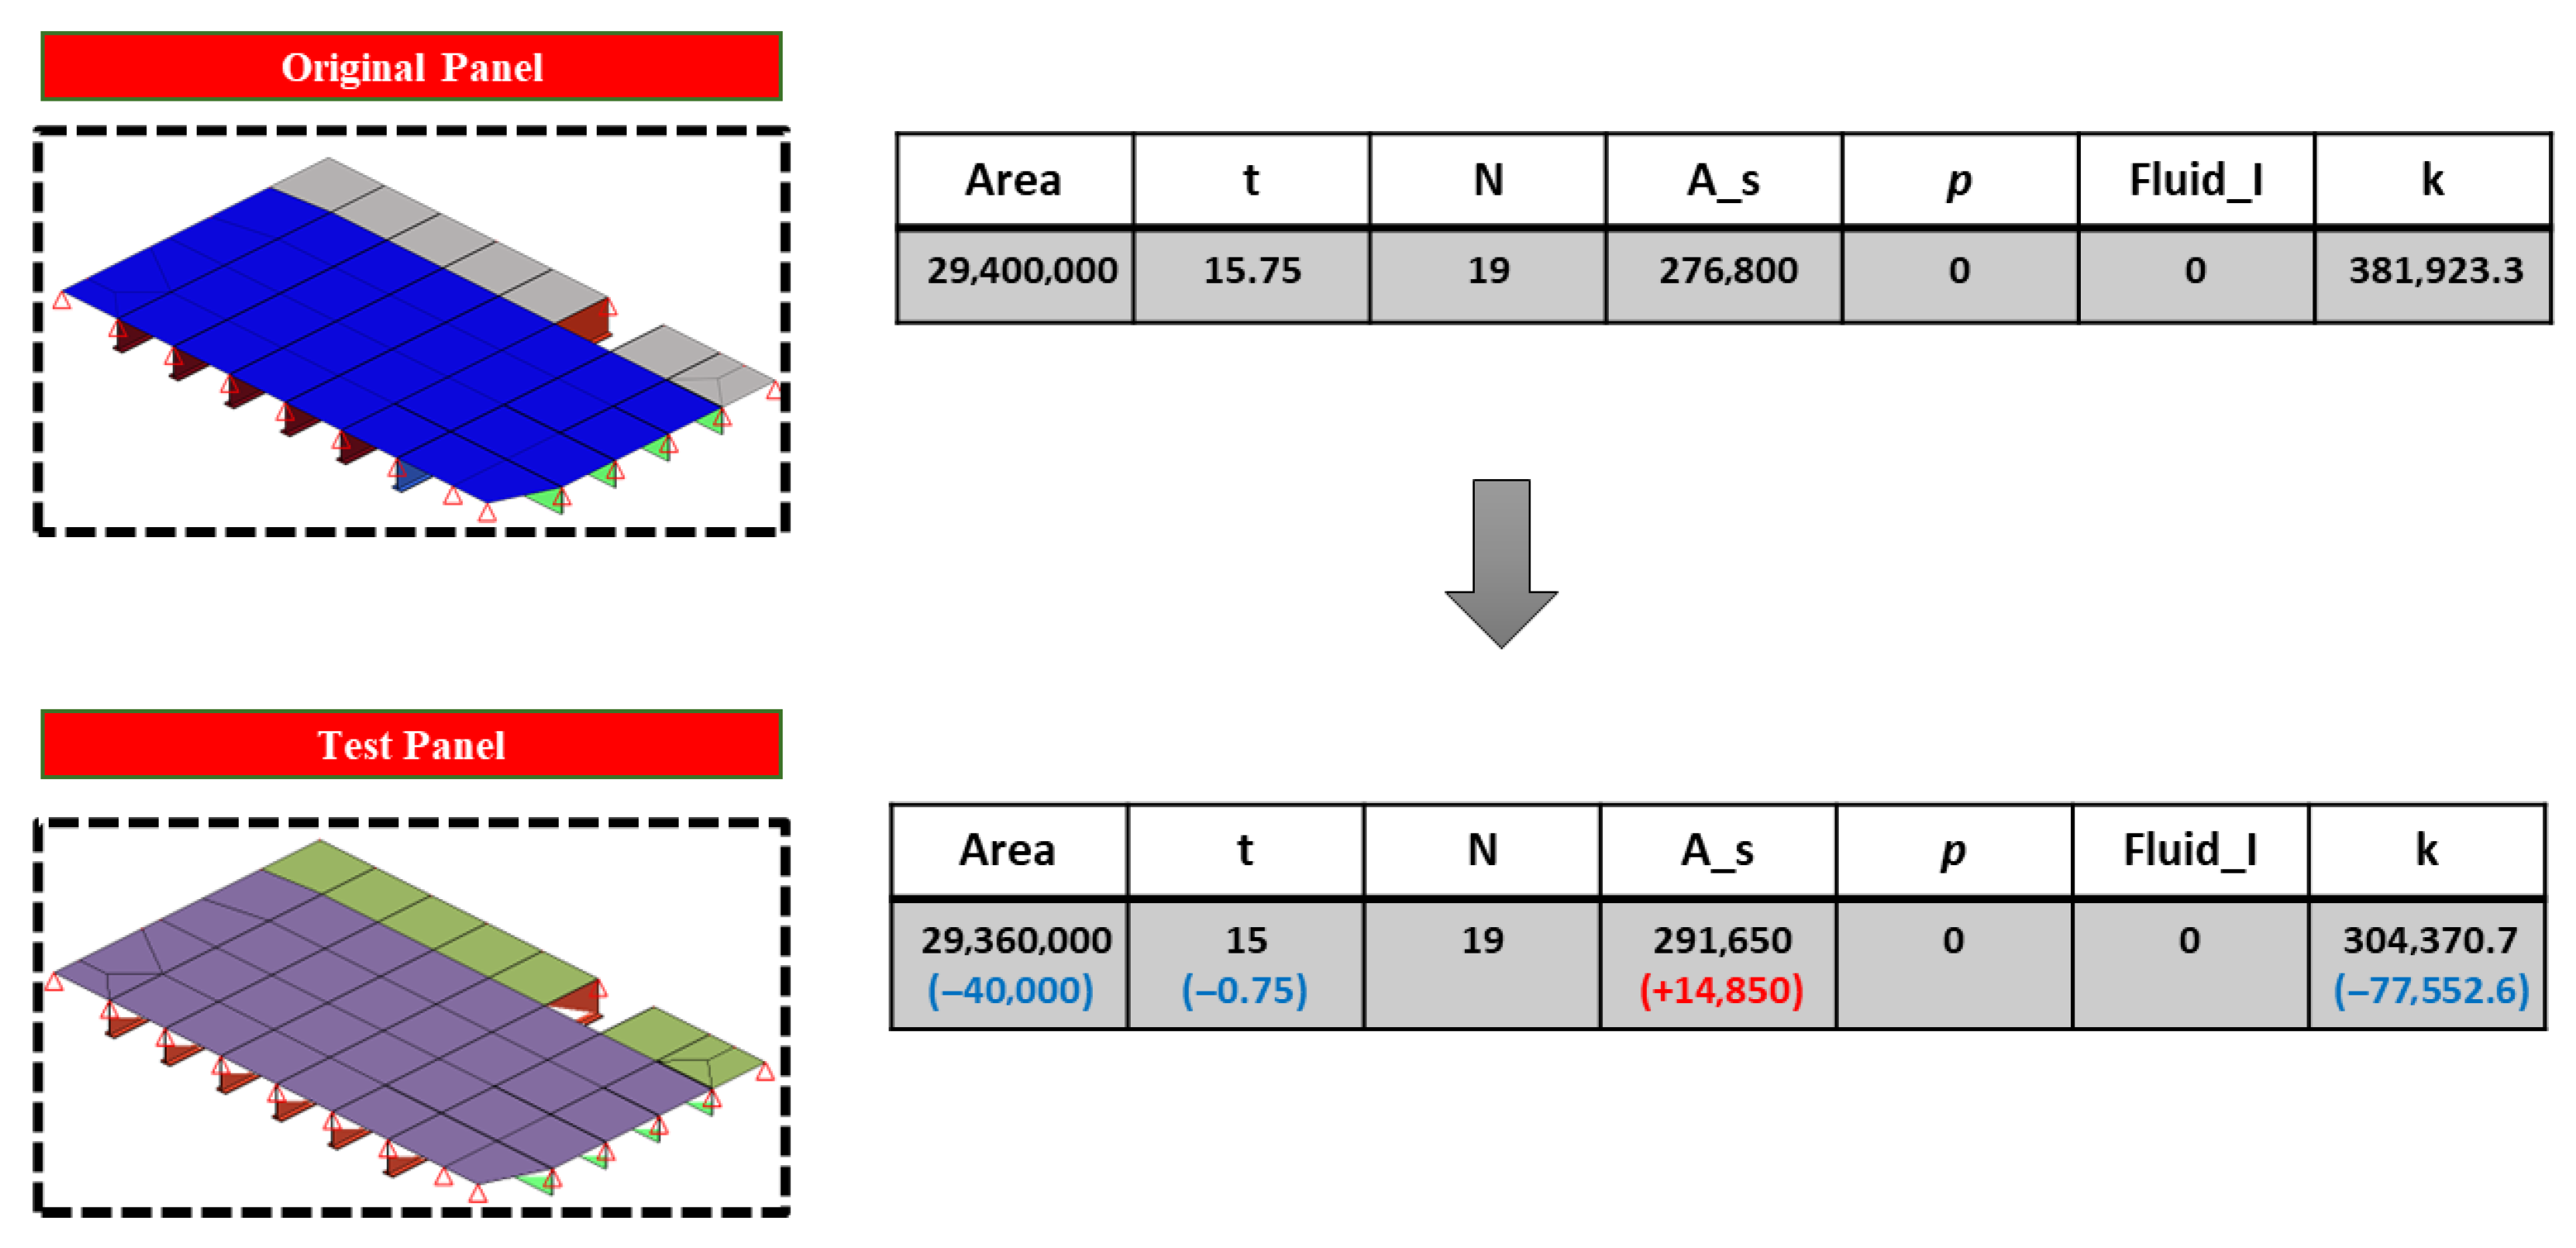
After the best network model and best sample data prediction method was determined, a case study had to be performed to check if the network could technically predict a stiffened panel vibration analysis result. In this case since the engine room–82 panel demonstrated the best sample data prediction, that base panel was chosen as the basic panel to be tested. The input variable value of the panel, such as plate dimension, thickness, the area of stiffener, has to be randomly changed. Model stiffness, the number of stiffeners, fluid density, and fluid interaction side are not changed because they vary the structural support and structural characteristics. In the case study, the number of stiffeners and the number of fluid contact sides were fixed to reflect the characteristics of hull structures. In ship structural design, the spacing of stiffeners must be maintained uniformly in accordance with classification rules. Furthermore, the hull structural sides in contact with fluid are limited to the inner surfaces of structures used for fluid storage within the hull structure. On the other hand, during the structural design process of the ship hull, the plate dimensions of stiffened panels can be adjusted within a certain range at the discretion of the designer. This had to be performed to test if the algorithm could generate with new random variable values. The specific input variables that were changed from the base original panel are shown in Figure 12.
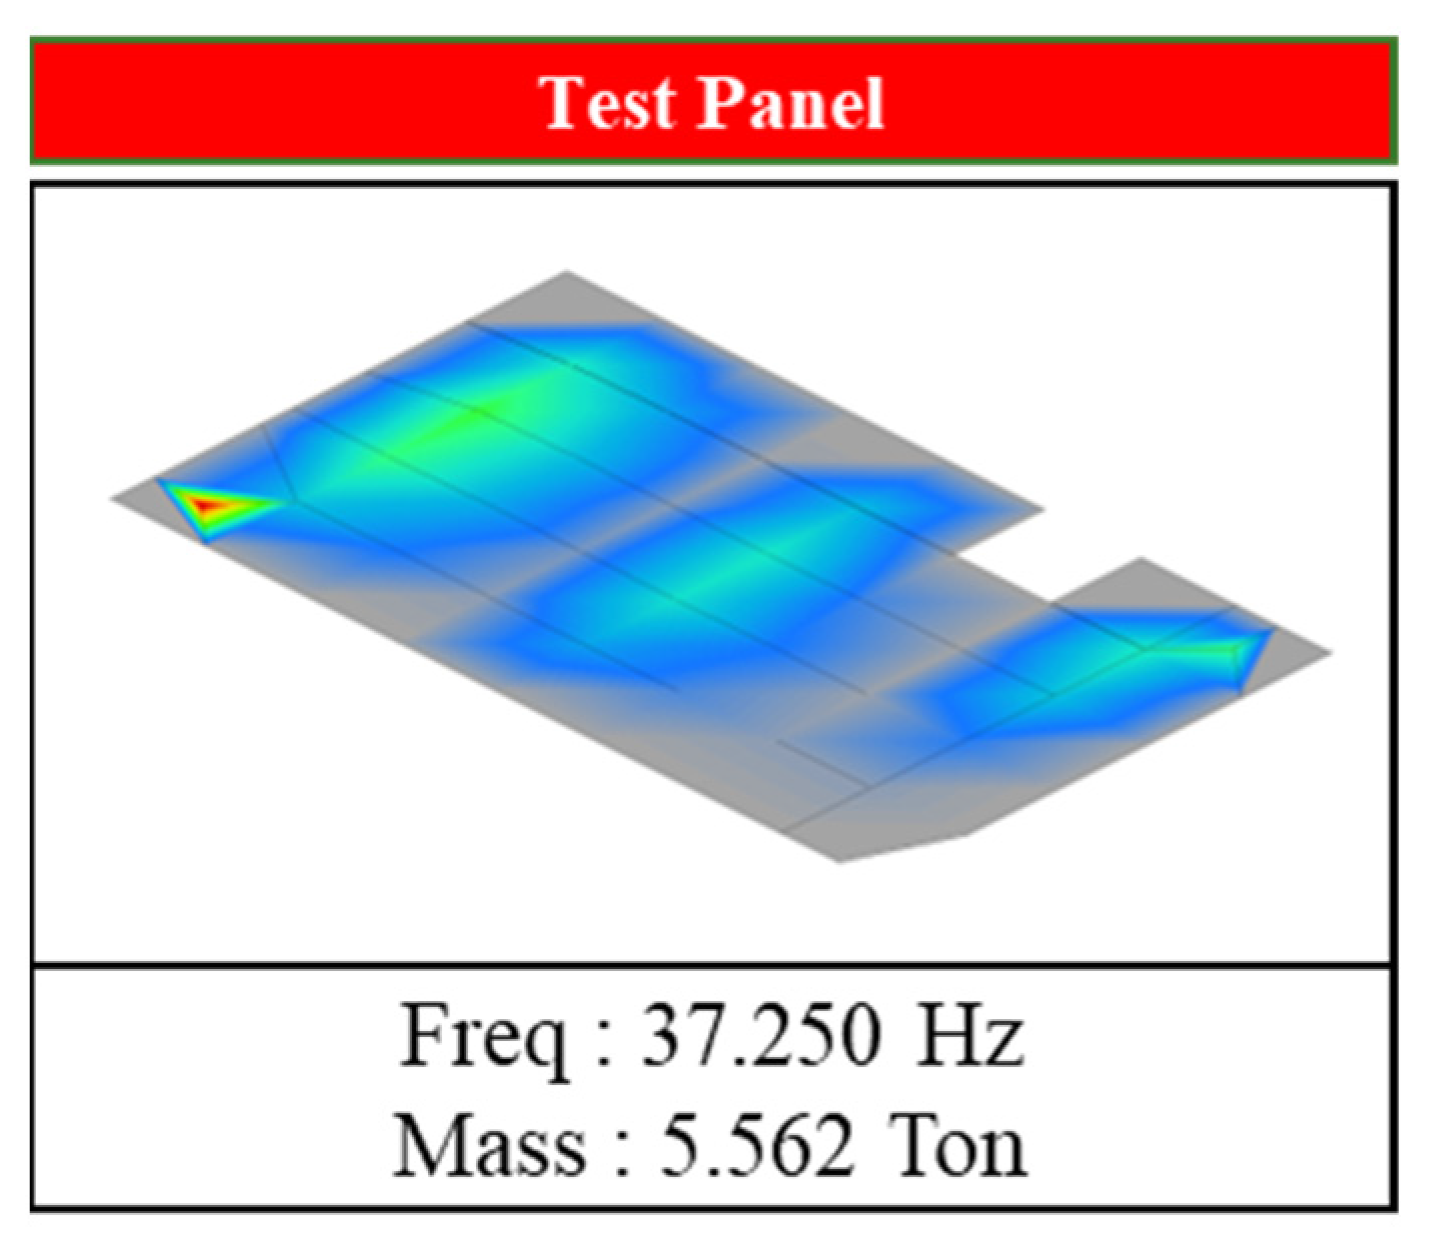
After all of the input variable values are defined, a vibration analysis for the test panel had to be performed. The vibration analysis results for the output variables are shown in Figure 13. The output variable value will not be inputted into the network model, since that value it just needed to validate if the algorithm can predict the random test panel and to determine the margin between the actual test panel value and predicted test panel value.
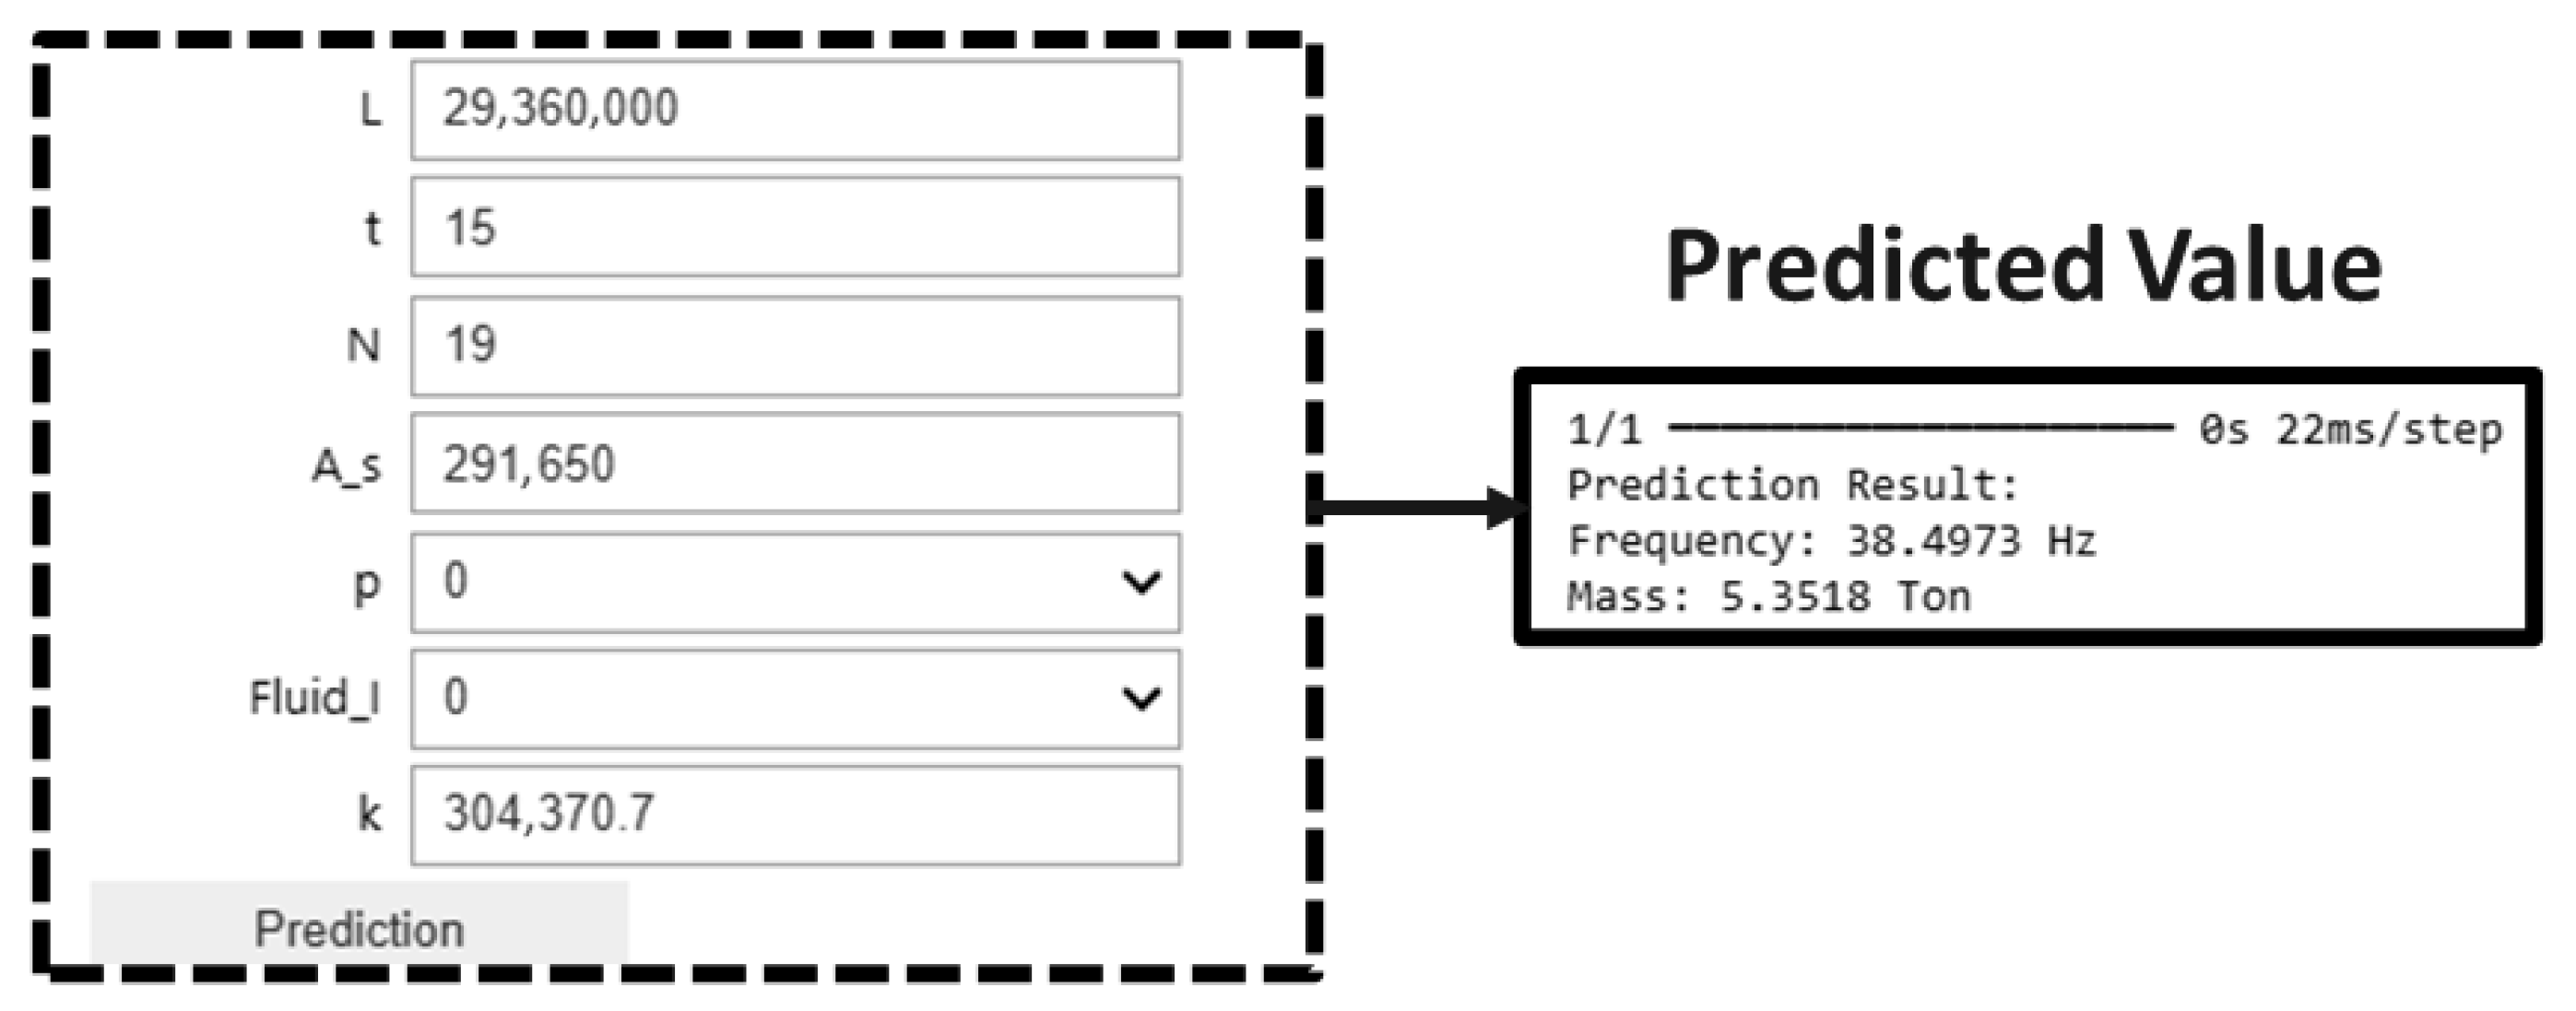
The input variable will be input into the network model; this step is performed after the network model has already obtained a result for accuracy and after the algorithm has been trained. In this case the entire set variation 1 (ALL-Var1) network model is used. After obtaining the result, the predicted value will be compared and the accuracy value will be validated against the entire set variation 1 (ALL-Var1) set accuracy. The simulation results of the test panel prediction are shown in Figure 14.
After the test panel is applied to the network training, it can be shown in Table 6 that the test panel predicted very well according to the algorithm that consisted of the entire set variation 1 (ALL-Var1) network model. The accuracy value of the test panel was similar to the validation set value, which shows that the network is capable of predicting the result based on the algorithm that was already being trained.

5. Conclusions

The primary objective of this study was to develop an ANN-based predictive model capable of accurately and efficiently estimating the fundamental vibration frequency and structural mass of ship stiffened panels. To this end, a comprehensive dataset was generated using FEA, encompassing a wide range of panel configurations and structural characteristics, including panel area, thickness, number and area of stiffeners, fluid density, number of fluid contact sides, and overall structural stiffness. These variables were used as input features for the ANN, which was trained to predict two key outputs: the fundamental vibration frequency and the corresponding structural mass.
A total of 16 different networks were trained with a combination of four training sets (entire panel, engine room, after peak, and accommodation room) with two variations in the hidden layers and two variations in validation. Among the networks, the model trained with the entire dataset (ALL-Var1) demonstrated the most robust and generalized predictive capability, achieving R2 values exceeding 0.98 and prediction gaps within 2% to 3% for both target outputs. In contrast, the models trained on subsets with limited data, such as the after peak and accommodation room panels, showed signs of overfitting due to insufficient data variation and poor correlation between input and output features.
These findings highlight the importance of data quality, quantity, and feature relevance in training machine learning models for structural prediction tasks. The ANN model developed in this research successfully captured the complex nonlinear relationships governing panel vibration behavior, showing promise as a rapid alternative to conventional FEA-based analyses. Furthermore, the trained model was verified using randomly selected panel cases, where it achieved over 96% accuracy in predicting both vibration frequency and mass.
In conclusion, this study demonstrates that a well trained ANN model can serve as a reliable and scalable tool for predicting the local vibration characteristics of ship structures, facilitating the early detection of resonance risks during the design stage. By integrating such a model into the structural design and inspection workflow, engineers can significantly reduce computational costs while maintaining a high predictive accuracy. Future research should aim to expand the training dataset to cover a broader range of structural scenarios and improve generalization by incorporating advanced feature selection and regularization techniques. This will further enhance the model’s applicability and robustness in practical marine engineering design contexts.

Author Contributions

Conceptualization, M.R.P. and C.-Y.S.; methodology, M.R.P. and C.-Y.S.; software, M.R.P.; validation, M.R.P. and C.-Y.S.; formal analysis, M.R.P.; investigation, M.R.P.; writing—original draft preparation, M.R.P.; writing—review and editing, C.-Y.S.; supervision, C.-Y.S. All authors have read and agreed to the published version of the manuscript.

Funding

This research received no external funding.

Data Availability Statement

The data presented in this study are available within the article.

Acknowledgments

This work was supported by the Korea Institute of Energy Technology Evaluation and Planning (KETEP) and the Ministry of Trade, Industry and Energy (MOTIE) of the Republic of Korea (No. 20213000000030; No. 20223030020240), the Korea Institute of Marine Science and Technology Promotion (KIMST), and the Ministry of Oceans and Fisheries, Korea (No. 1525013494/PMS5390, Development of basic technologies to evaluate electric-powered system for in eco-friendly ship and demonstrate ship—applicability of carbon-free fuel).

Conflicts of Interest

The authors declare no conflicts of interest.

Abbreviations

The following abbreviations are used in this manuscript:
FEAFinite Element Analysis
MLPMultilayer Perceptron
SLSupervised Learning
BPNNBack Propagation Neural Network
FEINNFinite Element Informed Neural Network
ALL-Var1Entire Panel Variation 1
ALL-Var2Entire Panel Variation 2
ALL-Var3Entire Panel Variation 3
ALL-Var4Entire Panel Variation 4
ER-Var1Engine Room Variation 1
ER-Var2Engine Room Variation 2
ER-Var3Engine Room Variation 3
ER-Var4Engine Room Variation 4
AE-Var1After Peak Variation 1
AE-Var2After Peak Variation 2
AE-Var3After Peak Variation 3
AE-Var4After Peak Variation 4
ACC-Var1Accommodation Room Variation 1
ACC-Var2Accommodation Room Variation 2
ACC-Var3Accommodation Room Variation 3
ACC-Var4Accommodation Room Variation 4

References

  1. Yang, Y.; Zhang, Z.; Zhao, J.; Zhang, B.; Zhang, L.; Hu, Q.; Sun, J. Research on Ship Resistance Prediction Using Machine Learning with Different Samples. J. Mar. Sci. Eng. 2024, 12, 556. [Google Scholar] [CrossRef]
  2. Li, W.; Zhang, D.; Shi, X. Establishment of a flow-induced vibration power database based on deep neural network machine learning method. Ocean. Eng. 2023, 285, 115463. [Google Scholar] [CrossRef]
  3. Mottaghian, F.; Taheri, F. Machine learning/finite element analysis—A collaborative approach for predicting the axial impact response of adhesively bonded joints with unique sandwich composite adherends. Compos. Sci. Technol. 2023, 242, 110162. [Google Scholar] [CrossRef]
  4. Lu, Y.; Luo, Q.; Liao, Y.; Xu, W. Vortex-induced vibration fatigue damage prediction method for flexible cylinders based on RBF neural network. Ocean. Eng. 2022, 254, 111344. [Google Scholar] [CrossRef]
  5. Hajializadeh, F.; Ince, A. Integration of artificial neural network with finite element analysis for residual stress prediction of direct metal deposition process. Mater. Today Commun. 2021, 27, 102197. [Google Scholar] [CrossRef]
  6. Duan, C.; Zhang, S. Prediction of fully plastic J-integral for weld centerline surface crack considering strength mismatch based on 3D finite element analyses and artificial neural network. Int. J. Nav. Archit. Ocean. Eng. 2020, 12, 354–366. [Google Scholar] [CrossRef]
  7. Han, H. Psycho-acoustic evaluation of the indoor noise in cabins of a naval vessel using a back-propagation neural network algorithm. Int. J. Nav. Archit. Ocean. Eng. 2012, 4, 374–385. [Google Scholar] [CrossRef][Green Version]
  8. Le-Duc, T.; Nguyen-Xuan, H.; Lee, J. A finite-element-informed neural network for parametric simulation in structural mechanics. Finite Elem. Anal. Des. 2023, 217, 103904. [Google Scholar] [CrossRef]
  9. Xiong, W.; Long, X.; Bordas, S.P.; Jiang, C. The deep finite element method: A deep learning framework integrating the physics-informed neural networks with the finite element method. Comput. Methods Appl. Mech. Eng. 2024, 436, 117681. [Google Scholar] [CrossRef]
  10. Zhang, N.; Xu, K.; Yin, Z.-Y.; Li, K.-Q. Transfer learning-enhanced finite element-integrated neural networks. Int. J. Mech. Sci. 2025, 290, 110075. [Google Scholar] [CrossRef]
  11. Yang, J.; Chen, Z.; Zhou, J. Enhanced soft Monte Carlo simulation coupled with support vector regression for high-dimensional reliability analysis. Proc. Inst. Civ. Eng.-Transp. 2025, 178, 128–141. [Google Scholar]
  12. Zhou, X.; Zhang, Y.; Deng, C.; Sun, C. Physics-guided neural networks for multiaxial fatigue life prediction under irregular loading. Philos. Trans. R. Soc. A Math. Phys. Eng. Sci. 2022, 380, 20220395. [Google Scholar]
  13. Meng, D.; Nie, P.; Yang, S.; Su, X.; Liao, C. Reliability analysis of wind turbine gearboxes: Past, progress and future prospects. Int. J. Struct. Integr. 2025, 16, 4–38. [Google Scholar] [CrossRef]
  14. Ban, I.; Lim, C.; Kim, G.; Choi, S.; Shin, S. A Data-Driven DNN model to predict the ultimate strength of a ship’s bottom structure. J. Mar. Sci. Eng. 2024, 12, 1328. [Google Scholar] [CrossRef]
  15. Cepowski, T. Utilizing artificial neural network ensembles for ship design optimization to reduce added wave resistance and CO2 emissions. Energies 2024, 17, 5326. [Google Scholar] [CrossRef]
  16. Hwang, H.E.; Cho, Y.S.; Hwang, S.C.; Kim, S.B. Optimal tire design using machine learning and Bayesian optimization. J. Korean Inst. Ind. Eng. 2022, 48, 433–440. [Google Scholar] [CrossRef]
  17. Martić, I.; Degiuli, N.; Majetić, D.; Farkas, A. Artificial neural network model for the evaluation of added resistance of container ships in head waves. J. Mar. Sci. Eng. 2021, 9, 826. [Google Scholar] [CrossRef]
  18. Radojčić, D.V.; Morabito, M.G.; Simić, A.P.; Zgradić, A.B. Modeling with Regression Analysis and Artificial Neural Networks the Resistance and Trim of Series 50 Experiments with V-Bottom Motorboats. J. Ship Prod. Des. 2014, 30, 153–174. [Google Scholar] [CrossRef]
  19. Santos, A.B.D.; Vasconcelos, H.M.; Domingues, T.M.R.M.; Sousa, P.J.S.C.P.; Dias, S.; Lopes, R.F.F.; Parente, M.L.P.; Tomé, M.; Cavadas, A.M.S.; Moreira, P.M.G.P. Predictive analysis of structural damage in submerged structures: A case study approach using machine learning. Fluids 2025, 10, 10. [Google Scholar] [CrossRef]
  20. American Bureau of Shipping (ABS). Guidance Notes on Ship Vibration; American Bureau of Shipping: New York, NY, USA, 2006. [Google Scholar]
  21. Det Norske Veritas (DNV). Rules for Classification of Ships—Vibration Class; Det Norske Veritas: Oslo, Norway, 2011. [Google Scholar]
  22. ISO 20283-5:2016; Mechanical Vibration—Measurement of Vibration on Ships. International Organization for Standardization (ISO): Geneva, Switzerland, 2016.
  23. Korean Register of Shipping (KR). Control of Ship Vibration and Noise; Korean Register of Shipping: Seoul, Republic of Korea, 2018. [Google Scholar]
  24. Lloyd’s Register (LR). Guidance Notes—General Overview of Ship Structural Vibration Problems; Lloyd’s Register: London, UK, 2015. [Google Scholar]
  25. American Bureau of Shipping (ABS). Insights into Ship Vibration Analysis; American Bureau of Shipping: New York, NY, USA, 2022. [Google Scholar]
  26. Altair Engineering. HyperMesh User Guide; Altair Engineering Inc.: Troy, MI, USA, 2023. [Google Scholar]
  27. MSC Software Corporation. MSC NASTRAN 2022.1 Reference Manual; Hexagon AB: Stockholm, Sweden, 2022. [Google Scholar]
  28. International Maritime Organization. MARPOL Consolidated Edition 2022; IMO Publishing: London, UK, 2023. [Google Scholar]
  29. Goodfellow, I.; Bengio, Y.; Courville, A. Deep Learning; MIT Press: Cambridge, MA, USA, 2016. [Google Scholar]
  30. Microsoft. Visual Studio Code Documentation; Microsoft: Washington, DC, USA, 2024. [Google Scholar]
  31. Python Software Foundation. The Python Language Reference, Version 3.12; Python Software Foundation: Beaverton, OR, USA, 2024.
  32. Kingma, D.P.; Ba, J.L. Adam: A method for stochastic optimization. In Proceedings of the 3rd International Conference on Learning Representations (ICLR), San Diego, CA, USA, 7–9 May 2015. [Google Scholar]
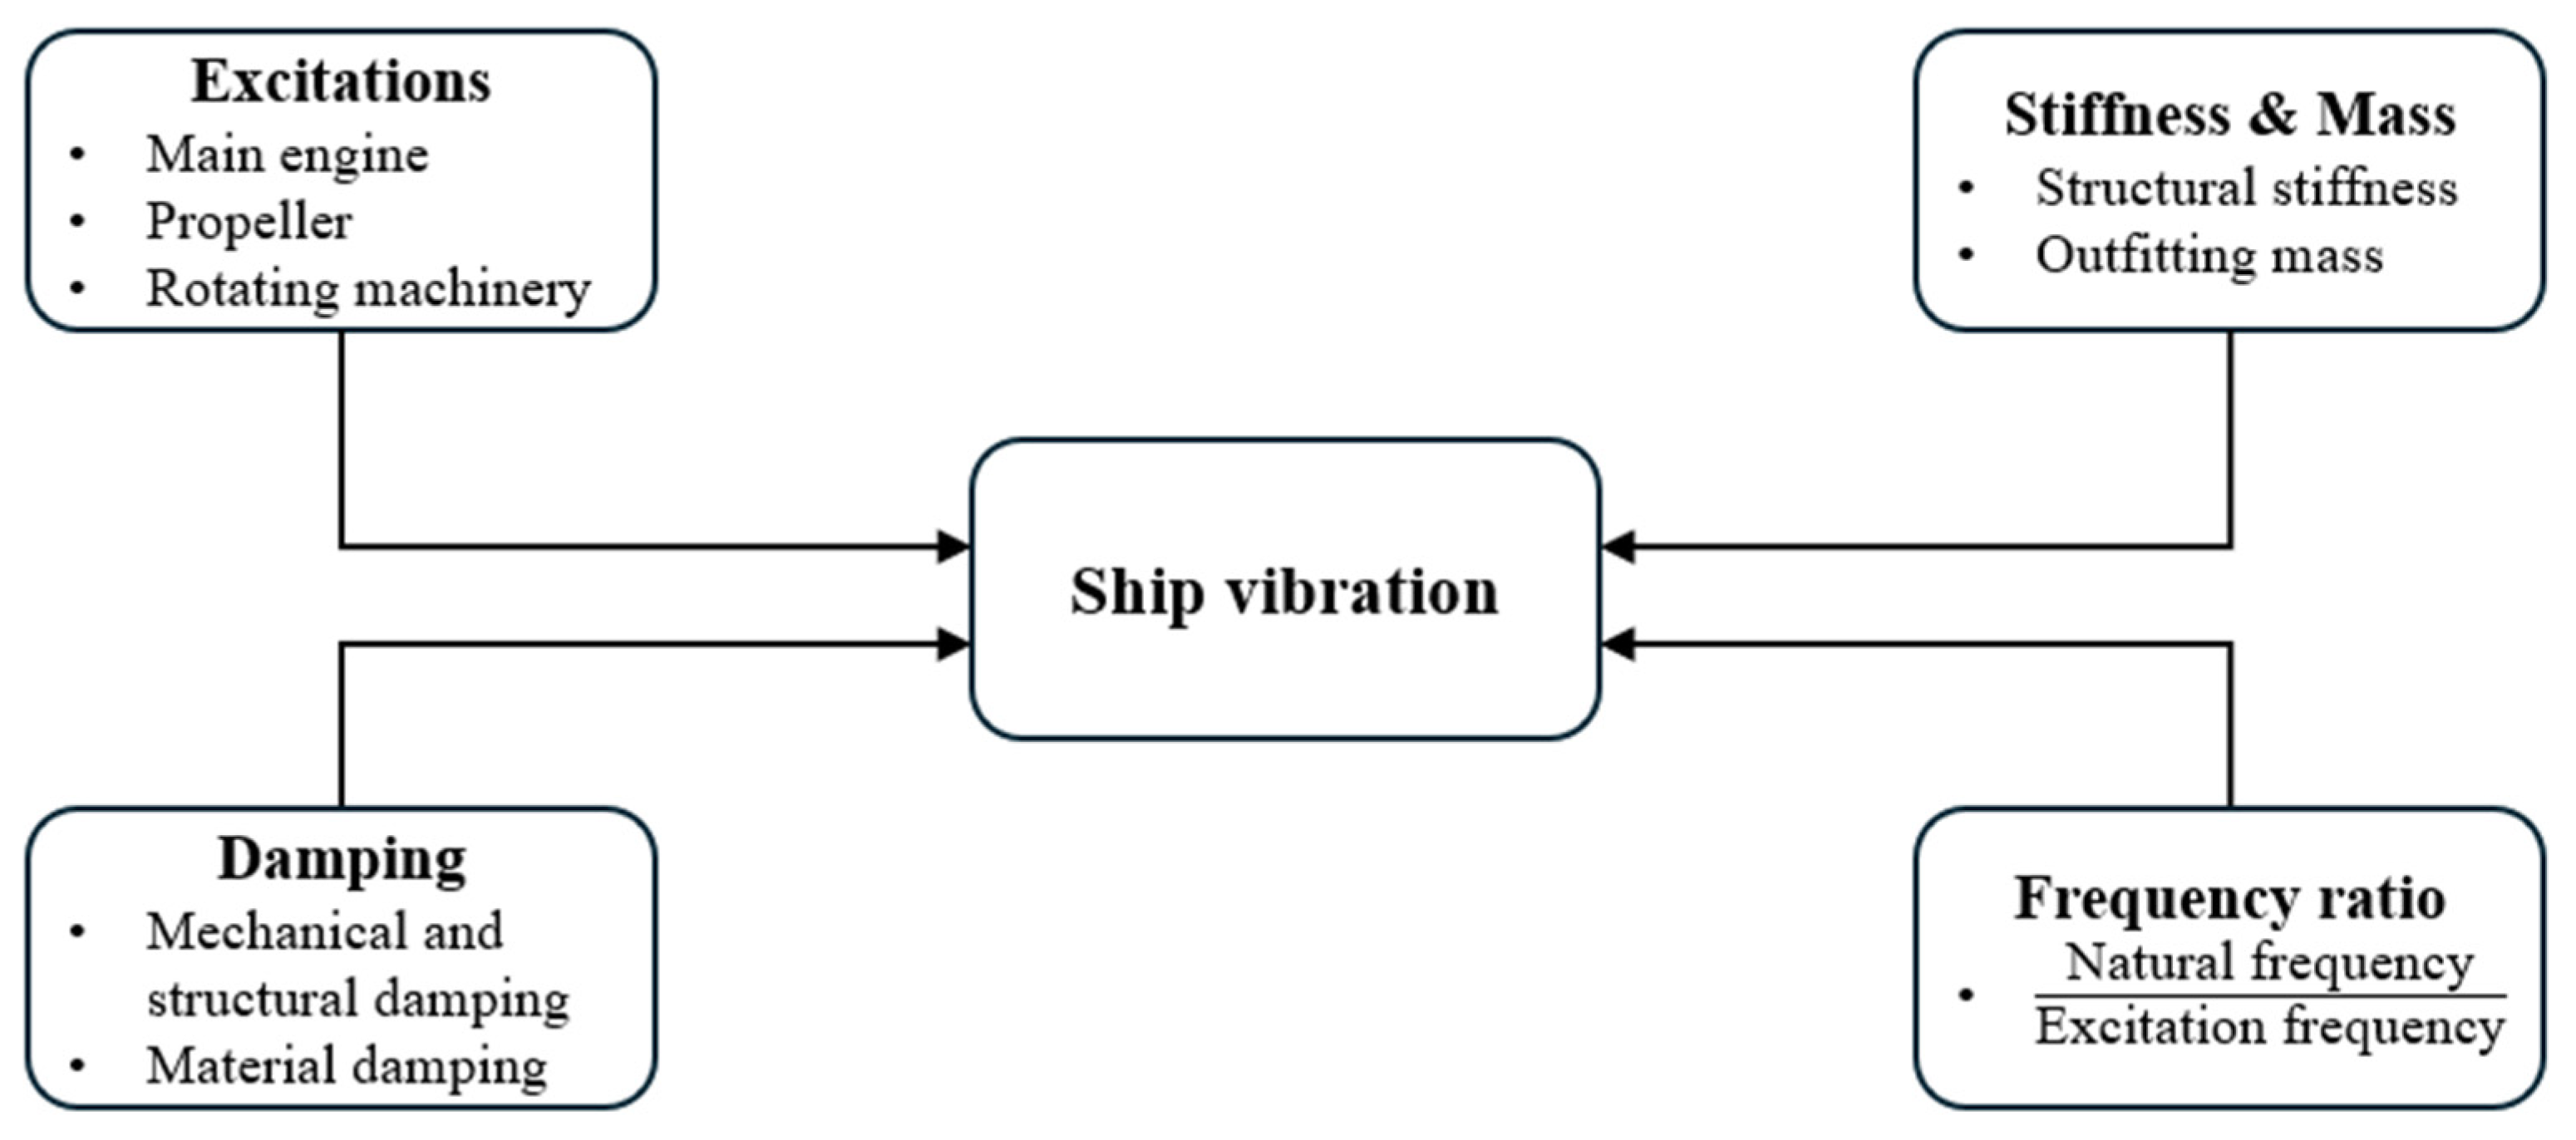
Figure 1. Key factors influencing ship vibration.
Vibration 08 00052 g001
Figure 2. Boundary condition setup, boundary condition shown by red triangle in the stiffened panel.
Vibration 08 00052 g002
Figure 3. Fundamental vibration mode contour results of stiffened panels.
Vibration 08 00052 g003
Figure 4. Artificial neural network model.
Vibration 08 00052 g004
Figure 5. Neural network workflow. The red dotted box shown the main layer for the training network.
Vibration 08 00052 g005
Figure 6. Hidden layers and neuron settings.
Vibration 08 00052 g006aVibration 08 00052 g006b
Figure 7. Loss curve results.
Vibration 08 00052 g007aVibration 08 00052 g007bVibration 08 00052 g007c
Figure 8. Regression results of prediction accuracy for entire panel model.
Vibration 08 00052 g008aVibration 08 00052 g008bVibration 08 00052 g008c
Figure 9. Regression results of prediction accuracy for engine room model.
Vibration 08 00052 g009aVibration 08 00052 g009bVibration 08 00052 g009c
Figure 10. Regression results of prediction accuracy for after peak model.
Vibration 08 00052 g010aVibration 08 00052 g010bVibration 08 00052 g010c
Figure 11. Regression results of prediction accuracy for accommodation room.
Vibration 08 00052 g011aVibration 08 00052 g011bVibration 08 00052 g011c
Figure 12. Test panel input variables at initiation.
Vibration 08 00052 g012
Figure 13. Actual vibration analysis results of random test panel.
Vibration 08 00052 g013
Figure 14. Test panel prediction results.
Vibration 08 00052 g014
Table 1. Stiffened panel distribution.
SectionNumber of Panel
Engine Room84
After Peak40
Accommodation Room32
Table 2. Types of fluid.
Fluid TypeDensity
( T o n / m m 3 )
Fresh water1.000 × 10−9
Sea water1.025 × 10−9
Urea1.335 × 10−9
Heavy fuel oil9.910 × 10−10
Low-sulfur marine gas oil8.900 × 10−10
System oil9.200 × 10−10
Cylinder oil9.600 × 10−10
Low base number cylinder oil9.200 × 10−10
Table 3. List of network model variation.
No.VariationTraining SetHidden LayersValidation Split
1ALL-Var1Entire Panel3 Hidden Layers10%
2ALL-Var3Entire Panel3 Hidden Layers15%
3ALL-Var3Entire Panel2 Hidden Layers10%
4ALL-Var4Entire Panel2 Hidden Layers15%
5ER-Var1Engine Room3 Hidden Layers10%
6ER-Var3Engine Room3 Hidden Layers15%
7ER-Var3Engine Room2 Hidden Layers10%
8ER-Var4Engine Room2 Hidden Layers15%
9AE-Var1After Peak3 Hidden Layers10%
10AE-Var3After Peak3 Hidden Layers15%
11AE-Var3After Peak2 Hidden Layers10%
12AE-Var4After Peak2 Hidden Layers15%
13ACC-Var1Accommodation3 Hidden Layers10%
14ACC-Var3Accommodation3 Hidden Layers15%
15ACC-Var3Accommodation2 Hidden Layers10%
16ACC-Var4Accommodation2 Hidden Layers15%
Table 4. Summary of ANN prediction accuracy. The green background described as model is fit and red background described as model is overfitting.
No.VariationFrequency AccuracyMass AccuracyPrediction GapModel Fitting
TrainVal.TrainVal.Freq.Mass
1ALL-Var198%95%98%96%3%2%fit
2ALL-Var397%92%97%99%5%2%
3ALL-Var395%97%95%97%2%2%
4ALL-Var498%91%97%99%7%2%
5ER-Var197%97%98%94%0%4%
6ER-Var397%94%97%94%3%3%
7ER-Var395%96%97%96%1%1%
8ER-Var498%94%98%97%4%1%
9AE-Var197%86%98%51%11%47%overfit
10AE-Var398%85%98%51%12%47%
11AE-Var397%92%98%45%5%53%
12AE-Var499%92%97%41%7%56%
13ACC-Var198%98%98%53%0%45%
14ACC-Var398%98%98%40%0%58%
15ACC-Var397%96%97%75%1%22%
16ACC-Var498%98%97%69%0%28%
Table 5. Summary of sample data prediction result. The green background described as the best case of the prediction.
PanelFrequencyMassPanelFrequencyMass
No.Act.Pred.Act.Pred.No.Act.Pred.Act.Pred.
121.620.13.02.77938.641.12.42.4
221.620.13.02.78020.820.36.46.1
310.111.24.63.98132.233.84.64.1
411.013.13.22.98241.340.95.75.7
513.513.34.74.48325.326.34.34.1
618.318.41.21.38420.620.36.36.0
734.034.21.61.48517.016.16.35.4
831.529.81.41.28617.716.86.35.6
915.714.85.44.68721.120.73.52.9
1029.629.82.11.98823.021.33.02.8
1114.911.93.44.48928.629.43.02.7
1214.415.42.62.49020.519.33.43.1
1321.420.510.310.69125.122.12.22.2
1431.132.52.72.49216.615.55.75.0
1522.121.13.12.89316.615.55.75.0
1614.814.23.13.29419.017.62.92.7
1714.213.83.13.39538.732.00.90.9
1814.213.83.13.39619.018.26.76.1
1929.524.11.11.19741.041.44.44.5
2032.329.71.51.39824.320.92.01.9
2118.118.11.11.39928.329.24.34.2
2212.312.24.34.110044.447.63.03.1
2316.214.76.26.010128.529.24.34.3
2413.813.33.73.710246.143.84.95.5
2520.919.52.22.110321.419.71.61.5
2621.719.91.91.710433.134.04.94.3
2721.721.05.55.310535.337.02.32.0
2811.911.24.24.310659.454.11.41.9
2919.518.76.15.810729.128.72.32.0
3013.814.53.32.910821.118.83.73.9
3120.219.20.70.910927.627.42.82.6
3215.615.82.92.711017.717.42.01.9
3313.113.33.53.111132.430.61.71.5
347.710.54.03.811231.728.31.41.4
3523.321.22.22.011343.447.02.93.0
3614.213.44.24.111426.525.94.65.0
3716.114.84.84.711528.730.63.43.2
387.89.94.74.211645.946.44.14.2
3911.511.55.14.711717.617.72.72.3
4012.712.16.85.511820.620.04.23.8
4117.418.11.21.311952.050.12.93.4
4235.037.43.83.412019.818.03.13.0
438.210.64.03.812126.026.02.92.5
4413.313.33.83.712212.413.73.02.7
457.79.06.55.612322.020.43.23.0
4617.415.93.93.512425.926.03.02.8
4711.611.86.95.812522.620.31.51.5
487.69.511.610.912618.114.84.44.6
4912.511.99.28.812718.815.63.43.7
5018.917.94.74.212824.222.32.52.4
5143.544.24.94.812923.321.24.75.2
5219.418.44.74.213024.622.32.32.3
5315.615.17.67.013148.148.01.61.9
5437.738.15.45.513239.138.71.91.8
5522.922.75.95.713313.313.711.611.4
5614.914.27.66.913428.426.48.17.7
5721.521.112.612.513524.123.714.613.2
5840.039.45.86.013623.924.13.22.8
5945.142.710.611.613714.714.817.017.2
6011.012.312.110.913814.820.60.40.4
6152.851.76.67.813919.718.61.31.5
6214.313.96.55.214021.720.31.51.4
63.41.542.54.04.414123.821.92.01.9
64.11.512.411.110.314215.217.71.41.4
6537.833.811.412.214324.321.81.71.6
6631.628.811.512.314439.537.61.31.1
6715.914.74.04.014514.015.22.22.3
6818.517.27.47.414622.119.71.51.6
6931.428.215.315.714711.814.72.22.3
7015.914.84.44.314821.921.80.50.4
718.38.48.67.914925.221.60.70.7
7220.520.15.95.715021.520.20.80.9
7325.425.815.515.515125.823.00.40.2
7429.132.33.22.815220.820.01.41.4
7527.929.93.83.615328.225.91.51.4
7630.427.21.71.815428.429.93.13.1
7718.917.06.56.315536.533.61.11.0
7843.142.35.86.015643.644.22.32.7
Table 6. Case study results. The green background described as the accuracy value are comply because exceed the validation value.
Panel TypeFrequencyMassMarginAccuracy
Act.Pred.Act.Pred.Freq.MassFreq.Mass
Original panel41.340.95.75.70.97%0%99.03%100%
Test panel37.338.55.65.43.22%3.57%96.78%96.48%
ALL-Var1 (validation set accuracy)95%96%
Disclaimer/Publisher’s Note: The statements, opinions and data contained in all publications are solely those of the individual author(s) and contributor(s) and not of MDPI and/or the editor(s). MDPI and/or the editor(s) disclaim responsibility for any injury to people or property resulting from any ideas, methods, instructions or products referred to in the content.