Article

Research on the Tensile-Bending Dynamic Response of the Half-Through Arch Bridge Short Suspender Considering Vehicle-Bridge Coupling Vibration

1
State Key Laboratory of Mountain Bridge and Tunnel Engineering, Chongqing Jiaotong University, Chongqing 400074, China
2
School of Civil Engineering, Chongqing Jiaotong University, Chongqing 400074, China
*
Author to whom correspondence should be addressed.
Vibration 2025, 8(3), 51; https://doi.org/10.3390/vibration8030051
Submission received: 7 July 2025 / Revised: 1 September 2025 / Accepted: 3 September 2025 / Published: 4 September 2025

Abstract

The half-through arch bridge short suspender is more prone to damage due to its high linear stiffness and special force characteristics. To analyze the vehicle-induced vibration characteristics of the short suspender during service, a half-through arch bridge finite element model and a three-axis vehicle model were established to realize the coupled vibration of the suspender axle under bridge deck unevenness excitation. The suspender was simulated using LINK element and BEAM element and separated along its axial and radial directions, and its tension-bending response characteristics was studied. The study found that the short suspender’s amplitude and frequency are higher than those of the long suspender as vehicle critical duration increases. Influenced by the tensile bending effect, the vibration, cross-section equivalent force amplitude, and impact coefficient at the anchorage end are larger than those at the center, and the lower anchorage end’s cross-section peak stress is biased towards the direction of the side column. The internal force of the short suspender is consistent with the deformation trend; its internal force coincides with the deformation trend; and its axial alternating load is generated by the axial relative deformation between the arch rib and the bridge deck, while the bending alternating load originates from the rotational deformation of the short suspender.

1. Introduction

Through and half-through arch bridges are widely used in municipal transportation infrastructure due to their elegant structural form, reduced construction height, and minimized approach span scale. As direct support for the bridge superstructure, suspenders are critical to operational safety. With the rapid expansion of China’s highway network, vehicle traffic density has significantly increased. When vehicles traverse the bridge, coupled vibrations inevitably reduce the residual strength of suspenders [1].
To clarify the dynamic characteristics of suspenders under vehicle-induced vibration, bridge engineers have investigated the vehicle-induced vibration response of suspenders in through and half-through arch bridges. Yan Li et al. [2], focusing on concrete-filled steel tube (CFST) arch bridges, analyzed the effects of bridge deck unevenness, vehicle speed, and structural damping on the impact effect of suspender internal forces. They concluded that structural damping has a negligible influence on vehicle-induced impacts, whereas deck unevenness critically exacerbates the impact effect. This aligns with the theoretical and experimental findings of Zhigang Yan et al. [3] regarding the dynamic impact effect in half-through concrete-filled steel tube arch bridge suspenders. Malm et al. [4] demonstrated that most variable amplitude cyclic stresses in railway arch bridge suspenders originate from vehiclevehicle-bridge coupled vibration, emphasizing that accurate suspender stress analysis requires coupled vibration simulation. Using microwave radar measurements and computational modeling, Zhihui Zhu et al. [5] quantified how suspender length variations and deck deterioration amplify impact effects under train loads. Huang et al. [6] examined the dynamic characteristics and impact effects of half-through concrete-filled steel tube arch bridge components under external excitation. Compared to long suspenders, short suspenders—located at main beam-column junctions—exhibit higher linear stiffness and natural frequencies, making them more susceptible to fatigue damage during vehicle passage due to high-frequency vibrations [7]. Jinsong Zhu et al. [8] established that short suspenders are most sensitive to external excitation variations, with side-span suspenders experiencing greater vehicle impacts [9]. Kaiyin Zhang et al. [10] developed an axial vibration model for suspenders, simulated vehicle excitation via MIDAS, and confirmed higher natural frequencies and intensified vibrations in shorter suspenders. Qingkai Kong [11] and Zhiqiang Yao [12], analyzing the Yibin South Gate Bridge collapse, attributed premature short suspender fracture to the corrosion-fatigue synergy under traffic flow, leading to beam collapse. Hongye Gou et al. [13] solved the dynamic response of the tied-arch bridge through train axle coupling analysis and evaluated the comfort of the train. Jianhong Huo et al. [14] used a reduced scale model of a landscape half-through arch bridge for a broken-line simulation test. Their study examined the derrick regularity of dynamic response under different failure mode.
Current research incorporates multi-factor coupling of vehiclevehicle-bridge interaction, enabling more accurate calculation of the dynamic response of bridge components to vehicle loads [15]. In simulation analysis, cable structures such as stay cables, main cables and suspensers are usually considered as rod elements. However, given the high linear stiffness of short suspenders, their anchorage ends experience constrained rotation, leading to a significant tension-bending effect at these locations [16]. Studies specifically addressing the tension-bending response characteristics of short suspenders remain scarce. This research establishes a vehiclevehicle-bridge coupled model accounting for bridge deck unevenness, analyzes the internal force distribution and tension-bending deformation relationship of short suspenders under vehicle-induced vibration, and provides a reference for the dynamic characteristics and durability design of suspenders in similar bridges.

2. Vehicle-Bridge Coupled Vibration Model

2.1. Half-Through Arch Bridge Model

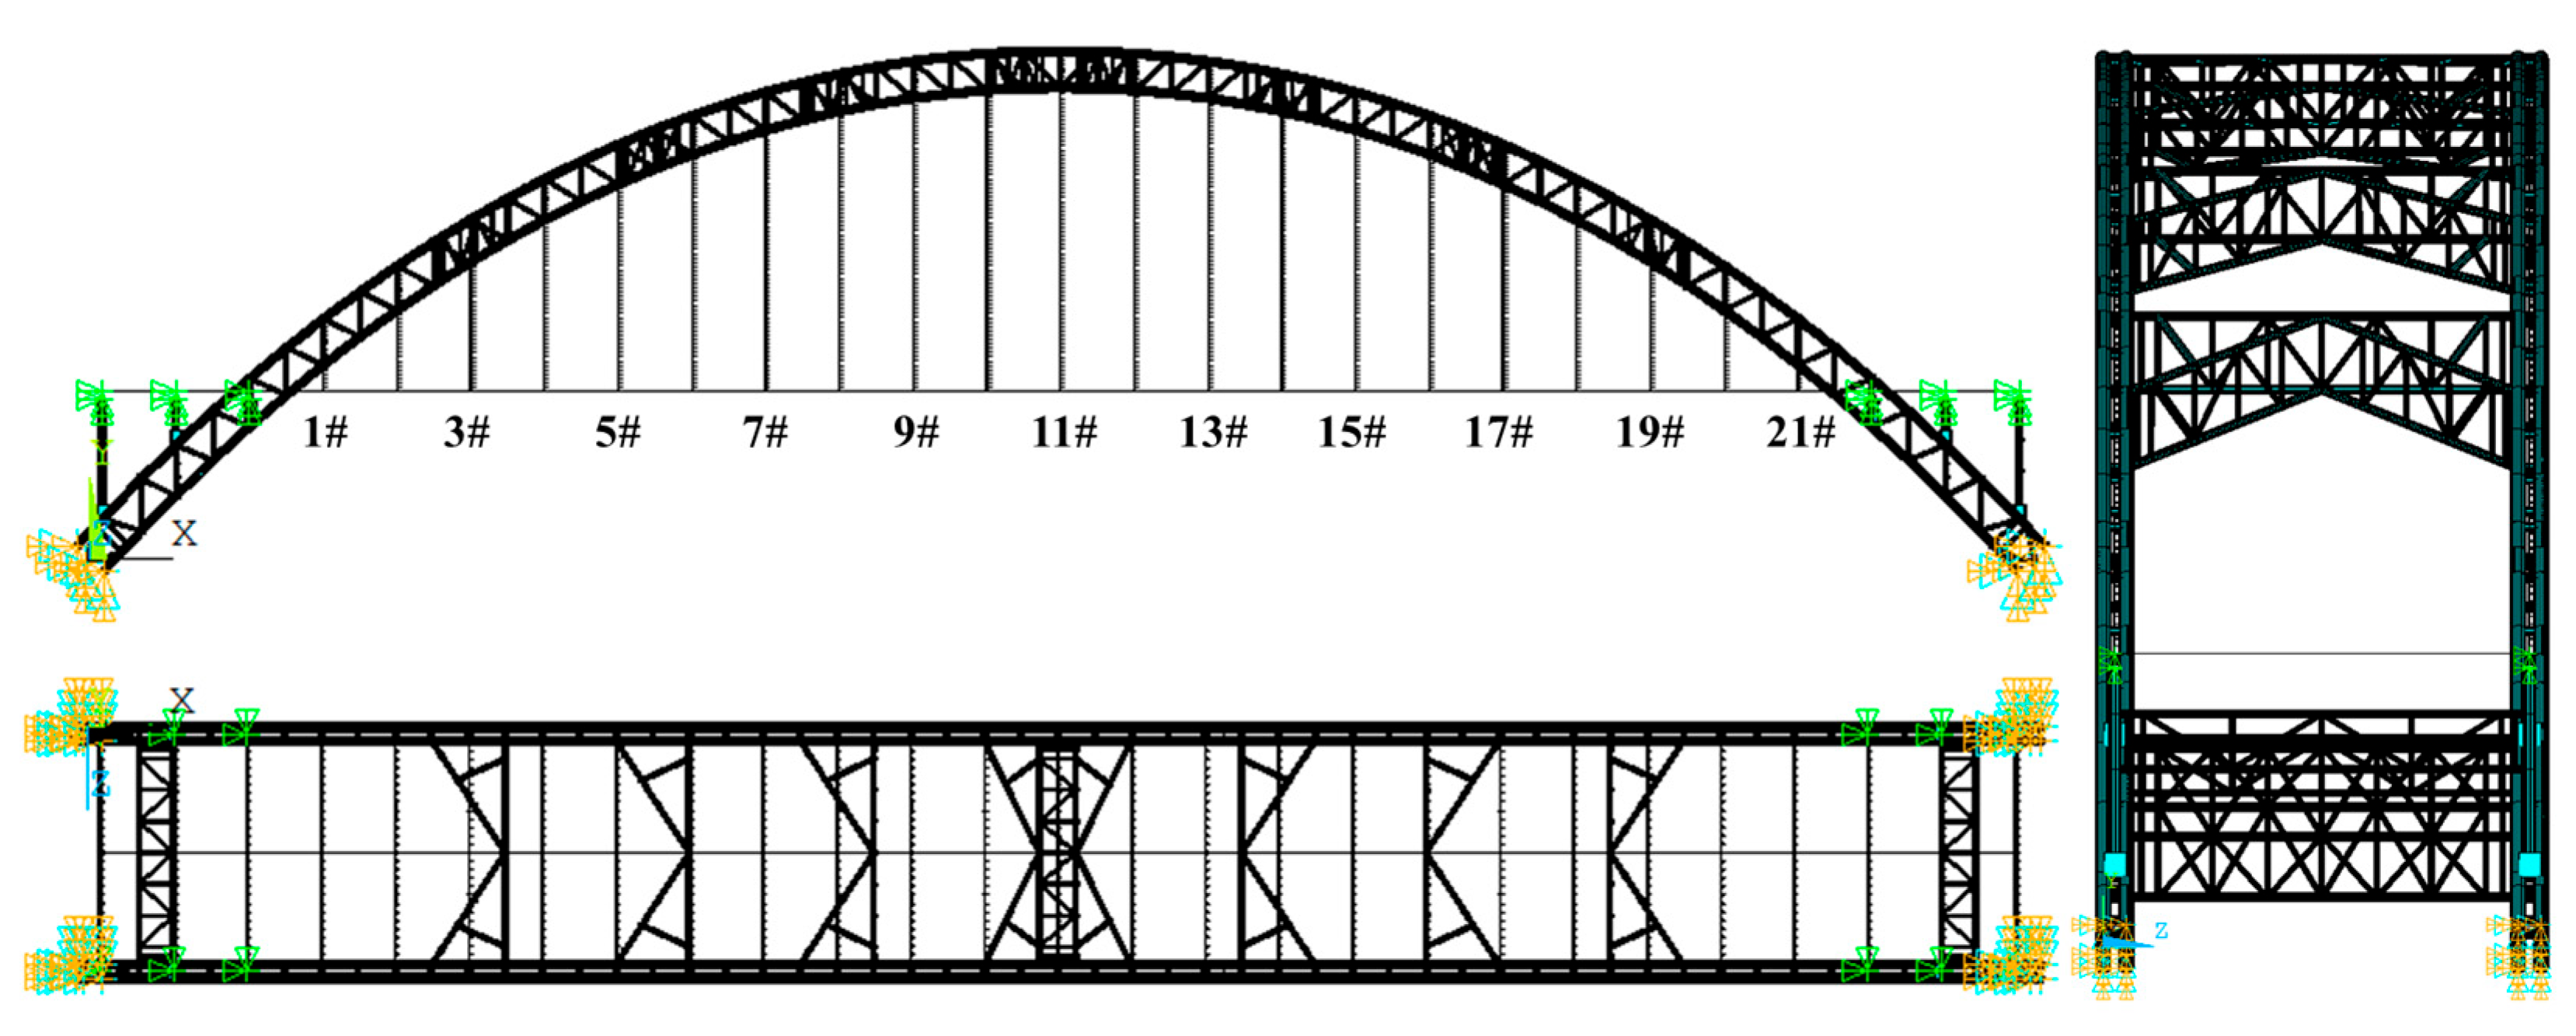
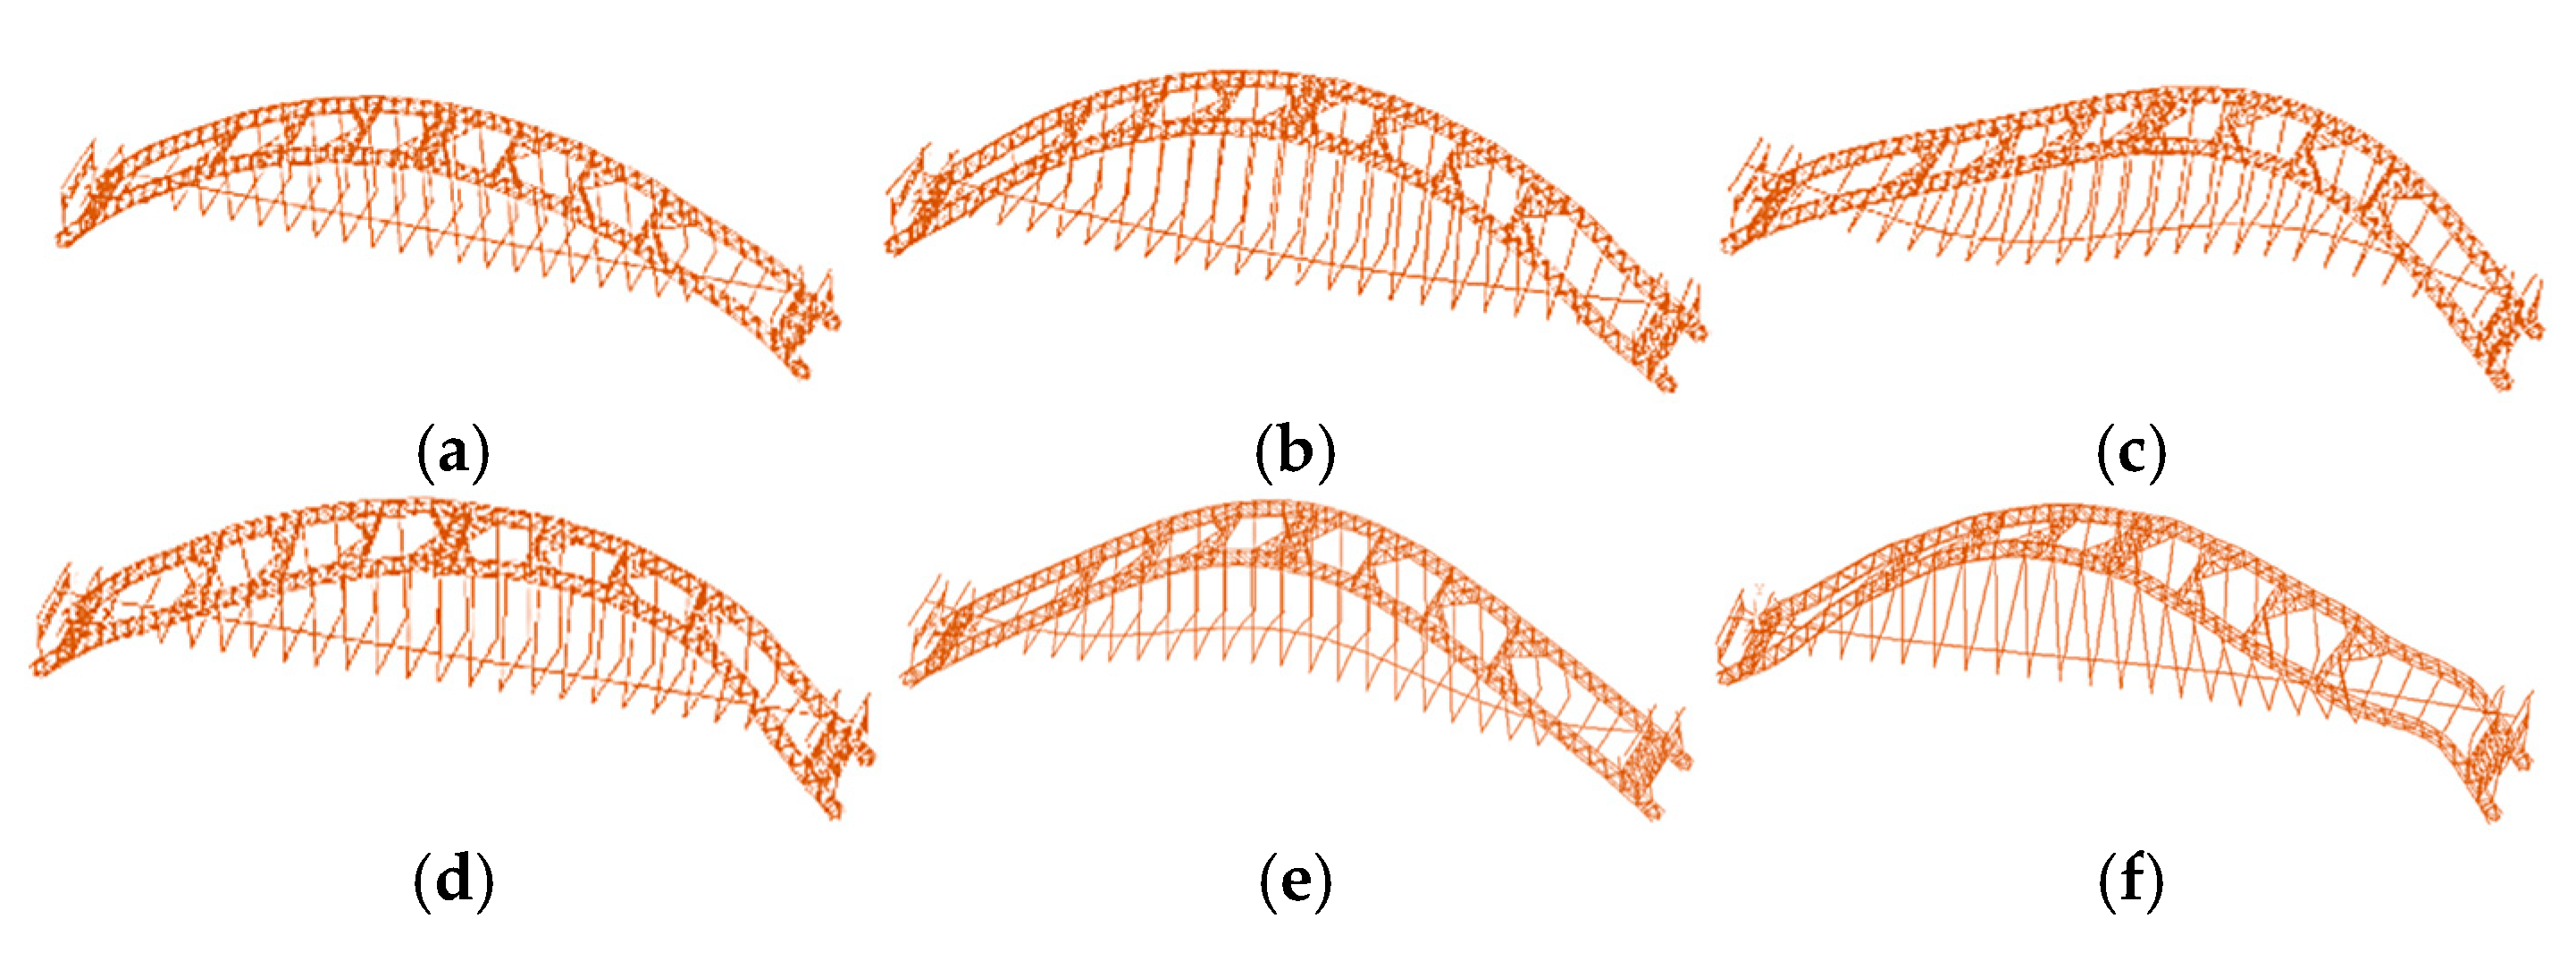
The study focuses on the Jiangkai River extra-large span CFST half-through arch bridge, with a main span of 221 m. Its upper structure comprises concrete-filled steel tube arch ribs, transverse bracing, bridge deck system beams, deck panels, suspenders, and auxiliary connections. The bridge deck adopts a composite I-girder configuration and contains 21 pairs of parallel suspenders spaced at 8.5 m intervals along the longitudinal direction. The half-through arch bridge is considered as the fishbone beam model, ANSYS 2025 R1 (25.1) finite element model used BEAM188 element for arch ribs via the dual-element method, the crossbeams and longitudinal beams of the bridge road beams are made of I-beams, and the cross-sectional equivalent steel-concrete composite system is adopted, which is established using BEAM44 elements fishbone model [17]. Suspenders were modeled with LINK180 and BEAM188 element. Anchorage ends were rigidly coupled to arch ribs/transverse bracing and transverse girders. The longitudinal beam end of the bridge beam is set as the sliding constraint, and the two arch ribs and four arch feet are treated according to the full constraint. The actual half-through arch bridge is shown in Figure 1, and the bridge finite element model is shown in Figure 2. Through modal analysis, it can be known that the first six natural frequencies of the middle-supported arch bridge are distributed from 0.343 Hz~1.346 Hz, and the period distribution corresponding to each natural frequency is from 2.915 s~0.743 s. According to the specification, the design impact coefficient for suspenders is 0.05 [18]. Due to its own structural characteristics, the high natural frequency makes the special components of the bridge have a higher impact than the specification under the vehicle dynamic impact. Parallel suspenders are symmetrically numbered 1#~21# from left to right, where 1# and 21# denote the shortest suspenders at both ends of the bridge. Modal analysis reveals the six natural frequencies and mode shapes in Figure 3.

2.2. Vehicles and Deck Unevenness

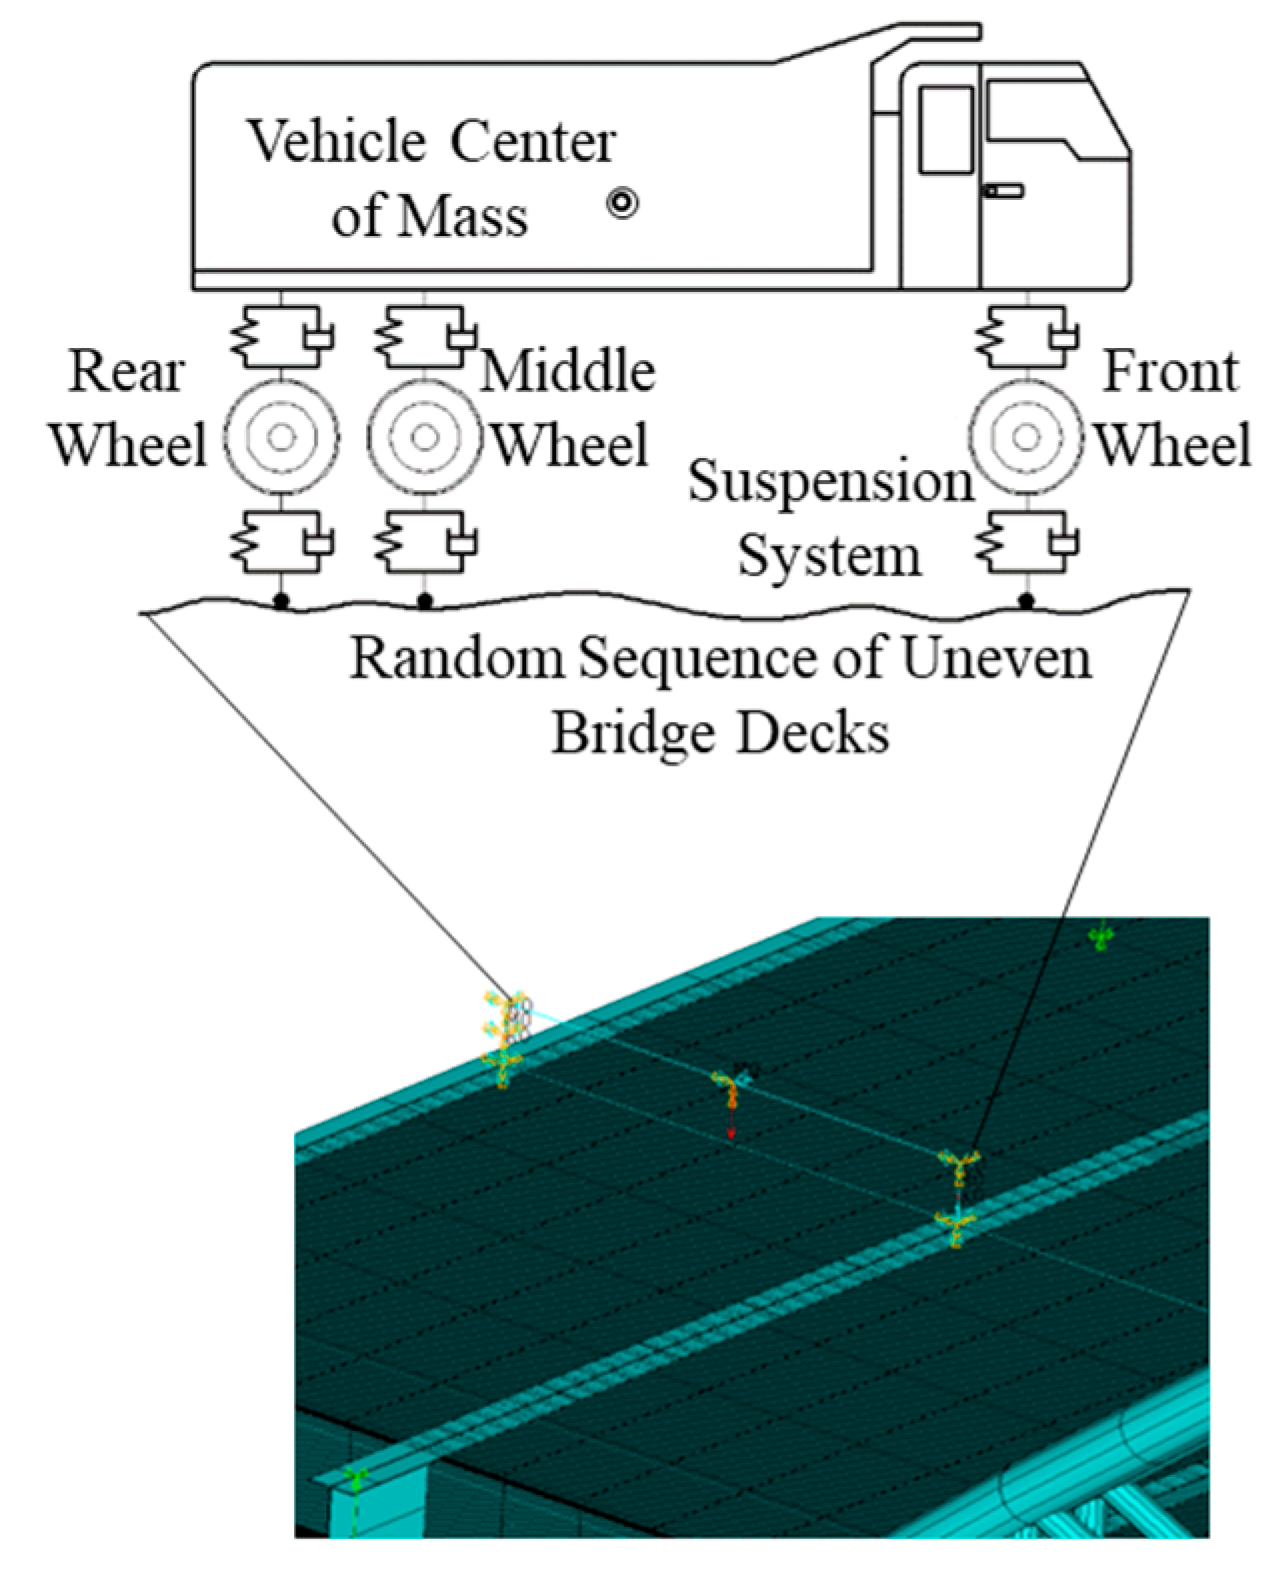
During the service period of the half-through arch bridge, heavy traffic loads, as the main type of load causing impact damage to the suspenders, not only may lead to low-cycle fatigue failure but also cause severe dynamic impact damage, and, to a certain extent, determine the suspenders’ service life. Therefore, heavy-duty truck models are selected as loading vehicles. The 5-DOF three-axle heavy truck model [19] accounted for vertical, pitching, and translational motions; the detailed construction parameters of the vehicle are shown in Table 1. MASS21 element modeled masses, COMBIN14 element simulated suspensions, and MPC184 element connected the body to suspensions [20]. The vehicle configuration is shown in Figure 4.
During bridge traversal, random bridge deck unevenness amplifies coupled vibration. Thus, vehiclevehicle-bridge coupled vibration analysis requires using the harmonic superposition method based on the road surface power spectral density; harmonic vibrations with random phase angles are linearly superimposed to generate the corresponding deck unevenness excitation, its simulation function is shown in Equations (1)–(3).
R x = k = 1 N 2 G d n k Δ n cos 2 π n k x + φ k
Δ n = n h n l N
n k = n h + k 1 Δ n
where R x is a sample of the unevenness along bridge direction. N is the number of sampling points for unevenness; G d n k is the power spectral density fitting function of the bridge deck. Δ n is the bandwidth of the spatial frequency interval; n k is the discrete spatial frequency of the power spectral density fitting function. n h and n l are, respectively, the upper and lower limits of spatial frequency; x is the coordinate along the bridge direction; φ k is a random phase angle.
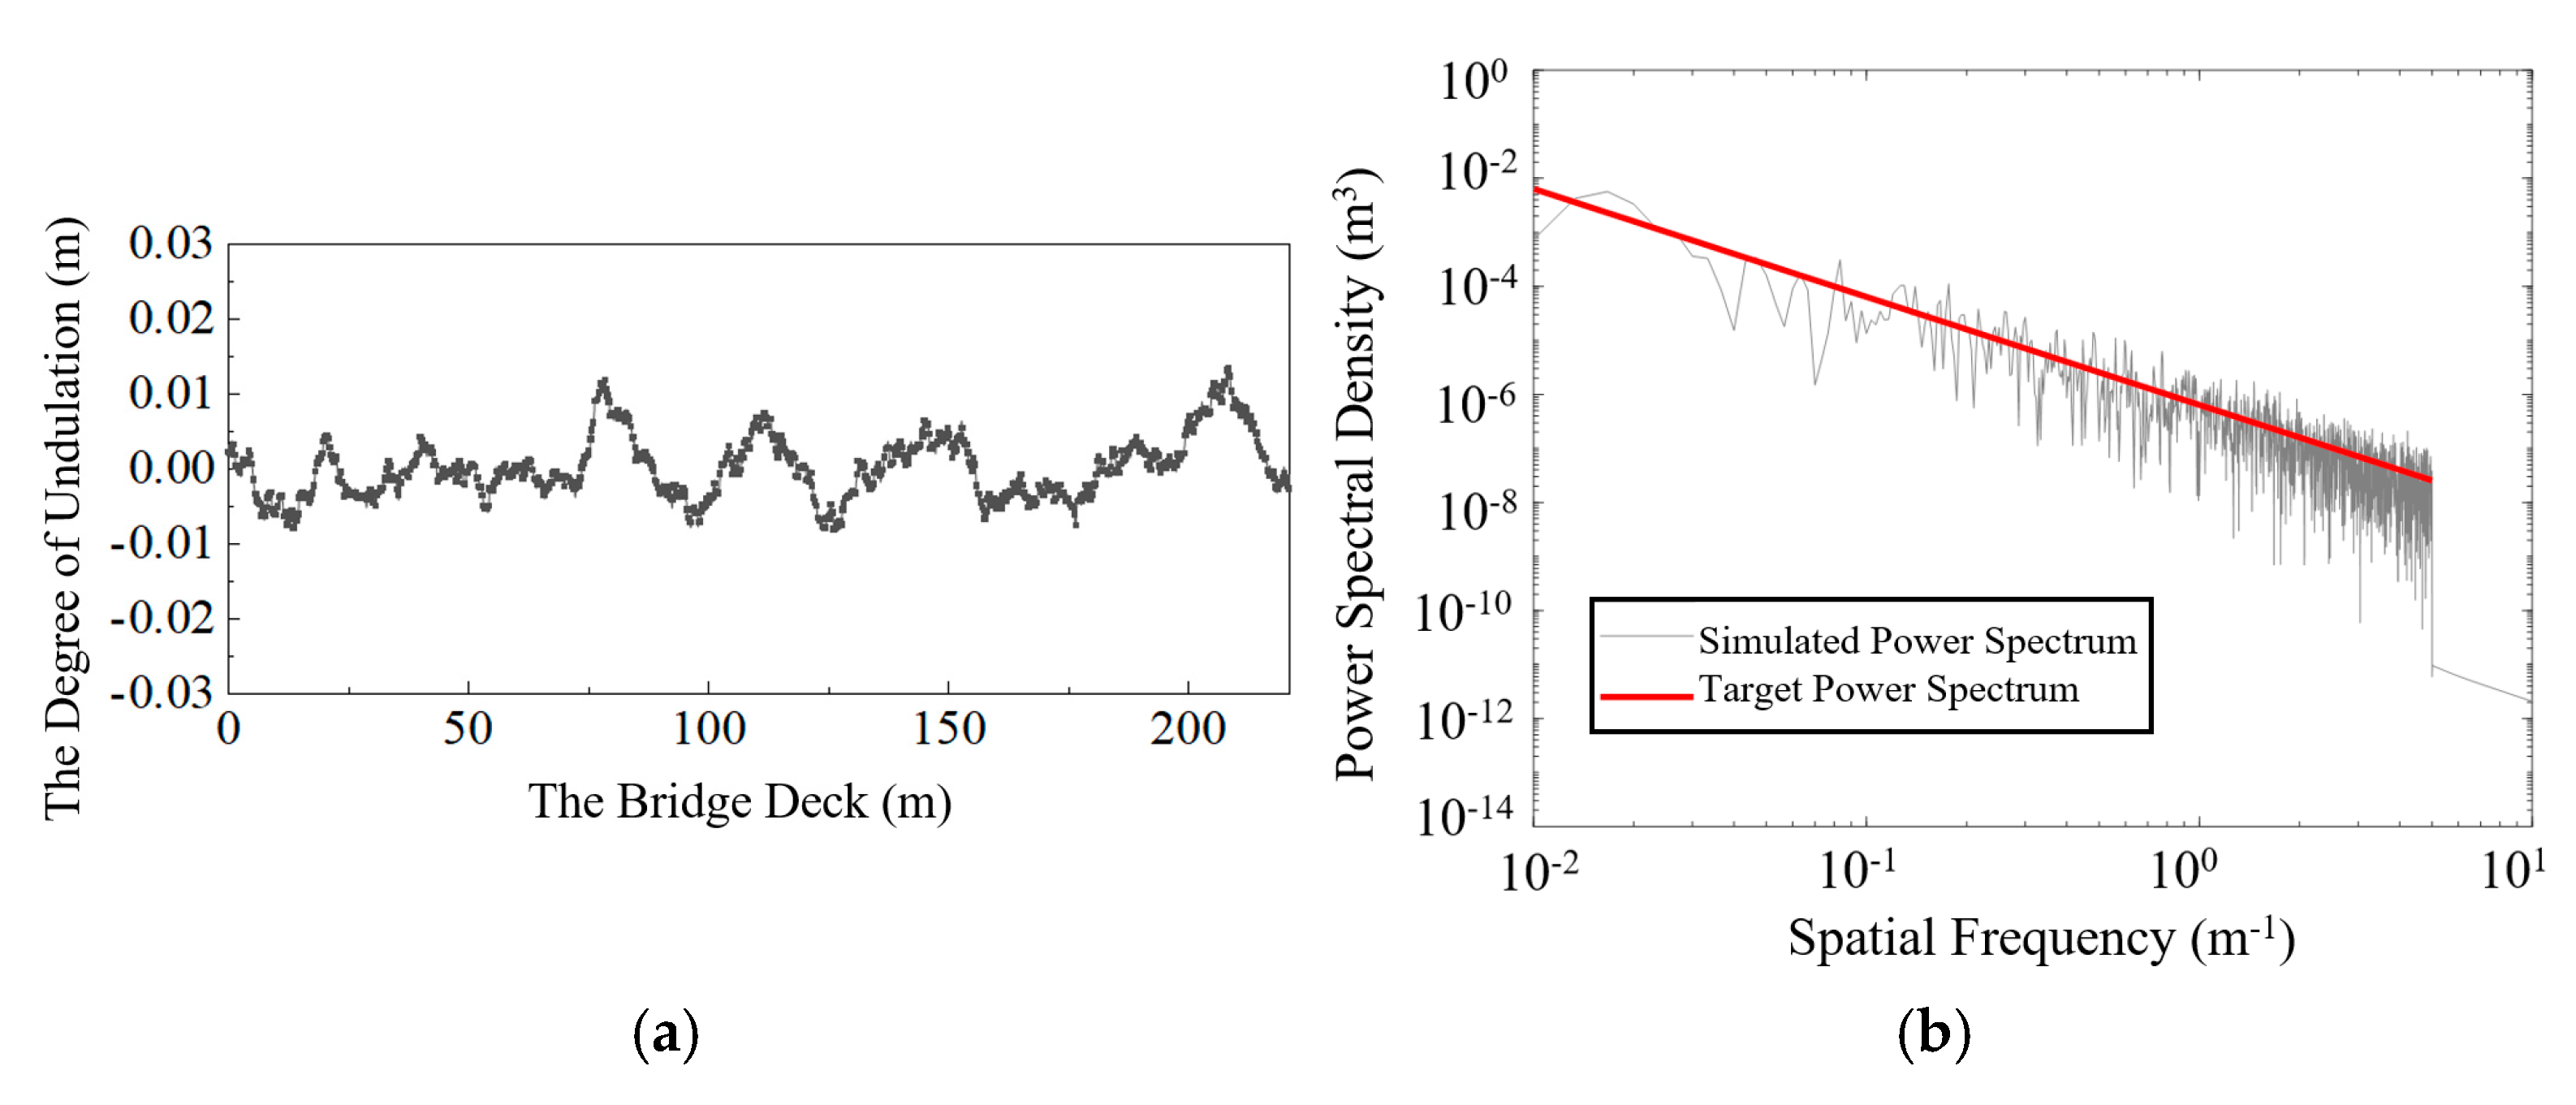
The design speed of the arch bridge is 80 km/h, and it has been in service for a certain period of time The operating conditions of the bridge were comprehensively considered, and vehicle speed was set at 70 km/h with grade B deck roughness. The unevenness sequence is shown in Figure 5, comparing simulated and target power spectra, demonstrating high consistency.
Coupled vibration constraints used the contact method [21]. The establishment of the vehicle–axle coupling vibration relationship is shown in Equation (4).
M b 0 0 M v u ¨ b u ¨ v + C b C α C β C v u ˙ b u ˙ v + K b K α K β K v u b u v = F b v F v b
where [ F b v ] and [ F v b ] are, respectively, the load vectors borne by the bridge subsystem and the vehicle subsystem under the vehiclevehicle-bridge coupling effect; [ M b ], [ M v ] are, respectively, the mass matrix of the half-through arch bridge and the vehicle; [ C b ], [ C v ] are, respectively, the damping matrix of the half-through arch bridge and the vehicle; [ K b ], [ K v ] are, respectively, the stiffness matrix of the half-through arch bridge and the vehicle; [ C α ], [ C β ] are, respectively, the damping matrix coupling terms of the dynamic equation; [ K α ], [ K β ] are, respectively, the stiffness matrix coupling terms of the dynamic equation; { u ¨ b }, { u ˙ b }, { u b } are, respectively, the acceleration vector, velocity vector and displacement vector of each node of the half-through arch bridge in all directions; { u ¨ v }, { u ˙ v }, { u v } are, respectively, the acceleration vector, velocity vector and displacement vector of each node of the vehicle in all directions.
Assuming constant vehicle speed along the bridge, wheel nodes maintain contact with bridge deck element. The displacement relationship between the vehicle wheel set and the bridge deck can be obtained as shown in Equations (5) and (6).
Y t i Y q i = R b i
X l i = X t i + V c T
where Y t i is the vertical displacement of the contact point between the vehicle wheel set and the bridge deck when driving to any position; Y q i is the vertical displacement at the corresponding contact position with the bridge deck; R b i should be the sample value of the unevenness of the bridge deck, if the bridge deck is considered as an ideal smooth bridge deck, it should be taken as 0; T is the time the vehicle has been driving; V c is the vehicle’s driving speed; X t i is the initial position of the i -th wheel set of the vehicle; X l i is the position of the i -th wheel set after the vehicle’s driving time T .
And then, CONTA175 element simulated wheel–deck contact, while CE commands formulated constraint equations as follows:
Front wheel: CE, NEQN, Rb1, L1, Uy, 1, Q1, Uy, −1;
Middle wheel: CE, NEQN, Rb2, L2, Uy, 1, Q2, Uy, −1;
Rear wheel: CE, NEQN, Rb3, L3, Uy, 1, Q3, Uy, −1;
Among them, NEQN is the constraint equation number; Rbi is the random unevenness of the deck corresponding to the wheel; Li is the node number of the wheel’s bottom; and Qi is the node number of the deck in contact with the wheel’s bottom.

2.3. Equivalent Stress of the Suspenders

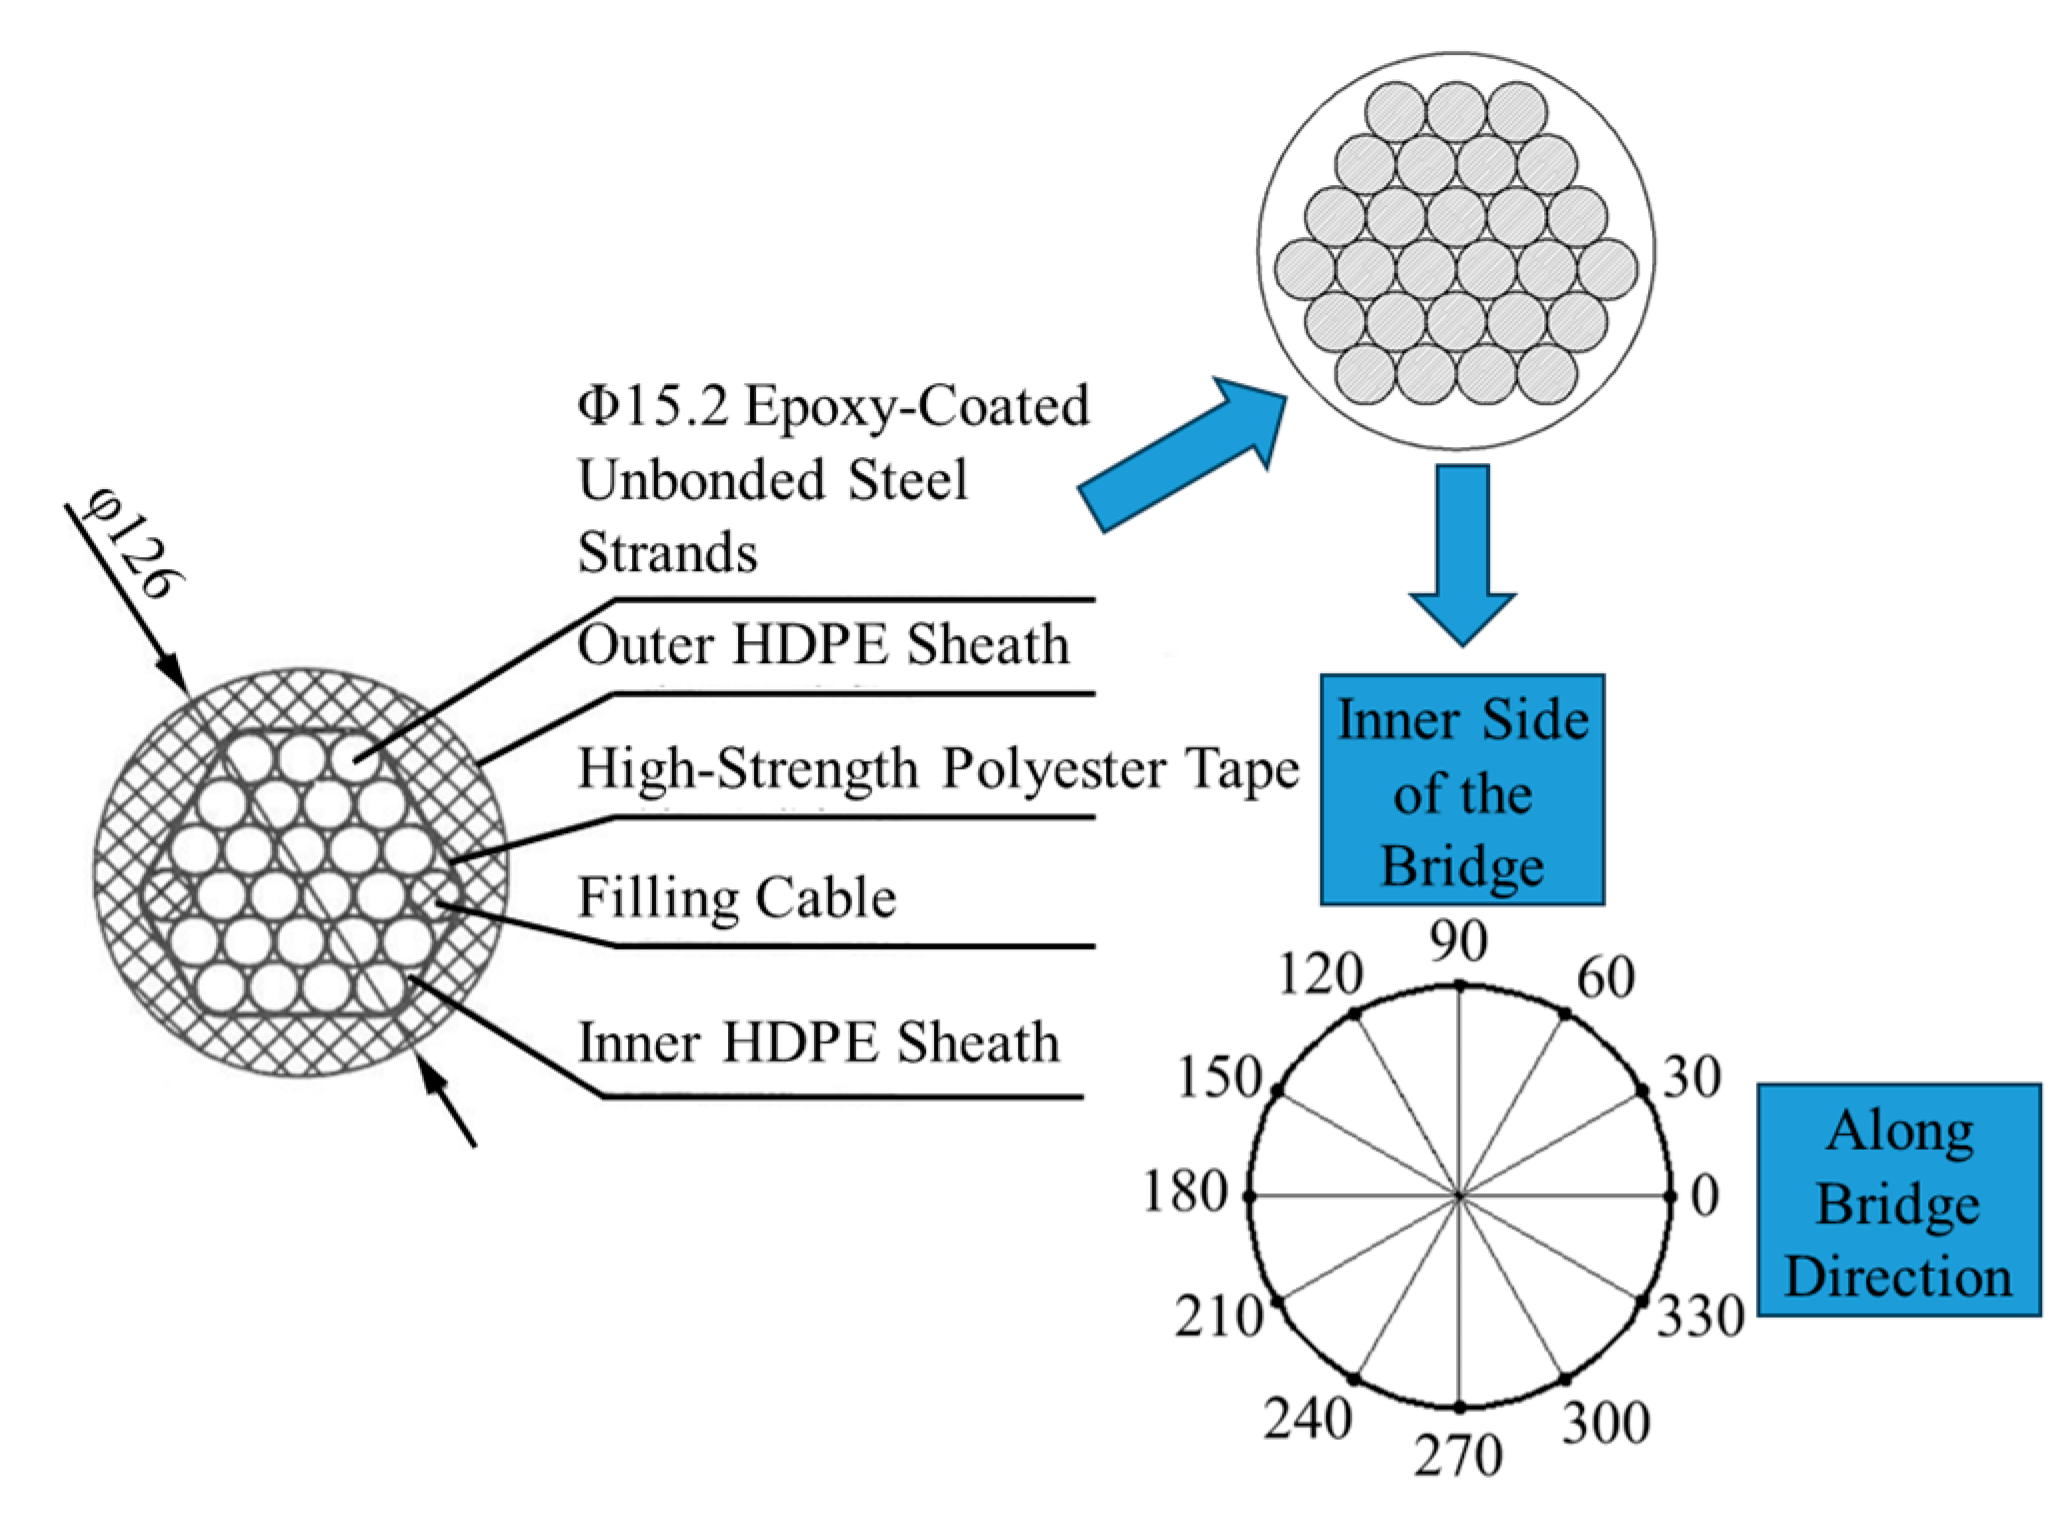
As shown in Figure 6, the suspender system comprises 27 high-strength steel strands with a diameter of 15.2 mm, arranged in a hexagonal pattern within the suspender.
The effective stress-bearing area is S = 0.0049 m2, the tensile strength design value is fpk = 1860 MPa, and the elastic modulus is E = 1.95 × 10⁵ MPa. Due to the varying stresses at different positions in the suspender cross-section under vehicle loads, the cross-section was divided into 12 equal parts at 30° intervals for subsequent research. At the same time, the short suspension rods are evenly divided into 17 BEAM element segments, with a total of 18 cross-sections including the anchoring end. Based on the suspender’s actual position in the bridge, the 90° direction is the inner side of the bridge, and the 0° direction is the vehicle driving direction. Using elementary beam theory, the axial and bending stresses in any direction of the cross-section were combined into equivalent stress [22].

3. Dynamic Responses of Suspenders Under Different Simulation Methods

3.1. Vibration Time-History Characteristics of the Anchorage End

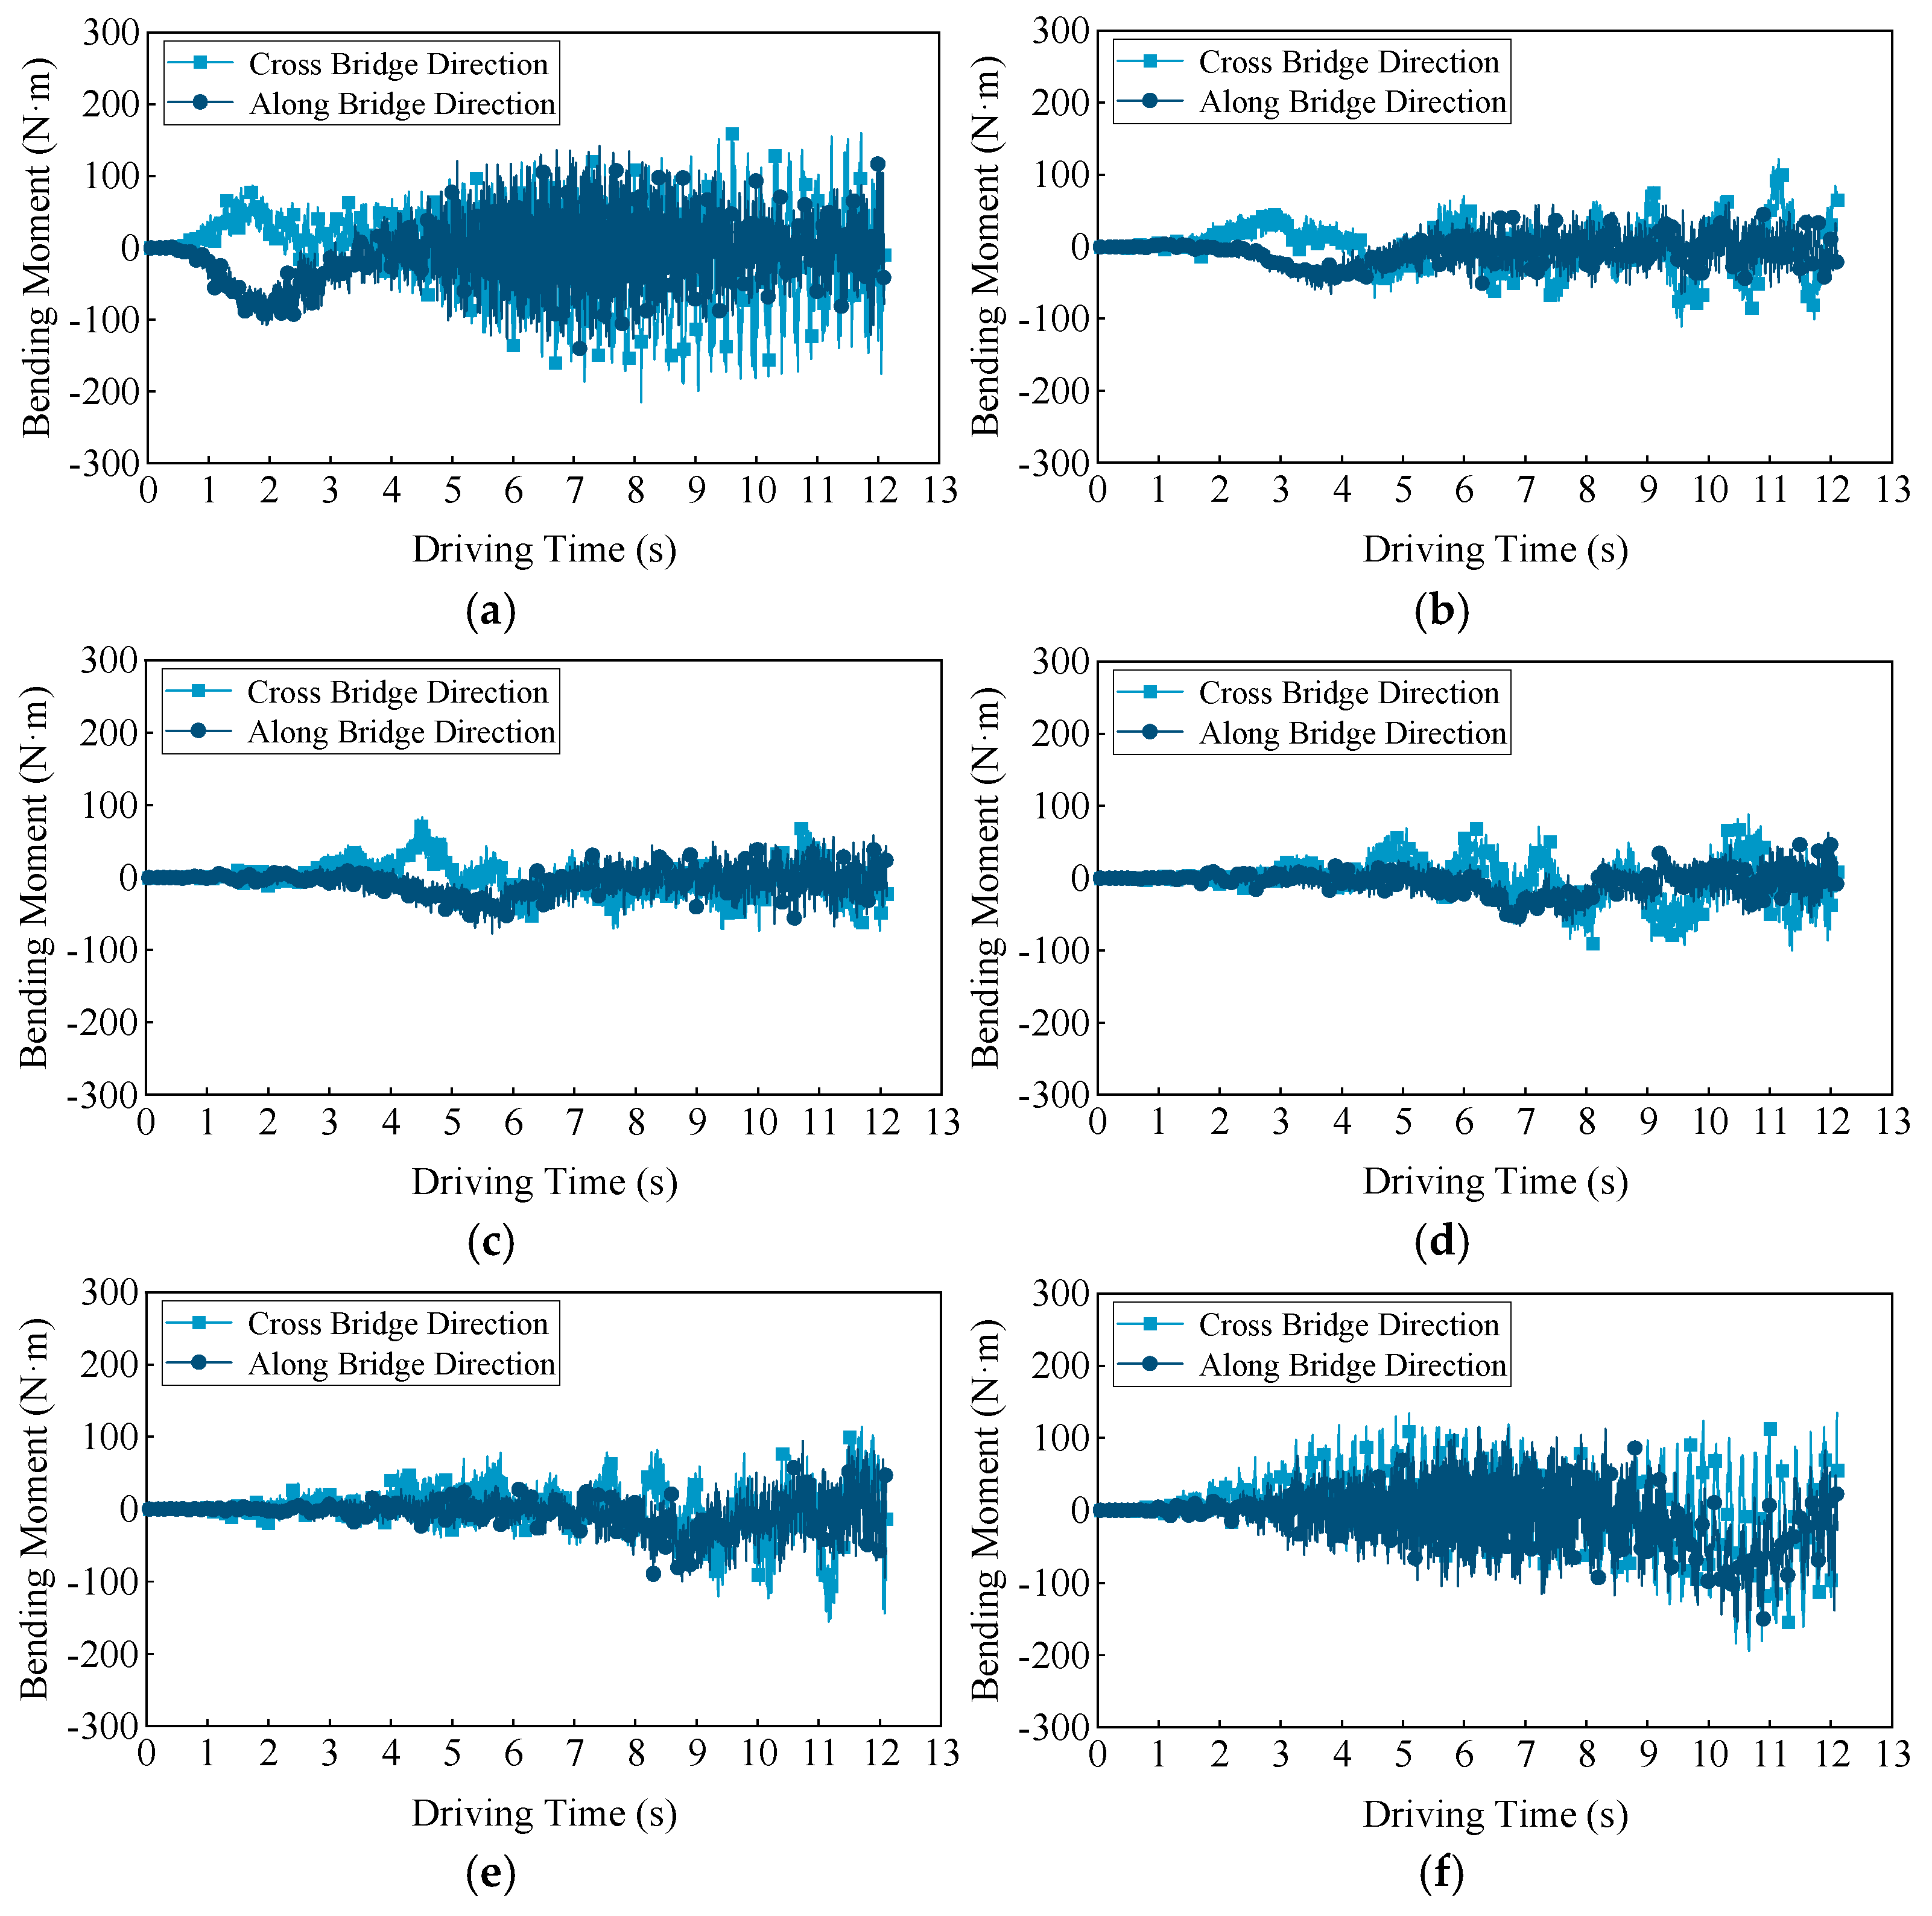
Vehicles traversed the bridge along the deck centerline, entering/exiting via suspenders 1# and 21#. LINK element cannot transfer moments, and the rotational degrees of freedom of suspender ends are automatically released. When simulating suspenders with LINK element, the axial force distribution is uniform. BEAM element is fully constrained with the deck system. When simulating suspenders with BEAM element, both axial force and bending moment exist. For illustration, Figure 7 shows the moment time history at the lower anchorage end of a typical BEAM element suspender when a vehicle crosses the bridge.
As the suspender length increases, the moment in the longer mid-span suspenders decreases both transversely and longitudinally. As vehicle driving time increases and vehiclevehicle-bridge vibration responds more fully, the moment time history of the suspenders 1# and 21# has higher frequency and amplitude than that of the long suspenders, indicating more severe vibration.
The comparative analysis was conducted on the axial stress time histories at the lower anchorage ends between suspenders modeled with LINK element and short suspenders modeled with BEAM element, where the latter incorporated the mathematical combination of bending moments and axial forces, as illustrated in Figure 8. The equivalent stress peaks of suspenders 1# and 21# modeled with BEAM element exceeded those of their LINK element-modeled counterparts by 2.29 MPa and 3.62 MPa, respectively, accompanied by significant increases in both stress amplitude and frequency. During the free vibration phases prior to the vehicle’s arrival and after its traversal of the short suspenders, the maximum amplitude of vehicle-induced stress responses in the short suspenders modeled with BEAM element was nearly twice that of those modeled with LINK element. Additionally, the mean stress level of suspender 21# was higher than that of suspender 1#, which can be attributed to the directional effects of vehicle-induced bridge excitation [23].

3.2. Cross-Sectional Stress Distribution of the Short Suspender

The 8.3 m-long short suspender was discretized into 17 segments, resulting in 18 cross-sections that include both the upper and lower anchorage ends. Under multi-axial stress states, equivalent stress distributions were reconstructed by mathematically combining the bending moments and axial forces at each cross-section. This approach further describes the distribution characteristics of equivalent stress along the axial direction of the short suspender and uses the extremum of the cross-sectional peak stress history in any direction to define the cross-sectional stress non-uniformity coefficient as shown in Equation (7).
R = σ m a x σ m i n σ m i n
where R is, respectively, the non-uniformity coefficient; σ m a x is the maximum value of the cross-sectional peak stress; σ m i n is the minimum value of the cross-sectional peak stress.
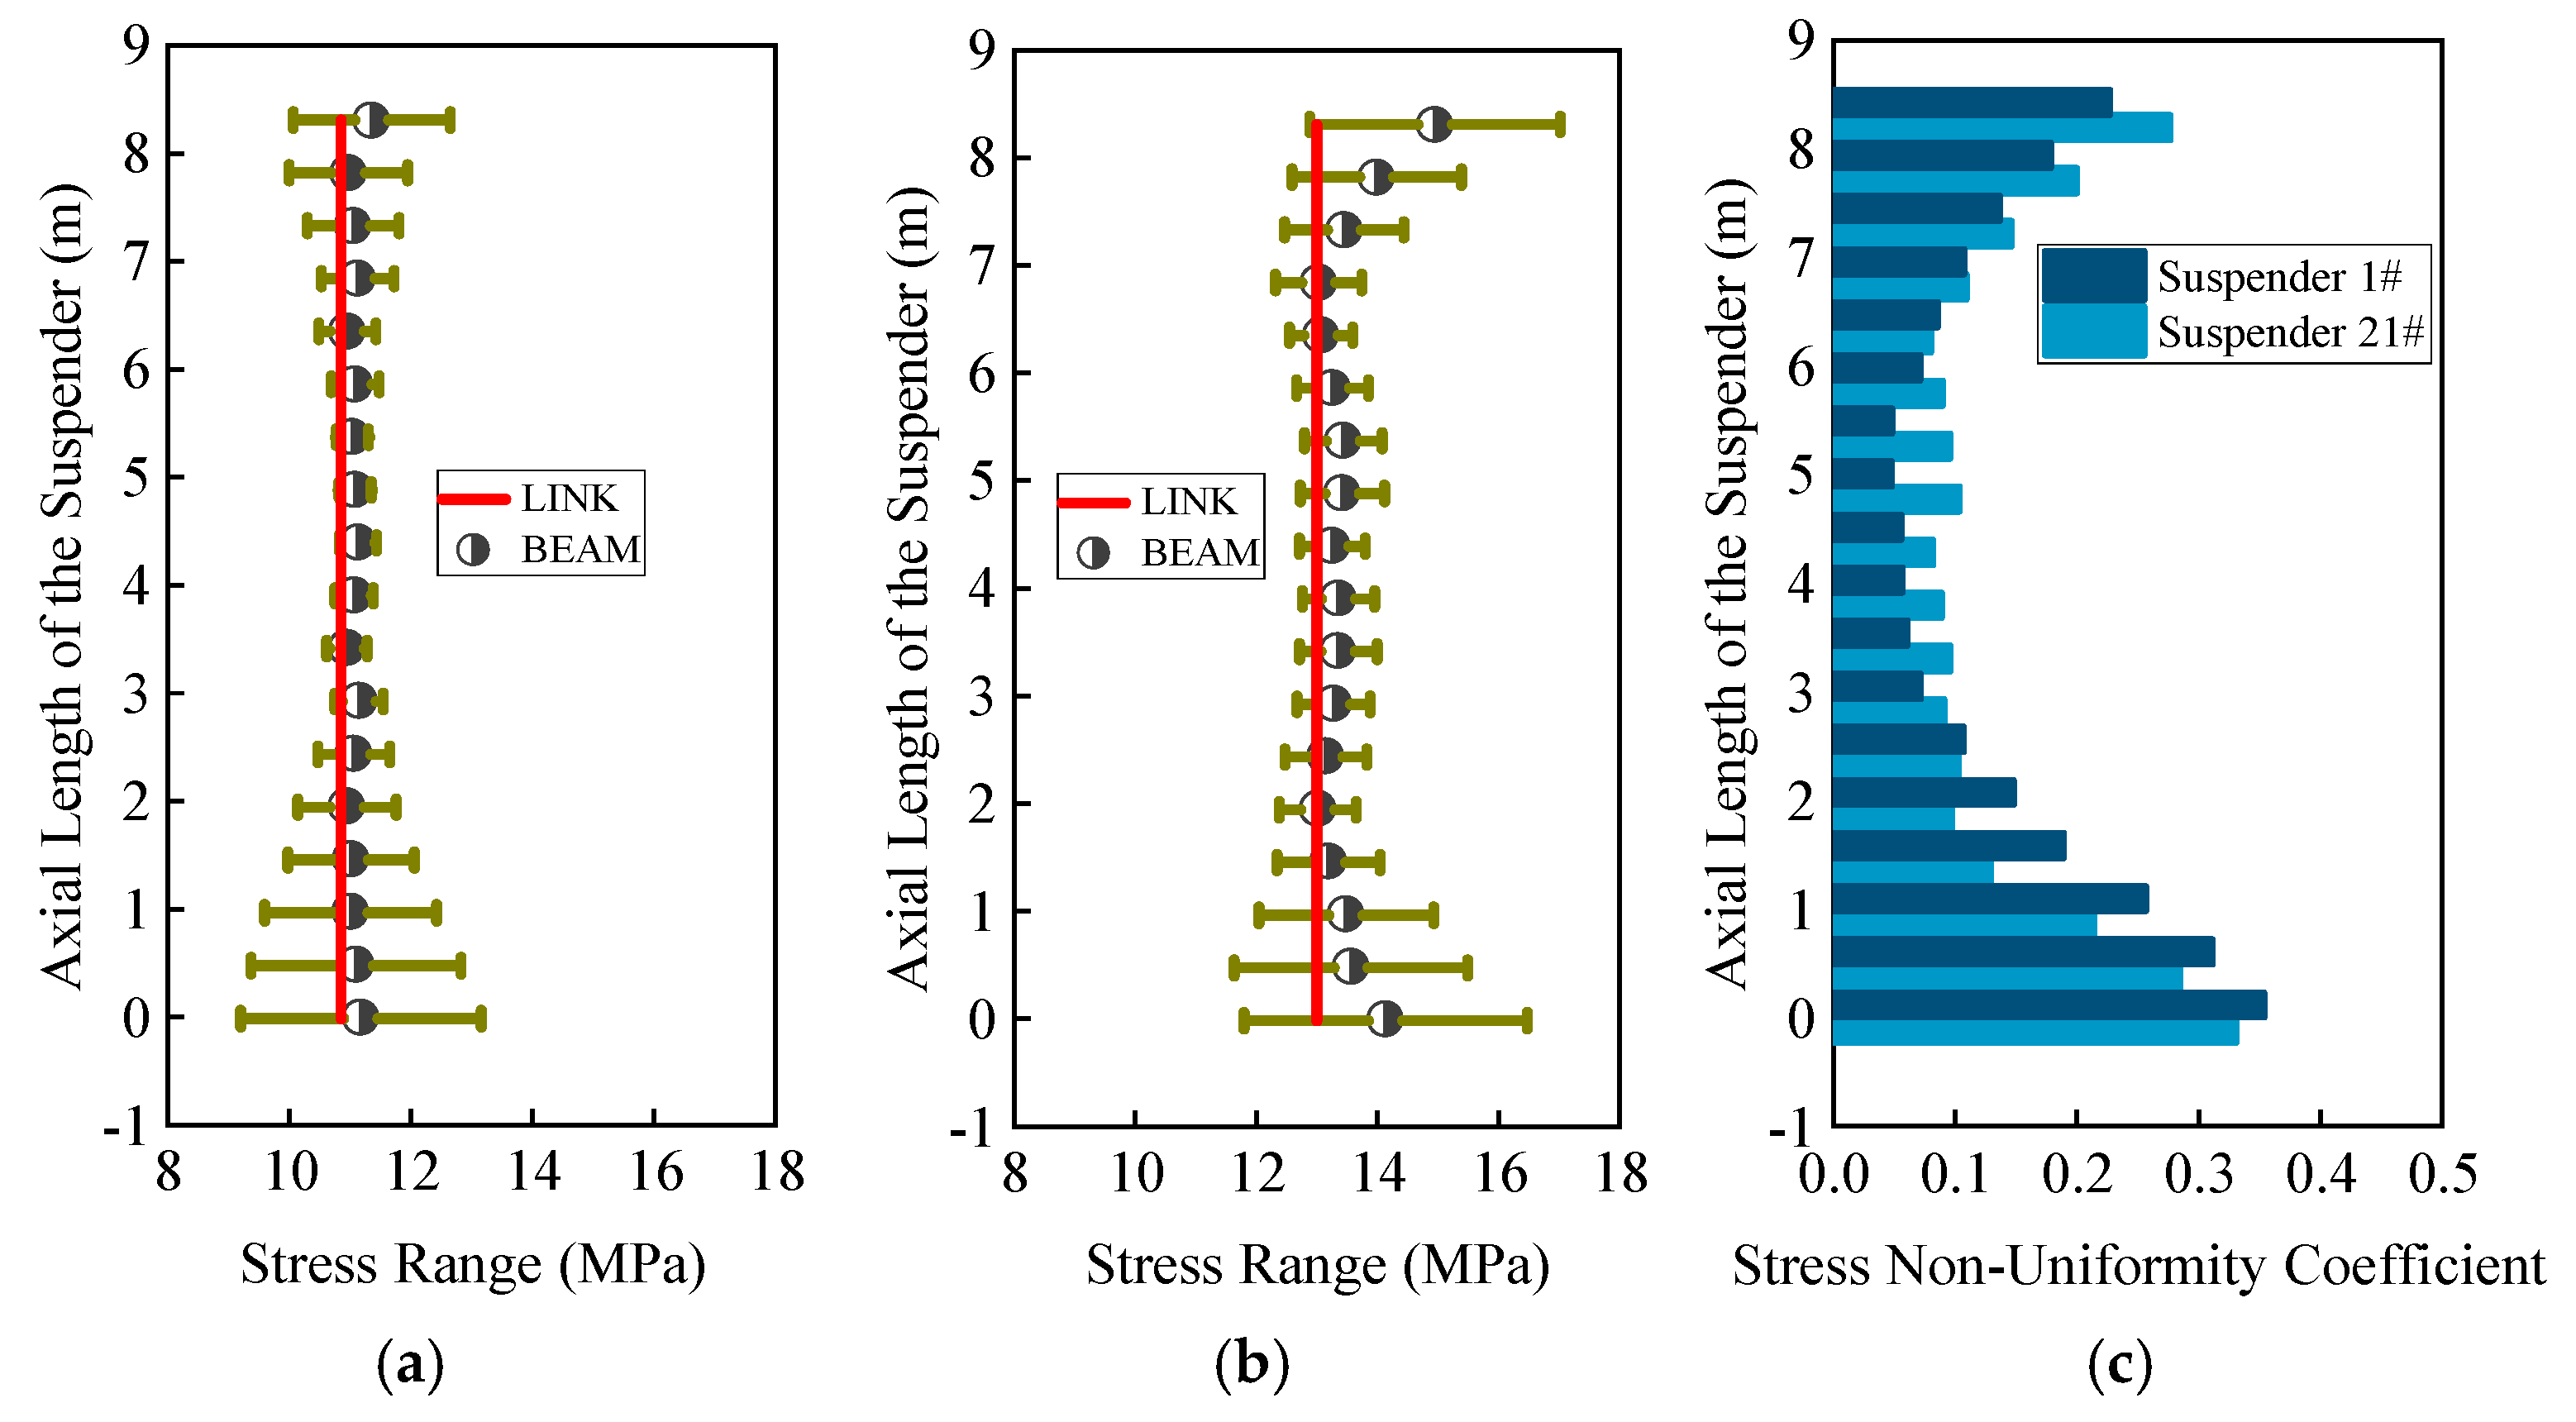
The equivalent stress range and stress non-uniformity coefficient in all directions within each suspender cross-section are shown in Figure 9. BEAM element short suspenders exhibit the most significant vehicle-induced dynamic response at anchorage ends. The range of stress peaks along the axis demonstrates higher values at anchorage ends compared to mid-sections. Stress peak fluctuations across all directions stabilize within mid-span cross-sections, while LINK element short suspenders show uniform sectional stress distribution at significantly lower levels than the stress range observed in BEAM element models. The stress non-uniformity coefficients at the upper and lower anchorage ends of the short suspender are significantly greater than those in the middle. The stress non-uniformity coefficient in the short suspender middle part is significantly reduced. The most obvious changes in the short suspender stress non-uniformity coefficient are approximately within the length range of the lower anchorage end to 2.0 m and 6.4 m to 8.3 m at the upper anchorage end, which, respectively, account for about 1/4 of the total short suspender length. However, the cross-sectional stress non-uniformity coefficient within the middle-half range of the short suspender tends to stabilize, and at this time, the stress distribution in the middle section of the short suspender is relatively uniform.
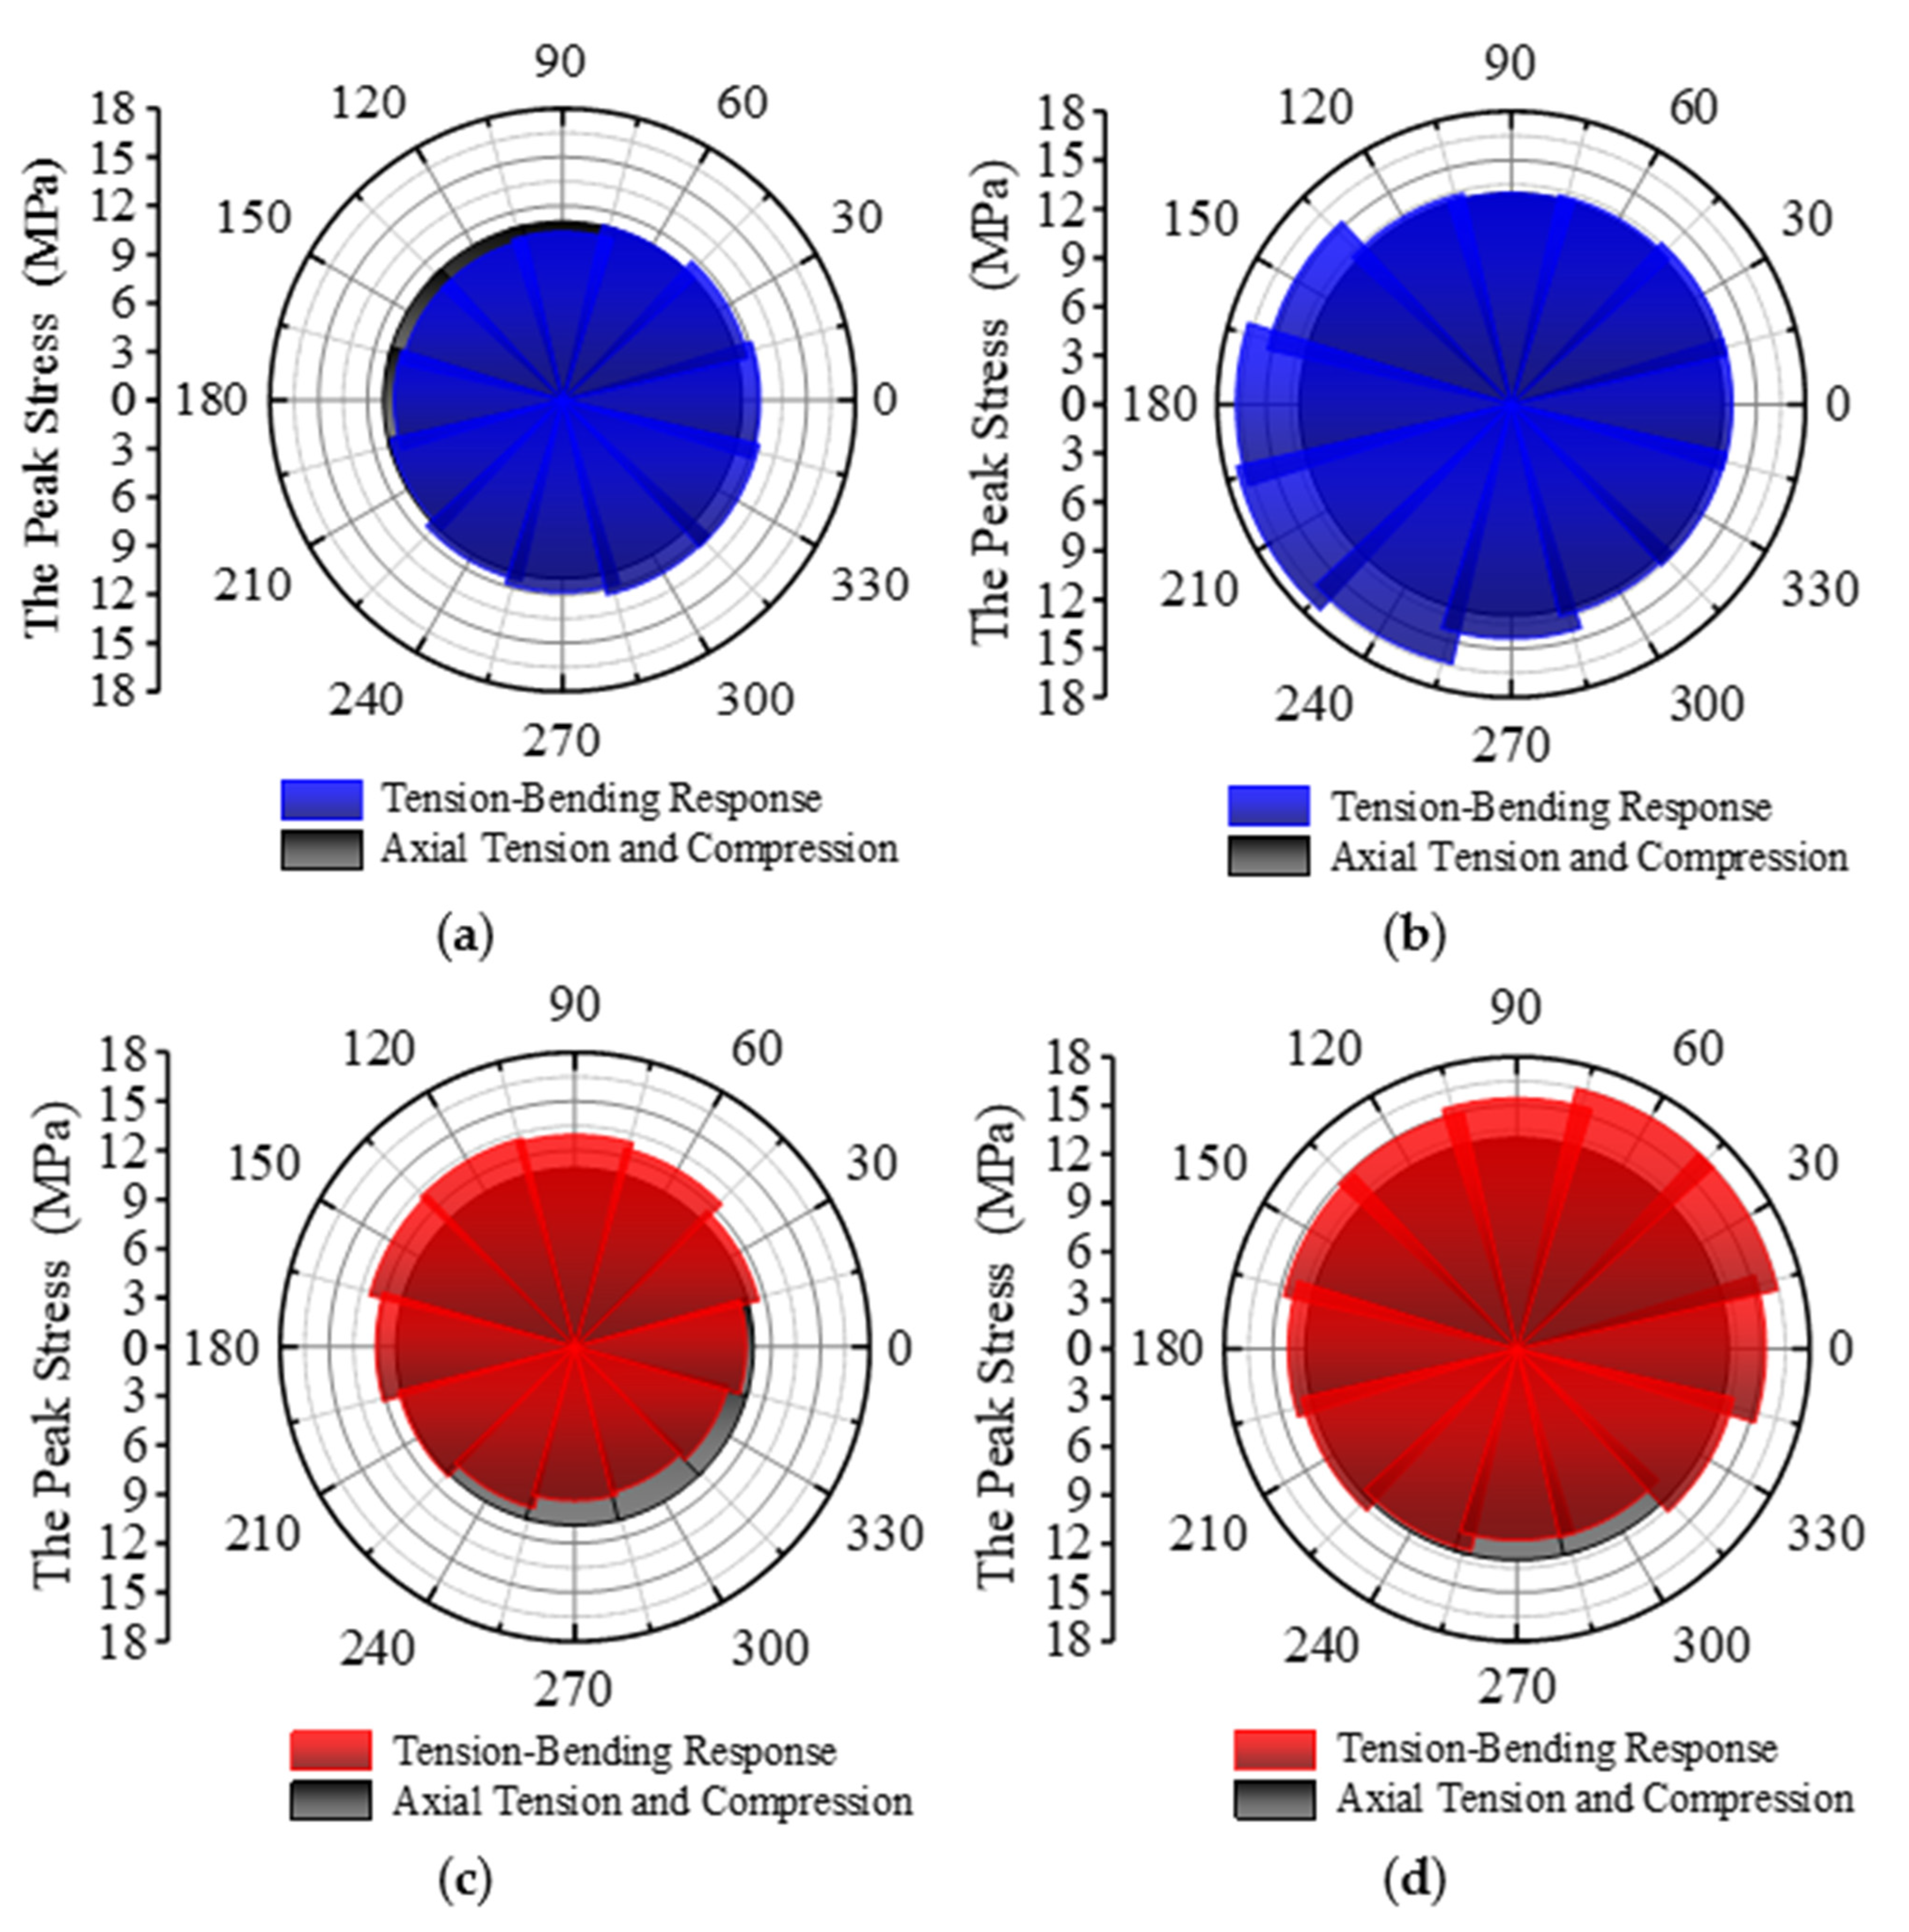
To better delineate the stress distribution characteristics at short suspender anchorage ends, peak stresses of alternating stresses induced by vehicle dynamic responses are compared against those from axial tension and compression scenarios, as illustrated in Figure 10. Due to the high structural rigidity at the connection between the approach-span columns and the main girder, the lower anchorage ends of BEAM element suspenders 1# and 21# exhibit more dynamic responses under vehicle-induced vibration. Consequently, cross-sectional stress peaks at these locations occur at 120° and 60° directions, respectively, toward the bridge centerline. As vehicles advance toward the mid-span, reduced structural rigidity at the suspender-girder connections diminishes impact effects near the column side. Simultaneously, cross-sectional stress peaks manifest at the upper anchorage ends of BEAM element suspenders 1# and 21# at 300° and 210° directions, respectively, toward the bridge exterior. This phenomenon occurs because when directional bending moments act on the lower anchorage ends under vehicular loading, the upper anchorage ends simultaneously develop counter-phase bending moments.
Analysis of the foregoing results confirms that bending moments constitute the primary cause of non-uniform sectional stress distribution in short suspenders under vehicular loading. Further investigation of bending moments in BEAM element suspenders 1# and 21# reveals distinct time–frequency energy characteristics when subjected to Short-Time Fourier Transform (STFT) analysis [24], particularly at orientations exhibiting peak mean stress levels, specifically suspender 1# at 120° and suspender 21# at 60°, as demonstrated in Figure 11. The BEAM element suspender 1# exhibits bending vibration primarily within the 0 Hz~10 Hz low-frequency band during the initial 3 s of vehicle entry. As the vehicle advances, vibration frequencies escalate to 20 Hz~40 Hz, reaching peak values exceeding 60 Hz. At approximately 9 s of vehicle driving, high-frequency spectral components attenuate while low-frequency components intensify progressively until bridge exit.
For BEAM element suspender 21#, high-frequency vibration remains virtually undetectable during the initial 3 s vehicle entry phase. Following the 9 s critical duration, high-frequency spectral components exhibit marked attenuation, with subsequent vibrations transitioning predominantly to low-frequency modes. Dynamics analysis reveals that the 3 s and 9 s intervals correspond precisely to the vehicle traversing the approach-side suspender 1# and exit-side suspender 21#, respectively. The substantial axle loads of heavy vehicles, combined with the significant mass and inertial forces within the vehiclevehicle-bridge coupled vibration system, enhance the system’s tendency to stability maintenance. During this period, the low-frequency component of the short boom bending vibration mainly comes from the gravitational effect of the vehicle’s axle load itself, while the high-frequency component is the high-frequency vibration caused by the vehicle’s dynamic impact. Consequently, bending moments in short suspenders exhibit amplified low-frequency constituents and attenuated high-frequency spectral components during these critical intervals. From an energy transfer perspective, the vehicle’s mid-span passage imposes severe cumulative damage potential on short suspenders.

4. Vehicle-Induced Tension-Bending Impact Effects of the Short Suspender

4.1. Axial Forces and Tensile Deformation at the Anchorage End

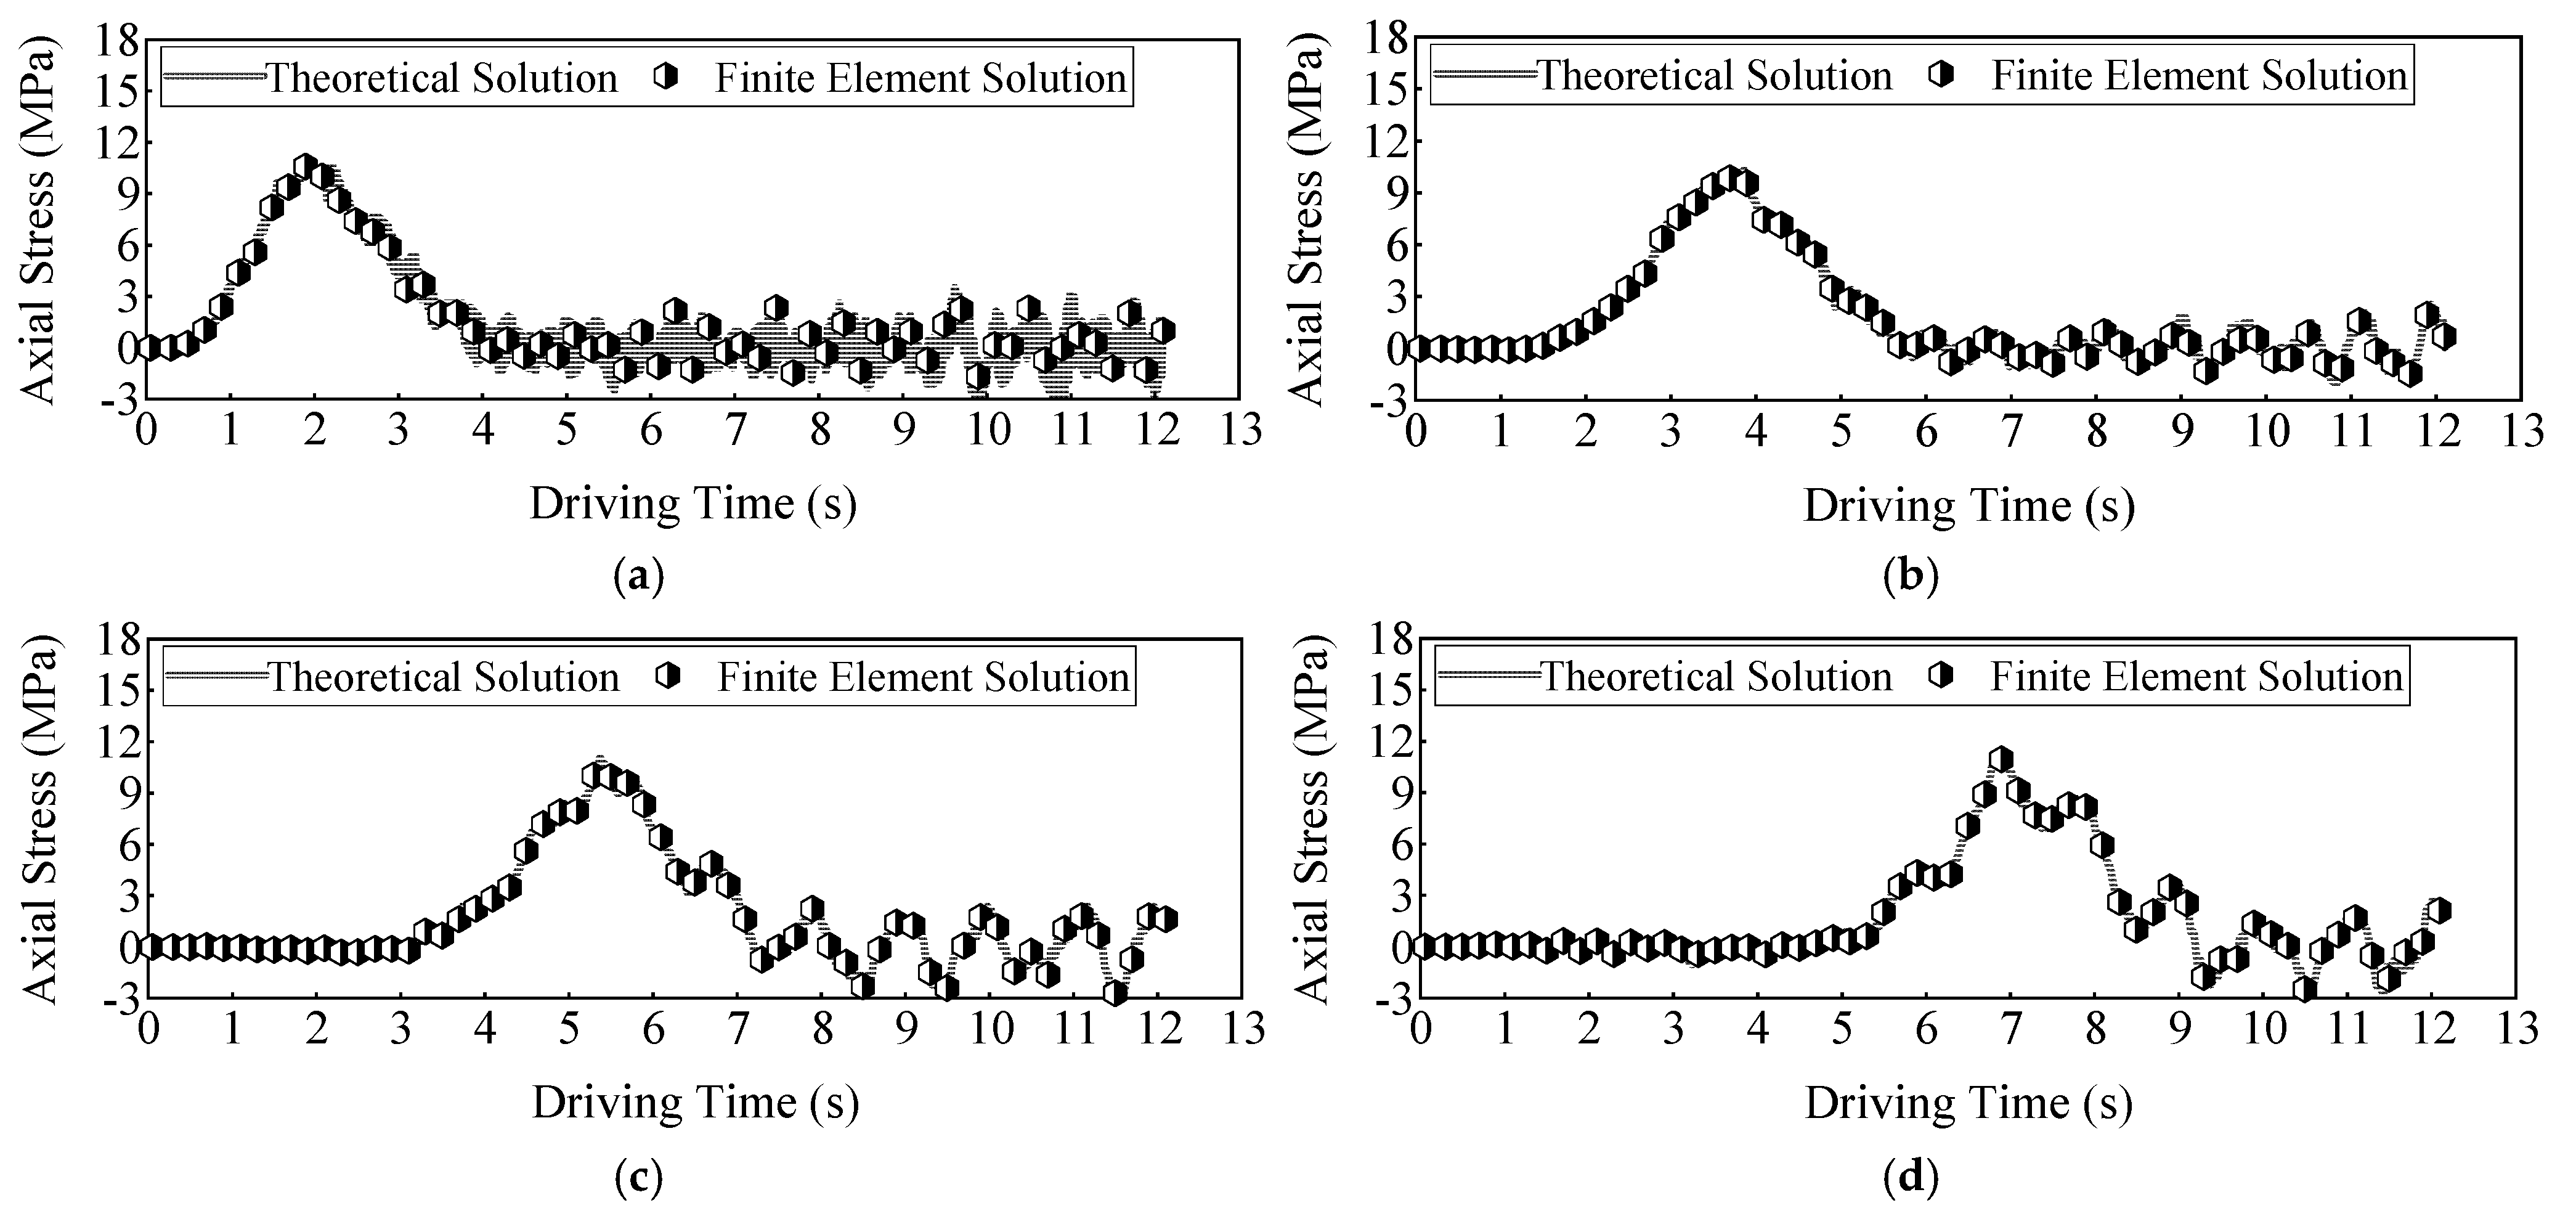
Vehicle-induced deformation of the bridge deck is the direct cause of tensile bending deformation in the suspenders. To clarify the correspondence between internal force and deformation for the short suspender under the vehicle-induced tensile bending effect, separate analyses were performed on the relationship between the short suspender’s axial force and bending moment and its axial stretching and rotational deformation. During vehicle crossing, the anchorage end of each suspender undergoes deformation to varying degrees. Based on the axial relative deformation between the upper anchorage end and lower anchorage end of each suspender, combined with physical and mechanical parameters such as the suspender length, force-bearing area, and elastic modulus, the theoretical time-history solution for the axial force of each suspender under vehicle-induced vibration was calculated through constitutive relations of suspensers. Concurrently, the finite element results for the axial force of LINK element suspenders under vehicle loading were extracted. The finite element results coincide with the theoretical solution, as shown in Figure 12. This indicates that the axial relative deformation, resulting from the collective vibration of the arch rib connected to the upper anchorage end of the suspender and the transverse girder connected to the lower anchorage end, transmits axial alternating load within the suspender.

4.2. Bending Moment and Rotational Deformation of the Short Suspender

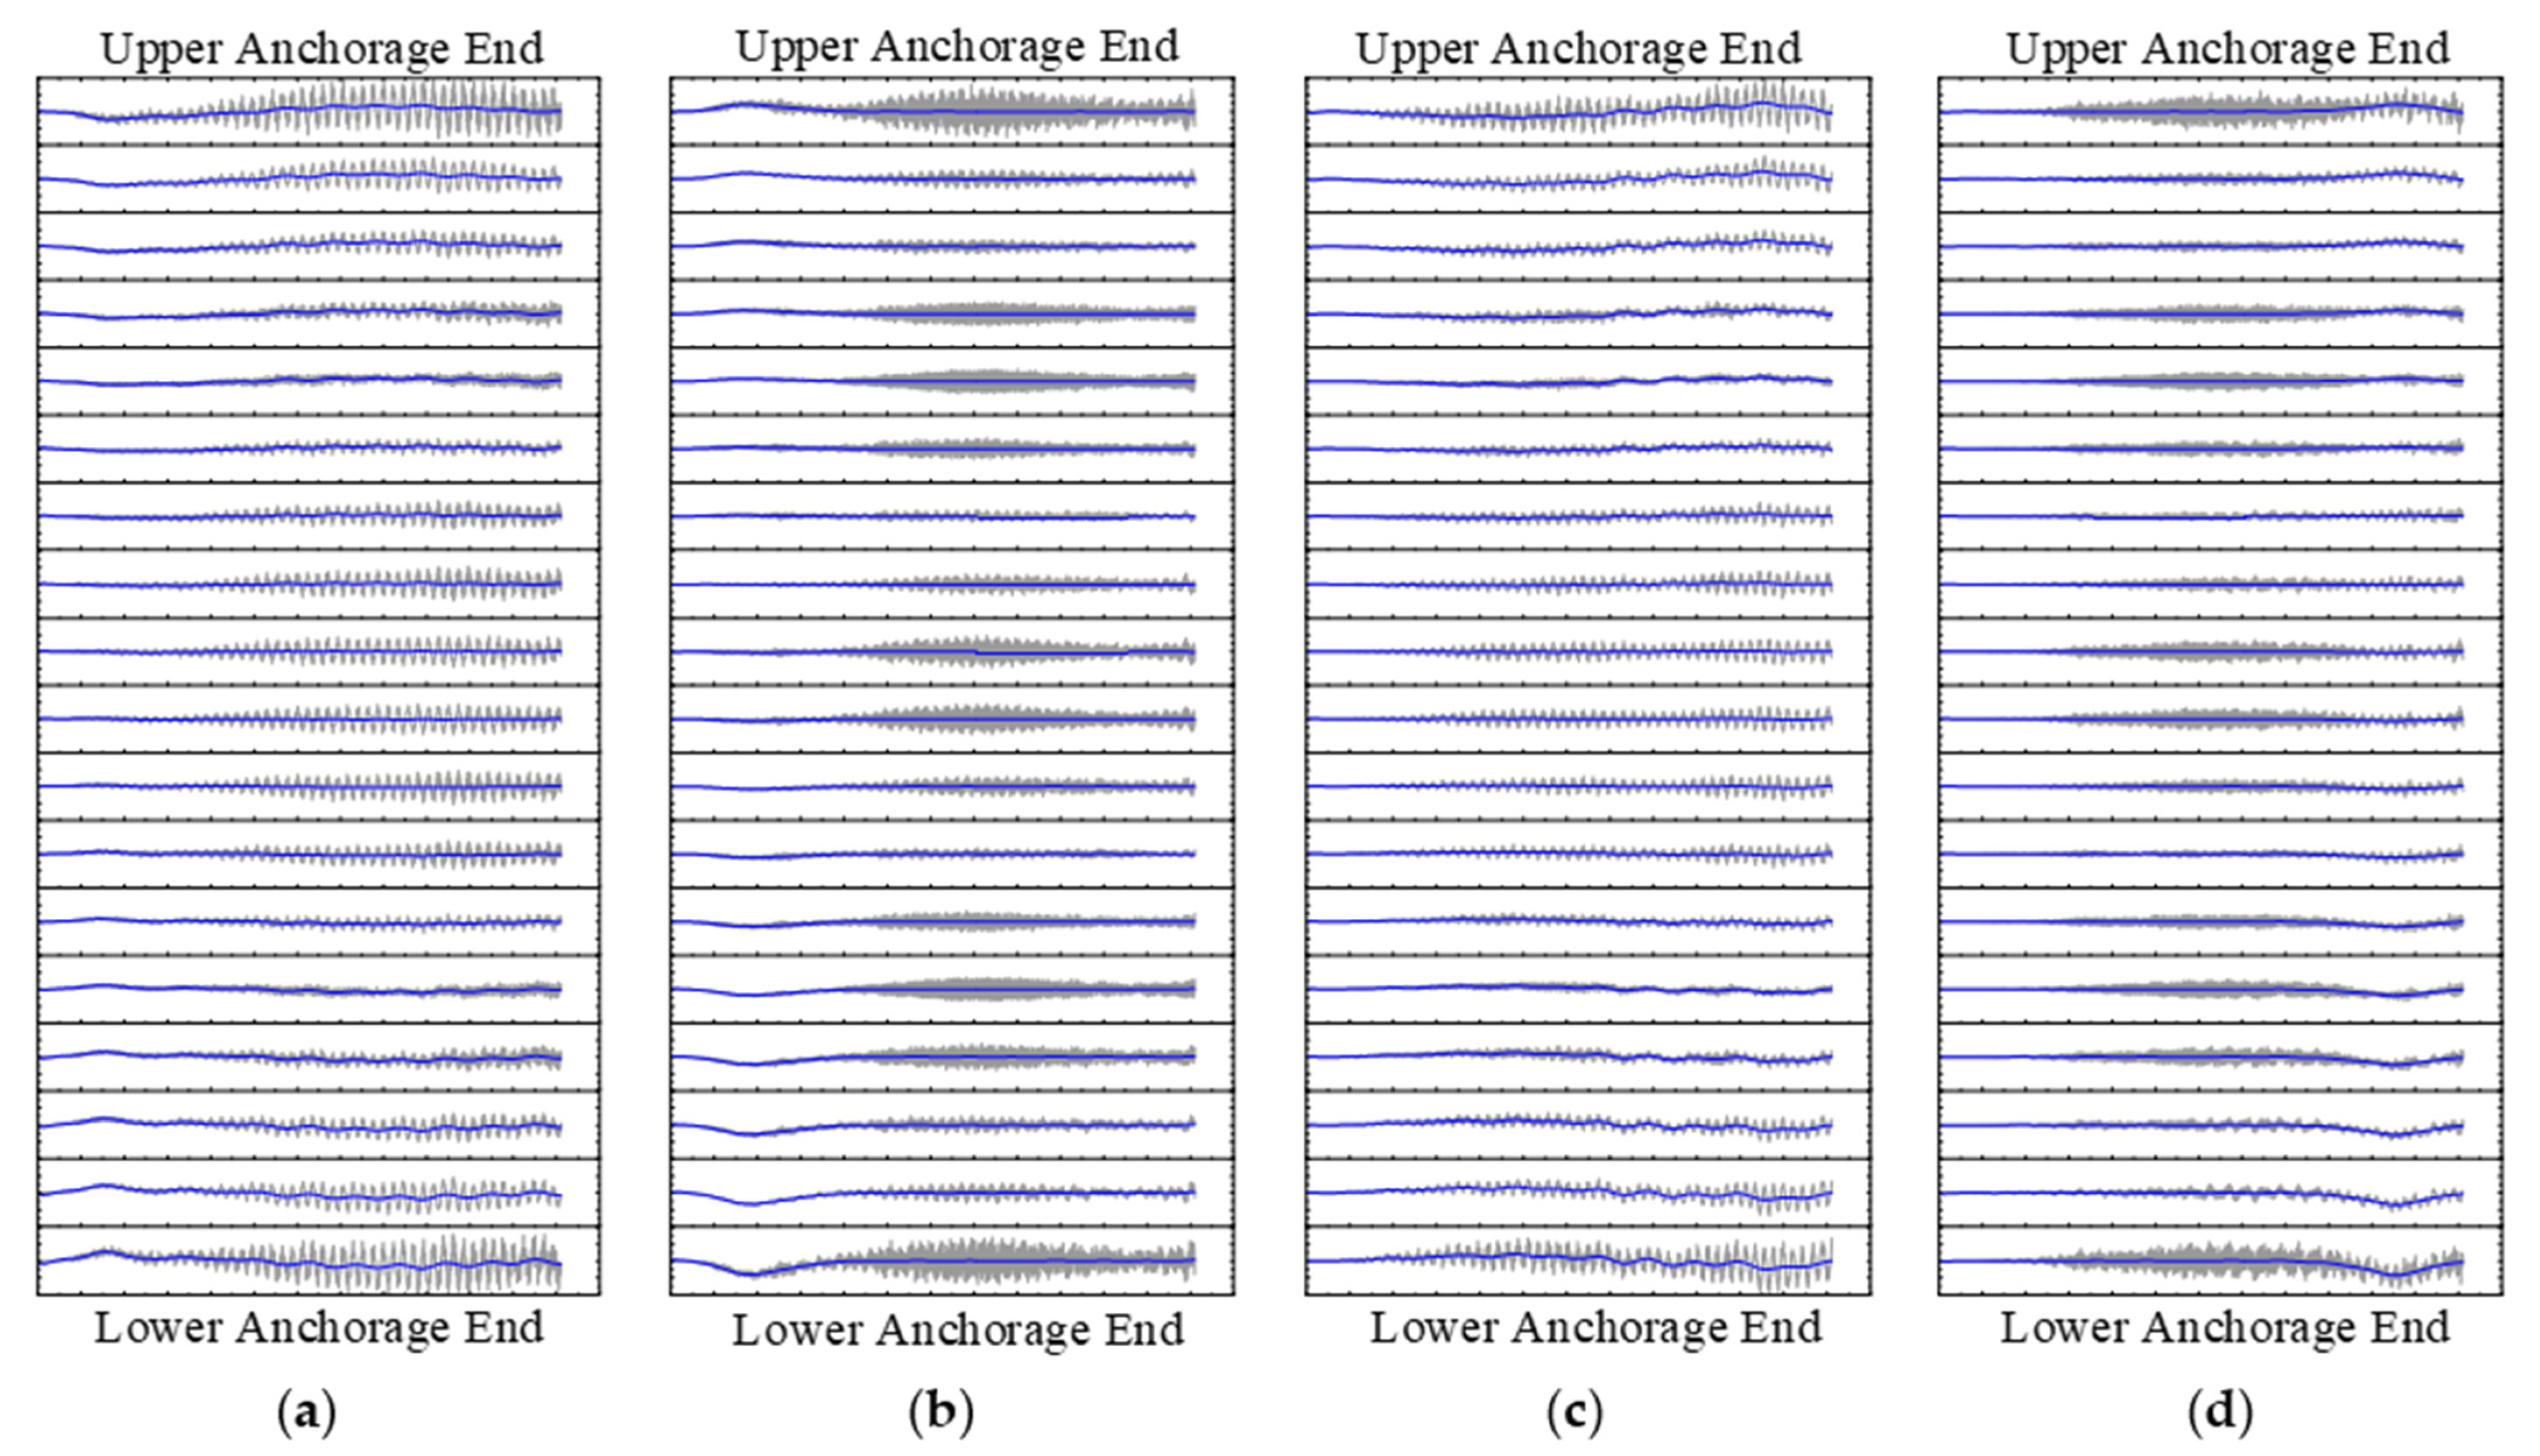
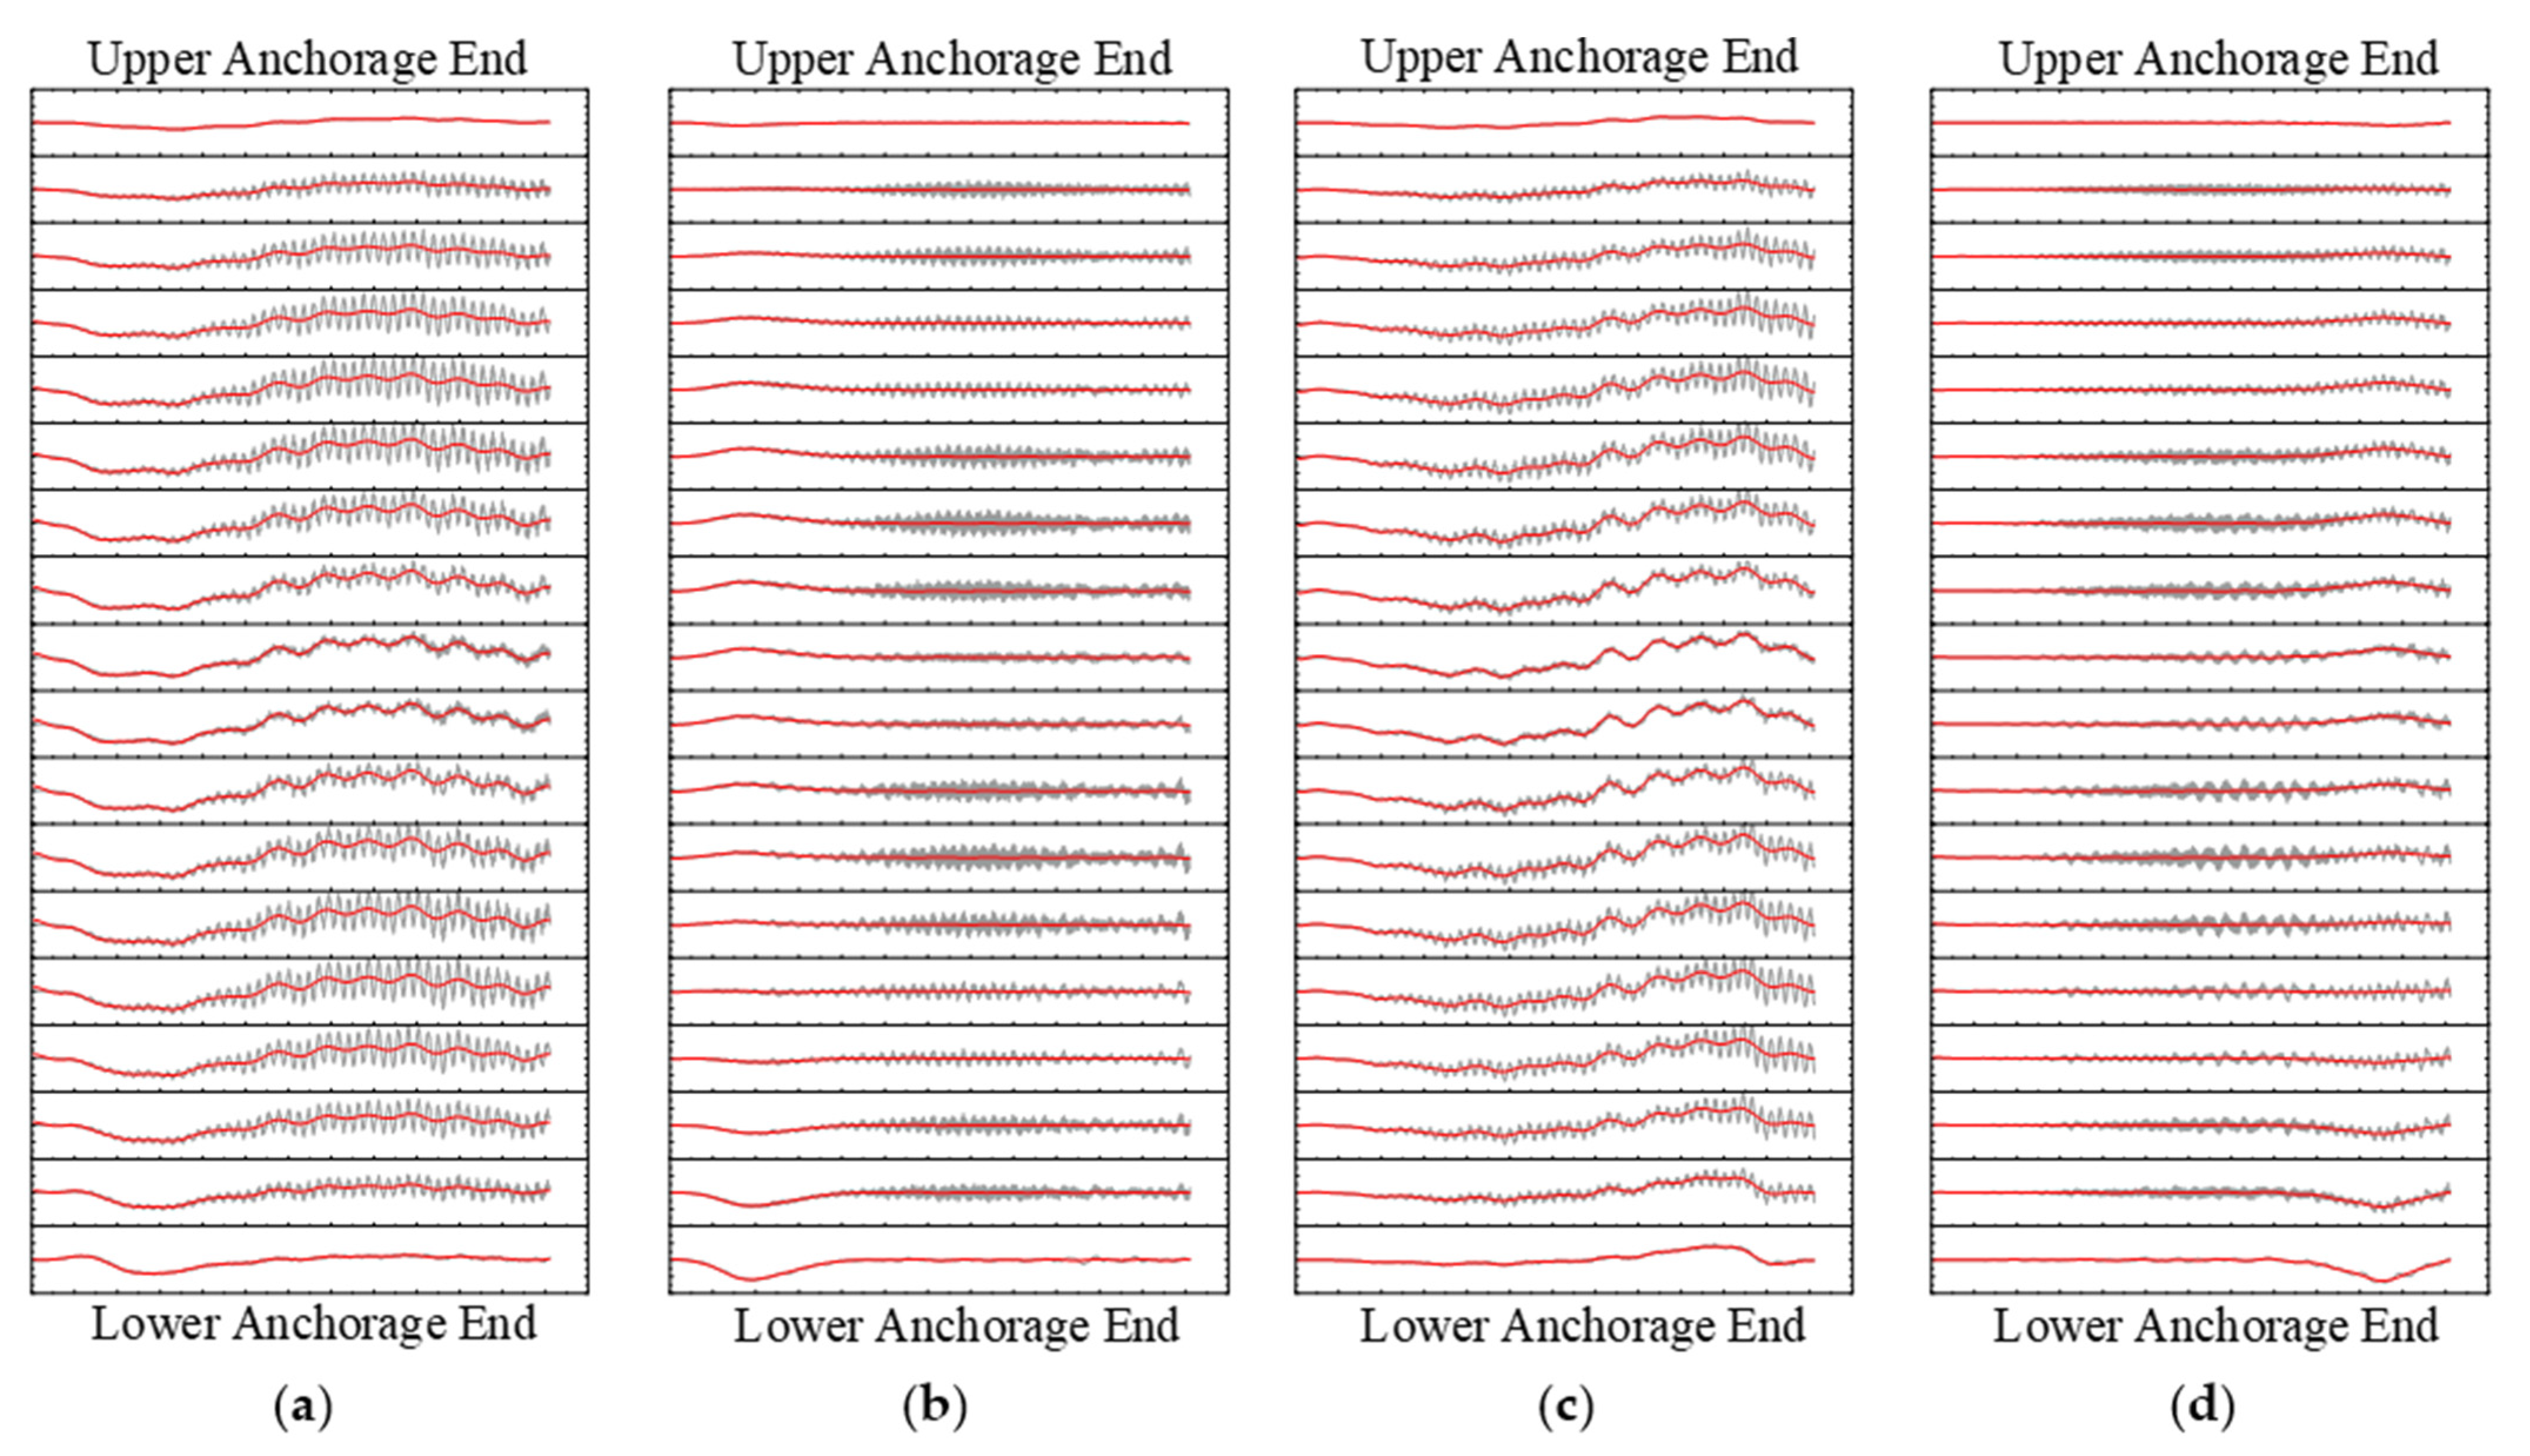
Considering the elastic constraints at the anchorage ends of BEAM element suspenders, the short suspenders were characterized by their shorter length, higher linear stiffness, and proximity to the arch-girder transition zone, and they will develop larger bending moments under the same deformation conditions compared to the short suspenders, such as suspenders 1# and 21#. Consequently, the dynamic response of short suspenders under vehicle loads will be the most significant, further analyzing the relationship between the bending moment and rotational deformation of the BEAM element. For short suspenders under vehicle loading, the rotational displacements at cross-sections of the short suspender were extracted and subjected to filtering processing. Figure 13 presents the bending moment time histories of the BEAM element short suspender in the transverse and longitudinal bridge directions, while Figure 14 shows the corresponding rotational displacements at cross-sections. The bending moment range is −200 N·m to 200 N·m, and the rotational displacement range is −5 × 10⁻⁴ rad to 5 × 10⁻⁴ rad during the abscissa, which represents vehicle driving time.
The deformation trend of rotational displacement at each cross-section of the short suspender aligns with the corresponding bending moment variation in both longitudinal and transverse bridge directions. The rotational displacement and bending moment at cross-sections exhibit a positive correlation across all directions, indicating that the rotational deformation at the anchorage ends of short suspenders under vehicle loading is transmitted within the suspender. Along the suspender axial, comparative analysis of rotational displacement at the anchorage ends of the short suspender reveals that the rotational trend at the lower anchorage end exceeds those at the upper anchorage end. This occurs because the primary transmission path of vehicle-induced vibration in the short suspender progresses upward along the suspender from the bottom, during which vibration dissipates to some extent. Additionally, considering the connection between the upper anchorage end and the steel rib cross-bracing, which exhibits greater stiffness, deformation is constrained. Significant rotational deformation also occurs in the mid-span region of the short suspender. However, as this region exhibits lower linear stiffness than the anchorage ends, the resulting bending moment at cross-sections is less pronounced than that at the anchorage ends. Whether at the lower or upper anchorage end, both the amplitude and frequency of bending moment variation significantly exceed those in the mid-span region. Consequently, under service conditions, the anchorage ends of short suspenders are subjected to greater alternating bending loads and become the priority failure locations.
Based on the analysis of the axial force deformation in Figure 12 and the bending force deformation in Figure 13 and Figure 14, it can be deduced that during the process of vehicle driving, the wheels directly act on the bridge beam, resulting in the bending force deformation of the bridge deck. The vehicle impact load is transmitted from the bridge beam to the suspender lower anchor end, resulting in rotational force deformation. Finally, it is transmitted from bottom to top through the suspender to the arch rib connected to the upper anchor end, and then, it causes the deformation of the arch rib and forms the vehicle load transfer whole path.

4.3. Analysis of the Uneven Impact Coefficient

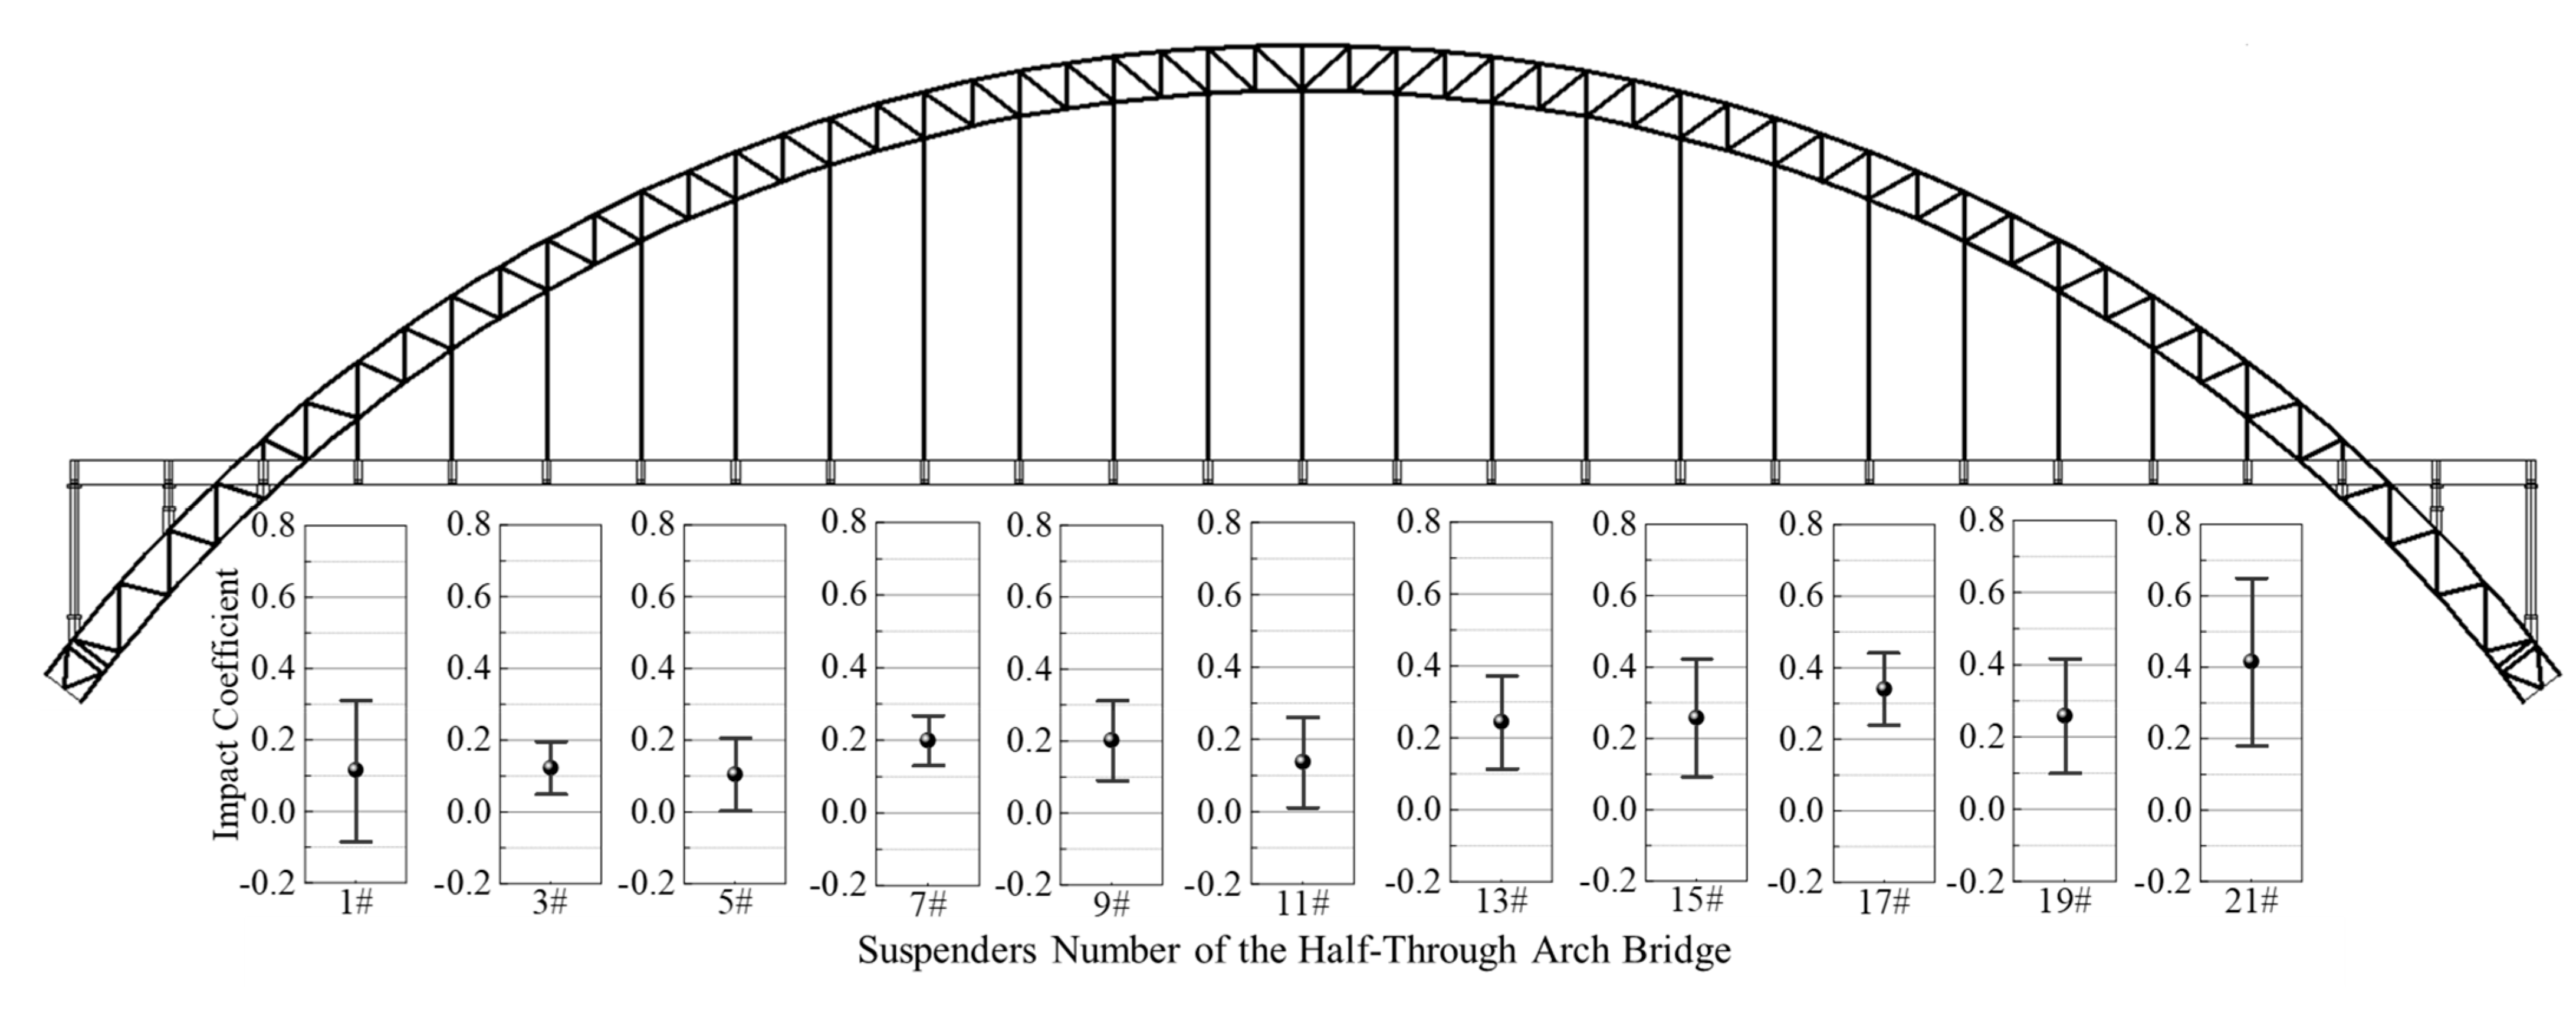
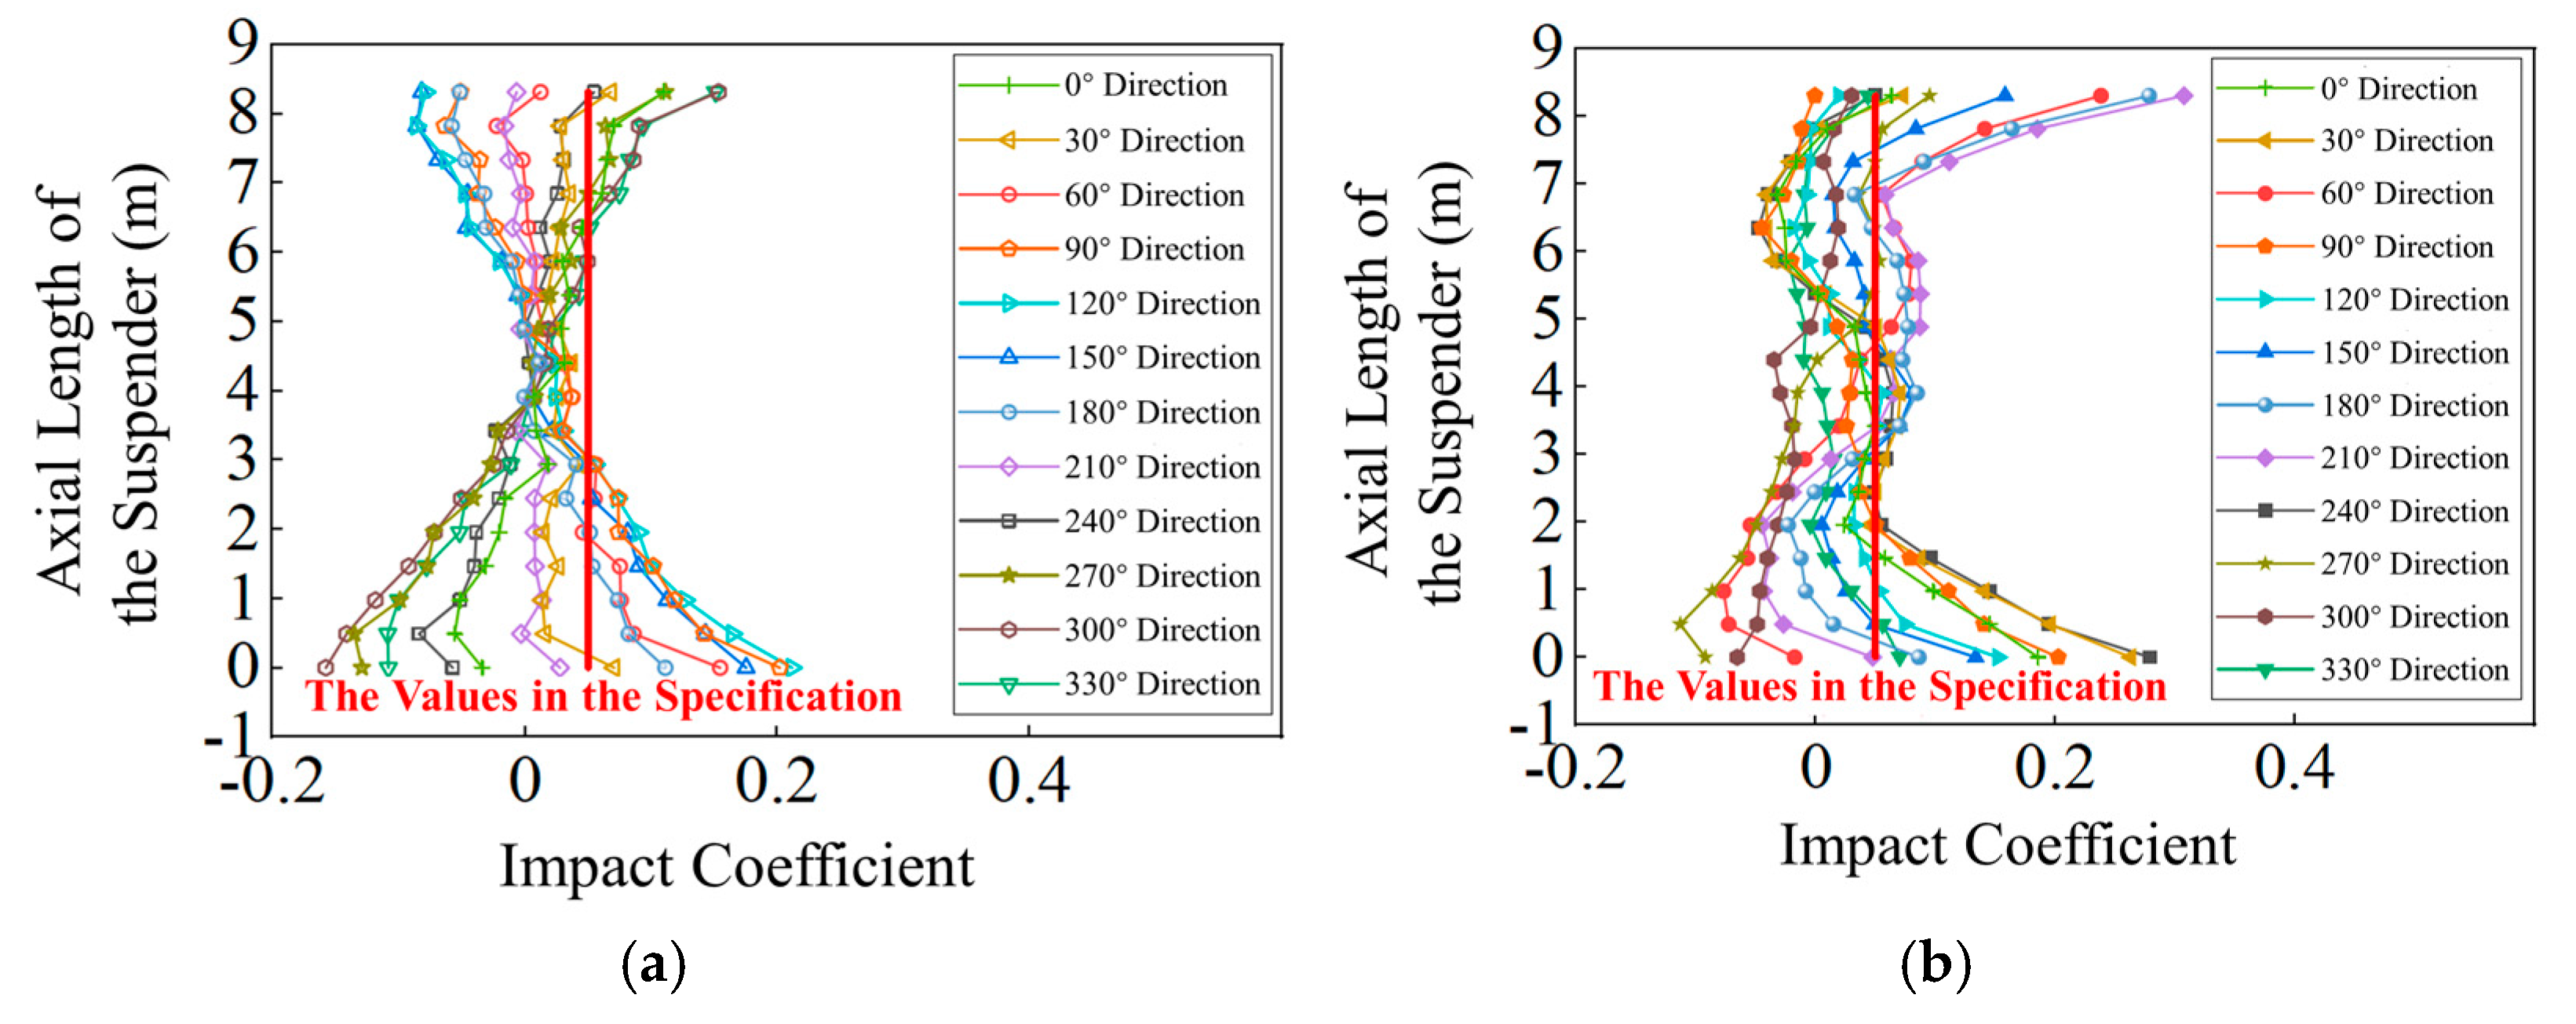
Subject to the tensile bending effect, various segments of suspenders experience differential impact responses. The vehicle-induced tensile bending impact effect at the lower anchorage end sections of each suspender was quantitatively analyzed using the impact coefficient [25], the impact coefficient was calculated according to Equation (8), and the calculation results as illustrated in Figure 15.
ξ = σ d m a x σ j m i n σ j m i n
where ξ is, respectively, the impact coefficient; σ d m a x is the maximum dynamic response of suspenders; σ j m a x is the maximum static response of suspenders.
Along the vehicle driving direction, the impact coefficients of the suspenders progressively increase. The distribution range of impact coefficients for short suspenders is notably higher than that for long suspenders and progressively decreases with increasing suspender length. The impact coefficient of the mid-span suspender 11# registers 0.25, approximately half that of the suspender 21#. Since a specific direction at the anchorage end section of short suspenders generates the maximum peak stress of alternating stresses, the diametrically opposite direction exhibits the minimum stress peak. This results in negative impact coefficients, demonstrating that the stress distribution at short suspender cross-sections under vehicle-induced vibration is uncontrollably unpredictable. Consequently, short suspenders in service carry an unpredictable risk of accelerated dynamic damage due to greater impulsive loads.
In addition, Figure 16 illustrates the distribution of impact coefficients along the suspender-axis direction for cross-sections of suspenders 1# and 21# under vehicle-induced vibration. The impact coefficient distribution of short suspender cross-sections aligns fundamentally with the cross-sectional stress distribution pattern, demonstrating a trend where values at the anchorage ends exceed those in the mid-span region. Notably, the impact coefficient distribution exhibits significant non-uniformity across short suspender cross-sections, with anchorage end sections displaying a distribution range exceeding tenfold that of the mid-span region. Specifically, the peak impact coefficients at anchorage end sections reach 0.21 for suspender 1# and 0.28 for suspender 21#, significantly deviating from the specification values. Only the mid-span regions of suspenders demonstrate marginal compliance with the specifications. Thus, practical applications necessitate particularized verification procedures for short suspenders impact effects based on in situ bridge conditions.
Similarly influenced by the directional nature of vehicle excitation, the overall impact coefficient level across sections of suspender 21# surpasses that of suspender 1#, with 21# exhibiting more significant uncertainty in impact effects. Furthermore, where the maximum impact coefficient occurs at the lower anchorage end, the upper anchorage end typically exhibits the minimum value in the same direction. This phenomenon results from the reverse bending induced by suspender deformation between its upper and lower anchorage ends.

5. Conclusions

(1)
Under vehicle loading, the bending moment in BEAM element suspenders increases as the suspender length decreases. With extended vehicle driving time, suspenders 1# and 21# exhibit higher frequency and amplitude of bending moments compared to long suspenders, indicating enhanced vibrational intensity.
(2)
LINK element short suspenders exhibit uniform stress distribution, while BEAM element short suspenders demonstrate non-uniform stress distribution and impact coefficients along the axial direction. Peak stresses and impact coefficients at lower anchorage end sections concentrate toward the side-span column. When vehicles move through the bridge mid-span region, these directional concentrations cause more severe damage in the corresponding direction of short suspender sections.
(3)
The deformation trend of short suspenders aligns with internal force variations: axial alternating loads originate from axial relative deformation between the arch rib and the transverse girder, while bending alternating loads are transmitted by rotational deformation at the lower anchorage end.
(4)
In engineering practice, it should be ensured that on the basis of the overall compliance with the impact coefficient specification requirements of the half-through arch bridge, the checking work of the vehicle-induced impact coefficient of the short suspender should be carried out through the combination of simulation and test, so as to ensure that the short suspender has sufficient impact resistance performance.

Author Contributions

Conceptualization, L.W., G.Y. and X.H.; methodology, L.W. and G.Y.; software, L.W. and G.Y.; validation, L.W., G.Y. and X.H.; formal analysis, L.W., G.Y. and X.H.; investigation, L.W. and X.H.; resources, G.Y.; data curation, L.W. and X.H.; writing—original draft preparation, L.W., G.Y. and X.H.; writing—review and editing, L.W. and G.Y.; visualization, L.W., G.Y. and X.H.; supervision, X.H.; project administration, L.W. and G.Y.; funding acquisition, G.Y. and X.H. All authors have read and agreed to the published version of the manuscript.

Funding

The National Natural Science Foundation of China (Grant No. 52178273), the National Natural Science Foundation of China (Grant No. 52578173), the Innovation and Development Joint Project of Natural Science Foundation of Chongqing, China (Grant No. CSTB2023NSCQ-LZX0077), the Natural Science Foundation of Chongqing (Grant No. cstc2021jcyj-msxmX1159); the Chongqing Talent Plan Project (Grant No. cstc2022ycjh-bgzxm0124); the Chongqing Graduate Research Innovation Project (Grant No. CYB23244); the Joint Training Base Construction Project for Graduate Students in Chongqing (Grant No. JDLHPYJD2020004).

Data Availability Statement

The data presented in this study are available on request from the corresponding author.

Conflicts of Interest

The authors declare no conflicts of interest.

References

  1. Editorial Department of China Journal of Highway and Transport. Review on China’s Bridge Engineering Research: 2024. China J. Highw. Transp. 2021, 34, 1–97. [Google Scholar]
  2. Li, Y.; Chen, Y.J.; Huang, X.Y. Impact effect study on long-span irregular concrete filled steel tube arch bridge under moving vehicles. J. Harbin Inst. Technol. 2010, 252, 109–114. [Google Scholar]
  3. Yan, Z.G.; Sheng, H.F.; Chen, Y.J. Effects of bridge deck roughness on vibration of long-span concrete filled steel tube arch bridges due to vehicles. China J. Highw. Transp. 2004, 17, 41–43. [Google Scholar]
  4. Malm, R.; Andersson, A. Field testing and simulation of dynamic properties of a tied arch railway bridge. Eng. Struct. 2006, 28, 143–152. [Google Scholar] [CrossRef]
  5. Zhu, Z.H.; Luo, S.H.; Zhang, L.; Wang, L.; Yu, Z.; Meng, X. Analysis of stress impact coefficient of hangers in arch bridge under vehicle-bridge coupled vibration. J. Vib. Meas. Diagn. 2019, 39, 1169–1176+1356–1357. [Google Scholar]
  6. Huang, D.Z.; Wang, T.L. Impact analysis of cable-stayed bridges. Comput. Struct. 1992, 43, 897–908. [Google Scholar] [CrossRef]
  7. Gu, A.B.; Xu, J.L. Structural behavior analysis of short suspender in half-through and through arch bridges. J. Chongqing Jiaotong Univ. 2002, 21, 1–3. [Google Scholar]
  8. Zhu, J.S.; Yi, Q. Non-uniformity of stress impact factor of suspenders on half- through or through arch bridges. J. Vib. Shock. 2012, 31, 5–10. [Google Scholar]
  9. Zhu, J.S.; Xu, Y.F. Research on the impact factor of the three-span continuous beam-arch combined bridge based on the vehicle-bridge coupled vibration. J. Railw. Sci. Eng. 2019, 16, 959–967. [Google Scholar]
  10. Zhang, K.Y.; Yang, J. Dynamic response analysis and redesign of short hangers in bridges. J. Wuhan Univ. Technol. (Transp. Sci. Eng.) 2017, 41, 934–937+942. [Google Scholar]
  11. Kong, Q.K. Structural Behavior Study on Short Suspender on Half Through Arch Bridges with Large Span. Ph.D. Dissertation, Southwest Jiaotong University, Chengdu, China, 2003. [Google Scholar]
  12. Yao, Z.Q.; Ruan, X.P.; Deng, Q. Prevention measures for bridge deck fracture caused by deformation difference of arch bridge hangers. Highway 2002, 7, 73–75. [Google Scholar]
  13. Gou, H.; Zhou, W.; Yang, C.; Bao, Y.; Pu, Q. Dynamic Response of a Long-Span Concrete-Filled Steel Tube Tied Arch Bridge and the Riding Comfort of Monorail Trains. Appl. Sci. 2018, 8, 650. [Google Scholar] [CrossRef]
  14. Huo, J.; Huang, Y.; Wang, J.; Zhuo, Q. Numerical Analysis on the Impact Effect of Cable Breaking for a New Type Arch Bridge. Buildings 2023, 13, 753. [Google Scholar] [CrossRef]
  15. Luan, J.; Hao, X.W. Evaluation of Reinforcement Effect of an RC Tied Arch Bridge Based on Vehicle Bridge Coupled Vibration. China J. Highw. Transp. 2018, 31, 227–234. [Google Scholar]
  16. Yang, J.X.; Chen, W.Z.; Gu, R. Analysis of Dynamic Characteristics of Short Hangers of Arch Bridge. Bridge Constr. 2014, 44, 13–18. [Google Scholar]
  17. Zhang, J.H. Research in the Carrying Capacity of the Simply Supported Composite Beam of Steel and Concrete. Ph.D. Dissertation, Hehai University, Nanjing, China, 2001. [Google Scholar]
  18. He, X.B. Research on Corrosion Fatigue Characteristics of Short Suspenders of Half-Through Arch Bridge Considering Vehicle Bridge Coupling Vibration. Ph.D. Dissertation, Chongqing Jiaotong University, Chongqing, China, 2022. [Google Scholar]
  19. JTG D60-2018; General Specifications for Design of Highway Bridges and Culverts. Ministry of Transport of the People’s Republic of China: Beijing, China, 2015.
  20. Jiang, P.W. Coupled Vibration Between Vehicles and Highway Long-Span Continuous Series Bridge. Ph.D. Dissertation, Chang’an University, Xi’an, China, 2012. [Google Scholar]
  21. Chen, X.D. The Vehicle-Bridge Interaction Analysis of Corrugated Steel Web Box Girder Based on Contact-Constraint Method. Ph.D. Dissertation, Chongqing University, Chongqing, China, 2021. [Google Scholar]
  22. Shao, Y.; Sun, Z.G.; Chen, Y.F. A study on equal stiffness design of arch bridge suspenders and their dynamic response analysis. J. Vib. Shock 2018, 37, 219–225. [Google Scholar]
  23. He, X.B.; Guo, Z.W.; Xu, H. Vehicle Impact Effect of Suspender in Half-through Arch Bridge Considering Vehicle-bridge Coupled Vibration. Noise Vib. Control 2022, 42, 206–213. [Google Scholar]
  24. Du, H.; Xu, H.W.; Lou, W.J. Fast Bayesian modal parameter identification method based on short-time Fourier transform. J. Build. Struct. 2023, 44, 305–314+334. [Google Scholar]
  25. Zhou, Y.J.; Xue, Y.X.; Li, R.R.; Zhan, J.W.; Zhao, Y. State-of-the-art of Theory and Applications of Bridge Dynamic Load Allowance. China J. Highw. Transp. 2021, 34, 31–50. [Google Scholar]
Figure 1. The actual half-through arch bridge.
Vibration 08 00051 g001
Figure 2. The bridge finite element model.
Vibration 08 00051 g002
Figure 3. Vibration modes of the bridge: (a) first-order mode shape (f = 0.343 Hz); (b) second-order mode shape (f = 0.617 Hz); (c) third-order mode shape (f = 0.639 Hz); (d) fourth-order mode shape (f = 0.735 Hz); (e) fifth-order mode shape (f = 0.969 Hz); (f) sixth-order mode shape (f = 1.346 Hz).
Vibration 08 00051 g003
Figure 4. Illustration of the heavy vehicle model.
Vibration 08 00051 g004
Figure 5. Bridge deck unevenness model: (a) random unevenness sequence of bridge deck; (b) fitting result of bridge deck unevenness.
Vibration 08 00051 g005
Figure 6. Section structure diagram and section division of suspender.
Vibration 08 00051 g006
Figure 7. Bending moment—time history of each suspender: (a) suspender 1#; (b) suspender 5#; (c) suspender 9#; (d) suspender 13#; (e) suspender 17#; (f) suspender 21#.
Vibration 08 00051 g007
Figure 8. Axial stress time and equivalent stress time history of the short suspender: (a) suspender 1#; (b) suspender 21#.
Vibration 08 00051 g008
Figure 9. The equivalent stress range and stress non-uniformity coefficient: (a) the equivalent stress range of suspender 1#; (b) the equivalent stress range of suspender 21#; (c) the short suspender stress non-uniformity coefficient.
Vibration 08 00051 g009
Figure 10. Cross-sectional stress distribution at the short suspender anchorage end: (a) upper anchorage end of suspender 1#; (b) upper anchorage end of suspender 21#; (c) lower anchorage end of suspender 1#; (d) lower anchorage end of suspender 21#.
Vibration 08 00051 g010
Figure 11. Time–frequency–energy distribution of cross-sectional bending moments in the short suspender: (a) suspenders 1# at 120°; (b) suspenders 21# at 60°.
Vibration 08 00051 g011
Figure 12. Axial force—time history results of each suspender and finite element solution: (a) suspender 1#; (b) suspender 5#; (c) suspender 9#; (d) suspender 13#; (e) suspender 17#; (f) suspender 21#.
Vibration 08 00051 g012aVibration 08 00051 g012b
Figure 13. Cross-sectional bending moment of the short suspender: (a) cross bridge direction of suspender 1#; (b) along bridge direction of suspender 1#; (c) cross bridge direction of suspender 21#; (d) along bridge direction of suspender 21#.
Vibration 08 00051 g013
Figure 14. Cross-sectional rotation displacement of the short suspender: (a) cross bridge direction of suspender 1#; (b) along bridge direction of suspender 1#; (c) cross bridge direction of suspender 21#; (d) along bridge direction of suspender 21#.
Vibration 08 00051 g014
Figure 15. Impact coefficient of each suspender anchorage end.
Vibration 08 00051 g015
Figure 16. Cross-sectional impact coefficient of the short suspender: (a) suspender 1#; (b) suspender 21#.
Vibration 08 00051 g016
Table 1. The vehicle construction parameters.
Vehicle StructureConstruction ParameterVehicle StructureConstruction ParameterVehicle StructureConstruction Parameter
Total Vehicle MassM = 46,000.0 kgFirst-Class Rear Axle Suspension Stiffnesskd3 = 1.2675 × 10⁶ N·m−1Second-Class Middle Axle Suspension Dampingcu2 = 4.9 × 10⁴ N·m−1·s−1
Vehicle Body Massm1 = 37,340.0 kgFirst-Class Front Axle Suspension Dampingcd1 = 1.96 × 10⁵ N·m−1·s−1Second-Class Rear Axle Suspension Dampingcu3 = 4.9 × 10⁴ N·m−1·s−1
Rotational InertiaJ = 2.446 × 10⁶ kg·m2First-Class Middle Axle Suspension Dampingcd2 = 9.8 × 10⁴ N·m−1·s−1Vehicle WheelbaseL = 8.0 m
Front Wheel Massm2 = 4330.0 kgFirst-Class Rear Axle Suspension Dampingcd3 = 9.8 × 10⁴ N·m−1·s−1The Distance from Front Axis to Center of Massl2 = 4.0 m
Middle Wheel Massm3 = 2165.0 kgSecond-Class Front Axle Suspension Stiffnessku1 = 4.28 × 10⁶ N·m−1The Distance from Middle Axis to Center of Massl3 = 3.0 m
Rear Wheel Massm4 = 2165.0 kgSecond-Class Middle Axle Suspension Stiffnessku2 = 2.14 × 10⁶ N·m−1The Distance from Rear Axis to Center of Massl4 = 4.0 m
First-Class Front Axle Suspension Stiffnesskd1 = 2.535 × 10⁶ N·m−1Second-Class Rear Axle Suspension Stiffnessku3 = 2.14 × 10⁶ N·m−1
First-Class Middle Axle Suspension Stiffnesskd2 = 1.2675 × 10⁶ N·m−1Second-Class Front Axle Suspension Dampingcu1 = 9.8 × 10⁴ N·m−1·s−1
Disclaimer/Publisher’s Note: The statements, opinions and data contained in all publications are solely those of the individual author(s) and contributor(s) and not of MDPI and/or the editor(s). MDPI and/or the editor(s) disclaim responsibility for any injury to people or property resulting from any ideas, methods, instructions or products referred to in the content.