Article

Innovative Double Dumbbell-Shaped Flux-Switching Linear Tube Generator for Ocean Wave Energy Conversion: Design, Simulation, and Experimental Validation

by
Pooja Khatri
1,
Zhenwei Liu
1,
James Rudolph
1,
Elie Al Shami
2 and
Xu Wang
1,*
1
School of Engineering, Royal Melbourne Institute of Technology University, Melbourne, VIC 3083, Australia
2
Carnegie Clean Energy, Fremantle, WA 6159, Australia
*
Author to whom correspondence should be addressed.
Vibration 2025, 8(2), 32; https://doi.org/10.3390/vibration8020032
Submission received: 14 April 2025 / Revised: 3 June 2025 / Accepted: 11 June 2025 / Published: 13 June 2025

Abstract

:
This study introduces a novel double dumbbell-shaped flux-switching linear tube generator (DDFSLG) for ocean wave energy conversion. The innovative architecture features a uniquely shaped stator and translator, distinguishing it from conventional linear generators. Unlike traditional systems, the DDFSLG is housed in a cylindrical buoy. The translator oscillates axially within the stator. This eliminates the need for motion rectification and reduces mechanical friction losses in the power take-off (PTO) system. These design advancements result in high power output and improved performance. The DDFSLG’s three-phase coil circuit is another key innovation, improving electrical performance and stability in irregular wave conditions. We conducted comprehensive experimental validation using an MTS-250 kN testing system, which demonstrated strong agreement between theoretical predictions and measured results. We compared star and delta coil connections to assess how circuit configuration affects power output and efficiency. Furthermore, hydrodynamic simulations using the JONSWAP spectrum and ANSYS AQWA software (Ansys 13.0) provide detailed insight into the system’s dynamic response under realistic oceanic conditions.

1. Introduction

The potential of ocean waves to generate substantial power, estimated at 1 terawatt annually, presents a significant opportunity for sustainable energy production [1]. The open coastline of Victoria, Australia, has high wave energy density [2,3]. Wave energy conversion technologies play a crucial role in harnessing this energy, involving two main steps: capturing wave energy through a wave energy converter (WEC) and converting mechanical energy into electrical energy using power take-off (PTO) systems [4,5,6,7,8,9].
Linear tubular generators have been identified as an optimal choice for PTO devices due to their design simplicity, reliability, and robustness. Flux-switching linear generators [10,11,12,13] perform efficiently at low speeds but need careful control of thrust and cogging forces. A speed-amplified version using a fixed pulley [14] was later developed and optimized for higher output and lower cogging [15]. However, this fixed pulley design suffers from reliability and robustness issues. The geometric shape of the generator significantly impacts the PTO’s output power [16,17]. Shape optimization techniques were applied to rotational permanent magnet generators in [18] but have not been applied to linear generators. Farrok et al. [19] proposed a novel graphical method to optimize the shape of any linear generator. This method uses a complex model with a manually guided genetic algorithm, making parameter selection difficult during simulations. Kimoulakis et al. [20] analyzed the permanent magnet geometry’s effects on the cogging force of linear permanent magnet generators. However, the method was not applied in an ocean environment and was not validated experimentally. Previous research [21,22,23,24,25] has focused intensively on periodic properties and pull-in stability.
This paper introduces a wave energy converter with a unique double dumbbell-shaped flux-switching linear tube generator. Its stator contains alternating pole permanent magnet rings, positioned in outer slots and separated by thin steel shoulders. A dumbbell-shaped translator slides axially inside the hollow stator, inducing current in the surrounding coils. The dumbbell-shaped translator has a magnet inserted in the middle of its hollow core, with coils wound around its external surface. The double-dumbbell flux-switching linear generator is contained in a cylinder-shaped buoy and sealed from seawater. The stator is fixed to the inner floor of the buoy, and the translator is suspended from its ceiling using an elastic spring. This design allows a high output conversion power and easy access for maintenance. Placing the PTO system above the waterline, within the buoy, improves the generator’s efficiency and also enhances its reliability and durability. The analytical modeling and experimental validation of the WEC contribute new scientific insights to the field.
In our previous study of single-phase DDFSLG models, we compared the output performance of the DDFSLG with that of surface-mounted linear vernier hybrid machines [26]. In that research, the outer stator slots were not utilized with permanent magnets. However, in contrast to the previous study, we compared a single-phase DDFSLG model with permanent magnets on the outer stator slots with the conventional linear permanent magnet generator (CLPMG) [27]. The efficiency of the DDFSLG was calculated to be 77%. It was demonstrated that the DDFSLG outperformed the conventional linear generator. An output power of 42 W was generated under regular waves with a 1 m height.
The current study describes a three-phase linear tube generator with various magnetic pole arrangements in the stator’s outer slots. The generator’s performance is assessed through simulation models developed using ANSYS Electronics software (Ansys 18.2).
We derive dynamic equations for the WEC and its harvesting circuits using Newton’s second law and Kirchhoff’s current law. These are solved numerically using MATLAB/Simulink. Hydrodynamic analysis of the WEC is conducted using ANSYS AQWA boundary element analysis, with the derived hydrodynamic parameters used in subsequent simulations.
To analyze irregular wave effects, the JONSWAP spectrum and state-space method are used to calculate radiation damping and fluid memory forces. This helps better understand the generator’s behavior in real ocean conditions. The integration of innovative design features with advanced analytical and experimental validation methods aims to enhance the efficiency and performance of wave energy conversion systems, contributing to the sustainable utilization of ocean wave energy resources.

2. Methodology

This section details the methodology and design of the DDFSLG. We evaluate the generator’s three-phase coil performance in both star and delta configurations. We analyze the generator’s performance with various magnetic polarities and both star and delta three-phase coil configurations. We use ANSYS AQWA to develop an analytical model of the WEC and assess the generator’s efficiency in irregular wave conditions. Following simulation analysis, a hardware prototype is developed for experimental validation.

2.1. The Design

The DDFSLG consists of a dual dumbbell-shaped stator and translator. The hollow stator is formed by joining four stainless-steel dumbbell-shaped units into a single structure, while the translator consists of a single dumbbell moving within the stationary stator. Permanent magnets are placed in the outer slots of the stator, while copper coils are wound around the translator.
The stator and translator configurations are shown in Figure 1. Figure 1a shows the hollow stator. Figure 1b shows the stator’s outer slots with permanent magnets. The dumbbell shape of the translator is shown in Figure 1c. Figure 1d shows copper wires, highlighted in orange, wound around the outer surface of the dumbbell-shaped translator.
A longitudinally polarized NdFeB permanent magnet is inserted into the center of the hollow steel translator core, shown in red in Figure 1e. The translator’s shape and motion cause the air gap between it and the stator to vary continuously, leading to fluctuating flux density and induced current in the coils. The speed of the translator with respect to the stator plays an important role in increasing the power output. Although the Halbach arrangement is ideal for performance [28], its high manufacturing cost led us to adopt a more practical longitudinal polarity configuration for the DDFSLG.

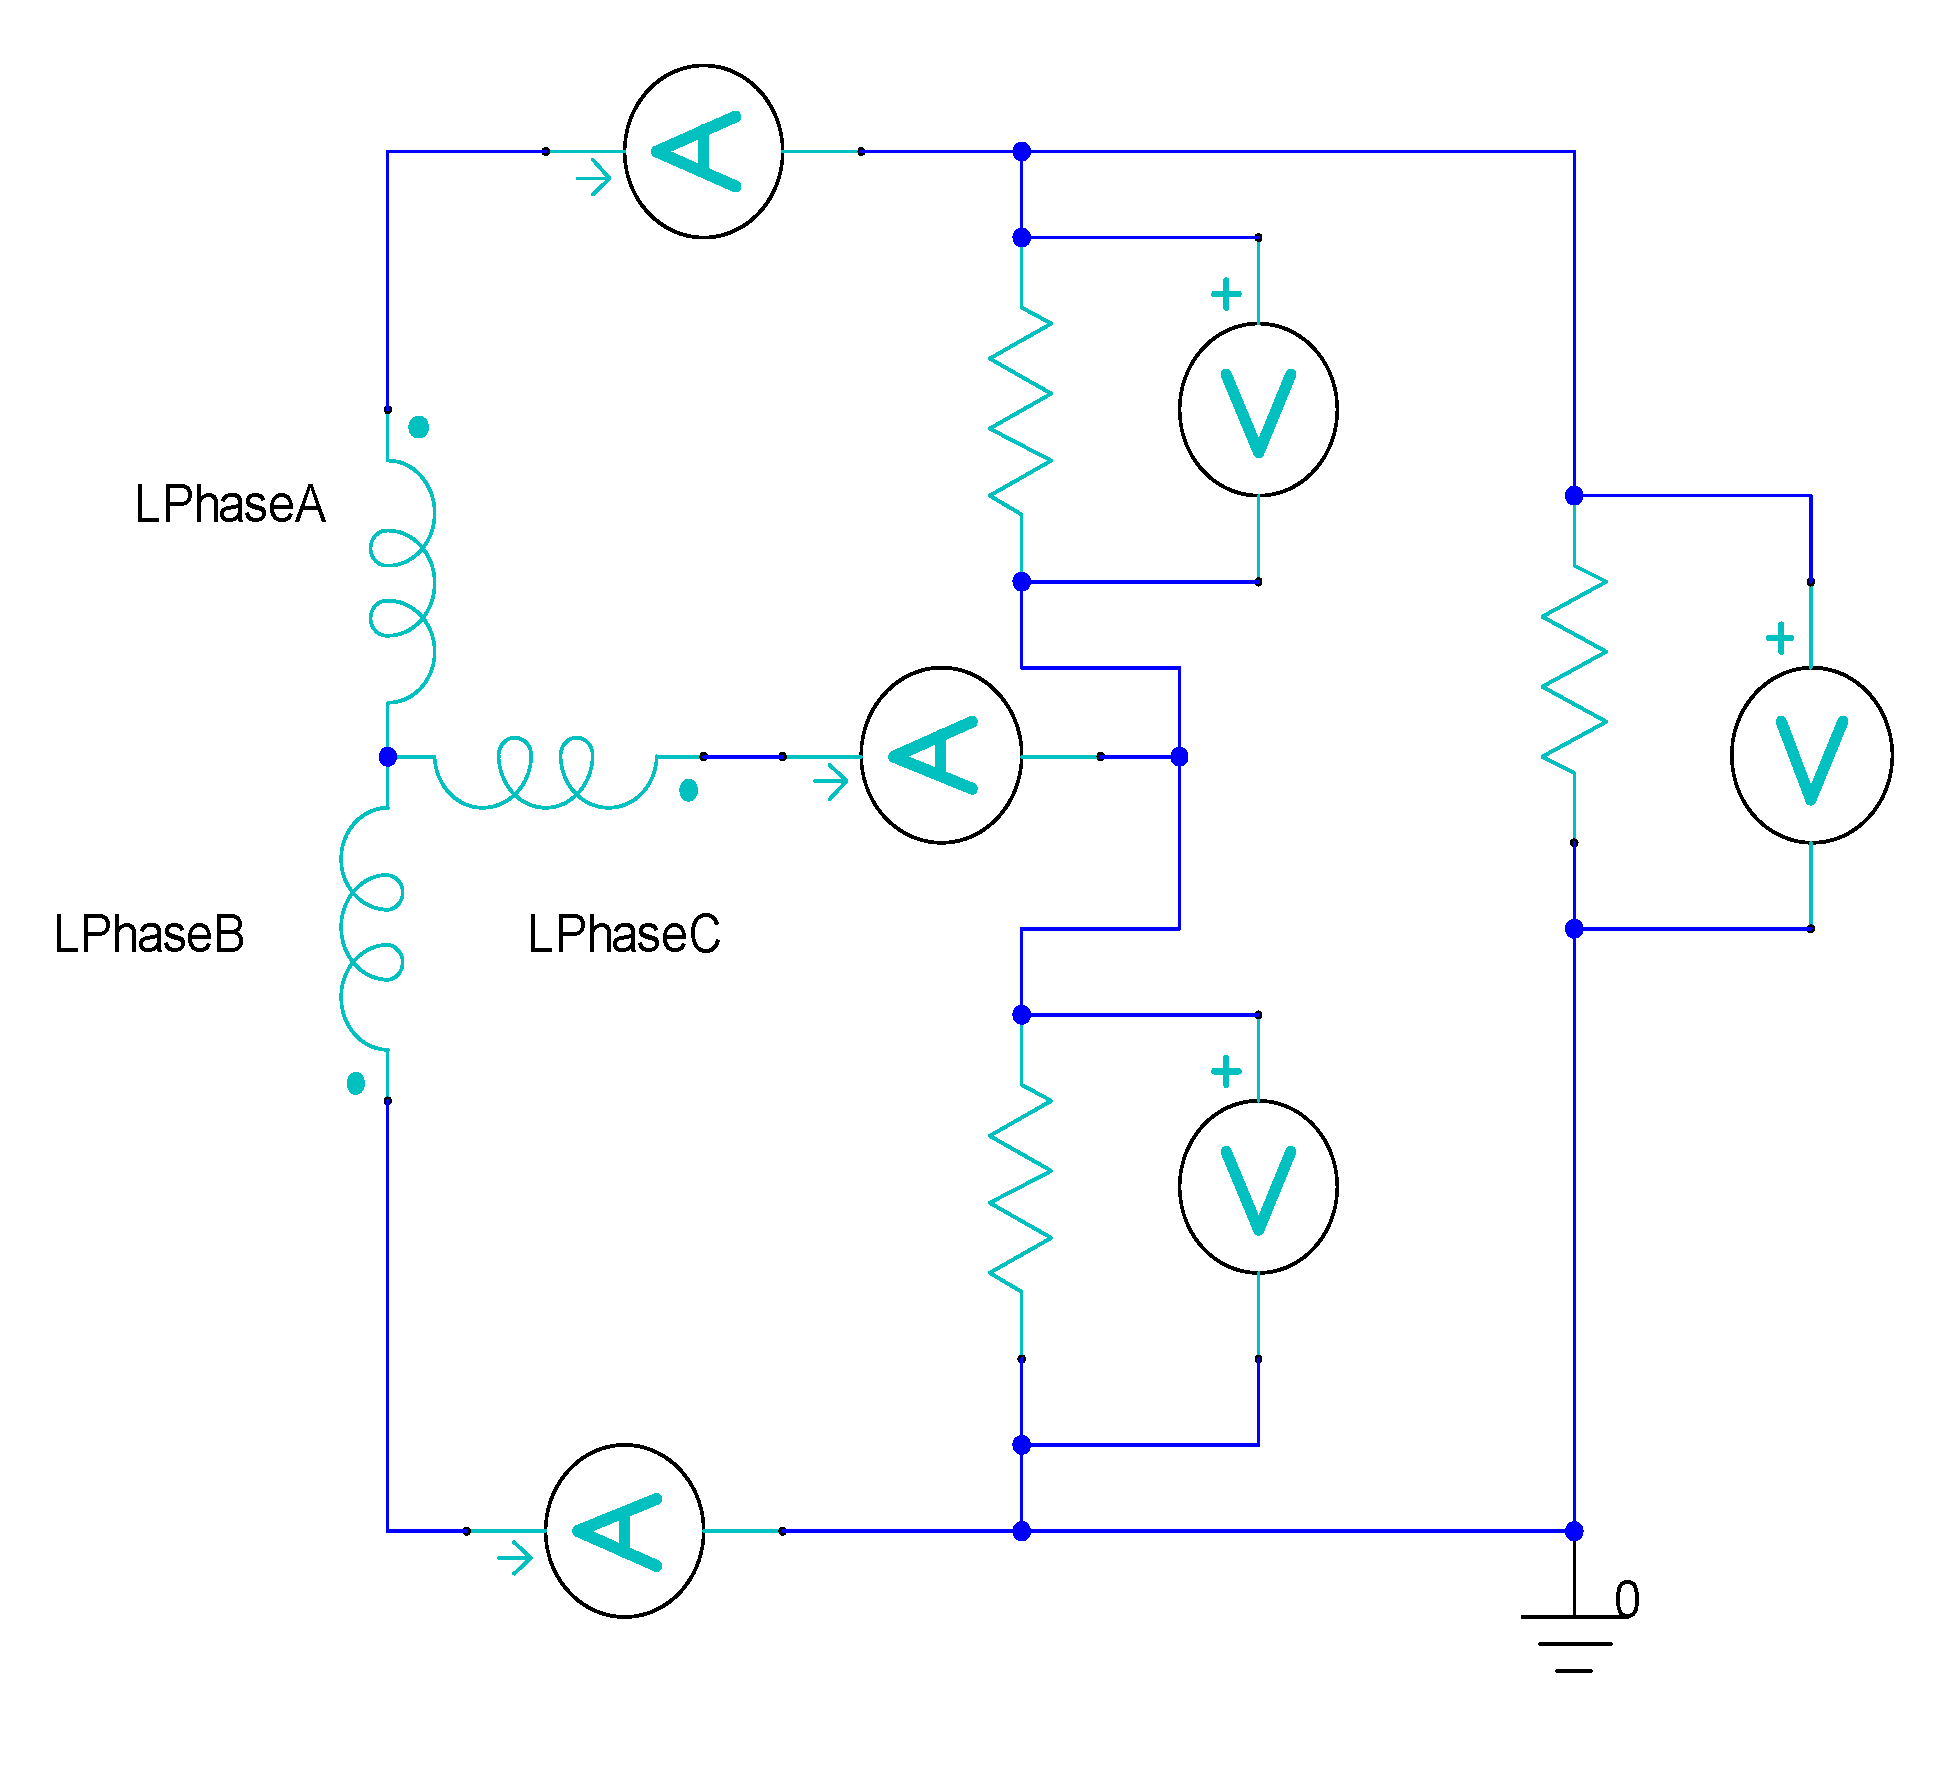
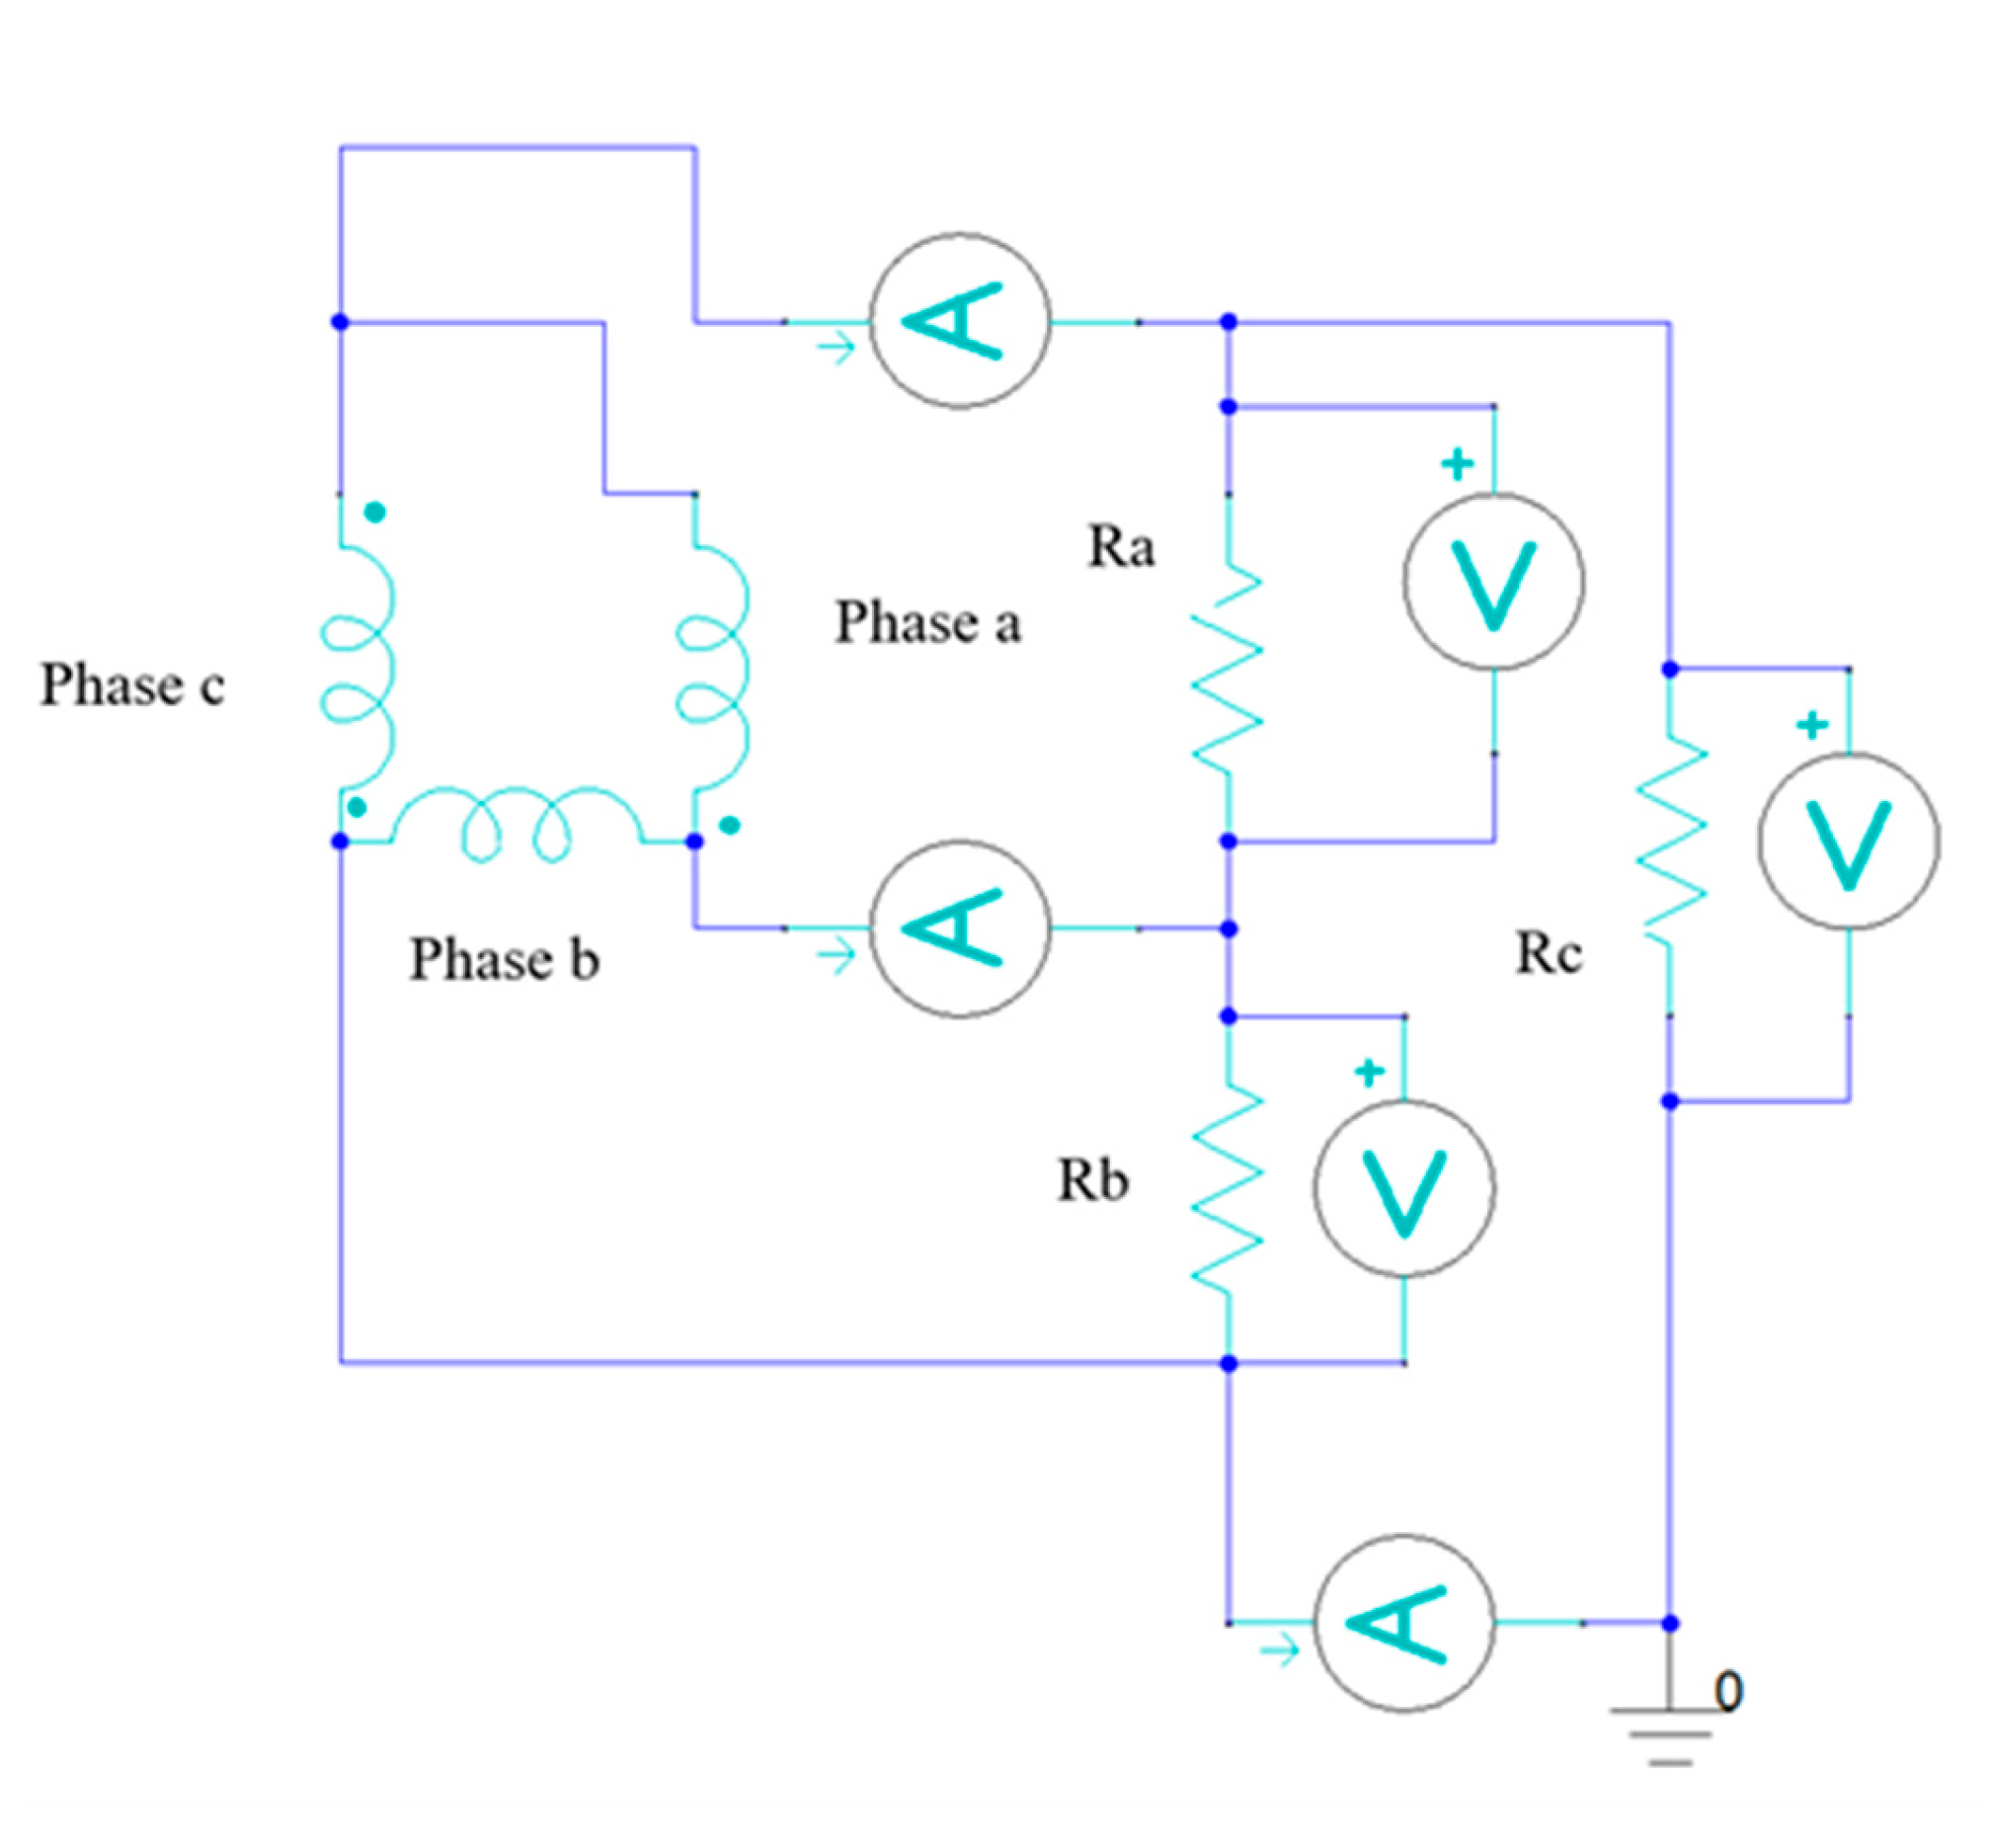
2.2. Star and Delta Connected Coil Phases of the Double-Dumbbell Linear Generator

A 3D finite element simulation model was developed and analyzed for the DDFSLG’s three-phase coil connection. The internal resistance of the three-phase coils was identified using the eddy current solver in ANSYS Electronics. The main design parameters are listed in Table 1.
Table 1 shows that each phase’s load resistance matches the corresponding coil’s internal resistance, ensuring impedance matching.

2.2.1. Star Coil Phase Connection of the DDFSLG in ANSYS Electronics Software Model

In the star (wye) connection, the three-phase coils are connected at a common neutral point, while the external load resistances are configured in a delta formation (Figure 2). In contrast, the delta coil phase connection links each coil’s endpoints in a loop, eliminating the neutral point. Both configurations are analyzed in ANSYS Electronics software for comparative evaluation. This ensures a valid comparison of the output performance between star and delta configurations. The three-phase connection with the three-load resistance constitutes the three-line voltage, i.e., Vac (between Phases A and C), Vbc (between Phases B and C), and Vab (between Phases A and B), whereas the voltage observed across Phase A, Phase B, and Phase C is referred to as phase voltage.
A transient solution setup with a linear time step size of 0.005 s is applied, and the DDFSLG design model is analyzed for the three-phase star connection. In the star coil phase connection, three-line currents should be equal to the three-phase currents, as shown below.
I L = I p h
The results from the three-phase star connection will be discussed in Section 3.

2.2.2. Delta Coil Phase Connection of the DDFSLG in ANSYS Electronics Software Model

In the delta connection (Figure 3), each coil’s end is connected to the start of the next, forming a closed loop. Output wires are taken from the junctions. The external load resistances are connected in a delta configuration at the junctions between the coil ends. In the delta coil phase connection, there is no neutral point. It is a three-phase, three-wire system. This external circuit is imported into the ANSYS Electronics software as an excitation input to the coil terminals. The model settings are the same as those for the star phase connection. A sinusoidal input velocity of sin(2πft) m/s is applied to the translator. A similar transient solution setup is applied for the delta coil phase connection with a linear time step size of 0.005 s. The solver is run after validating the external circuit with the design model. Simulations confirm that, in the delta connection, the line voltages equal the phase voltages, as expected from theory [29].
V L = V p h

2.3. Analytical Model for the WEC of the DDFSLG Under Irregular Waves

An analytical model for the WEC is developed under irregular ocean wave conditions using ANSYS AQWA software. The DDFSLG is housed in a 1 m-wide cylindrical buoy, with the translator suspended inside the stator using a steel spring. The stator was fixed onto the inner floor of the buoy’s frame, as shown in Figure 4. The system’s dynamic equations are derived using Newton’s second law and Kirchhoff’s current law and are solved using MATLAB/Simulink. The JONSWAP spectrum is employed to simulate irregular wave behavior and assess generator performance.
We conducted a dynamic analysis of the single-phase DDFSLG-based WEC. For the ocean wave energy conversion, the power take-off (PTO) must synchronize with the buoy. With the movement of the ocean waves, the linear translator will move up and down, oscillating with the spring. As the translator moves, it changes the magnetic flux through the surrounding copper coils, inducing current.
The dynamic equations for the two-degree-of-freedom oscillating WEC system are derived using Newton’s second law and are expressed as:
m 1 + m d x ¨ + c p x ˙ y ˙ + k p x y + t R I F t τ x ˙ t d τ + F h + B I l = F e
m 2 y ¨ k p x y B I l c p x ˙ y ˙ = 0
where m 1   is the total mass of the buoy and stator, m 2   is the mass of the translator, and m d is the hydrodynamically added mass. The hydrodynamically added mass is calculated through the ANSYS AQWA simulations of the buoy. x and y are the displacements of the buoy/stator and translator, respectively. x ¨   and y ¨ are the accelerations of the buoy/stator and translator. c p is the mechanical damping coefficient of the spring, and k p is the spring stiffness coefficient. The values of   c p and k p are determined from the experiments, as illustrated in Section 3 below.
Radiation damping force is given as t R I F t τ x ˙ t d τ , where R I F t τ is the response impulse function, which is the inverse Fourier transform of the radiation damping spectrum. The total force acting on the buoy and stator mass point m1 is given in Equation (1). F h   is the hydrostatic force and is calculated by the hydrostatic spring stiffness kh multiplied by the buoy and stator mass point displacement x. Equation (2) defines the total force on the translator (mass m 2 ), balancing the inertia, spring, Lorentz, and damping forces.
The electrical circuit equation of the generator is given by
B l y ˙ x ˙ = I R e + R i + L e ( d I d t )
where B is the magnetic flux density that is identified by the experiments, as illustrated in Section 3 below. l is the length of the coil, Re is the external load resistance, Ri is the internal resistance of the generator translator coil, L e is the self-inductance of the coil, and I ˙ is the change rate of the current across the coil. I is the current across the coil. The parameters of the linear electrical machine are listed in Table 2.
In general, irregular waves are more common in the ocean than regular waves. The ocean surface fluctuations of irregular waves in the wave-elevation space may be written as
η x 1 , t = i = 1 A i c o s ( k i x 1 ω i t + ε i ) i = 1 N A i c o s ( k i x 1 ω i t + ε i )
where N is the variable rounded off number of the wave harmonics, ε i is the random phase of irregular waves, and x 1 is the position of the buoy.
A i = 2 ·   S ω i ·   Δ ω
ω i 2 = g ·   k i · tanh ( k i · d h )
where g is the gravity acceleration and given by 9.81 m/ s 2 ; Δ ω is the damping frequency bandwidth; and d h is the depth of the ocean.
S( ω i ) is the JONSWAP spectrum function at the frequency ω i and is given by
S ω i = α g 2 ω i 5 exp 1.25   ( ω p ω i ) 4 . γ e x p 0.5 ( ω i ω p σ ω p ) 2
where σ = 0.07, when ω p > ω i , and σ = 0.09, when ω p < ω i .
ω p is the peak frequency, and γ is a constant, which is selected as 3.3, according to [29]. ω i is the wave excitation frequency, and α is given by
  α = 5.061 · ( ω p 2 π ) 4 · H s 2 · 1 0.287 · l n ( γ )
where H s is the significant wave height.
We calculate the wave excitation force for irregular waves using the following expression:
F e n t = i = 1 N A i · F e n ω i · c o s ( k i x 1 ω i t + ε i )
where A i is the wave amplitude of the wave frequency ω i . F e n ω i is the wave excitation force spectrum in the frequency domain, which is calculated from the ANSYS AQWA simulations, ω i is the wave excitation frequency, k i is the wave number, and ε i is the random phase of the irregular waves.   ω i and A i are calculated by solving Equations (5)–(8) from the JONSWAP spectrum, which is integrated with an Australian sea state data where a significant wave height of 3 m and peak period of 10 s are considered. The Runge Kutta numerical integration of Equations (1)–(3) in MATLAB/Simulink calculates the velocity of both the buoy and the translator and the branch current. We calculate the radiation damping force using an inverse Fourier transform of the damping spectrum combined with a state-space model. The added mass, radiation damping spectrum, and wave excitation force are obtained from the ANSYS AQWA boundary element software simulation of the buoy.
The total available power is given by
P t t = 4 T 0 T c p + c e · x ˙ t y ˙ t 2 d t
c p and c e are the mechanical and electrical damping coefficients. The electrical damping coefficient is calculated by c e = B . I . l x ˙ y ˙ . The generated electrical power is calculated as
P = I 2 · R e
The results are elaborated in Section 3.

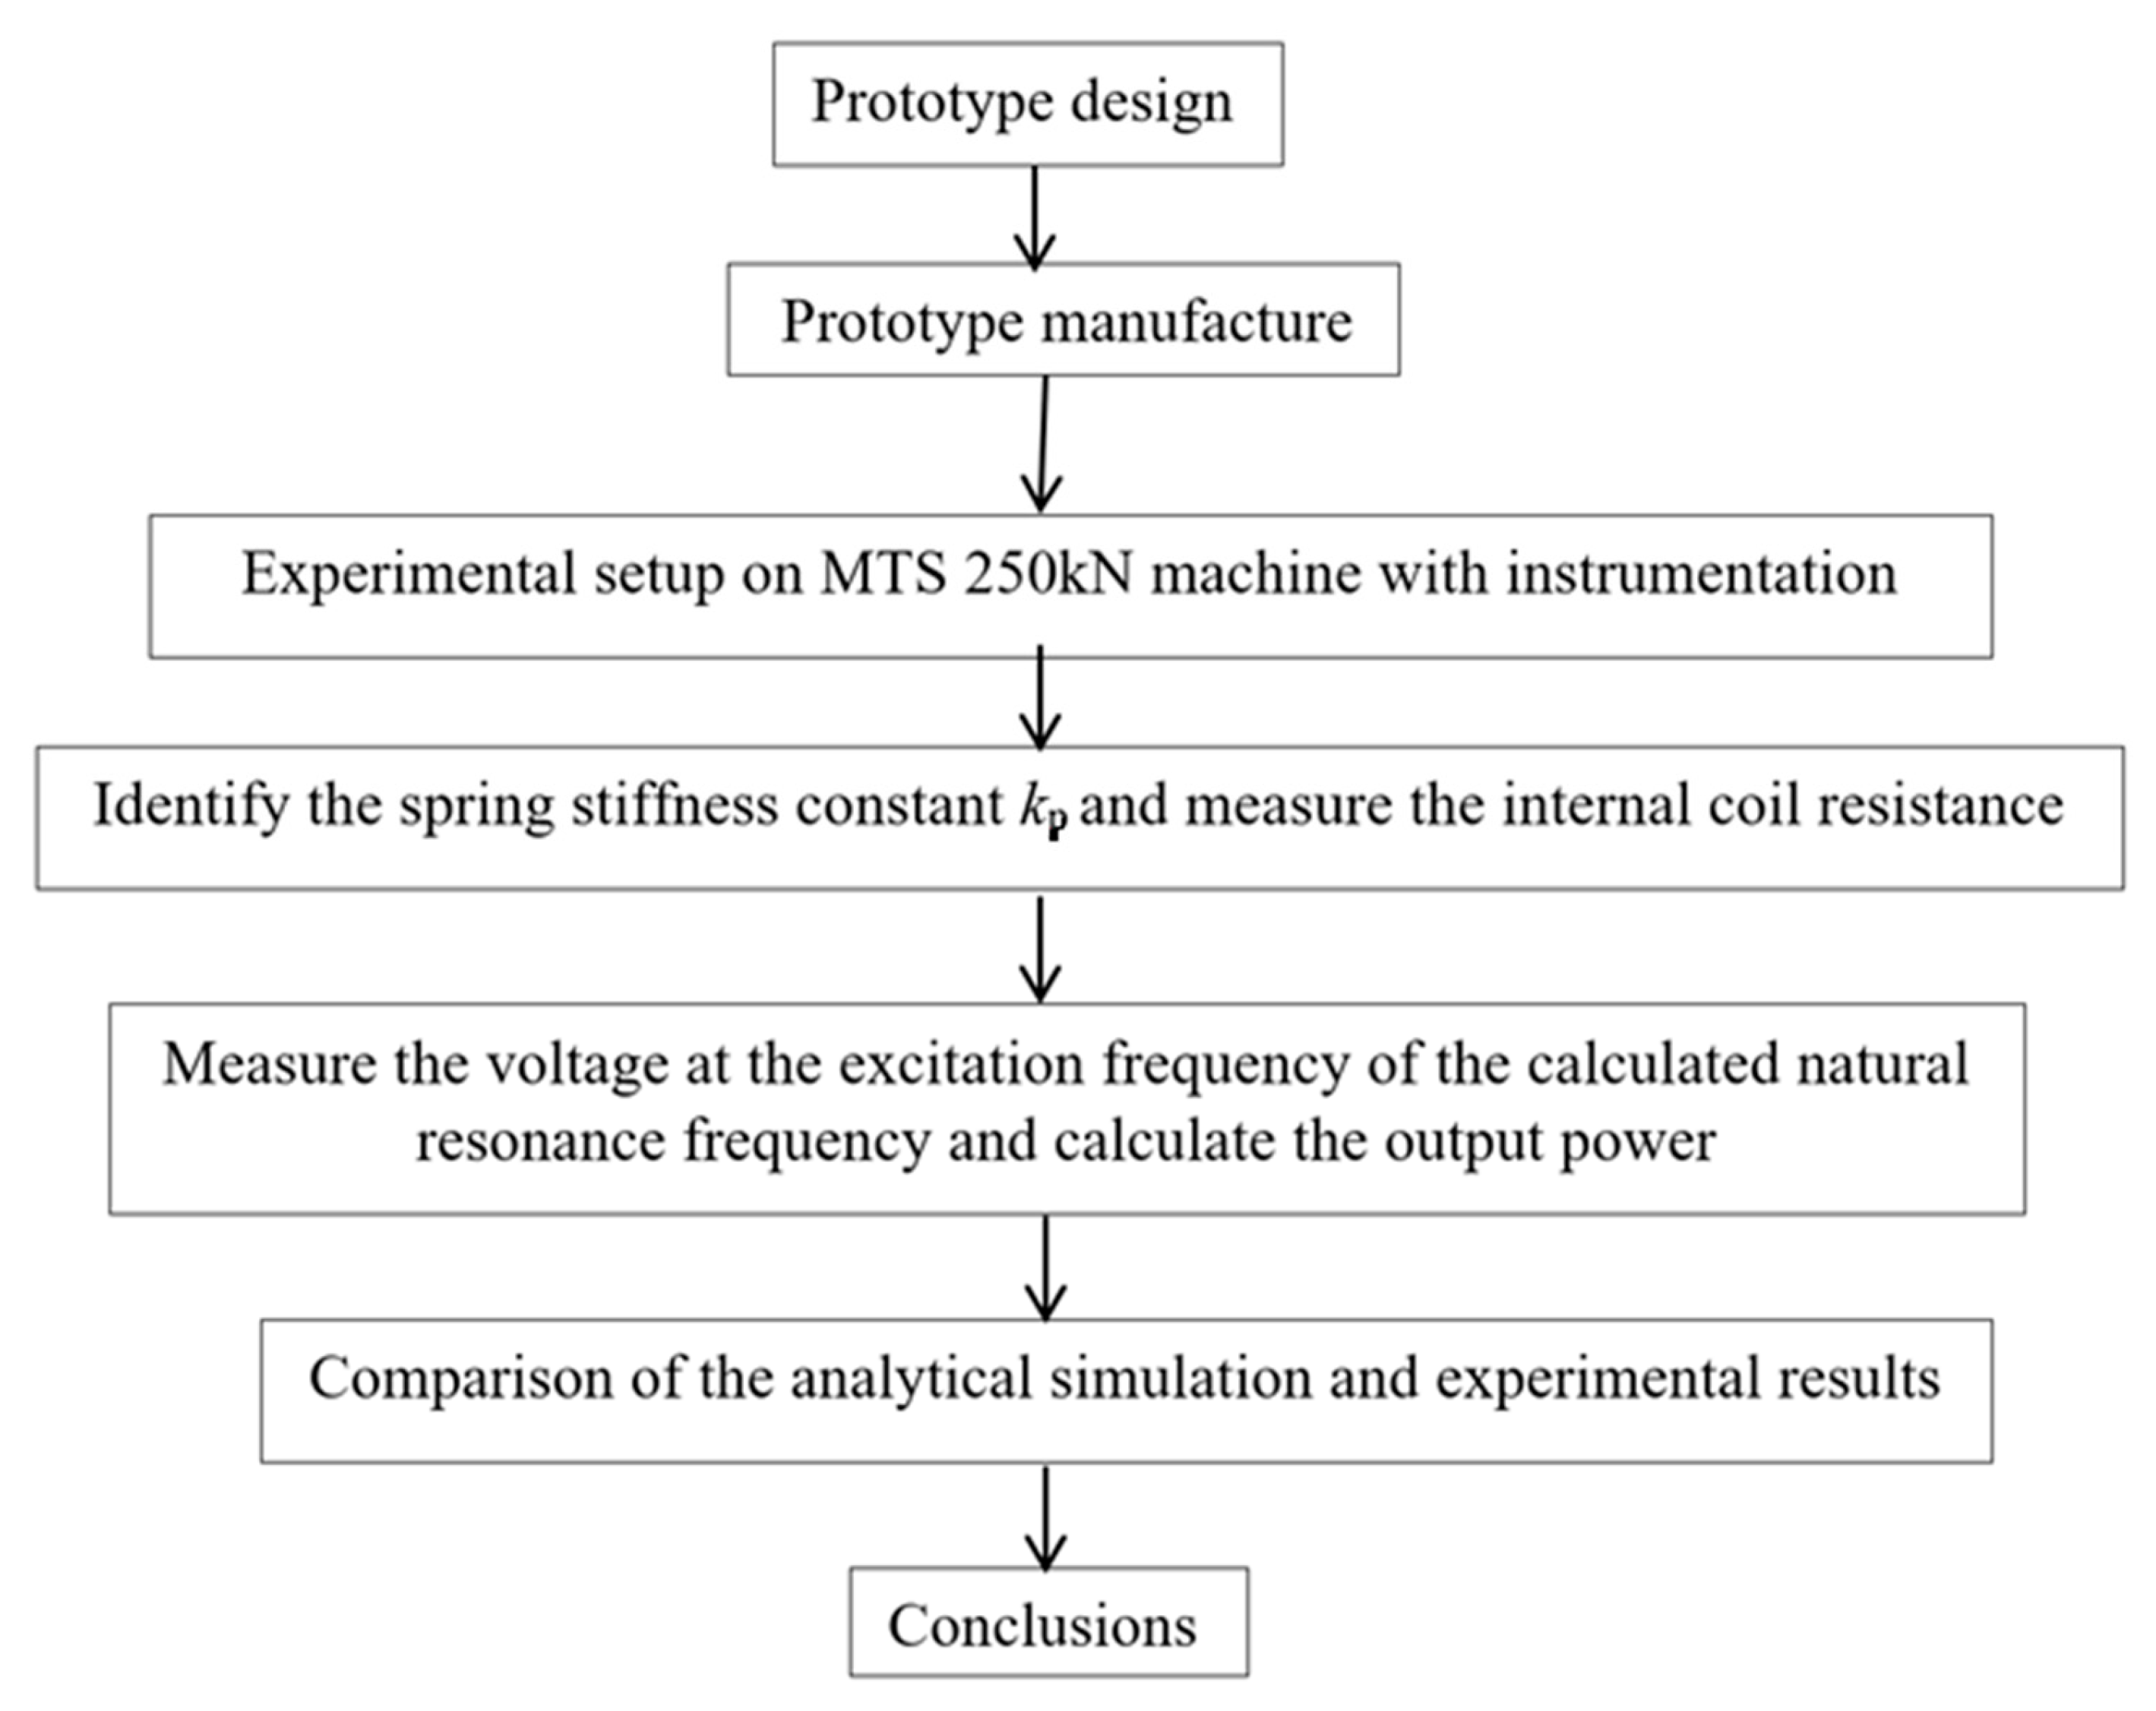
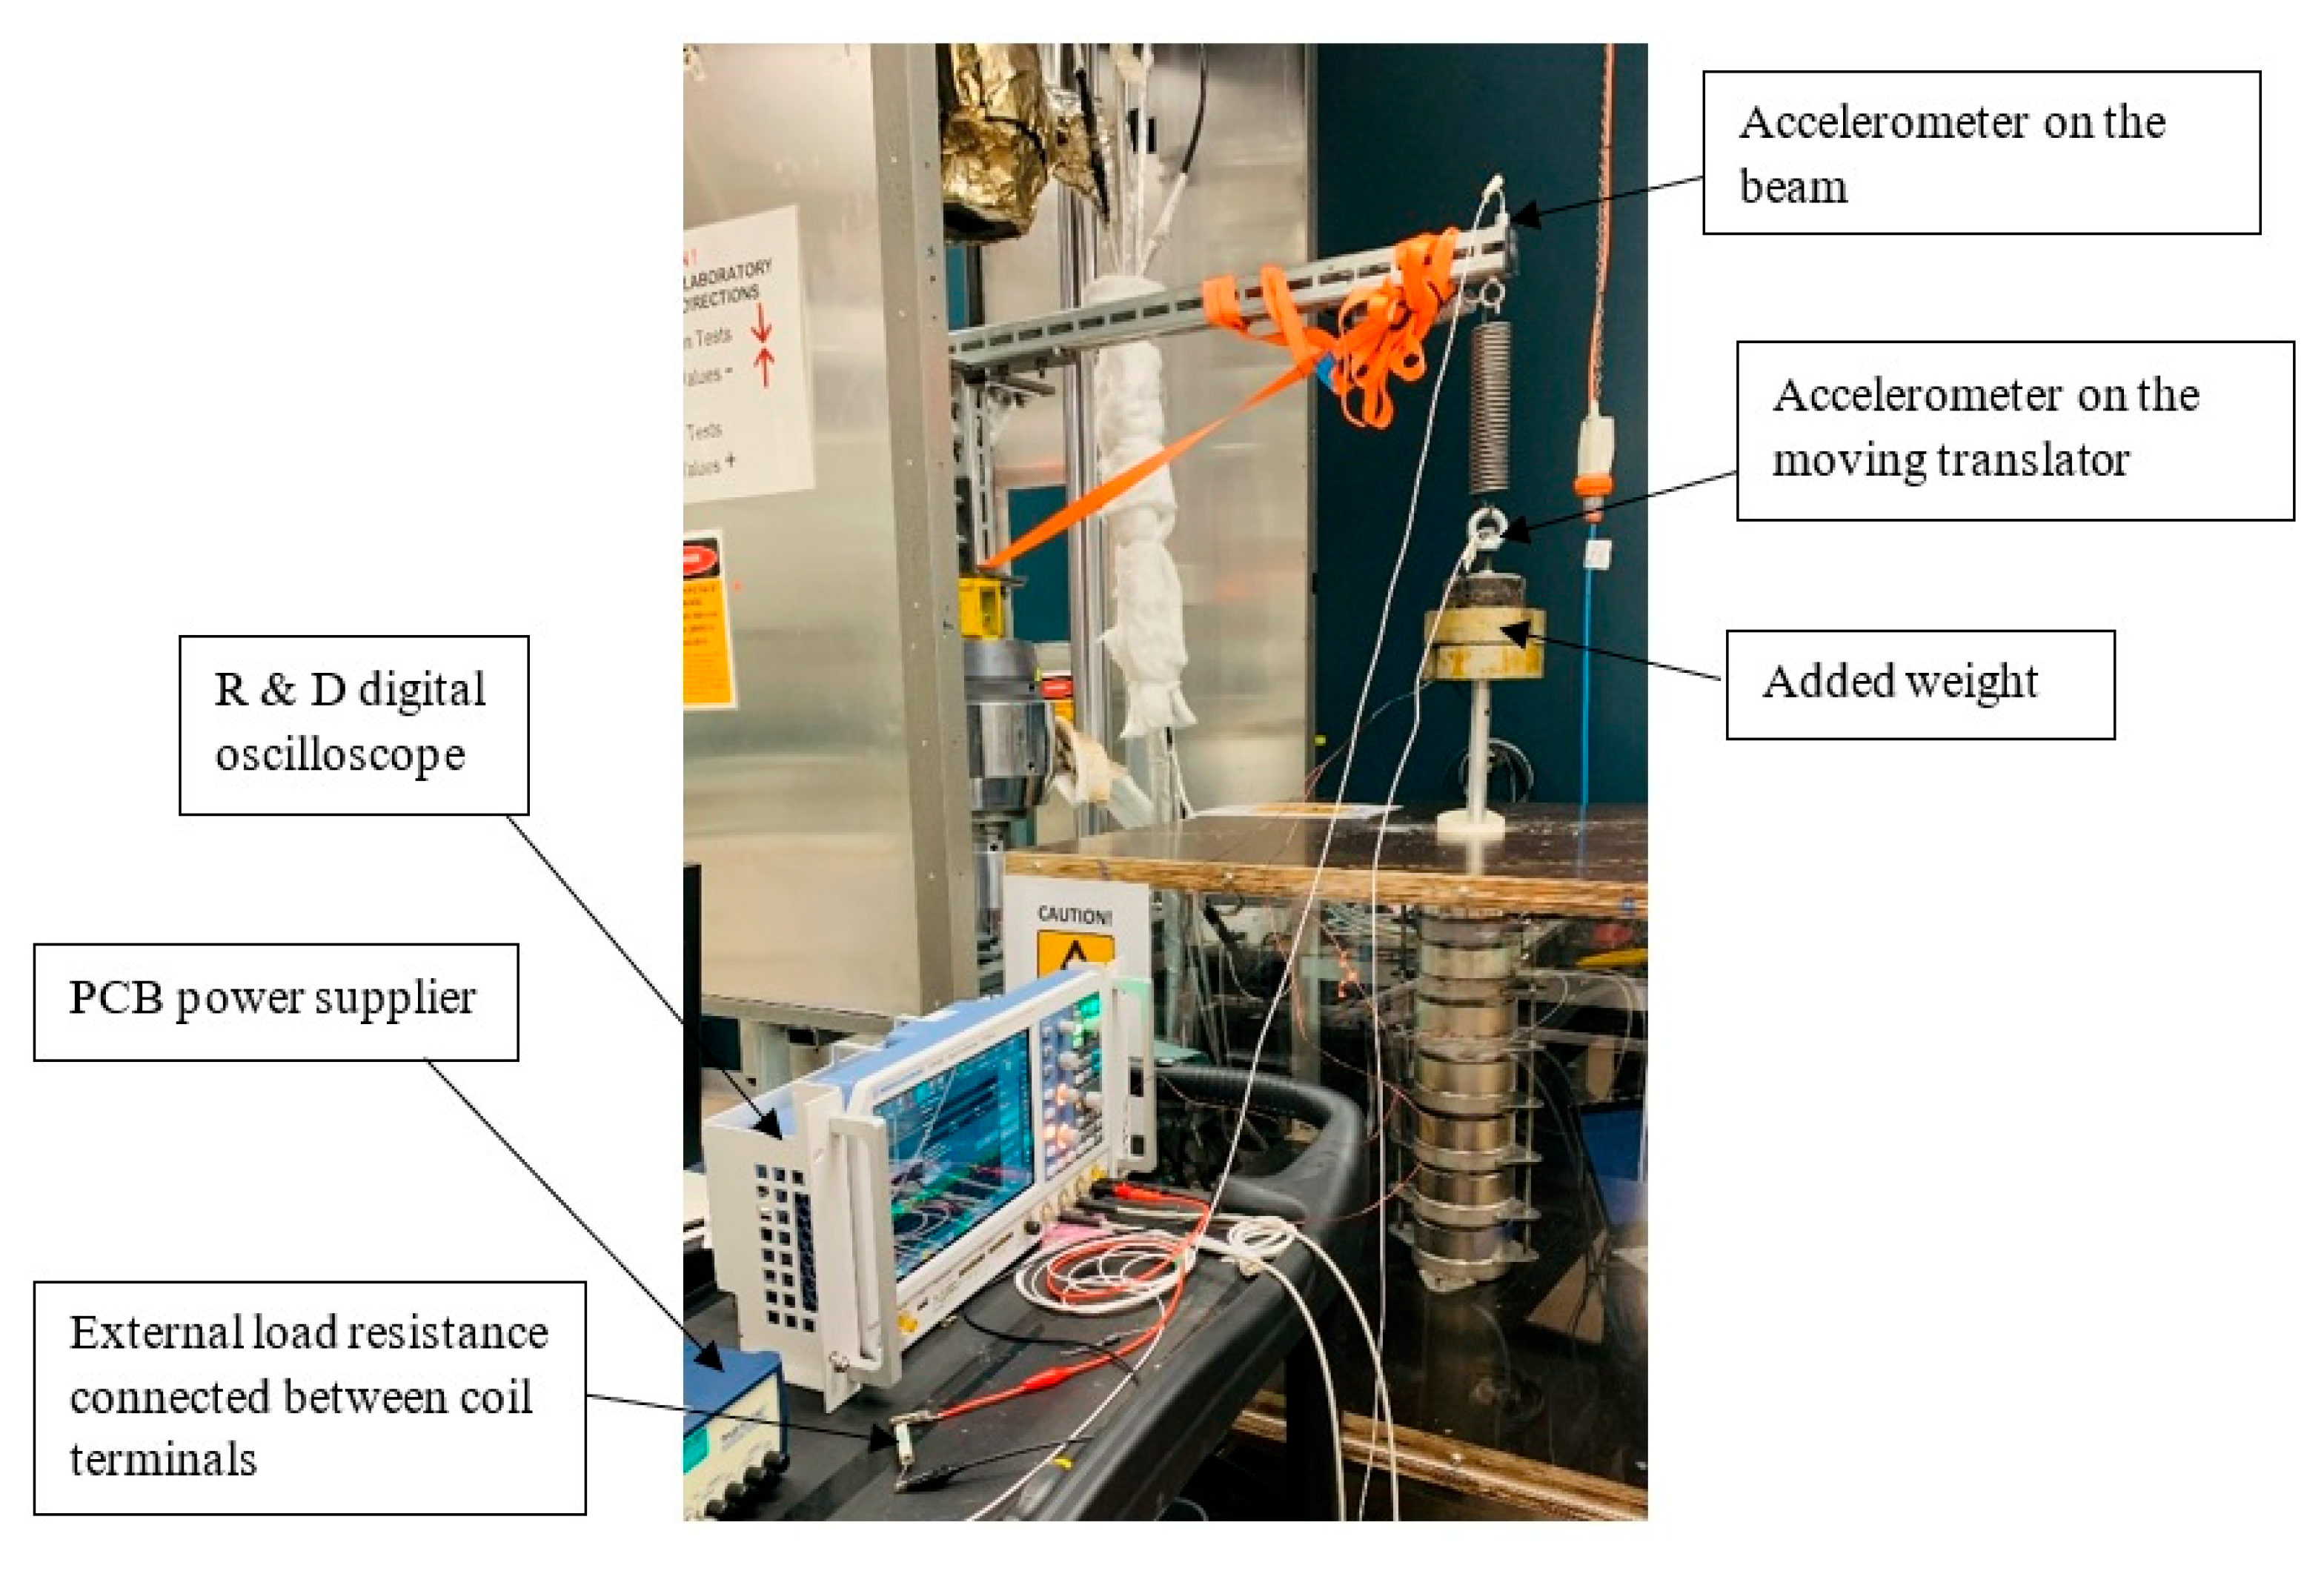
2.4. Experimental Validation

We used an MTS-250 kN machine to validate the DDFSLG design and its performance under ocean wave-like conditions. Key parameters such as translator natural frequency, spring constant, internal resistance, and coil inductance were measured. We tested the DDFSLG prototype under varying excitation frequencies and displacement amplitudes to measure voltage and power output.
The experimental procedure involved the following.
  • Installing the prototype on an MTS machine;
  • Measuring the spring constant using Hooke’s law;
  • Observing voltage output across external load resistances (4 Ω, 5 Ω, 7 Ω, 10 Ω, 15 Ω, 26 Ω);
  • Comparing experimental results with theoretical predictions.
The measured and simulated results align closely, validating the analytical models.

2.4.1. Experimental Methodology

The experimental methodology for the DDFSLG is illustrated in the flowchart in Figure 5. The design parameters for the DDFSLG are shown in Table 3. The prototype was installed on an MTS machine. A suitable spring was selected for the prototype. The spring constant was measured and calculated using Hooke’s law. Voltage output was measured at the natural frequency and different translator acceleration amplitudes using load resistances of 4, 5, 7, 10, 15, and 26 Ω. The natural frequency of the moving translator was calculated through the measured spring stiffness constant and oscillator mass. We operated the MTS machine at the calculated natural frequency and applied varying excitation amplitudes. The experimental results closely matched the simulation predictions, validating the theoretical model, as detailed in Section 3.3.1.

2.4.2. Experiment Procedure

The same procedure was followed for all tests, with varying load resistances connected to the DDFSLG coil terminals. The assembled prototype was installed on the MTS machine. The maximum excitation displacement amplitude of the MTS machine was obtained at the excitation frequency of the calculated natural resonant frequency. All the measured and identified parameters are summarized in Table 4. Seven permanent magnet rings of NdFeB, N50 grade, with alternating axial polarity were mounted on the stator’s outer slots. Figure 6 shows the stationary steel stator with permanent magnets on the outer slots, which is protected by Perspex housing. A long permanent magnet rod, as shown in Figure 7a, was inserted into the hollow dumbbell translator, as shown in Figure 7b.
The complete setup is shown in Figure 8, where accelerometer signals were routed through two PCB power supplies and fed into the first two channels of a digital oscilloscope. Both accelerometers and oscilloscope channels were calibrated to ensure accurate measurements. The external load resistance of 7 Ω and then 4 Ω, 5 Ω, 10 Ω, 15 Ω, and 26 Ω was connected to the two output terminals of the coil. The voltage output across the load resistance was measured while the accelerations of the free end of the beam and translator were recorded. The measurement results are discussed in the next section.

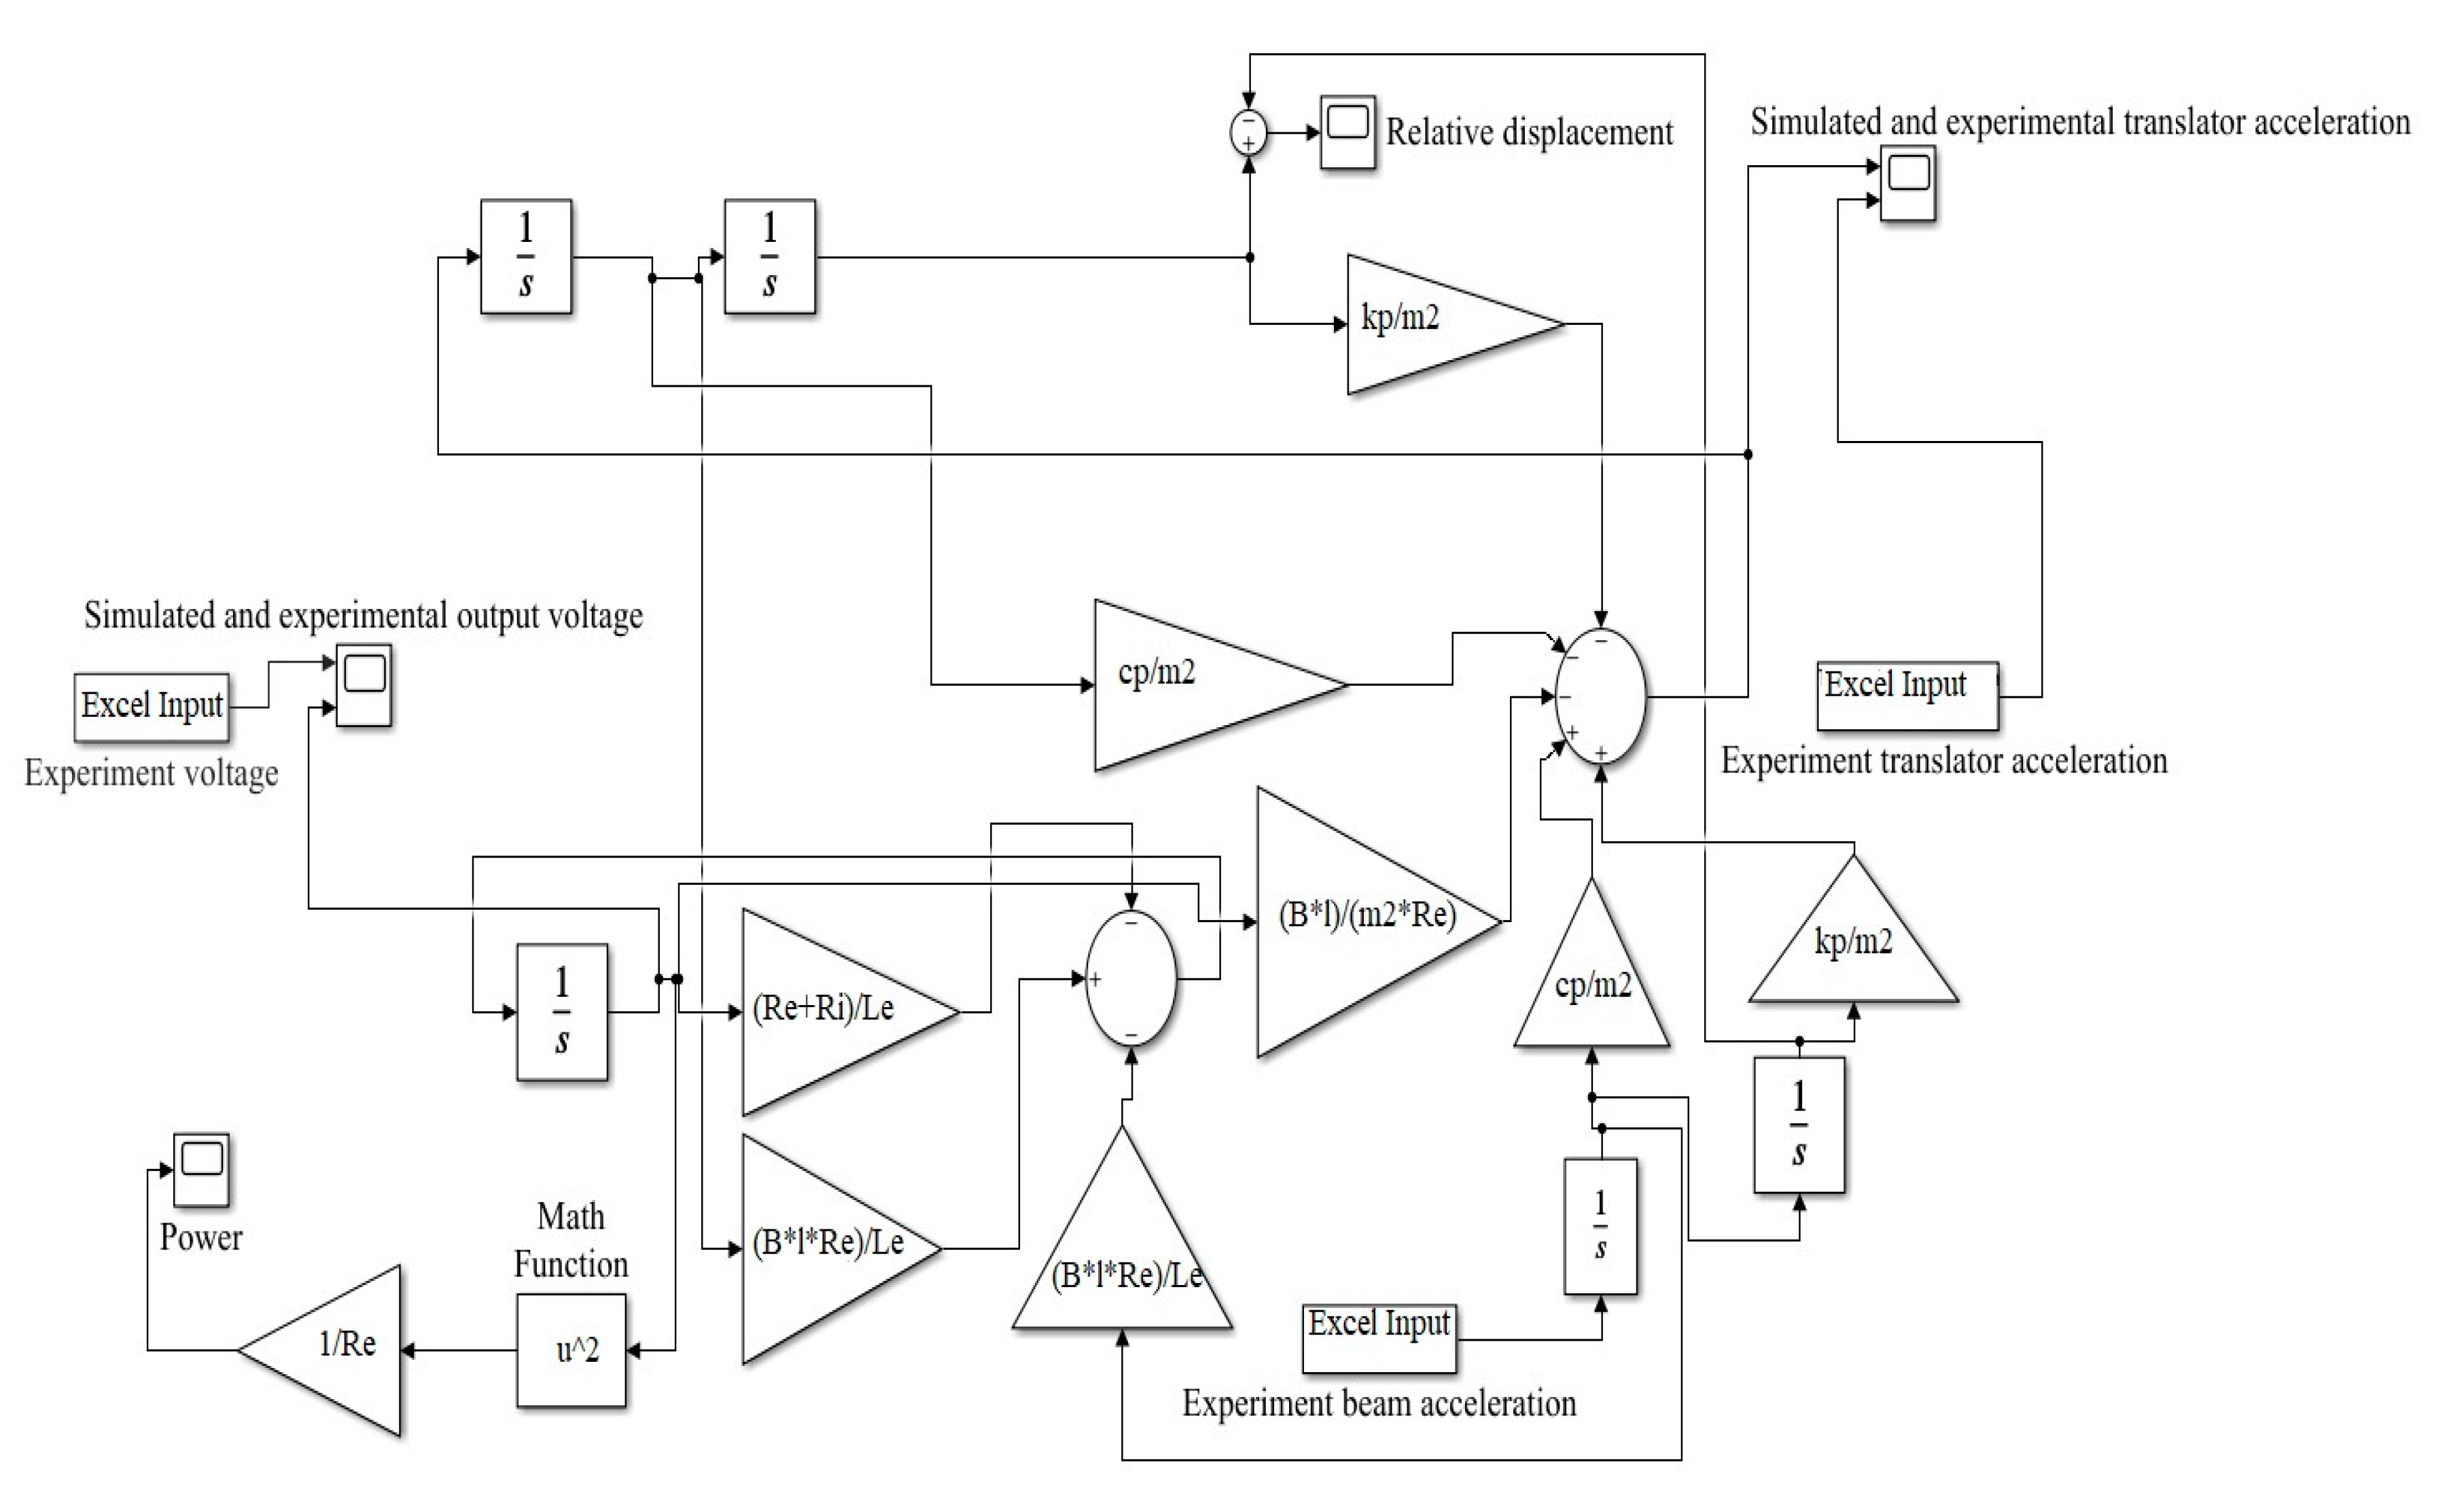
2.4.3. Analytical Simulation Model for the DDFSLG Testing Device

There are no buoy or wave hydrodynamics in the above DDFSLG dry test device setup. Thus, Equation (1) does not exist for the dry test device. However, the differential equations of the translator and electrical circuit are given according to Equations (2) and (3) as
m 2 y ¨ k p z y B I l c p z ˙ y ˙ = 0
B l y ˙ z ˙ = I R e + R i + L e ( d I d t )
Rearranging the above two equations gives
y ¨ = c p m 2 y ˙ k p m 2 y + c p m 2 z ˙ + k p m 2 z B l m 2 V R e
V ˙ = V L e R e + R i + R e B l L e y ˙ R e B l L e z ˙
where y and z are, respectively, the displacements of the translator and free end of the cantilevered beam, as shown in Figure 8, R e is the external load resistance, R i is the coil internal resistance, l   is the length of the coil, and I is the induced current. I can also be written as V R e . Based on the above-rearranged Equations (14) and (15), the Simulink model was developed using MATLAB/Simulink software (Ansys 18.2), as shown in Figure 9. The acceleration data of the free end of the beam recorded from the MTS hardware testing was fed as source input into the Simulink model in an excel file format. The MATLAB/Simulink code was run to identify the values of magnetic flux density, B, and damping coefficient, cp, in order to match the peak-to-peak values of the predicted load voltage and translator acceleration with the measured ones.

3. Results and Discussion

Simulations show that the star connection yields higher branch voltages and currents, while the delta connection results in higher phase voltages and greater overall power output. The experimental data corroborate these findings, demonstrating a peak power output of 0.33 W at an external load resistance of 7 Ω. The system efficiency under irregular wave conditions reaches 7.90%.

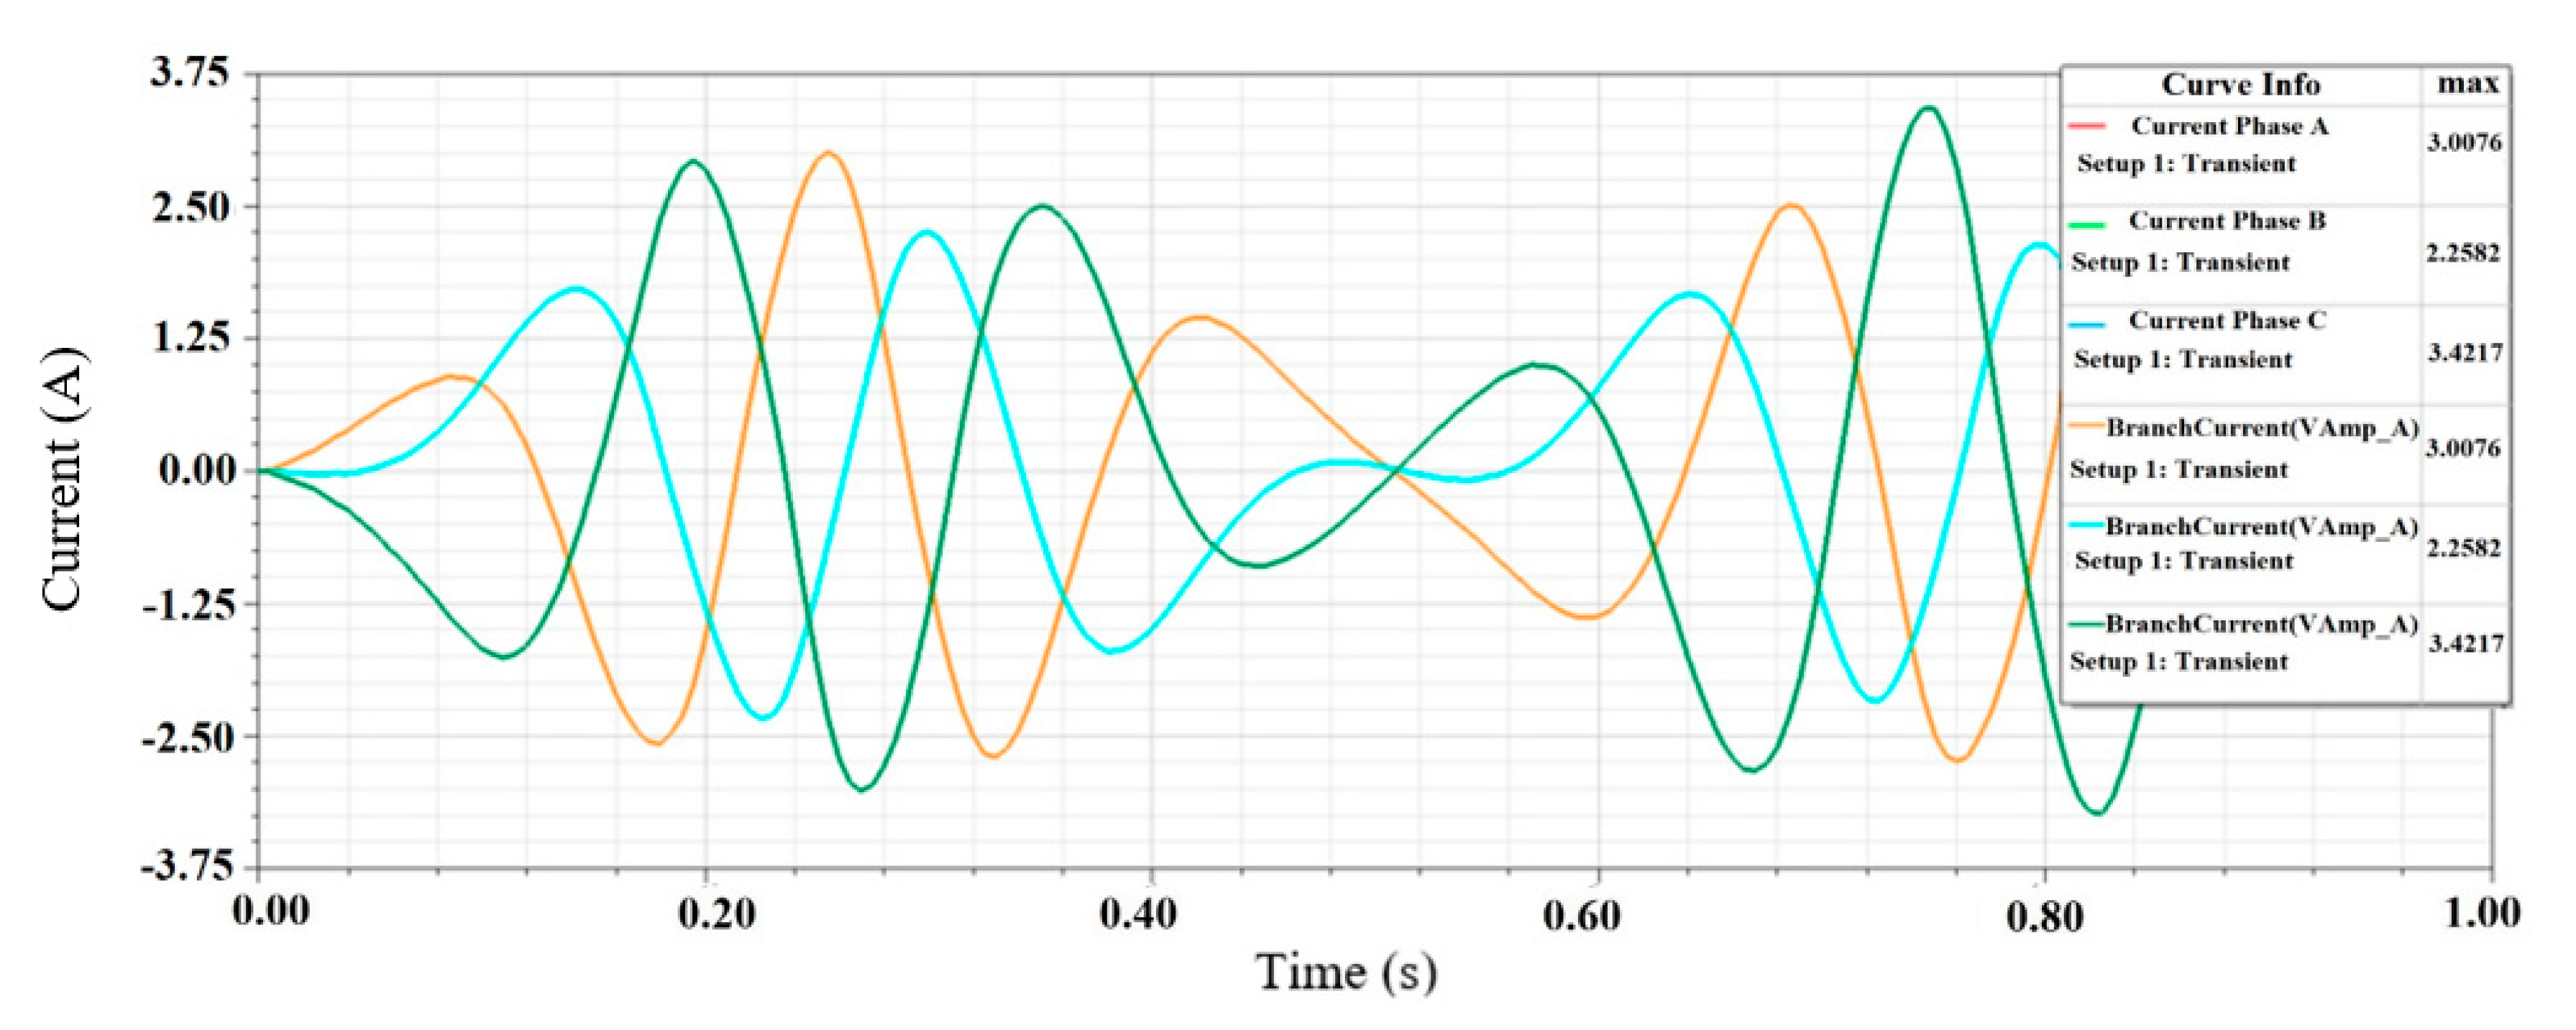
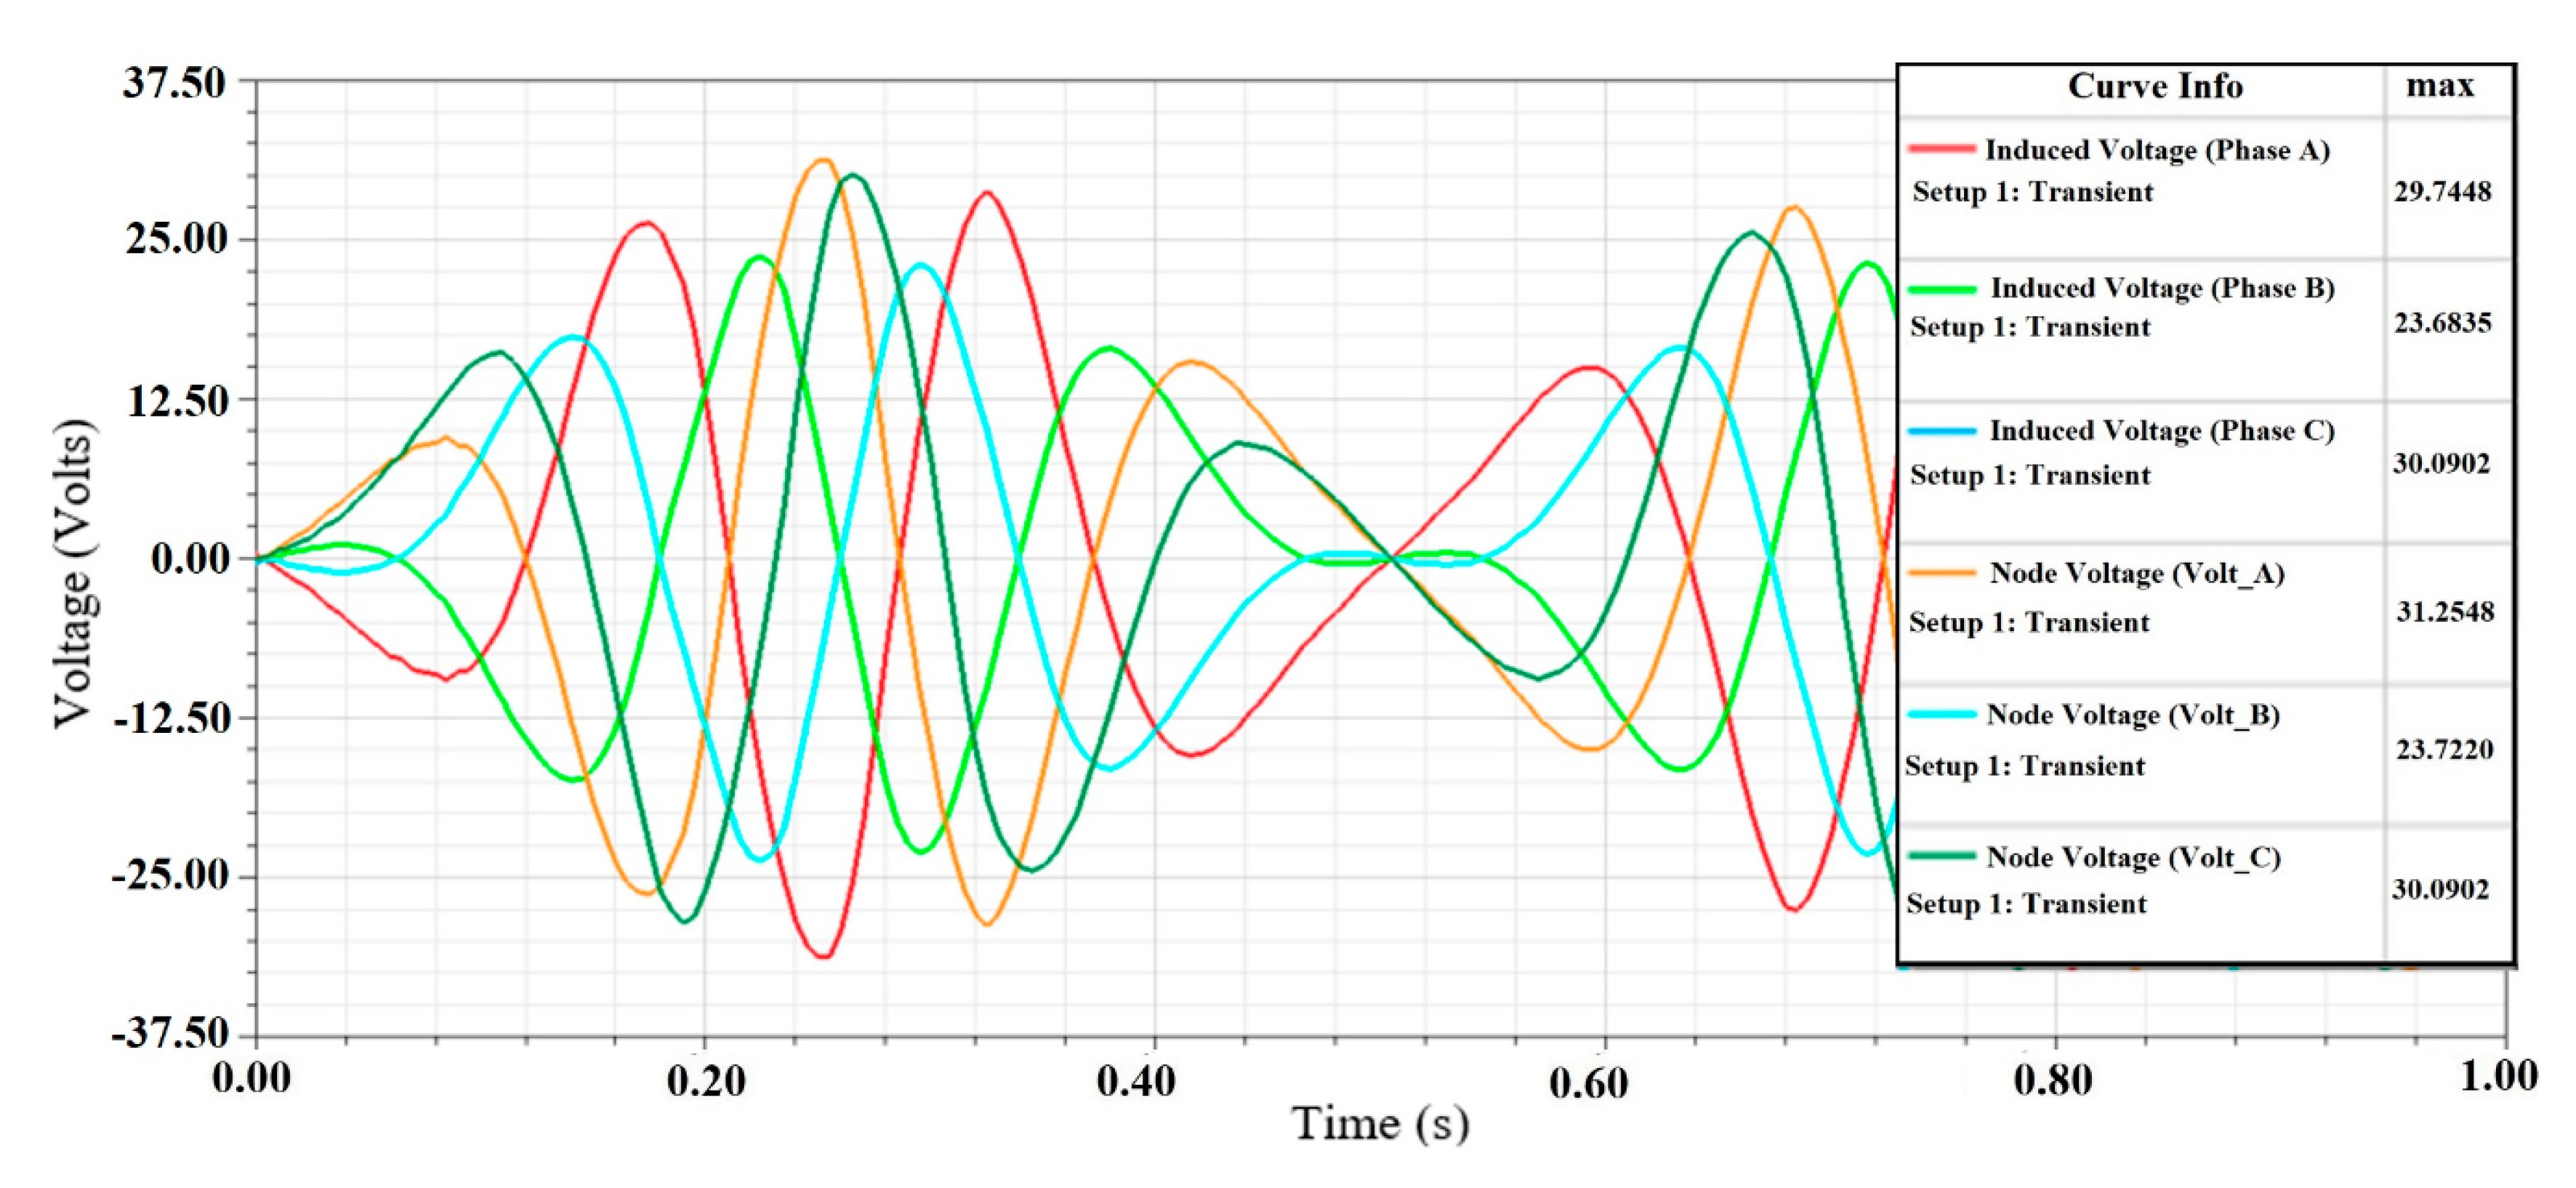
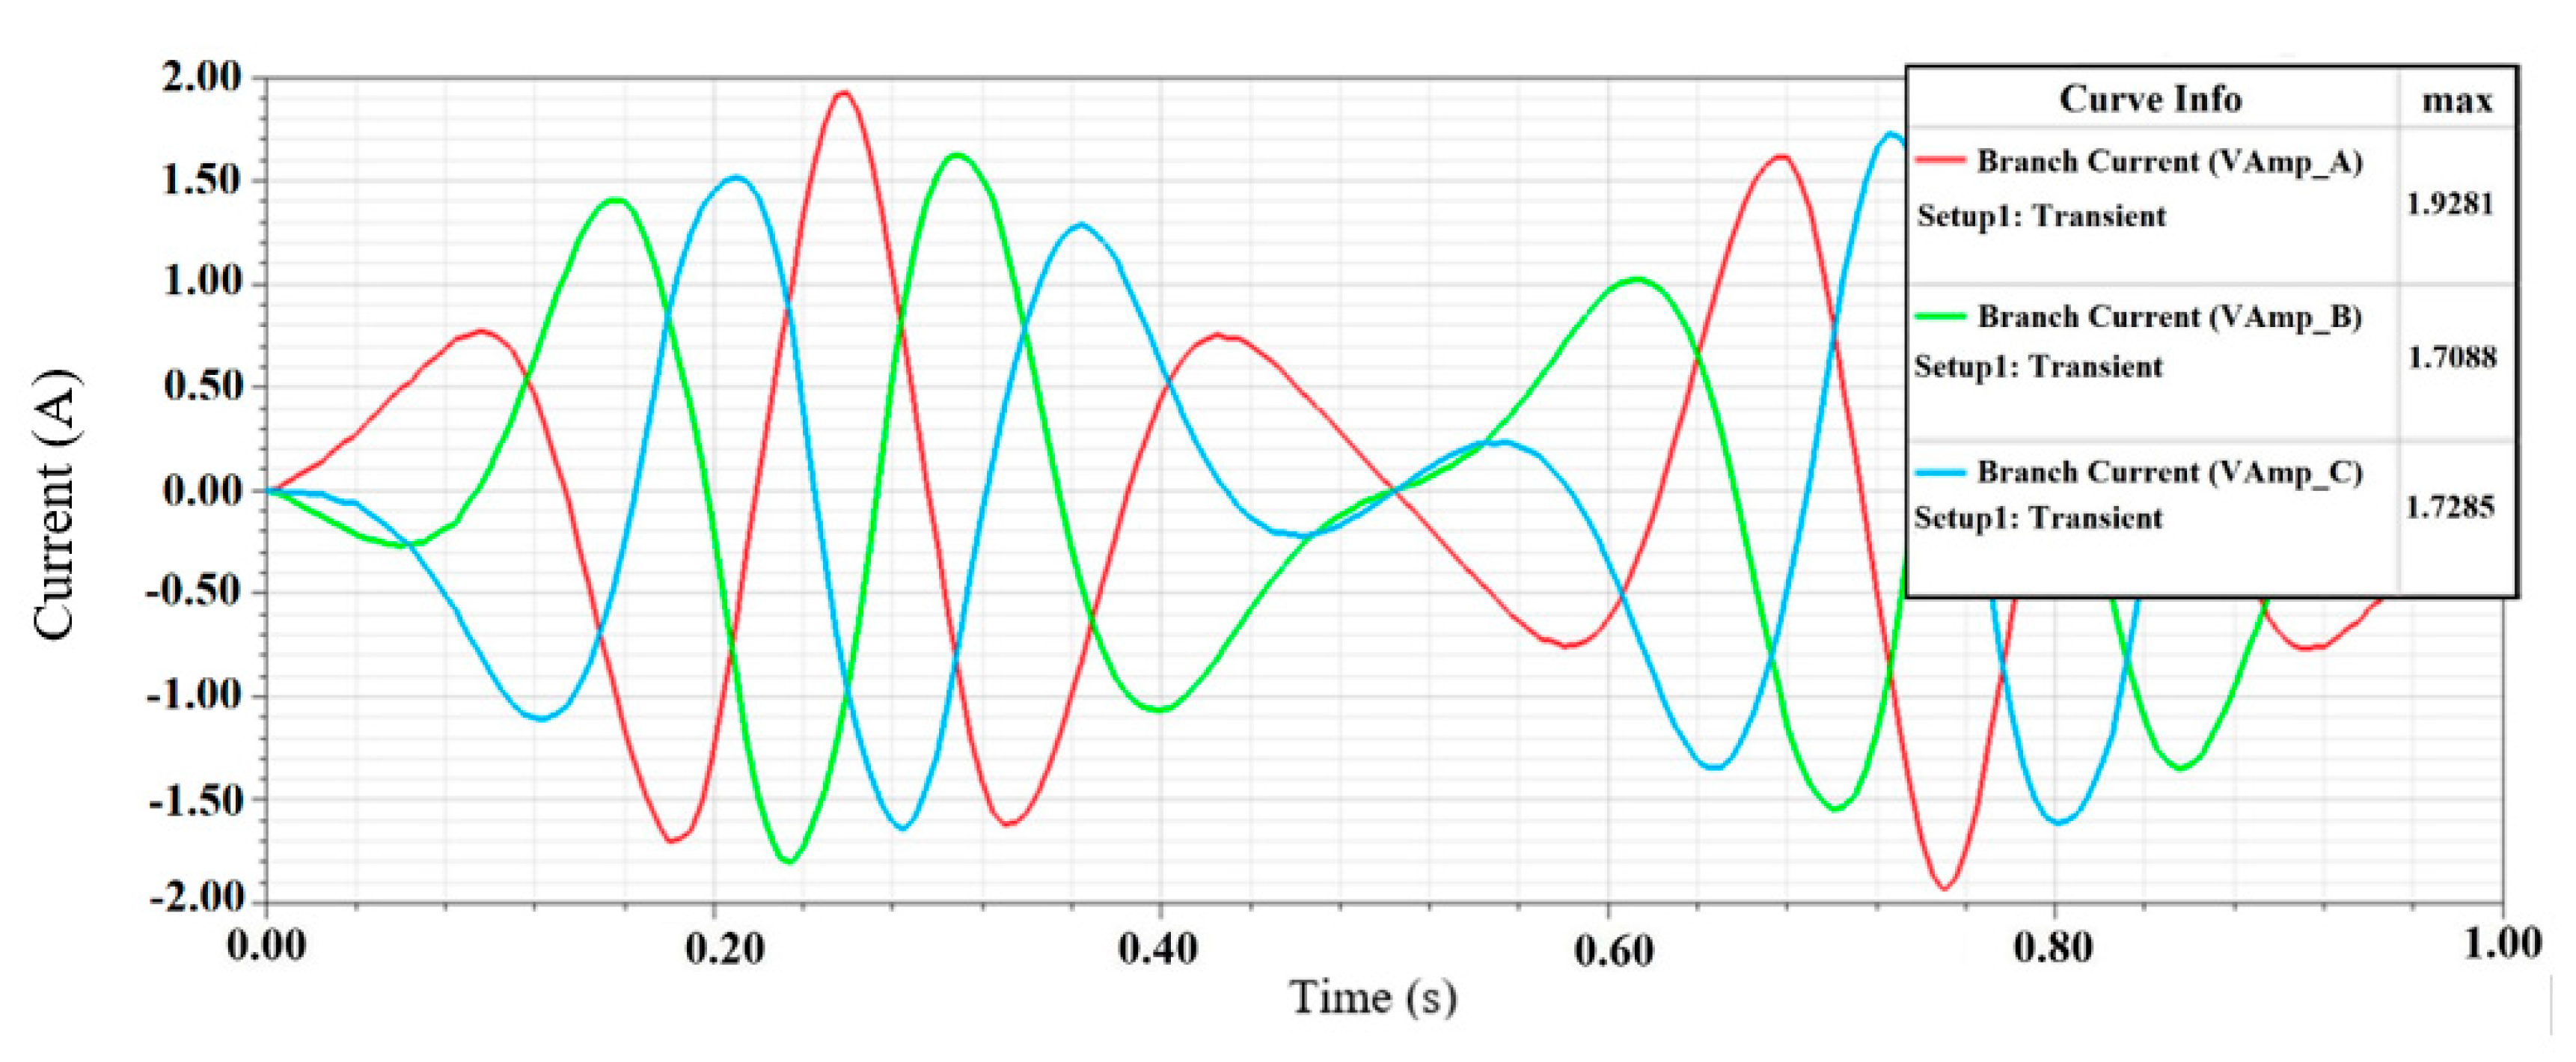
3.1. Simulation Results of Output Voltages and Currents of Each Coil Phase for the DDFSLG of the Star (Wye) and Delta Coil Phase Connections

We simulated the output voltage and current for each coil phase in both star and delta configurations of the DDFSLG. We used the transient solver in ANSYS Electronics to calculate the output voltage and current for each coil phase in the star configuration, as shown in Figure 10, Figure 11 and Figure 12. The phase currents and the branch currents are shown in Figure 10. The induced voltages across three phases and loads are shown in Figure 11 and Figure 12. The results show that the observed current across Phase A is 3.0076 A and the current across the line I a b is 3.0076 A. Similarly, the phase currents for Phase B and Phase C match well with the line currents I b c and I a c . The line currents are equal to the phase currents, as expected.
Similarly, the simulation results for the output voltage and current of each coil phase of the delta coil phase connection of the DDFSLG circuit are shown in Figure 13, Figure 14 and Figure 15. Since the internal resistances of Phase A (30 Ω) and Phase C (31 Ω) are nearly equal, the voltages across these phases are also nearly identical. Because Phase B has a lower resistance (22 Ω), its output voltage is lower than that of Phases A and C. The observed phase voltage across Phase A is 29.7448 V and the line voltage is 31.2548 V, as shown in Figure 13. The phase voltage across Phase B is 23.6836 V and the line voltage is 23.7220 V. Similarly, the phase voltage across Phase C and the line voltage across Phase C are identical, reading 30.0902 V across each. The near-identical phase and line voltages confirm that, in a delta connection, the two are effectively equal. This confirms the expected behavior of a delta-connected three-phase circuit. Figure 14 and Figure 15 illustrate the phase currents and branch currents of the delta coil phase connections. The internal resistances of Phases A and C are nearly identical, resulting in similar output currents. Table 5 summarizes the results observed through the star and delta connections.
Table 5 confirms that, for the star connection, the phase and branch currents are equal, while in the delta configuration, the phase and branch voltages are the same. The branch currents of the star connection are larger than those of the delta connection, while the phase currents of the star connection are smaller than those of the delta connection. The branch voltage output values of the star coil phase connection of the DDFSLG circuit are higher than those of the delta connection, while the phase voltage output values of the star connection are less than those of the delta connection for Phase A and Phase C and are opposite for Phase B. Table 5 shows that the star connection yields higher branch power but lower phase power compared to the delta connection.
Simulation results confirm that, in the star connection, the branch and phase currents are equal, while in the delta connection, the branch voltage closely matches the phase voltage.
Differences in coil resistance can lead to torque ripples, which, in turn, can reduce power generation efficiency in a flux-switching linear generator like the double dumbbell-shaped flux-switching linear generator (DDFSLG). This would be caused by unequal coil resistance (Phase A: 30 Ω, Phase B: 22 Ω, Phase C: 31 Ω). The disparity in coil resistance is attributed to limitations in the ANSYS software. To ensure the internal resistance matches the external resistance, we employed the eddy current method in ANSYS Electronics software. In linear generators, what would be torque ripple in a rotary machine manifests as thrust or force ripple. Uneven current across the phases leads to non-uniform electromagnetic force, which can oscillate and disrupt smooth translator motion, increasing mechanical vibration and losses. Different voltage and power outputs for each phase stem in part from the resistance imbalance. Specifically, the delta connection shows a significant spread in phase powers (Phase A: 196.8 W, Phase B: 140.7 W, Phase C: 188.9 W). This uneven load sharing confirms reduced electrical balance and potential efficiency degradation.
To mitigate the torque (force) ripple and inefficiency caused by the imbalance in coil resistance, coil resistances should be matched as closely as possible during manufacturing. This can be achieved through active or passive compensation circuits and the implementation of control algorithms that dynamically balance currents.

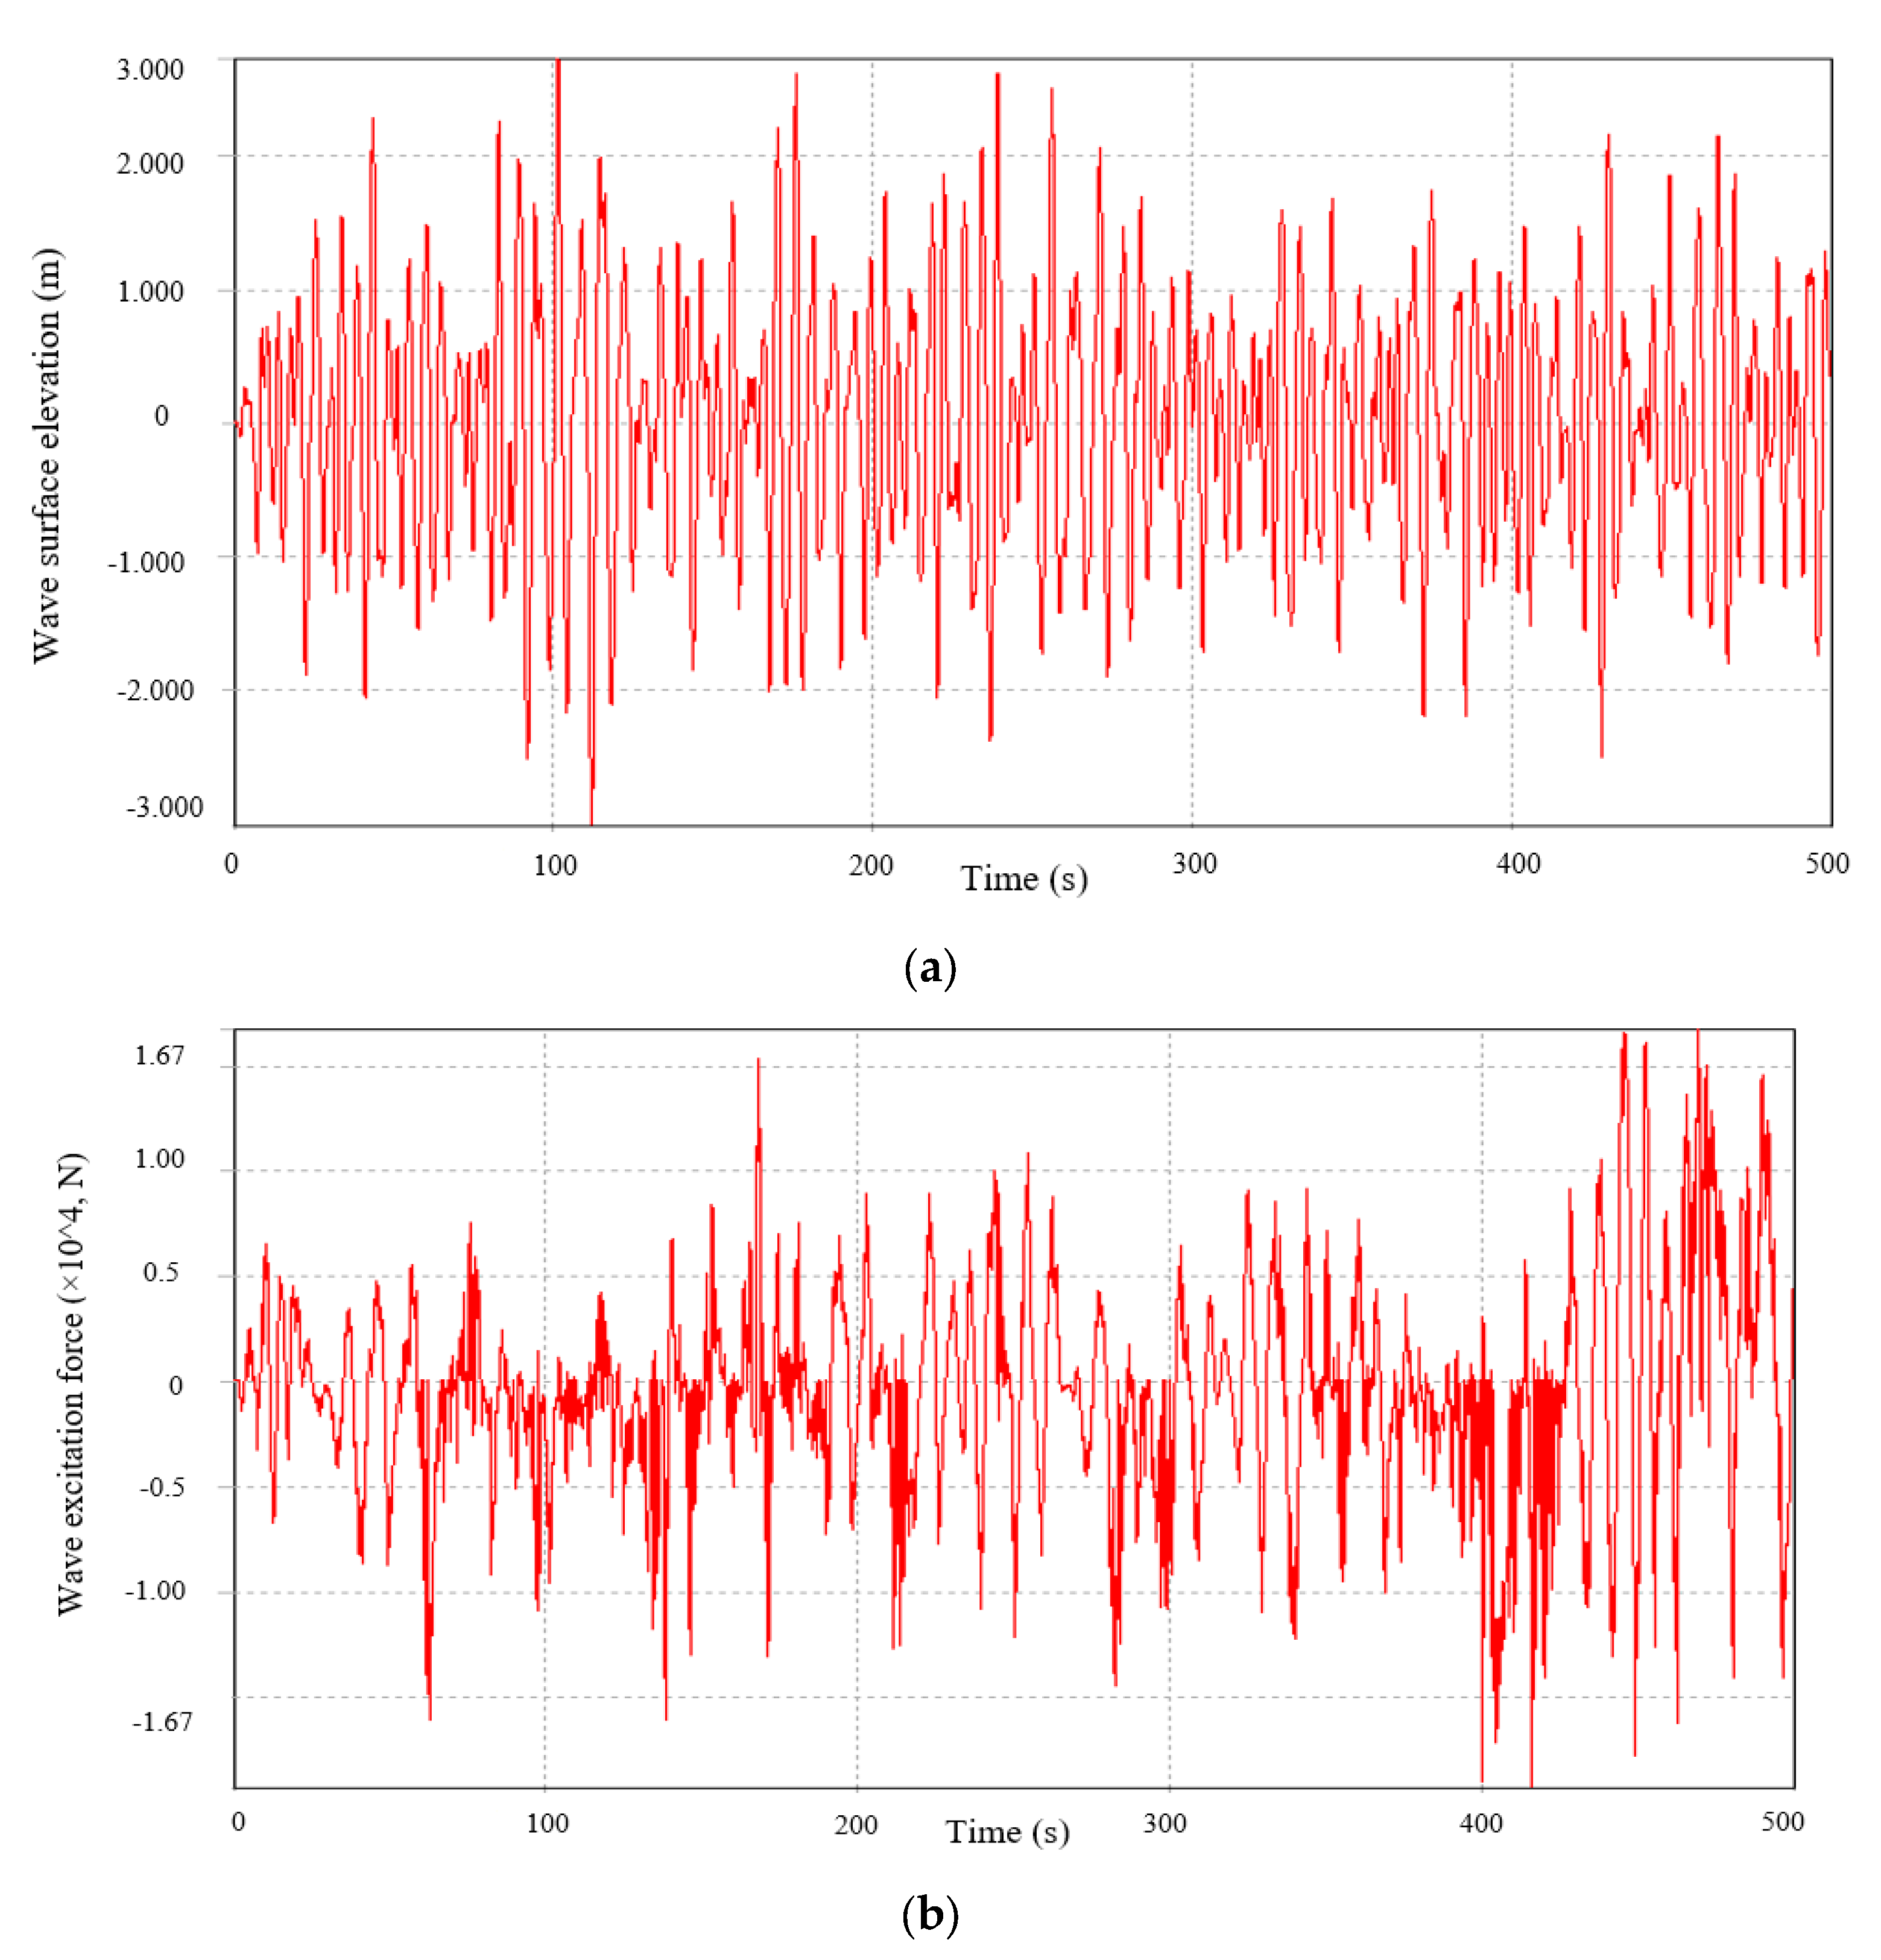
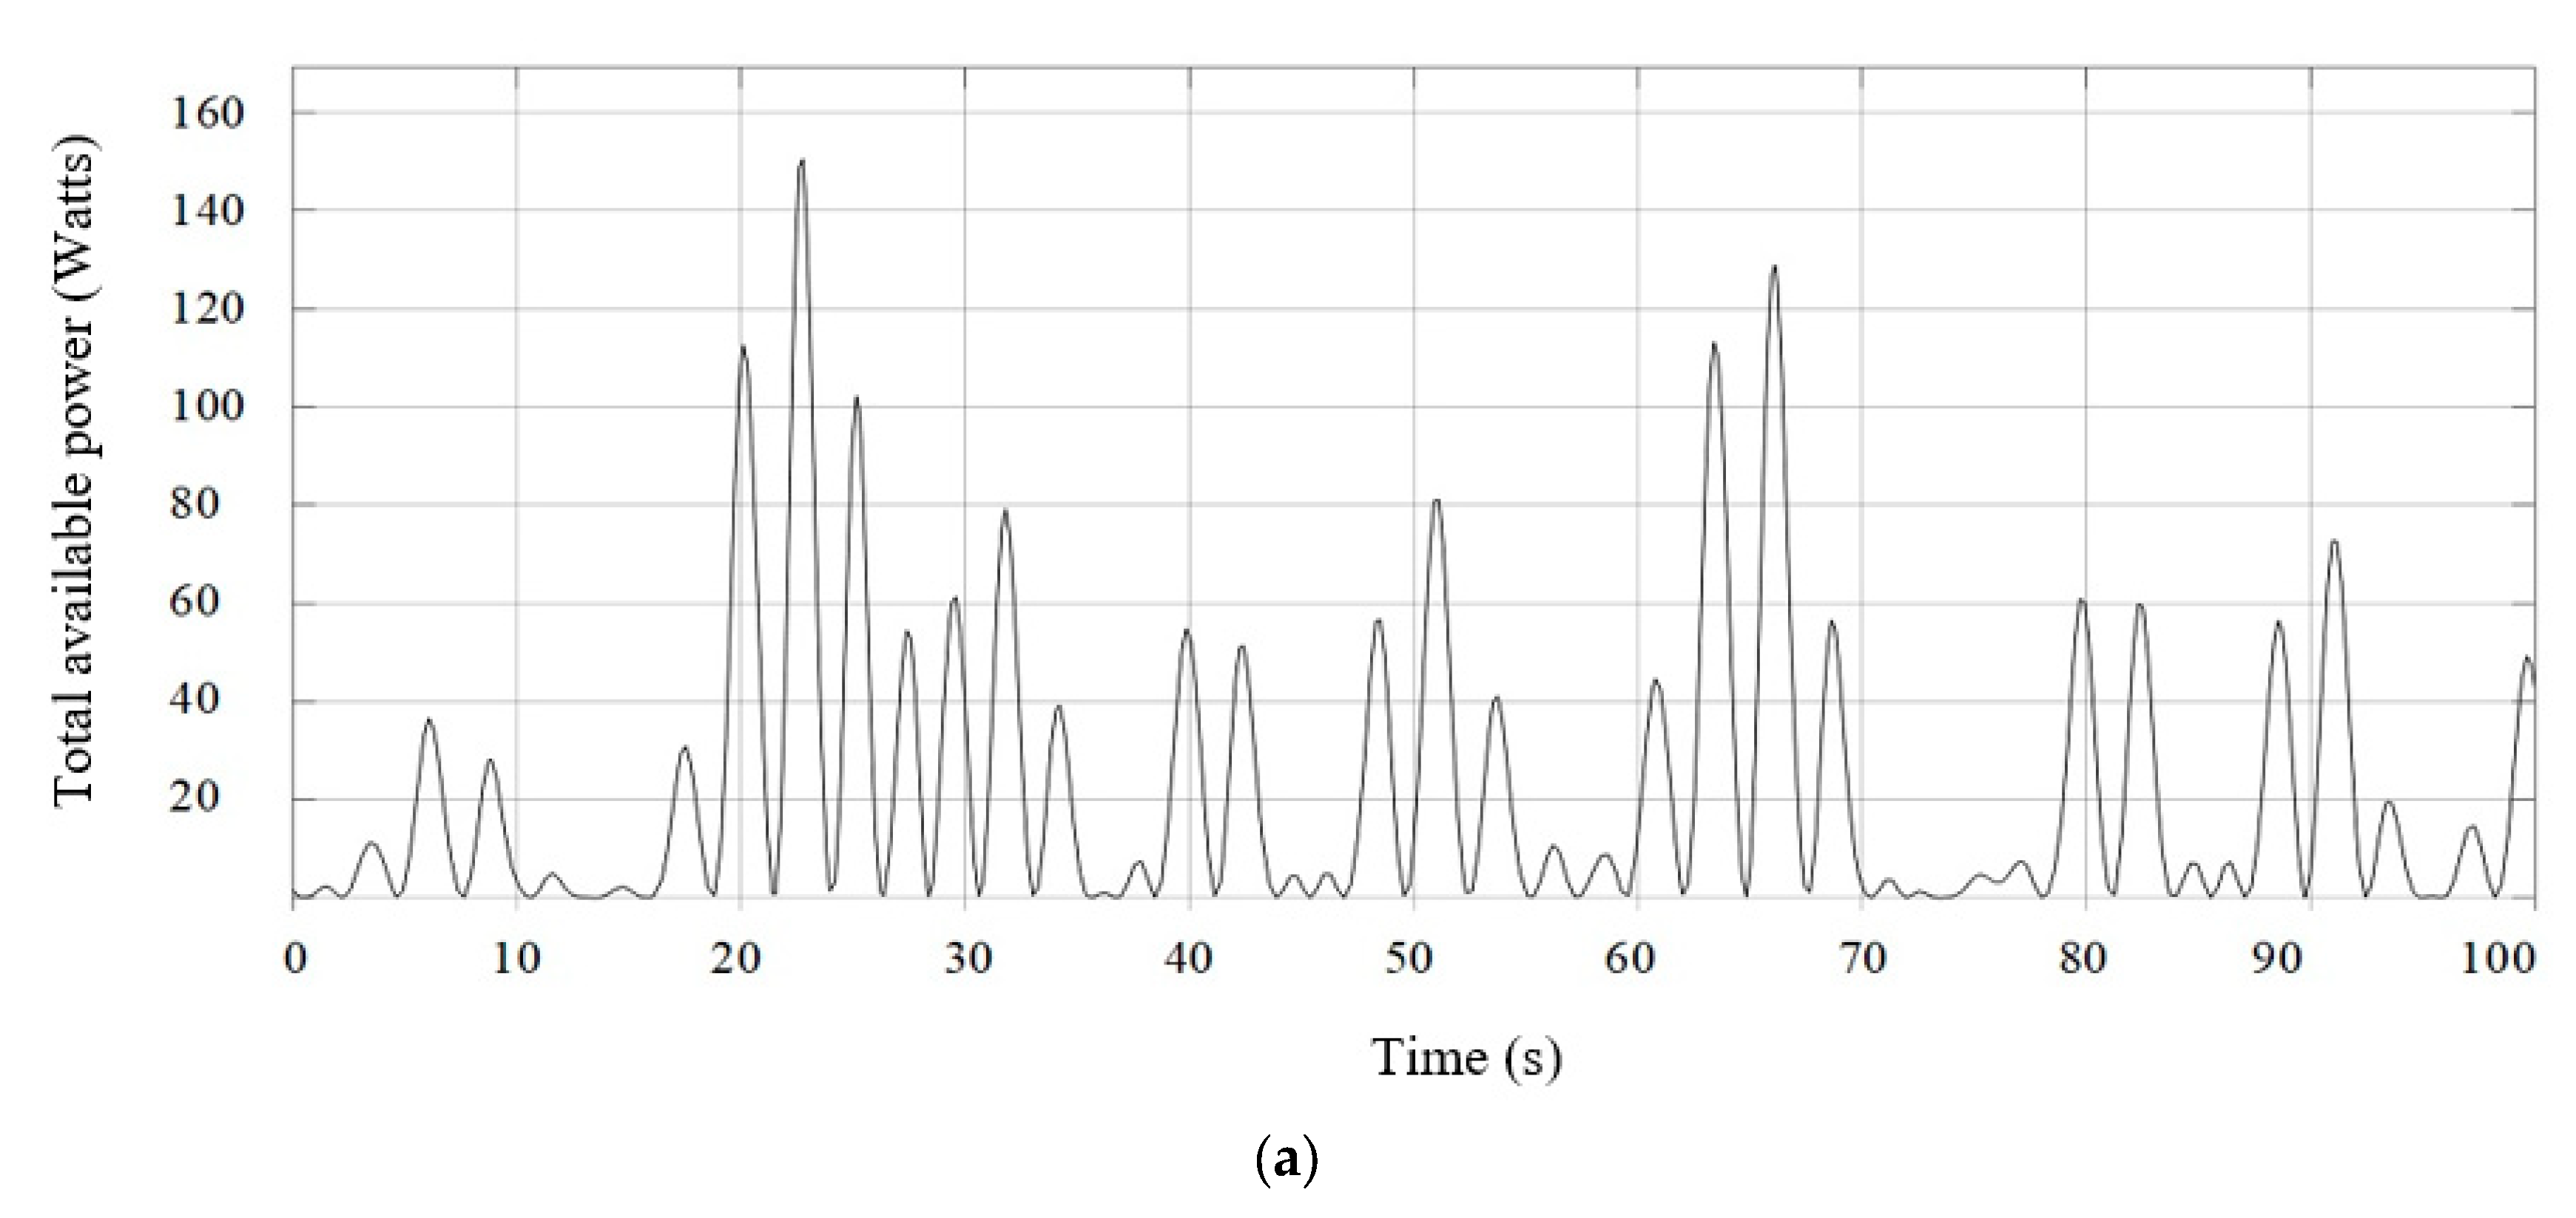
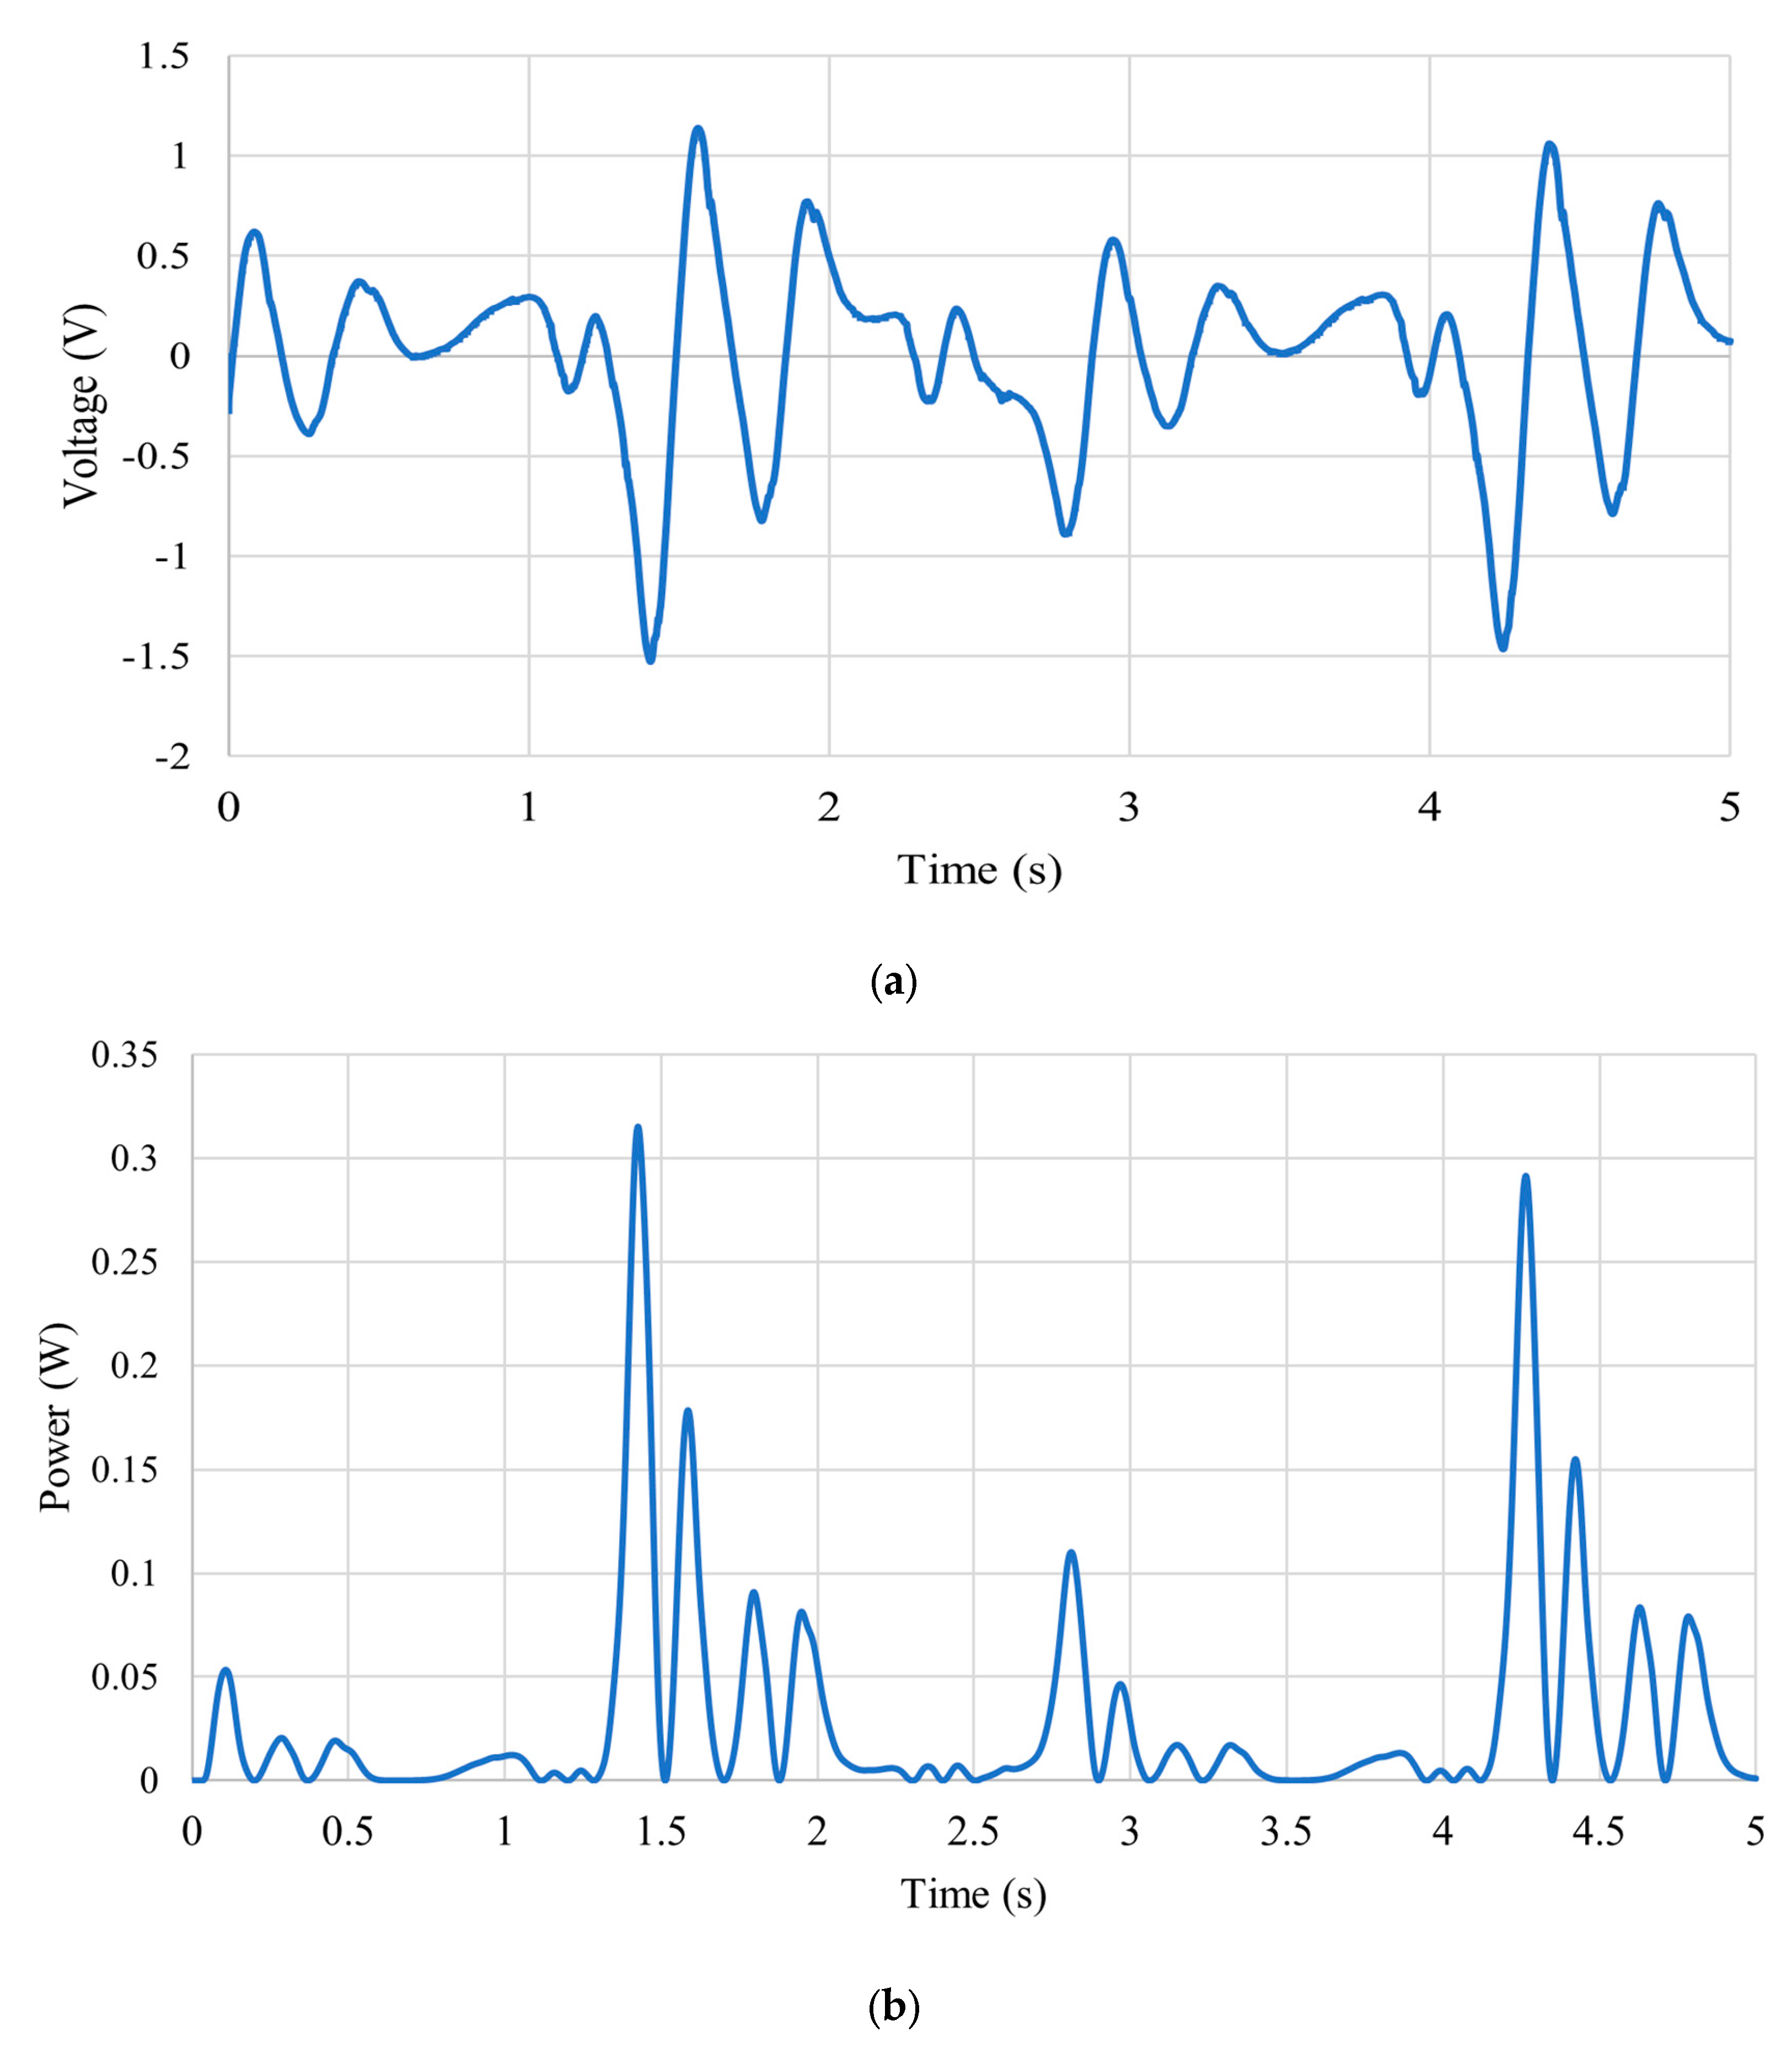
3.2. Simulation Results of Wave Excitation Force and WEC Dynamic Simulation Under Irregular Waves

The wave surface elevation is calculated from Equation (4). The results of the wave surface elevation, wave excitation force, and radiation damping force are shown in Figure 16.
.
Figure 16a shows the calculated wave surface elevation, with a peak amplitude of 3 m. We used the wave excitation spectrum from ANSYS AQWA and the wave amplitude in Figure 16a to compute the excitation force using Equation (9). Figure 16b shows the wave excitation force, which peaks at 16,900 N. The radiation damping force is derived using the inverse Fourier transform of the damping spectrum and a state-space model. Figure 16c displays the radiation damping force with a peak value of 2885 N.
Equations (1)–(3) are solved using MATLAB Simulink to calculate the total power and generate electrical power across the load resistance. Figure 17 shows that under irregular wave excitation, the DDFSLG WEC produces a peak available power of approximately 148 W and an electrical output of 11.7 W. The efficiency curve for irregular waves is shown in Figure 17c. For irregular waves, a peak efficiency of 7.90% is observed.

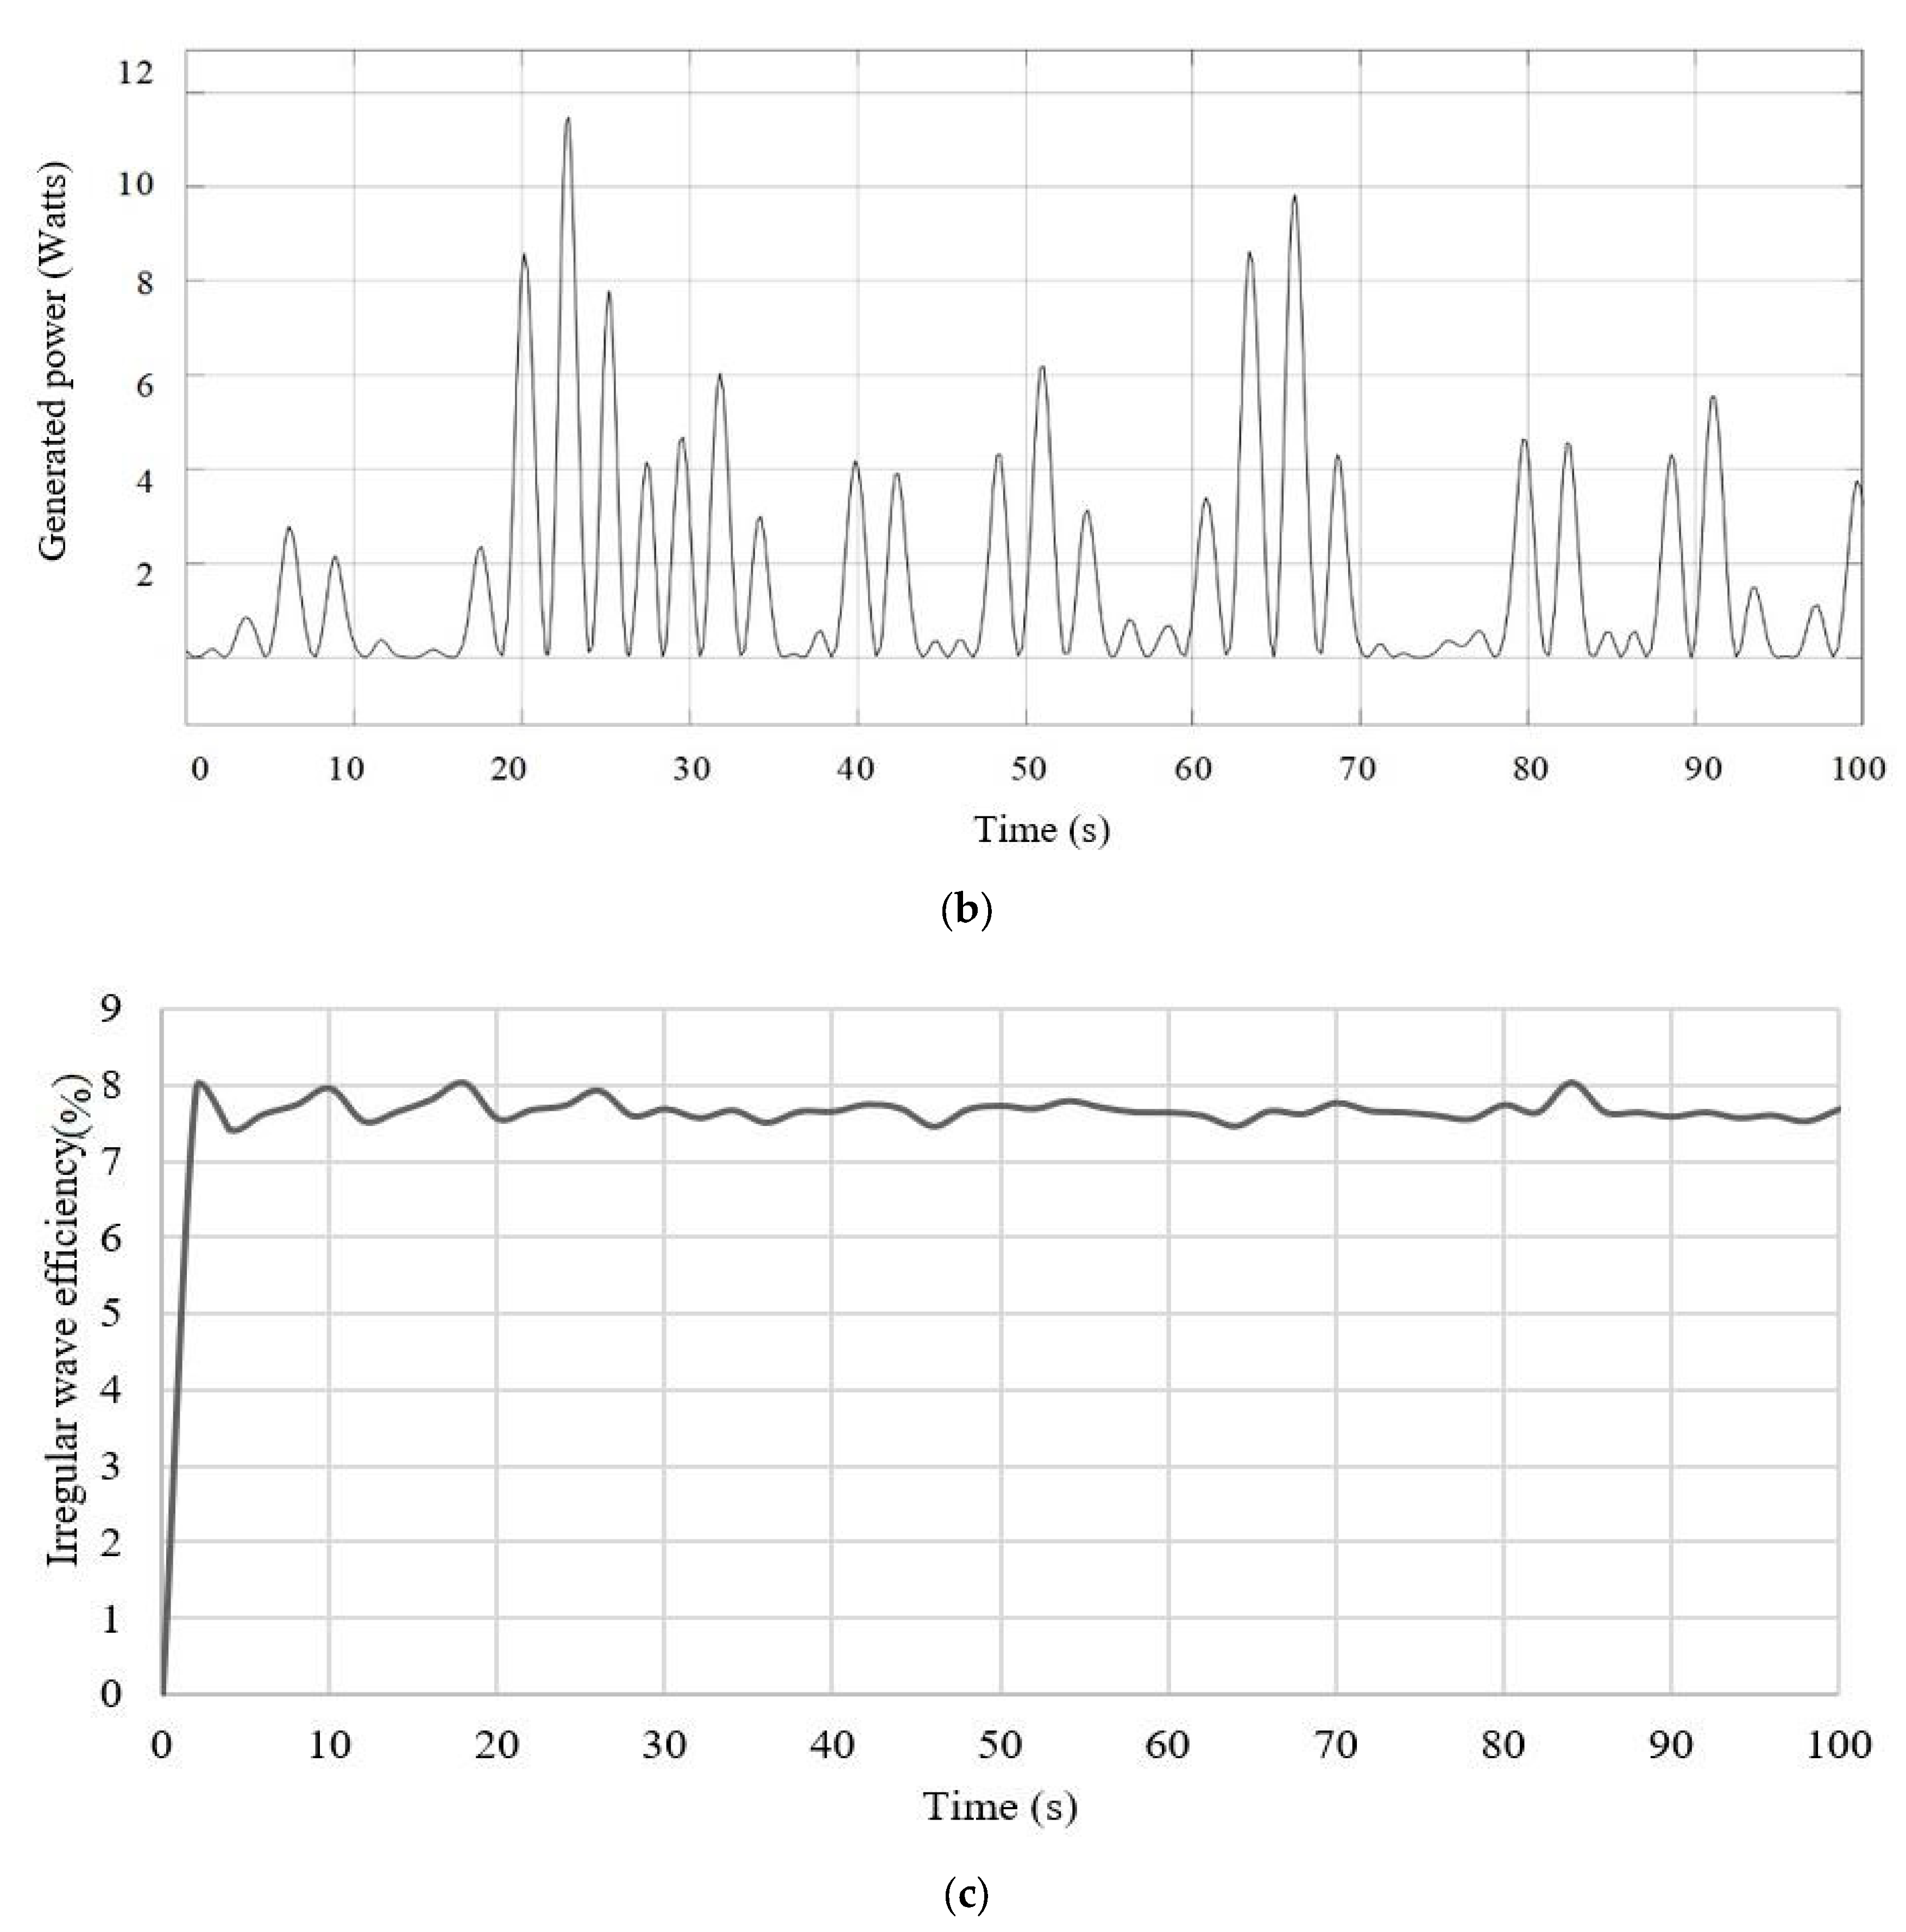
3.3. Experimental Results

The experimental results were obtained for a range of load resistances that were connected to the coil output terminals. We recorded translator and beam accelerations, along with output voltage, using a Bruel & Kjaer Pulse data acquisition system. The prototype test results at 7 Ω external load resistance are presented in Section 3.3.1. The acceleration data were then used as input to the Simulink model to identify the magnetic flux density B and damping coefficient cp.
The resultant simulated translator acceleration and output voltage are compared with the experimentally measured results for different load resistances, as illustrated below.

3.3.1. Testing Results of the Prototype at the Excitation Frequency of 0.7325 Hz and External Load Resistance of 7 Ohm

Figure 18a and Figure 18b, respectively, show the measured accelerations of the cantilevered beam’s free end and the translator. Figure 19a illustrates the measured output voltage, and Figure 19b shows the calculated power curves for an external load resistance of 7 Ohm. The observed peak voltage is 1.5 V, and the calculated peak power is 0.33 W.
The same testing procedure was repeated with different values of the external load resistance to measure the output voltages and calculate the corresponding power. Table 6 summarizes the experimental results obtained for the output voltage and power at various load resistances. Figure 20 displays the variation of peak output power and voltage versus the external load resistances. Maximum power is delivered when the external load resistance matches the coil’s internal resistance. It can be observed in Figure 20 that as the load resistance increases, the output voltage rises, and the output power initially increases—peaking when the external resistance matches the coil’s internal resistance (7 Ω)—before declining. Beyond the peak, further increases in load resistance cause the output power to decline.

3.3.2. Identification of Magnetic Flux Density B and Damping Coefficient cp by Matching Experimental and Simulated Results

Table 6 shows the identified values of magnetic flux density B at different load resistances, where the peak-to-peak output voltage and peak output power are simulated and listed in Table 6. Table 6 lists simulated and measured peak voltages and power values for direct comparison. An average of the magnetic flux density B of 0.139 T is identified. A damping coefficient cp of 40 Ns/m is identified for the experimental data. The parameters are identified in Figure 20, where the internal coil resistance is equal to the external load resistance. The simulated and measured peak-to-peak output voltage and peak output power are also plotted in Figure 20 for comparison. Figure 20 shows that the simulated and measured peak-to-peak output voltage curves align closely across different load resistances.
The simulated and measured peak output power curves (versus the external load resistances) coincide with each other. We verified the simulation results against the experimental measurements.

4. Conclusions

This study presented and validated a novel WEC design using a double-dumbbell flux-switching linear generator with stator-mounted magnets, tested with both star and delta three-phase coil configurations. The generator’s design supports practical deployment in offshore wave energy systems. In addition, a hydrodynamic analysis was conducted on the buoy. An analytical model of the WEC was developed and simulated under irregular wave conditions based on Australian ocean data. The experimental results confirmed the accuracy of the analytical model and validated the DDFSLG design.
The development and validation of this novel generator represent a significant step forward in wave energy conversion. With its innovative design and verified simulations, the generator achieved 0.33 W power output and peak efficiency of 7.9% under irregular wave conditions. Experimental validation confirmed the generator’s suitability for real-world wave energy applications. This work lays the foundation for future optimization of wave energy conversion systems.
Further improvements in efficiency and performance are possible by enhancing electrical symmetry. Ongoing research will aim to reduce force ripple and optimize symmetry to further improve conversion efficiency.

Author Contributions

Conceptualization, methodology, software, validation, writing original draft, P.K.; software, E.A.S. and Z.L.; validation, J.R.; supervision, writing-review and editing, X.W.; All authors have read and agreed to the published version of the manuscript.

Funding

This research was funded by Australian Research Council Discovery Project (Grant No. DP170101039).

Data Availability Statement

Data are contained within the article.

Conflicts of Interest

Elie Al Shami is employee of Carnegie Clean energy. The paper reflects the views of the scientists and not the company.

Abbreviations

DDFSLG, direct drive flux switching linear generator; MTS, material testing system; NdFeB, Neodymium Iron Boron; PTO, power take-off; WEC, wave energy converter.

References

  1. Falnes, J. A review of wave energy extraction. Mar. Struct. 2007, 20, 185–201. [Google Scholar] [CrossRef]
  2. Young, I.R. Seasonal variability of the global ocean wind and wave climate. Int. J. Climatol. 1999, 19, 931–950. [Google Scholar] [CrossRef]
  3. Hughes, M.G.; Heap, A.D. National-scale wave energy resource assessment for Australia. Renew. Energy 2010, 35, 1783–1791. [Google Scholar] [CrossRef]
  4. Lopes, M.F.P.; Hals, J.; Gomes, R.P.F.; Moan, T.; Gato, L.M.C.; Falcao, A.F.O. Experimental and numerical investigation of non-predictive phase-control strategies for a point-absorbing wave energy converter. Ocean Eng. 2009, 36, 386–402. [Google Scholar] [CrossRef]
  5. Margheritini, L.; Vicinanza, D.; Frigaard, P. SSG wave energy converter: Design, reliability, and hydraulic performance of an innovative overtopping device. Renew. Energy 2009, 34, 1371–1380. [Google Scholar] [CrossRef]
  6. Martinelli, L.; Zanuttigh, B.; Kofoed, J.P. Selection of design power of wave energy converters based on wave basin. Renew. Energy 2011, 36, 3124–3136. [Google Scholar] [CrossRef]
  7. Rusu, E.; Guedes Soares, C. Coastal impact induced by a pelamis wave farm operating in the Portuguese near shore. Renew. Energy 2013, 58, 34–49. [Google Scholar] [CrossRef]
  8. Son, D.; Belissen, V.; Yeung, R.W. Performance validation and optimization of a dual coaxial-cylinder ocean-wave energy extractor. Renew. Energy 2016, 92, 192–201. [Google Scholar] [CrossRef]
  9. Su, Y.; You, Y.; Zheng, Y. Investigations on the oscillating buoy wave power devices. China Ocean Eng. 2002, 16, 141–149. [Google Scholar]
  10. Khatri, P.; Wang, X. Comprehensive review of a linear electrical generator for ocean wave energy conversion. IET Renew. Power Gener. 2019, 14, 949–958. [Google Scholar] [CrossRef]
  11. Farrok, O.; Islam, M.R.; Sheikh, M.R.I.; Guo, Y.; Zhu, J.G. A split translator secondary stator permanent magnet linear generator for oceanic wave energy conversion. IEEE Trans. Ind. Electron. 2017, 65, 7600–7608. [Google Scholar] [CrossRef]
  12. Huang, L.; Hu, B.; Hu, M.; Liu, C.; Zhu, H. Research on primary excitation fully superconducting linear generators for wave energy conversion. IEEE Trans. Appl. Supercond. 2019, 29, 2903573. [Google Scholar] [CrossRef]
  13. Huang, L.; Hu, M.; Liu, J.; Yu, H.; Zeng, C.; Chen, Z. Electromagnetic design of a 10-kW-class flux-switching linear superconducting hybrid excitation generator for wave energy conversion. IEEE Trans. Appl. Supercond. 2017, 27, 2656620. [Google Scholar] [CrossRef]
  14. Liu, Z.; Wang, X.; Ding, S.; Zhang, R.; McNabb, L. A new concept of speed amplified nonlinear electromagnetic vibration energy harvester through fixed pulley wheel mechanisms and magnetic springs. J. Mech. Syst. Signal Process 2019, 126, 305–325. [Google Scholar] [CrossRef]
  15. Liu, Z.; Xiao, H.; Khatri, P.; Wang, X. A study of a flux switching linear generator with a novel speed amplified mechanism and its optimization for the maximum power output and minimum cogging force of wave energy conversion. Mech. Syst. Signal Process. 2022, 166, 108413. [Google Scholar] [CrossRef]
  16. Huang, L.; Liu, J.; Yu, H.; Qu, R.; Chen, H.; Fang, H. Winding configuration and performance investigations of a tubular superconducting flux-switching linear generator. IEEE Trans. Appl. Supercond. 2014, 25, 1–5. [Google Scholar] [CrossRef]
  17. Zou, Y.; Cheng, K.W.E. A Vertical Flux-Switching Permanent Magnet Based Oscillating Wave Power Generator with Energy Storage. Energies 2017, 10, 887. [Google Scholar] [CrossRef]
  18. Stamenkovic, I.; Milivojevic, N.; Schofield, N.; Krishnamurthy, M.; Emadi, A. Design, analysis, and optimization of ironless stator permanent magnet machines. IEEE Trans. Power Electron. 2013, 28, 2527–2538. [Google Scholar] [CrossRef]
  19. Farrok, O.; Islam, M.R.; Guo, Y.; Zhu, J.; Xu, W. A novel design procedure for designing linear generators. IEEE Trans. Ind. Electron. 2017, 65, 1846–1854. [Google Scholar] [CrossRef]
  20. Kimoulakis, N.M.; Kladas, A.G.; Tegopoulos, J.A. Cogging force minimization in a coupled permanent magnet linear generator for sea wave energy extraction applications. IEEE Trans. Magn. 2009, 45, 1246–1249. [Google Scholar] [CrossRef]
  21. He, J.H. Periodic solution of a micro-electromechanical system. Facta Univ. Ser. Mech. Eng. 2024, 22, 187–198. [Google Scholar] [CrossRef]
  22. Tian, D.; Ain, Q.T.; Anjum, N.; He, C.H. Fractal N/MEMS: From pull-in instability to pull-in stability. Fractals 2021, 29, 2150030. [Google Scholar] [CrossRef]
  23. Molla, S.; Farrok, O.; Alam, M.J. Sustainable solution to the critical challenges of an oceanic wave farm for maximizing power generation. Renew. Energy 2024, 237 Pt A, 121461. [Google Scholar] [CrossRef]
  24. Tian, D.; He, C.H. A fractal micro-electromechanical system and its pull-in stability. J. Low Freq. Noise Vib. Act. Control. 2021, 40, 1380–1386. [Google Scholar] [CrossRef]
  25. He, C.H. A variational principle for a fractal nano/microelectromechanical (N/MEMS) system. Int. J. Numer. Methods Heat Fluid Flow 2023, 33, 351–359. [Google Scholar] [CrossRef]
  26. Khatri, P.; Wang, X. Design parameter sensitivity analysis and performance prediction of a novel direct drive double dumbbell flux switching linear generator. J. Ocean Eng. Mar. Energy 2022, 8, 65–82. [Google Scholar] [CrossRef]
  27. Khatri, P.; Liu, Z.; Rudolph, J.; Wang, X. A study of a modified design of Dumbbell-Shaped Flux Switching Tubular Linear generator for regular wave energy conversion. Renew. Energy 2023, 208, 287–300. [Google Scholar] [CrossRef]
  28. Liu, C.; Yu, H.; Hu, M.; Liu, Q.; Zhou, S.; Huang, L. Research on a permanent magnet tubular linear generator for direct drive wave energy conversion. IET Renew. Power Gener. 2014, 8, 281–288. [Google Scholar] [CrossRef]
  29. Beig, A.R. Three-phase AC supply. In Electric Renewable Energy Systems; Elsevier: Amsterdam, The Netherlands, 2016; pp. 183–208. [Google Scholar]
Figure 1. (a) Hollow stator core. (b) Permanent magnets (blue-colored) on the outer slots of the stator. (c) Dumbbell-shaped translator. (d) Copper coil (orange-colored) around the translator. (e) NdFeB magnet (red-colored) placed inside the middle of the hollow translator dumbbell core.
Vibration 08 00032 g001
Figure 2. The star or wye coil phase connection of the double-dumbbell linear generator circuit.
Vibration 08 00032 g002
Figure 3. The delta coil phase connection of the double-dumbbell linear generator circuit.
Vibration 08 00032 g003
Figure 4. Point absorber wave energy converter of the DDFSLG placed inside the cylindrical buoy.
Vibration 08 00032 g004
Figure 5. Experimental validation methodology for the DDFSLG.
Vibration 08 00032 g005
Figure 6. Stationary stator assembly with permanent magnet rings placed inside a Perspex box.
Vibration 08 00032 g006
Figure 7. (a) Hollow dumbbell translator and the permanent magnet rod; (b) permanent magnet rod inserted inside the translator.
Vibration 08 00032 g007
Figure 8. The complete DDFSLG device setup on the MTS machine.
Vibration 08 00032 g008
Figure 9. Simulink model for the developed dynamic equations of Equations (14) and (15).
Vibration 08 00032 g009
Figure 10. The branch/phase currents of the star wye coil phase connection of the DDFSLG circuit.
Vibration 08 00032 g010
Figure 11. The induced phase voltages of the star wye coil phase connection of the DDFSLG circuit.
Vibration 08 00032 g011
Figure 12. The load node voltage of the star wye coil phase connection of the DDFSLG circuit.
Vibration 08 00032 g012
Figure 13. The induced phase and branch node voltages of the delta coil phase connection of the DDFSLG circuit.
Vibration 08 00032 g013
Figure 14. The phase current of the delta coil phase connection of the DDFSLG circuit.
Vibration 08 00032 g014
Figure 15. Branch currents of the delta coil phase connection of the DDFSLG circuit.
Vibration 08 00032 g015
Figure 16. (a) Wave surface elevation calculated from Equation (4); (b) wave excitation force calculated from Equation (9); and (c) radiation damping force calculated from t R I F t τ x ˙ t d τ .
Vibration 08 00032 g016aVibration 08 00032 g016b
Figure 17. (a) Total available power; (b) electrically generated power output; and (c) efficiency of the WEC of the DDFSLG in irregular waves.
Vibration 08 00032 g017aVibration 08 00032 g017b
Figure 18. Experimentally measured results of the (a) cantilevered beam free end acceleration and (b) translator acceleration.
Vibration 08 00032 g018
Figure 19. (a) Experimentally measured voltage output and (b) calculated power output from the measured voltage.
Vibration 08 00032 g019
Figure 20. Simulated peak power and peak-to-peak voltage output for different load resistances.
Vibration 08 00032 g020
Table 1. Design parameters of the DDFSLG of the star and delta coil phase connections.
ParameterValue/Name
Speed of translator (m/s)1
Thickness of PM (mm)40
Material for PMNdFeB
Stator length (mm)600
Coil internal resistance (Ω)Phase APhase BPhase C
302231
Load resistance (Ω)RaRbRc
302231
Table 2. Main design parameters for modeling the DDFSLG with ANSYS Maxwell software (Ansys 18.2).
ParametersValue
Total mass of the buoy and stator m 1 (kg)800
Mass of the translator of the DDFSLG m 2 (kg)5.6
Hydrodynamically added mass m d (kg) at 0.435 Hz241
Mechanical damping coefficient of the DDFSLG c p (Ns/m)40
Spring stiffness coefficient of the DDFSLG k p (N/m)398.09
Magnetic flux density B (Tesla)0.139
Coil inductance L e (mH)3.2
Length of coil l (m)219.94
Internal resistance R i (Ω)7
External resistance R e (Ω)7
Table 3. Dimension parameters of the prototype manufactured in the mechanical workshop.
Design ParametersValue (mm)
Stator length 600
Translator length 200
Translator dumbbell outer diameter80
Translator dumbbell inner diameter45
The outer diameter of the magnet ring on stator slots134
The inner diameter of the magnet ring on stator slots94
Length of the magnet inside the dumbbell translator196
Diameter of the magnet inside the translator45
Table 4. The measured/identified parameter values of the DDFSLG.
Experimental Prototype Value of Design ParametersDetermined Value
Mass of the stator 22.85 kg
Mass of the translator5.6 kg
Mass of the aluminum rod0.6 kg
Spring stiffness constant (kp)398.09 N/m
The internal resistance of the coil (Ri)7 Ω
The internal inductance of the coil (Le)3.2 mH
Natural resonant frequency0.7328 Hz
Number of coil turns1000 turns
Table 5. The current and voltage results of the branches and phases of the star and delta coil phase connections of the DDFSLG circuit.
Connection TypeBranch Current (A)Phase Current (A)
PhaseABCABC
Star3.0072.2583.4213.0072.2583.421
Delta1.9281.7081.7286.2975.9306.279
Branch Voltage (V)Phase Voltage (V)
PhaseABCABC
Star42.68338.70755.20827.64727.61528.124
Delta29.74423.68330.09031.25423.72230.090
Branch Power (W)Phase Power (W)
PhaseABCABC
Star128.3587.40188.8783.1362.3596.21
Delta57.34640.45151.996196.806140.671188.935
Table 6. The identified values of the magnetic flux density, simulated and measured peak power, and peak-to-peak voltage output values for different external load resistances.
The External Load Resistance (Ω)The Identified Magnetic Flux Density, B (T)Simulated Peak-to-Peak Voltage Values (V)Measured Peak-to-Peak Voltage Values (V)Simulated Peak Power Values (W)Measured Peak Power Values (W)
40.1551.851.890.290.30
50.1652.152.180.310.32
70.1402.582.690.320.33
100.1352.983.020.300.31
150.1253.53.770.280.29
260.1154.164.280.220.23
Disclaimer/Publisher’s Note: The statements, opinions and data contained in all publications are solely those of the individual author(s) and contributor(s) and not of MDPI and/or the editor(s). MDPI and/or the editor(s) disclaim responsibility for any injury to people or property resulting from any ideas, methods, instructions or products referred to in the content.

