1. Introduction
Low back pain (LBP) is a prevalent health problem and the leading cause of disability worldwide [
1,
2]. Whole-body vibration is one of the contributors to LBP [
3,
4]. Additionally, cadaver studies have demonstrated that cyclic loading of the spine can cause injuries associated with LBP [
5,
6,
7,
8]. Cyclic loading does not only result from vibration but also from repeated shocks. Whole-body vibrations typically refer to continuous perturbations with relatively low levels of acceleration. Repeated shocks are defined by ISO 2041 (article 3.1) [
9] as mechanical shocks: “a sudden change of force, position, velocity or acceleration that excites transient disturbances in a system”.
ISO 2631-1:1997 [
10] evaluates vibration based on root mean square (RMS) frequency-weighted seat acceleration (Section 6.1 in ISO 2631-1:1997) and notes that in cases where the basic evaluation method may underestimate the effects of vibration (e.g., high crest factors, occasional shocks, transient vibration), the vibration dose value (VDV) should be evaluated in addition. The VDV uses a fourth power of the frequency-weighted seat accelerations. The VDV from ISO 2631-1:1997 [
10] has been assigned legal limits. Directive 2002/44/EC of the European Parliament and of the Council [
11] (hereafter called “EU Directive”) provides action and limit values with a legal basis regarding the VDV, based on the expected health risk. When the action value is reached, measures need to be taken to reduce vibration exposure and health risk; when the limit value is reached, vibration exposure should be ceased immediately.
ISO 2631-1:1997 [
10] applies to both vibration and shock, or rather repeated shocks, and excludes application to a single high acceleration. Besides its common uses for vibration [
12,
13,
14,
15,
16], indeed the VDV has also been used for assessment of repeated shocks, such as on high-speed boats [
17,
18,
19,
20,
21,
22] and during cycling [
23]. Since the EU Directive imposes a legal limit on vibration exposure, and previous studies [
17,
18,
19,
20,
21,
22,
23] have pointed out that the limits are rapidly exceeded, these limits may restrict essential activities more than needed. This raises the question of whether exceeding the limits aligns with the potential risks during these activities [
24]. However, the dose–risk relationship for these activities has not yet been investigated extensively [
25].
Another common activity during which repeated shocks take place is horse riding. There is more literature on the prevalence of back pain in participants for this activity than in the abovementioned activities. LBP was found to be more prevalent in riders who trained intensively for a minimum of 5–6 h a week than in the general population, with cantering and show jumping as the major risk-inducing activities [
26,
27,
28]. On the other hand, riding a horse in walk gait is sometimes successfully used as a therapy to relieve back pain, which suggests that this activity should be harmless [
29]. However, there is only one paper reporting the use of the VDV for evaluating health risk in horse riding [
30]. This paper reported that EU limits were exceeded within 30 min, but measurements were performed in a single participant only, in a mixed activity of walking with bouts of trot and canter.
A potential concern using the VDV for high-impact activities is that ISO 2631-1:1997 [
10] makes use of seat accelerations and assumes that the buttocks remain in contact with the seat throughout the activity, which is not always the case during these activities. Because in practice, the buttocks do indeed not remain on the saddle throughout the gait cycle during horse riding, we will calculate the VDV using both pelvis and saddle accelerations. Furthermore, we expect that pelvis accelerations are more relevant, as LBP is correlated to the vibrations in the spine, regardless of whether these reach the spine through the buttocks or the legs.
Considering the above, in the present paper, we examine horse riding during walking and cantering, using both saddle and pelvis accelerations as an example to investigate the applicability of the VDV and EU action and limit values for activities including repeated shocks and in which the buttocks are not in continuous contact with the seat.
If, in this probably harmless activity, limit values are exceeded, and such findings are reproduced in other activities involving repeated shocks, the VDV or the associated EU action and limit values should be reconsidered.
2. Materials and Methods
Twelve equestrians between 18 and 55 years old were recruited to participate in this study. The equestrians had at least one year of experience in horse riding. Furthermore, participants were excluded from the study if they had experienced back injuries or back pain in the last six months that could lead to modifications in their riding style and/or frequency. The recruited participants were all female and had a mean (sd) of 20 (10) years of experience in horse riding. This research complied with the tenets of the Declaration of Helsinki and was approved by the Institutional Review Board at the Vrije Universiteit Amsterdam (approval number: VCWE-2023-076). Informed consent was obtained from each participant.
Inertial measurement units (IMUs, Dot v2, Movella, Enschede, The Netherlands) were used to measure three-dimensional linear accelerations, angular velocities, and magnetometer data. One IMU was placed on the back of the horse’s saddle and one on the pelvis (sacrum) of the equestrian, both using double-sided tape and stretch tape. The IMUs were set to record data on board at a sample rate of 120 Hz.
Before the IMUs were attached to the participant, the sensors were synchronized. In addition to the onboard synchronization function provided in the manufacturer’s application, the sensors were placed in a rigid case, which was then tapped on a hard, flat surface three times. This resulted in narrow and easily detectable peaks that allowed for validation and correction (if needed) of the embedded synchronization function provided in the manufacturer’s application.
After the IMUs were attached to a subject and the saddle, calibration measurements were conducted to align the sensor signals during the data processing stage. These calibration measurements included the equestrian standing still and walking in a straight line while being next to the horse and while riding the horse. To assess back-load, the equestrian was instructed to let the horse walk for 30 min in a riding arena of approximately 20 × 40 m. Additionally, the equestrian was asked to canter for 10 min. These durations were chosen to limit the burden of the experiment on the participant. Furthermore, pilot measurements proved that these durations were sufficient to answer our research question. During the measurements, the equestrians were free to ride in any forward direction (e.g., circles or figure-eight shapes). In the remainder of this paper, “walking” will be used to refer to the equestrian riding the horse while it walks.
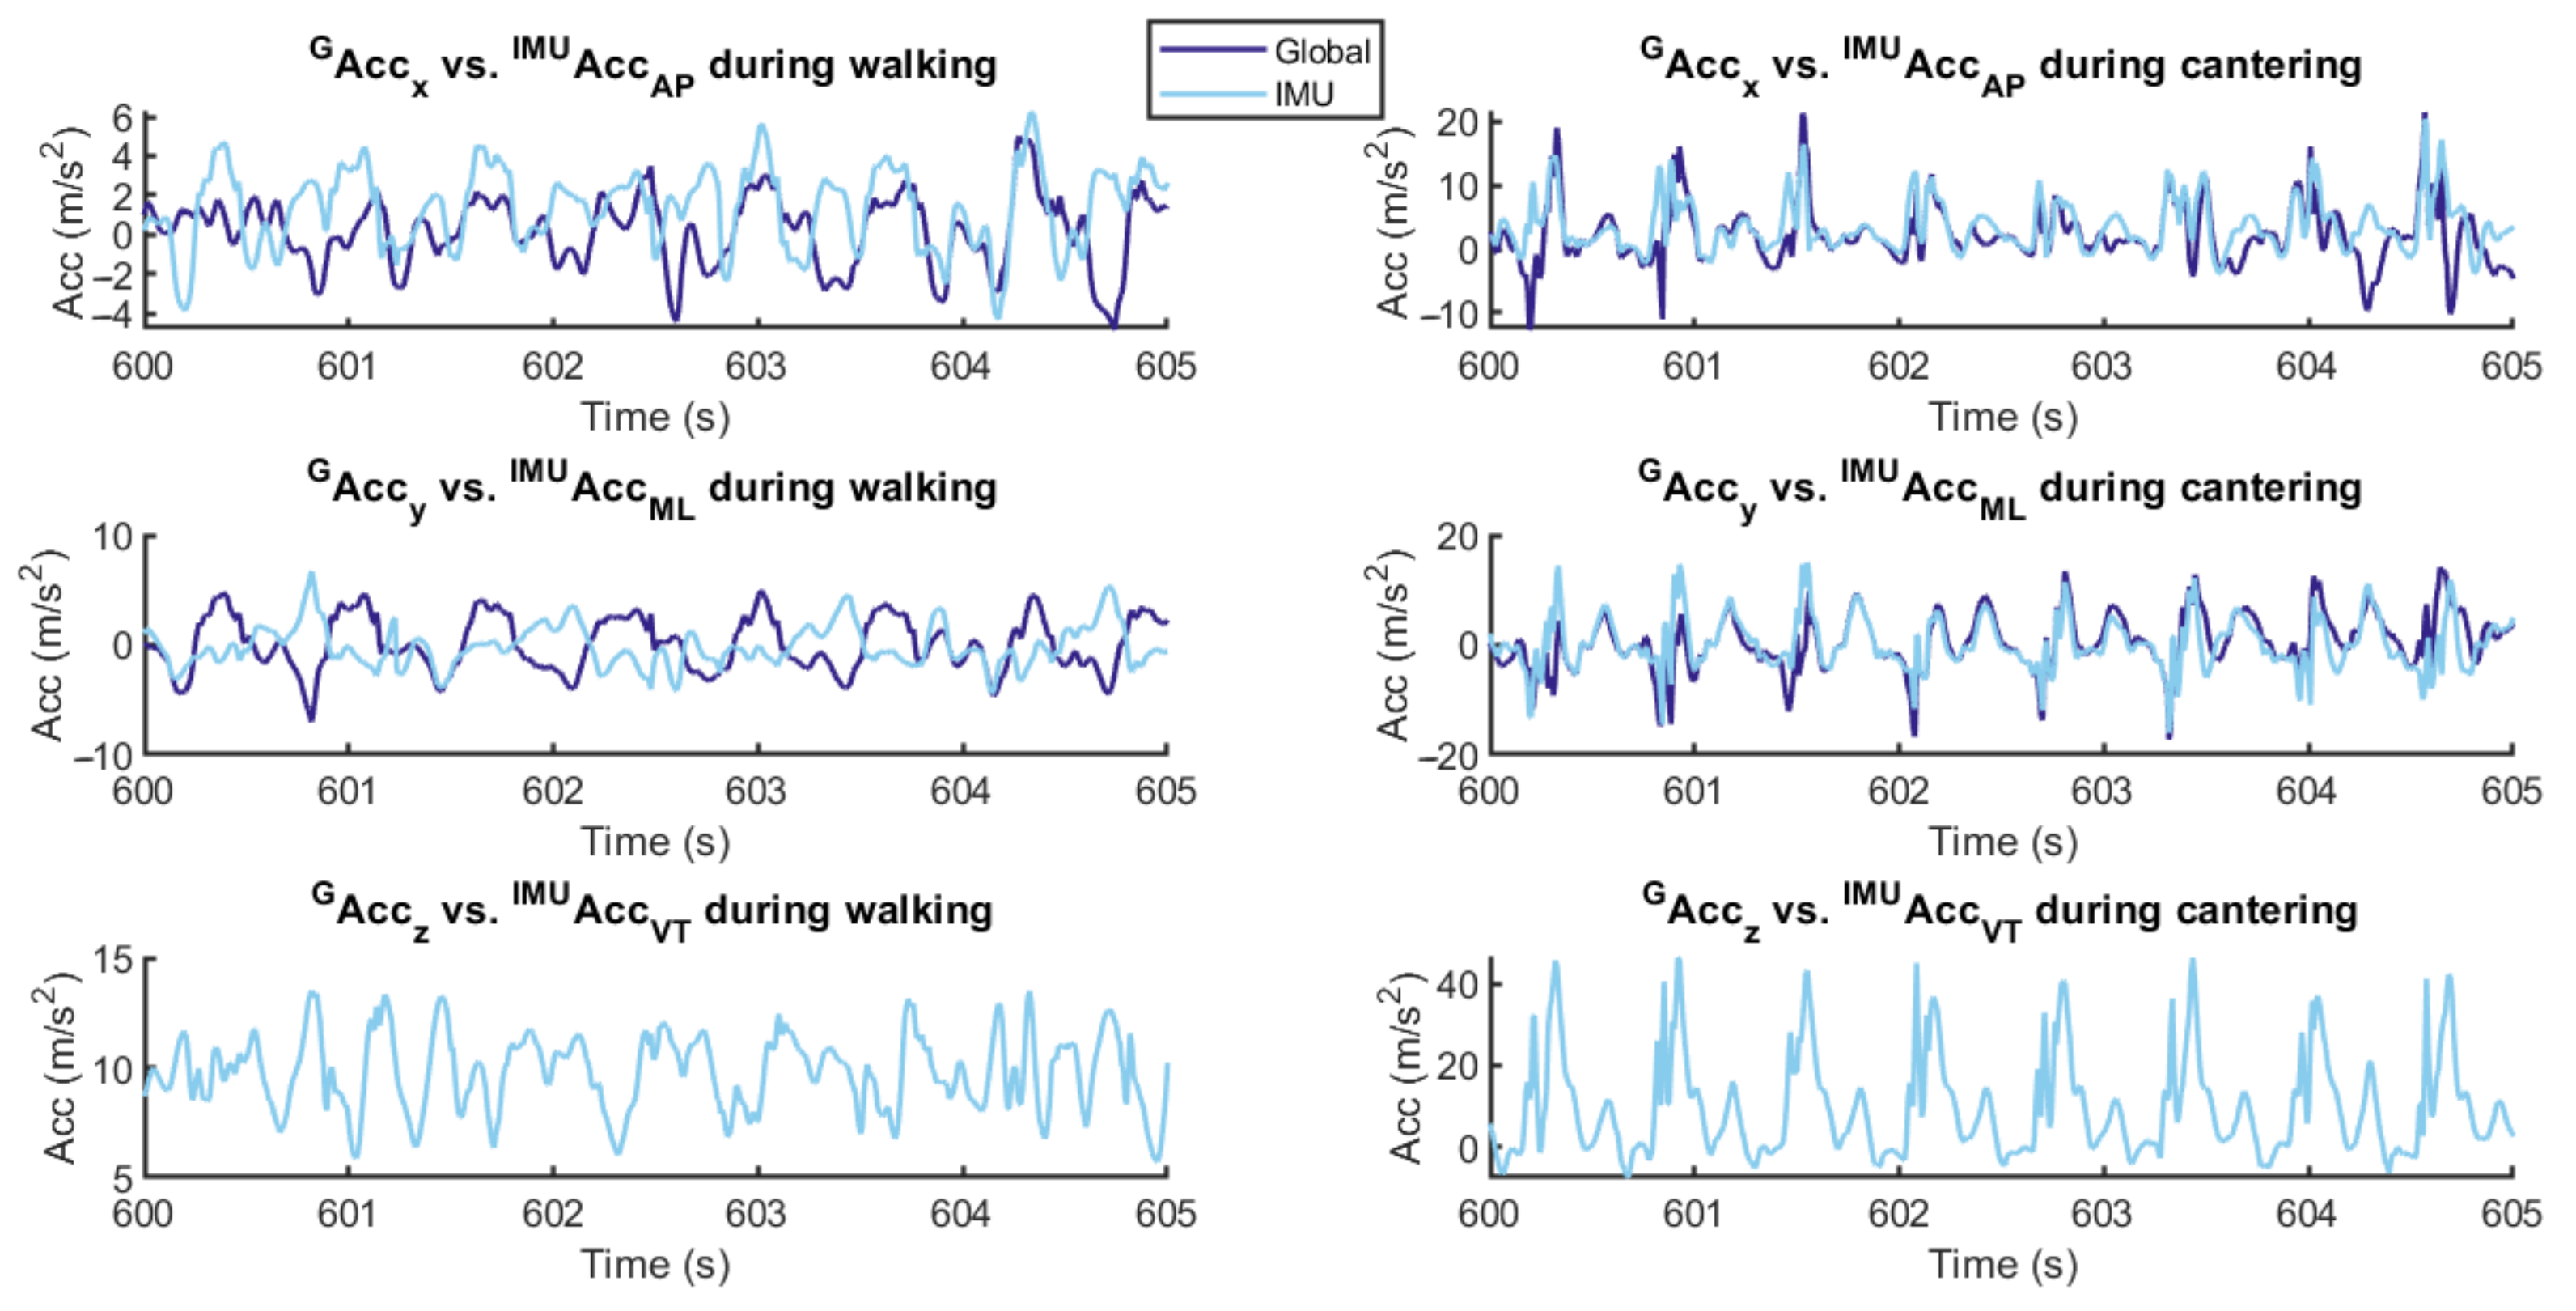
The data captured by the IMUs were extracted using the software provided by the manufacturer. The following data were exported from the IMUs: quaternion angles (based on the onboard fusion algorithm), angular velocity, acceleration, and magnetic field. A dedicated MATLAB (version 2023b) script was employed to synchronize and calibrate the data. The data were checked for inconsistencies, and the accelerations were rotated into a global world-fixed frame of reference using the quaternion output of the sensors (
Figure 1).
To evaluate the variation in overall acceleration over participants, we calculated the standard deviation of the global vertical acceleration of the saddle and pelvis for each participant over a trial and then calculated the mean and standard deviation over the standard deviations of all participants. This was done for walking and cantering separately. To check whether ISO 2631-1:1997 [
10] deemed the signals suitable for calculation of VDV, the crest factor was calculated. This is defined as the ratio of the maximum instantaneous peak of the frequency-weighted acceleration to the RMS value of the full signal. When the crest factor is below or equal to 9, the VDV is deemed appropriate to evaluate the signal.
When the calculation of the VDV with seat accelerations is used for seated persons, ISO2631-1:1997 [
10] assumes that the person remains seated throughout the complete measurement and exposure period. This condition is often violated in repeated shock exposure, like with horse riding (e.g., the buttocks very briefly leave the saddle each stride during cantering). Alternatively, accelerations measured directly on the pelvis can be used, as previously done by [
23]. Consequently, we calculated the VDV using the accelerations of the IMU attached to the pelvis as well as using the accelerations of the IMU attached to the seat. Equation (1) was used to calculate the total weighted acceleration a
v(t) based on the acceleration vector at each instant of time (t).
The VDV can be calculated using the instantaneous frequency-weighted (w) acceleration in m/s
2 in any direction d, a
wd(t), or the total acceleration a
v(t). For calculations concerning health risk assessment, the accelerations in directions AP [AnteroPosterior], ML [MedioLateral], and VT [Vertical] are added using weights (k) of 1.4, 1.4, and 1, respectively [
10]. Equation (2) can then be used to calculate the VDV, taking the fourth root time integral of the fourth power of the acceleration.
T in the equation is the duration of the measurement in seconds. By taking the fourth power, peaks in acceleration are weighted progressively by their amplitude, implying that the magnitude of the vibrations is far more important than the duration of the exposure. To calculate the frequency-weighted accelerations, accelerations are transformed to the frequency domain and multiplied by a weighting function as included in the ISO 2631-1:1997 [
10]. These weighting factors attenuate those frequencies that are thought to pose a lower risk to the human body due to typical human lumbar biomechanical properties, which show a natural frequency of about 4 Hz [
31]. ISO frequency weightings are for 0 Hz, thus eliminating the gravitational acceleration.
ISO 2631-1:1997 [
10] uses accelerations in the global frame for every direction (x, y, z). We also calculated the vertical (VT) VDV using the accelerations in the global frame (z), but we chose to calculate the horizontal VDV using local reference frame accelerations, i.e., a frame with the forward (AP) axis aligned with the walking or cantering direction of the horse and sideward (ML) perpendicular to AP and VT, in accordance with ISO 2631-1:1997 [
10]. This choice was also made because the equestrians were not riding in a straight line, which causes the forward accelerations to be distributed over both the
x and
y axes in the global frame (
Figure 1). The resulting VDVs were compared to the action (9.1 m/s
1.75) and limit (21 m/s
1.75) values specified in the EU directive.
3. Results
The vertical accelerations of the pelvis during walking had a mean (sd) of 9.77 (0.15) m/s
2, the mean deviating from the gravitational acceleration of 9.81 m/s
2 by only 0.39%. This indicates that the measurements and rotation of the accelerations were accurate.
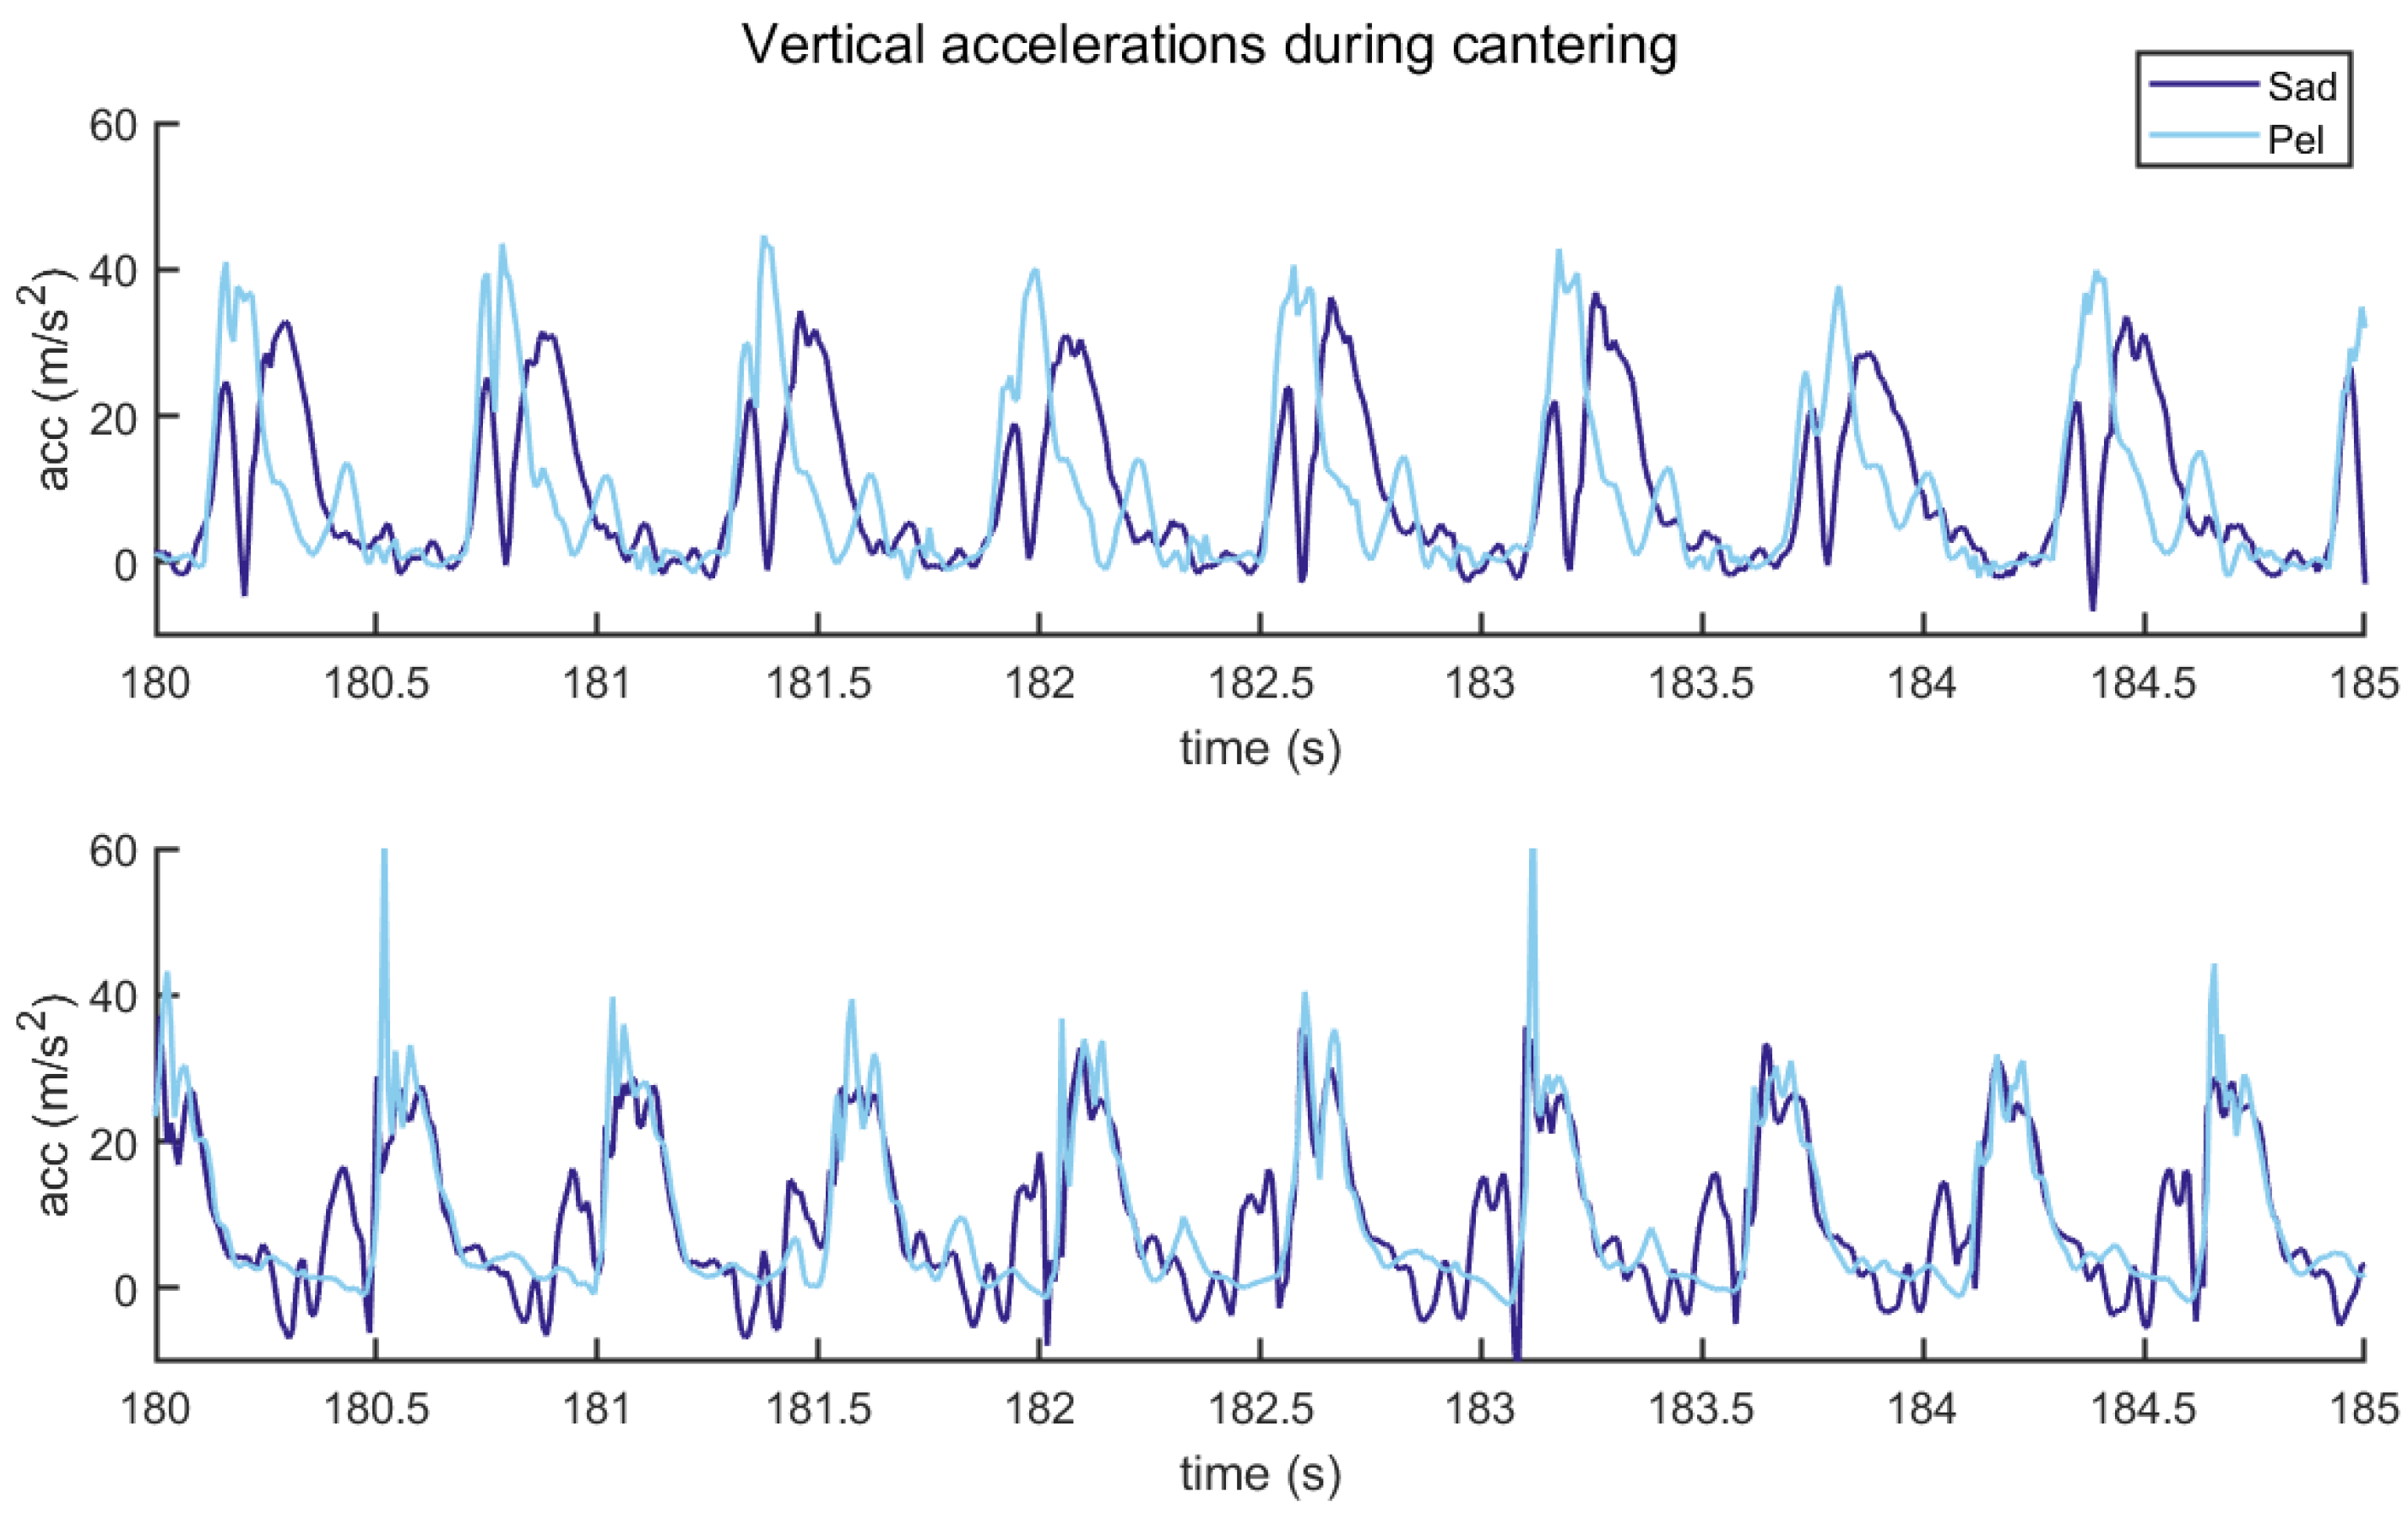
Figure 2 displays a sample of the pelvis accelerations during walking and cantering, demonstrating the acceleration patterns in both local and global axes. Vertical accelerations of the pelvis, including gravity, typically reached 10–20 m/s
2 during walking, and 35–60 m/s
2 during cantering (see
Figure 2). The mean and standard deviation over participants of the standard deviation of the vertical acceleration were 1.70 (0.63) and 10.94 (1.07) m/s
2 for walking and cantering, respectively.
The mean standard deviation of vertical accelerations of the saddle during cantering was 9.63 m/s
2, showing that saddle accelerations are generally lower than pelvis accelerations (
Figure 3). This would mean that using saddle accelerations to calculate the VDV would systematically underestimate the risk to the lower back, as LBP is correlated to vibrations and repeated shocks in the lower back. In view of this, all results are provided for pelvis accelerations, while results for saddle accelerations are partially provided in the
Supplementary Materials.
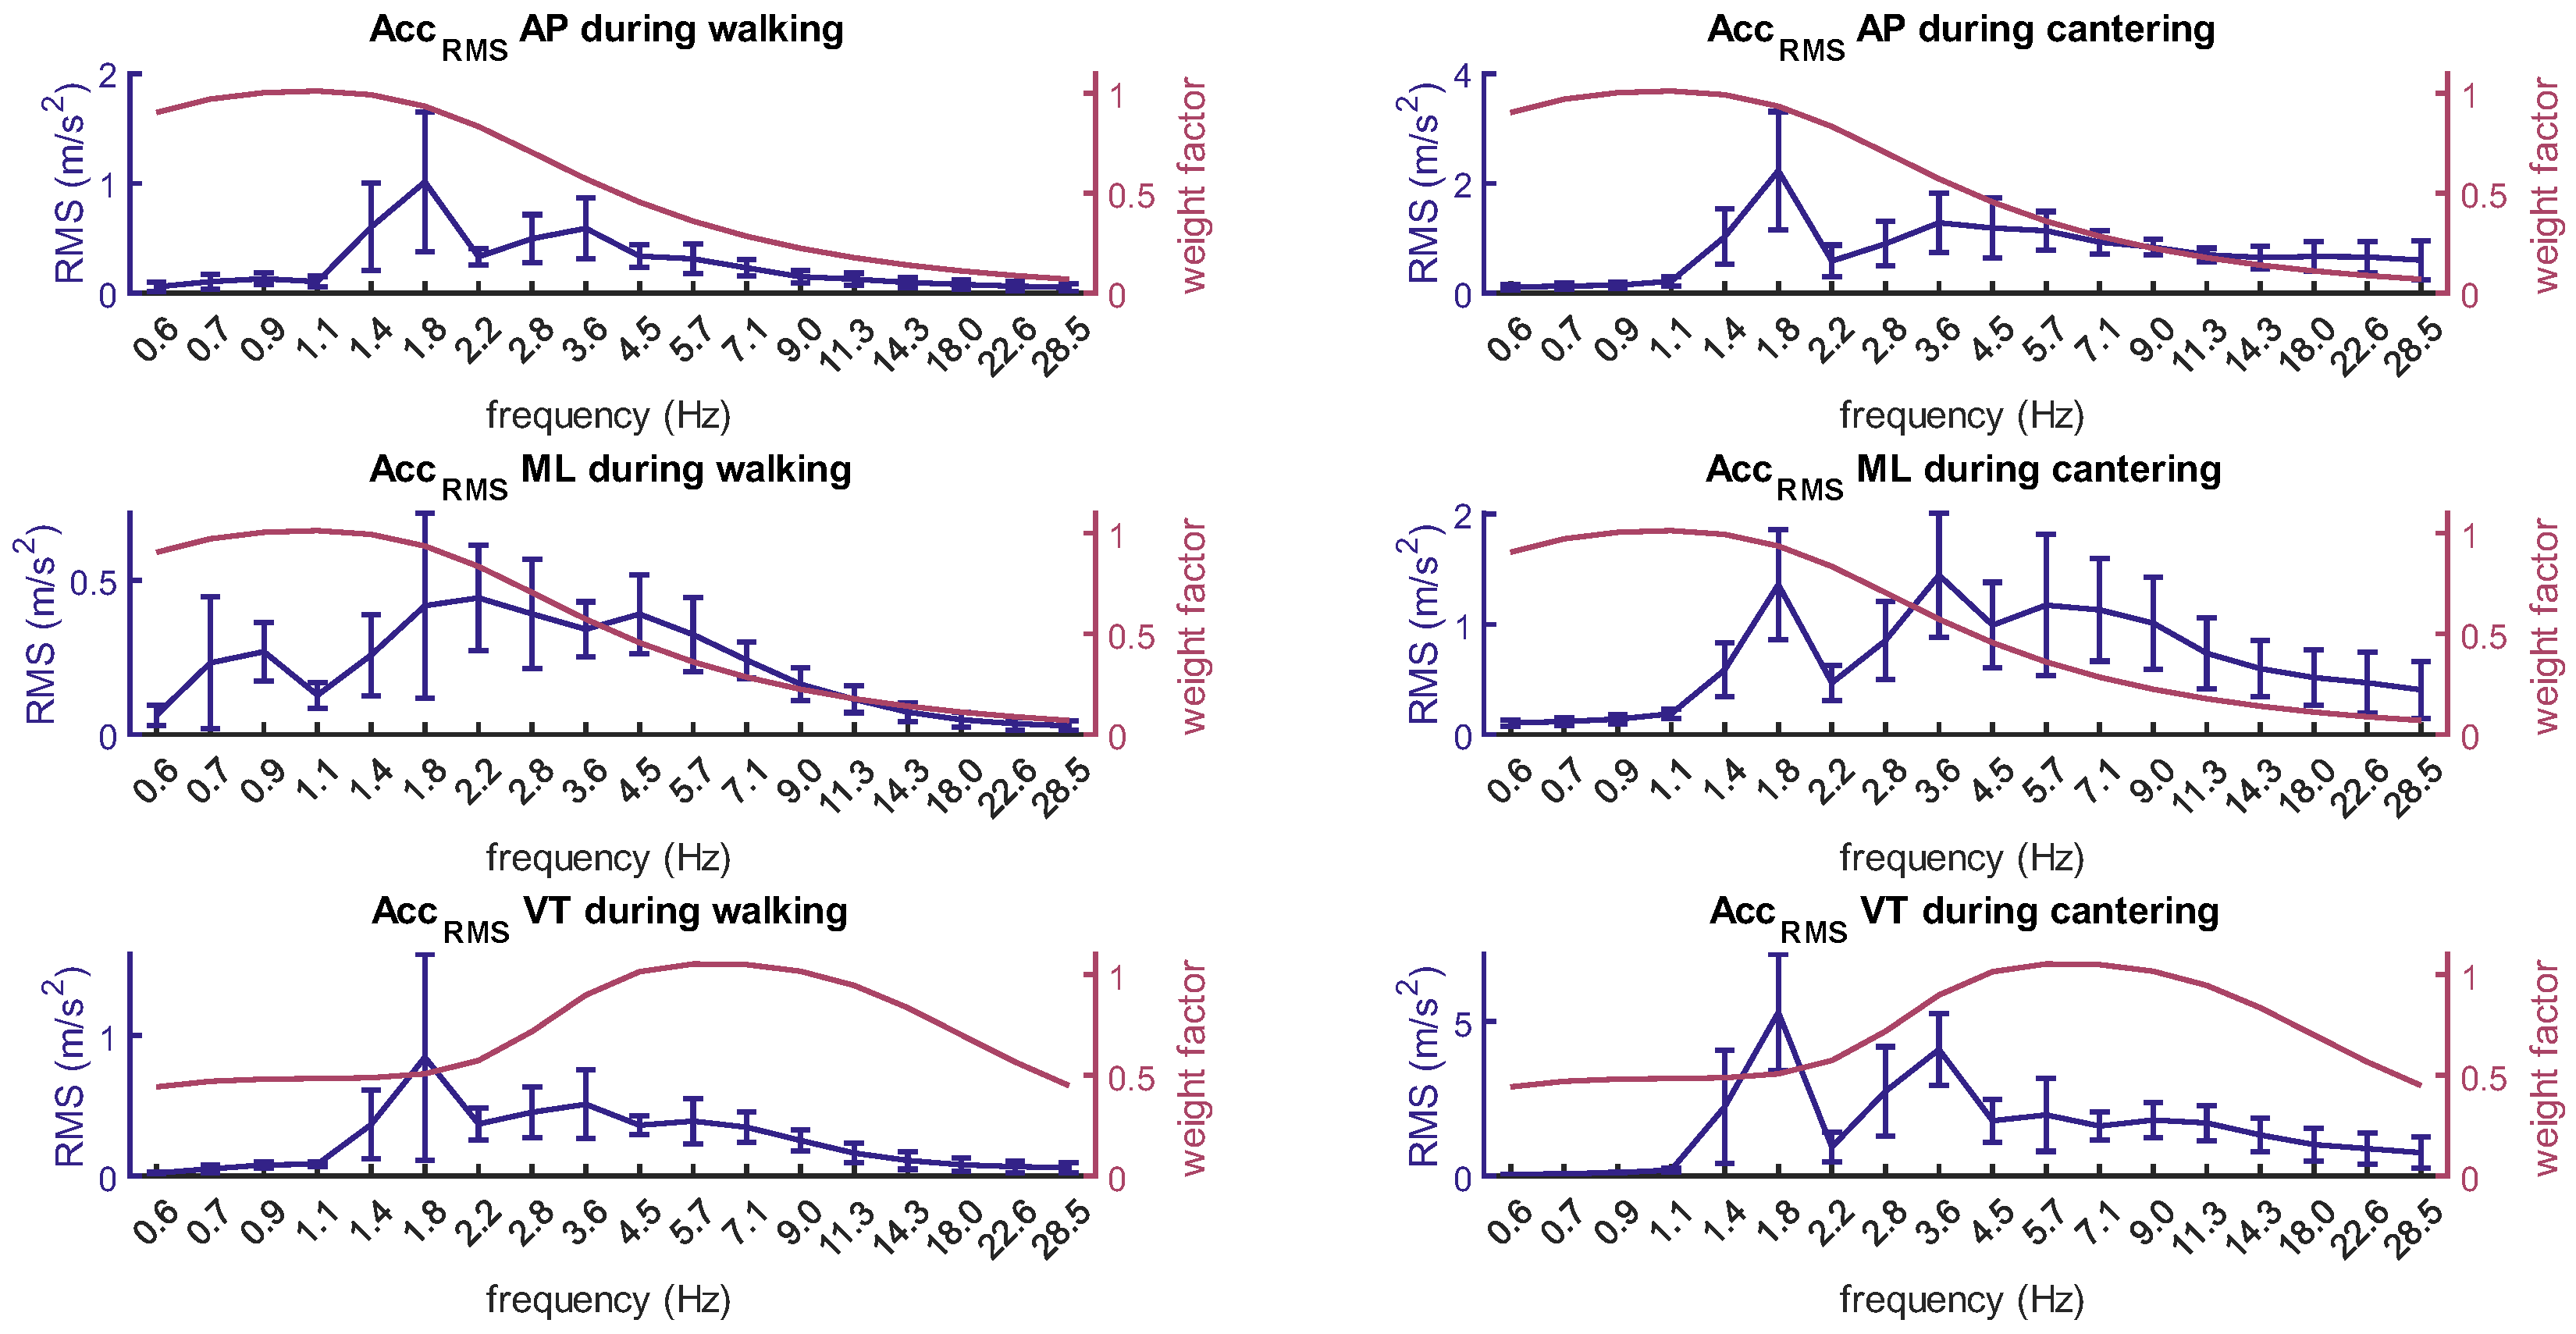
Because the VDV is based on frequency-weighted accelerations, it is important to inspect which frequencies are present and how strong they are. This can be done, for instance, by evaluating the root mean squared (RMS) pelvis accelerations per third-octave frequency band and their corresponding weight factors (
Figure 4). The stride frequency of the horse is clearly present in the RMS accelerations at the 1.8 Hz frequency band for walking and cantering. For cantering, there is also an RMS acceleration peak at 3.6 Hz, which corresponds to the rhythm of the hooves hitting the ground: first one of the hind legs hits the ground, then the ipsilateral foreleg and contralateral hind leg hit the ground simultaneously, followed by the contralateral foreleg. The impact of the last leg is reduced because the other legs already carry the weight of the horse and equestrian.
The average crest factor was 6.6 (1.6) for walking and 6.0 (1.6) for cantering. During both trials, the crest factor exceeded the limit of 9 with 0.3 for only one participant. Similarly, for accelerations measured on the saddle of the horse, the average crest factor was 4.3 (0.8) for walking and 3.7 (0.8) for cantering. This validates the use of the VDV in our study according to ISO 2631-1:1997 [
10]. For walking, the total pelvis VDV (Equation (1)) exceeded the action value (9.1 m/s
1.75) in all participants and the limit value (21 m/s
1.75) in eight out of twelve participants (
Table 1). It should be noted that the large variability in the ratio between AP and vertical VDV (
Table 1) is due to interindividual differences in riding technique. For cantering, the VDV exceeded the action and limit values for all participants, even reaching values of two to three times the limit value (
Table 2). Furthermore, both the vertical and horizontal VDVs individually exceeded the action value in cantering.
To further evaluate the VDV in relation to the action and limit values, we also calculated the VDV over increasing time intervals.
Figure 5 shows that for total pelvis accelerations, the action value was reached after 00:35 min to 03:16 min of walking or within 00:08 min of cantering (also see
Figure S2 for VDV development over the full measurement). The limit value was reached after 09:30 to 30:00 min of walking for eight out of twelve participants or after 00:06 to 00:26 min of cantering. A similar VDV progress was found for the vertical VDV separately. For saddle accelerations, the action value was reached after 00:35 to 04:20 min of walking or within 00:10 min of cantering. The limit value was reached after 10:00 to 30:00 min of walking in 8 out of 12 participants, or 00:12 to 00:40 min of cantering (
Figure S1, Tables S1 and S2).
4. Discussion
Both walking and cantering lead to the VDV exceeding the action and limit values according to the EU directive. The pelvis VDV for walking reached the limit value within 30:00 min for eight out of twelve participants, and cantering reached the limit value within 00:08 min. The pelvis VDV reached two to three times the limit value after 10 min for all participants. One participant reached an exceptionally high VDV during cantering, which was attributed to her relatively aggressive riding style, after visual inspection of the video material and acceleration signals. Equestrian therapy (riding in walking gait) proved to reduce LBP [
29,
32], which leads us to believe that 30 min of walking should pose no health risk for the low back. Hence, if the European limit values [
11] would be suitable for evaluating the risk of LBP in impact loading during horse riding, the action value, and certainly the limit value, should not be exceeded during 30 min of walking. Furthermore, 10 min of cantering should not yet lead to such a large exceedance of the limit value, considering that an increased prevalence in LBP was found in equestrians only when riding multiple hours per week [
26,
27].
In earlier studies on the VDV, a range of activities was investigated with similar and lower impacts. For horse riding, 30 min of walking with bouts of trot and canter resulted in a VDV of 26.2 m/s
1.75, which is comparable to our findings [
30]. For sailing on high-speed boats, the VDV reaches 49.4 m/s
1.75 after 90 min [
21]. On rough waters, the action value was reached after 2 min. During cycling, the lumbar VDV was approximately 24 after 16 min and reached the limit value after 3 min and 43 s [
23]. Operating mining equipment on average leads to a VDV of 25 after 8 h [
15].
According to ISO 2631-1:1997 [
10], the acceleration measured on the seat of the participants should be used for the calculation of the VDV. As mentioned before, the assumption that the buttocks of the rider are in contact with the seat at all times is violated (see also a comparison between the pelvis and saddle accelerations in
Figure S3). This is also the case for other activities, including repeated shocks for which VDV is used, like sailing a high-speed boat using a so-called jockey seat [
33]. Mitigation of repeated shocks by the legs means that the accelerations of the seat cannot be accurately recalculated into the accelerations of the pelvis. Furthermore, when the buttocks are in contact with the seat, the soft tissue of the buttocks may already dampen some of the acceleration. Both of these notions imply that the pelvis accelerations calculated from the seat accelerations would differ from the actual pelvis accelerations. Because LBP is caused by the exposure of the lower back to accelerations, regardless of whether these accelerations originate from the feet or the buttocks, we deem the pelvis accelerations to be the most relevant. Nevertheless, the VDV calculated from saddle accelerations in horse riding (
Figure S1) shows that, although limit values are reached somewhat later, the course of the VDV value over time does not differ a lot from the course of the pelvis VDV (
Figure S2). This implies that the majority of the impact that contributes to the rise of the VDV takes place while the buttocks are in contact with the saddle. During cantering, pelvis accelerations reached the action value within 00:08 min, whereas saddle accelerations reached the action value within 00:10 min. The limit value was reached within 00:21 min and 00:40 min for pelvis and saddle accelerations, respectively. Despite these larger numbers for saddle accelerations, our conclusion that action and limit values are too strict would not change if saddle accelerations had been used. Similar to our findings, Edwards and Holsgrove [
23] showed that for cycling while remaining seated, the VDV from accelerations measured on the lumbar spine was lower than the VDV calculated from saddle accelerations.
Some limitations of this study should be mentioned. First, because only female equestrians signed up to participate in our study, we may not be able to accurately generalize the results to the complete equestrian population. As VDV variability in horse riding likely depends on the horse, the riding technique of the equestrian, and soft tissues between the pelvis and the saddle, the VDV magnitudes might differ to some extent for males. However, we do not expect the findings for males to be so different from females that this would affect our conclusions. Second, we only investigated repeated shocks in horse riding. While it becomes clear that the VDV-based limit values are too strict for this activity, it remains to be investigated if this also holds for other activities involving repeated shocks. Last, it should be noted that this study is limited to the evaluation of musculoskeletal injuries. Other physical injuries that could occur after repeated shocks, such as neurological, vascular, and vestibular disorders, are not considered in the VDV and are therefore not included in this study.
While working with large accelerations, such as with high-impact activities, the fourth power and root in the calculation (see Equation (2)) amplify the larger accelerations more than smaller accelerations, which is the cause of the high VDV for high-impact activities. This is in agreement with in vitro research [
34], which has shown that the magnitude of compression force has a larger contribution to the probability of injury to a vertebra than the number of loading cycles. This suggests that larger loading peaks should indeed be weighted more than the number of loading cycles, in line with the weighting of large peaks in the calculation of the VDV. However, either the magnitude of the frequency weighting of accelerations in the VDV or the action and limit values in the EU directive may be inaccurate for this type of loading. Therefore, based on our results, the combination of the VDV and the action and limit values according to the EU directive could be reconsidered for use with repeated shocks due to horse riding.
Because the EU directive is legally binding for some activities, including repeated shocks, and may restrict exposure too much, more research should be conducted for a wider range of activities. If the use of the VDV and EU Directive in these activities were to be reconsidered, broader testing would make this more efficient and thorough.


