1. Introduction
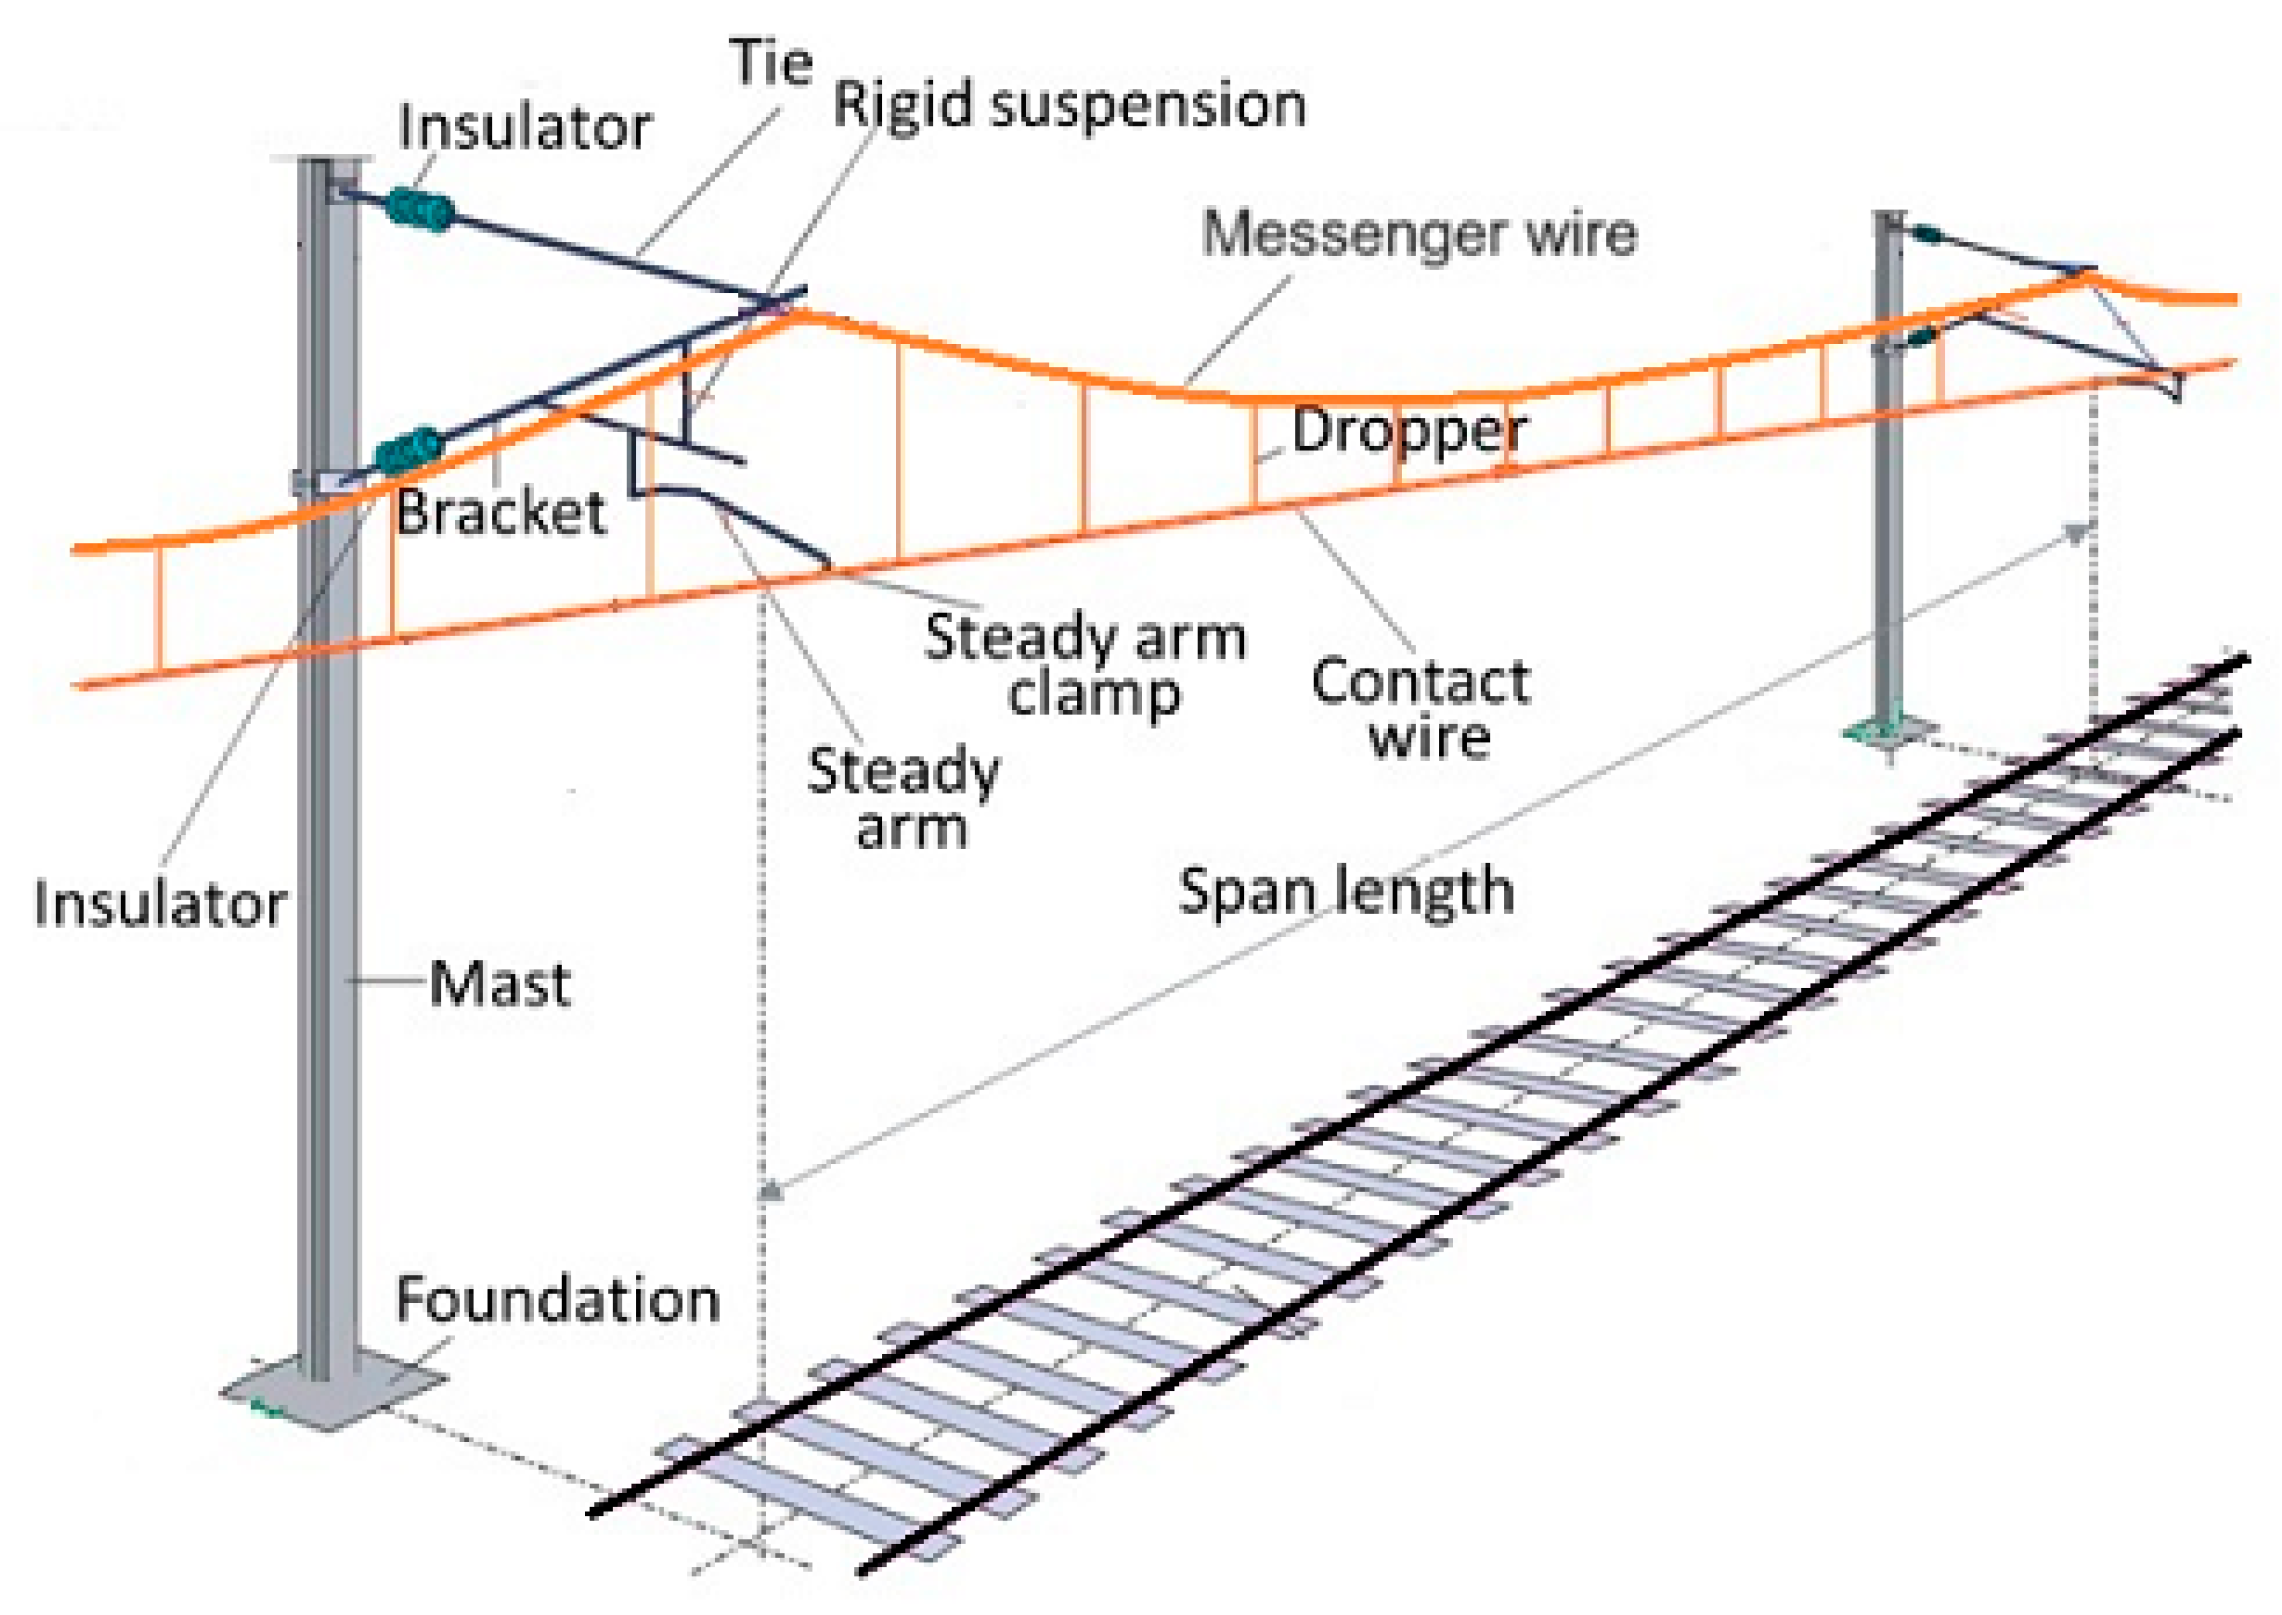
An overhead contact line (OCL) is a key component of the railway infrastructure’s energy subsystem, supplying electrical power to the motors of electric trains. The main components of an OCL include a contact wire (CW), which is suspended to the messenger wire (MW) by a series of droppers spaced along the line. The MW is supported by suspensions attached to structures such as poles or portals, typically at intervals of 50 m to 60 m. Each suspension consists of a frame, insulators, and a steady arm, with the latter imposing the lateral position (stagger) of the CW.
Figure 1 reports a schematic of an OCL with its main components.
The purpose of the OCL is to supply electrical power to train motors through a sliding contact between the contact wire (CW) and the pantograph collector strip.
Maintaining the correct geometry and structural integrity of the OCL is essential for safe and efficient railway operation. Any failure or misalignment of one or more OCL components can damage the pantograph, and in the worst case, cause additional damage to the OCL itself. Such damage can lead to service interruptions, disrupting traffic flow.
Different types of failures and damages can affect the OCL, each with different impacts on railway operation. These can range from the accelerated wear of individual components to the severe damage or breakage of critical OCL elements.
Failures that may occur in the OCL can be categorized into two main types: (i) failures arising from initial damage to the pantograph, and (ii) failures caused by improper geometrical configuration of the OCL. In these cases, the damage may be limited to the pantograph or extended to the structural integrity of the OCL itself. Other types of failure may occur independently of pantograph transit, often as a result of accumulated damage, leading to a break in the contact wire (CW). Such damage may also be triggered by external factors, such as ice buildup, wind, uncompensated temperature variation and associated overstress, or local overheating due to high current intensity. The failure of the CW can cause severe damage on a pantograph passing beneath the broken CW section, potentially resulting in a catastrophic event requiring the suspension of traffic. Therefore, it is crucial to prevent the transit of the pantograph under a damaged section of the OCL with a broken CW. In such extreme cases, it is important to note that a CW break may not be detectable by an electrical voltage drop from the power station since electrical continuity is maintained unless the messenger wire (MW) is also damaged.
More common failures of the OCL involve the droppers [
1,
2,
3,
4] or elements of the suspension of the span [
5]. On the other hand, although the rupture of the contact wire (CW) is a rare phenomenon, with a probability on the order of 10
−8 (see [
5]), it must still be considered in a proper risk analysis due to its potential consequences. Localized wear and fatigue failure are considered the most common causes of CW rupture. Wear and fatigue are concurrent damage mechanisms [
6]; when wear rate is low, as in the case of a high-speed (HS) line, fatigue failure is more likely to develop from microcracks beneath the CW surface.
Possible causes of crack initiation and subsequent fatigue failure in the CW include the continuous occurrence of arcing, combined with bending of the CW [
7] during pantograph transit and the subsequent decay that can be lengthy due to the low structural damping of the OCL. Other causes of fatigue are related to the presence of a clamp (either temporary for maintenance or permanent). In such cases, CW failure may occur unexpectedly and remain undetected during standard inspections.
Some research devoted to improving mechanical behavior and performances to prevent failures of wires and overhead line components can be found in the literature [
8,
9,
10]; but, while these actions are able to reduce the probability of failure related to the fatigue failure of single OCL components, they are not able to avoid failure related to accidents caused by external factors such as contact between the OCL and damaged pantographs or failures caused by improper geometrical configuration of the OCL.
Examples of the consequences of CW breakage can be found in investigations conducted by safety surveillance authorities or transport boards, usually linked to the National Ministry of Transport.
The first example comes from a regional network close to Rome, Italy ([
11], reference in Italian), reported by DIGIFEMA, the Italian office branch of the Ministry of Transport, which is responsible for investigating rail and maritime transportation accidents. In this case, the CW broke due to the transit of a damaged pantograph. Subsequent pantograph transit further damaged the CW, which remained electrically connected to the system and at line voltage. The main following secondary effects were electric arcs and the start of fires. In the meantime, passengers spontaneously evacuated the train, with the power line still in operation due to bilateral connections to the power system and a defective switch. The electrical voltage was only switched off after the on-board train manager called for assistance and safely evacuated the passengers.
A second example, reported by DAIB in the UK [
12], involved a train driver who noticed the damaged CW ahead and stopped the train before passing under the broken section. After notifying the signaler staff pertinent to the area, the driver left the train to refer to the exact location of the problem. However, the low-hanging CW was still electrically live, and the driver suffered serious injuries after coming into contact with the rails. The subsequent investigation revealed that the wire had broken due to fatigue, likely initiated at a high-stress area near a clamp supporting the overhead wire.
A third example of accident involving the breakage of the CW of an OCL concerns a freight train in the Netherlands on 14 September 2022 [
13]. During the train transit the CW broke, causing a fire in the freight cars being transported. The CW breakage occurred at multiple points and the pantograph subsequently drew 800 m of OCL, further extending the damage.
A subsequent investigation by ProRail [
13] revealed that the breakage began at temporarily repaired sections where the contact wire was below the permitted thickness, and supplementary parallel short lengths of CW were set aside with additional clamps. The combination of electrical arc erosion and the presence of clamps eventually led to the CW breaking during pantograph transit.
The fire was triggered by a short circuit caused by a switch operation, which occurred without the operators being aware of the ongoing issue.
The above-mentioned examples underscore the severe consequences of CW breakage and highlight the importance of developing monitoring systems for the OCL that can alert traffic control rooms and prevent trains from passing under a broken CW section.
In the literature, some monitoring systems are proposed to monitor continuously the OCL to detect CW cracks analyzing the changing law of eddy current signal characteristics [
14] or, in general, to minimize potential risks that the infrastructure faces by using suitably developed fiber Bragg grating (FBG) sensors-based solutions [
15].
The present paper examines the feasibility of a monitoring setup, using standard sensors as accelerometers and displacement transducers, designed to detect a rupture event in the CW and consequently transmit an alert to the traffic management unit. The goal is to prevent train transit under the broken section, minimizing potential harm to passengers and operators and reducing the damage to the OCL, which could delay the restoration of normal operation.
The proposed monitoring system is conceived to be installed at each end of the OCL regulation to detect the dynamic effect caused by a CW break, which disrupts its mechanical continuity. Consequently, the mechanical tension (axial load) of the portion of the CW is subjected to a sudden change, with a pulse-like pattern, that travels along the OCL and reaches the extremity of the regulation, where measurements are intended to be taken. This paper investigates the dynamic behavior of the OCL after the occurrence of a failure in the CW, simulating the after-breakage transient by means of nonlinear dynamic analysis to define the pattern of the acceleration, displacement, and axial force at a line’s extremities. Several locations of CW rupture are examined to analyze the resulting time history of variables that can be measured at the regulation’s end, comparing them under different prospects in terms of feasibility, CW rupture detection capability, and challenges in processing the measured variables.
The paper is organized as follows:
Considerations on the monitoring setup potentially applicable to the OCL;
Description of the OCL model and of the procedure for simulating the CW breakage;
Results from simulations in the examined scenarios;
Final remarks.
The aim of the paper is to present the concept of a monitoring system capable of detecting the occurrence of a rupture in the CW to raise an alert to traffic management and halt train traffic in the affected section, preventing further damage and ensuring passenger safety.
2. Some Consideration on the Monitoring Setup in Relationship to OCL Structure
The arrangement of a measurement and monitoring system on a single structure, such as a bridge or a tunnel, is a common practice today. However, implementing such systems on an OCL is more challenging because of several reasons. The main reason is that the active components of the OCL structure are at a high voltage, with typical nominal voltages of 1.5 kV or 3 kV DC, or 15 kV or 25 kV AC. This characteristic poses issues concerning (i) the insulation of the transducers to be used for monitoring, (ii) how to power them, and (iii) how to transmit the signals to the data acquisition and processing system.
Another critical challenge is the large territorial extent of the infrastructure. For this reason, the use of inspection trains or vehicles is the most efficient way to monitor large areas. This approach is particularly effective for monitoring those parameters that show continuous development, such as the wear of the CW or its geometrical configuration. However, since the interval between inspections depends on the availability of inspection trains, the network extension, and the line category, periodic inspections are not suitable to detect sudden failures. Under this respect, continuous monitoring would be more effective. The challenge, then, is to set a balance between infrastructure coverage and the ability to detect and report alerts quickly to control sites in order to halt the traffic before the section involved in the CW breakage is traversed by a subsequent train.
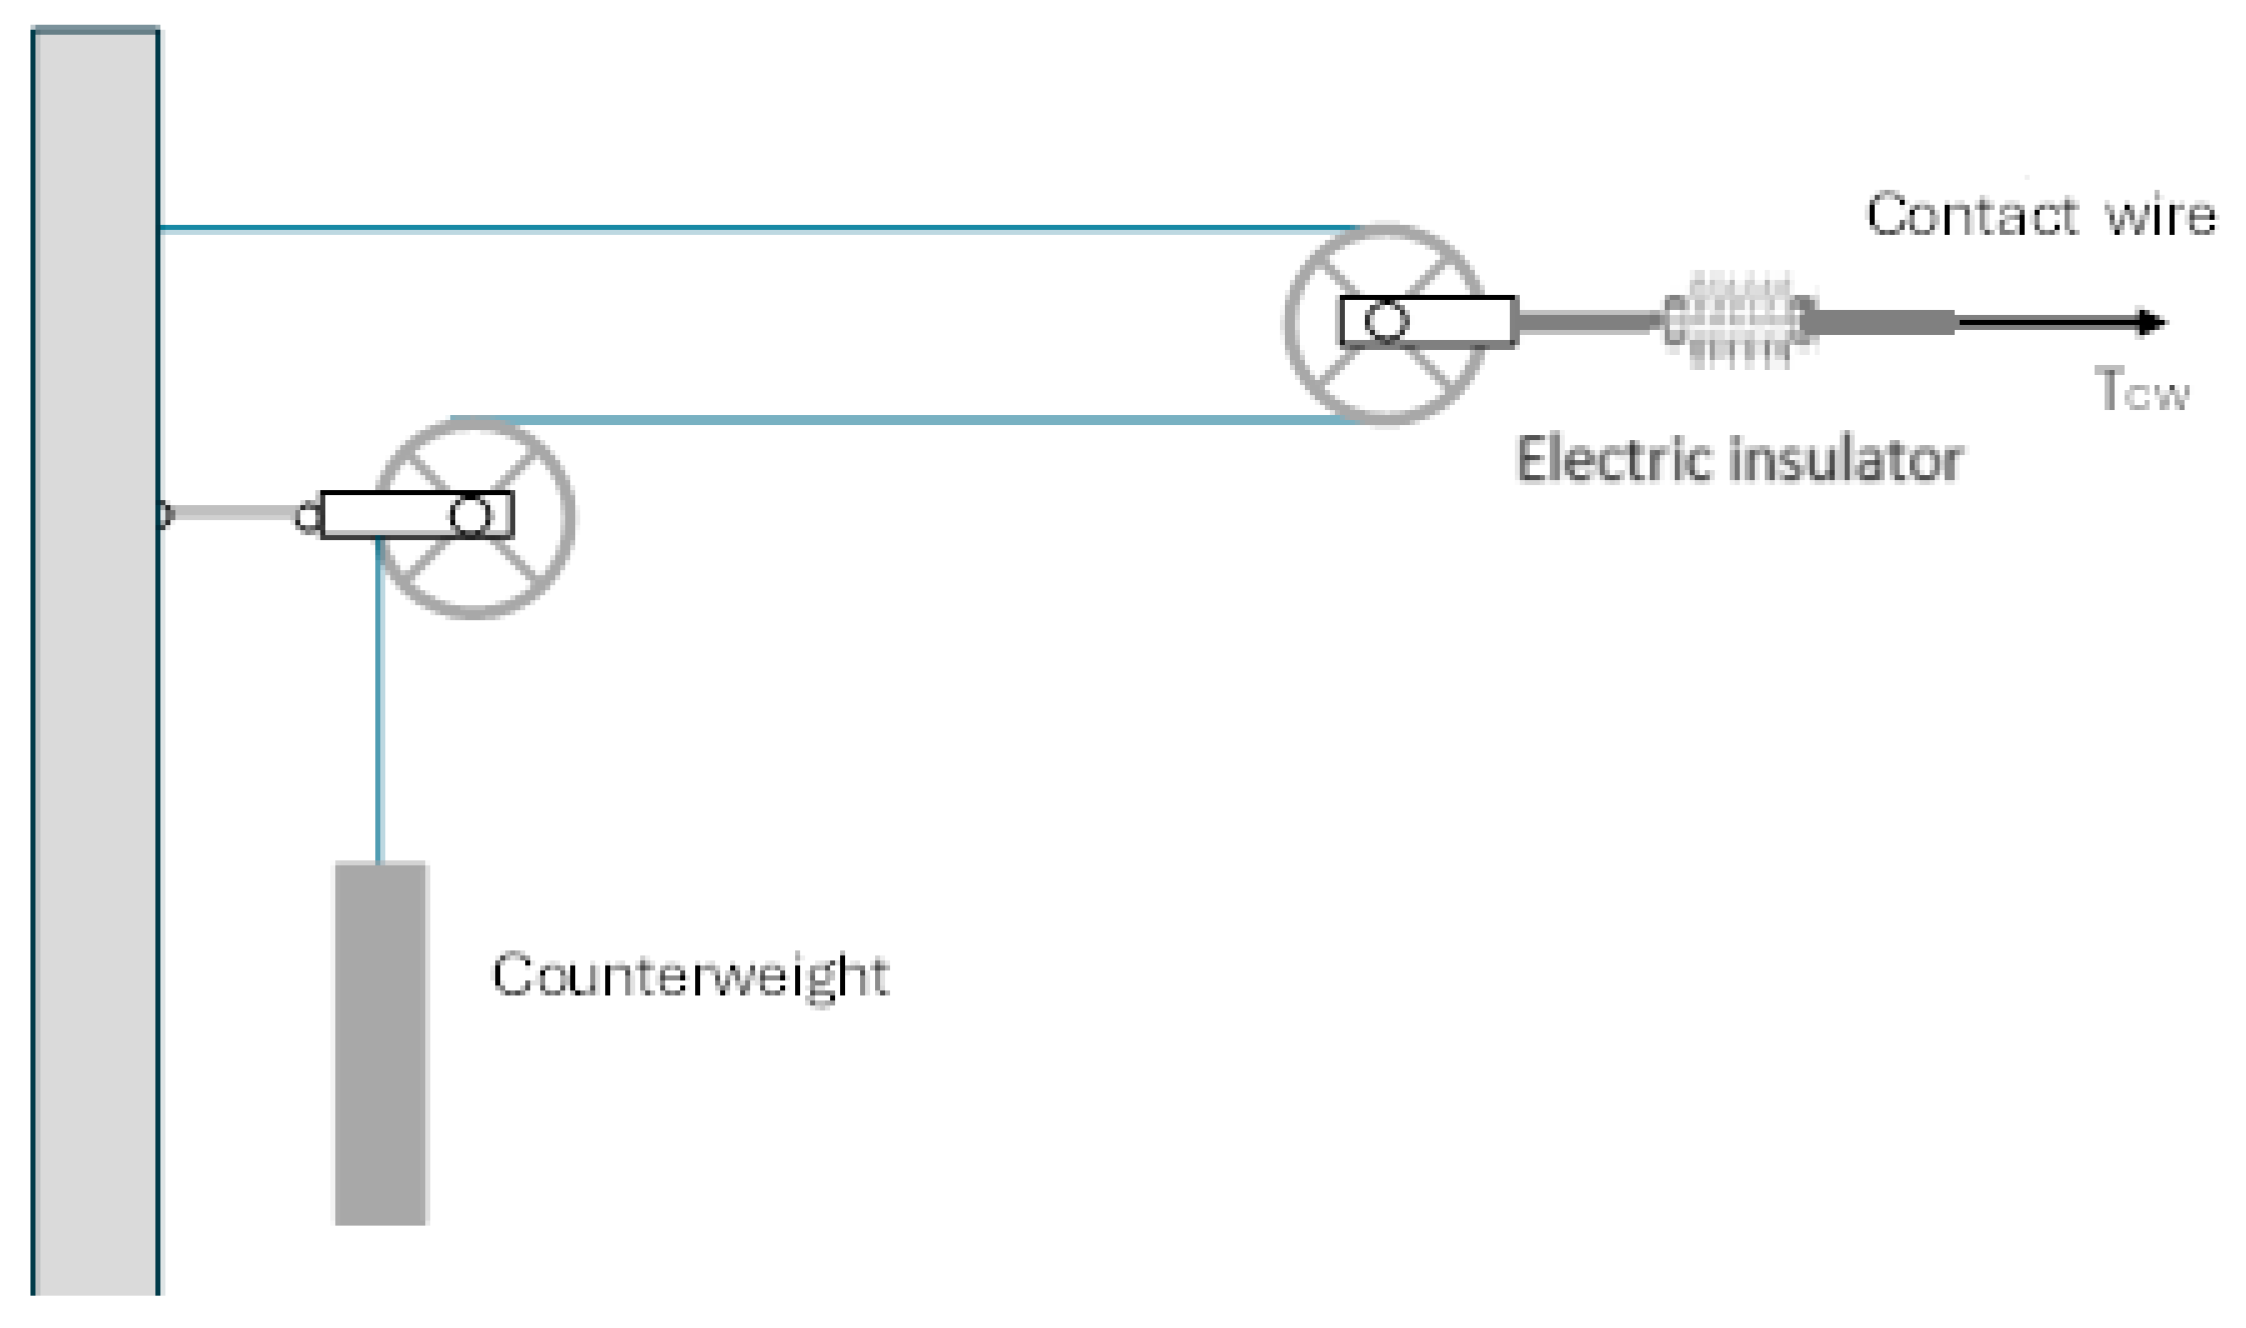
A monitoring system needs to consider the particular structure of the OCL, which is typically divided into sections (called “regulations”) with lengths ranging from 1000 m to 1400 m, consisting of mechanically tensioned uninterrupted conductors, namely the CW and the messenger wire (MW). The length of the CW and the MW corresponds to the length of the entire regulation, so that there are no junctions on the conductors inside a regulation. The CW and the MW are unwrapped from a cable reel, brought along the line by special vehicles during the construction stage. In the final configuration, axial load is applied to the conductors by a series of masses whose gravity force is transferred and amplified through a device consisting of pulleys and a chain (
Figure 2). The loading device is connected to the end side of the conductors through an electrical insulator. This tensioning device allows for thermal expansion and contraction associated with temperature changes without affecting the overall axial load of the conductors. When considering on-site monitoring of the OCL to detect CW ruptures, the first issue that arises is the high cost and impracticality of monitoring every span, regardless of the type of transducer used. This is due not only to the number of transducers required but also to the need to power a distributed network of sensors and transmit their signals. Additionally, maintaining such a monitoring network would add further complexity. A more practical solution would be to concentrate measurements in a single section, selected based on the structure of the OCL.
Given the structure of the OCL, a suitable solution for transducer placement would be at the end section of the regulation, considering that the effect of CW breakage can be potentially measured also at large distance, enabling the monitoring of half of the regulation (from the fixed point to the load regulation device at each end of the section) with a single measurement system.
The consequences of the breakage of the CW are of two types: a dynamic response due to an impulse-like effect and the change in statical configuration. That considered, the proposed candidate variables worth being measured at the end of the regulation are as follows:
The dynamic variation in mechanical tension on both the CW and MW;
The longitudinal displacement of the CW and MW;
The vertical acceleration of the CW.
However, several challenges must be considered when installing transducers on an OCL. The most significant issues are outlined below:
Application of transducers on a structure at high voltage. Transducers could be placed before the insulators at the ground potential or after the insulator on the CW. In the latter case, issues related to power supply and signal transmission for standard sensors must be carefully addressed and solved.
Powering of transducers. Continuous power is required for the transducers to ensure that the alert function always remains active: a combination of batteries and solar panels can be used
Metrological parameters of the transducers. These include frequency range, long-term bias, and sensitivity to temperature.
Local processing of the acquired signal. This includes computational effort, management of data acquisition, and signal processing.
Signal transmission and alerting. Efficient transmission of the signal or index and the consequent alert must be ensured.
Installation, durability, maintenance, and diagnostics of the transducers. Considerations related to the installation process, long-term durability, ongoing maintenance, and the ability to perform diagnostics on the transducers must be considered.
Considering the above-mentioned issues, some recommendations on the transducers suitable to be used are given below.
For the measurement of the axial load in the CW and in the MW an optical fiber-based strain gage is the preferrable option to measure strain, avoiding the issues related to electrical insulation, with the main drawback being the cost of the signal conditioning device, depending on the type of fiber optics used, since the dynamic behavior needs to be properly measured. FBG requires f.i., a rather costly conditioner, that in turn needs to be powered on-site. As will be shown later in the report, a combination of displacement and acceleration measurement is proposed in spite of direct axial load measurement.
For the measurement of the longitudinal displacement of a CW and MW section at an OCL end, a long-range optical system can be used without requiring a high resolution due to the expected displacement. The target could be the insulator or the counterweight (see
Figure 2), and the measuring device could be located before the insulator in the zone at ground potential so that no insulation issue is present.
As for the acceleration measurement on the CW, its location is clearly in a live voltage area. An available and convenient option is given by a wireless accelerometer which is able to transmit the signal avoiding the use of electrical cables. Use of such devices has been already demonstrated in real operating conditions.
3. Model of the OCL
The OCL considered in this paper is the Italian HS line operating a 25 kV AC system. The CW and the MW are tensioned at regulated tensions of 20 kN and 16 kN, respectively. The main parameters of the CW and the MW are summarized in
Table 1.
A finite element model was created using Abaqus
® 2022 version, where beam elements are adopted to represent the conductors and insulators while connectors were used to model the droppers to simulate their slackening during the dynamic transient following the breakage of the CW. Only one half of the regulation OCL has been modeled, and the symmetrical boundary conditions have been considered. The model, shown in
Figure 3, consists of 420 nodes and 412 B31 beam linear elements to model the CW, MW, and insulators according to the detailed cross-sections reported in
Table 2. To model the droppers, 83 nonlinear axial connectors, 1 for each dropper, have been used as shown in the detail of
Figure 3. These axial nonlinear connectors are defined by the initial un-deformed distance between the two connected nodes; the first node is on the MW and the second node is on the CW. If the distance decreases, the connector exerts no reaction force, corresponding to the dropper slackening, while an increasing distance results in a reaction force proportional to the dropper’s axial stiffness. This model allows for a simple yet effective representation of the dropper’s behavior under tension and relaxation. The current model does not account for the stagger, or the zig-zag arrangement, of the OCL conductors.
Regarding the damping of the OCL structure, Rayleigh damping is assumed with parameters
and
, i.e., the damping matrix
can be defined as follows:
where
and
are, respectively, the mass and stiffness matrices of the OCL numerical model. The assumed values of the damping parameters are in the high range of the usual damping ratio, corresponding to a value of 2%, while other reported damping values are around 0.5%.
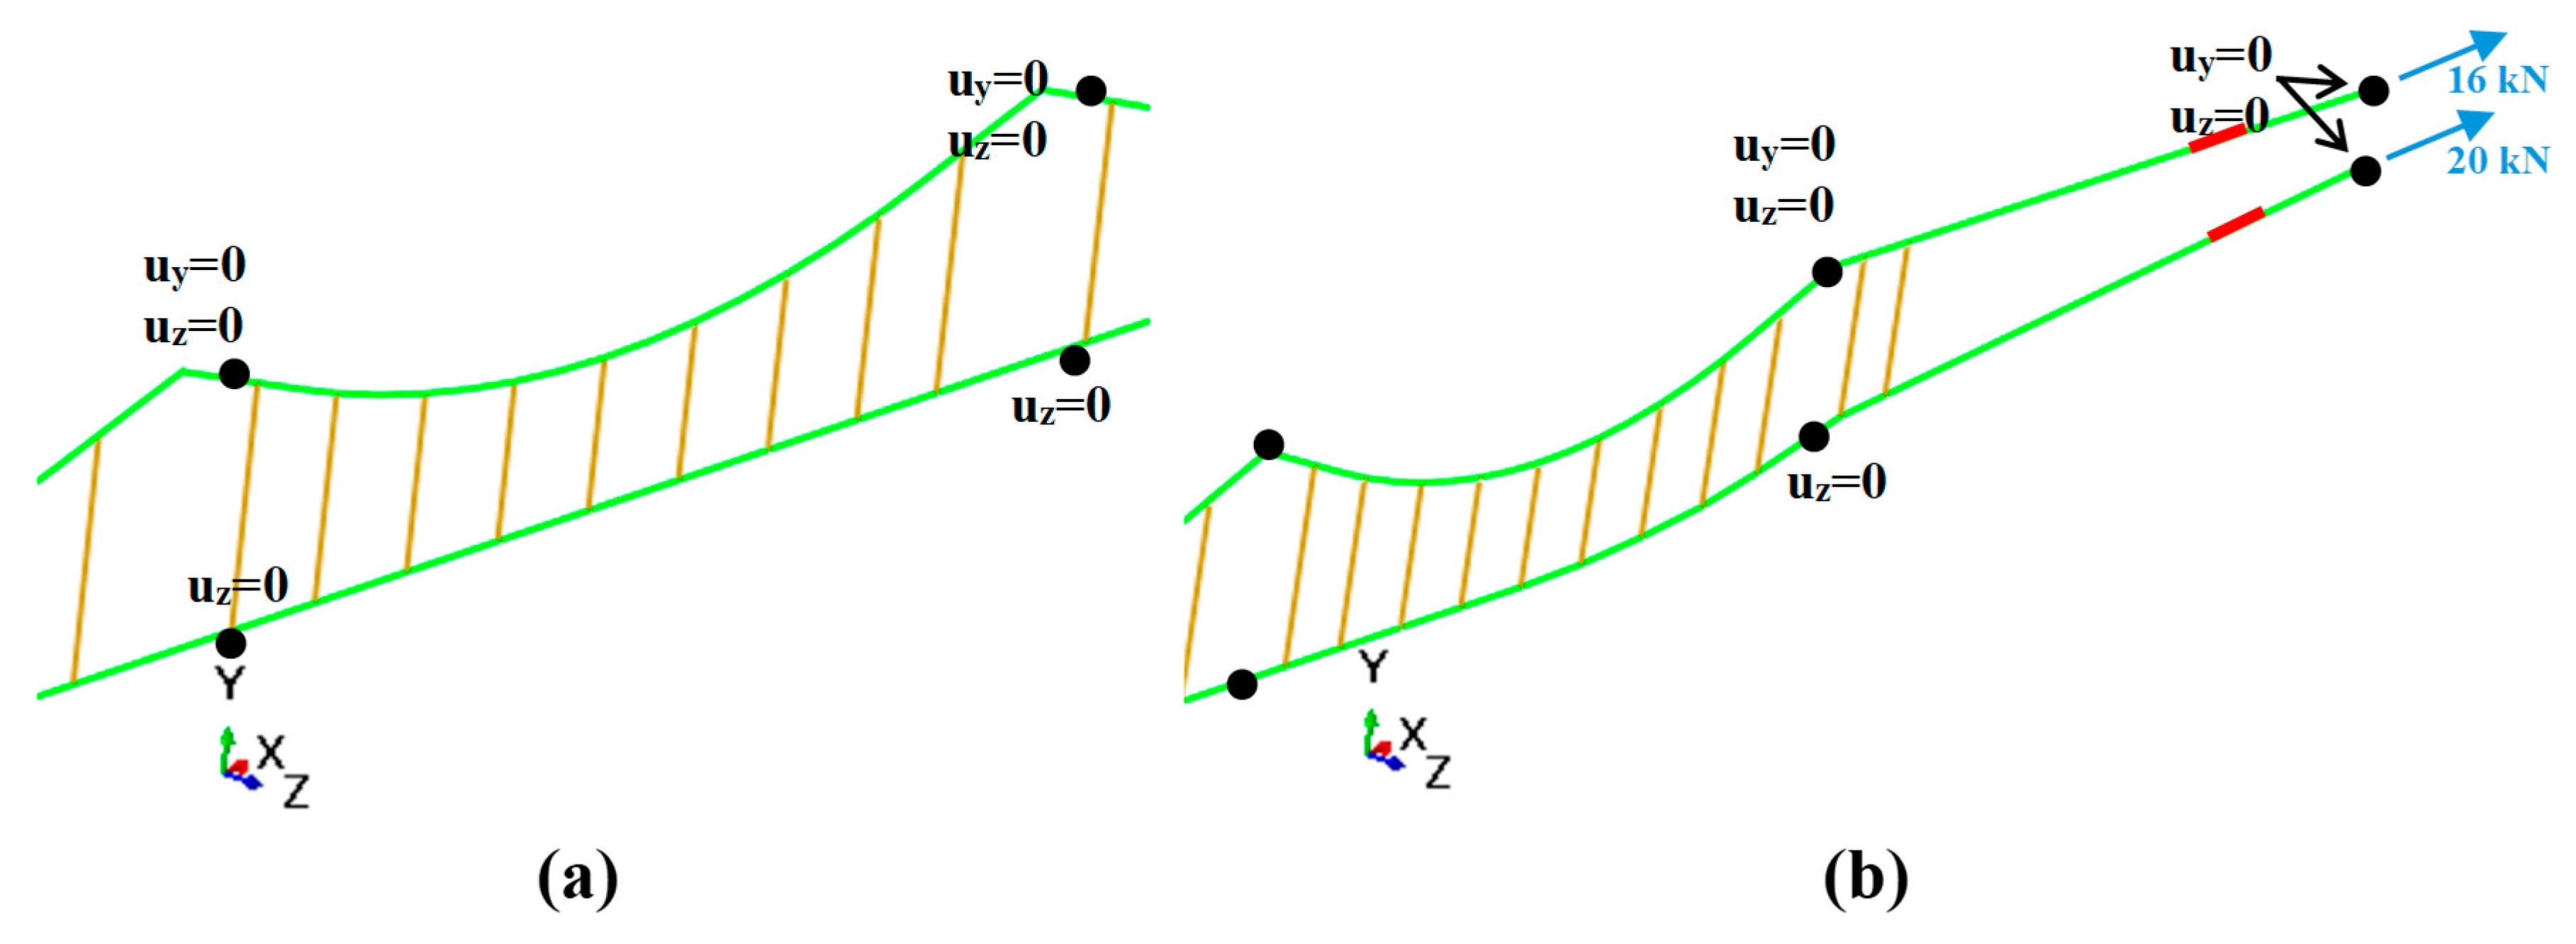
To model half regulation of the OCL symmetry boundary conditions have been applied at the symmetry axis (
Figure 3). To model the suspension configuration that permits the longitudinal motion of the MW and accounts for the effect of the stagger arm, which only restricts lateral movement, the connection points with the supporting structure are represented as stiffness elements. These elements are applied in the vertical and lateral directions for the MW, and in the lateral direction only for the CW. The corresponding boundary conditions are shown in
Figure 4a.
Additionally, the applied mechanical tension is modeled as a constant force at the extremities of the CW and MW. The kinematic boundary condition at these extremities is simplified to a longitudinal sliding constraint, as illustrated in
Figure 4b.
The analysis performed is an implicit static analysis, which accounts for both the gravitational load and the axial load in the CW and MW. The resulting static displacement and stress field serve as the initial conditions for the subsequent explicit dynamics analysis, which simulates the breakage of the CW.
The simulation of the CW breakage clearly requires a full nonlinear analysis in the time domain, where the rupture of the CW is modeled using a beam connector, with an assigned failure criterion.
The analysis procedure employs the explicit central-difference integration method for solving the equations of motion of the system, combined with diagonal (“lumped”) element mass matrices. The explicit central-difference operator ensures that the dynamic equilibrium equations are satisfied at the beginning of each increment at time t. The accelerations calculated at time t are then used to update the velocity solution to time t + Δt/2, and the displacement solution to time t + Δt.
While the cause of the CW breakage is not addressed in this paper, the focus is on the dynamic transient response following the CW rupture. The aim is to provide practical guidance on the type of measurement setup that should be installed on the OCL to detect when the CW breakage occurs.
The connector element introduced to simulate the CW failure is set to fail at a load level slightly above the static configuration value. To trigger the rupture, an extra tensile load of 100 N is applied across the connector on the CW, causing it to open and so causing CW rupture in the selected section. During the breaking process, as further approximation, no other failures, such as those in the droppers or in any of the elements of the suspension, are considered.
Three rupture locations were simulated (
Figure 5): (i) in the first span (Scenario A), (ii) in the last span (Scenario B), and (iii) in the middle (Scenario C). These scenarios were designed to investigate the capability to reveal the rupture and provide insights into the potential failure location. Within the span where the break occurs, the rupture is positioned at the dropper immediately before the suspension. This location is chosen as the most likely point of failure due to the presence of the dropper clamp, along with the higher local deflection of the CW relative to the MW, resulting in a higher bending moment on the CW.
A separate explicit dynamics analysis has been performed for each breakage position considered. For each analysis, the initial conditions are taken from the final increment of the static analysis, as previously mentioned. The failure is assumed to occur at time 0 of the explicit dynamics analysis. The transient response, including stress, displacement, and acceleration time histories of the modeled system, is then simulated for 10 s using stable time increments on the order of 10−6 s.
4. Results of the Simulated Scenarios
The results of the simulation of the three scenarios, in terms of the time histories of the observed variables, i.e., axial tension in the conductors, longitudinal displacement and vertical acceleration of the CW close to the end of the regulation, are presented below. Additionally, some considerations on the processing of these variables are provided, based on the time-domain patterns of the signals obtained from the simulation.
4.1. General Motion Response
The rupture of the CW causes an abrupt disruption of the equilibrium condition. The transient occurring between the initial static position and the final one is the primary focus of this numerical investigation. Vertical motion is the most significant one resulting from CW breakage. The motions of the CW and MW are coupled trough the droppers, and for this transient it is crucial to account for the slackening of the droppers. In this analysis, droppers are modeled as elements that are active only in tension and provide no stiffness in compression once the value of the static preload is exceeded during the dynamic response.
To provide an overview of the transient dynamics, the vertical motion of the CW at midspan of each span is plotted as a function of time for the three scenarios considered, as shown in
Figure 6. The vertical displacement of the CW at midspan is analyzed from span I to span VIII, where span I is the first span after the rupture and span VIII is the one closest to the end of the line. The reported variables are not intended for alert purposes as it is impractical to measure the vertical displacement of the CW at all midspans. However, it can be observed that moving away from the rupture section, located before span I, the maximum displacement amplitude decreases by 30% initially, then more gradually toward the end of the line. A comparison of the three time-domain diagrams reveals the following common features:
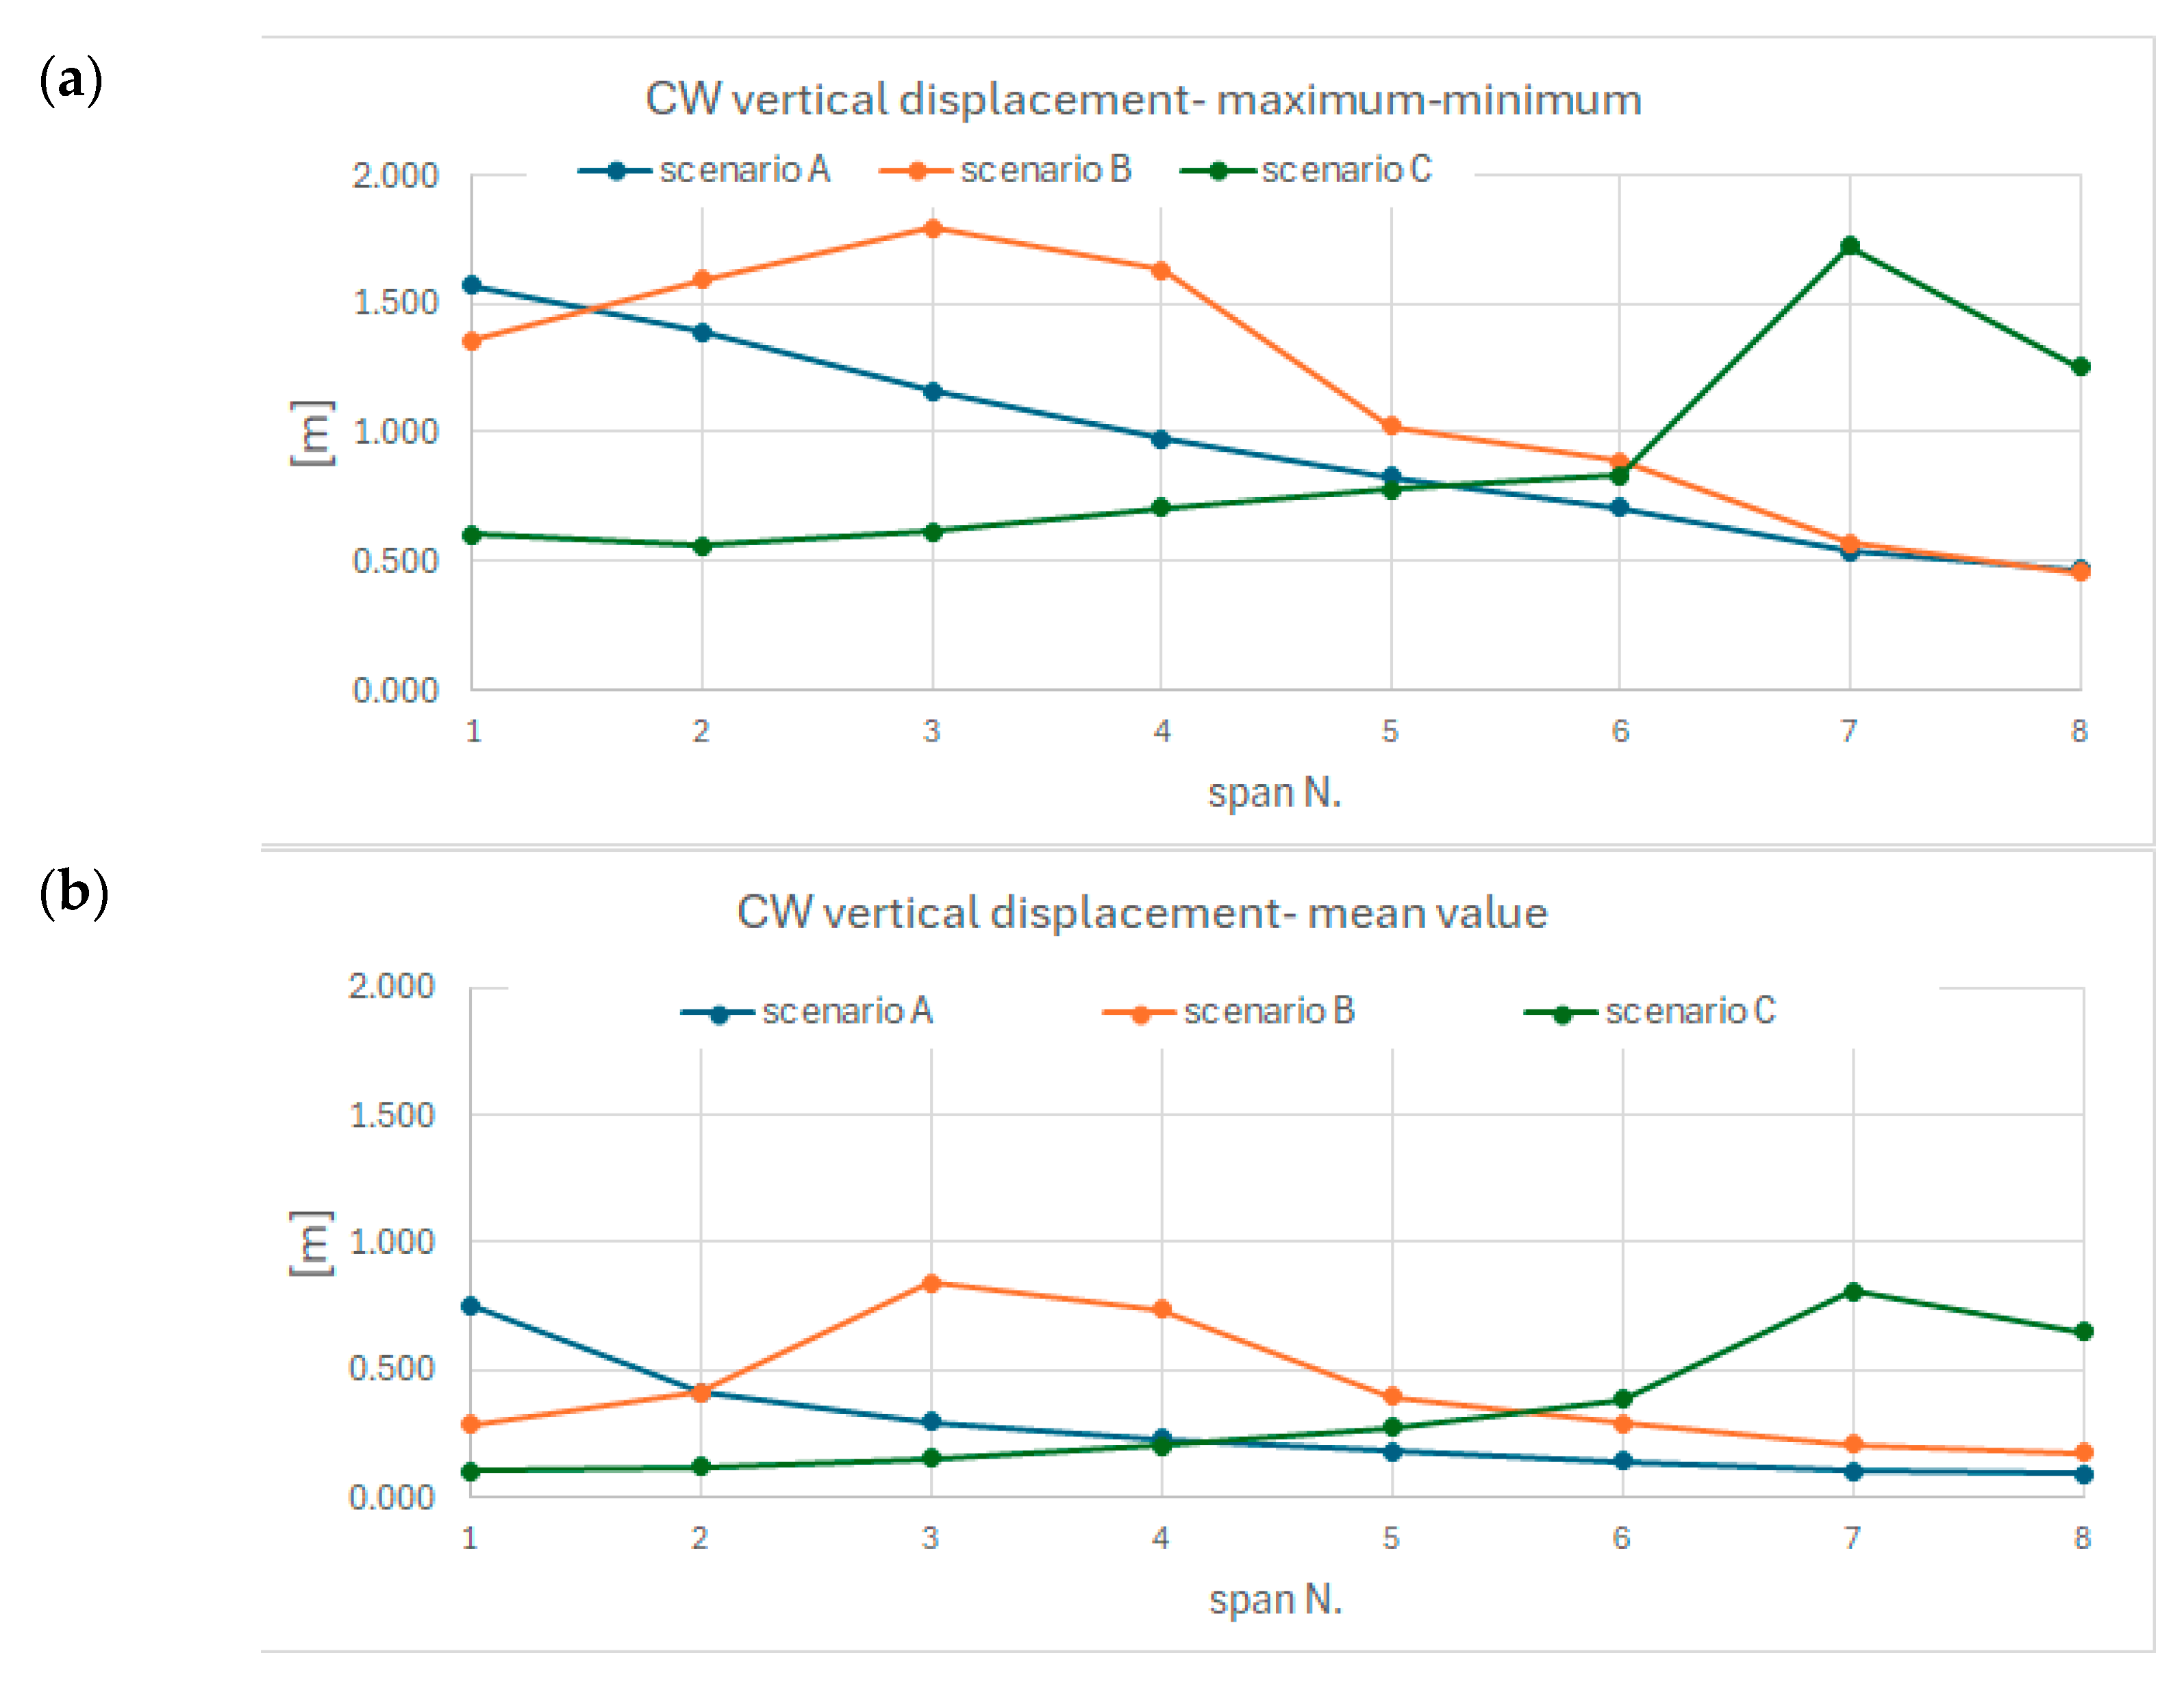
The maximum amplitude occurs in the span involved in the CW rupture and, for scenarios B and C, also in the adjacent spans, as shown in
Figure 7a, reporting the difference between maximum and minimum vertical CW displacement along the span, assumed as p–p amplitude. The latter is about 1.8 m, corresponding to a roughly 3% of the span length.
The vertical motion induced by the CW rupture is transmitted to both sides of the regulation, with lower amplitude as the distance from the rupture section increases, as clearly shown in
Figure 7a.
The waveform is asymmetrical, due to the slackening of the dropper, which links the motion of the CW with the MW in the downward direction. In the upward direction, the unrestrained relative motion allows the CW to vibrate with a higher amplitude. Another reason for a non-symmetrical waveform is that the final vertical position of the conductors differs from their initial position. This aspect is reflected in the mean value of the vertical displacement of the CW, which is always positive, and is larger close to the span of the rupture section, as shown in
Figure 7b where the mean value of the oscillation is reported for all the eight spans.
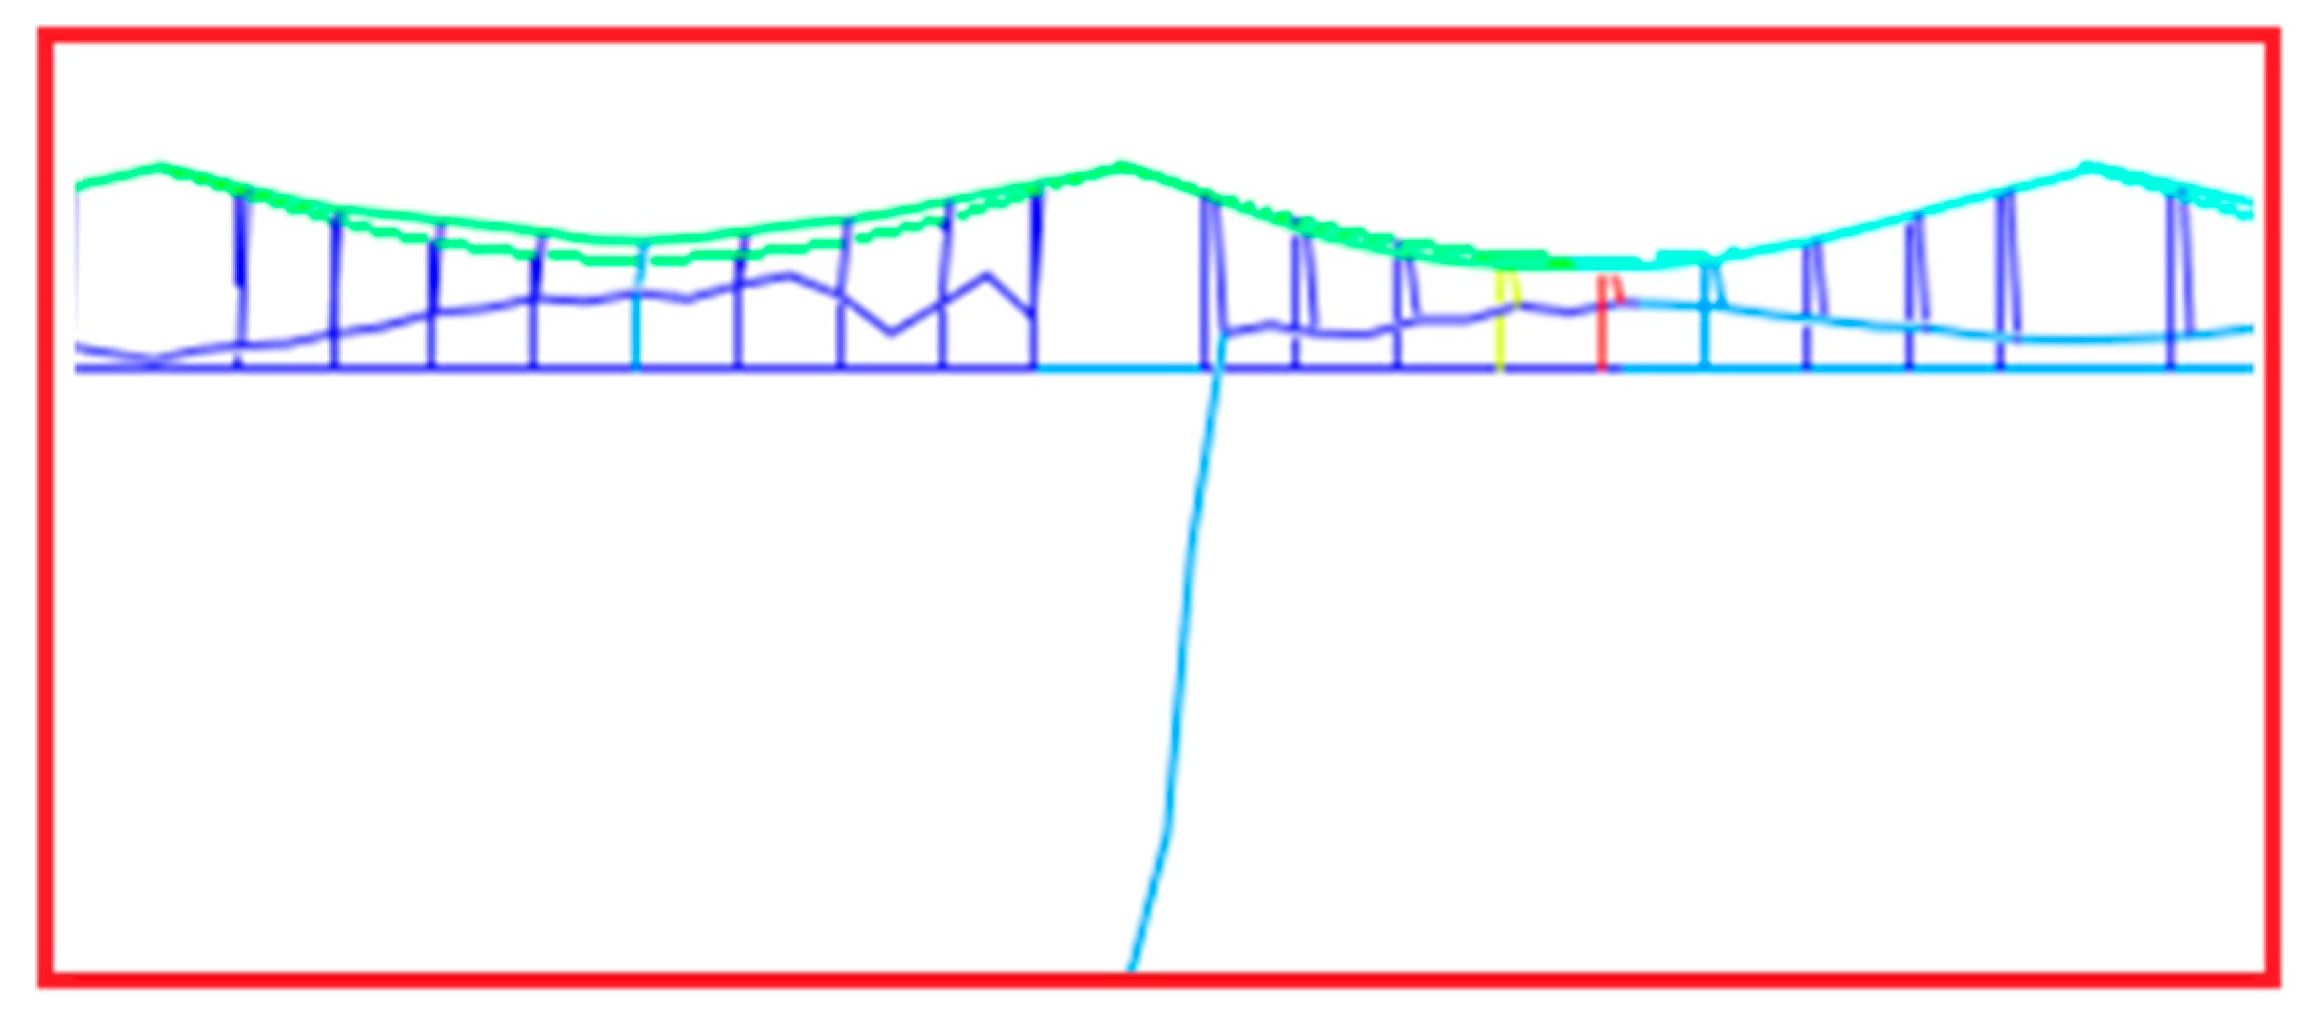
Considering now the overall OCL configuration, it is evident that the broken CW significantly disrupts the normal static configuration. Under normal operating conditions, the droppers are vertically aligned. However, following the CW rupture, the droppers remain still vertical in the region between the rupture section and the fixed point. In the portion between the rupture section and the end of the regulation, the droppers incline, transmitting the horizontal component of the axial load to the MW, which remains anchored to the central fixed point. This results in a complex final configuration, where the axial tension, measured at regulation extremity, is still very close to the nominal value, as determined by the tensioning pulley system.
The first key detail focuses on the CW breakage, as shown in
Figure 8, where only the deformed configuration is shown. The vertical component of the displacement is amplified for highlighting it, along with the vertical dimension. The axial load on the CW between the rupture section and the central fixed point becomes zero as no axial load is applied. Meanwhile, the axial load applied by the loading devices at the regulation is progressively transferred from the CW to the MW through the droppers. These droppers, instead of remaining vertical, take on an inclined configuration, as illustrated in
Figure 9. Similarly, in the area close to the tensioning setup, the droppers appear inclined (see
Figure 10) due to the progressive transfer of the axial load from the CW to the MW.
Therefore, the measurement of the applied axial load cannot rely upon a final difference in the tension of the CW; instead, a dynamic measurement is required. On the other hand, a difference in the longitudinal position of the conductors could serve as a potential indicator of a CW failure occurring along the line.
4.2. Longitudinal Motion of the Conductors
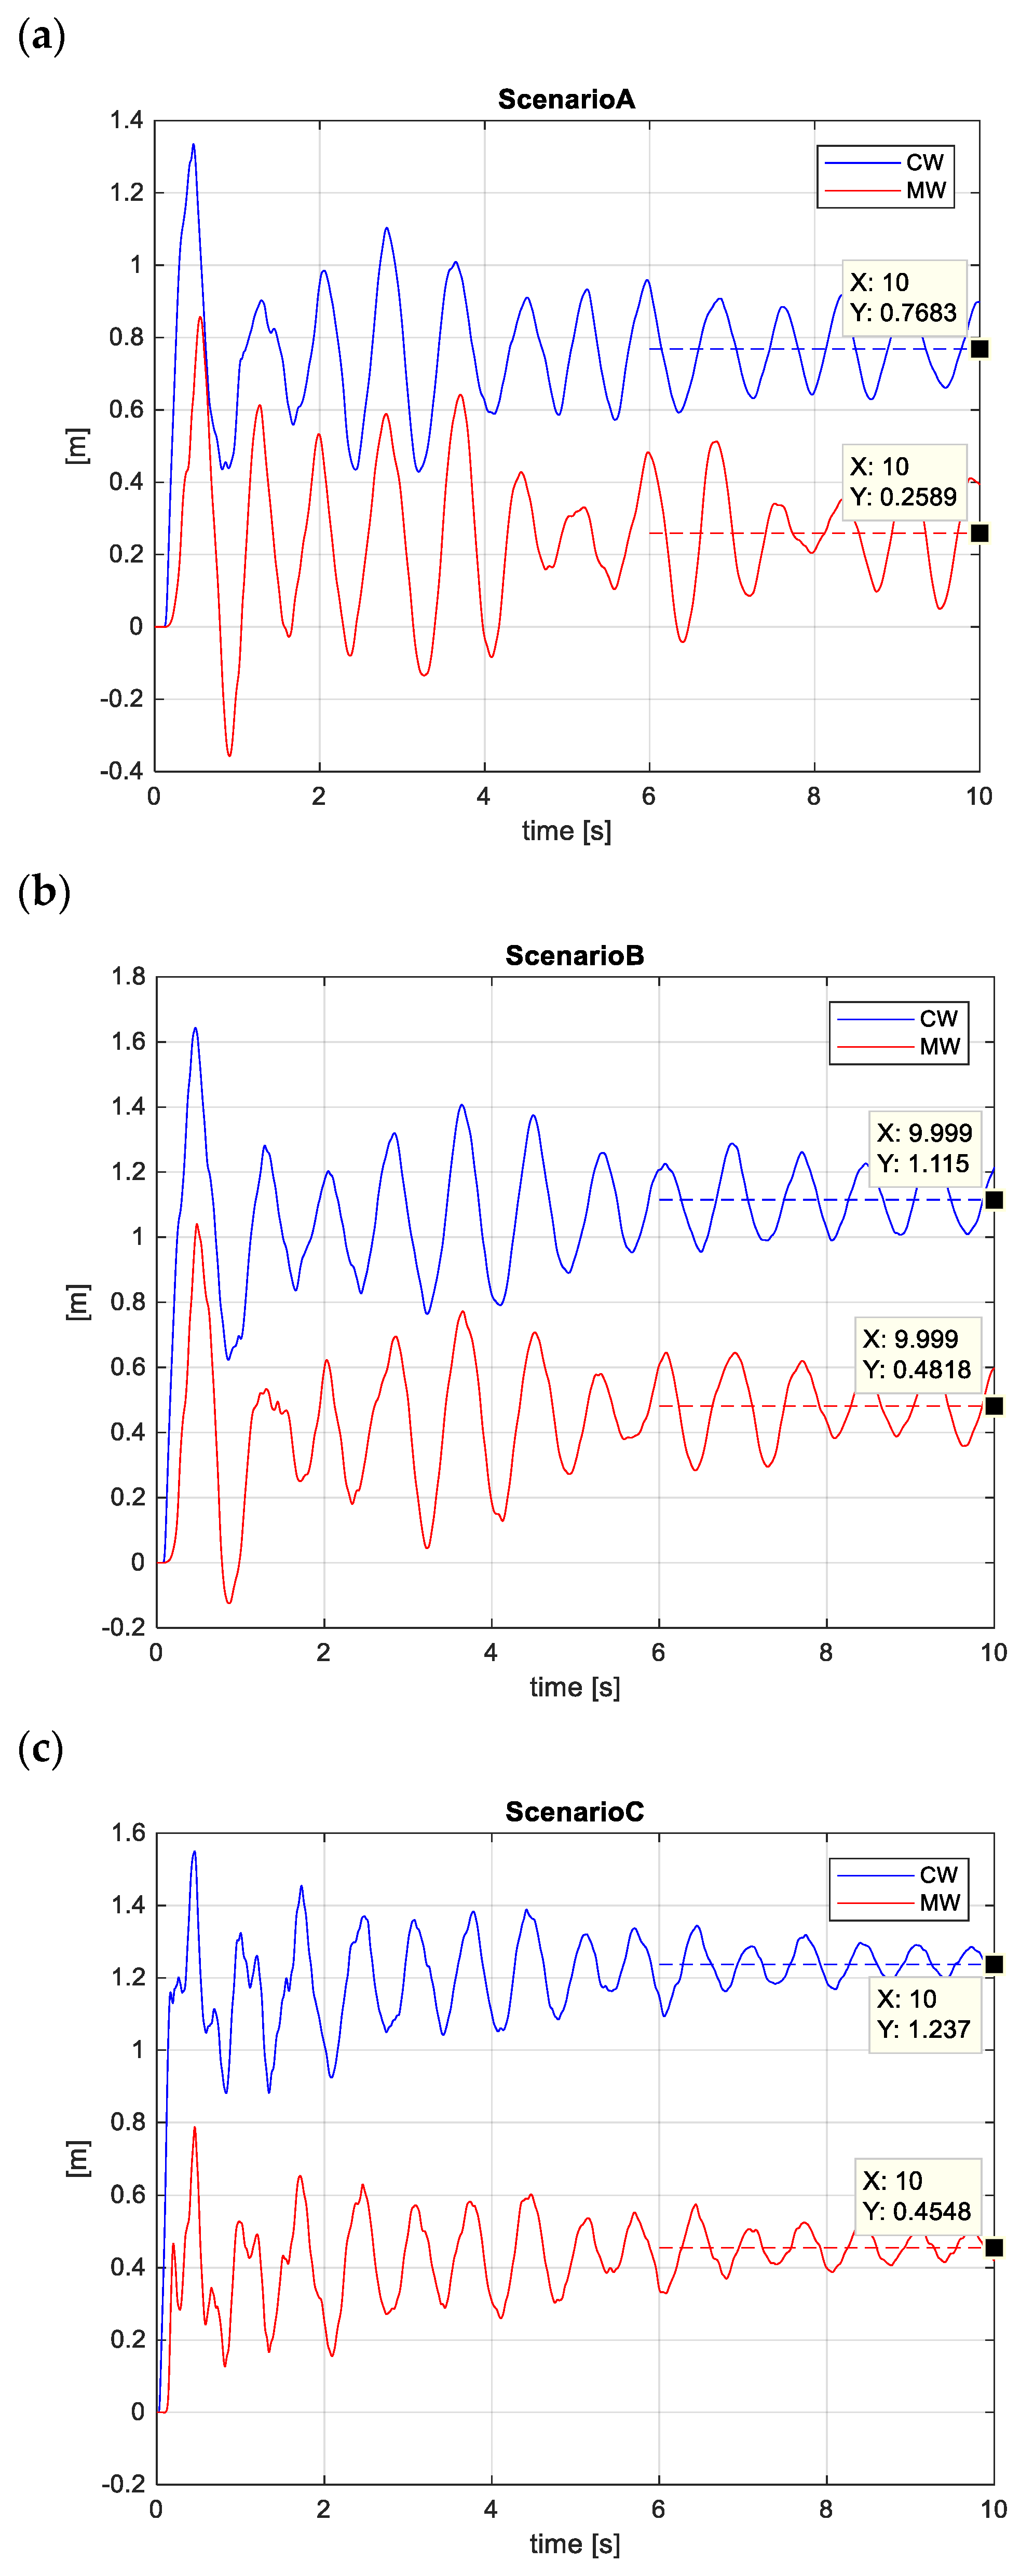
The longitudinal motion of the MW and CW following the CW rupture event is reported in
Figure 11.
The final positions of the conductor extremities differ, with the CW exhibiting a larger displacement than the MW. As previously noted, the difference between the final longitudinal positions of the CW and MW is reflected in the inclined orientation of the droppers.
4.3. Axial Load in the Conductors
The dynamic axial force in the MW and CW are shown in
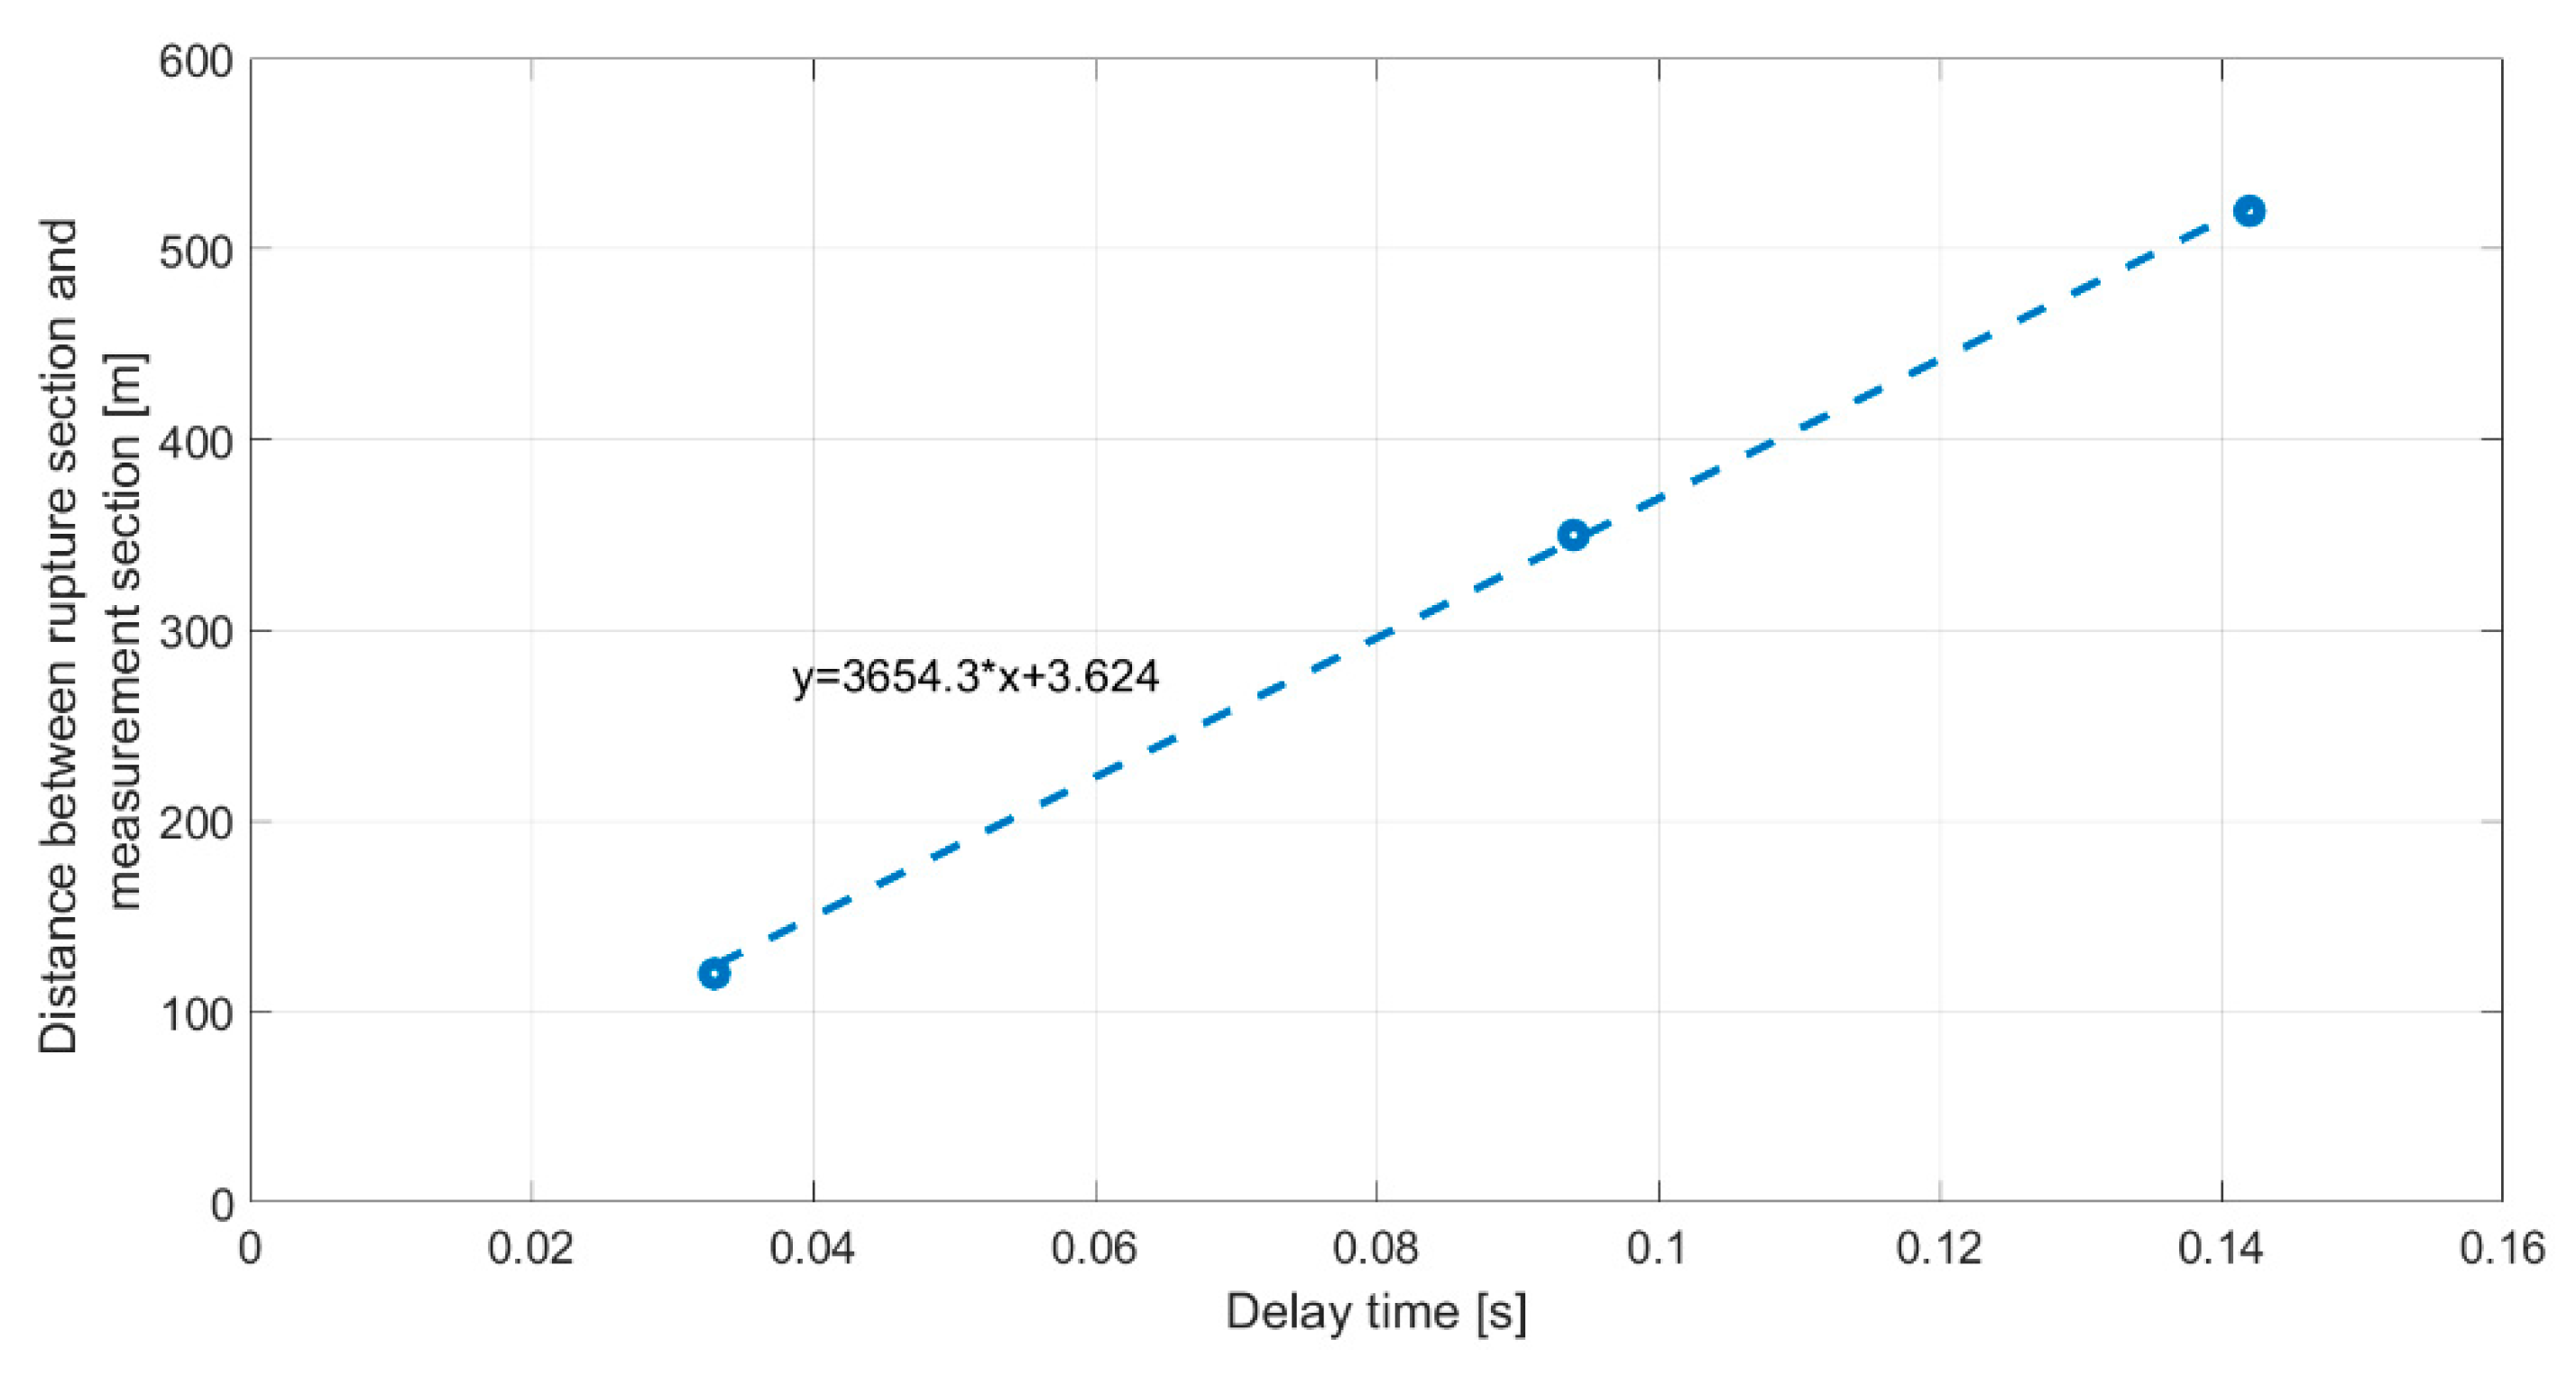
Figure 12 as a function of time for the three scenarios. The breakage occurs immediately after the integration begins, resulting in a negative pulse in the axial load of the CW after a time interval corresponding to the distance between the measurement section and the rupture section, divided by the propagation velocity of the longitudinal wave
in the CW. The propagation velocity is expressed as follows:
For the copper of the CW, the assumed values are a Young’s modulus
N/m
2 and a material density
kg/m
3. The resulting propagation velocity is 3643 m/s. By measuring the time intervals between the start of the simulation and the occurrence of the first negative peak in the CW’s axial load, these intervals can be related to the distance between the rupture section and measurement section through the axial wave propagation velocity
. The slope of the linear relationship equals the theoretical propagation velocity, confirming that the adopted mesh is suitable for the analysis (
Figure 13).
Different from the CW, no pulse is observed in the axial load of the MW. Both the MW and CW axial loads exhibit a fundamental frequency approximatively double that of the vertical motion frequencies of the MW and CW. This is due to the increase in axial load as the MW and CW experience vertical motion, reaching their maximum displacements upward and downward. Additionally, higher-frequency components become more pronounced as the broken CW section moves closer to the half-regulation extremity.
The visual observation of the time history of the axial load clearly reveals the presence of an impulse deriving from the CW breakage. From the point of view of real time monitoring, although the downward impulse is clearly visible it may not be clearly distinguished from the subsequent dynamic variation, making the automatic detection more difficult by simple algorithms like peak value or r.m.s. It is believed that more sophisticated time-domain analysis would be required, making the on-site processing unit more costly.
4.4. Vertical Acceleration of the CW
The final parameter relevant to the actual measurement setup is the vertical acceleration of the CW close to the end of the regulation. The acceleration pattern is oscillatory, so it is more robust to analyze a processed version of this signal. In
Figure 14, the moving root mean square (r.m.s.) is superposed to the time history (red line in
Figure 14), considering windows of 0.10 s, and shifted with a step equal to the length of the window. The moving r.m.s. trend helps to highlight the mean power of the signal during the transient vibration development. The purpose of processing the raw signal with a moving r.m.s over a short time window is to decrease the sensitivity to the peak value, applying a filtering effect, while keeping the peak value of the processed signal clearly distinguishable with respect to the following decay. The selected time window length is selected as about twice the time interval necessary to reach the peak value of the raw acceleration. The length of the time window should be a balance between the possibility of clearly highlighting the acceleration peak and an excessive filtering effect that makes the automatic recognition of the peak more difficult.
5. Summary and Conclusions
This paper presents a feasibility analysis of a monitoring setup capable of sending alerts regarding a CW rupture event on an OCL. The aim is to halt traffic and prevent the transit of a pantograph beneath the broken CW section. The potential to detect a CW breakage at any position along an OCL regulation has been analyzed, simulating different scenarios where the transient dynamics following the rupture of the CW in a high-speed OCL have been carried out by means of numerical simulation in Abaqus®.
Different output variables that can be measured at the ends of the regulation, where the tensioning devices apply axial load to the conductors (the CW and the MW), have been analyzed. These variables were compared with respect to their ability to reliably detect the rupture and the methods for processing raw data to derive a meaningful and robust index.
The outcomes of the simulated transient following the CW rupture are as follows:
The axial load in the CW reveals the presence of a negative force pulse (resulting from the rupture) between 8% and 16% of the static value, followed by a dynamic pattern. While the identification of this pulse could reveal the rupture, it provides a weak alert signal due to the relatively small percentage of deviation from the mean value. Additionally, the subsequent transient may feature peaks higher than the initial pulse.
The extremities of both conductors show significant longitudinal motion during the transient dynamics. The predominant frequency corresponds to the first vertical frequency of the single span, which is linked to the longitudinal motion through the second-order geometrical effect associated with the shape of the catenary. A detection process should focus on changes in the longitudinal position of conductor ends within a time interval of 10–20 s, excluding gradual thermal expansion of a similar magnitude.
The vertical acceleration of the CW close to the tensioning devices connection is dominated by frequencies higher than the first flexural one. A moving r.m.s. applied to the raw acceleration signal can provide a more robust indication, in terms of vibratory energy, rather than directly analyzing acceleration amplitude. The overall increase in signal power appears to be a more reliable indication than raw acceleration levels alone.
The longitudinal displacement provides a clear indication on the CW rupture but requires long-range transducers to accurately track the longitudinal motion of the MW and CW. Considering that towards the end of the transient the oscillation is set around different mean values, it is conceivable to monitor at defined intervals the mean value of the conductor positions. This can also provide insights into the location of the rupture along the line as it is related to the final static configuration of the half regulation involved. Combining the acceleration analysis and displacement evaluation offers a more robust indication of the CW rupture’s occurrence, giving at the same time an indication of the location of the broken CW section.
The model developed in this work captures the main features of the phenomenon: (i) large displacement nonlinear analysis, (ii) a consideration of dropper slackening, and (iii) the dynamic effect of the CW breakage on the variables (displacement, force, and acceleration) that can be measured at the end of the regulation. The results provide a basis for designing a measurement setup at the ends of each regulation. This setup would combine vertical acceleration measurement of the CW and MW, which, when properly processed, can trigger the alert. It would also include the measurement of large displacement mean values, which, when showing a clear gradient with respect to the previous measurement results, would enhance the robustness to the alert.
As for the possible implementation of the monitoring setup proposed here, two orders of issues are to be considered. The first one concerns the required transducers and their installation on the OCL.
Transducers suitable for detecting acceleration are to be installed on the CW under high voltage, but this has been already demonstrated as feasible [
16,
17] when adopting wireless transducers. The issue of power is tackled by combining a long-term battery supply with a photovoltaic panel, as experienced in ultra-high voltage electrical lines [
18]. The main challenge is the dimensioning of the battery and the photovoltaic panel so as to guarantee its continuous working. As far as the longitudinal displacement of both conductors is concerned, the possibility of measuring the displacement of the counterweight with a commercial long range and low-cost laser transducer is an option, avoiding problems related to electrical insulation. It is also to be considered that accuracy is not an issue for this measurement. This is relatively easy in cases where each conductor has its own loading system, like in the Italian HS line. In cases of a loading device that connects both the CW and MW, a different analysis has to be performed, although keeping the concept of a sudden variation in the position of the counterweight.
The second category of issues is related to the transmission chain sending the alert to the traffic management unit. This heavily depends on the type of signaling considered. A general option for HS lines would be to communicate the alert to the radio block center (RBC) that directly manages the traffic in its area of competence, and at the same time to the control room that overviews the traffic along a specific route. A second issue consists of the time required to really set off the alarm and halt the traffic. To make some considerations regarding the response time to give the alert, a minimum theoretical time headway of 5 min can be considered, corresponding to a traffic flow of 12 trains/hour. Currently the real traffic flow in the peak hour is 9 trains/hour for the Italian HS service.
Such an interval is compatible with an automatic data flow transmission, but a bottleneck in the decision chain may come if confirmation by a traffic manager operator from the control room is needed. Although these operational issues are very important, they are outside the scope of this paper.
The work presented in the paper was the first step and further improvement can be applied to the model and the definition of the measurement setup.
To further refine the analysis and define the transducer requirements, improvements could be made in modeling the suspension system, as well as incorporating the dynamics of the supporting poles. Additionally, the representation of the tensioning device in more detail could be enhanced by considering its kinematic aspects and the inertia of the counterweights. Finally, it is worth remarking that no experimental evidence was available to the authors to validate the dynamic model in the considered scenario. The design of a scale dynamic model is ongoing. Among the different available scaling approaches, the most promising one is that which considers the equality of acceleration between the scaled model and full-scale system. The reason is that it makes it easier to keep the same ratio between gravity loads and applied axial loads, which, together with inertia forces, are the actions relevant for dynamic behavior. It is worth remarking that, following the same approaches for aeroelastic models tested in wind tunnels, the mass can be adjusted with additional masses on the conductor.
Despite the simplifications used, the core principles of the monitoring system based on acceleration and displacement measurements, despite direct axial load measurement, remain valid, considering that the main nonlinear dynamic aspects have been adequately considered.


