Article

Studying the Behavior of a Paperboard Box: Experiment and Finite Element Model

1
MATIM, University of Reims Champagne-Ardenne, Campus Moulin de la Housse, 51100 Reims, France
2
Faculty of Mechanical Engineering, Thai Nguyen University of Technology, Thai Nguyen 25000, Vietnam
*
Author to whom correspondence should be addressed.
Vibration 2025, 8(2), 23; https://doi.org/10.3390/vibration8020023
Submission received: 13 March 2025 / Revised: 14 April 2025 / Accepted: 30 April 2025 / Published: 6 May 2025

Abstract

:
In the transportation and distribution of goods, cardboard boxes are often subjected to mechanical impacts such as shocks and random vibrations, which can cause damage to the goods. In this study, static and dynamic tests on cardboard boxes were designed and conducted to determine the compression strength, natural frequencies, and modal characteristics of the boxes. A finite element model of cardboard boxes considering the in-plane orthotropic elastic–plastic behavior of the cardboard was implemented in the Abaqus software through a VUMAT subroutine to perform numerical simulations under compression and random vibrations. The parameters of the model were determined through an inverse identification process. As a first result, the predicted force–displacement curves show good agreement with the measured curves. Furthermore, the power spectral density (PSD) response of the mass/box system under random vibrations obtained through numerical simulations is consistent with the responses obtained from experimental measurements.

1. Introduction

Packaging is subject to random vibrations during transport. It is a set of frequencies and amplitudes that constantly varies over time. Indeed, the packaging, by its design, can amplify or attenuate the movements to which it is subjected. Vibration tests make it possible to verify the resistance of the packaging to these constraints. They also offer the possibility of comparing the difference in the behavior of different packaging solutions: either qualitatively by means of a standard test or quantitatively by instrumenting the test. During the product design phase, mechanical tests provide accurate information on structural strength, which is one of the most important steps towards confirming the design. Cardboard boxes are made from paperboard, which needs to be mechanically characterized to assess the mechanical properties of the box. There have been many research publications on the mechanical properties of paperboard using different mechanical tests. Carlsson et al. [1] conducted bending tests on paperboard samples with induced interlaminar defects to evaluate the impact on bending stiffness. They measured the force–displacement curves to assess the structural integrity and failure modes of the creased zones. Carlsson et al. [2] employed pure bending tests on paperboard specimens to investigate the mechanisms of failure under bending stress. The experimental setup included controlled loading conditions to observe delamination and fiber fracture behaviors. Cavlin [3] utilized a series of creasing and folding tests on paperboard to examine its convertibility during packaging processes. The experiments involved varying crease depths and folding angles to assess the material’s adaptability and performance. Edholm [4] performed bending stiffness tests on paperboard before and after conversion processes to quantify stiffness loss. The study included both experimental measurements and predictive modeling to understand the effects of conversion on bending ability. Giampieri et al. [5] developed a constitutive model for creased paperboard and validated it through experimental bending tests. These tests involved applying controlled bending loads to creased samples and measuring the resulting deformations to calibrate the model. Cavlin et al. [6] introduced inclined rule tests to evaluate the creasability of paperboard. The experimental procedure involved applying a standardized inclined load to creased paperboard samples and measuring the resulting deformation to assess creasing performance. Nygårds et al. [7] conducted both experimental and numerical studies on the creasing of paperboard. Experimental tests included applying controlled creasing loads to paperboard samples and analyzing the resulting stress distributions and deformations. Beex and Peerlings [8] performed experimental and computational analyses on laminated paperboard creasing and folding. The experiments involved applying folding loads to laminated samples and measuring the resulting deformations to validate their computational models. Crespo Amigo [9] utilized finite element simulations to design paperboard packages with enhanced stiffness. The study included experimental validation of the simulated designs by testing the bending stiffness of prototype packages under controlled loading conditions. Fadiji et al. [10] applied finite element analysis to predict the mechanical strength of ventilated corrugated paperboard packaging. Experimental tests involved subjecting the packaging to mechanical loads and measuring the resulting deformations to validate the simulation predictions.
Many studies have been conducted by performing vertical compression experiments on corrugated boxes to obtain the force vs. displacement or stress vs. strain curves [11]. In some studies, the results obtained after box compression are compared with numerical simulation results [12,13,14]. Kwak [15] studied the compressive strength of corrugated shipping containers with different handle geometries that are sources of a decrease in vertical compressive strength. Other studies have evaluated the impact of environmental conditions on the performance of corrugated boxes by comparing the results of vertical compression at different relative humidities [16]. Thorpe and Choi [17] studied the behavior of corrugated cardboard boxes subjected to a compression test using 2D digital image correlation. However, this method does not allow for the measurement of out-of-plane displacements, which is important when the panels are bent. Viguie et al. [18] used 3D digital image correlation to determine the complete displacement field and to trace back the stress field of the body panels. Using this method, it is possible to visualize where the elastic limit is reached or exceeded in the panel during box compression.
Different studies have analyzed vibration levels during the transportation of goods on road and rail networks to propose Power Spectral Density (PSD) for each type of transport. Jarimopas et al. [19] investigated vibration levels during truck transport of tangerines in Thailand and their correlation with fruit damage. The findings show that significant mechanical damage can occur due to vibrations, especially when packaging and cushioning are inadequate. Singh et al. [20] measured and analyzed vibration and shock levels in truck and rail transport environments in India. The results highlighted significant variations depending on road quality and vehicle type, with implications for packaging design and product protection. Rissi et al. [21] detailed the transport conditions experienced in Brazilian truck shipments, particularly focusing on vibration frequencies and amplitudes. The study found that rough road conditions and vehicle types strongly influence the mechanical stress exerted on cargo. Garcia-Romeu-Martinez et al. [22] examined how payload weight, truck suspension type, and speed affect vibration levels during truck transport in Spain. Their results suggest that air suspension and moderate speeds reduce vibration intensity, thereby helping to protect goods in transit. Böröcz and Singh [23] measured vibration levels in rail transport across Central Europe, analyzing variability across routes and train types. They concluded that rail transport presents distinct vibration profiles compared to road, requiring tailored packaging solutions to ensure product integrity. Testing methods for packaging systems based on these data have been proposed. Low-frequency vibrations (0.1–10 Hz) are much more harmful to products than high-frequency vibrations [24]. Paternoster et al. [25] analyzed the vibration levels of cardboard packaging during the transportation of beer by truck in Belgium by using the cumulative distribution functions (CDFs) of the RMS (Root Mean Square) values of vibrations in the time domain measured in the lateral, longitudinal, and vertical directions. The results show the CDF of the RMS and Kurtosis values of the acceleration signals measured in the time domain during the different transports. It can be concluded that vertical vibrations are the most severe with the highest RMS values. Vibration tests at different frequencies of cardboard boxes containing agricultural products such as apples [26] and bananas [27] were carried out to evaluate the performance of the boxes. From these studies, the authors proposed optimized designs of cardboard boxes that reduce damage to the packaged fresh products. Many other vibration tests on cardboard packaging have also been conducted by other researchers. Guo et al. [28] studied the vibration behavior of corrugated cardboard sheets using slow sine sweep vibration tests to analyze the resonance frequencies, vibration transmissibility, and damping ratios of different sheets. Zhang et al. [29] tested the vibration resistance of three types of corrugated cardboard boxes by subjecting them to vibration-only tests and drop-plus-vibration tests. They concluded that for vibration-only tests, the package with the highest static stress performed best, while for drop-plus-vibration tests, the package with the lowest static stress performed best. Marcondes and Batt [30] analyzed the vibration behavior of corrugated cardboard boxes on a force-controlled vibration table. They concluded that the greatest advantage of controlling the vibration table with force rather than acceleration is that a more realistic test can be performed with only a permanent load.
Random vibrations refer to systems that are subjected to time-varying, unpredictable excitations. Unlike deterministic vibrations, random vibrations involve probabilistic analysis due to the inherent uncertainty in the input forces and responses [31]. For linear systems, spectral analysis methods are used to provide solutions to random vibration problems [32]. Later this was expanded to solve random vibrations in non-linear systems, proposing solutions that involve higher-order statistical moments, such as skewness and kurtosis, which can capture non-linearities [33]. An important theoretical framework for analyzing random vibrations in linear systems is the power spectral density (PSD) approach. The PSD of a system’s response gives information about how the system responds to different frequencies of random excitation. The use of Monte Carlo simulation methods and finite element analysis (FEA) has become increasingly common in random vibration analysis, allowing engineers to simulate complex systems under random excitation [34,35]. Recently, Kamiński [36] extended the Stochastic Finite Element Method based on the iterative generalized stochastic perturbation technique and the Least Squares Method with statistically optimized polynomial bases to symmetric triangular and uniform probability distributed random input variables; and Do and Tran [37] used the so-called refined stochastic finite element method to investigate the random vibration of functionally graded material (FGM) plates subjected to moving loads.
Regarding the validation of FEM simulations with random vibration experiments related to the packaging field, most of the work focused on corrugated board. Recently, Mrówczyński et al. [38] presented a simplified method combining static and dynamic analyses, including random vibration simulations, to evaluate the compressive strength of corrugated board packaging under transport conditions. Wan et al. [39] explored the vibration and acoustic characteristics of corrugated composite panels through both experimental tests and finite element simulations, providing insights applicable to packaging design. Wang et al. [40] developed acceleration root mean square-life curves for corrugated paperboard boxes under random vibration, employing experimental and numerical methods to assess fatigue failure. Wang and Wang [41] verified an accelerated random vibration testing method using finite element analysis, aiming to improve the safety assessment of transport packaging systems under random loading.
While the above studies focused on corrugated board packaging, they provide valuable insights into random vibration analyses applicable to compact paperboard packaging. However, specific studies exclusively addressing compact paperboard under random vibration validated by simulations are limited. To the authors’ knowledge, this is the first time that random vibration experiments validated by simulations have been performed on compact paperboard packaging.

2. Theory

2.1. Random Vibrations

During the transportation of goods, cardboard boxes are often stacked on top of one another to maximize the use of available space and reduce shipping costs. The boxes are subjected to random vibrations occurring during the transport process. To design a random vibration experiment for cardboard boxes, it is essential to rely on theoretical aspects related to vibration mechanics, frequency spectrum analysis, and random theory. The frequency spectrum represents the distribution of oscillation energy across various frequency bands. Acceleration spectra or Power Spectral Density (PSD) spectra are used to recreate real-world conditions. Consequently, the cardboard box is modeled as a single-degree-of-freedom (SDOF) vibration system (Figure 1) governed by the basic vibration differential equation:
m x ¨ t + c x ˙ t + k x t = F ( t ) ,
where m is the mass, c is the damping factor, k is the stiffness, x(t) is the position variation over time, and F(t) is the force.
In frequency spectrum analysis, the Fourier transform is used to represent force signals and vibration responses in the frequency domain. In the case where the impact force F(t) is considered a random process, it is characterized by:
-
Probability Density Function (PDF)
-
Autocorrelation function
R F τ = E [ F ( t ) F ( t + τ ) ]
-
Power Spectral Density—PSD:
S p ω = + R p ( τ ) e j ω τ d τ
In the frequency domain, the transfer function H ( ω ) of the system from the impact force F ( t ) to the response X ( t ) is determined. Applying the Fourier transform to Equation (1), we have:
ω 2 m + j ω c + k X ( ω ) = F ( ω )
H ω = X ( ω ) F ( ω ) = 1 k ω 2 m + j ω c
The function H ( ω ) can be decomposed into two parts:
-
Amplitude:
H ω = 1 ( k ω 2 m ) 2 + ( ω c ) 2
-
Phase: Represents the phase change of the output signal relative to the input signal. The phase part shows the time shift between the input signal and the output at a given frequency. Power spectrum density (PSD) is used in random vibration analysis. The output power density spectrum is calculated as:
S X ( ω ) = H ( ω ) 2 S p ( ω )
where S p ( ω ) is the force spectrum and S X ( ω ) is the system response spectrum.
The resonance frequency corresponding to the amplitude H ( ω ) reaching its maximum corresponds to the natural frequency of the system, which can cause damage if not controlled. Thus, to set up a random vibration experiment, the following requirements must be fully prepared:
-
Random Vibration Table: Programmed to replicate PSD spectra.
-
Data Recorder: Used to measure the responses of the cardboard box.
-
Control and Sensor System: Includes accelerometers, pressure sensors, or motion sensors.
-
ASTM (American Society for Testing and Materials): Standards for random vibration testing of transportation packaging.

2.2. Material Model

Cardboard exhibits anisotropic properties, which means that its mechanical response varies depending on the direction of the applied stress. In this study, we adopt the Isotropic Plasticity Equivalent (IPE) model, as proposed by Mäkelä and Östlund [43], to describe the mechanical behavior of paper. The following formulation characterizes the orthotropic elastic behavior under in-plane stress:
s = s x s y s z s x y = L σ = 1 3 2 a c a b 0 c a b 2 b 0 b c a a b c 0 0 0 3 d σ x σ y σ x y
where a , b , c , and d are the anisotropy parameters.
The stress tensor can be decomposed into the sum of a hydrostatic part and a deviatoric part such that:
s i j = σ i j 1 3 σ k k δ i j
Karafillis and Boyce [44] introduced the isotropic plasticity equivalent (IPE) material concept. The IPE material is a fictitious isotropic material subjected to a stress state equal to the corresponding stress state in the real anisotropic material. The isotropic relationship between the deviatoric stress tensor and the stress tensor given in Equation (9) can be expressed as:
σ = 1 1 ν x y ν y x E x ν y x E x 0 ν x y E x E y 0 0 0 G x y 1 ν x y ν y x ε x e ε y e γ x y e
The IPE model load surface is given by the following expression:
f = σ e q σ y = 3 2 s s 2 E 0 ε 0 + ε e q p 1 n
where σ y is the yield stress, {s} is the deviatoric stress tensor, ε e q p   is the equivalent plastic strain, and E 0 and ε 0 , are two model parameters.
This IPE model was implemented in the ABAQUS software 2019 using the VUMAT user subroutine.

3. Experiment

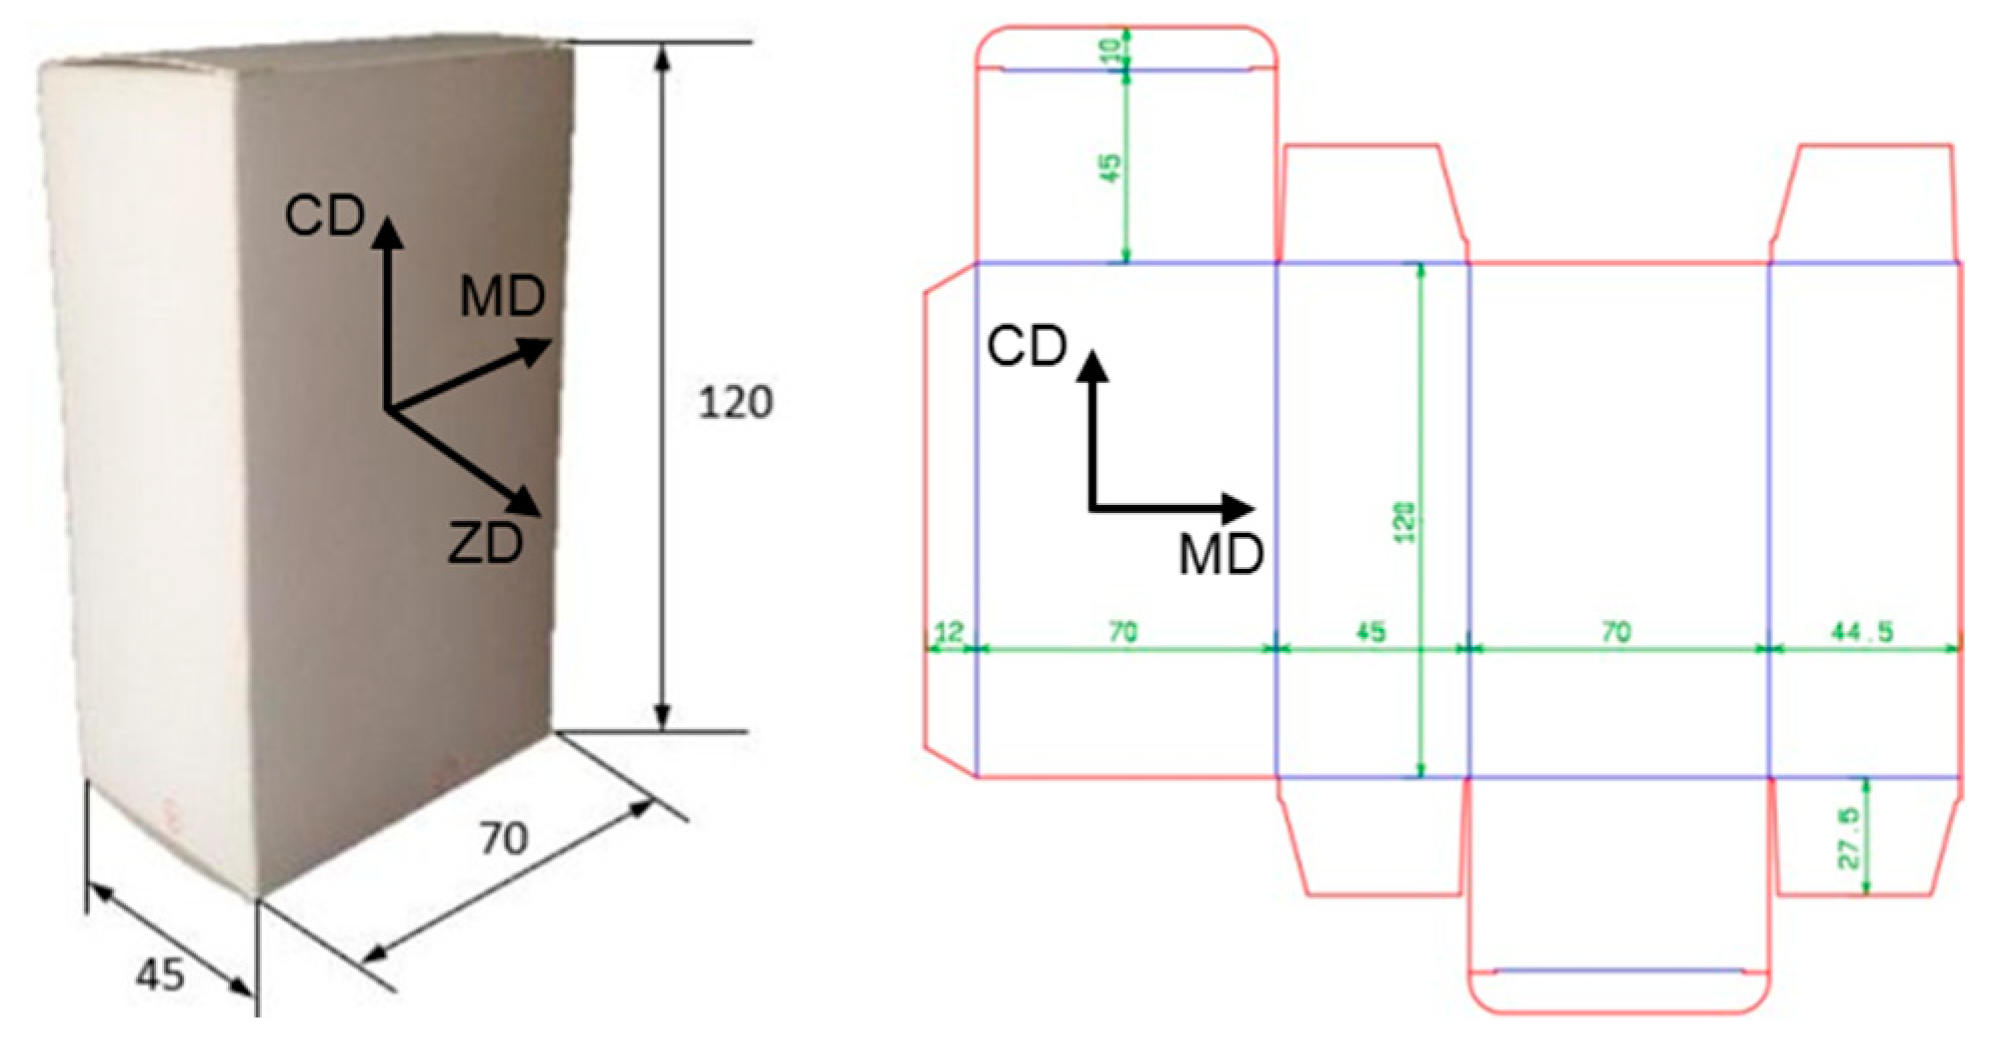
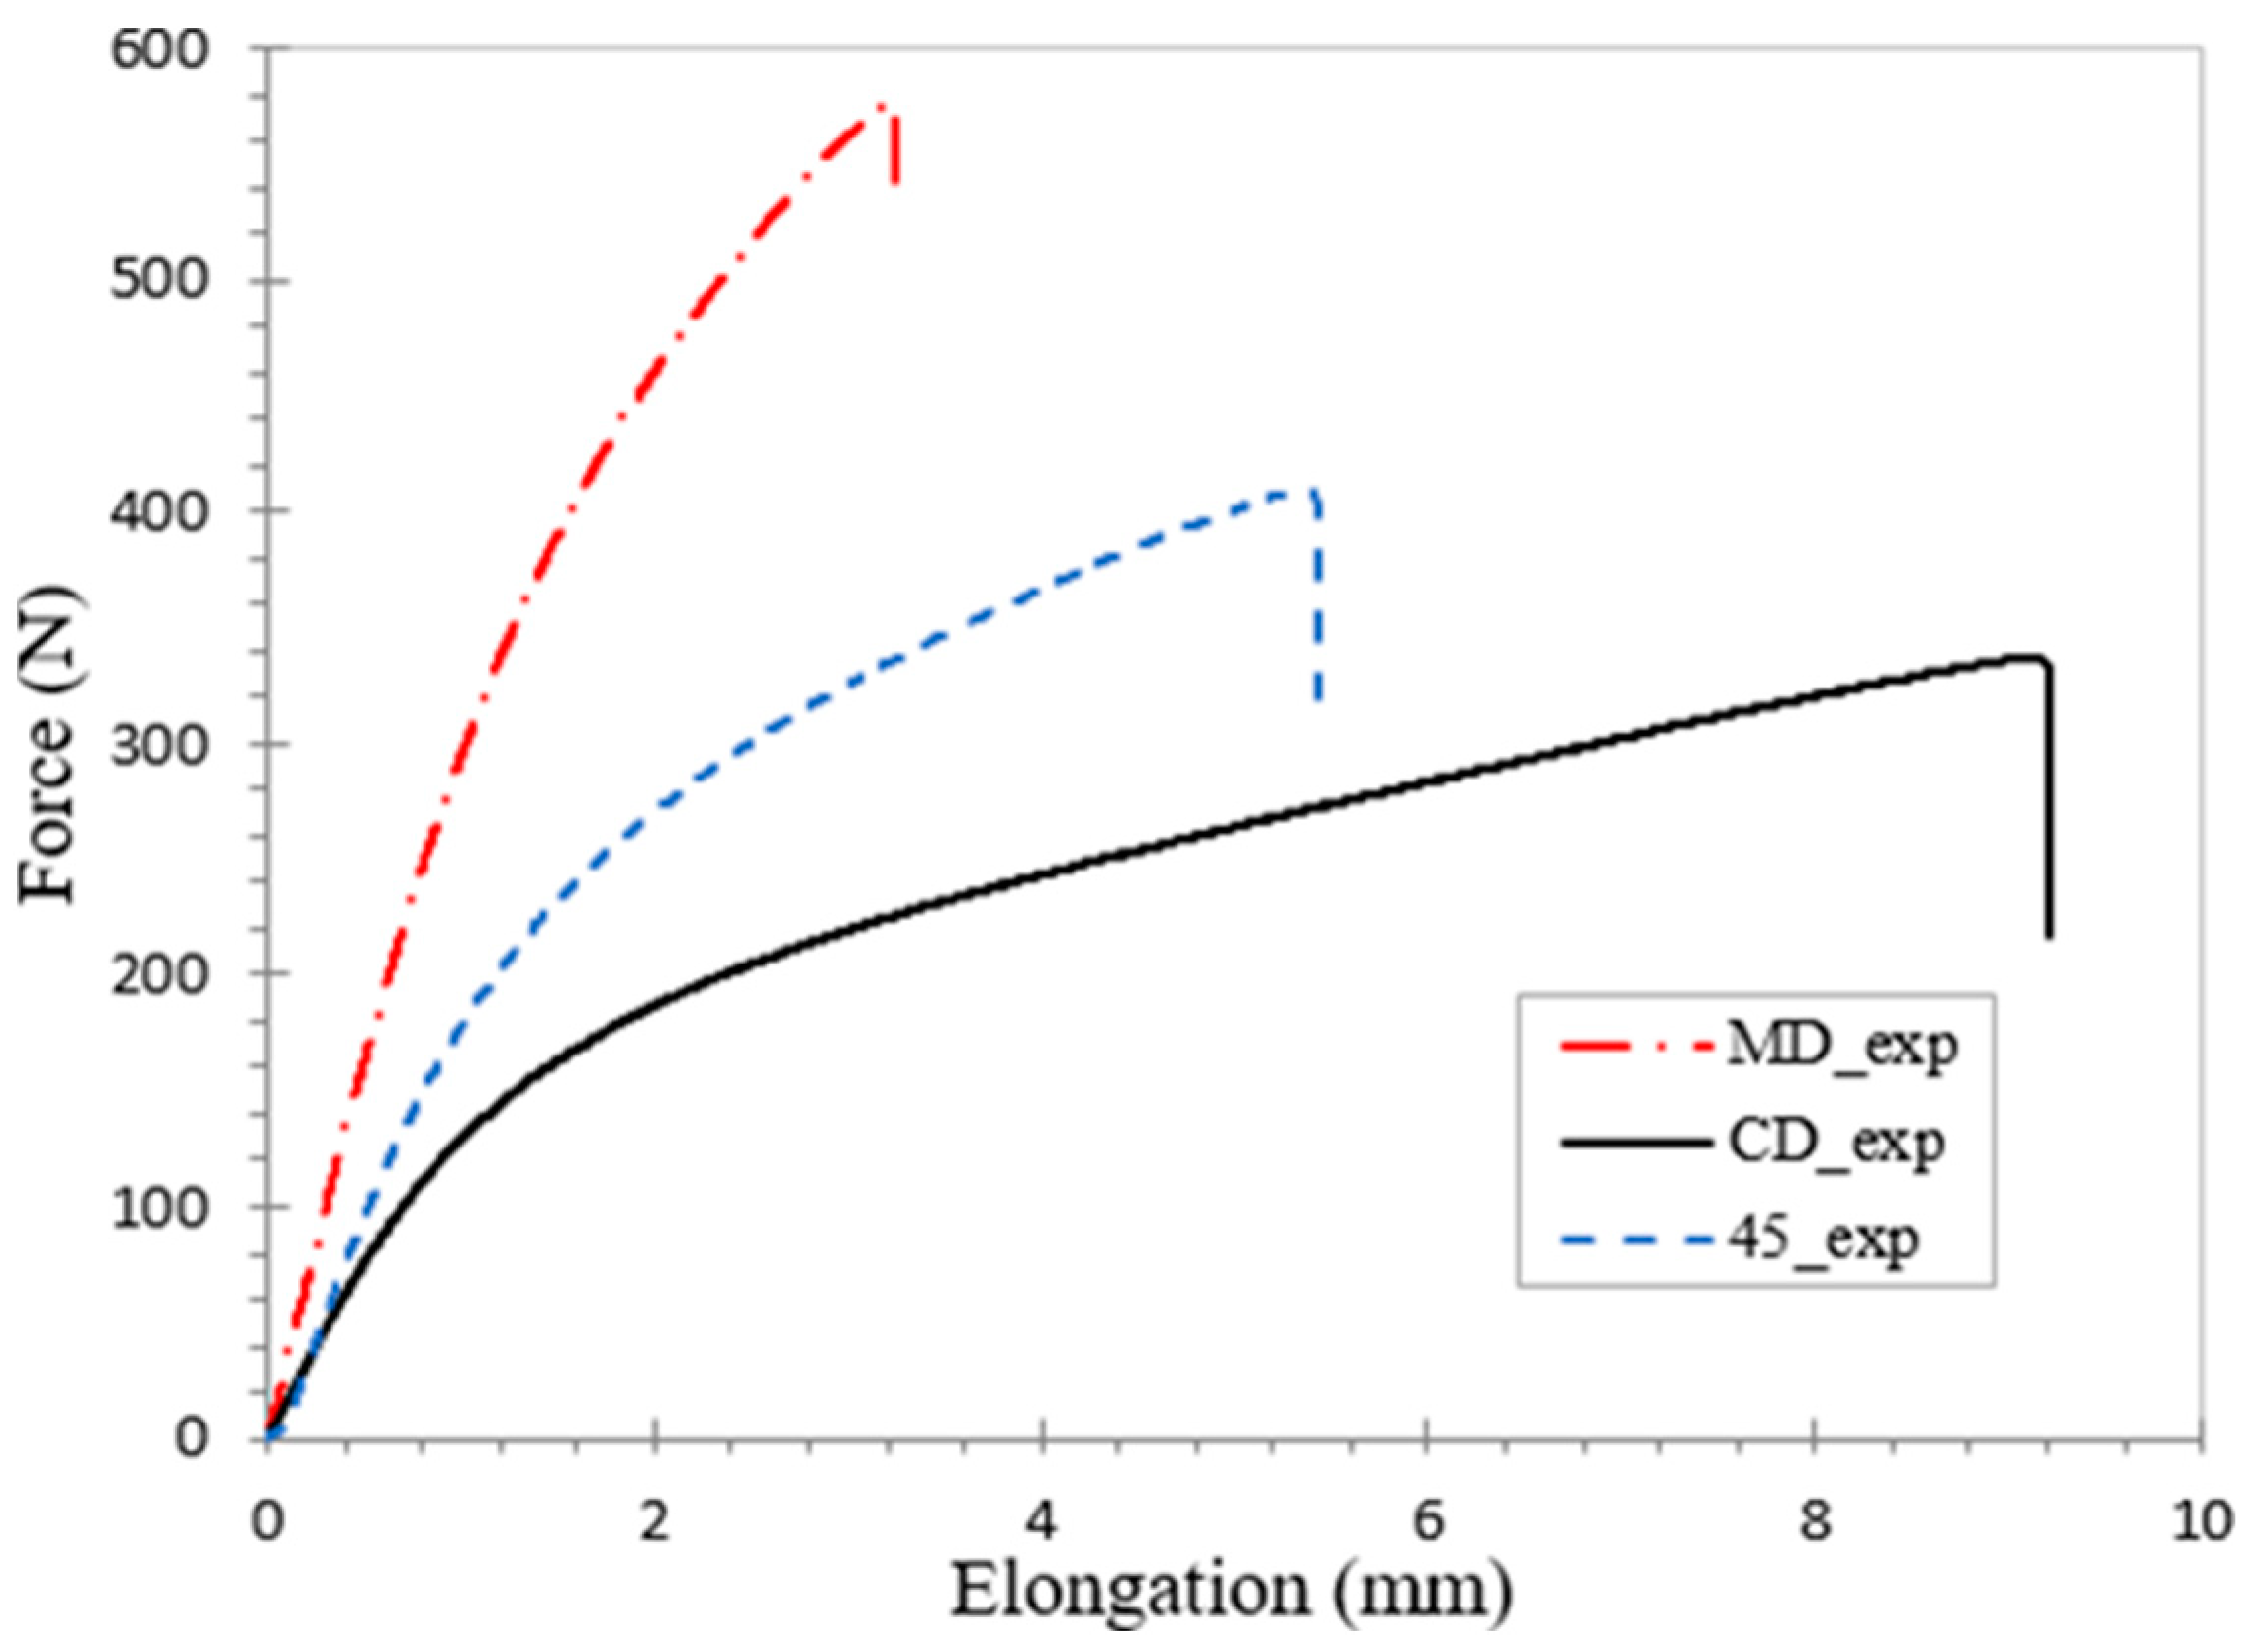
3.1. Studied Material

Paperboard was the material used in this study, with a grammage of 320 g/m2 and a thickness of 0.51 mm. The paper manufacturing process produces three characteristic directions: machine orientation (MD), cross direction (CD), and out-of-plane direction (ZD). Accordingly, Young’s modulus along the MD direction is usually about 200 times larger than the modulus in the ZD direction [45]. The Poisson coefficients ν x z and ν y z are close to zero because the strain in the plane is negligible during thickness compression [46].
All the measurements presented in this study were conducted at standard climate (50% RH and 23 °C), and prior to testing, all specimens were conditioned for 24 h at the same standard conditions.

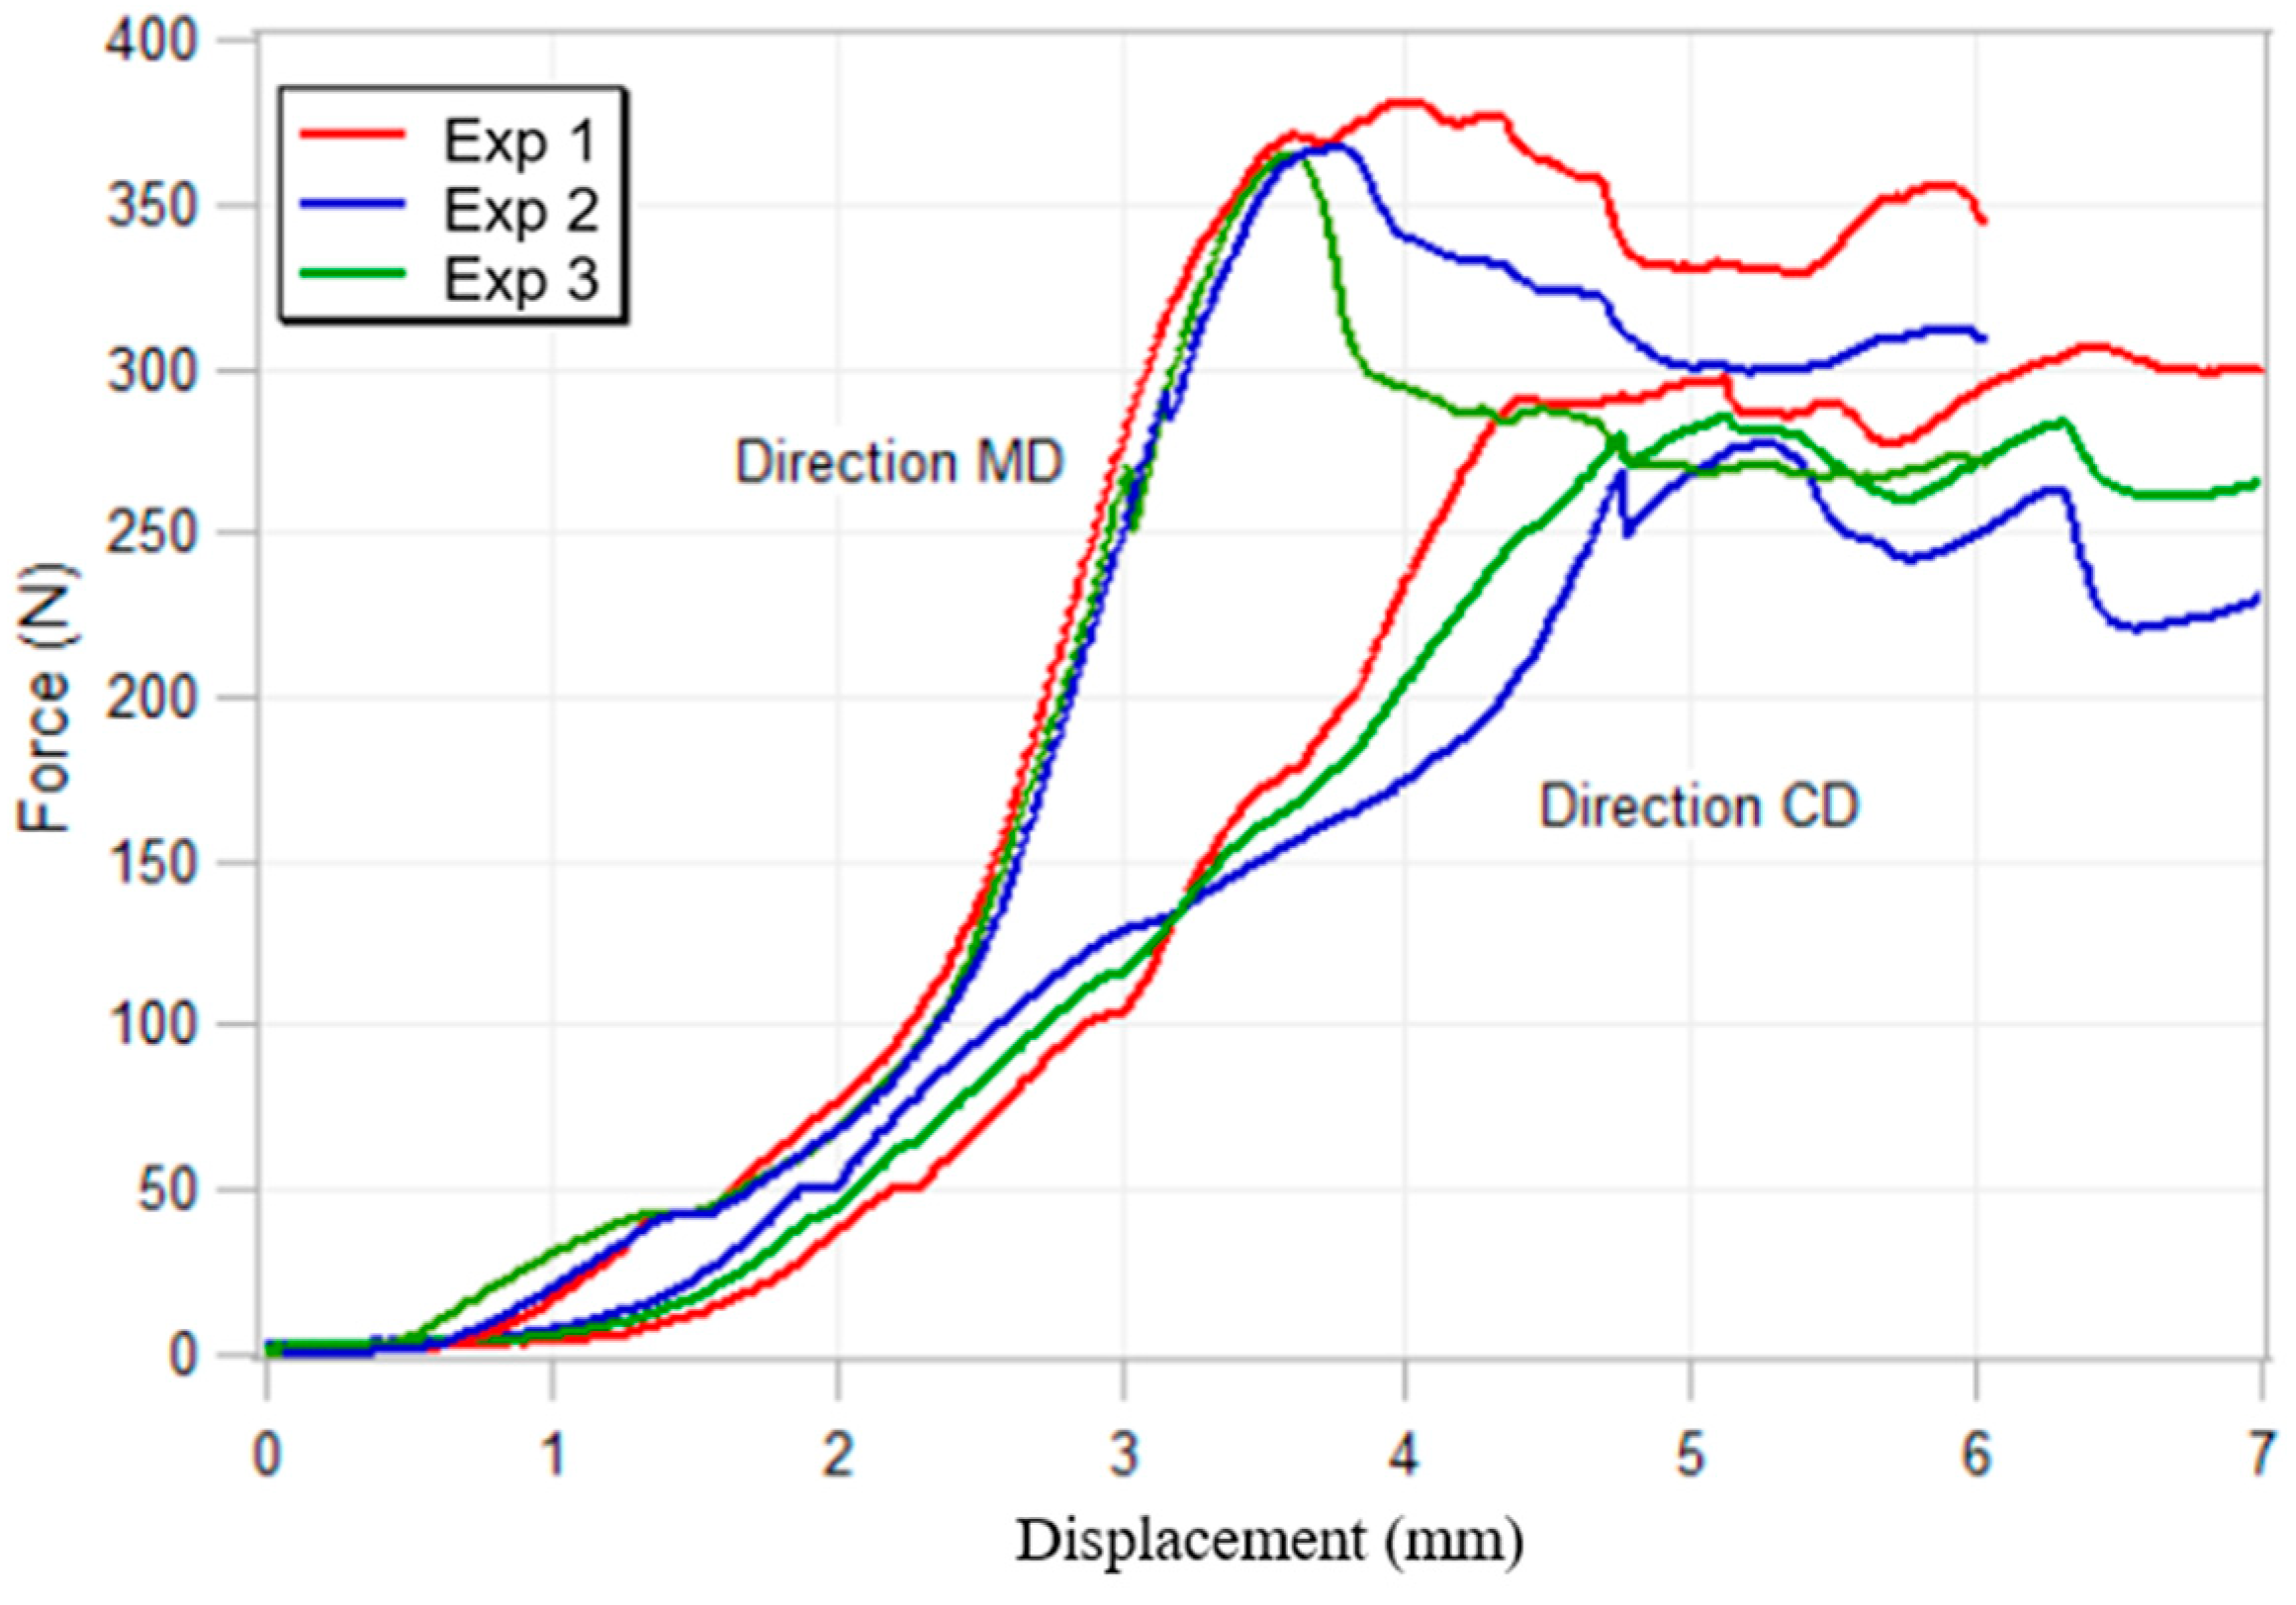
3.2. Static Compression Test
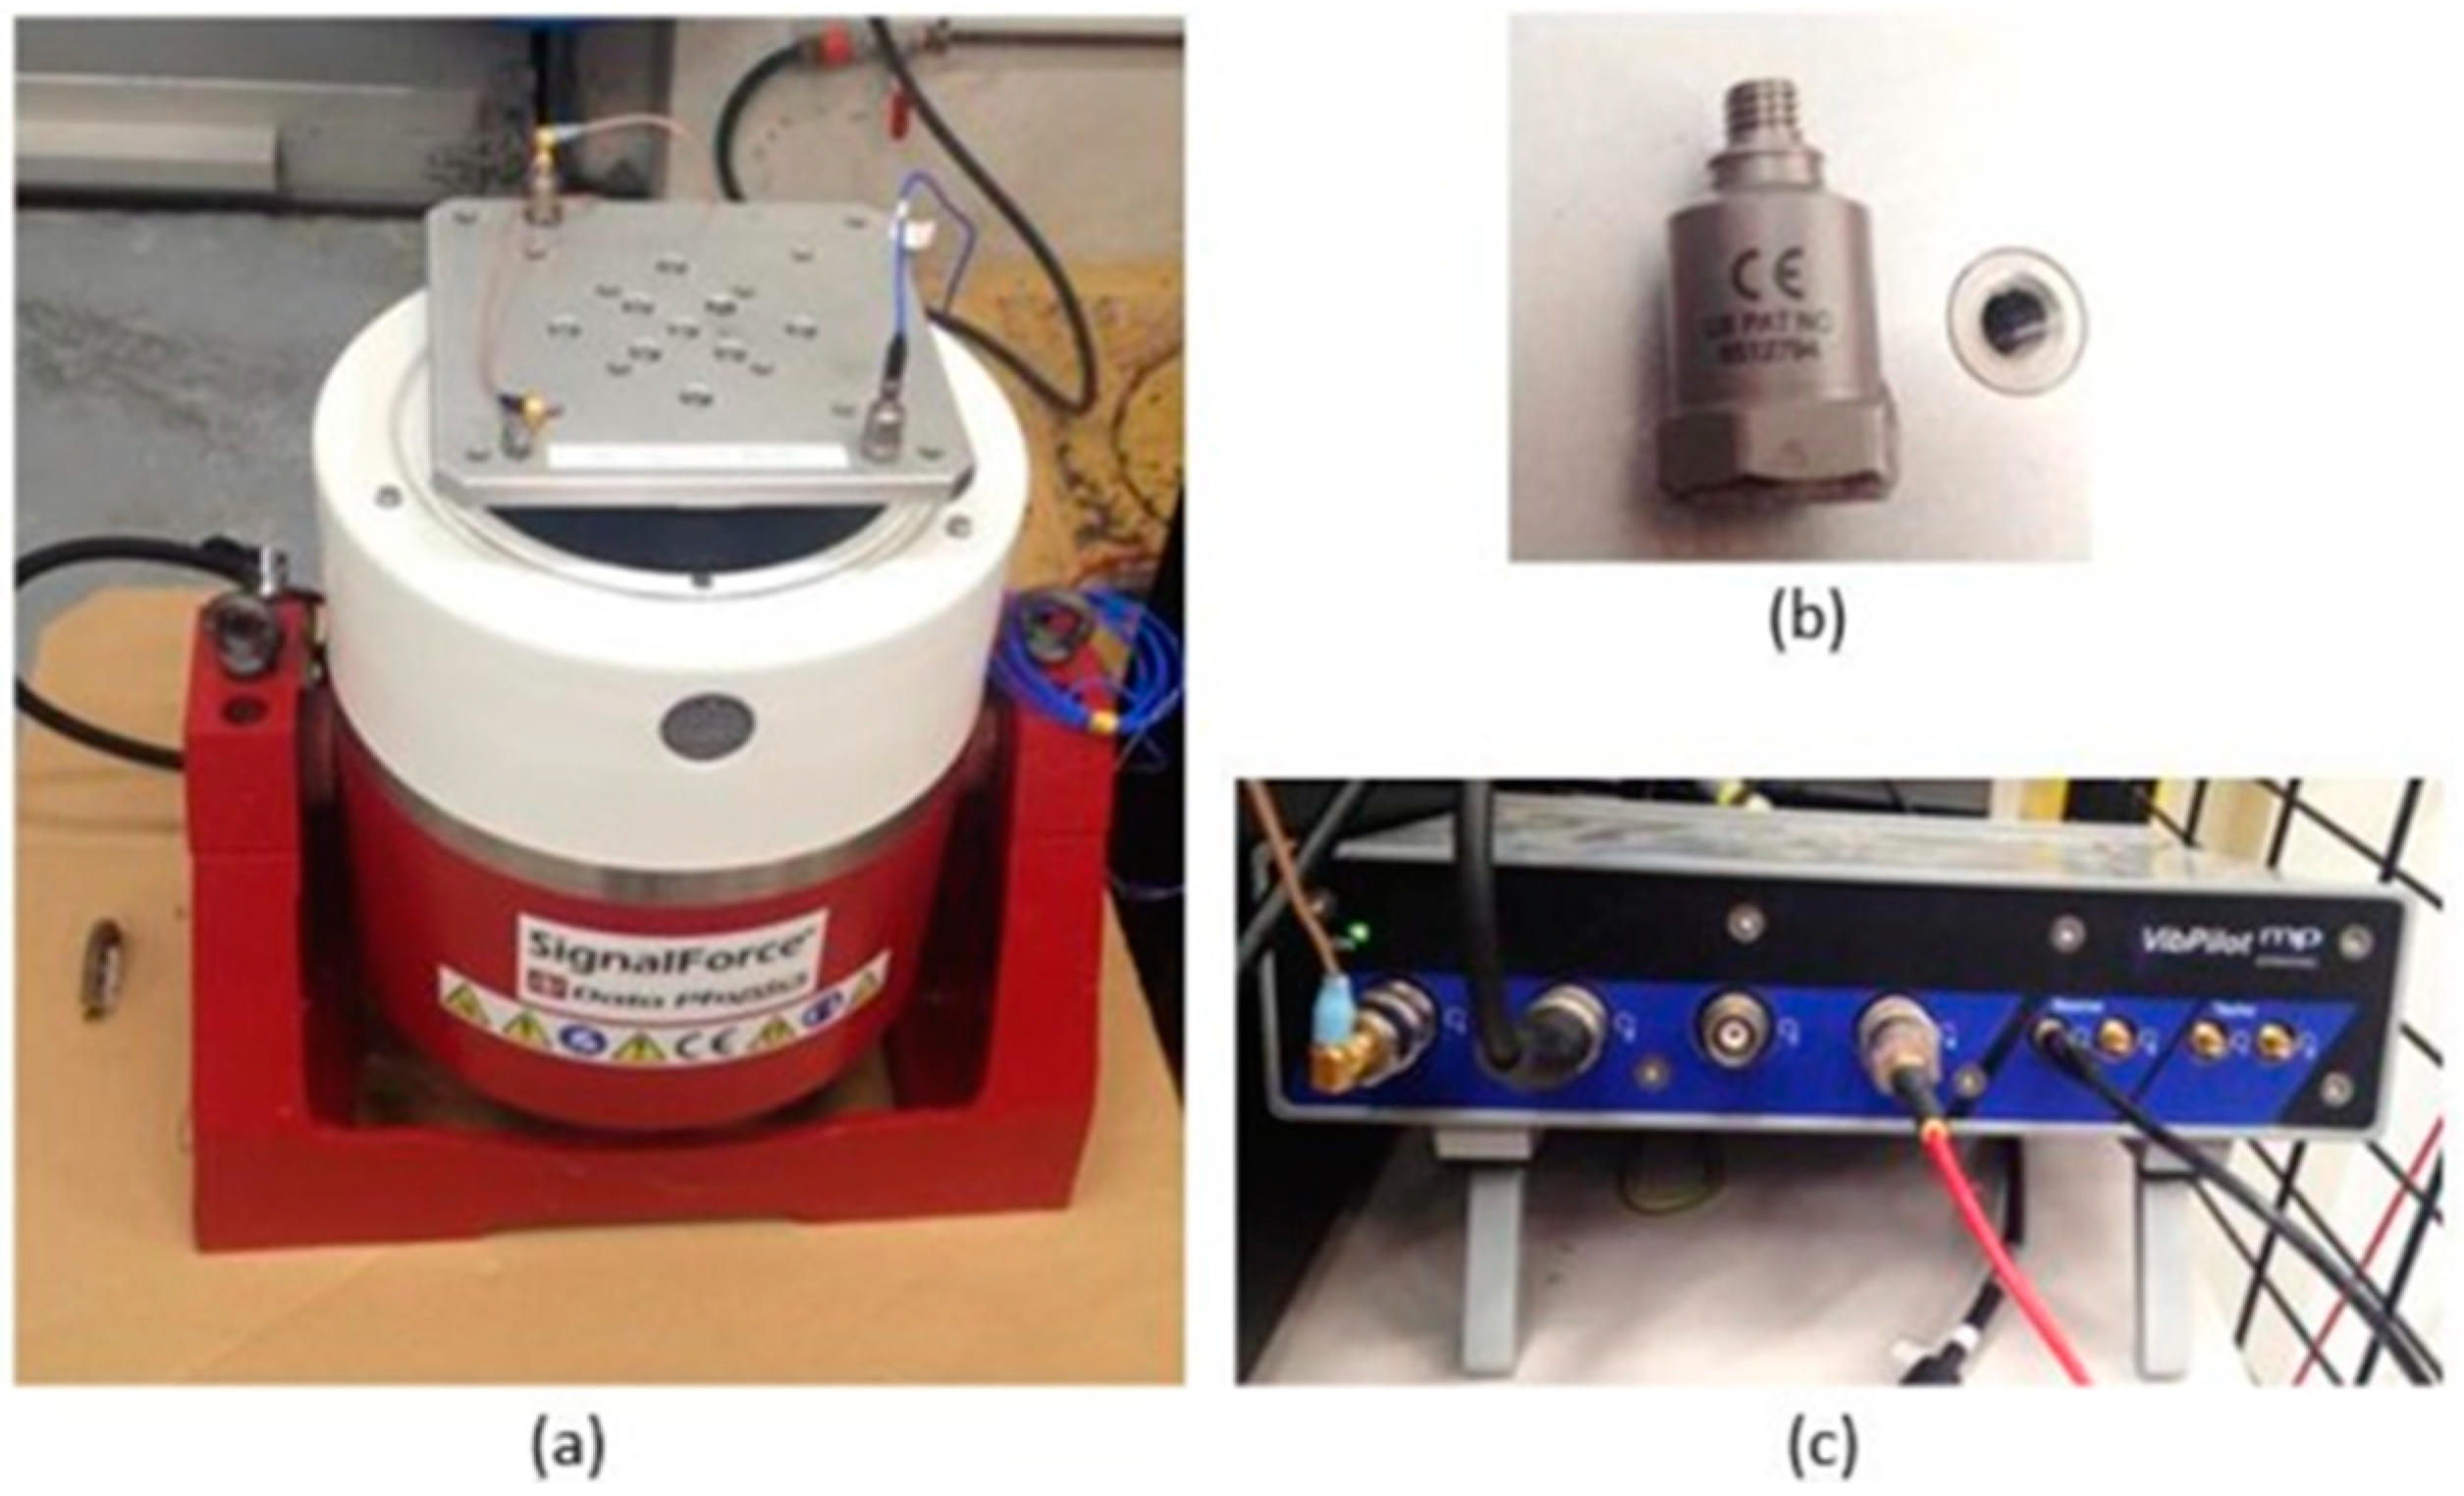
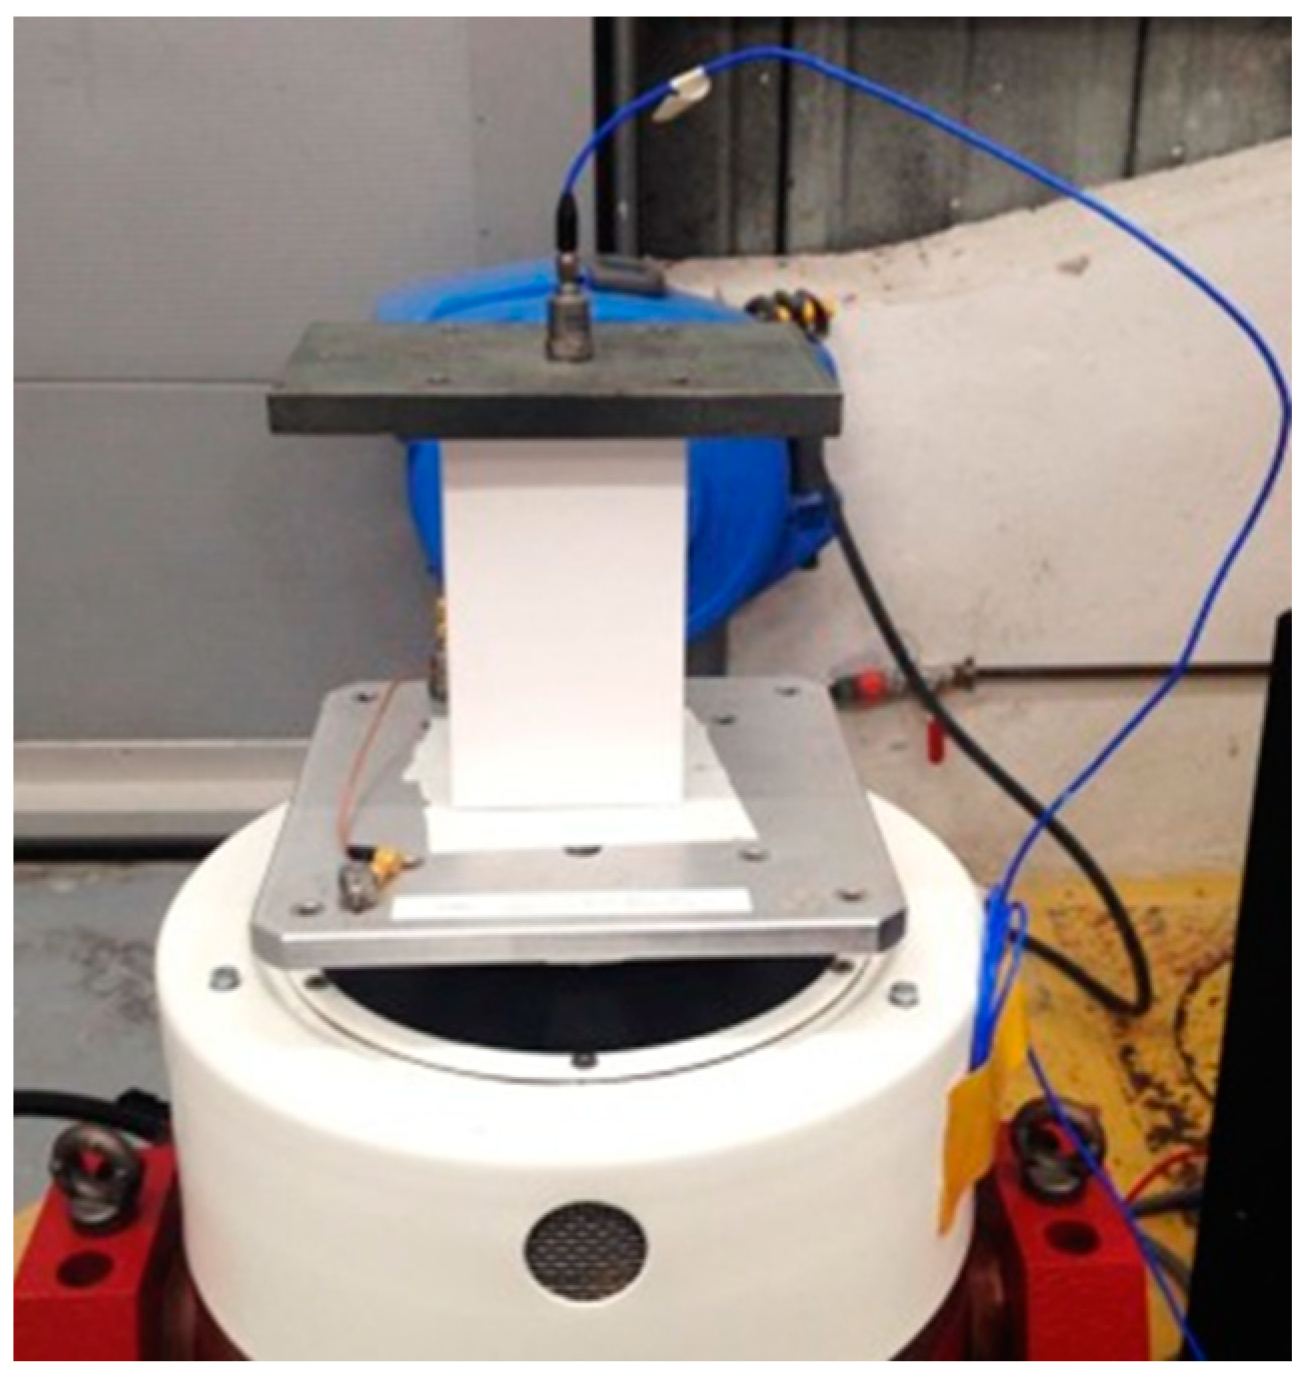
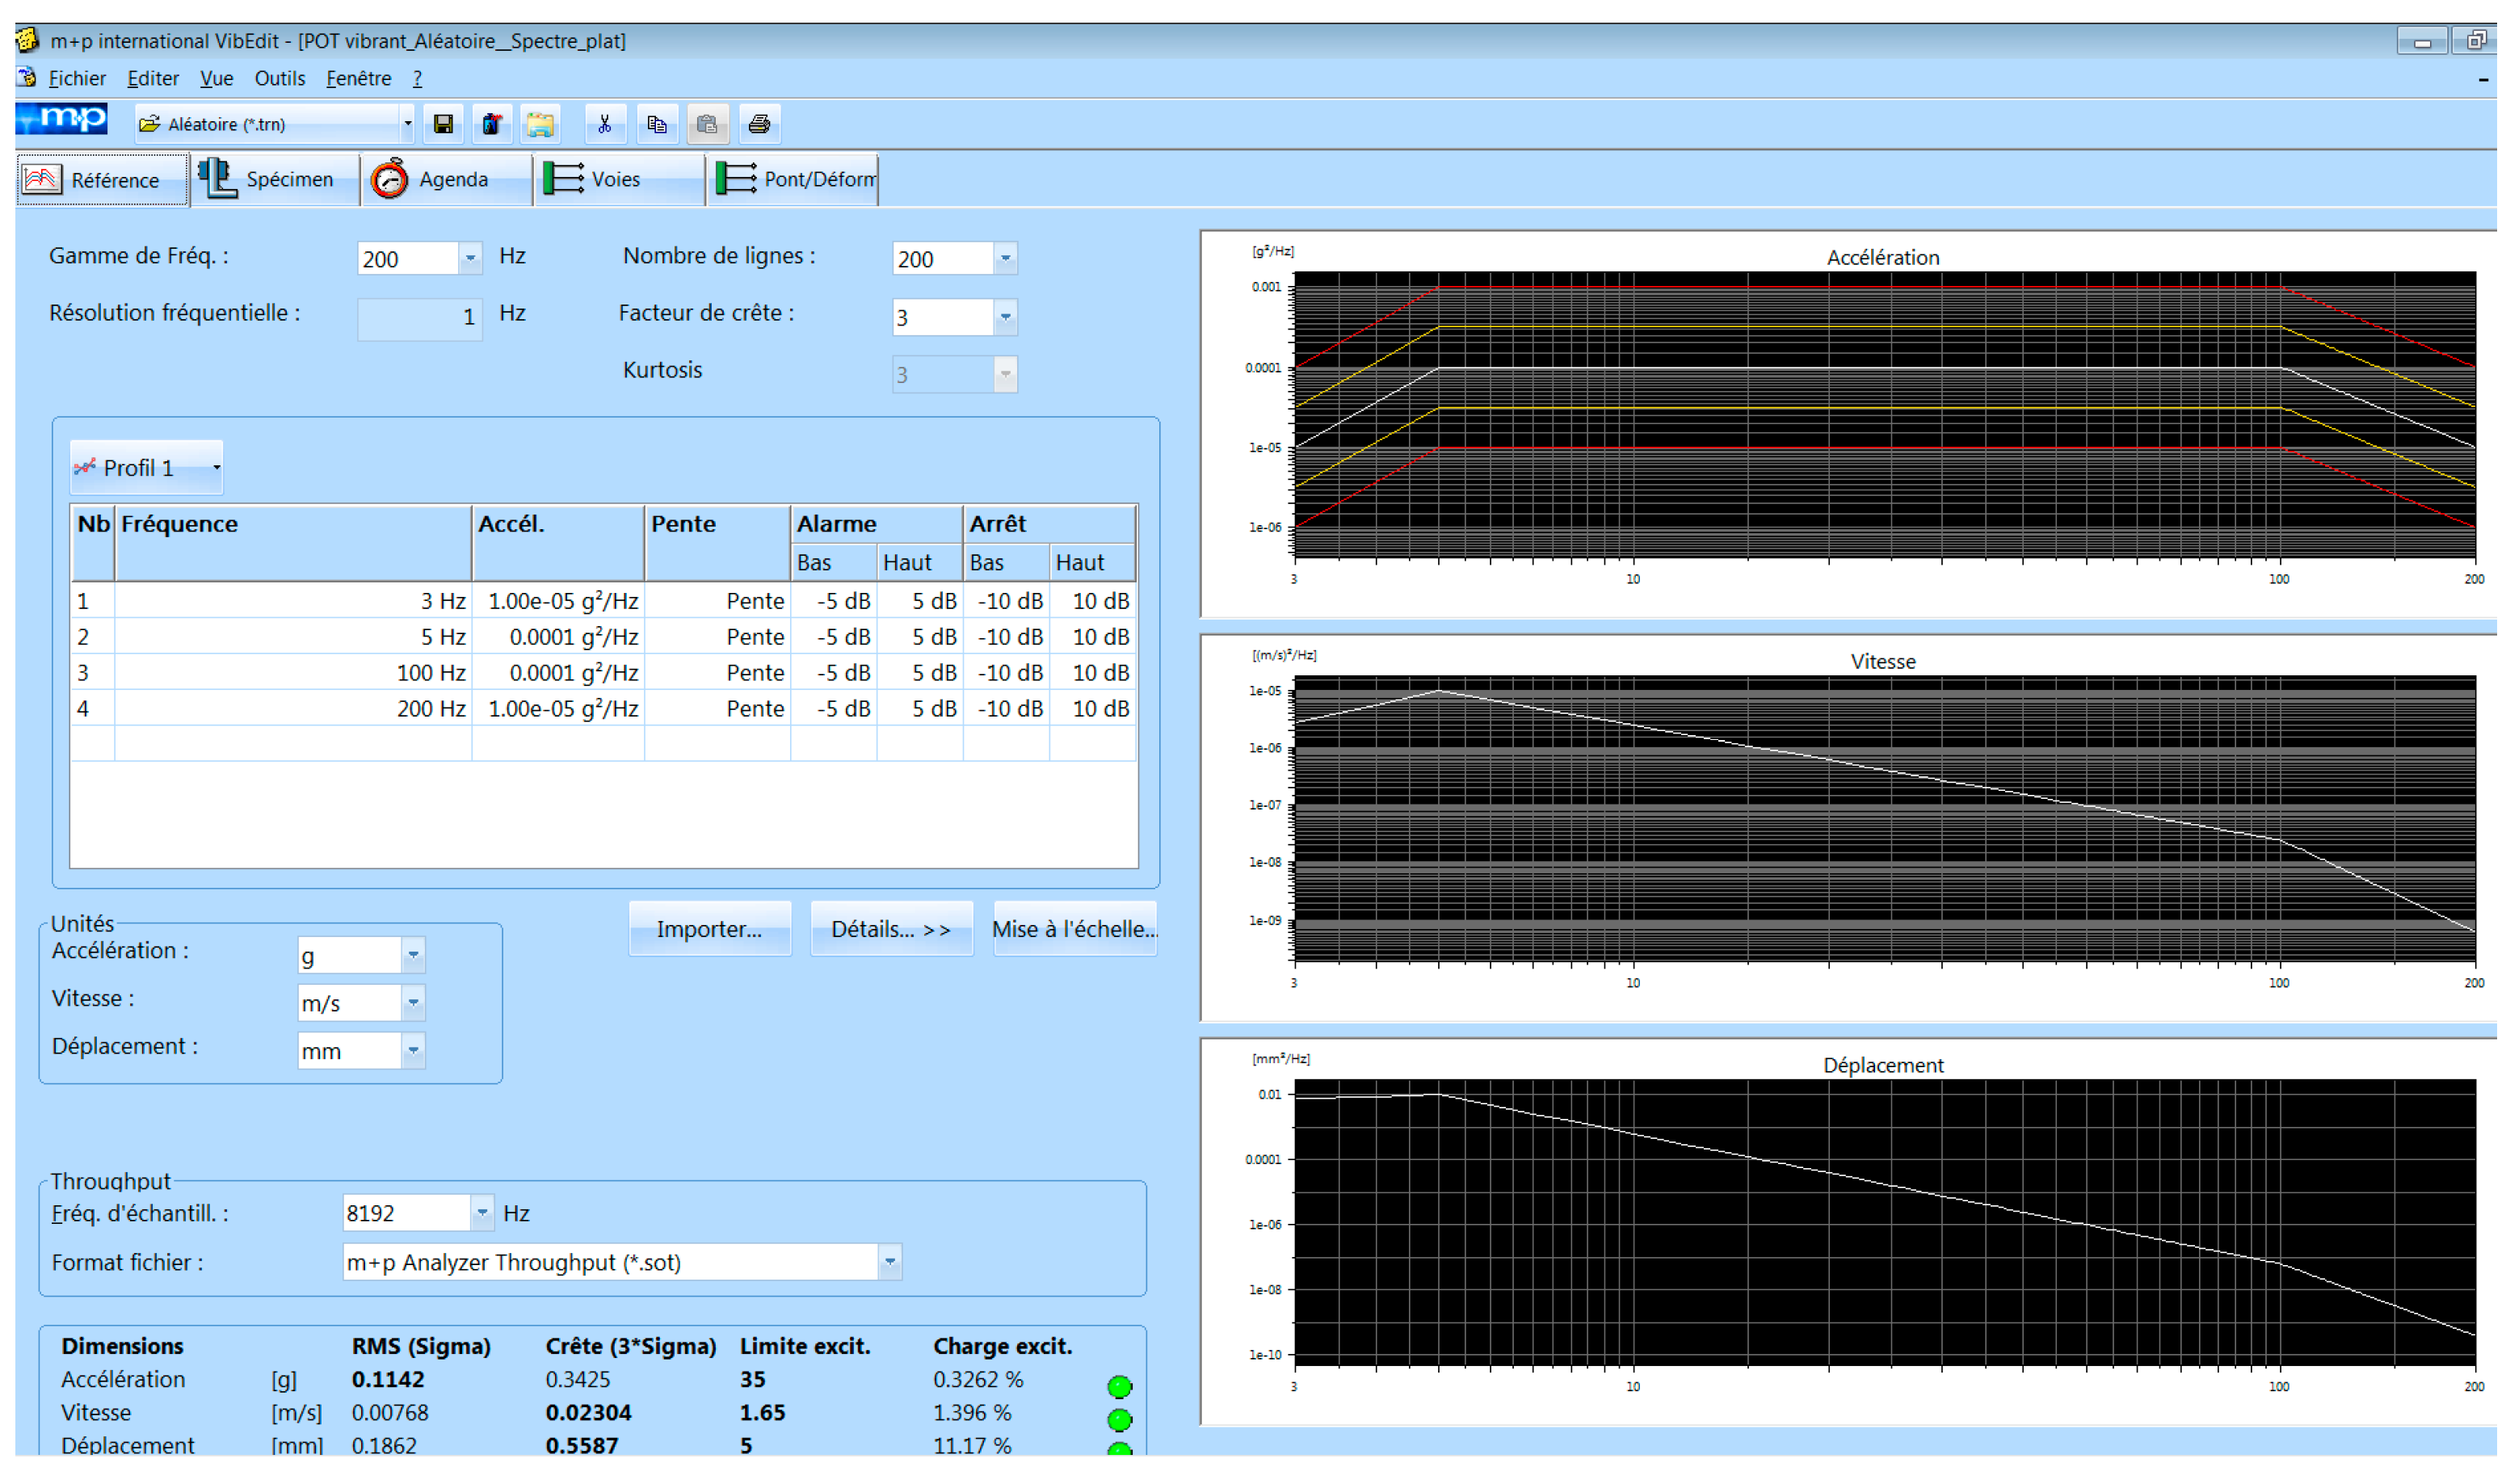
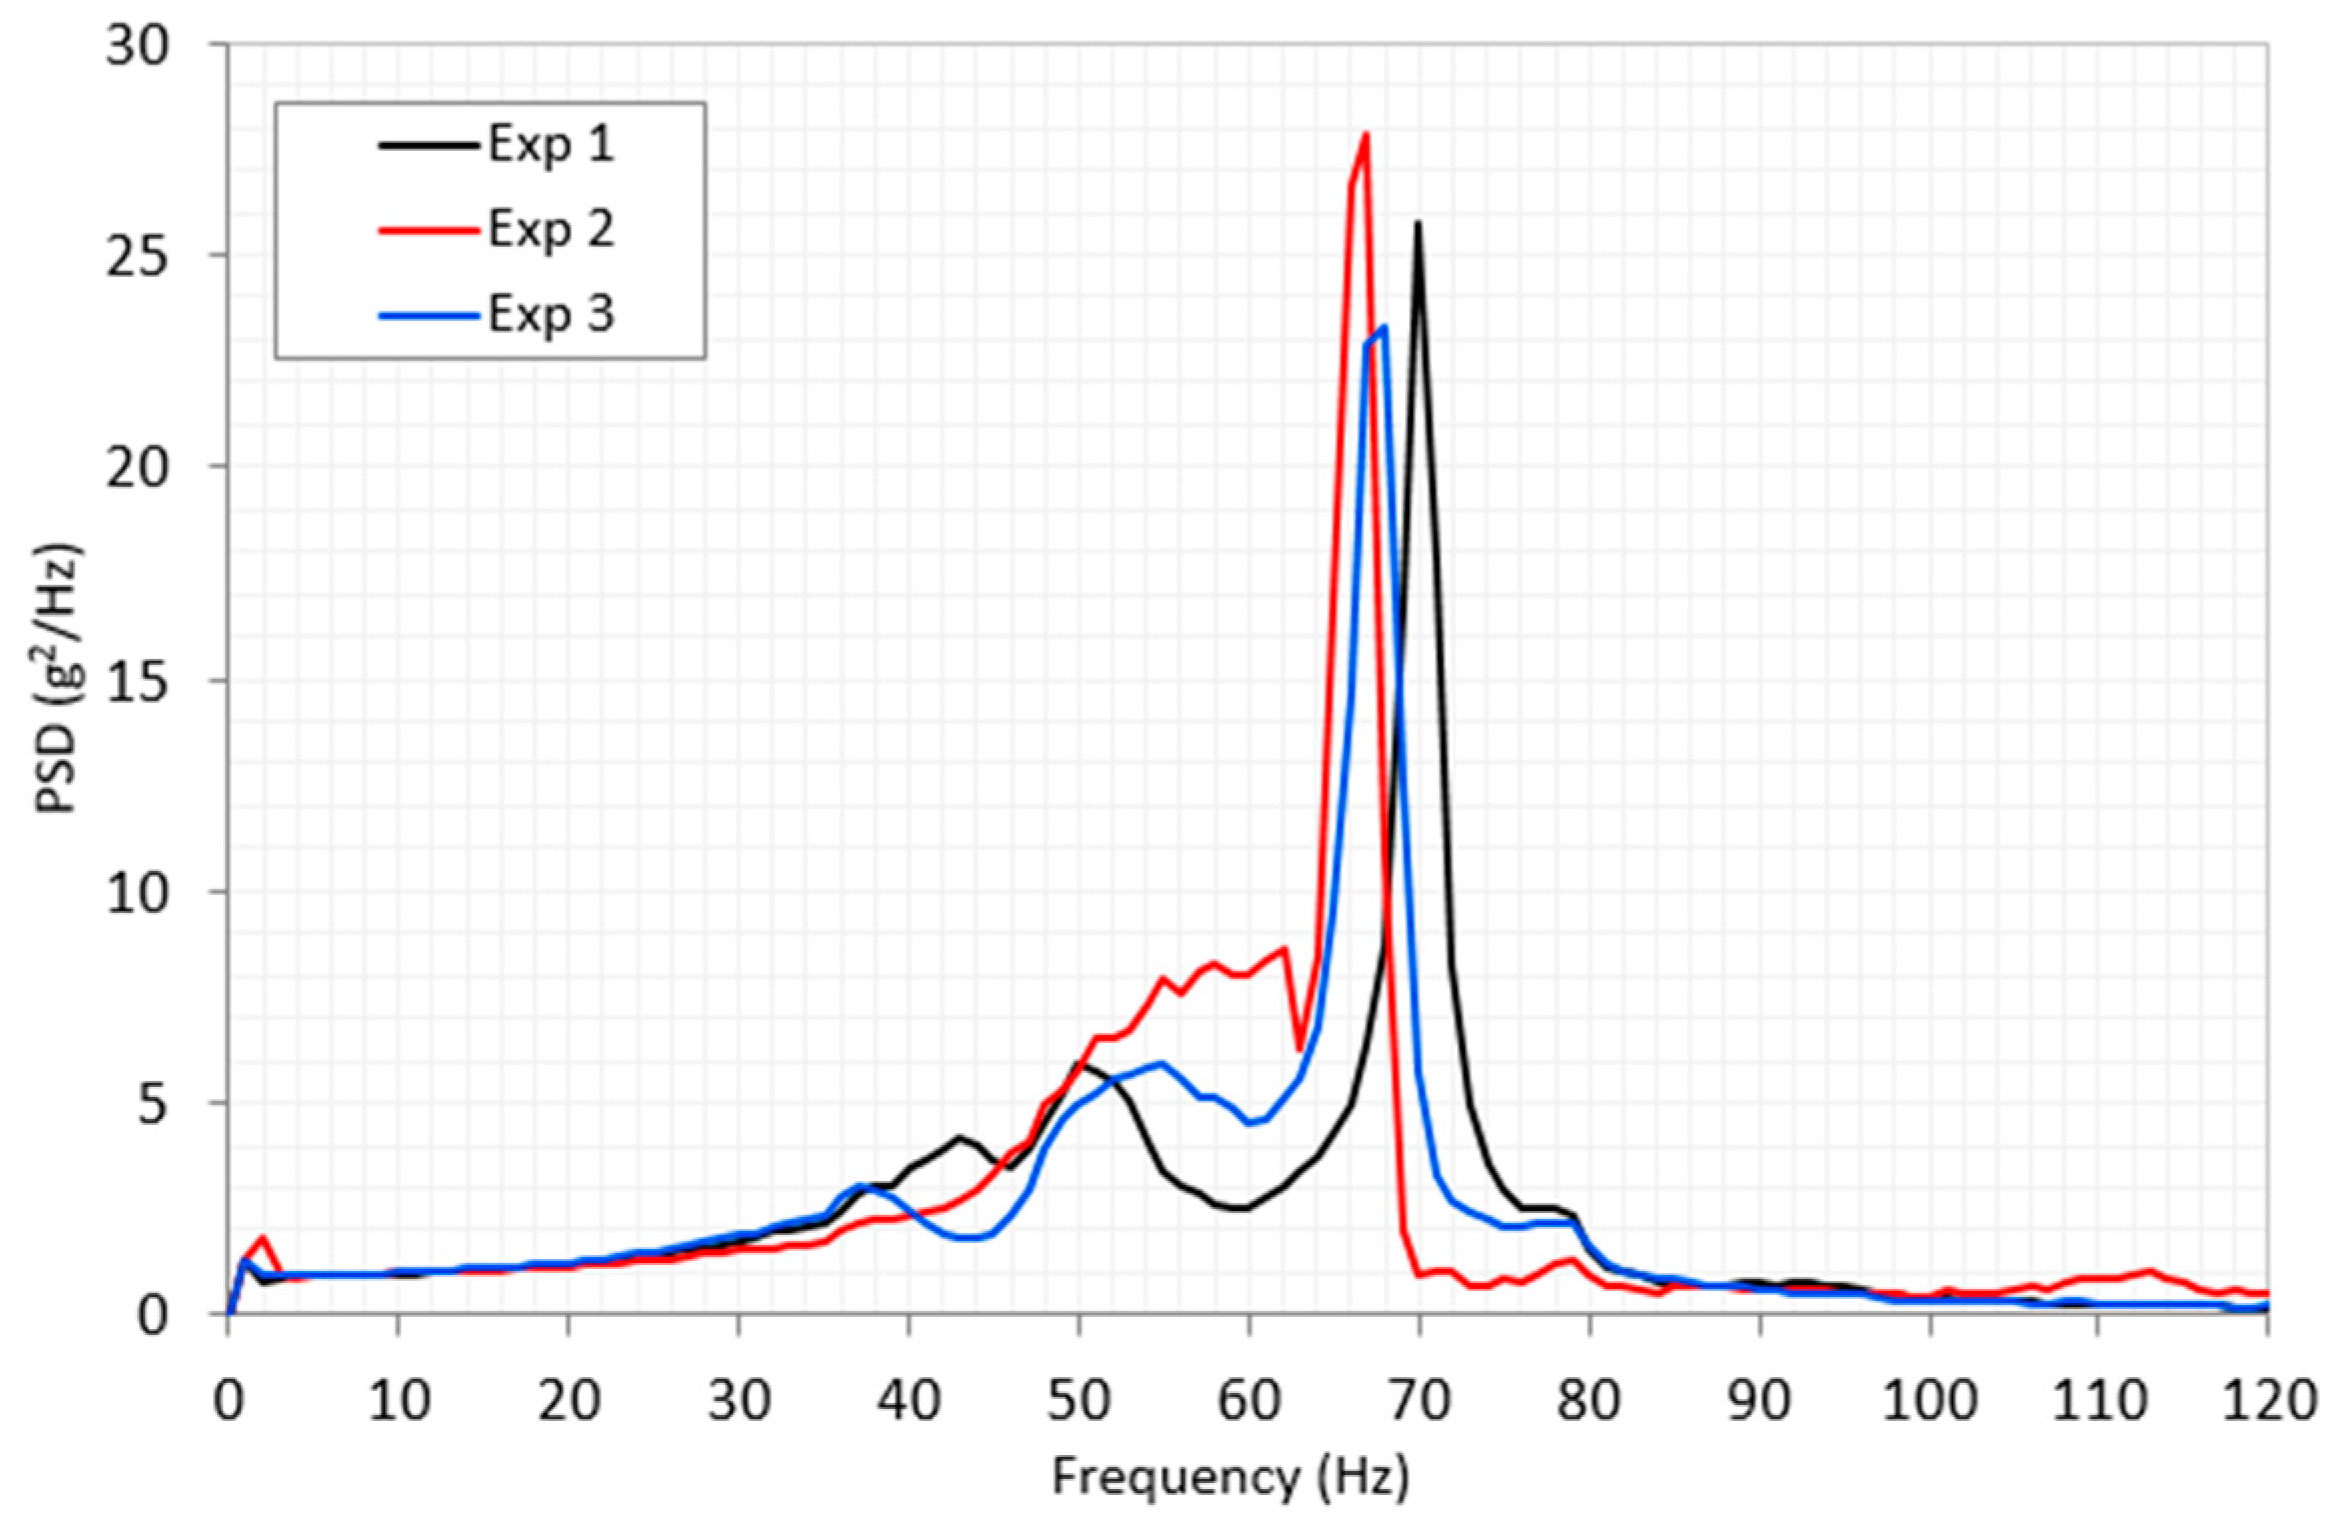
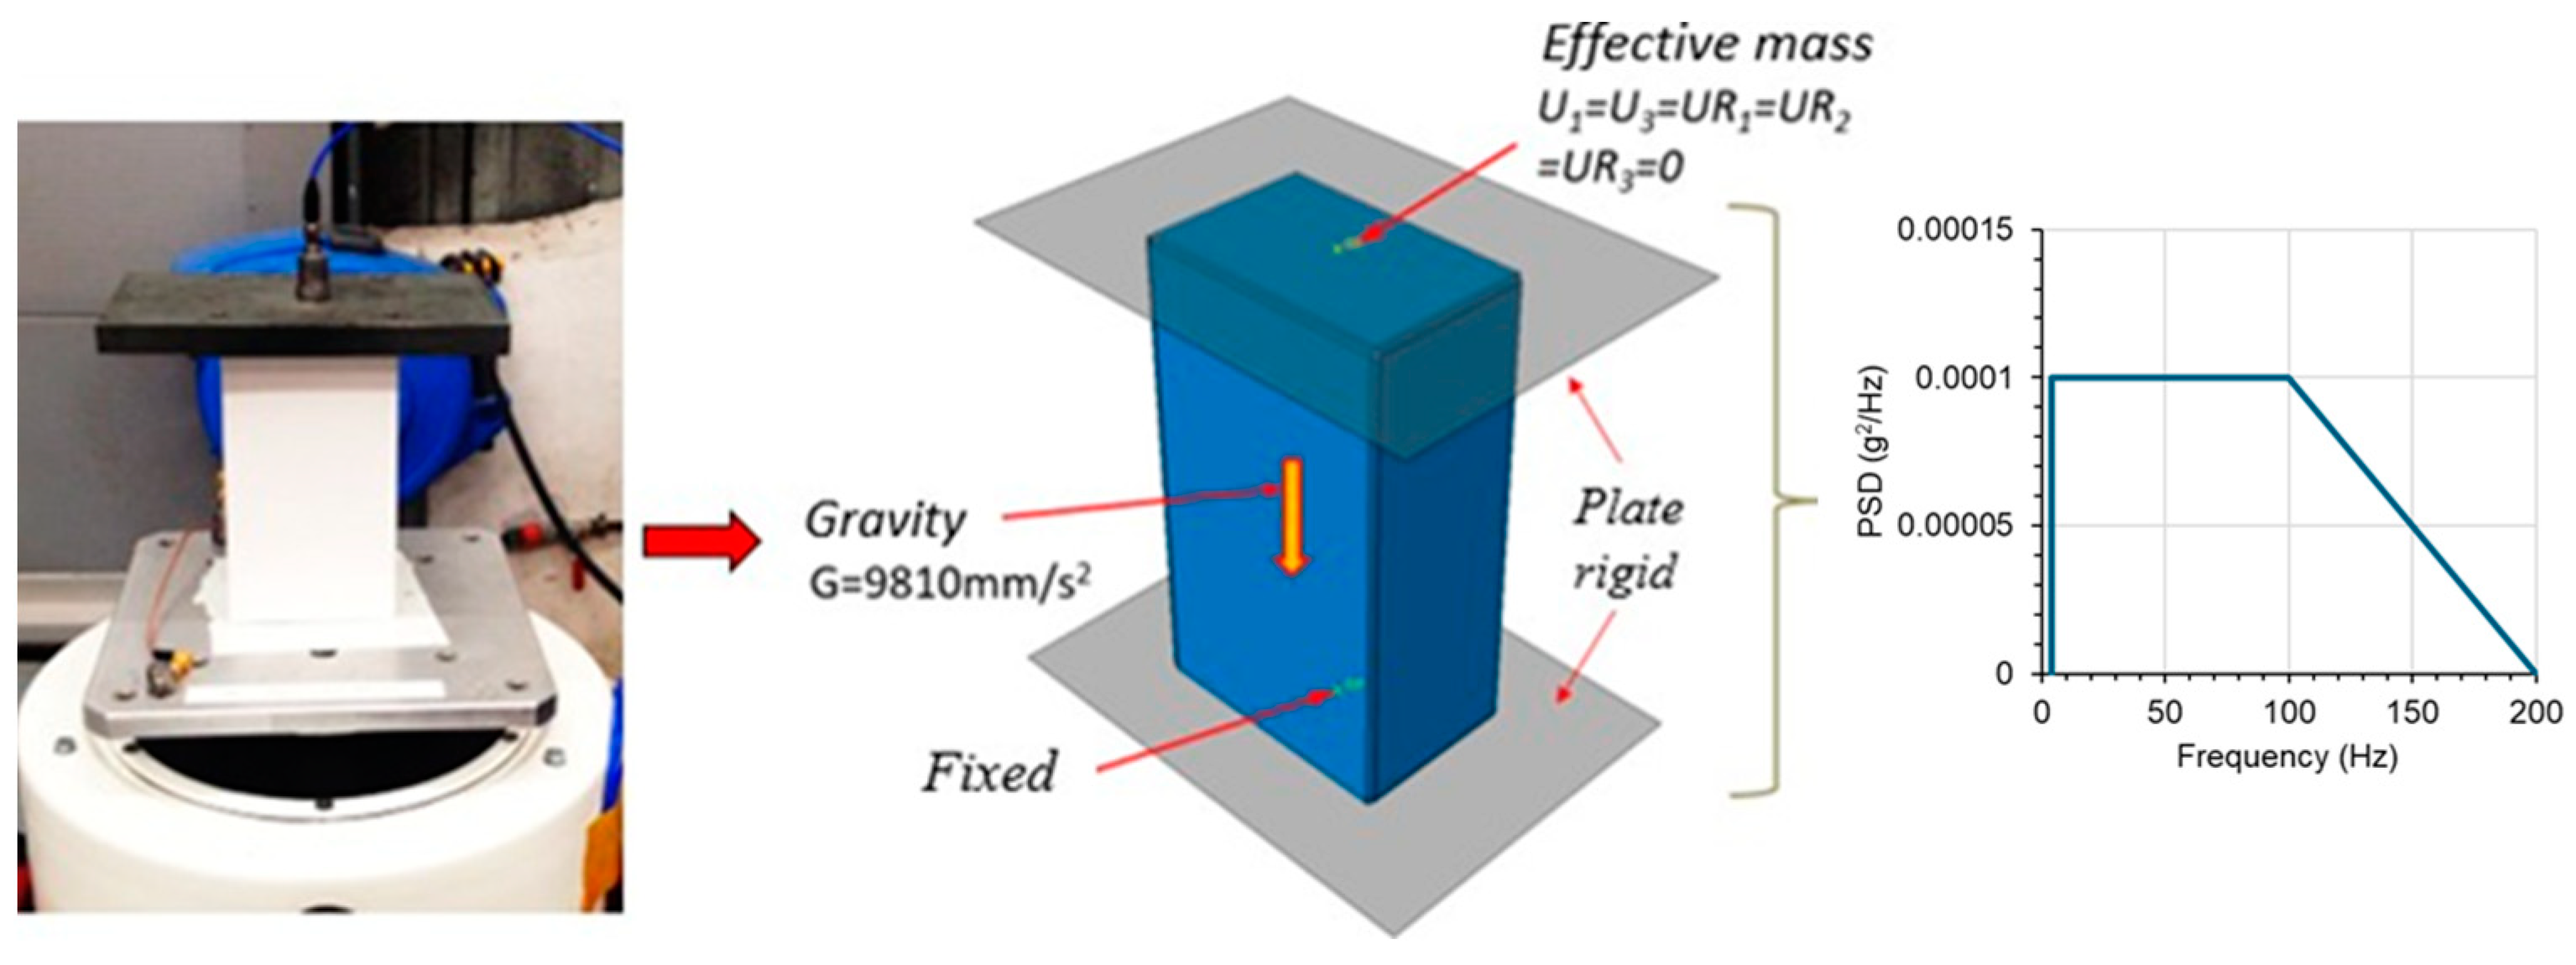
The boxes were designed using ArtiosCAD software 18 and a cutting table (ZÜND M-1600). Two series of boxes were cut so that the vertical panels in compression were parallel to the MD and CD directions. The dimensions of the boxes are shown in Figure 2 in the case where the box is oriented along CD. Three tests were carried out in each series.
The experiment was set up as shown in Figure 3. Figure 4 shows the experimental results of compressive force versus vertical displacement for MD- and CD-oriented boxes. As shown in Table 1, the box compression test (BCT) strength of the MD-oriented box is 28.4% higher than that of the CD-oriented box. Similar curves were obtained by Marin et al. [47]. An initial nonlinear part was noted in the curves followed by a linear response until peak load. They also investigated the effect of moisture on the measured box compression strength showing a reduction of 20% at 70% RH and 58% at 90% RH.

3.3. Vibration Test

Packaging can also be subjected to random vibrations during transportation. This is a set of frequencies and amplitudes that continuously change over time. In fact, according to the packaging design, it can amplify or damp the movements it is subjected to. Vibration tests help to evaluate the resistance of the packaging to these limitations. They also provide the possibility of comparing the differences in the performance of different packaging solutions: qualitatively by classical testing or quantitatively by instrument testing.
In this study, vibration tests on compact cardboard boxes were conducted. The objective of these tests was to obtain the natural frequencies and natural modes of the boxes. We used a Signal Force (Data Physics) vibration table, as shown in Figure 5a, to perform the tests. The tested packaging systems were all equipped with accelerometers PAT NO 5,512,794 from the USA (Figure 5b). The computer performed the acquisition of acceleration as a function of time through a vibration controller and a VibPilot4 dynamic signal analyzer (m + p International) connected to the accelerometer (Figure 5c).
A compact cardboard box was placed on a vibrating table, on top of which was placed a 1.41 kg steel block (Figure 6). An accelerometer was attached to the steel plate to record the system response. The box was subjected to random white noise vibrations with a constant power spectral density (PSD) of 0.0001 g2/Hz, over a frequency range of 3 Hz to 200 Hz (Figure 7). The test results are shown in Figure 8 as the PSD response as a function of frequency. The results obtained were reproducible. The natural frequency of the compact cardboard block system was 68.47 ± 1.55 Hz.

4. Simulation

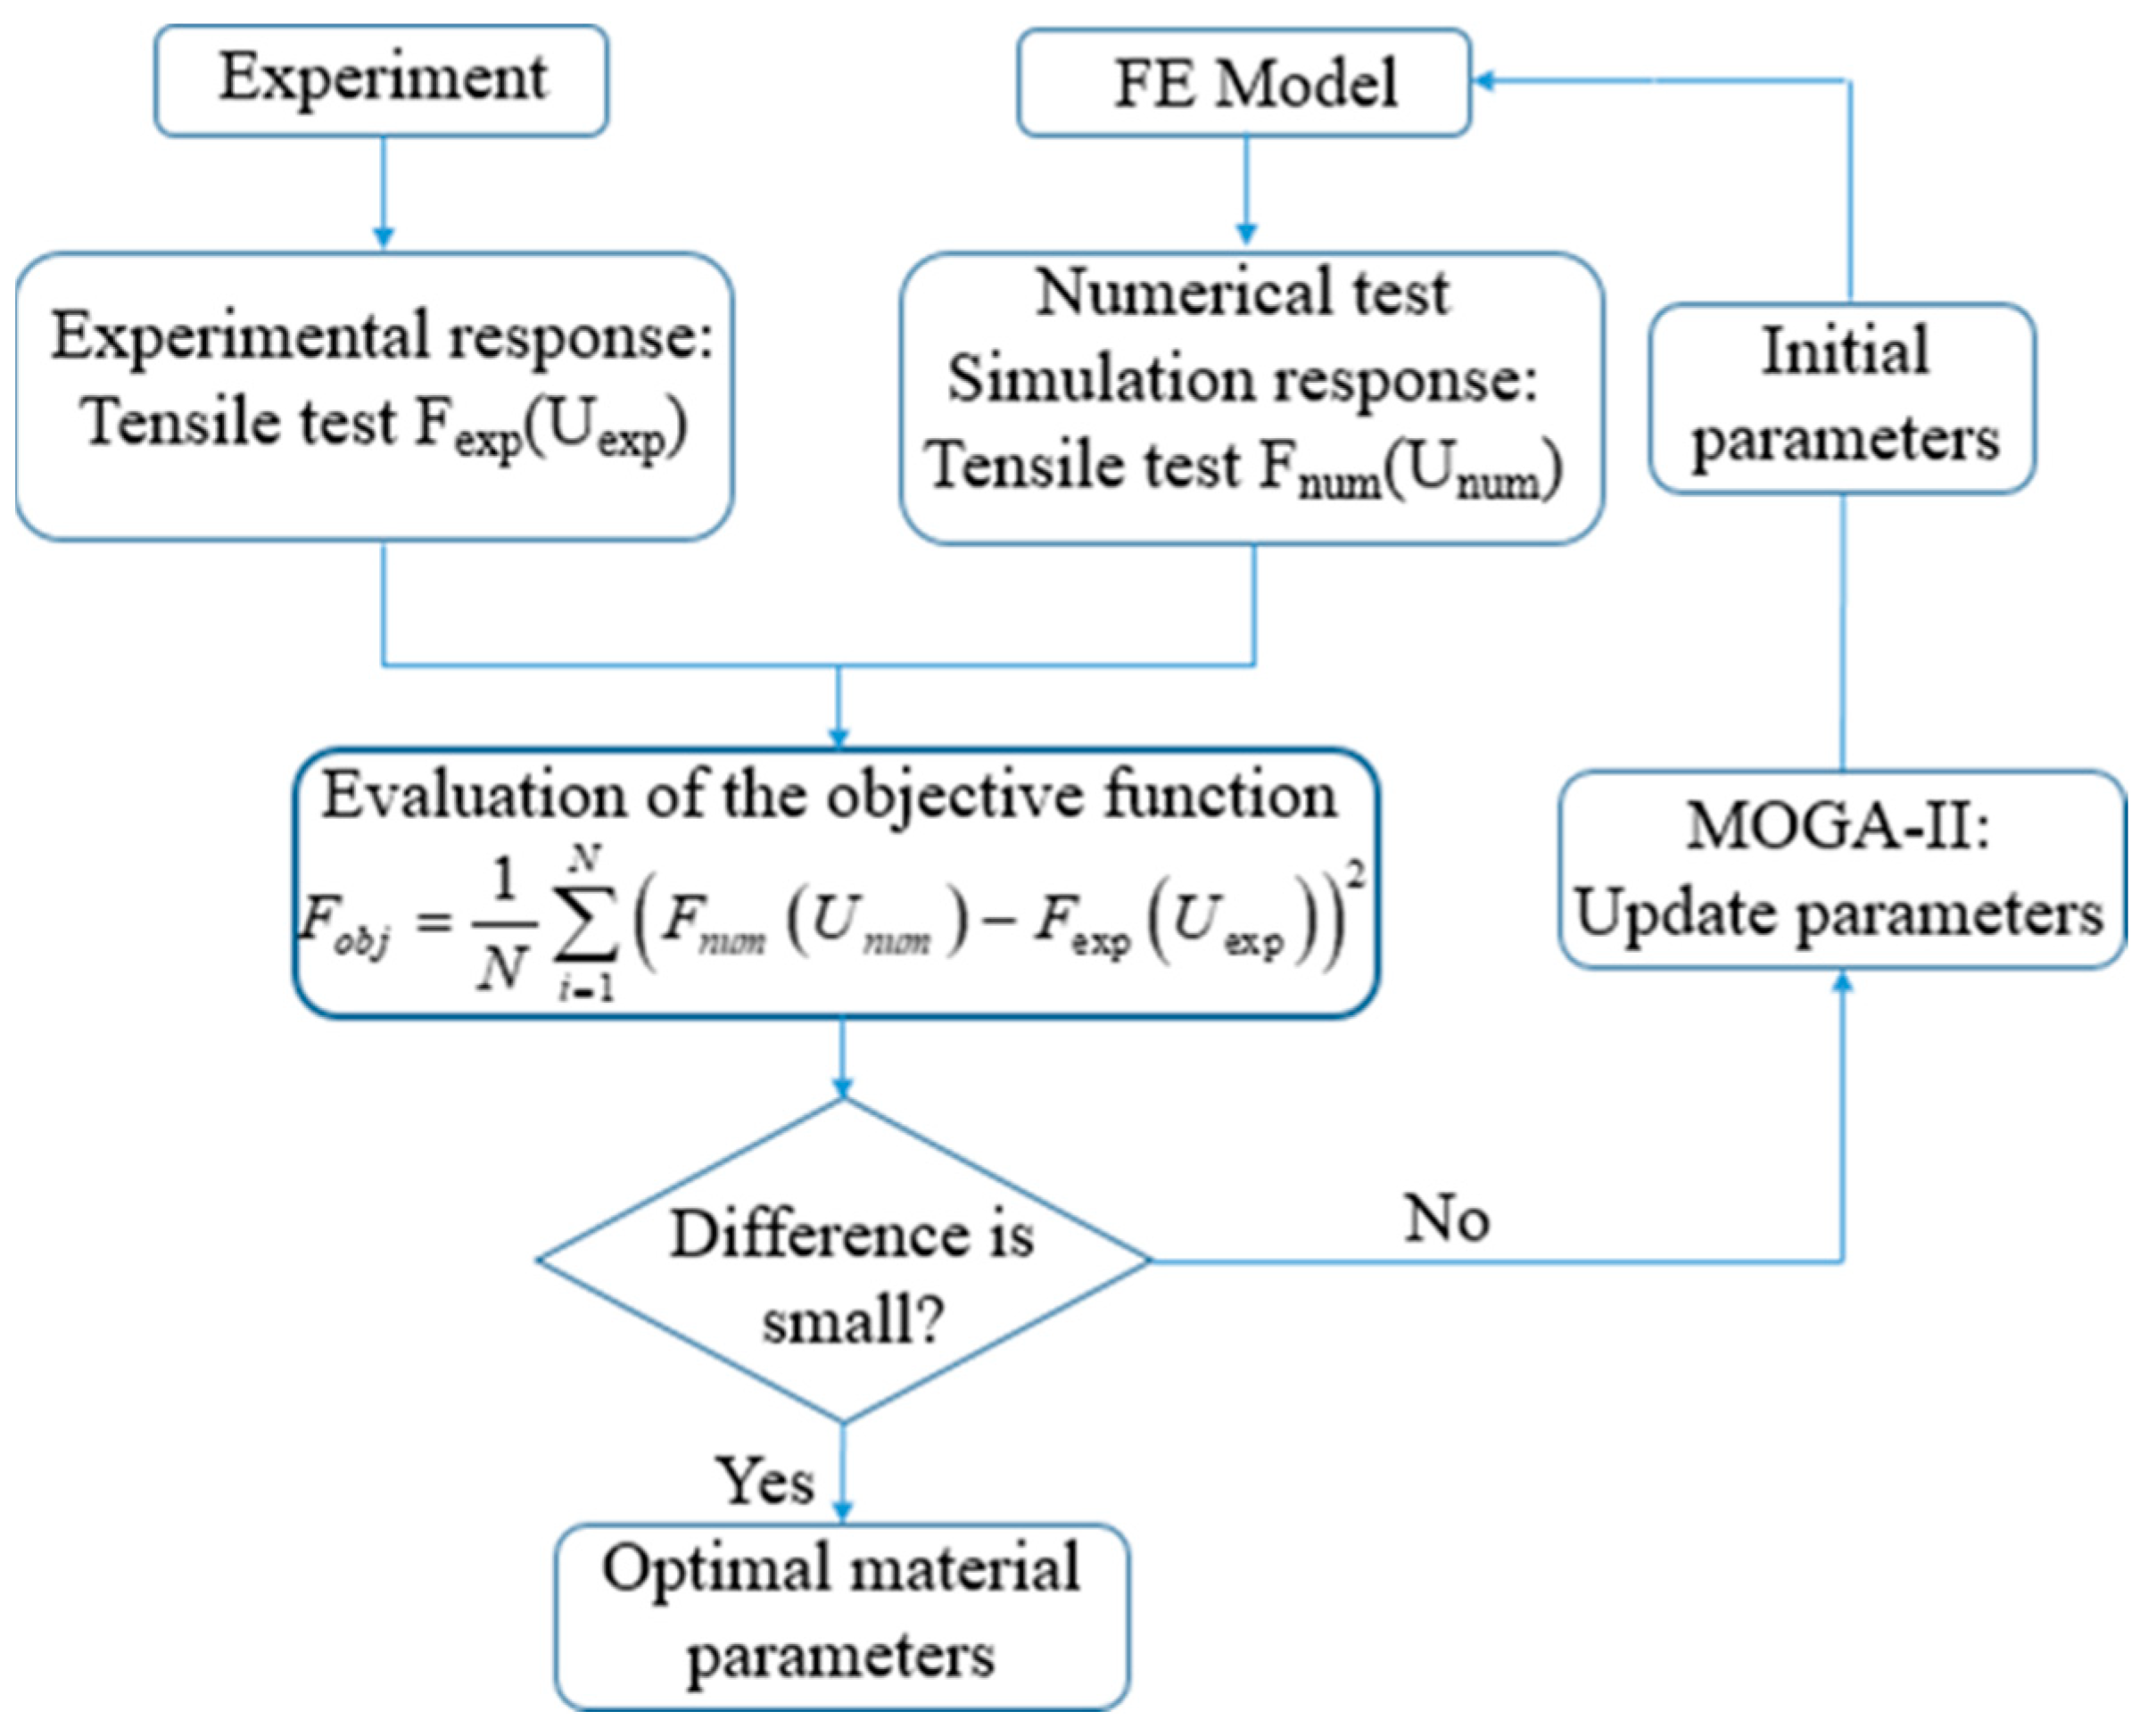
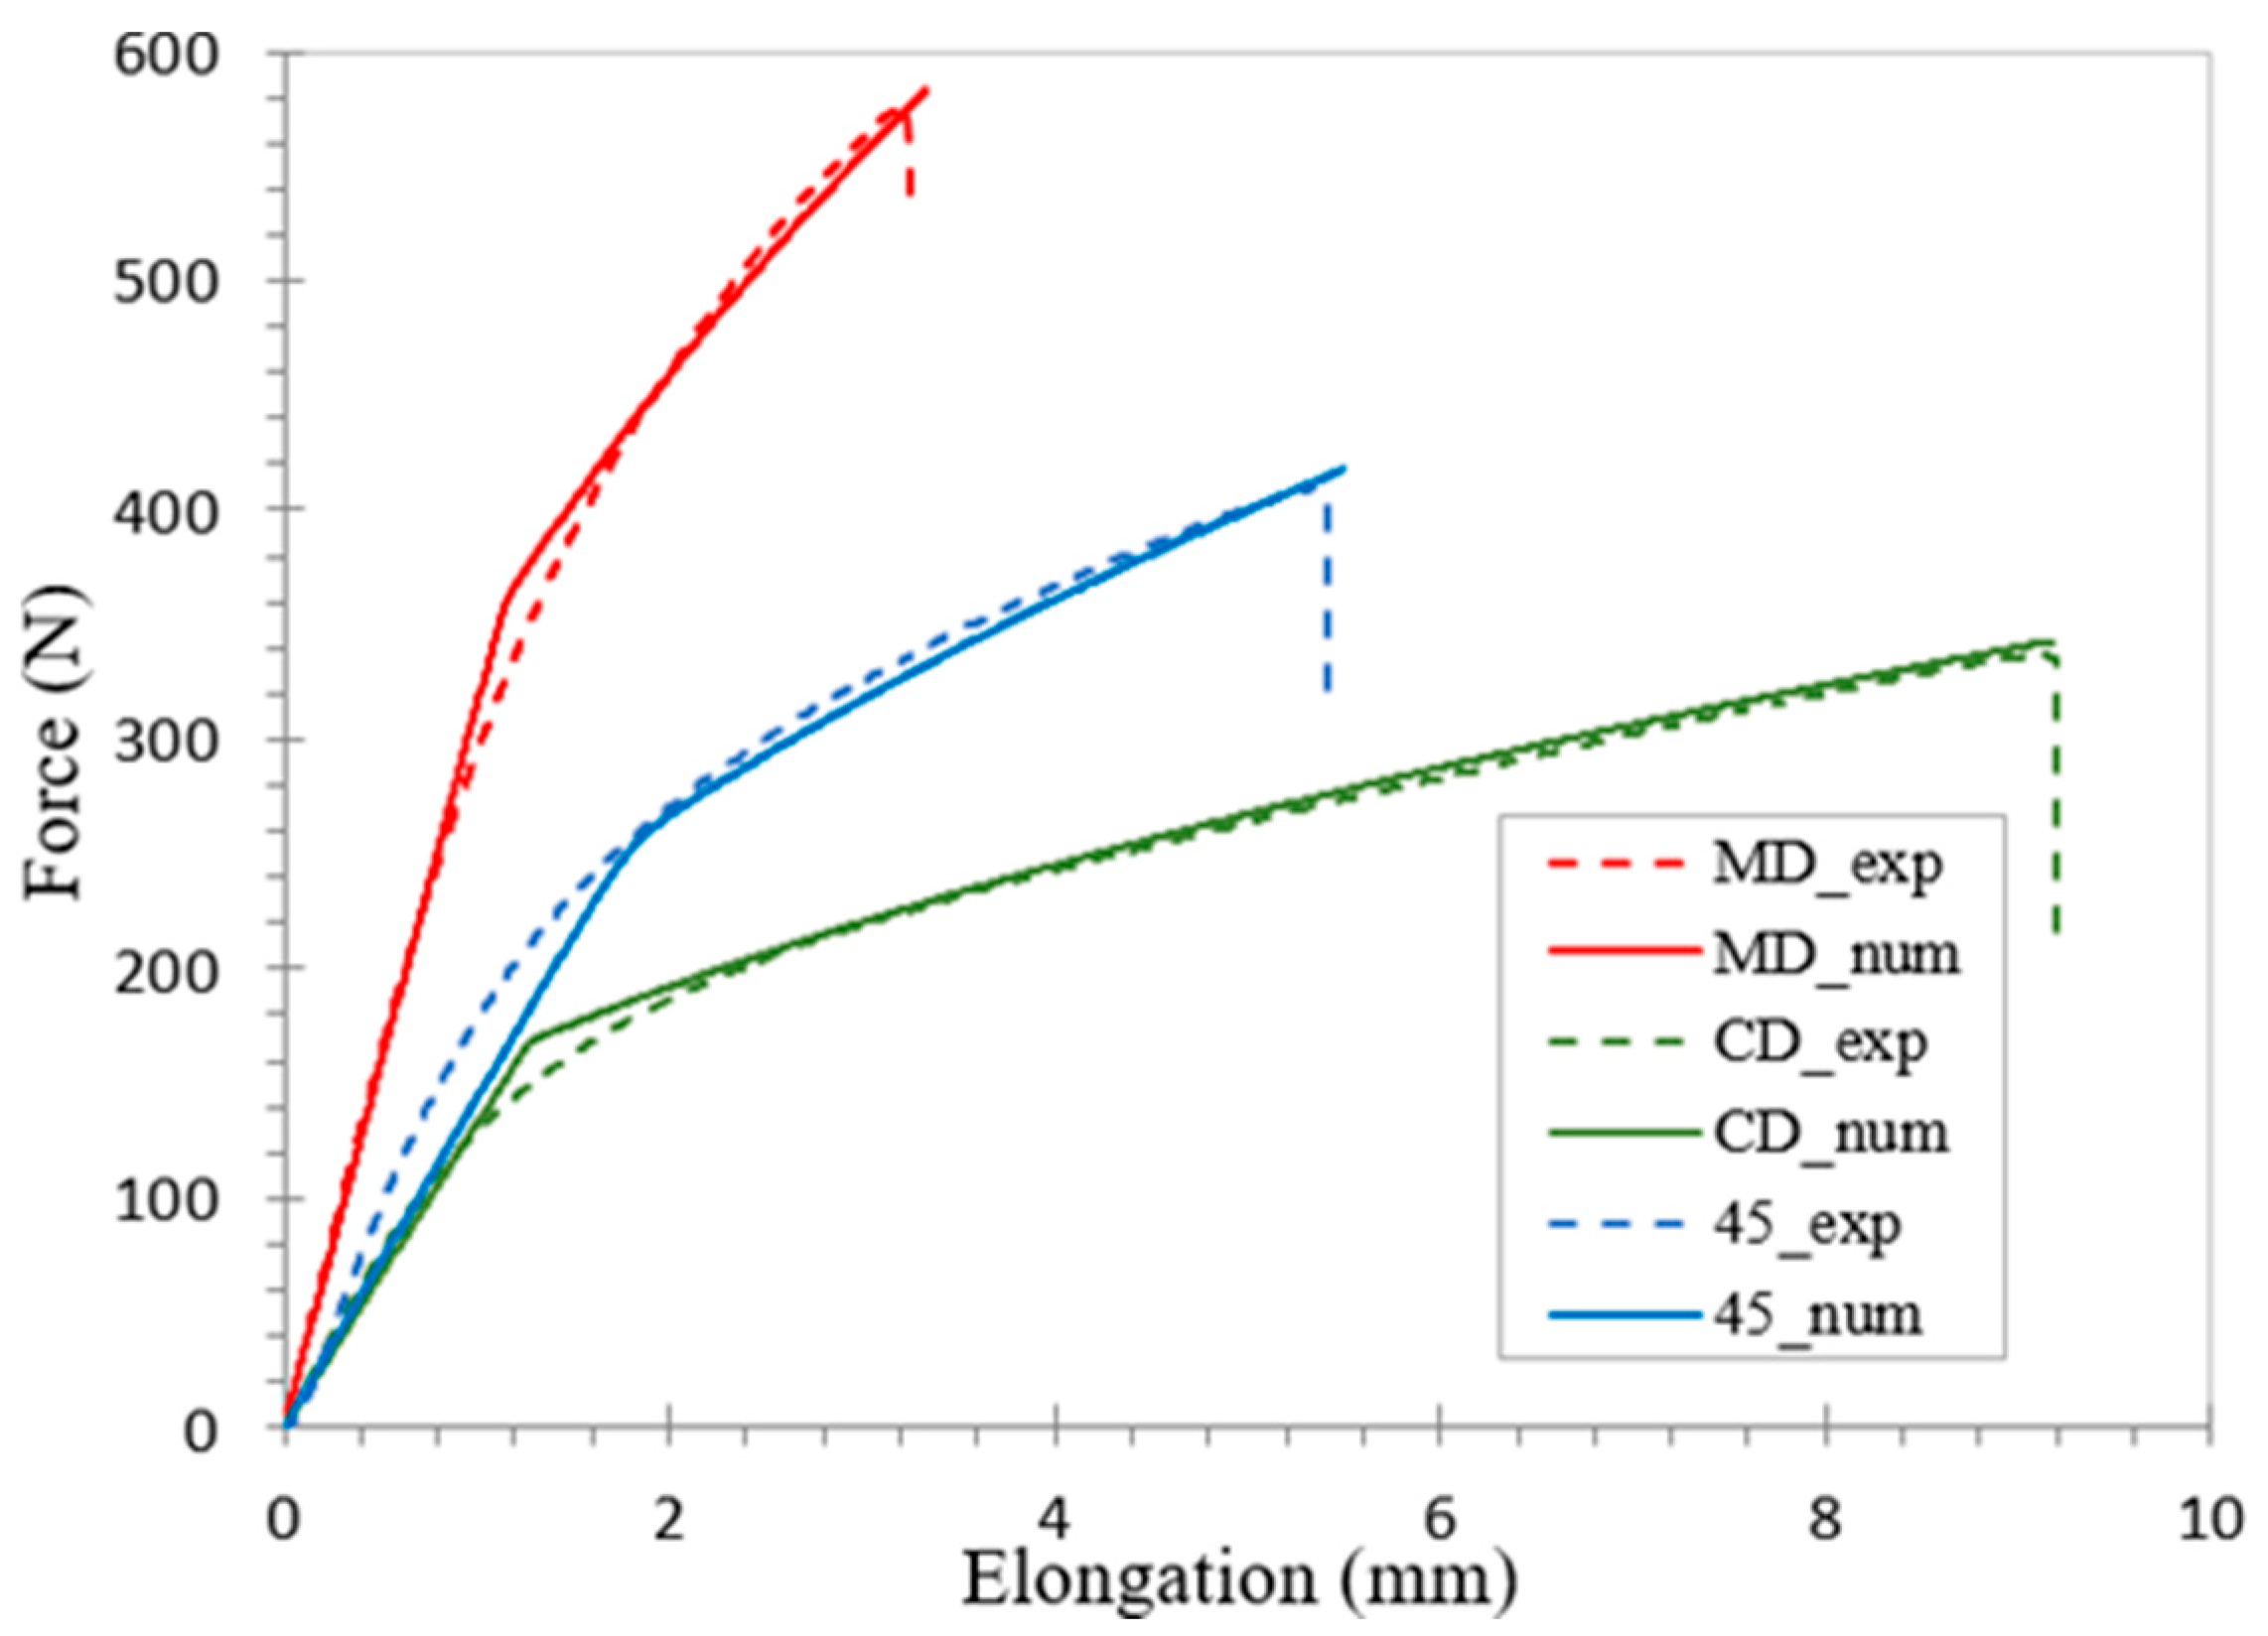
4.1. Material Parameter Identification

The finite element model of the box was developed using ABAQUS software to simulate its compression behavior. During the paperboard box manufacturing process, in the folding positions where the box is formed (Figure 9), the cellulose fibers are unevenly compressed and stretched, resulting in damage to the microstructure of the material, such as reduction of stiffness, propagation of cracks, and delamination of the cardboard layers. The bonding strength between the layers typically decreases by up to 80% during folding [17]. This effect will be incorporated into the finite element model of the paperboard box.
However, when conducting numerical simulations, the values of material parameters in the behavior model must be accurate. Therefore, an inverse identification process of the parameters in the behavior model is also carried out based on the discrepancy between experimental data and numerical data. The objective function used is the scalar least squares function given in expression (12):
F o b j = 1 N i = 1 N F n u m U n u m F e x p U e x p 2
where N is the number of data sets, U n u m and U e x p are the simulation and experimental displacements, and F n u m and F e x p are the simulation and experimental tensile forces. The process diagram for identification is illustrated in Figure 10.
First, tensile experiments on cardboard samples were conducted. The samples were cut on the ZÜND M-1600 cutting machine. To ensure a tighter grip when placing the samples, cardboard pieces were attached to both sides of each end of the tensile specimens. Experimental tensile tests were conducted in three directions: MD, CD, and 45°, at a constant speed of 10 mm/min under standard conditions (23 °C and 50% RH). The experimental tensile test results are presented in Figure 11.
Next, the numerical simulation of cardboard tensile tests was performed using Abaqus software. The dimensions of the simulation model were taken to match the size of the tensile specimens in the experimental tests. In this study, the MOGA-II genetic optimization algorithm was utilized to minimize the objective function in Equation (12). The results of the material parameter determination process are presented in Table 2 and Table 3 and Figure 12. In Table 3, E 0 is a material constant, ε 0 is the yield strain, n is the strain hardening exponent, and a , b , c , and d are the anisotropy parameters defined in Equation (8).
Figure 12 demonstrates the good similarity between the experimental curves and the numerical results obtained through the parameter determination in the IPE model.

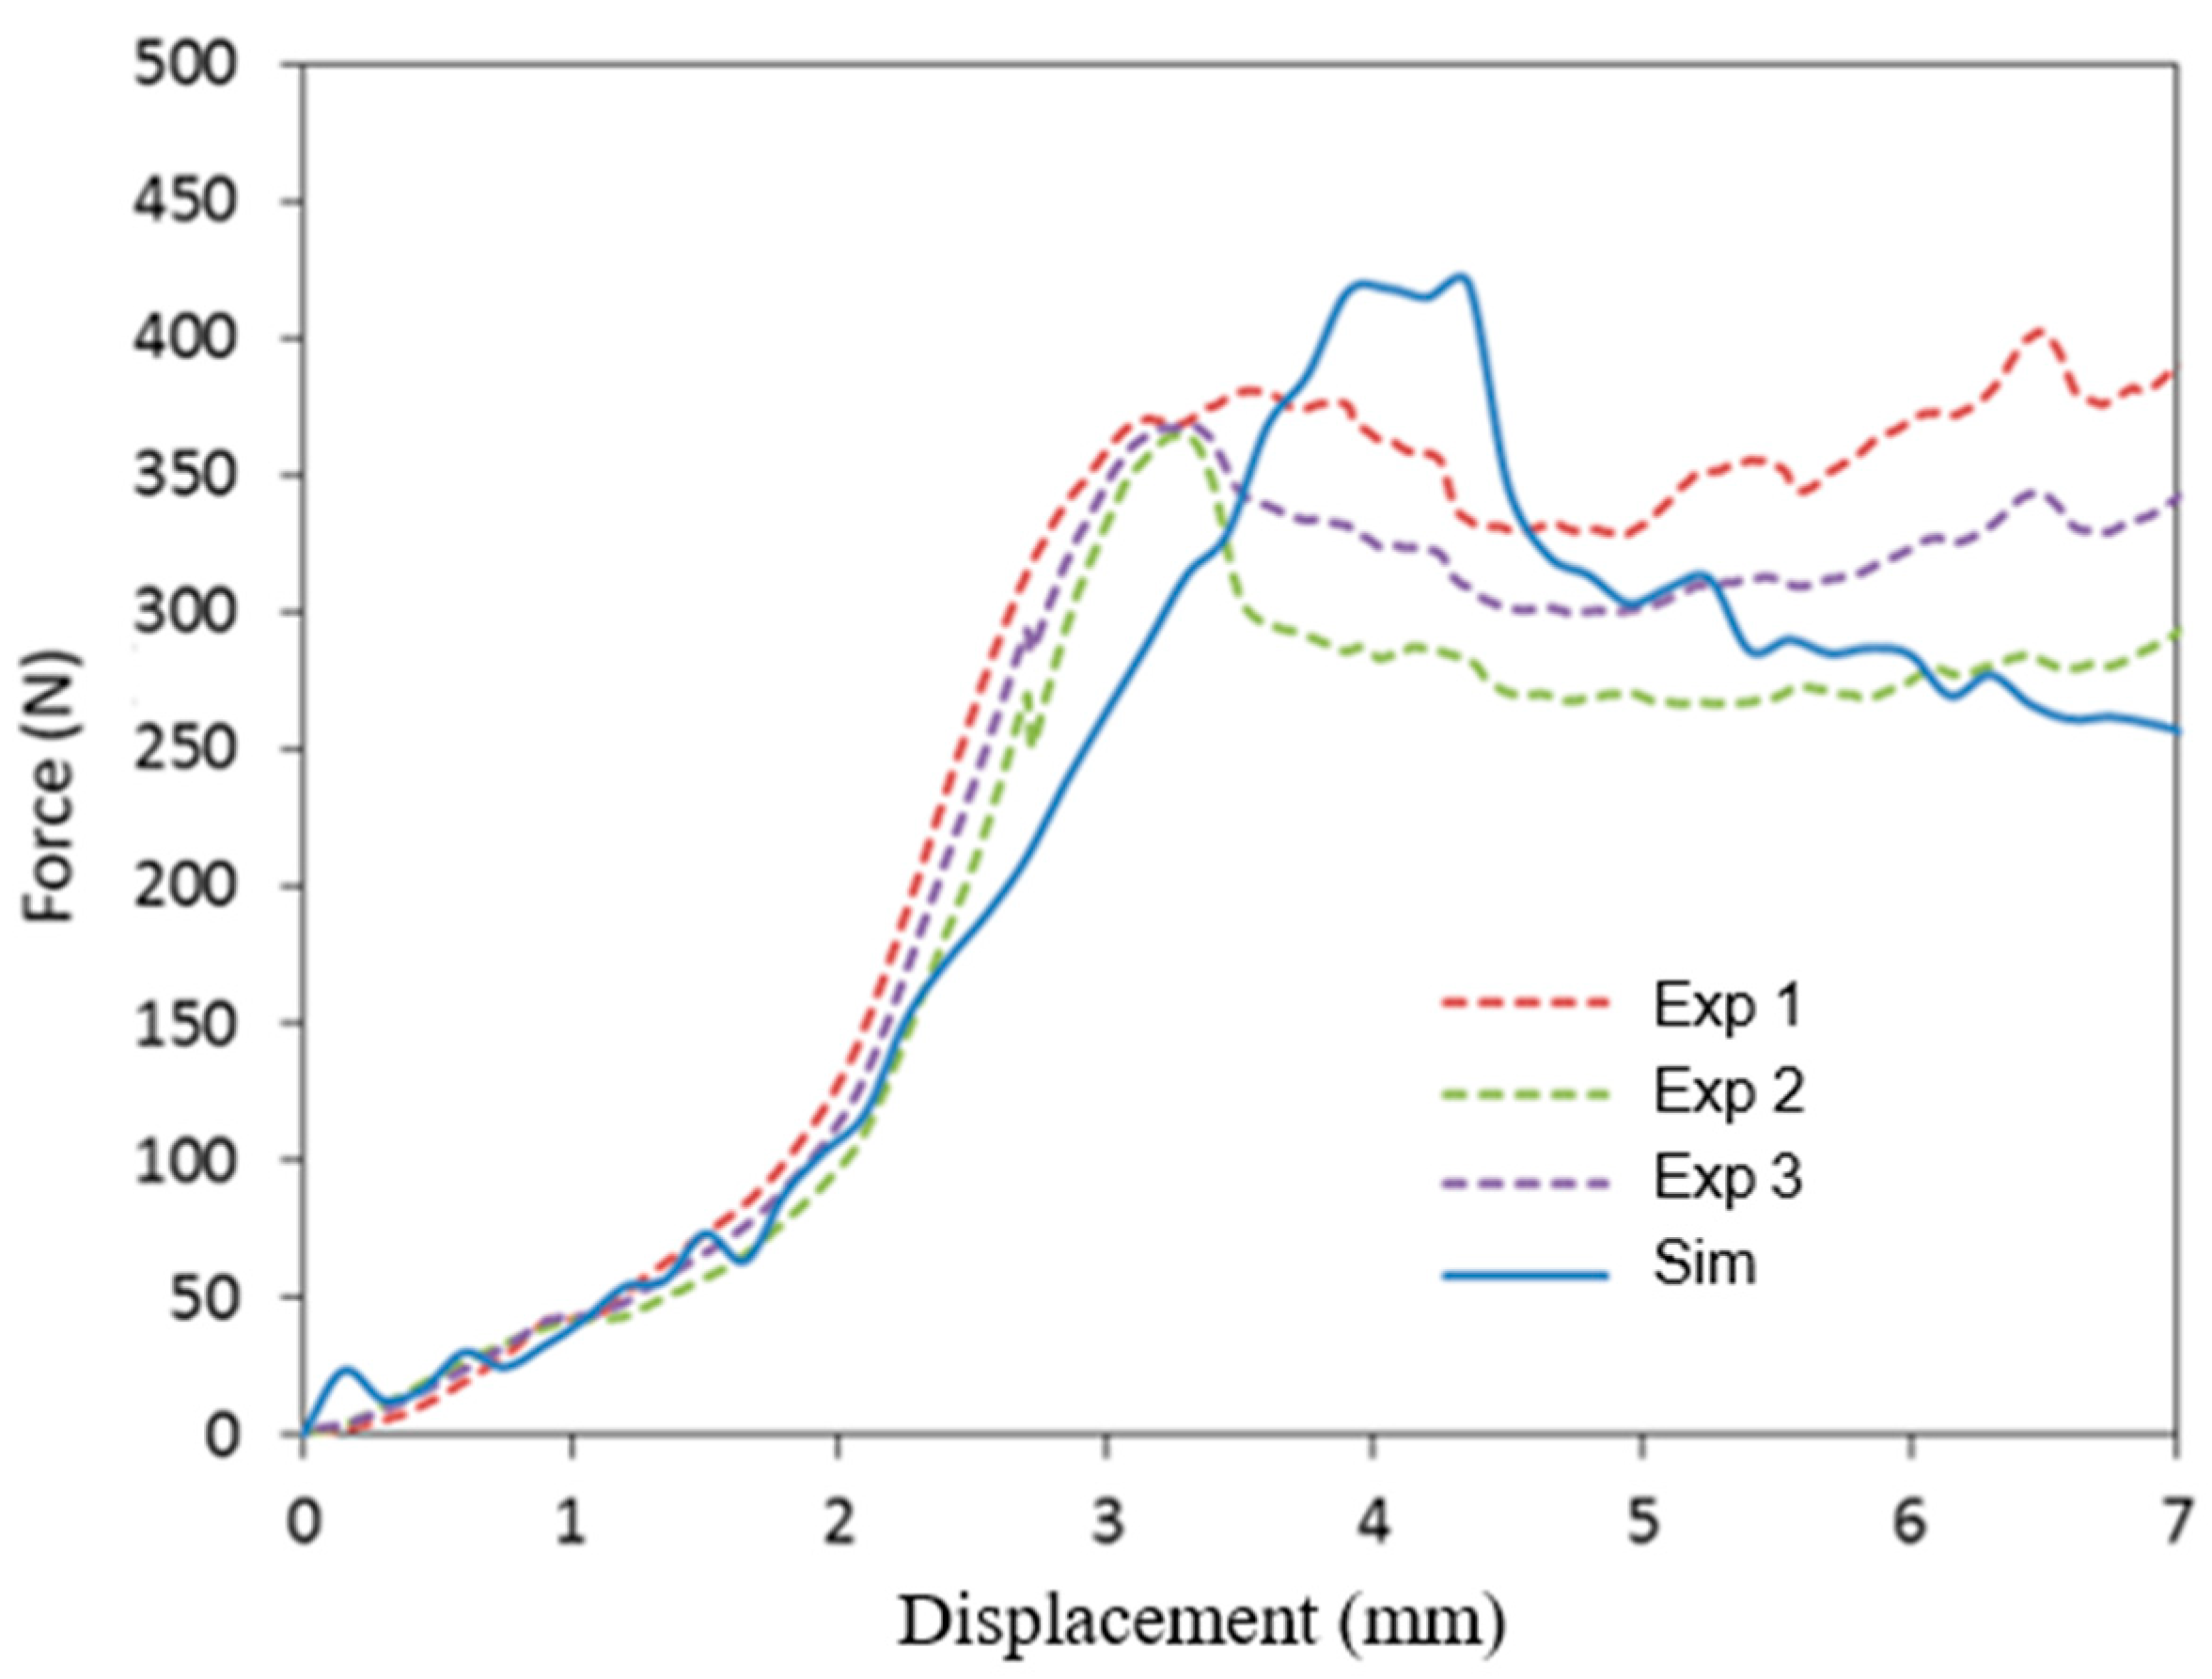
4.2. Simulation Experimental Compression

The element formulation used in this analysis was the S4R four-node reduced integration, hourglass control, finite membrane strains, and five Simpson integration points in the thickness direction [48]. The mesh size was 1 mm for the panels and flaps; and six elements were used along the circumference of the creases, as determined in our previous work [49]. The tied constraint option was used between the top flaps, the bottom flaps, the panels, the gluing tab, and the bottom flap. The box was placed between two rigid plates to simulate the longitudinal compression force. The surface-to-surface contact conditions were applied between the rigid plates and the package. The coefficient of friction between the box and the plates was set to 0.1. We performed a sensitivity study on the coefficient of friction and found that its influence is not significant regarding the prediction of the BCT strength. The lower rigid plate was fixed, while the upper one moved at a rate of 10 mm/min (Figure 13). Two types of simulation were carried out, with the boxes oriented such that the compression axis was in the machine direction (MD) for Case 1 and in the cross direction (CD) for Case 2, respectively.
Figure 14 and Figure 15 compare the experimental and numerical results of the longitudinal compression curves for the MD- and CD-oriented boxes, respectively. The numerical curves agree with the experimental curves and the difference between the BCT strength values is about 11%. We found that the deformations were concentrated in narrow regions along the corners. The maximum stress obtained on the MD-oriented box ( σ m a x = 79.5 MPa) was higher than the maximum stress on the CD-oriented box ( σ m a x = 59.0 MPa). As the paperboard is stiffer in MD, the stresses are larger in MD than in CD. Marin et al. [47] obtained similar results by using an orthotropic linear elastic material model with a stress-based failure criterion in the FE solver LS-Dyna. In their results, the initial nonlinear part was not accounted for in the FE simulations, and their curves exhibited a close to linear force–compression response until the first peak. However, while the experimental curve continued to increase, the simulations collapsed after the second peak in accordance with their model that captured local in-plane failure in the elements close to the yield line.

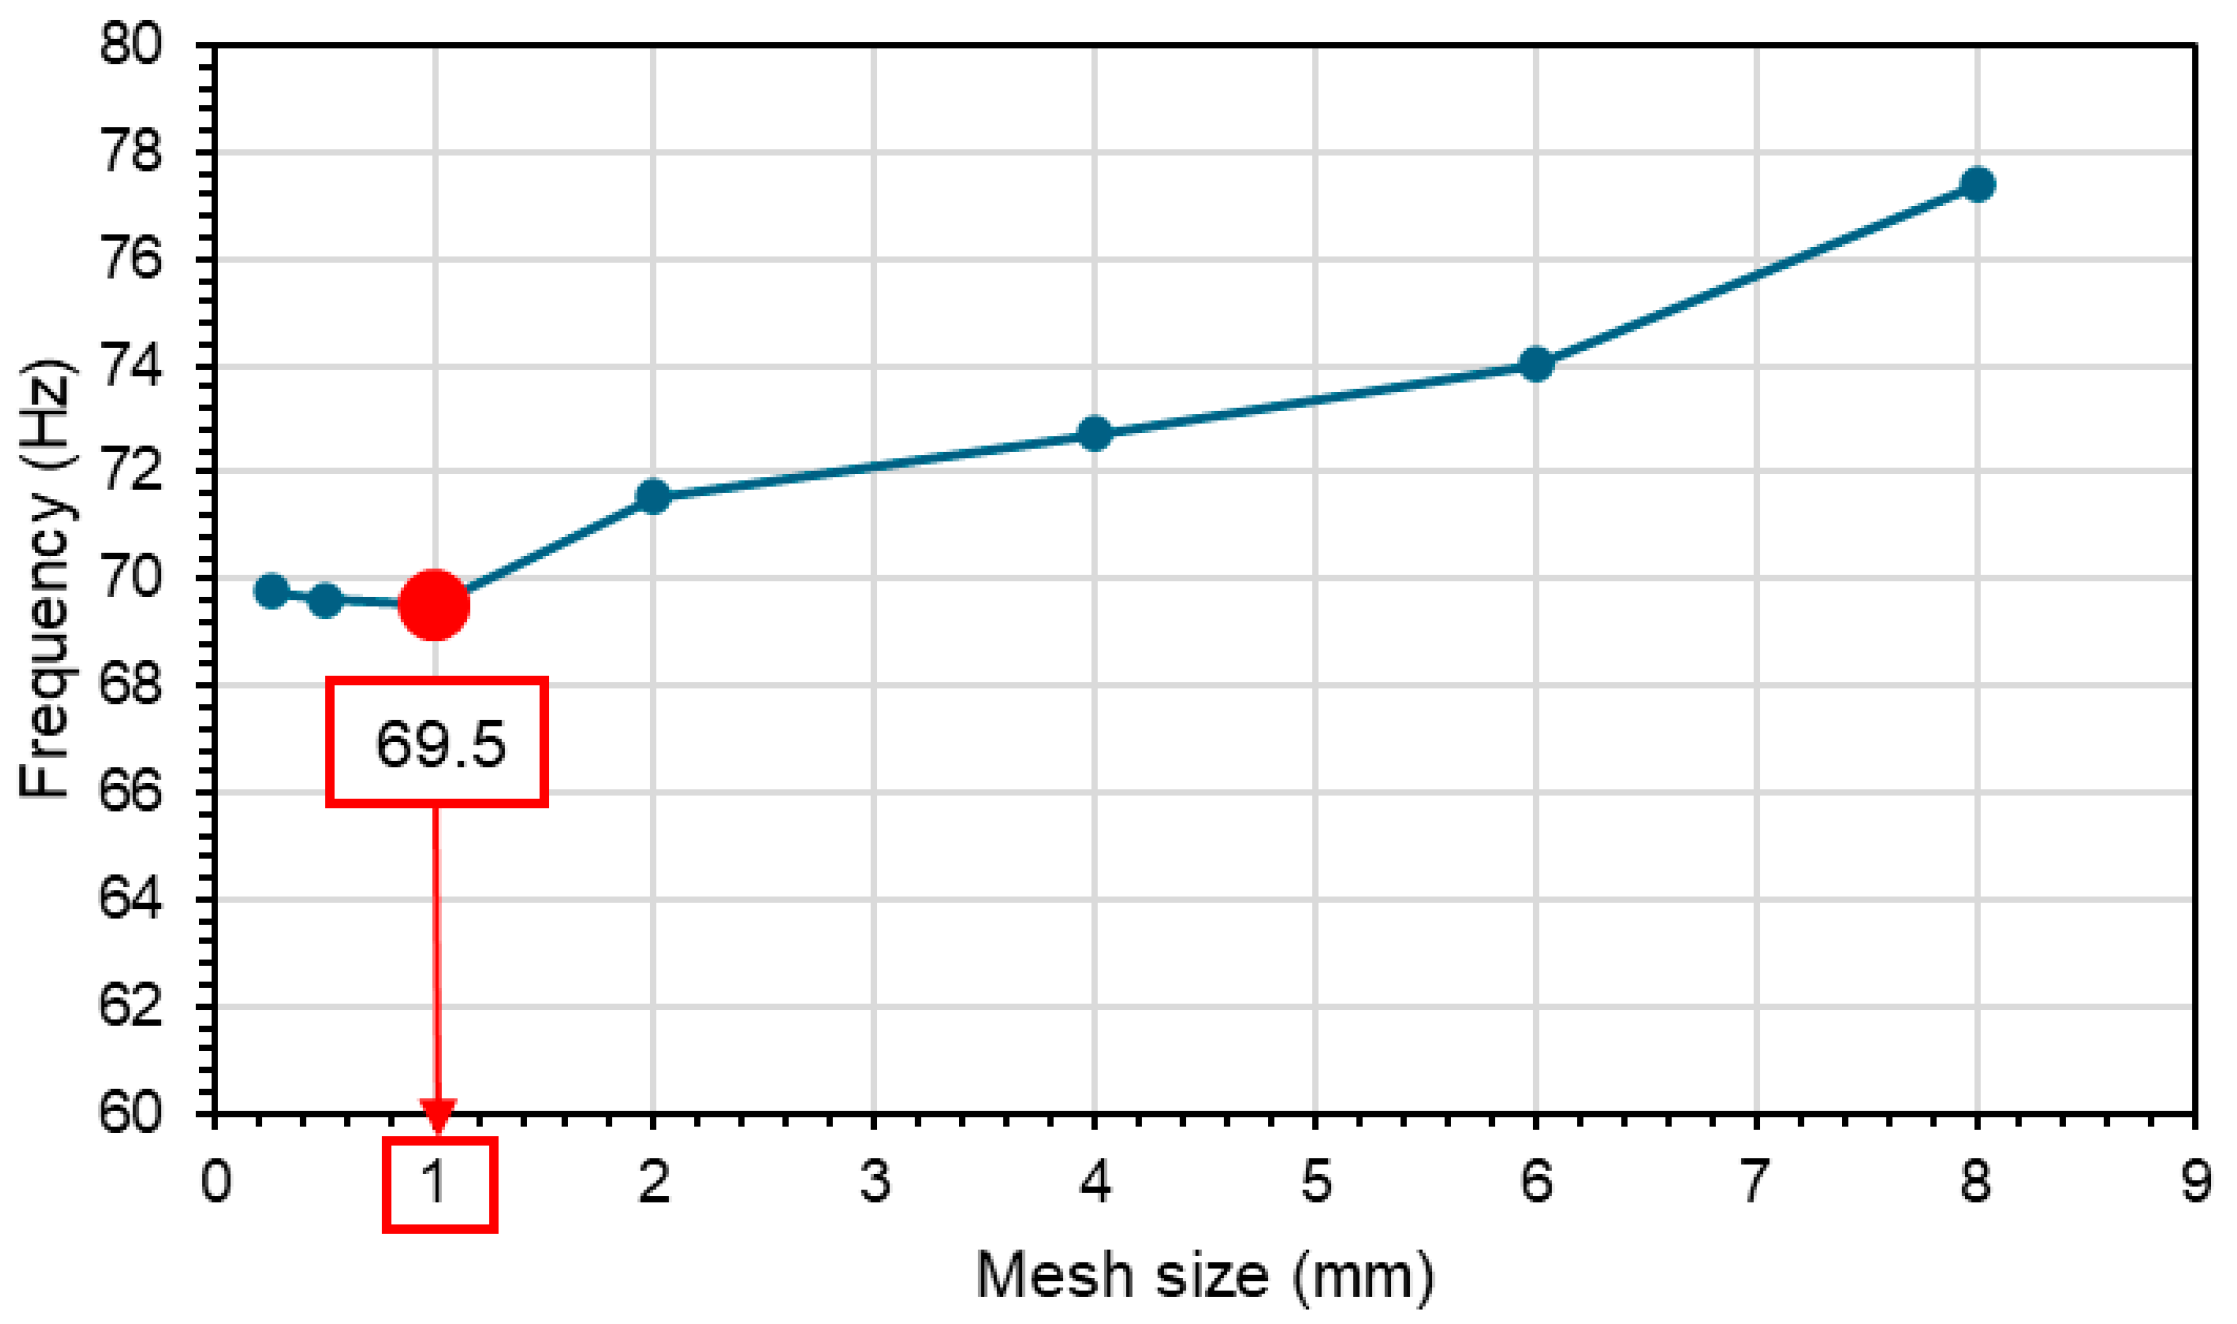
4.3. Vibration Test Simulation

The numerical model of the random vibration test was validated by comparing the numerical and experimental results. The box was meshed with 95,135 reduced-integration four-node shell elements (S4R) containing a total of 95,981 nodes. Shell elements are used to model structures in which one dimension, the thickness in the present study, is significantly smaller than the other dimensions. They are widely used for industrial applications [49]. The S4R element uses a reduced integration rule with one integration point that makes this element computationally less expensive than the S4 element, which uses a normal integration rule with four integration points [50].
A mesh sensitivity analysis was conducted to see how the simulation results vary with mesh element size. The analysis was conducted by changing the element size with a mesh size control of 8 mm, 6 mm, 4 mm, 2 mm, 1 mm, 0.5 mm, and 0.25 mm. The natural frequency obtained was then plotted against the mesh size in Figure 16, indicating that, for a mesh size lower than 1 mm, the natural frequency varies very little with the subsequent mesh size.
To simulate the vibration test, two rigid plates were glued to a compact cardboard box: one on the upper side and the other on the lower side. The reference point of the lower plate was fixed and the upper plate with a mass of M = 1.41 kg was free to move vertically (Figure 17). The effect of gravity was enabled to account for the pressure exerted by the upper plate on the box. Frequency analysis (Abaqus/Frequency) was performed, followed by random vibration analysis (Abaqus/Random Response). The input PSD applied to the system was the same as that of the experimental test as shown in Figure 17.
Figure 18 shows the comparison of the PSD response of the mass/box system, submitted to PSD input given in Figure 17, obtained by numerical simulation with the responses obtained experimentally for three measurements. This frequency distribution response provides useful information and shows the frequency response of a box with the first mode at f = 66.5 Hz . The PSD response ramps up near the natural or resonance frequency and gradually drops off as one moves away from it. The numerical natural frequency obtained is in very good agreement with the values obtained by the experimental tests described in Section 3.3, where f = 68.47 ± 1.55 Hz . Wang et al. [51] obtained similar trends in their experimental investigation of the mechanical damage in ‘Huangguan’ pears under random vibration excitation considering different packaging by using limited white noise with the frequency 3–80 Hz as the excitation spectrum.

5. Conclusions

In this paper, a FE model was developed to predict cardboard box behavior under static and dynamic conditions with adequate accuracy.
Firstly, the BCT strength was determined by running a nonlinear elastoplastic static analysis. The proposed model was validated using the experimental results from the static compression tests. It has been shown that it is possible to predict the box compression strength and the nonlinear stiffness response prior to the peak. The results obtained showed that the durability of cardboard boxes in MD and CD directions was different due to the paperboard’s higher rigidity in the MD direction.
Secondly, a random vibration test was performed, which determined the resonance frequency of the box. The box was subjected to random white noise vibrations with a constant power spectral density (PSD) of 0.0001 g2/Hz, over a frequency range of 3 Hz to 200 Hz. The frequency distribution response provided useful information and showed the frequency response of the box that ramps up near the resonance frequency and gradually drops off as one moves away from it. The numerical natural frequency obtained was in very good agreement with the values obtained by experiments.
The proposed method can be used to design alternative packaging that can be verified regarding its resistance to static and dynamic generic loading conditions. Regarding the random vibration response, the packaging can be optimized to reduce or increase the resonance frequency, depending on the packed product and the loading conditions, by changing the paperboard material or the geometry of the box. Furthermore, the dynamic numerical method uses frequency domain analysis that does not require computationally expensive time domain analysis to determine the resonance frequency.

Author Contributions

Conceptualization, F.A. and B.A.; Investigation, B.A. and V.D.L.; Methodology L.T.D. and P.T.M.D.; Resources, V.D.L. and B.A.; Software, V.D.L. and L.T.D.; Supervision, V.D.L. and B.A.; Validation, V.D.L. and L.T.D.; Writing—original draft, V.D.L. and B.A.; Writing—review and editing, V.D.L. and B.A. All authors have read and agreed to the published version of the manuscript.

Funding

This research was funded by the Ministry of Education and Training Vietnam grant number B2023-TNA-20. And The APC was funded by the Ministry of Education and Training Vietnam.

Data Availability Statement

All data used to support the findings of this study are included within the article.

Acknowledgments

We acknowledge the Ministry of Education and Training Vietnam for the funding.

Conflicts of Interest

The authors declare no conflicts of interest.

References

  1. Carlsson, L.; De Ruvo, A.; Fellers, C. Bending properties of creased zones of paperboard related to interlaminar defects. J. Mater. Sci. 1983, 18, 1365–1373. [Google Scholar] [CrossRef]
  2. Carlsson, L.; Fellers, C.; De Ruvo, A. The mechanism of failure in bending of paperboard. J. Mater. Sci. 1980, 15, 2636–2642. [Google Scholar] [CrossRef]
  3. Cavlin, S. The unique convertibility of paperboard. Packag. Technol. Sci. 1988, 1, 77–92. [Google Scholar] [CrossRef]
  4. Edholm, B. Bending stiffness loss of paperboard at conversion—Predicting the bending ability of paperboard. Packag. Technol. Sci. Int. J. 1998, 11, 131–140. [Google Scholar] [CrossRef]
  5. Giampieri, A.; Perego, U.; Borsari, R. A constitutive model for the mechanical response of the folding of creased paperboard. Int. J. Solids Struct. 2011, 48, 2275–2287. [Google Scholar] [CrossRef]
  6. Cavlin, S.; Dunder, I.; Edholm, B. Creasability testing by inclined rules—A base for standardized specification of paperboard. Packag. Technol. Sci. Int. J. 1997, 10, 191–207. [Google Scholar] [CrossRef]
  7. Nygårds, M.; Just, M.; Tryding, J. Experimental and numerical studies of creasing of paperboard. Int. J. Solids Struct. 2009, 46, 2493–2505. [Google Scholar] [CrossRef]
  8. Beex, L.; Peerlings, R. An experimental and computational study of laminated paperboard creasing and folding. Int. J. Solids Struct. 2009, 46, 4192–4207. [Google Scholar] [CrossRef]
  9. Amigo, J.C. Stiffness Design of Paperboard Packages Using the Finite Element Method. Master‘s Thesis, KTH Royal Institute of Technology, Stockholm, Sweden, 2012. [Google Scholar]
  10. Fadiji, T.; Ambaw, A.; Coetzee, C.J.; Berry, T.M.; Opara, U.L. Application of finite element analysis to predict the mechanical strength of ventilated corrugated paperboard packaging for handling fresh produce. Biosyst. Eng. 2018, 174, 260–281. [Google Scholar] [CrossRef]
  11. Viguié, J.; Dumont, P.J.; Desloges, I. Mauret. Some experimental aspects of the compression behaviour of boxes made up of g-flute corrugated boards. Packag. Technol. Sci. Int. J. 2010, 23, 69–89. [Google Scholar] [CrossRef]
  12. Haidar, M. Modelling of Failure Mechanisms for Corrugated Board. Master’s Thesis, KTH Royal Institute of Technology, Stockholm, Sweden, 2015. [Google Scholar]
  13. Rodrigues, D.F.; Pereira, J.C. Experimental tests and numerical simulations for failure investigation on corrugated boxes used on house- hold appliance packaging. J. Appl. Packag. Res. 2018, 10, 6. [Google Scholar]
  14. Biancolini, M.; Brutti, C. Numerical and experimental investigation of the strength of corrugated board packages. Packag. Technol. Sci. Int. J. 2003, 16, 47–60. [Google Scholar] [CrossRef]
  15. Kwak, W. Analysis of Compression Strength of Corrugated Shipping Containers with Different Designed Hand Holes. Master’s Thesis, Rochester Institute of Technology, Rochester, NY, USA, 2010. [Google Scholar]
  16. Lamb, M.J.; Rouillard, V. Static and dynamic strength of paperboard containers subjected to variations in climatic conditions. Packag. Technol. Sci. 2017, 30, 103–114. [Google Scholar] [CrossRef]
  17. Thorpe, J.L.; Choi, D. Corrugated container failure. II: Strain measurements in laboratory compression tests. Tappi J. 1992, 75, 155–161. [Google Scholar]
  18. Viguié, J.; Dumont, P.J.; Vacher, P.; Org, L.; Desloges, I.; Mauret, E. Analysis of the strain and stress fields of cardboard box during compression by 3D digital image correlation. Appl. Mech. Mater. 2010, 24, 103–108. [Google Scholar] [CrossRef]
  19. Jarimopas, B.; Singh, S.P.; Saengnil, W. Measurement and analysis of truck transport vibration levels and damage to packaged tangerines during transit. Packag. Technol. Sci. Int. J. 2005, 18, 179–188. [Google Scholar] [CrossRef]
  20. Singh, S.P.; Sandhu, A.; Singh, J.; Joneson, E. Measurement and analysis of truck and rail shipping environment in India. Packag. Technol. Sci. Int. J. 2007, 20, 381–392. [Google Scholar] [CrossRef]
  21. Rissi, G.O.; Singh, S.P.; Burgess, G.; Singh, J. Measurement and analysis of truck transport environment in Brazil. Packag. Technol. Sci. Int. J. 2008, 21, 231–246. [Google Scholar] [CrossRef]
  22. Garcia-Romeu-Martinez, M.-A.; Singh, S.P.; Cloquell-Ballester, V.-A. Measurement and analysis of vibration levels for truck transport in Spain as a function of payload, suspension and speed. Packag. Technol. Sci. Int. J. 2008, 21, 439–451. [Google Scholar] [CrossRef]
  23. Böröcz, P.; Singh, S.P. Measurement and analysis of vibration levels in rail transport in central Europe. Packag. Technol. Sci. 2017, 30, 361–371. [Google Scholar] [CrossRef]
  24. Paternoster, A.; Vanlanduit, S.; Springael, J.; Braet, J. Vibration and shock analysis of specific events during truck and train transport of food products. Food Packag. Shelf Life 2018, 15, 95–104. [Google Scholar] [CrossRef]
  25. Paternoster, A.; Vanlanduit, S.; Springael, J.; Braet, J. Measurement and analysis of vibration and shock levels for truck transport in Belgium with respect to packaged beer during transit. Food Packag. Shelf Life 2018, 15, 134–143. [Google Scholar] [CrossRef]
  26. Fadiji, T.; Coetzee, C.; Chen, L.; Chukwu, O.; Opara, U.L. Susceptibility of apples to bruising inside ventilated corrugated paperboard packages during simulated transport damage. Postharvest Biol. Technol. 2016, 118, 111–119. [Google Scholar] [CrossRef]
  27. Fernando, I.; Fei, J.; Stanley, R.; Rouillard, V. Evaluating packaging performance for bananas under simulated vibration. Food Packag. Shelf Life 2020, 23, 100428. [Google Scholar] [CrossRef]
  28. Guo, Y.; Xu, W.; Fu, Y.; Zhang, W. Comparison studies on dynamic packaging properties of corrugated paperboard pads. Engineering 2010, 2, 378. [Google Scholar] [CrossRef]
  29. Zhang, Q.; Saito, K.; Nagaoka, K. Damping package design using structural corrugated board. J. Appl. Packag. Res. 2017, 9, 19–33. [Google Scholar]
  30. Marcondes, J.; Batt, G. Update on dynamic compression measurement and testing. In Proceedings of Dimensions 2003 Conference (pp. 1–10). International Safe Transit Association (ISTA) and Institute of Packaging Professionals (IoPP). Available online: https://paperzz.com/doc/7932764 (accessed on 29 April 2025).
  31. Roberts, J.B.; Spanos, P.D. Random Vibration and Statistical Linearization; Courier Corporation: North Chelmsford, MA, USA, 2003. [Google Scholar]
  32. Beranek, L.; Mellow, T. Acoustics: Sound Fields, Transducers and Vibration; Academic Press: Cambridge, MA, USA, 2019. [Google Scholar]
  33. Materazzi, A.L.; Breccolotti, M. Stochastic Analysis of Nonlinear Systems. In Encyclopedia of Earthquake Engineering; Beer, M., Kougioumtzoglou, I., Patelli, E., Au, I.K., Eds.; Springer: Berlin/Heidelberg, Germany, 2014. [Google Scholar]
  34. Norouzi, M. Random vibration Monte Carlo simulation using multiple harmonic function schemes. Int. J. Veh. Noise Vib. 2014, 10, 214–225. [Google Scholar] [CrossRef]
  35. Chang, T.P.; Chang, H.C.; Liu, M.F. A finite element analysis on random vibration of nonlinear shell structures. J. Sound Vib. 2006, 291, 240–257. [Google Scholar] [CrossRef]
  36. Kamiński, M. Uncertainty analysis in solid mechanics with uniform and triangular distributions using stochastic perturbation-based Finite Element Method. Finite Elem. Anal. Des. 2022, 200, 103648. [Google Scholar] [CrossRef]
  37. Do, N.T.; Tran, T.T. Random vibration analysis of FGM plates subjected to moving load using a refined stochastic finite element method. Def. Technol. 2024, 34, 42–56. [Google Scholar] [CrossRef]
  38. Mrówczyński, D.; Gajewski, T.; Garbowski, T. A simplified dynamic strength analysis of cardboard packaging subjected to transport loads. Materials 2023, 16, 5131. [Google Scholar] [CrossRef] [PubMed]
  39. Wan, Z.; Liu, Y.; Chen, X.; Wu, H.; Yin, F.; Gao, R.; Li, Y.; Zhao, T. Experimental and numerical investigations of the vibration and acoustic properties of corrugated sandwich composite panels. Appl. Sci. 2022, 12, 8553. [Google Scholar] [CrossRef]
  40. Wang, L.J.; Lai, Y.Z.; Wang, Z.W. Fatigue failure and Grms–N curve of corrugated paperboard box. J. Vib. Control. 2020, 26, 793–803. [Google Scholar] [CrossRef]
  41. Wang, L.J.; Wang, Z.W. FEM verification of accelerated vibration test method based on Grms–N curve. J. Mech. Sci. Technol. 2022, 36, 1703–1712. [Google Scholar] [CrossRef]
  42. Broch, J.T.; Courrech, J. Mechanical Vibration and Shock Measurements; Bruël & Kjaer: Nærum, Denmark, 1980. [Google Scholar]
  43. Mäkelä, P.; Östlund, S. Orthotropic elastic–plastic material model for paper materials. Int. J. Solids Struct. 2003, 40, 5599–5620. [Google Scholar] [CrossRef]
  44. Karafillis, A.; Boyce, M. A general anisotropic yield criterion using bounds and a transformation weighting tensor. J. Mech. Phys. Solids 1993, 41, 1859–1886. [Google Scholar] [CrossRef]
  45. Frank, B. Corrugated box compression—A literature survey. Packag. Technol. Sci. 2014, 27, 105–128. [Google Scholar] [CrossRef]
  46. Gudavicius, D. Finite Element Analysis of E-Commerce Corrugated Board Cushioning. Master’s Thesis, KTH Royal Institute of Technology, Stockholm, Sweden, 2018. [Google Scholar]
  47. Marin, G.; Srinivasa, P.; Nygårds, M.; Östlund, S. Experimental and finite element simulated box compression tests on paperboard packages at different moisture levels. Packag. Technol. Sci. 2021, 34, 229–243. [Google Scholar] [CrossRef]
  48. ABAQUS 2019; ABAQUS Documentation; Dassault Systèmes: Providence, RI, USA, 2019.
  49. Luong, V.D.; Abbès, B.; Abbès, F.; Nolot, J.B.; Erre, D. Experimental Characterisation and Finite Element Modelling of Paperboard for the Design of Paperboard Packaging. IOP Conf. Ser. Mater. Sci. Eng. 2019, 540, 012014. [Google Scholar] [CrossRef]
  50. Laulusa, A.; Bauchau, O.A.; Choi, J.Y.; Tan, V.B.C.; Li, L. Evaluation of some shear deformable shell elements. Int. J. Solids Struct. 2006, 43, 5033–5054. [Google Scholar] [CrossRef]
  51. Wang, L.J.; Zhang, Q.; Song, H.; Wang, Z.W. Mechanical damage of ‘Huangguan’ pear using different packaging under random vibration. Postharvest Biol. Technol. 2022, 187, 111847. [Google Scholar] [CrossRef]
Figure 1. Model of a single-degree-of-freedom system [42].
Vibration 08 00023 g001
Figure 2. Dimensions of the compact cardboard box.
Vibration 08 00023 g002
Figure 3. Setup of the compression test on a machine.
Vibration 08 00023 g003
Figure 4. Vertical compression curves for the boxes.
Vibration 08 00023 g004
Figure 5. Experimental setup: (a) SignalForce vibrating pot; (b) Accelerometer; (c) Vibration controller and dynamic signal analyzer.
Vibration 08 00023 g005
Figure 6. Experimental setup for the random oscillation experiment.
Vibration 08 00023 g006
Figure 7. Shaker input signal setting.
Vibration 08 00023 g007
Figure 8. PSD of the response of the compact cardboard box system.
Vibration 08 00023 g008
Figure 9. (a) Location of mechanical changes on the box; (b) Meshing of the edges.
Vibration 08 00023 g009
Figure 10. Identification by means of the inverse method.
Vibration 08 00023 g010
Figure 11. Force–displacement curves from tensile tests of paperboard.
Vibration 08 00023 g011
Figure 12. Experimental traction curves identified for cardboard.
Vibration 08 00023 g012
Figure 13. Boundary conditions for vertical compression of a cardboard box.
Vibration 08 00023 g013
Figure 14. Comparison of experimental and numerical results of the BCT strength of the box according to the MD.
Vibration 08 00023 g014
Figure 15. Comparison of experimental and numerical results of the BCT strength of the box according to the CD.
Vibration 08 00023 g015
Figure 16. Mesh sensitivity analysis.
Vibration 08 00023 g016
Figure 17. Boundary conditions of the random vibration test on the cardboard box.
Vibration 08 00023 g017
Figure 18. Comparison of experimental and numerical PSD responses of the mass/box system subjected to random vibrations.
Vibration 08 00023 g018
Table 1. BCT strength of the boxes.
BoxDirection MDDirection CD
BCT Strength (N)371.9 ± 7.6289.6 ± 15.5
Table 2. Parameters of the elastic model identified for cardboard.
Ex (MPa)Ey (MPa)νxyGxy (MPa)
371015590.361200
Table 3. Parameters of the IPE model identified for cardboard.
nabcdε0E0
2.311.02.042.481.080.0046301
Disclaimer/Publisher’s Note: The statements, opinions and data contained in all publications are solely those of the individual author(s) and contributor(s) and not of MDPI and/or the editor(s). MDPI and/or the editor(s) disclaim responsibility for any injury to people or property resulting from any ideas, methods, instructions or products referred to in the content.

