Article

Using Wearable Accelerometers to Develop a Vertical Ground Reaction Force Prediction Model during Running: A Sensitivity Study

by
Thomas Provot
1,2,*,
Samaneh Choupani
1,
Maxime Bourgain
1,2,
Laura Valdes-Tamayo
2 and
Delphine Chadefaux
3,4
1
EPF–Graduate School of Engineering, 55 Avenue du Président Wilson, 94230 Cachan, France
2
Arts et Métiers Institute of Technology, Institut de Biomécanique Humaine Georges Charpak, IBHGC, UR 4494, Université Sorbonne Paris Nord, 93000 Bobigny, France
3
Institut de Biomécanique Humaine Georges Charpak, Université Sorbonne Paris Nord, IBHGC, UR 4494, Arts et Métiers Institute of Technology, 75013 Paris, France
4
Département STAPS, Université Sorbonne Paris Nord, 93000 Bobigny, France
*
Author to whom correspondence should be addressed.
Vibration 2023, 6(3), 680-694; https://doi.org/10.3390/vibration6030042
Submission received: 26 July 2023 / Revised: 28 August 2023 / Accepted: 1 September 2023 / Published: 12 September 2023
(This article belongs to the Special Issue Vibrations in Sports)

Abstract

:
The estimation of vertical ground reaction forces (VGRFs) during running is necessary to understand running mechanisms. For this purpose, the use of force platforms is fundamental. However, to extend the study of VGRFs to real conditions, wearable accelerometers are a promising alternative to force platforms, whose use is often limited to the laboratory environment. The objective of this study was to develop a VGRF model using wearable accelerometers and a stepwise regression algorithm. Several models were developed and validated using the VGRFs and acceleration signals collected during 100 stances performed by one participant. The validated models were tested on eight participants. In a sensitivity study, the strongest correlations were observed at cut-off frequencies of ≤25 Hz and in models developed with 30 to 90 stances. After the validation phase, the 10 best models had, on average, low relative differences (≤10%) in the estimation of discrete VGRF parameters, i.e., the passive peak ( ε p p = 6.26 % ), active peak ( ε a p = 2.22 % ) , and loading rate ( ε l r = 2.17 % ). The results indicate that the development of personalized models is more suitable for achieving the best estimates. The proposed methodology opens many perspectives for monitoring VGRFs under real conditions using a limited number of wearable sensors.

1. Introduction

The use of force platform data is the gold standard for measuring ground reaction forces (GRFs). In running, their vertical component (VGRF) provides several indicators of interest for performance and injury studies. The passive peak is related to a particular running technique and is observed particularly in runners impacting the ground with the heel (i.e., rearfoot strikers) [1]. The active peak, which represents the maximum of the VGRF curve, is associated with the performance of the runner. Runners reach faster speeds when stronger vertical forces are applied to the ground [2]. Additionally, the loading rate, which represents the upward slope of the VGRF curve, is associated with the occurrence of tibial stress fractures when it is high [3,4]. However, force platforms are expensive and technically difficult to use in sport fields. Hence, wearable sensors, such as inertial sensors, are promising tools for collecting large amounts of data, allowing sports activity to be described in detail via the estimation of VGRF indicators during running. Moreover, these sensors can be used under real conditions, avoiding the constraints related to the simulated environments of studies performed in the laboratory [5].
For several years, the scientific community has been interested in the relationship between GRFs and wearable accelerometer signals during walking, running, and jumping [6,7,8,9,10]. With regards to walking, this relationship may allow the detection of muscle weakness in patients with osteogenesis imperfecta in their living conditions [6]. With regards to jumping, this relationship can be used to evaluate performance during sports training and conditioning in an ecologically valid environment rather than in a laboratory [9]. With regards to running, it has been shown that there are correlations between the value of the peak measured by an accelerometer located on the tibia and the loading rate or the amplitude of the passive peak during running [11]. Thus, the estimation of VGRFs during running using wearable sensors—particularly accelerometers—has become a subject of interest.
Several models, based on three main methodologies, have been proposed [12]. The first method uses Newton’s second law of motion: the acceleration of the center of mass is estimated by placing an accelerometer at the trunk [13,14]. Thus, acceleration is directly related to GRFs by the mass of the participant. Although this methodology allows the estimation of indicators such as the maximum peak [13] or step average force [14], it does not fully validate the shape of the estimated force curves. In addition, this method neglects the dynamic effects of the impact of the foot on the ground, which is the origin of the passive peak. The second method involves a mechanical mass–spring–damper model of the human body [15,16,17]. The objective is to estimate the acceleration of the model mass using an onboard accelerometer. Thus, the properties of the model can be determined, and the forces can be estimated. This method was used by Nedergaard et al. [18], who reported that while the model fit the measured mass acceleration well, the VGRF estimation accuracy was poor, as errors increased with the running speed. Although this type of model facilitates a physical interpretation of the relationship between acceleration and force, the results of the modelling do not allow the evaluation of effort under real running conditions. The third methodology involves statistical modelling, such as machine learning algorithms [19,20] or regression algorithms [8,21,22,23]. Using this method, Derie et al. [19] accurately estimated the vertical instantaneous loading rate measured via a force platform with two accelerometers located on the tibias. Seeley et al. [22] proposed a model involving different VGRF indicators (i.e., passive peak, active peak, and loading rate). Small errors were observed in these indicators. Ngoh et al. [20] proposed a complete VGRF model based on a neural network using a single axial accelerometer. Their results indicated that the VGRF was accurately estimated. Among the three methodologies, the statistical approach is the most promising. Although statistical modelling provides a physical description that is less detailed than the biomechanical model and does not consider all the subtleties of the body’s anatomy [12], it yields more accurate results than modelling based on Newton’s second law of motion or mass–spring–damper models. Moreover, statistical modelling can integrate information specific to the participant for personalization.
Nevertheless, numerous questions remain unanswered. To date, there is no consensus on the positioning of the sensors on the participant, although sensors located on the trunk appear to provide more relevant information for modelling the active peak [8,13,21] and those on the lower limbs appear to provide more relevant information for modelling the passive peak and the loading rate [19]. Furthermore, there is no agreement on the most suitable filtering method for accelerometers, even if frequencies remain below 50 Hz. The results of Wundersitz et al. [13] indicated that to achieve the most accurate estimates of the maximum peaks of VGRFs using an accelerometer positioned at the center of the upper back, a low-pass filter with a cut-off frequency of 10 Hz is needed to eliminate the unnecessary high frequencies (the typical estimation error was 11.7% for filtered acceleration and 16.4% for unfiltered acceleration). In a study by Derie et al. [19], which focused on the estimation of vertical instantaneous loading rates with two accelerometers located on the tibias, the choice was made to limit the effects of high frequencies and gravity bias by filtering the acceleration using a bandpass filter between 0.8 and 45 Hz. Finally, there is also no agreement on the amount of data needed to develop a reliable model. Indeed, while the study of Derie et al. [19] was based on a dataset of more than 4000 steps from more than 90 participants, Ngoh et al. [20] used 280 steps for training the model. Nevertheless, an important feature of this type of tool may be its ease of deployment in the field using the minimum amount of laboratory data.
In summary, the state of the literature shows that while statistical models are the most efficient for estimating VGRFs, there is little methodological information on either the optimal development or physical interpretation of the model. For this purpose, the objective of this study was to develop a specific and personalized model for predicting VGRFs via accelerometers placed on the trunk and lower limbs using a linear regression algorithm. Thus, a methodology was developed for evaluating the sensitivity of the model. It was hypothesized that (1) it is possible to model VGRFs using a small dataset size; (2) there is an optimal cut-off frequency for the low-pass filter applied to the data that maximizes the quality of the modelling; and (3) in a limited amateur population, a specific model will be able to estimate VGRFs for other runners.

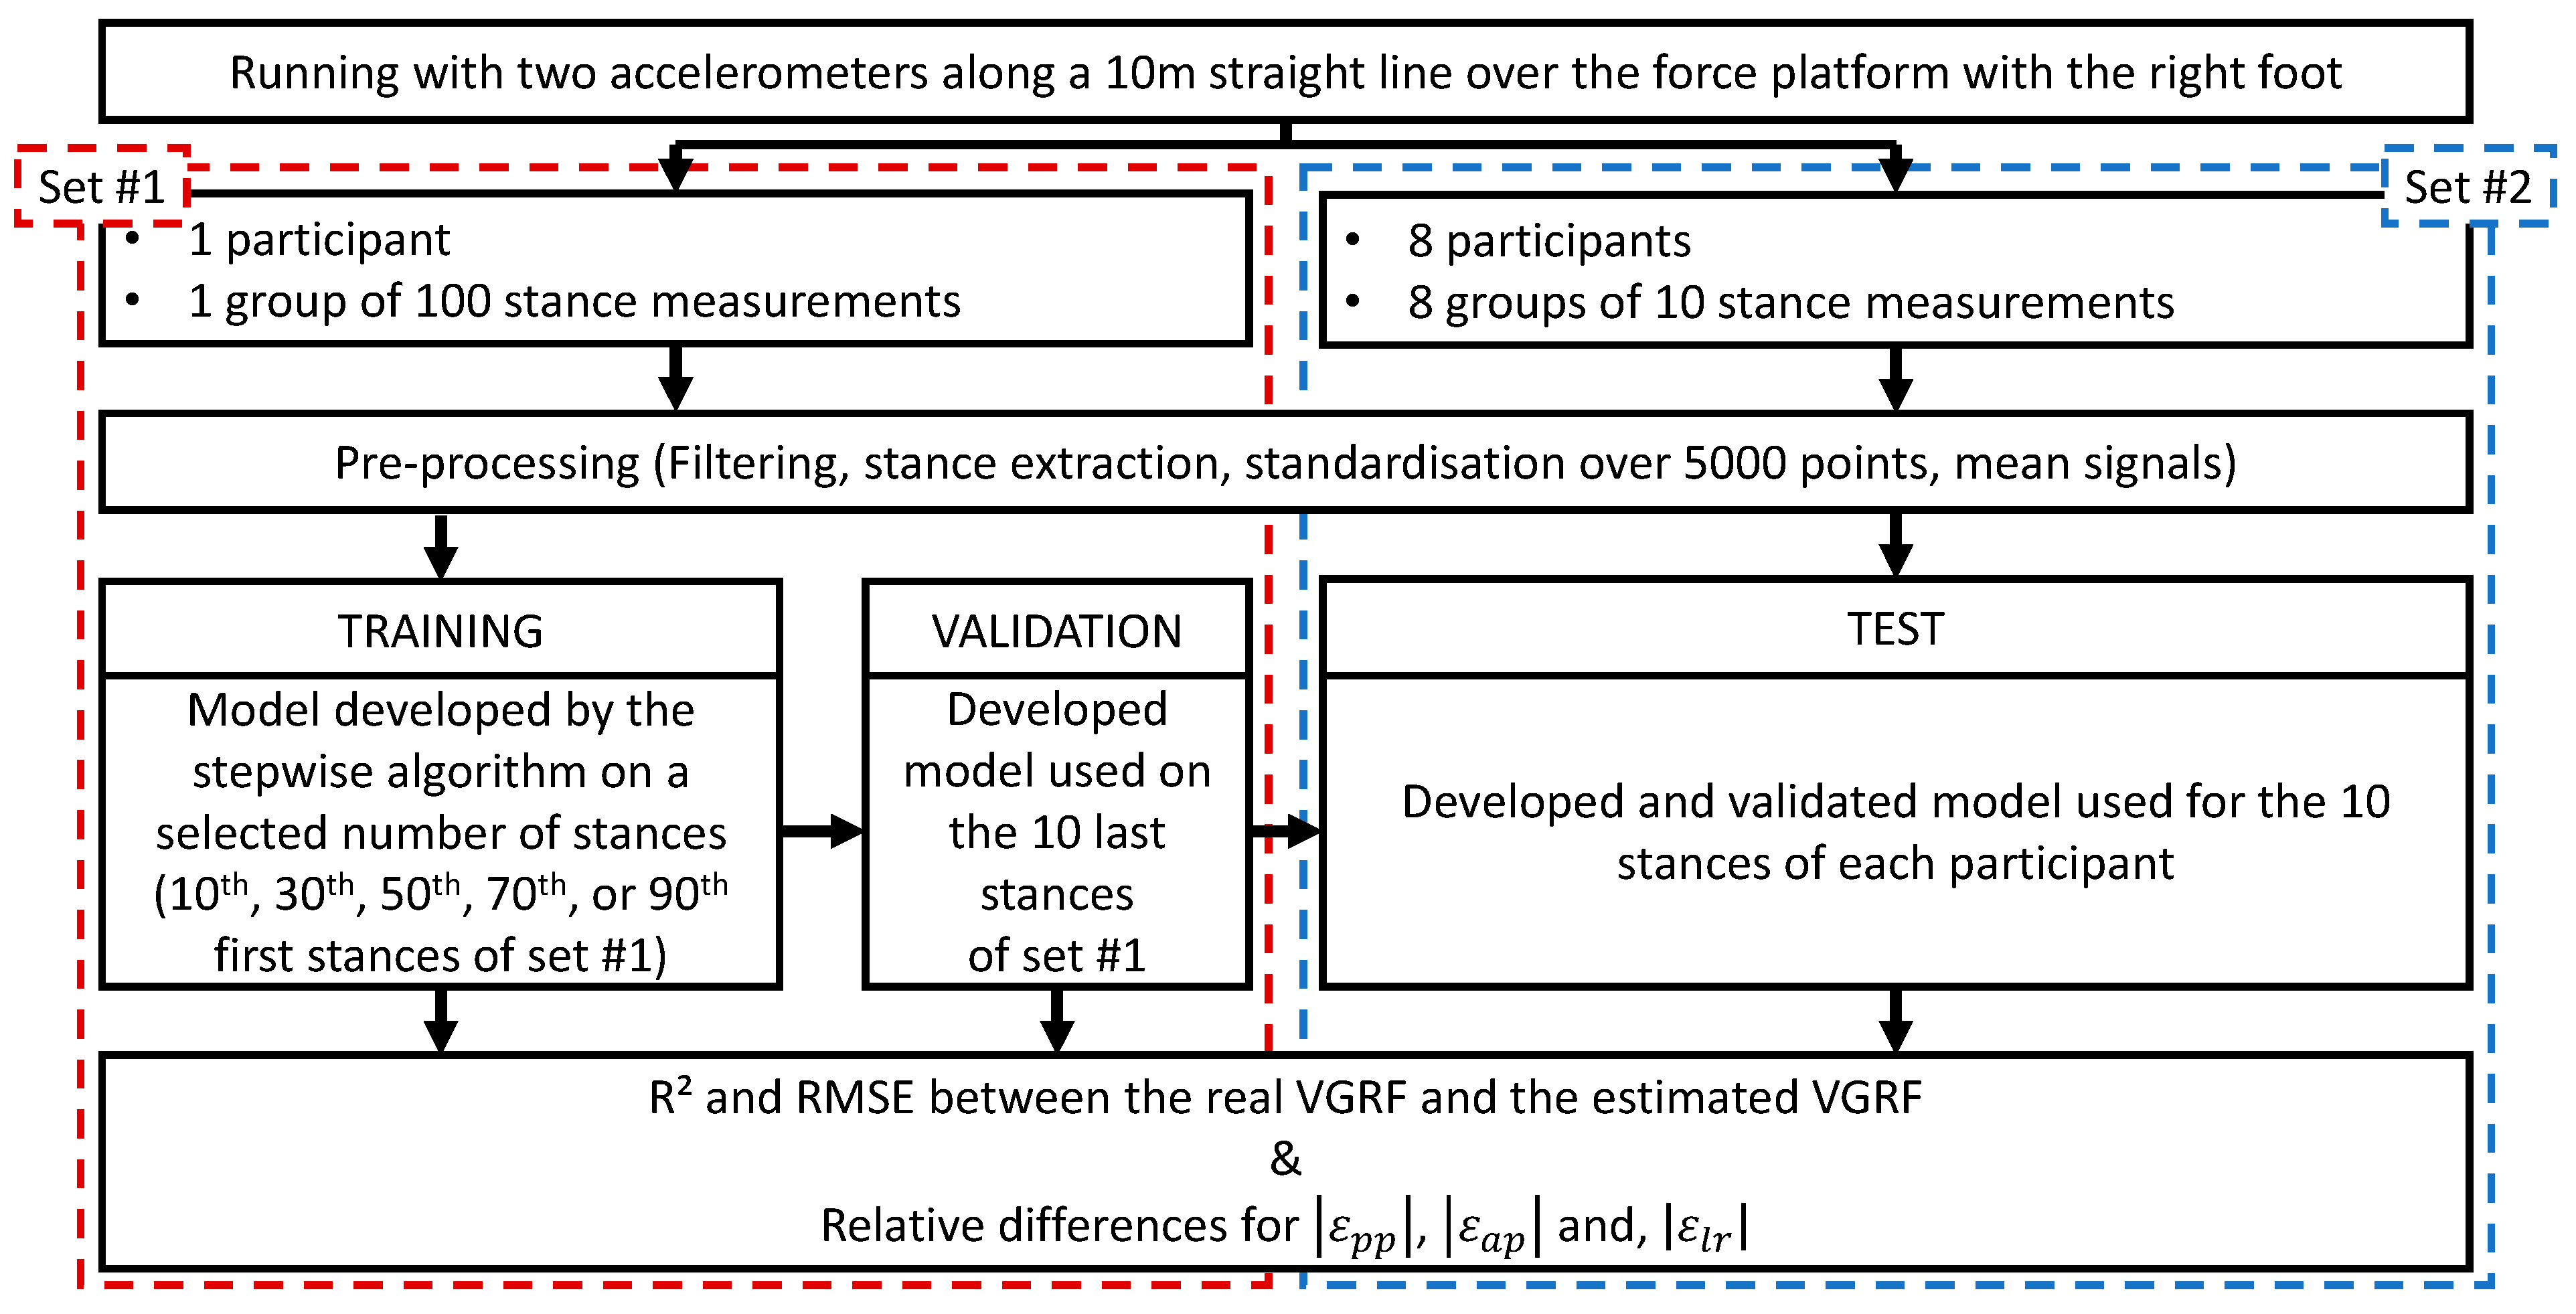
2. Materials and Methods

2.1. Participants

Nine runners without lower extremity injuries or pathologies volunteered for this study (5 females and 4 males; age: 23.4 ± 2.5 years; height: 175 ± 8 cm; mass: 68 ± 8 kg). The participants were recruited for recreational running without a particular competitive goal. They were asked to wear personal running shoes for the test. All subjects gave their informed consent for inclusion before they participated in the study. The study was conducted in accordance with the Declaration of Helsinki, and the protocol was approved by the local Research Ethics Committee prior to the initiation of the research.

2.2. Materials

VGRFs were measured using a triaxial force platform (OR6, AMTI, Watertown, MA, USA) at a sampling frequency of 1 kHz. The force platform was fixed at the middle of a 10 m straight line in the laboratory. Acceleration data were collected using two triaxial accelerometers connected to a wearable datalogger (S3-1000G-HA & MWX8, Biometrics Ltd., Ynysddu, UK) at a sampling frequency of 20 kHz. One of the accelerometers was mounted on the trunk, in the L4–L5 space of the lumbar spine, on the line between the two iliac crests, with one axis oriented along the longitudinal axis of the trunk. The second accelerometer was mounted on the distal extremity of the medial surface of the right tibia. One axis of this accelerometer was aligned with the longitudinal axis of the segment and directed upwards. The two accelerometers were fixed to the skin using adhesive tape and secured using an elastic band that was tightened to the limit of comfort. Both systems were connected to the hardware (Lock Lab, Vicon, Oxford, UK), and acquisitions were synchronized in the software (Nexus, Vicon, Oxford, UK) to record all data simultaneously.

2.3. Protocol

Participants were asked to run at a constant and self-selected comfortable speed along a 10 m straight line and to run over the force platform keeping their eyes forward. Before the measurement session, an unlimited warm-up period was provided to familiarize participants with the experimental context. Participants performed as many trials as needed to complete 10 successful trials per session, according to the task realization criteria (impact of the right foot against the platform, visually undisturbed running pattern, and successful measurement of forces). One participant participated in 10 sessions spread over 10 weeks (a total of 100 successful trials). The remaining eight participants participated in only one session (10 successful trials each).

2.4. Data Management

The data were divided into two datasets. The first set (set #1) was composed of data from the participant who completed 10 sessions (N = 100 trials). As the intra- and inter-test repeatability of these signals had been controlled and considered acceptable in a previous study [24], set #1 was considered as one group of 100 stance measurements. Set #1 was used to train and validate the proposed model. For this purpose, set #1 was divided into two groups dedicated to the training and validation phases. In the training phase, a stepwise regression algorithm was used to generate the VGRF equation using three-dimensional (3D) signals from the two accelerometers. In the validation phase, the equation generated during the training phase was used to estimate the VGRF from the accelerometric data.
The second set (set #2) comprised data from participants who completed only one session each. As the intra-subject repeatability of these signals had been controlled and considered acceptable in a previous study [24], set #2 was considered as eight groups of 10 stance measurements. This set was used to test the model (test phase) which had previously been trained and validated using set #1. In the test phase, the validated equation was used to estimate the VGRFs from the accelerometric data of other participants. This phase was applied to each participant with data from set #2 to study the possibility of using this specific model on a different population.

2.5. Pre-Processing

The data were pre-processed via the following four steps: First, only 3D accelerometer signals were passed through a low-pass filter with zero phase shift (resulting in a second order Butterworth filter) to match the frequency content observed in VGRF signals (signals which were not filtered) [25]. Different cut-off frequencies between 5 and 50 Hz (with steps of 5 Hz) were tested to study the sensitivity of the developed model to filtering during the training phase. Second, the stance phase during running was defined as the period between foot strike and foot-off. These events are commonly defined by VGRFs of >10 N on rising (foot strike) and <25 N on descending (foot-off) [26]. Thus, stance phase events were extracted from force platform signals, and then VGRFs and acceleration were segmented according to these events. In this study, the events were not determined on the accelerometers as it had been proposed in the literature [27,28], in order to avoid errors due to the detection of heel strike and toe-off. Third, as the stance duration differed among the trials, the signals were standardized to a uniform length of 5000 sample points (representing 100% of the stance). Fourth, as the intra- and inter-test repeatability of these signals had been controlled and considered acceptable in a previous study [24], the selected stance signals were averaged to extract the mean VGRF signal and six mean acceleration signals. To study the sensitivity of the developed model to the size of the training dataset, the models were developed using the mean signals of the 10th, 30th, 50th, 70th, or 90th first stance signals. During the validation phase, the developed model was applied to the mean of the last 10 stance signals. During the test phase, the validated model was applied to the mean of 10 stance signals per participant.

2.6. Model Development

A multiple stepwise regression algorithm (function stepwiselm, Matlab 2021b, Matworks, Natick, MA, USA) was used to model the VGRFs with six acceleration signals (i.e., three components per two accelerometers). Using a Fisher’s exact test, the algorithm selected or discarded accelerations according to their interdependence and significance in explaining the VGRF. The estimated vertical ground reaction force ( V G R F ^ ) was then expressed as a function (first order polynomial) of the different acceleration signals A j (with j = 1 to 6), weighted by the coefficients β j determined by the algorithm as presented in Equation (1):
V G R F ^ = β 0 + β 1 · A 1 + + β j · A j + β J · A J

2.7. Statistics and Model Validation

For all the phases, prediction quality was studied using the determination coefficient R 2 , and average error was represented as the root-mean-square error (RMSE). An extremely strong coefficient of determination was considered to be R 2 > 0.90 [29]. Moreover, to physically validate the estimated VGRF, three criteria were computed as absolute values: the relative difference between the real passive peak value and the estimated value at the same temporal (abscise) point ( ε p p   in %); the relative difference between the real active peak value and the estimated value at the same abscise point ( ε a p in %); and the relative difference between the real loading rate and the estimated loading rate at the same abscise point ( ε l r in %). Loading rate (considered as the vertical average loading rate in this study) was defined as the slope between the points representing 20% and 80% of the passive peak [4]. The relative differences were rated very low for ε i i < 5 % and low for 5 % < ε i i < 10 % [30]. A summary of the applied methodology is presented in Figure 1.

3. Results

3.1. General Results

For set #1, one participant completed 100 trials at an average speed of 3.36 ± 0.11 m/s. For set #2, eight participants completed 10 trials each at an average speed between 2.75 ± 0.06 and 3.39 ± 0.19 m/s (see Table 1 for details). Except for participant #7, the participants in set #2 ran slower than the participant in set #1 (based on a Wilcoxon statistical test, alpha set at 0.05). Participants #2 and #7 exhibited wider speed distributions than the other participants over the 10 trials.

3.2. Training Phase

Fifty VGRF models were developed to evaluate the performance of ten filtering conditions and five stance numbers. For each modelling condition, Table 2 presents the resulting coefficients of determination, which reflect the quality of the VGRF predictions obtained from the acceleration signals. Forty-seven models exhibited extremely strong coefficients of determination. The strongest correlation ( R 2 = 0.992 ) was observed at cut-off frequencies between 20 and 30 Hz using 50 stances. Filtering above 30 Hz led to lower correlations.
A summary of the results of the training phases is presented in Appendix A (Table A1). For the models with the strongest correlation, the RMSE was <0.07 BW (i.e., <50 N). Of the fifty models developed, twenty-two exhibited low relative differences (±10%) for the passive peak, active peak, and loading rate ( ε p p ,   ε a p , and ε l r , respectively), and only three exhibited very low relative differences (±5%). Figure 2 shows the worst and best model outputs.

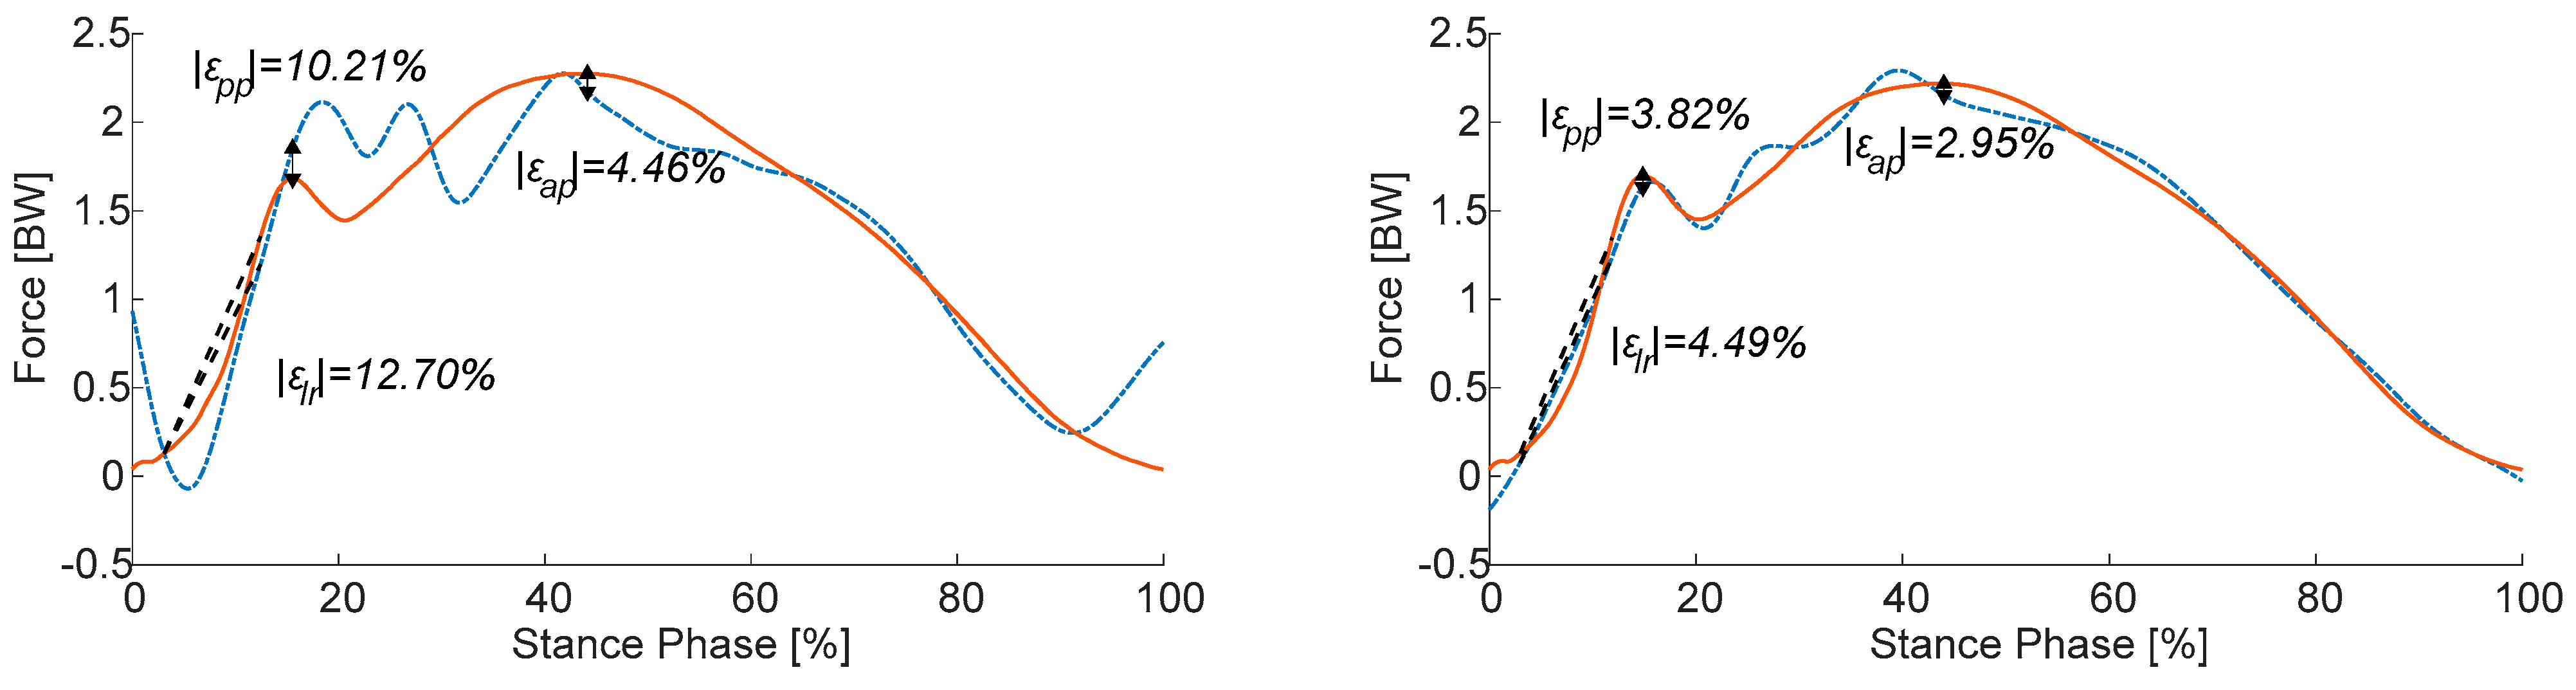
3.3. Validation Phase
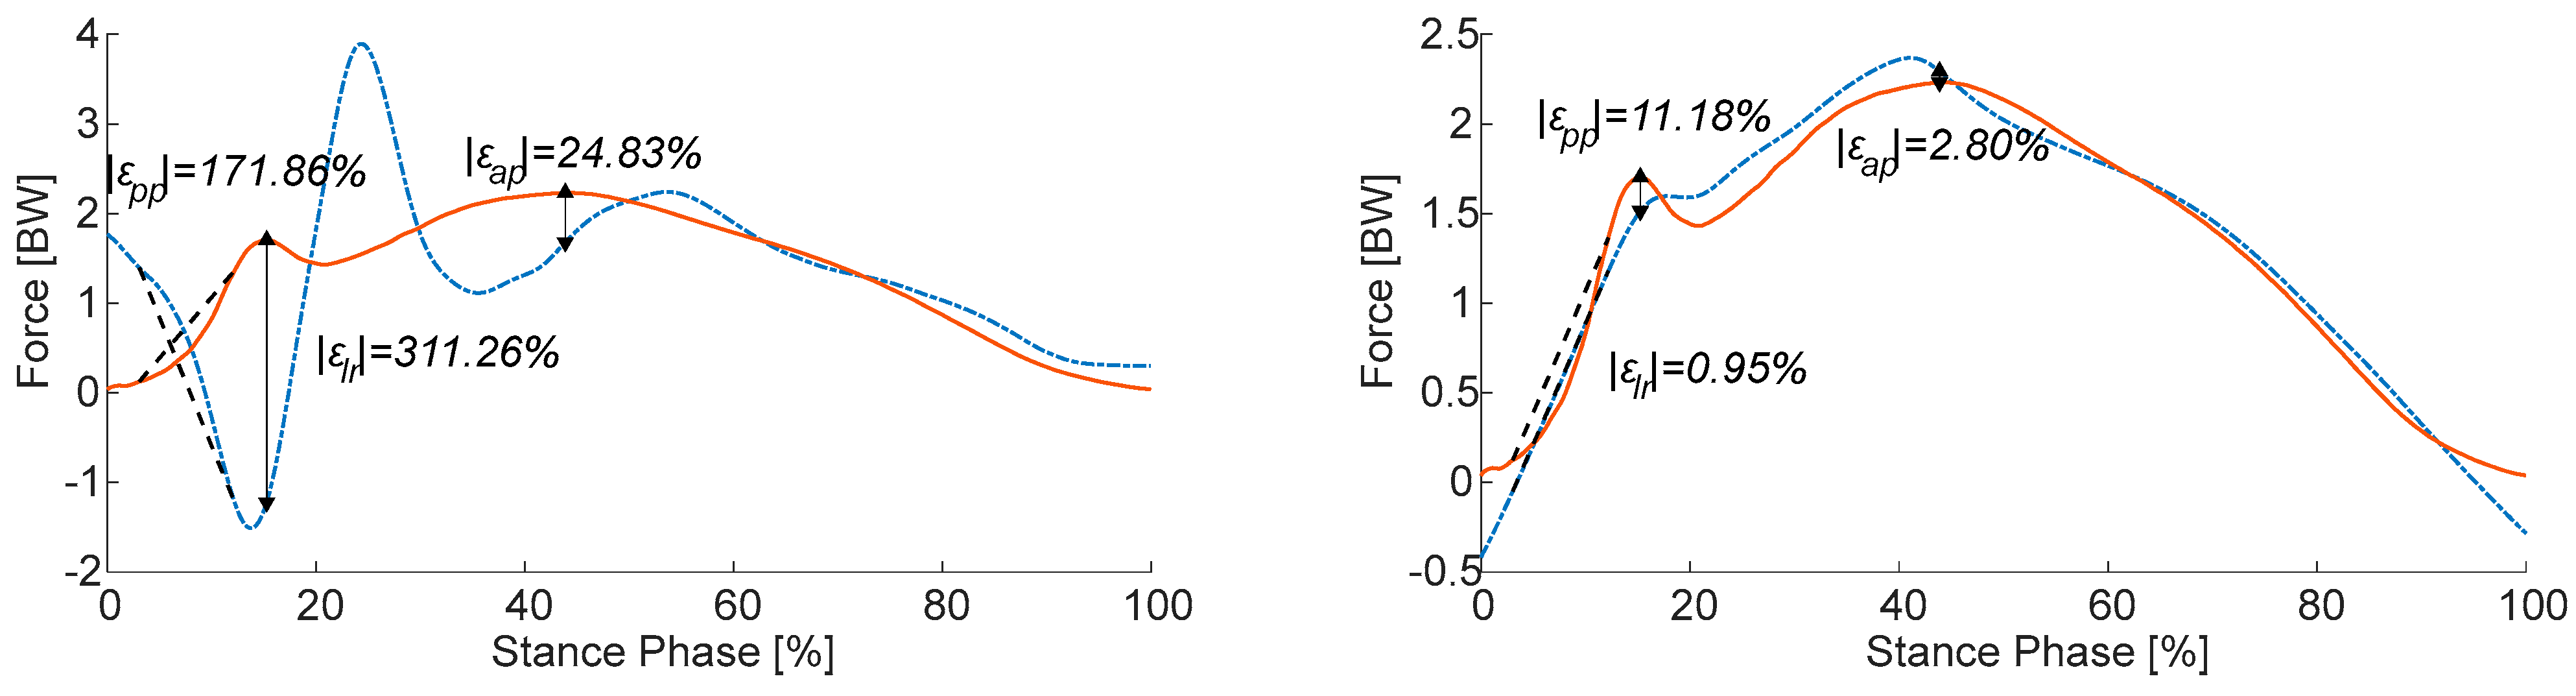
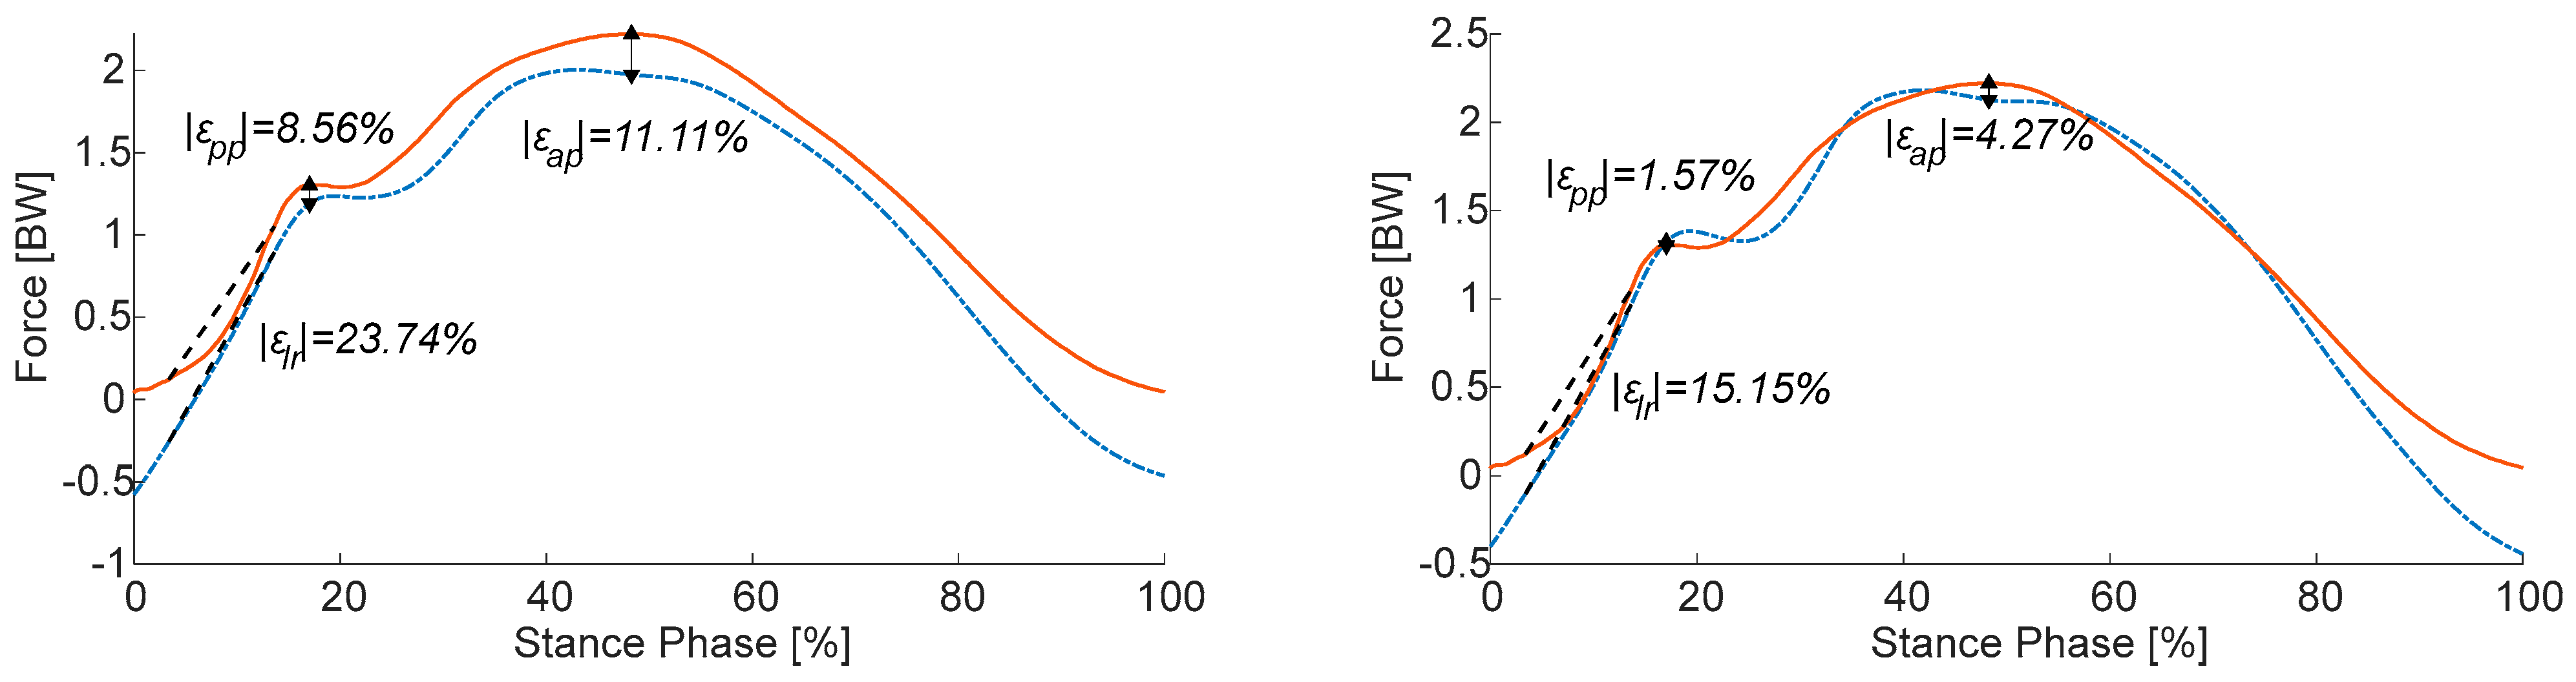
Table 3 presents the resulting quality of VGRF predictions based on acceleration in the validation phase. Of the 50 models developed, 18 exhibited an extremely strong coefficient of determination. Extremely strong coefficients of determination were observed at cut-off frequencies of ≤25 Hz and in models developed with 30 to 90 stances. The strongest correlation was observed in the model developed with 50 stances and at a cut-off frequency of 5 Hz. In this case, the RMSE was 0.15 BW. A summary of the results of the validation phases is presented in Appendix A.
Of the fifty developed models, ten exhibited low relative differences ( ε p p , ε a p , and ε l r ), and only six exhibited very low relative differences. An example of the two extremes is shown in Figure 3. The shapes of the curves indicate that models that do not have an extremely strong coefficient of determination can exhibit local divergences, which explains the large relative errors.

3.4. Test Phase

To limit the number of results, only the 10 models exhibiting the largest coefficients of determination (all >0.95 during the validation phase) were tested on the eight participants in set #2. None of the 10 validated models exhibited extremely strong coefficients of determination ( R 2 > 0.90 ) for all eight participants. Generally, the models exhibited extremely strong coefficients of determination only for two or three participants. An example of the results of a specific model developed with filtered accelerations at 15 Hz for 50 stances is presented in Table 4. Equation (2) presents the values of the coefficients of this particular model:
V G R F ^ = 483.09 + 298.63 T 1 182.96   T 2 + 241.20   T 3 + 742.04   L 1 474.90   L 2 142.00   L 3
where variables T and L represent the accelerations measured by the tibia and lumbar sensors, respectively; indices 1, 2, and 3 represent the longitudinal, medio-lateral-oriented, and antero-posterior-oriented axes, respectively.
The results indicated that regardless of the model, the quality of the prediction depended on the participant (Table 5). Although VGRF signals derived from participants #1 and #4 exhibited large R 2 values, the RMSEs were important (approximately 0.45 BW). Conversely, for participants #7 and #8, VGRF predictions always had small R 2 values. None of the solutions exhibited low or very low relative differences ( ε p p , ε a p , and ε l r ). The results of two of the best-performing models are presented in Figure 4.

4. Discussion

The objective of this study was to develop personalized statistical VGRF models during running using two triaxial accelerometers located in the tibia and lumbar regions. First, models were developed using a dataset of VGRFs and acceleration signals collected from one participant running over a force platform. The developed models were validated using a dataset obtained from the same participant. Finally, the validated models were tested using a dataset of signals collected from eight other participants.

4.1. Training and Validation Phases

The results indicate that after the training and validation phases, it was possible to develop personalized models to estimate VGRFs during running using two wearable accelerometers with extremely strong correlation ( R 2 > 0.90) and very low error rates ( ε i i < 5 % ). Following the validation phase, the 10 models exhibiting the highest coefficients of determination ( R 2 > 0.95) were considered to be the best-performing models. For the passive peak, these models achieved on average low relative differences ( ε p p = 6.26 % ). These results indicate that acceleration measurement on the lower limbs provided relevant information on the impact of the foot against the ground, and thus also on running technique and the passive peak. This can explain why the values of the passive peak obtained in this study were better than those obtained by Seeley et al. [22] (approximately 9%) in a subject-specific linear regression model. Indeed, in this previous work, the authors used a low-range accelerometer (full range: 16 g; sampling frequency: 16 Hz). However, the acceleration amplitudes reached on the lower limbs during running may have exceeded 16 g and led to saturation of the sensor. The acceleration measurement would then not have allowed a correct estimation of the passive peak. Our recommendation is to use accelerometers with a high range on the lower limbs for an accurate estimation of the passive peak. For the active peak, our models exhibited low relative differences ( ε a p = 2.22 % ) on average, which is consistent with the literature (between 3% and 8.3% [21,22,23]). These results indicate the importance of using an accelerometer on the trunk close to the center of mass, in correspondence with previous studies [8,13,21]. This methodology allows the direct relationship of the acceleration and active peak of the VGRF by the mass of the participant, allowing a simple and accurate estimation of the active peak. Regarding the loading rate, our models achieved on average low relative differences ( ε l r = 2.17 % ). This result was better than that of Derie et al. [19] who developed a subject-dependent model using a machine learning approach. However, the comparison remains debatable, because there are different definitions of loading rates in the literature [31]. Nevertheless, this small relative difference can be considered acceptable for certain applications. For example, Huang et al. [32] reported a difference of >30% in the loading rate between forefoot and rearfoot runners. In the same way, Milner et al. [4] reported a difference of >10% in the loading rate between subjects subjected to tibial stress fractures and a control group.

4.2. Sensitivity to Cut-Off Frequency Conditions and Size of Training Dataset

In this study, the training and validation phases indicated that the best-performing models were developed with 50 stances. With more or fewer steps, the coefficient of determination decreased, and the models appeared to be overtrained or undertrained. However, these results remain highly dependent on the protocol used, which imposed relatively fixed conditions and did not validate the hypothesis (1). The number of steps can be modulated if different conditions are integrated into the model; for example, in previous studies, velocity conditions were integrated into the models [20,22]. Considering the filtering conditions, the training and validation phases indicated that the best-performing models were developed using filtered accelerations with a maximum cut-off frequency of 15 Hz. This cut-off frequency seems to provide a closer approximation of the general shape of the VGRF curve by eliminating the occurrence of unwanted peaks (as can be seen in Figure 2) due to the damping effect of the foot against the ground. Wundersitz et al. [13] reported that for an accurate estimation of the vertical and resultant force peaks using an accelerometer located in the middle of the back, the optimal cut-off frequency was 10 Hz. Derie et al. [19] reported that the optimal cut-off frequency for estimating the loading rate with accelerometers on the shins was 45 Hz. As their methodologies and sensor characteristics were similar to those used in the present study, these differences can be explained by the different locations of the sensors and different indicators estimated. Indeed, the results of the present study indicated that the accelerometer located on the tibia provided information for modelling the onset of the VGRF curve through the passive peak and loading rate. These results are due to observations of the weights of each axis in the model equation, but also due to the shape of the signals. On the tibia, longitudinal and antero-posterior signals are characteristic of a damped shock and provide the equation with the information it needs to model the passive peak (representative of the impact of the foot against the ground). However, these two indicators are sensitive to high frequencies, because they are related to the impact of the foot on the ground. These observations are consistent with those of Seeley et al. [22] who attributed the high errors in the loading rate obtained using an accelerometer located on the foot to the low sampling frequency of the sensor, which did not allow the high-frequency content of these signals to be captured. In contrast, a sensor located in the lumbar region (particularly on the longitudinal axis) provides information for modelling a general sinusoidal shape, particularly for the active peak. This signal has a characteristic shape, very similar to VGRFs. It also has the highest weight in the equations compared to the other axis. The associated coefficient is also close to the weight of the human body and therefore logically refers to Newton’s second law, linking external forces to the acceleration of the center of gravity. This indicator was sensitive to low frequencies. These observations coincide well with the 10 Hz cut-off frequency proposed by Wundersitz et al. [13]. Thus, hypothesis (2) is validated, and we recommend a low cut-off frequency (10 Hz) for the sensor at the lumbar level and a higher cut-off frequency (50 Hz) for the sensor at the tibia level.

4.3. Test Phase

In the test phase, in which the developed and validated models were used to estimate VGRFs for the eight participants, the results indicated that none of the 10 models provided accurate estimates for all the participants ( R 2 > 0.90 for three of the eight participants) and invalidated hypothesis (3). These results can be explained by the differences in the personal characteristics of the participants (age: 23.4 ± 2.5 years; height: 175 ± 8 cm; mass: 68 ± 8 kg) and the differences in the realization of the protocol. In this study, no speed was imposed on the participants, and their results were different (Table 1). However, a previous study indicated that an increase in running speed tended to increase the average amplitude of the accelerometric signals at the tibia and lumbar regions in amateur runners [33]. This implies that model coefficients associated with acceleration signals are sensitive to running speed.
Nonetheless, the application of some of the models to participant #1 and (in particular) participant #4 yielded accurate VGRF predictions. In terms of personal characteristics (sex, height, weight, speed, shoe size, and shoe type), the participant on whom the models were based and participant #4 differed. Other characteristics, such as details of the running technique or kinematics, may have been involved and should be considered in the development of a prediction model. Nevertheless, if kinematics must be included in the VGRF model, as has been proposed in the literature [34,35], the acquisition of these data remains a significant technical challenge for describing running activity in ecological conditions. Either the acquisition volume provided by optical systems is insufficient or the movement is limited by the large number of onboard sensors required to capture it. Accordingly, if the running kinematics differ between experimental running conditions (overground running in laboratory, ecological situations, treadmill running, etc.), as has been demonstrated [36], models aimed at deployment in real running conditions can yield mitigated results. In previous studies, models were systematically developed using measures realized under laboratory conditions (in a controlled measurement space or on a treadmill). Developing models that are as close as possible to ecological conditions is the main recommendation for this type of work.
However, non-negligible errors still appeared in the best-estimated VGRF curves. These divergences between the model and measured signals essentially originate from two factors. The first is the bias between the two curves, which appears to shift the ordinate of the estimated curve with respect to the real curve (Figure 4, left). This explains the good coefficient of determination, because the shape of the estimated curve is similar to the actual one, but with a relatively high RMSE because of the shift. While this bias can easily be corrected in the model by changing the constant of the equation, it can be explained by the difference in velocity between the participant on which the models were developed and participant #4. Indeed, velocity is a factor that has already been shown in the literature to impact the amplitudes of force [37] and acceleration [33,38] signals (generally in a linear relation). As these amplitudes are different between the training set and the test set, the constant of the equation is no longer adapted and thus causes a bias. A possible improvement of the model would be to define the equation constant as a linear function of running speed. The second factor is the difference between the model at the end and at the beginning of the contact (Figure 4, right and left). Two methods can be used to reduce this error and improve loading rate estimates. The first method is to add boundary conditions to the modelling algorithm consistent with the contact description proposed by Hunter et al. [26] (i.e., VGRF is >10 N on the rise for foot strike and <25 N on the fall for foot strike). The second method is to apply corrections at the beginning and end of the signal to impose remarkable values on the curve while maintaining the continuity of the signal.

4.4. Personalized Model

This study indicated that the development of personalized models is more suitable for achieving accurate estimates. After the validation phase for the 10 best-performing models ( R 2 > 0.95), estimation errors were generally high and reached high relative mean difference values ( ε p p = 35.35 % , ε a p = 26.29 % , and ε l r = 27.53 % ). These results are consistent with those of Derie et al. [19], who reported that estimation errors were greater when the model was developed independently of the participant (the mean absolute errors were 5.39 and 12.41 BW⋅s−1 for personalized and independent models, respectively). Similar conclusions were drawn by Seeley et al. [22], indicating the importance of developing customized models that can include race-specific indicators, such as equipment or techniques, as proposed in the literature [8,21].

4.5. Perspectives

A potential direction for improvement is to add different running conditions to the models so that they can be used in a wider range of cases. In this study, the results of the models were specific to the developed protocol and to the running technique with a heel strike. As the signature curve of the VGRF of a foot striker can differ [1], it is necessary to adapt the model to different running techniques. More generally, the addition of different speed conditions, as well as different types of shoes, running techniques, or even slopes, has been proposed [39], and could be a better way to reflect the ecological conditions of running and thus develop a more reliable model for in-field use. Subsequently, improvements can be made to the algorithm used to develop the model. Indeed, if this algorithm has demonstrated its performance in proposing a simple model of the VGRF, it remains necessary to estimate the VGRF at the beginning and end of the contact. The addition of boundary conditions would allow some local estimation errors to be eliminated. Finally, in this study, the contact phase was defined using force platform signals and not accelerometer signals. As the long-term objective is to only use wearable sensors, further work is underway to add the heel strike and toe-off detections directly to accelerometer data, according to the literature [28,40,41].

5. Conclusions

This paper proposes promising VGRF prediction models using two accelerometers for running. After the training and validation phases, the results indicate that it is possible to develop personal models for estimating VGRF in running with extremely strong correlations ( R 2 > 0.90) and very low errors ( ε i i < 5%). The results indicated that it was possible to develop relevant models with a small number of stances (50), representing a short acquisition time and an affordable size of the dataset. Moreover, accelerations must be filtered under 15 Hz to remove the high frequencies contained in these signals, allowing low-cost sensors with low-frequency ranges to acquire the data needed for the models. Although the models provided accurate results for two of eight subjects, the current results and methodology do not allow us to conclude on the relevance of custom model development. The results obtained make it possible to accurately describe the VGRF curve for a specific running speed. This model provides many perspectives for monitoring the biomechanics of running under real conditions, as it requires a small number of sensors.

Author Contributions

Conceptualization, T.P., S.C., M.B., L.V.-T. and D.C.; methodology, T.P., S.C., M.B., L.V.-T. and D.C.; software, T.P. and S.C.; validation, T.P., M.B., L.V.-T. and D.C.; formal analysis, T.P. and S.C.; investigation, T.P., M.B., L.V.-T. and D.C.; resources, T.P., M.B., L.V.-T. and D.C.; data curation, T.P. and S.C.; writing—original draft preparation, T.P.; writing—review and editing, T.P., M.B., L.V.-T. and D.C.; visualization, T.P.; supervision, T.P., M.B., L.V.-T. and D.C.; project administration, T.P., M.B., L.V.-T. and D.C.; funding acquisition, T.P., M.B., L.V.-T. and D.C. All authors have read and agreed to the published version of the manuscript.

Funding

This research received no external funding.

Data Availability Statement

The data presented in this study are available on request from the corresponding author. The data are not publicly available due to privacy.

Acknowledgments

The authors would like to thank all the participants who were involved in the experimental protocol.

Conflicts of Interest

The authors declare no conflict of interest.

Appendix A

Table A1. Results of the fifty models for the training and validation phase developed on set #1.
Cut-Off Freq. (Hz)Stance
#
TrainingValidation
R2RMSE (BW) ε p p
(%)
ε a p  (%) ε l r  (%)R2RMSE (BW) ε p p
(%)
ε a p  (%) ε l r  (%)
5100.9870.0810.951.7118.080.7120.4872.3111.3949.41
300.9850.0914.141.798.330.9700.2321.3915.452.80
500.9880.0812.500.879.260.9790.154.867.193.51
700.9890.0811.990.448.950.9710.131.511.291.15
900.9890.0812.020.689.510.9670.141.170.175.90
10100.9830.106.411.1515.390.6580.5296.8113.87115.70
300.9880.0811.331.757.200.9310.2535.8711.6421.07
500.9890.0811.020.538.790.9750.1311.182.800.95
700.9900.0710.390.707.230.9680.142.710.610.85
900.9900.0710.230.467.330.9630.141.512.111.89
15100.9700.131.181.3413.090.5480.59114.1915.68176.38
300.9900.077.772.205.830.9000.2842.2311.6841.68
500.9910.078.980.118.010.9600.1615.231.5910.51
700.9900.078.212.445.080.9560.162.841.011.40
900.9900.077.802.204.710.9510.170.262.481.54
20100.9520.162.711.7211.730.4250.68128.2217.94221.23
300.9900.073.822.954.490.8730.3145.9912.1460.70
500.9920.076.570.967.110.9350.2019.381.2122.37
700.9890.085.634.463.090.9340.203.500.846.60
900.9890.084.944.222.400.9320.200.452.244.28
25100.9340.195.492.1211.210.3230.77140.7920.08254.36
300.9860.080.213.873.620.8470.3348.2212.4077.05
500.9920.064.001.906.380.9040.2523.381.2634.40
700.9860.092.916.491.720.9080.244.630.3513.38
900.9850.091.946.240.960.9090.230.541.719.09
30100.9170.217.382.5411.250.2490.85152.2421.94279.08
300.9810.104.154.883.380.8220.3549.3912.3390.66
500.9920.071.422.875.980.8690.2926.951.4845.47
700.9820.100.218.381.120.8790.285.980.2220.70
900.9810.100.978.100.500.8850.260.201.1814.97
35100.9030.238.633.0011.560.1960.93162.6023.51297.54
300.9730.127.865.923.750.7990.3649.8211.95101.73
500.9900.071.083.815.940.8350.3329.961.7355.14
700.9780.112.3310.061.220.8510.317.340.7127.85
900.9750.113.649.750.900.8630.290.390.7821.16
40100.8910.249.443.4811.970.1590.99171.8624.83311.26
300.9640.1411.276.964.610.7780.3849.7411.32110.54
500.9890.083.444.726.250.8030.3732.401.9263.30
700.9740.124.6611.521.870.8250.348.581.0534.47
900.9700.136.0111.181.930.8420.311.040.5627.18
45100.8800.269.933.9712.360.1341.04180.0325.94321.39
300.9540.1614.337.955.810.7590.3949.3310.51117.43
500.9860.085.615.556.830.7750.3934.312.0270.07
700.9690.136.7612.772.910.8020.369.671.2440.39
900.9640.148.0712.403.380.8240.321.690.5032.77
50100.8720.2710.214.4612.700.1151.08187.1926.88328.78
300.9430.1717.038.877.250.7420.4048.749.60122.75
500.9840.097.596.327.620.7500.4235.792.0475.61
700.9650.148.6113.854.200.7820.3810.571.2945.60
900.9590.159.8313.445.060.8080.342.270.5837.82

References

  1. Lieberman, D.E.; Venkadesan, M.; Werbel, W.A.; Daoud, A.I.; Dandrea, S.; Davis, I.S.; Mangeni, R.O.; Pitsiladis, Y. Foot Strike Patterns and Collision Forces in Habitually Barefoot versus Shod Runners. Nature 2010, 463, 531–535. [Google Scholar] [CrossRef]
  2. Weyand, P.G.; Sternlight, D.B.; Bellizzi, M.J.; Wright, S. Faster Top Running Speeds Are Achieved with Greater Ground Forces Not More Rapid Leg Movements. J. Appl. Physiol. 2000, 89, 1991–1999. [Google Scholar] [CrossRef]
  3. Zadpoor, A.A.; Nikooyan, A.A. The Relationship between Lower-Extremity Stress Fractures and the Ground Reaction Force: A Systematic Review. Clin. Biomech. 2011, 26, 23–28. [Google Scholar] [CrossRef]
  4. Milner, C.E.; Ferber, R.; Pollard, C.D.; Hamill, J.; Davis, I.S. Biomechanical Factors Associated with Tibial Stress Fracture in Female Runners. Med. Sci. Sports Exerc. 2006, 38, 323–328. [Google Scholar] [CrossRef]
  5. Camomilla, V.; Bergamini, E.; Fantozzi, S.; Vannozzi, G. Trends Supporting the In-Field Use of Wearable Inertial Sensors for Sport Performance Evaluation: A Systematic Review. Sensors 2018, 18, 873. [Google Scholar] [CrossRef]
  6. Pouliot-Laforte, A.; Veilleux, L.N.; Rauch, F.; Lemay, M. Validity of an Accelerometer as a Vertical Ground Reaction Force Measuring Device in Healthy Children and Adolescents and in Children and Adolescents with Osteogenesis Imperfecta Type I. J. Musculoskelet. Neuronal Interact. 2014, 14, 155–161. [Google Scholar]
  7. Elvin, N.G.; Elvin, A.A.; Arnoczky, S.P. Correlation between Ground Reaction Force and Tibial Acceleration in Vertical Jumping. J. Appl. Biomech. 2007, 23, 180–189. [Google Scholar] [CrossRef]
  8. Neugebauer, J.M.; Hawkins, D.A.; Beckett, L. Estimating Youth Locomotion Ground Reaction Forces Using an Accelerometer-Based Activity Monitor. PLoS ONE 2012, 7, e48182. [Google Scholar] [CrossRef]
  9. Howard, R.; Conway, R.; Harrison, A.J. Estimation of Force during Vertical Jumps Using Body Fixed Accelerometers. In Proceedings of the 25th IET Irish Signals & Systems Conference 2014 and 2014 China-Ireland International Conference on Information and Communities Technologies (ISSC 2014/CIICT 2014), Limerick, Ireland, 26–27 June 2014; Volume 2014, pp. 102–107. [Google Scholar]
  10. Raper, D.P.; Witchalls, J.; Philips, E.J.; Knight, E.; Drew, M.K.; Waddington, G. Use of a Tibial Accelerometer to Measure Ground Reaction Force in Running: A Reliability and Validity Comparison with Force Plates. J. Sci. Med. Sport 2018, 21, 84–88. [Google Scholar] [CrossRef]
  11. Henning, E.M.; Lafortune, M.A. Relationships between Ground Reaction Force and Tibial Bone Acceleration Parameters. J. Appl. Biomech. 1997, 7, 303–309. [Google Scholar] [CrossRef]
  12. Ancillao, A.; Tedesco, S.; Barton, J.; O’Flynn, B. Indirect Measurement of Ground Reaction Forces and Moments by Means of Wearable Inertial Sensors: A Systematic Review. Sensors 2018, 18, 2564. [Google Scholar] [CrossRef] [PubMed]
  13. Wundersitz, D.W.T.; Netto, K.J.; Aisbett, B.; Gastin, P.B. Validity of an Upper-Body-Mounted Accelerometer to Measure Peak Vertical and Resultant Force during Running and Change-of-Direction Tasks. Sports Biomech. 2013, 12, 403–412. [Google Scholar] [CrossRef] [PubMed]
  14. Gurchiek, R.D.; McGinnis, R.S.; Needle, A.R.; McBride, J.M.; van Werkhoven, H. The Use of a Single Inertial Sensor to Estimate 3-Dimensional Ground Reaction Force during Accelerative Running Tasks. J. Biomech. 2017, 61, 263–268. [Google Scholar] [CrossRef]
  15. Cavagna, G.A. Force Platforms as Ergometers. J. Appl. Physiol. 1985, 39, 174–179. [Google Scholar] [CrossRef] [PubMed]
  16. Blickhan, R. The Spring-Mass Model for Running and Hopping. J. Biomech. 1989, 22, 1217–1227. [Google Scholar] [CrossRef]
  17. Morin, J.-B.; Dalleau, G.; Kyröläinen, H.; Jeannin, T.; Belli, A. A Simple Method for Measuring Stiffness during Running. J. Appl. Biomech. 2005, 21, 167–180. [Google Scholar] [CrossRef]
  18. Nedergaard, N.J.; Verheul, J.; Drust, B.; Etchells, T.; Lisboa, P.; Robinson, M.A.; Vanrenterghem, J. The Feasibility of Predicting Ground Reaction Forces during Running from a Trunk Accelerometry Driven Mass-Spring-Damper Model. PeerJ 2018, 6, e6105. [Google Scholar] [CrossRef]
  19. Derie, R.; Robberechts, P.; Van den Berghe, P.; Gerlo, J.; De Clercq, D.; Segers, V.; Davis, J. Tibial Acceleration-Based Prediction of Maximal Vertical Loading Rate During Overground Running: A Machine Learning Approach. Front. Bioeng. Biotechnol. 2020, 8, 33. [Google Scholar] [CrossRef]
  20. Ngoh, K.J.-H.; Gouwanda, D.; Gopalai, A.A.; Chong, Y.Z. Estimation of Vertical Ground Reaction Force during Running Using Neural Network Model and Uniaxial Accelerometer. J. Biomech. 2018, 76, 269–273. [Google Scholar] [CrossRef]
  21. Neugebauer, J.M.; Collins, K.H.; Hawkins, D.A. Ground Reaction Force Estimates from ActiGraph GT3X+ Hip Accelerations. PLoS ONE 2014, 9, e99023. [Google Scholar] [CrossRef]
  22. Seeley, M.K.; Evans-Pickett, A.; Collins, G.Q.; Tracy, J.B.; Tuttle, N.J.; Rosquist, P.G.; Merrell, A.J.; Christensen, W.F.; Fullwood, D.T.; Bowden, A.E. Predicting Vertical Ground Reaction Force during Running Using Novel Piezoresponsive Sensors and Accelerometry. J. Sports Sci. 2020, 38, 1844–1858. [Google Scholar] [CrossRef] [PubMed]
  23. Thiel, D.V.; Shepherd, J.; Espinosa, H.G.; Kenny, M.; Fischer, K.; Worsey, M.; Matsuo, A.; Wada, T. Predicting Ground Reaction Forces in Sprint Running Using a Shank Mounted Inertial Measurement Unit. Proceedings 2018, 2, 199. [Google Scholar] [CrossRef]
  24. Lariviere, O.; Provot, T.; Valdes-Tamayo, L.; Bourgain, M.; Chadefaux, D. Force Pattern and Acceleration Waveform Repeatability of Amateur Runners. Proceedings 2020, 49, 136. [Google Scholar] [CrossRef]
  25. Gruber, A.H.; Edwards, W.B.; Hamill, J.; Derrick, T.R.; Boyer, K.A. A Comparison of the Ground Reaction Force Frequency Content during Rearfoot and Non-Rearfoot Running Patterns. Gait Posture 2017, 56, 54–59. [Google Scholar] [CrossRef] [PubMed]
  26. Hunter, J.P.; Marshall, R.N.; McNair, P.J. Relationships between Ground Reaction Force Impulse and Kinematics of Sprint-Running Acceleration. J. Appl. Biomech. 2005, 21, 31–43. [Google Scholar] [CrossRef]
  27. Benson, L.C.; Clermont, C.A.; Watari, R.; Exley, T.; Ferber, R. Automated Accelerometer-Based Gait Event Detection during Multiple Running Conditions. Sensors 2019, 19, 1483. [Google Scholar] [CrossRef]
  28. Mo, S.; Chow, D.H.K. Accuracy of Three Methods in Gait Event Detection during Overground Running. Gait Posture 2018, 59, 93–98. [Google Scholar] [CrossRef]
  29. Hopkins, W.G.; Marshall, S.W.; Batterham, A.M.; Hanin, J. Progressive Statistics for Studies in Sports Medicine and Exercise Science. Med. Sci. Sports Exerc. 2009, 41, 3–12. [Google Scholar] [CrossRef]
  30. Verheul, J.; Nedergaard, N.J.; Pogson, M.; Lisboa, P.; Gregson, W.; Vanrenterghem, J.; Robinson, M.A. Biomechanical Loading during Running: Can a Two Mass-Spring-Damper Model Be Used to Evaluate Ground Reaction Forces for High-Intensity Tasks? Sports Biomech. 2019, 20, 571–582. [Google Scholar] [CrossRef]
  31. Ueda, T.; Hobara, H.; Kobayashi, Y.; Heldoorn, T.A.; Mochimaru, M.; Mizoguchi, H. Comparison of 3 Methods for Computing Loading Rate during Running. Int. J. Sports Med. 2016, 37, 1087–1090. [Google Scholar] [CrossRef]
  32. Huang, Y.; Xia, H.; Chen, G.; Cheng, S.; Cheung, R.T.H.; Shull, P.B. Foot strike pattern, step rate, and trunk posture combined gait modifications to reduce impact loading during running. J. Biomech. 2019, 86, 102–109. [Google Scholar] [CrossRef]
  33. Provot, T.; Chiementin, X.; Bolaers, F.; Murer, S. Effect of Running Speed on Temporal and Frequency Indicators from Wearable MEMS Accelerometers. Sports Biomech. 2021, 20, 831–843. [Google Scholar] [CrossRef]
  34. Komaris, D.S.; Pérez-Valero, E.; Jordan, L.; Barton, J.; Hennessy, L.; O’flynn, B.; Tedesco, S. Predicting Three-Dimensional Ground Reaction Forces in Running by Using Artificial Neural Networks and Lower Body Kinematics. IEEE Access 2019, 7, 156779–156786. [Google Scholar] [CrossRef]
  35. Johnson, W.R.; Mian, A.; Robinson, M.A.; Verheul, J.; Lloyd, D.G.; Alderson, J.A. Multidimensional Ground Reaction Forces and Moments from Wearable Sensor Accelerations via Deep Learning. IEEE Trans. Biomed. Eng. 2020, 68, 289–297. [Google Scholar] [CrossRef]
  36. Van Hooren, B.; Fuller, J.T.; Buckley, J.D.; Miller, J.R.; Sewell, K.; Rao, G.; Barton, C.; Bishop, C.; Willy, R.W. Is Motorized Treadmill Running Biomechanically Comparable to Overground Running? A Systematic Review and Meta-Analysis of Cross-over Studies. Sports Med. 2019, 50, 785–813. [Google Scholar] [CrossRef]
  37. Keller, T.; Weisberger, A.; Ray, J.; Hasan, S.; Shiavi, R.; Spengler, D. Relationship between Vertical Ground Reaction Force and Speed during Walking, Slow Jogging, and Running. Clin. Biomech. 1996, 11, 253–259. [Google Scholar] [CrossRef] [PubMed]
  38. Lafortune, M.A. Three-Dimensional Acceleration of the Tibia during Walking and Running. J. Biomech. 1991, 24, 877–886. [Google Scholar] [CrossRef]
  39. Alcantara, R.S.; Edwards, W.B.; Millet, G.Y.; Grabowski, A.M. Predicting Continuous Ground Reaction Forces from Accelerometers during Uphill and Downhill Running: A Recurrent Neural Network Solution. PeerJ 2022, 10, e12752. [Google Scholar] [CrossRef]
  40. Purcell, B.; Channells, J.; James, D.; Barrett, R. Use of Accelerometers for Detecting Foot-Ground Contact Time during Running. In BioMEMS and Nanotechnology II, Proceedings of the Microelectronics, MEMS, and Nanotechnology, Brisbane, Australia, 11–14 December 2005; Nicolau, D.V., Ed.; SPIE: Bellingham, WA, USA, 2006; Volume 6036, p. 603615. [Google Scholar]
  41. Chew, D.-K.; Ngoh, K.J.-H.; Gouwanda, D.; Gopalai, A.A. Estimating Running Spatial and Temporal Parameters Using an Inertial Sensor. Sport. Eng. 2018, 21, 115–122. [Google Scholar] [CrossRef]
Figure 1. Summary of the applied methodology. The red dashed box represents the first dataset (set #1) composed of data from one participant who completed 100 stances on the force platform. The blue dashed box represents the second dataset (set #2) composed of data from eight participants who each completed 10 stances on the force platform.
Vibration 06 00042 g001
Figure 2. Results of the models developed, presented as a comparison of the estimated VGRF (blue dashed line) and actual VGRF (orange solid line). The left and right arrows indicate the differences between the actual and estimated passive peaks ε p p and active peaks ε a p , respectively. The dashed segments represent the differences between the actual and estimated loading rates ε l r . The left frame corresponds to a model developed with filtered accelerations with a cut-off frequency of 50 Hz for 10 stances ( R 2 = 0.872 ;   R M S E = 0.27   B W ). The right frame corresponds to a model developed with filtered accelerations at 20 Hz for 30 stances ( R 2 = 0.990 ;   R M S E = 0.07   B W ).
Vibration 06 00042 g002
Figure 3. Results of the models developed, presented as a comparison of the estimated VGRF (blue dashed line) and actual VGRF (orange solid line). The left and right arrows indicate the differences between the actual and estimated passive peaks ε p p and active peaks ε a p , respectively. The dashed segments represent the differences between the actual and estimated loading rates ε l r . The left frame corresponds to a model developed with filtered accelerations at 40 Hz for 10 stances ( R 2 = 0.159 ;   R M S E = 0.99   B W ). The right frame corresponds to a model developed with filtered accelerations at 10 Hz for 50 stances ( R 2 = 0.975 ;   R M S E = 0.13   B W ).
Vibration 06 00042 g003
Figure 4. Results of the models developed, presented as a comparison of the estimated VGRF (blue dashed line) and actual VGRF (orange solid line). The left and right arrows indicate the differences between the actual and estimated passive peaks ε p p and active peaks ε a p , respectively. The dashed segments represent the differences between the actual and estimated loading rates ε l r . The left frame corresponds to a model tested on participant #4 with filtered accelerations at 10 Hz for 50 stances ( R 2 = 0.987 ;   R M S E = 0.26   B W ). The right frame corresponds to a model tested on participant #4 with filtered accelerations at 15 Hz for 50 stances ( R 2 = 0.985 ;   R M S E = 0.17   B W ).
Vibration 06 00042 g004
Table 1. Speed results (m/s) of the 10 trials for each participant in set #2.
Participant
#
MeanStandard
Deviation
13.190.11
23.130.25
32.780.03
43.080.06
52.750.06
62.830.06
73.390.19
83.110.06
Table 2. Prediction quality for the ten filtering conditions and five stance numbers, i.e., coefficient of determination ( R 2 ) results of the training phase for the different models developed. Extremely strong coefficients of determination are presented on white background.
Number of StancesCut-Off Frequency (Hz)
5101520253035404550
100.9870.9830.9700.9520.9340.9170.9030.8910.8800.872
300.9850.9880.9900.9900.9860.9810.9730.9640.9540.943
500.9880.9890.9910.9920.9920.9920.9900.9890.9860.984
700.9890.9900.9900.9890.9860.9820.9780.9740.9690.965
900.9890.9900.9900.9890.9850.9810.9750.9700.9640.959
Table 3. Prediction quality for the ten filtering conditions and five stance numbers, i.e., coefficient of determination ( R 2 ) results of the validation phase for the different models developed. Extremely strong coefficients of determination are presented on white background.
Number of StancesCut-Off Frequency (Hz)
5101520253035404550
100.7120.6580.5480.4250.3230.2490.1960.1590.1340.115
300.9700.9310.9000.8730.8470.8220.7990.7780.7590.742
500.9790.9750.9600.9350.9040.8690.8350.8030.7750.750
700.9710.9680.9560.9340.9080.8790.8510.8250.8020.782
900.9670.9630.9510.9320.9090.8850.8630.8420.8240.808
Table 4. Results of the validated model developed with filtered accelerations at 15 Hz for 50 stances applied to the eight participants.
Participant
#
R2RMSE (BW) ε p p
(%)
ε a p
(%)
ε l r
(%)
10.9240.4530.7732.4240.90
20.6610.4547.2523.6256.36
30.7420.8433.2643.953.64
40.9850.171.574.2715.15
50.7930.3651.2012.8125.42
60.9000.4226.3033.2128.59
70.3400.7468.4523.8021.77
80.4110.7560.1623.1555.65
Table 5. Mean and standard deviation (Mean ± SD) of R 2 , RMSE, ε p p , ε a p , and ε l r for the 10 validated models used in the test phase for each participant.
Participant
#
R2RMSE
(BW)
ε p p
(%)
ε a p
(%)
ε l r
(%)
10.957 ± 0.0160.45 ± 0.0818.32 ± 7.3624.33 ± 7.0934.94 ± 2.75
20.749 ± 0.1360.41 ± 0.1021.28 ± 15.3618.91 ± 6.1548.78 ± 5.94
30.785 ± 0.0551.02 ± 0.2825.45 ± 7.0758.77 ± 19.2214.74 ± 10.46
40.947 ± 0.0360.45 ± 0.2921.96 ± 19.3921.96 ± 18.0420.09 ± 9.81
50.898 ± 0.0620.43 ± 0.1551.41 ± 11.7412.06 ± 7.8413.25 ± 7.49
60.807 ± 0.0840.48 ± 0.0810.49 ± 7.8329.83 ± 5.9715.35 ± 6.85
70.294 ± 0.1110.88 ± 0.2377.05 ± 15.6428.43 ± 6.8323.43 ± 5.36
80.574 ± 0.1110.63 ± 0.0856.87 ± 4.2316.09 ± 4.7549.69 ± 3.51
Disclaimer/Publisher’s Note: The statements, opinions and data contained in all publications are solely those of the individual author(s) and contributor(s) and not of MDPI and/or the editor(s). MDPI and/or the editor(s) disclaim responsibility for any injury to people or property resulting from any ideas, methods, instructions or products referred to in the content.

