Article

An Experimental Approach for the Determination of the Mechanical Properties of Base-Excited Polymeric Specimens at Higher Frequency Modes

1
Institute of Lightweight Engineering and Polymer Technology (ILK), Technische Universität Dresden, Holbeinstraße 3, 01307 Dresden, Germany
2
Faculty of Automotive Engineering, Institute of Energy and Transport Engineering, Westsächsische Hochschule Zwickau, Scheffelstraße 39, 08012 Zwickau, Germany
3
Faculty of Engineering, Leipzig University of Applied Sciences, PF 30 11 66, 04251 Leipzig, Germany
*
Author to whom correspondence should be addressed.
Current address: Faculty of Engineering, Leipzig University of Applied Sciences, PF 30 11 66, 04251 Leipzig, Germany.
Vibration 2022, 5(3), 429-441; https://doi.org/10.3390/vibration5030024
Submission received: 24 June 2022 / Revised: 13 July 2022 / Accepted: 15 July 2022 / Published: 16 July 2022

Abstract

:
Structures made of the thermoplastic polymer polyether ether ketone (PEEK) are widely used in dynamically-loaded applications due to their high-temperature resistance and high mechanical properties. To design these dynamic applications, in addition to the well-known stiffness and strength properties the vibration-damping properties at the given frequencies are required. Depending on the application, frequencies from a few hertz to the ultrasonic range are of interest here. To characterize the frequency-dependent behavior, an experimental approach was chosen and applied to a sample polymer PEEK. The test setup consists of a piezoelectrically driven base excitation of the polymeric specimen and the non-contact measurement of the velocity as well as the surface temperature. The beam’s bending vibrations were analyzed by means of the Timoshenko theory to determine the polymer’s storage modulus. The mechanical loss factor was calculated using the half-power bandwidth method. For PEEK and a considered frequency range of 1 kHz to 16 kHz, a storage modulus between 3.9 GPa and 4.2 GPa and a loss factor between 9 × 10⁻³ and 17 × 10−3 were determined. For the used experimental parameters, the resulting mechanical properties were not essentially influenced by the amplitude of excitation, the duration of excitation, or thermal degrad.ation due to self-heating, but rather slightly by the clamping force within the fixation area.

1. Introduction

Dynamically-loaded structures made of thermoplastic polymers are used in the automotive and aerospace industry as well as in medical technology. In particular, the high-temperature resistant thermoplastic polymer polyether ether ketone (PEEK) with high mechanical and comparable low vibration-damping properties seems to be a promising polymer for dynamic applications where high vibration amplitudes have to be achieved. For a vibration-optimized design of these applications, the characterization of the dynamic mechanical properties at a high frequency range using a reliable experimental approach is required. The dynamic-mechanical analysis (DMA) only covers a relatively low frequency range [1]. To overcome this drawback, a time–temperature superposition (Williams–Landel–Ferry equation) on a multi-frequency DMA measurement can be used [1,2,3]. For isotropic materials, ultrasonic immersion methods are particularly suitable [4,5]. However, the application of these methods to characterize anisotropic materials is more challenging and the resulting properties are generally less accurate [4]. Both measurement approaches do not take into consideration the realistic thermo-mechanical behavior of thermoplastic polymers, such as self-heating effects.
Further measurements of the mechanical properties of polymers and composites at the ultrasonic frequency range were focused on very high cycle (VHC) fatigue testing as well as on thermographic investigations. Almaraz et al. [6] determined the ultrasonic fatigue endurance, the general crack initiation and propagation on the polymeric material PMMA at a frequency of 20 kHz using hourglass-shaped cylindrical specimens. Backe et al. [7] carried out fatigue testing of carbon fiber-reinforced polyphenylene sulfide in a very high cycle fatigue regime at ultrasonic frequencies of 20 kHz by means of an ultrasonic testing apparatus for cyclic three-point bending. Almaraz et al. [8] analyzed the crack initiation and propagation on the polymeric material acrylonitrile–butadiene–styrene under ultrasonic fatigue testing at a frequency of 20 kHz using a dog-bone test specimen. Mignogna et al. [9] investigated the thermal effects of high-power ultrasound at a frequency of 20 kHz on polychlorotrifluoroethylene using a rod-shaped test specimen.
In order to measure the vibration-damping properties at lower frequencies, a cantilever beam test specimen configuration is a standardized method according to ASTM E756-05 (2017). Therefore, the deformation of the specimen can be obtained among other techniques by means of a non-contact electromagnetic excitation [3,10,11,12], the excitation due to the mechanical coupling to an electrodynamic shaker [13,14], or the loading due to the connection to two nylon wires [15]. Whereas the non-contact realization using an electromagnetic excitation suffered the drawback of a highly limited frequency range, the contacted approaches introduce an additional source of joint damping and are, therefore, more difficult to implement in thermal chambers. To overcome these disadvantages, several authors described the excitation of the cantilever beam at the clamped end of the beam or at the midpoint of the beam. Ledi et al. [16] investigated the frequency dependent viscoelastic material properties of sandwich beams using this approach. The sandwich beams were attached to a shaker by means of an apparatus, that allowed the measurement of different lengths of the specimens. A similar test configuration was used by Liao and Wells [17] for the estimation of the complex Young’s modulus of non-stiff materials. Wojtowicki et al. [18] carried out measurements of the damping properties of composite beams using central clamped and excited beams. Kucher [19] introduced a test setup for the determination of the mechanical properties of PEEK at a higher frequency range for the design of polymer-based endodontic irrigation tips using a piezoelectric actuator.
For the polymer PEEK or fiber-reinforced PEEK, there are only a few studies concerning the cyclic deformation or the fatigue behavior of this polymer, which were carried out at low frequencies up to 5 Hz [20,21,22,23,24,25,26] or at frequencies up to 100 Hz [27]. These studies are not focused on the mechanical properties (storage modulus, loss modulus) of harmonic deformed PEEK at a higher frequency range. For this purpose, a suitable test configuration and an evaluation approach of the viscoelastic properties of PEEK are required, as described by Kucher [19].
In the current study, the mechanical properties of flat specimens made of the high-performance biocompatible polymer PEEK were analyzed by means of a harmonic base-excited test configuration as introduced by Kucher [19]. Thereby, the use of a piezoelectric actuator enables the determination of the mechanical properties at higher frequencies and an adaption of the displacement amplitude of excitation. For the used test configuration and due to the existing high vibration modes, the mechanical properties were determined using the Timoshenko beam theory and the half-power bandwidth method.

2. Materials and Methods

2.1. Specimen Preparation

Commercially available extruded plates with a nominal thickness of t = 1 mm made of PEEK (Sustapeek, Röchling Systaplast, Lahnstein, Germany) were used. The flat specimens ( n = 5) with dimensions of 140.03   ±   0.12   mm × 4.94   ±   0.09   mm × 1.21   ±   0.01   mm were prepared by means of a fully automatic high volume cutting machine (Axitom, Struers, Willich, Germany), all oriented in the same direction according to the plate’s main directions. The specimens had a mass of m = 1.08 ± 0.02 g. According to the manufacturer’s datasheet, the investigated PEEK had a density of ρ = 1.31 g/cm3 [28]. Prior to testing, all specimens were stored in a standard atmosphere at ambient temperature. A temperature of ϑ = 23 ± 0.7 °C and relative humidity of 31 ± 1.8% were measured.

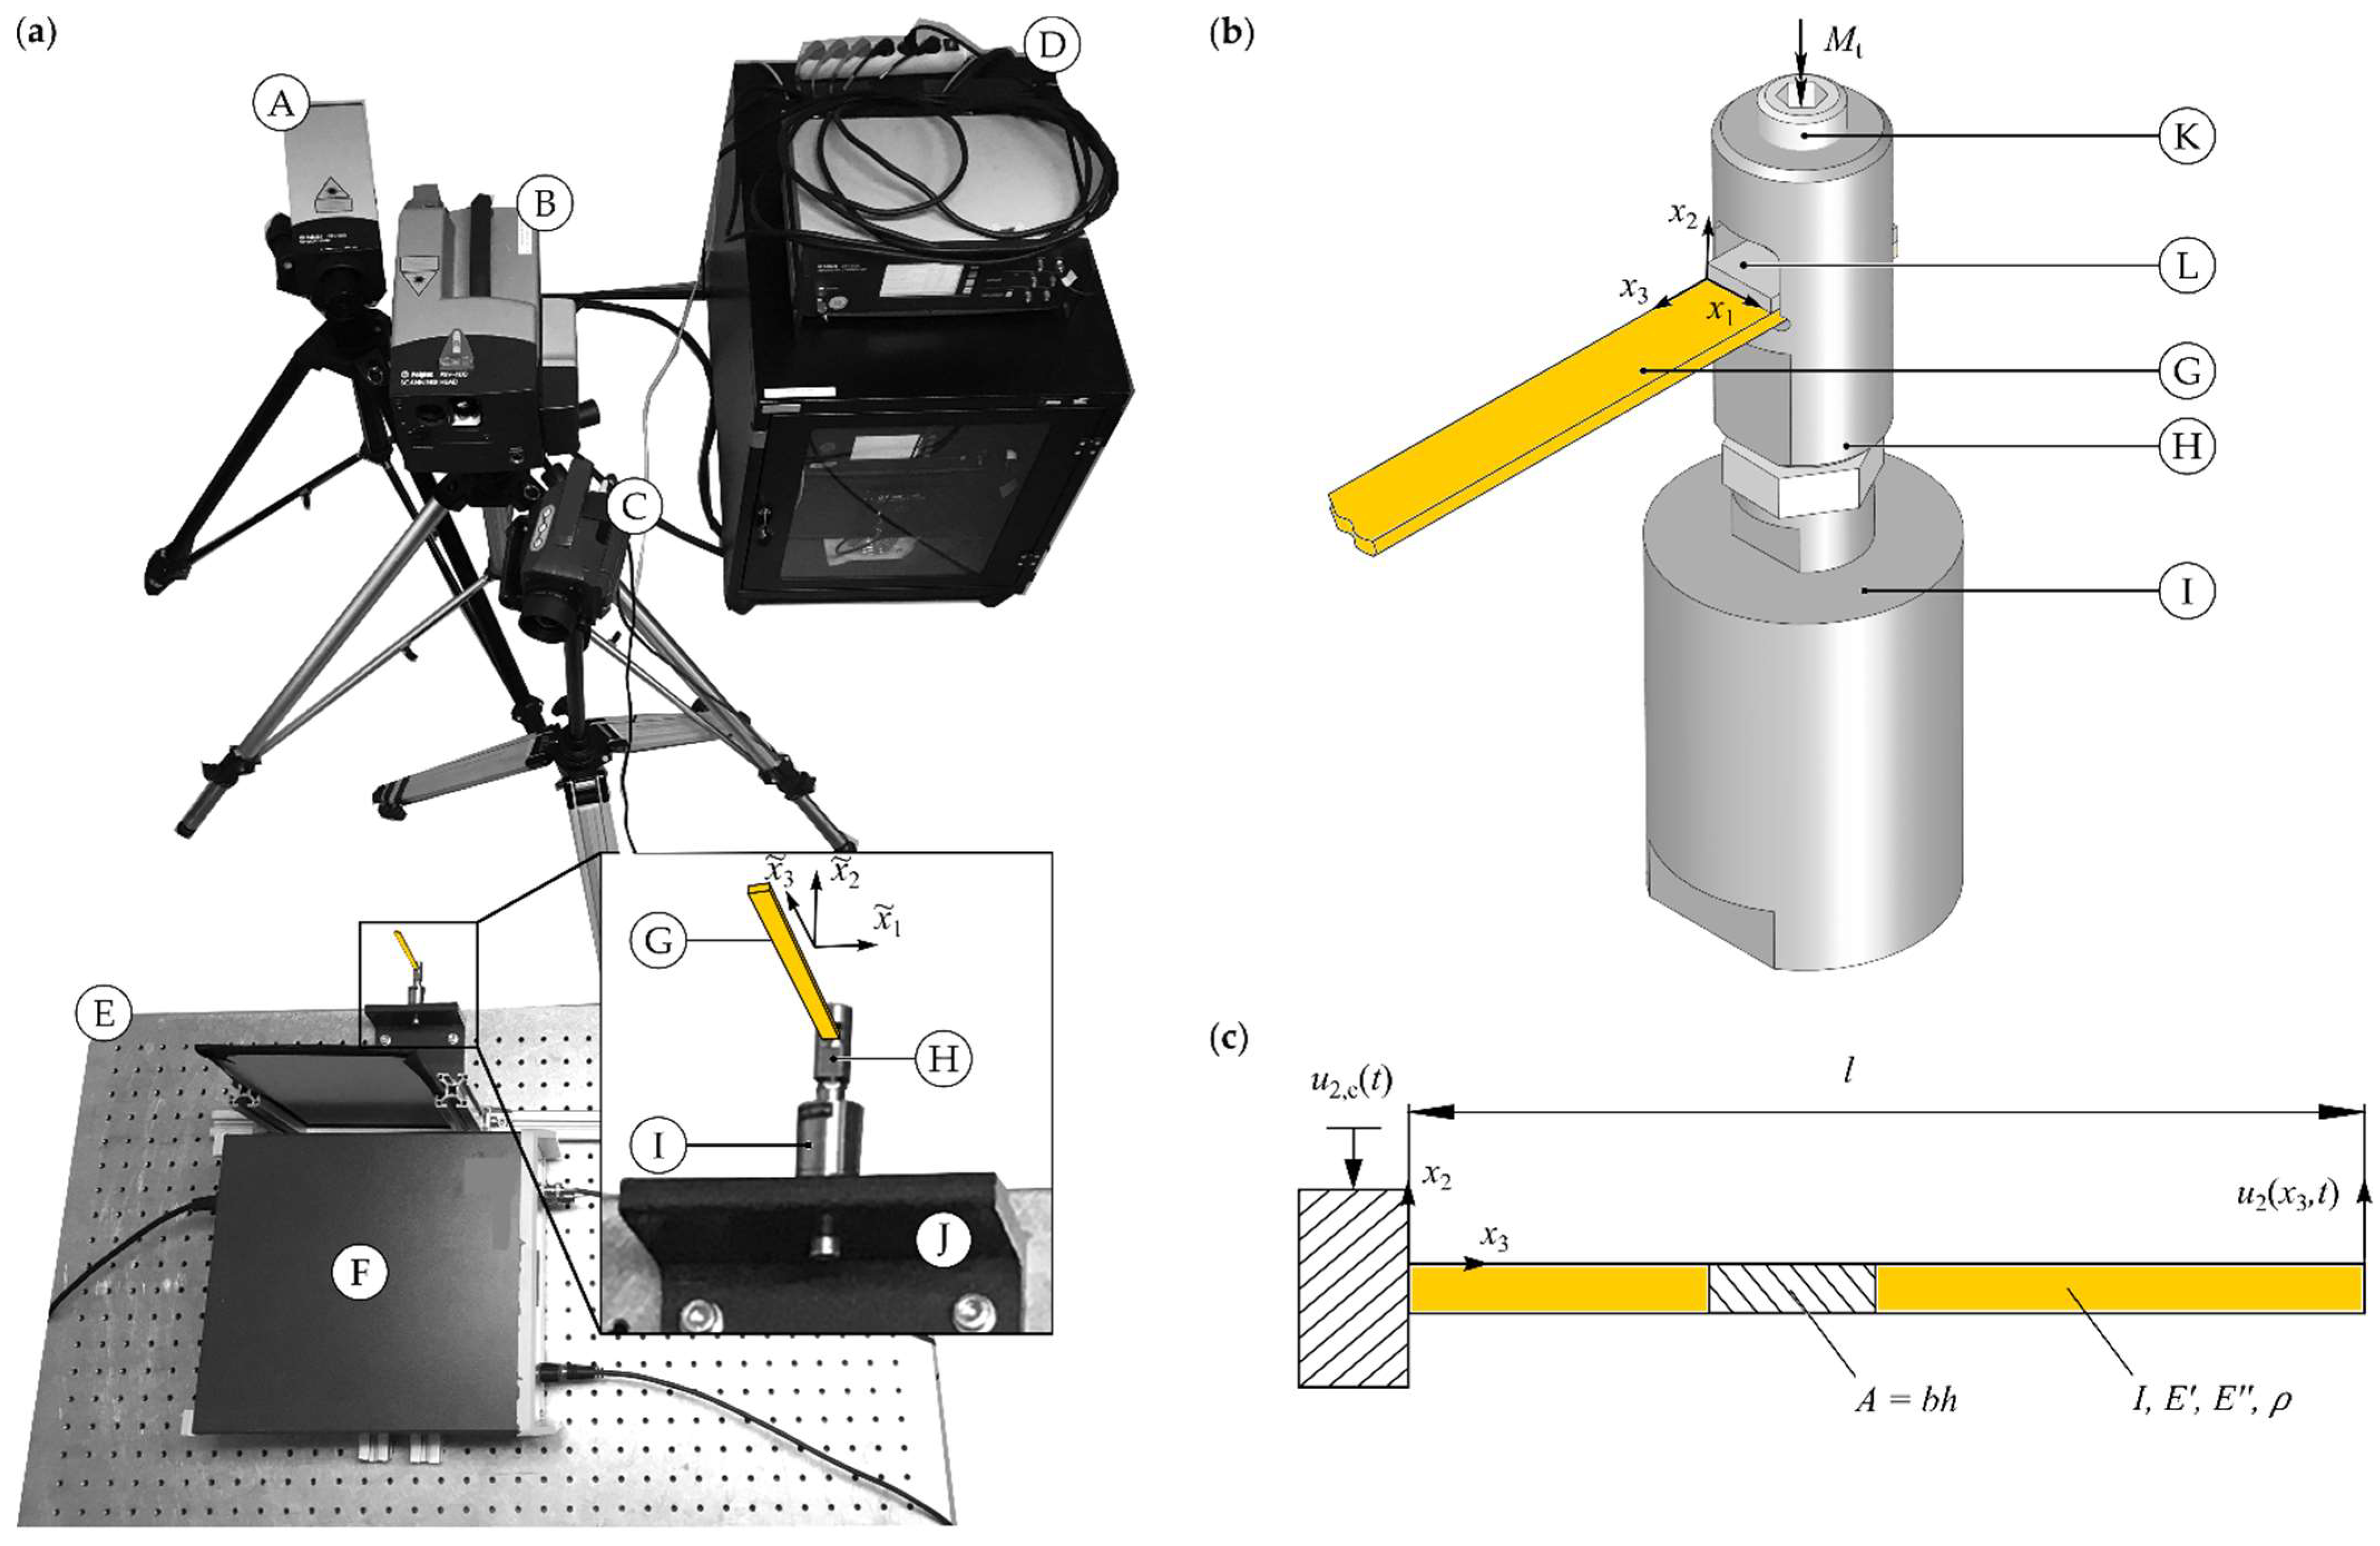
2.2. Experimental Apparatus and Procedure

The specimens were fixed with a length of l s l = 10 mm using the clamping adapter (Figure 1a). The adapter was then excited by means of a base excitation. This excitation was realized by means of a piezoelectric actuator (PSt 1000/10/7 VS18, Piezosystem, Jena, Germany), which was driven by a signal generator (PSV-400 junction box, Polytec, Waldbronn, Germany) and amplified by a voltage amplifier (LE 150/100 EBW, Piezosystem, Jena, Germany) to a sinusoidal voltage signal with an offset
U ( t ) = U ^ e sin ( 2 π f e ) + U ^ e ,  
where U ^ e is the voltage amplitude as well as the offset and f e is the frequency of excitation (compare Figure 1a,b). The backside of the actor was mounted on a steel profile, which was fixed by four M6 cylinder head screws on an optical table. The specimen was fixed using a modified one-end threaded circular post. By tightening a grub screw with a defined tightening torque M t , an insertion plate was pressed on the specimen’s clamping area to hold it in position (compare Table 1). The resulting clamping force in the fixation area was modified by varying the tightening torque.
The velocities of the beam were measured by means of a scanning laser vibrometer (SLV) (PSV-400 scanning head, Polytec, Waldbronn, Germany). The SLV consisted of a scanning head, which allowed the measurement of the beam’s normal velocity at different measurement positions of the visible measured objects. The vibrometer operated at a velocity range of up to 20 m/s with a maximum sampling frequency of 20 MHz. The velocity of the base excitation v 2 , e ( x , t ) = u ˙ 2 , e ( x , t ) was determined using an additional one-point laser vibrometer (OFV-505 sensor head, Polytec GmbH, Waldbronn, Germany). For the calculation of the loss factor, the average frequency spectrum v ^ 2 ( f ) of the beam’s normal velocity v 2 ( x , t ) = u ˙ 2 ( x , t ) with x = ( x 1 , x 2 , x 3 ) T was used (Figure 1a). The vibration measurements were pre- and post-processed using the manufacturer’s original software (PSV 9.2, Polytec, Waldbronn, Germany) and further analyzed using the multi-paradigm numerical computing environment (MATLAB 9.5, MathWorks, Inc., Natick, MA, USA).
Similar to the vibration measurements, the surface temperature of the specimen and the clamping were determined using an infrared thermographic camera (Variocam, Jenoptik, Jena, Germany). All thermographic images were produced with a sampling frequency of 2 Hz. For the quantification of self-heating effects, the resulting temperature difference of the specimen’s surface Δ ϑ ( t ) = ϑ ( t ) ϑ ( t ) | t = 0 and average temperature difference Δ ϑ were analyzed to identify the temperature-related effect on the polymer’s cyclic deformation behavior.
In order to assess the reliability of the calculated properties, a conventional DMA (DMA Q800, TA Instruments, New Castle, DE, USA) in a frequency range from 5 Hz to 60 Hz was carried out using a single cantilever beam configuration and air cooling at an ambient temperature of ϑ = 23 °C.
For the used test configuration and a harmonic excitation, the polymer’s mechanical properties can be described by means of the complex modulus (see [29] for example)
E * ( ω ) = E ( ω ) + j E ( ω ) = E ( ω ) [ 1 + j tan δ ( ω ) ] ,  
where E is the storage modulus, E is the loss modulus, j is the complex unit, ω = 2 π f is the circular frequency and tan δ is the mechanical loss factor. The mechanical loss factor tan δ = Δ f / f r was estimated via the half-power bandwidth method, where Δ f is the 3 dB bandwidth and f r is the related resonance frequency [30,31]. Satisfying Equation (2), the loss modulus was calculated using the loss factor E = tan δ E [31]. The storage modulus was determined by evaluating the beam’s resonance behavior as described in the following.

2.3. Beam Vibrations

For the used test configuration of a base-excited beam, a direct measurement of the applied forces and the resulting strains to obtain the cyclic stress–strain response with the used non-destructive measurement methods cannot be given. For this reason, the mechanical properties are determined by analyzing the resonance behavior of a one-dimensional beam with a length l s , a width b s , a thickness h s , a cross-sectional area A = b s h s , an area moment of inertia I around axis x 1 and the constant mass density ρ (see Figure 1c). For the investigated base-excited beam, the displacement of the beam
u 2 ( x , t ) = u 2 , rel ( x , t ) + u 2 , e ( t )
can be described by the sum of relative beam displacement u 2 , rel and base excitation
u 2 , e ( t ) = u ^ 2 , e sin ( 2 π f e t ) ,
where u ^ 2 , e is the amplitude of the base excitation and f e is the frequency of excitation. The description of flexural vibrations of an elastic beam is commonly given by the Euler–Bernoulli beam theory [4]. This approach assumes that plane cross sections remain plane and perpendicular to the neutral surface after deformation and thus the shear deformations are neglected. For higher frequency modes, this classical theory becomes inadequate due to the subdivision of the beam by the nodes into comparatively short sections [4]. The Timoshenko beam theory considers the tensile-compressive strains, as well as the rotational motions and the shear deformations of the beam elements. To compare the applicability of both theories, the storage modulus was determined using both these theories.

2.3.1. Euler–Bernoulli Beam Theory

Considering the Euler–Bernoulli beam theory, the equation of motion of a beam is defined as (compare, e.g., [32])
ρ A u ¨ 2 ( x 3 , t ) + E I u 2 ( x 3 , t ) = 0 ,
with Young’s modulus E . Using substitution (3) Equation (5) yields
ρ A u ¨ 2 , rel ( x 3 , t ) + E I u 2 , rel ( x 3 , t ) = u ˘ e ( t ) .
with
u ˘ e ( t ) = ρ A f e 2 u ^ 2 , e sin ( 2 π f e t ) .
Thereby, the partial deviations ( ˙ ) = ( ) / t and ( ) = ( ) / x 3 are used. This Equation (5) has the form of single cantilever beam for the relative displacement u 2 , rel ( x , t ) . Satisfying the following boundary conditions:
u 2 , rel ( x 3 , t ) | x 3 = 0 = 0
u 2 , rel ( x 3 , t ) | x 3 = L = 0
the elastic storage modulus of the cantilever beam with base excitation can be calculated by [32]
E = 48 ρ π 2 l 4 f r , n 2 h 2 λ j 4
where f r , n = ω r , n / ( 2 π ) is the resonance frequency of the n -th mode of natural vibration of the beam, ω r , n is the damped angular frequency and λ n is the corresponding characteristic eigenvalue (compare [4]). Thereby, the circular frequency ω and the Young’s modulus E , were substituted with their complex values [4]
E E * = E ( 1 + j tan δ ) , ω ω * = ω + j ω ,
with
ω r 2 = ω 2 ω 2
This modulus represents the flexural storage modulus.

2.3.2. Timoshenko Beam Theory

Involving the transverse displacement u 2 , the bending slope φ and the shear strain γ , the equation of motion can be described as [33]
ρ A u ¨ 2 ( x 3 , t ) + E I u 2 ( x 3 , t ) ρ I ( 1 + E κ s G ) u ¨ 2 ( x 3 , t ) + ρ 2 I κ s G u 2 ( x 3 , t ) = 0 ,
where κ s = ( 5 + 5 ν ) / ( 6 + 5 ν ) is the shear constant [34], ν is the constant Poisson ratio and G = E / ( 2 + 2 ν ) is the shear modulus. Using the substitution (3), the homogenous part of Equation (15) is obtained
ρ A u ¨ 2 , rel ( x 3 , t ) + E I u 2 , rel ( x 3 , t ) ρ I ( 1 + E κ s G ) u ¨ 2 , rel ( x 3 , t ) + ρ 2 I κ s G u 2 , rel ( x 3 , t ) = 0
which is equivalent to a single clamped beam considering the Timoshenko theory. For this beam, the following boundary conditions have to be satisfied [33]
u 2 , rel ( x 3 , t ) | x 3 = 0 = 0 ,
φ ( x 3 , t ) | x 3 = 0 = 0 ,
φ ( x 3 , t ) | x 3 = L = 0 ,
u 2 , rel ( x 3 , t ) φ ( x 3 , t ) | x 3 = L = 0 .
This results analogously to (12) in the equation for the determination of the storage modulus using the Timoshenko theory [4]
E = 48 ρ π 2 l 4 f r , n 2 h 2 β n 4 ,
where β n are the eigenvalues of the Timoshenko beam (compare [4]) which were calculated iteratively.

3. Results and Discussion

3.1. Influence of Applied Base Excitation of Beam’s Vibration Behavior

Figure 2 shows the measured resonance frequencies and loss factors for different voltage amplitudes at two different frequencies. The comparison of these measured quantities showed almost no dependence of the measured properties on the exciting voltage amplitude for an increasing voltage amplitude U ^ e , both for the resonance frequencies and for the loss factors (Figure 2). However, the measured quantities were subject to the typical test-related variations, which were higher in the upper frequency range.
The repeated clamping and unclamping (12 repetitions) of the same specimen and the subsequent determination of the natural frequencies as well as the loss factors resulted in a relative error of less than 0.4% for the natural frequencies and less than 4% for the loss factors, respectively. The lower repeat accuracy of the loss factor is evident, especially at higher frequencies (compare Figure 2). Furthermore, it should be noted that the conditions at the specimen’s clamping influence its resonance behavior. Thus, the variations of natural frequencies and loss factors can also be seen as the result of the slightly differing tightening torque M t (see also Figure 3).
To justify that the investigated material behaves in accordance with the linear viscoelastic theory, the performed damping measurements have to be made in the linear range. The assumption was verified considering the fact that the increasing voltage amplitude, associated with the applied force, only had a negligible influence. For the following measurements, a voltage amplitude of U ^ e = 11 V was used.

3.2. Influence of Specimen’s Tension Torque

The contact mechanical conditions, especially the gripping force and the stiffnesses in the clamping area, influence the specimen’s vibration behavior. In the context of the current study, the tested specimens were fastened on one side in the clamping adapter with the help of a grub screw (see Figure 1b). To determine the influence of different gripping forces, the tightening torque was varied in a range from 0.5 Nm to 1.7 Nm. For the investigated tightening torques, a subsequent visual inspection did not reveal any damage marks on the specimen’s clamping area. Furthermore, no displacement of the test specimen could be detected during the vibration excitation. For two exemplarily selected bending resonance frequencies in the lower and upper frequency range, there was an increase in the measured resonance frequencies with an increasing tightening torque M t (Figure 3). However, the determined loss factors showed only a slight change for the investigated torques without a clear tendency. To ensure a suitable mounting of the specimen and the prevention of material damage in the clamping region based on the performed investigations, a tightening torque of M t = 1.1 Nm was chosen for the following investigations.

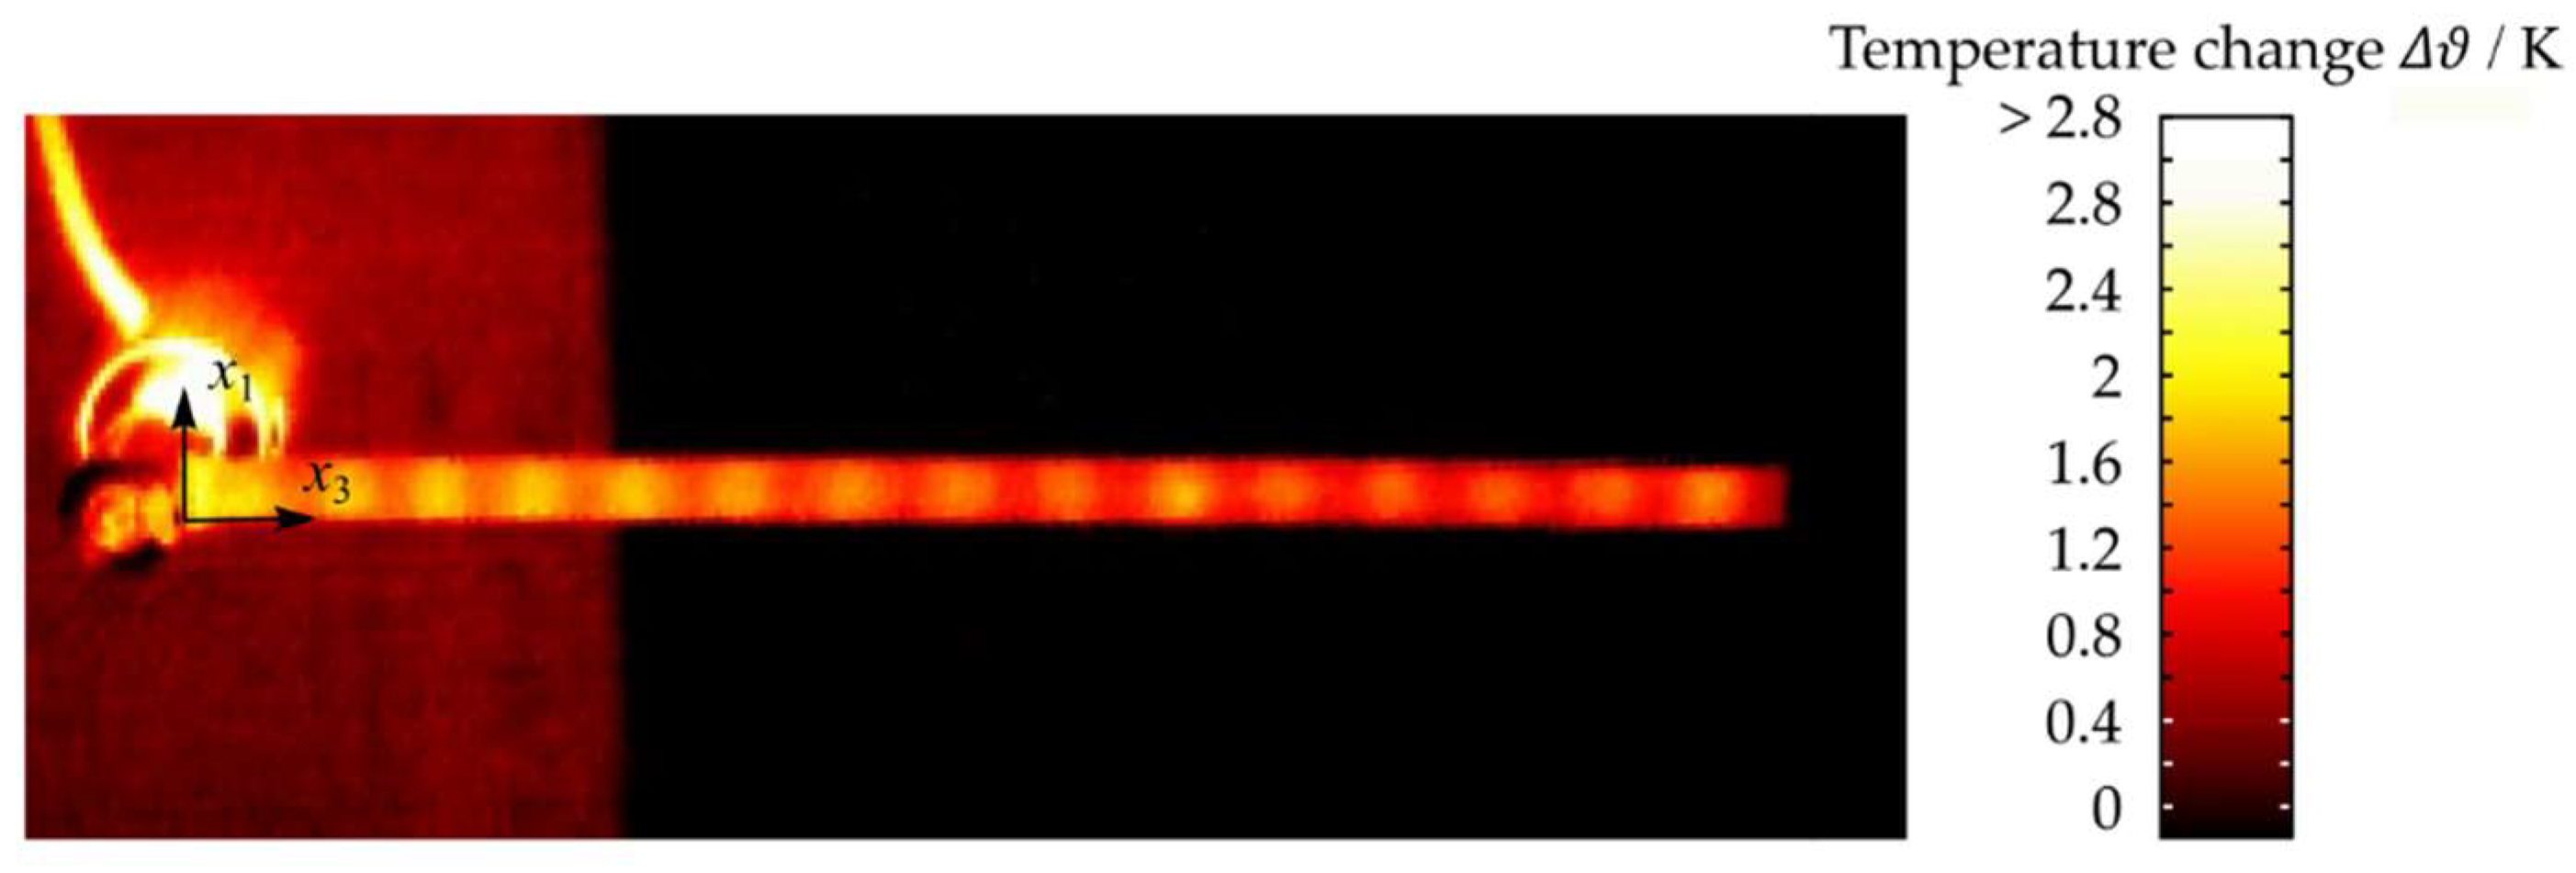
3.3. Thermal Behavior during Excitation

Due to the high mechanical material damping of the thermoplastic polymer PEEK as well as its low thermal conductivity, the delayed dissipation of the generated heat to the environment during cyclic loads leads to a considerable temperature increase [35].
The temperature increase varied depending on the certain position along the axis x 3 (compare Figure 4). For a voltage amplitude of U ^ e = 54 V, the areas with high deformations—for the beam’s bending vibrations at the vibrational antinodes—showed the highest temperature increase. Furthermore, there was a high increase in the actuator’s surface temperature which led to a rise in temperature in the specimen’s clamping area. After an excitation of t = 209 s, the beam’s antinode resulted in a maximum temperature increase of Δ ϑ = 1.9 K and the actuator’s surface reached a maximum temperature of Δ ϑ = 4.8 K above the ambient temperature (compare Figure 4). For a voltage amplitude of U ^ e = 11 V and an excitation of t = 300 s, the averaged surface temperature of the specimen did not exceed an increase of Δ ϑ = 0.2 K (Figure 5). During this time, the displacement amplitude did not significantly change. There was only a small decrease during the initial deformation of the specimen ( t < 20 s). Thus, for the field problem to be investigated, the assumption of isothermal deformation can be made in a simplified manner ( ϑ ϑ 0 ,   ϑ 0 ,   ϑ ˙ 0 ). As a consequence, for a voltage amplitude of U ^ e = 11 V, the material behavior can be assumed as purely mechanical.

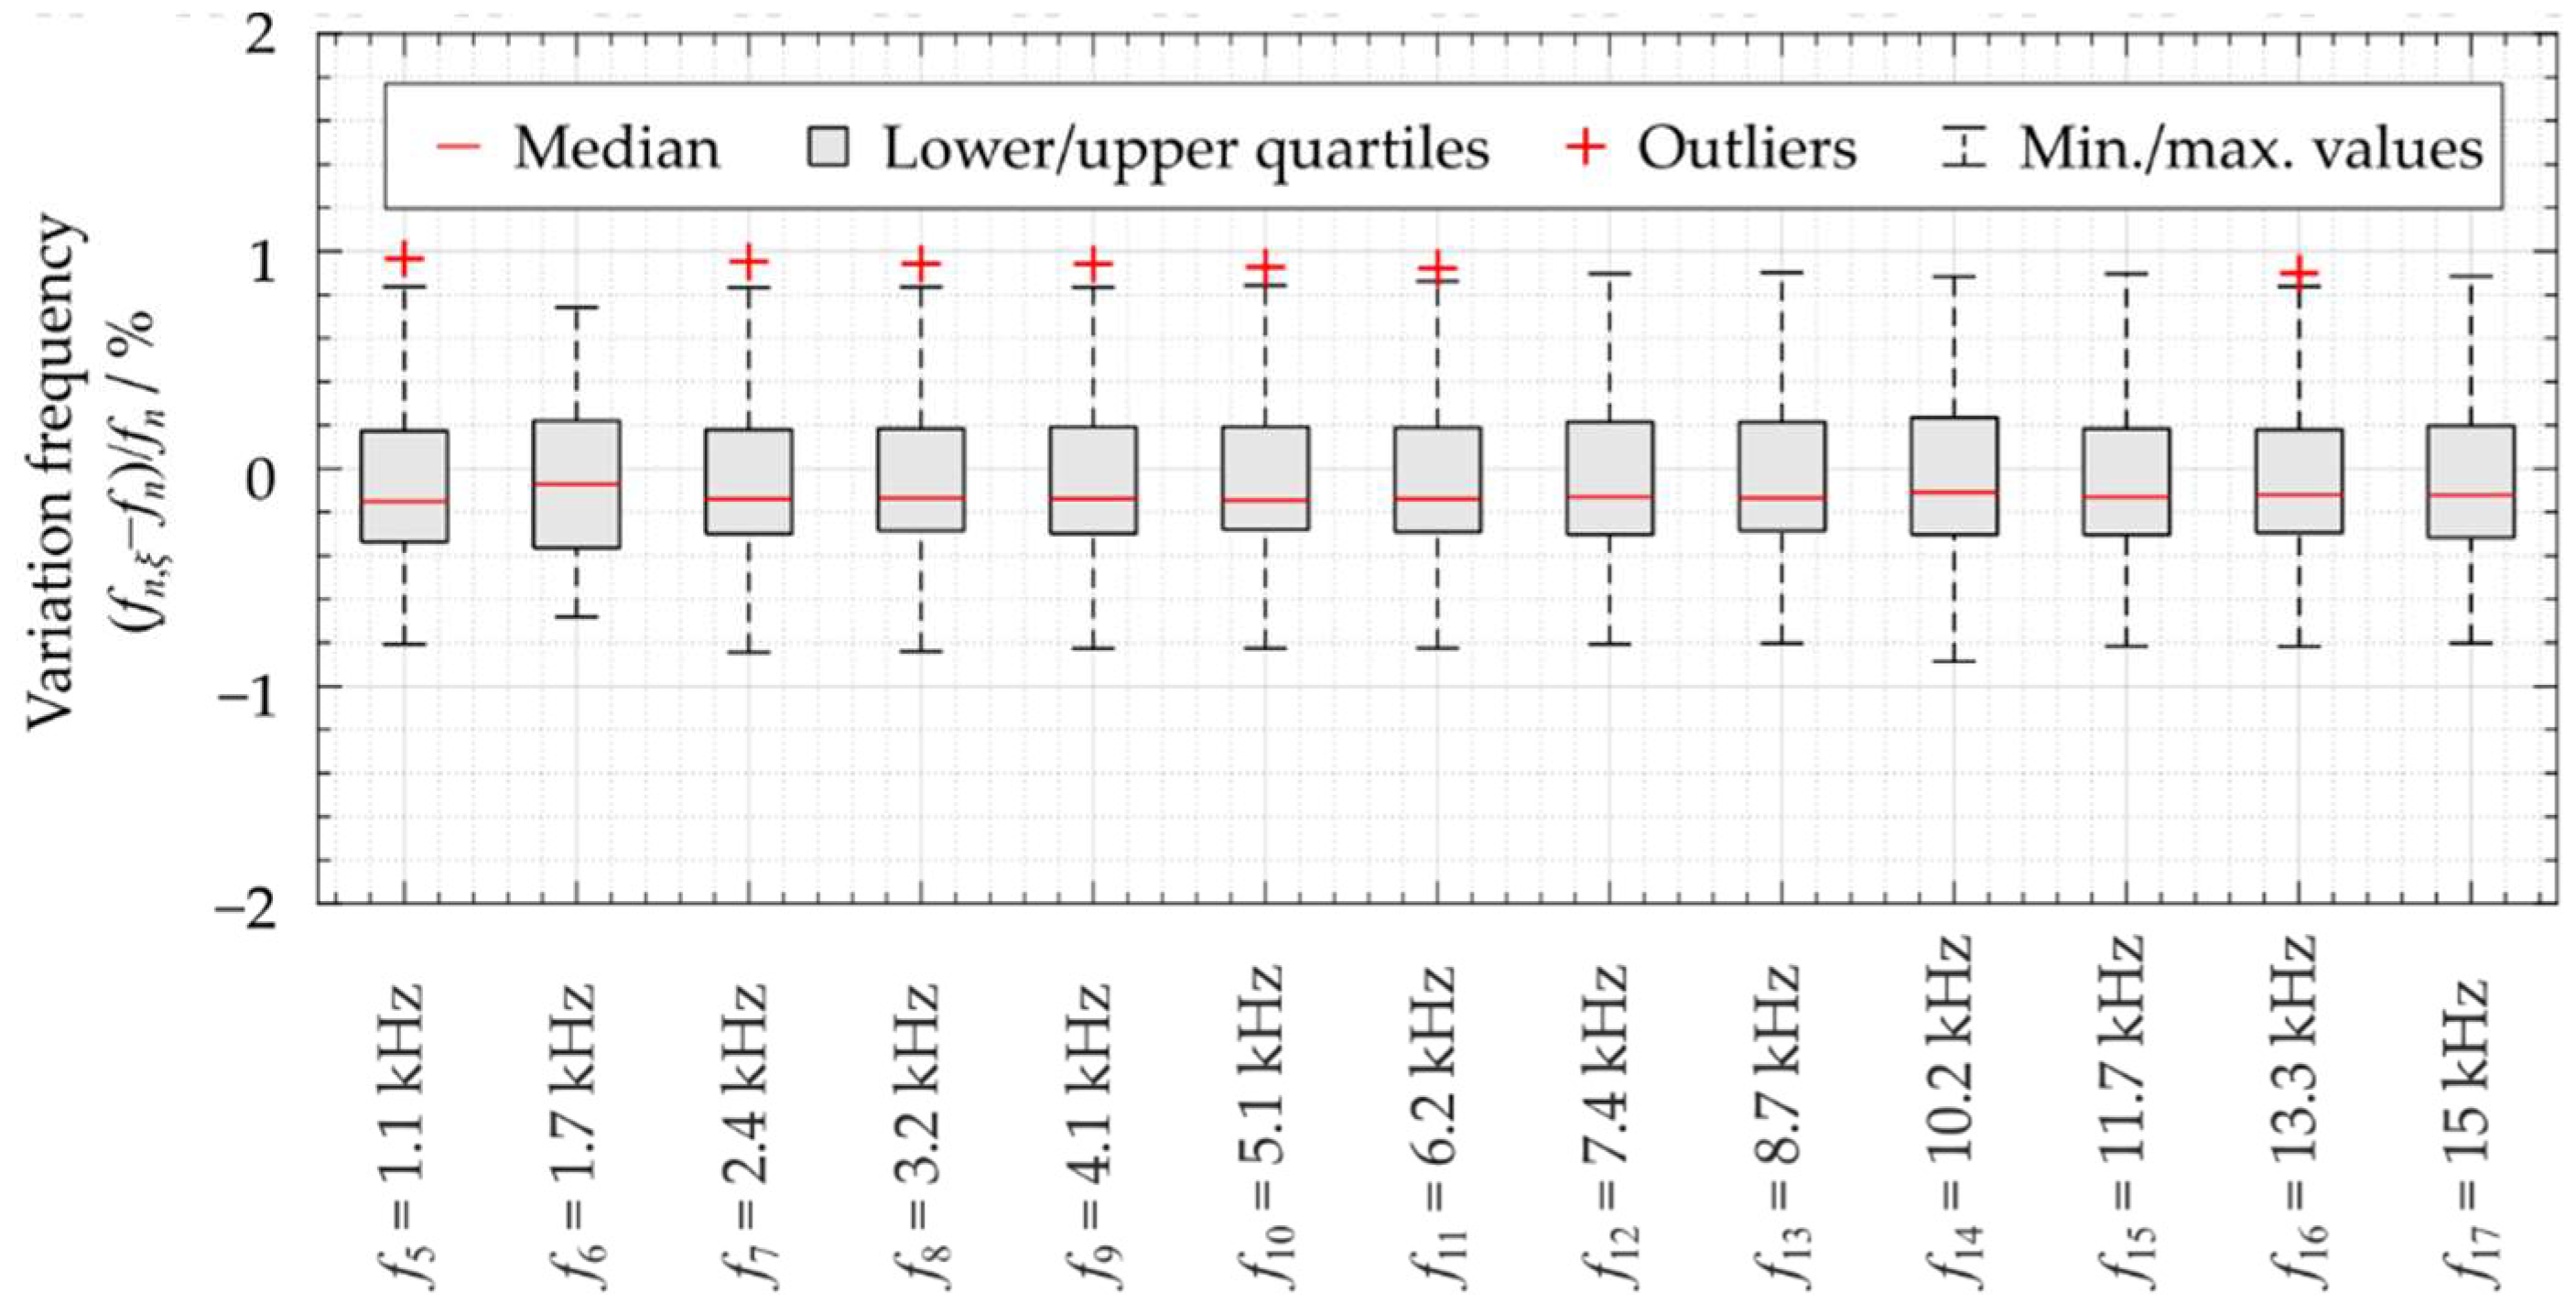
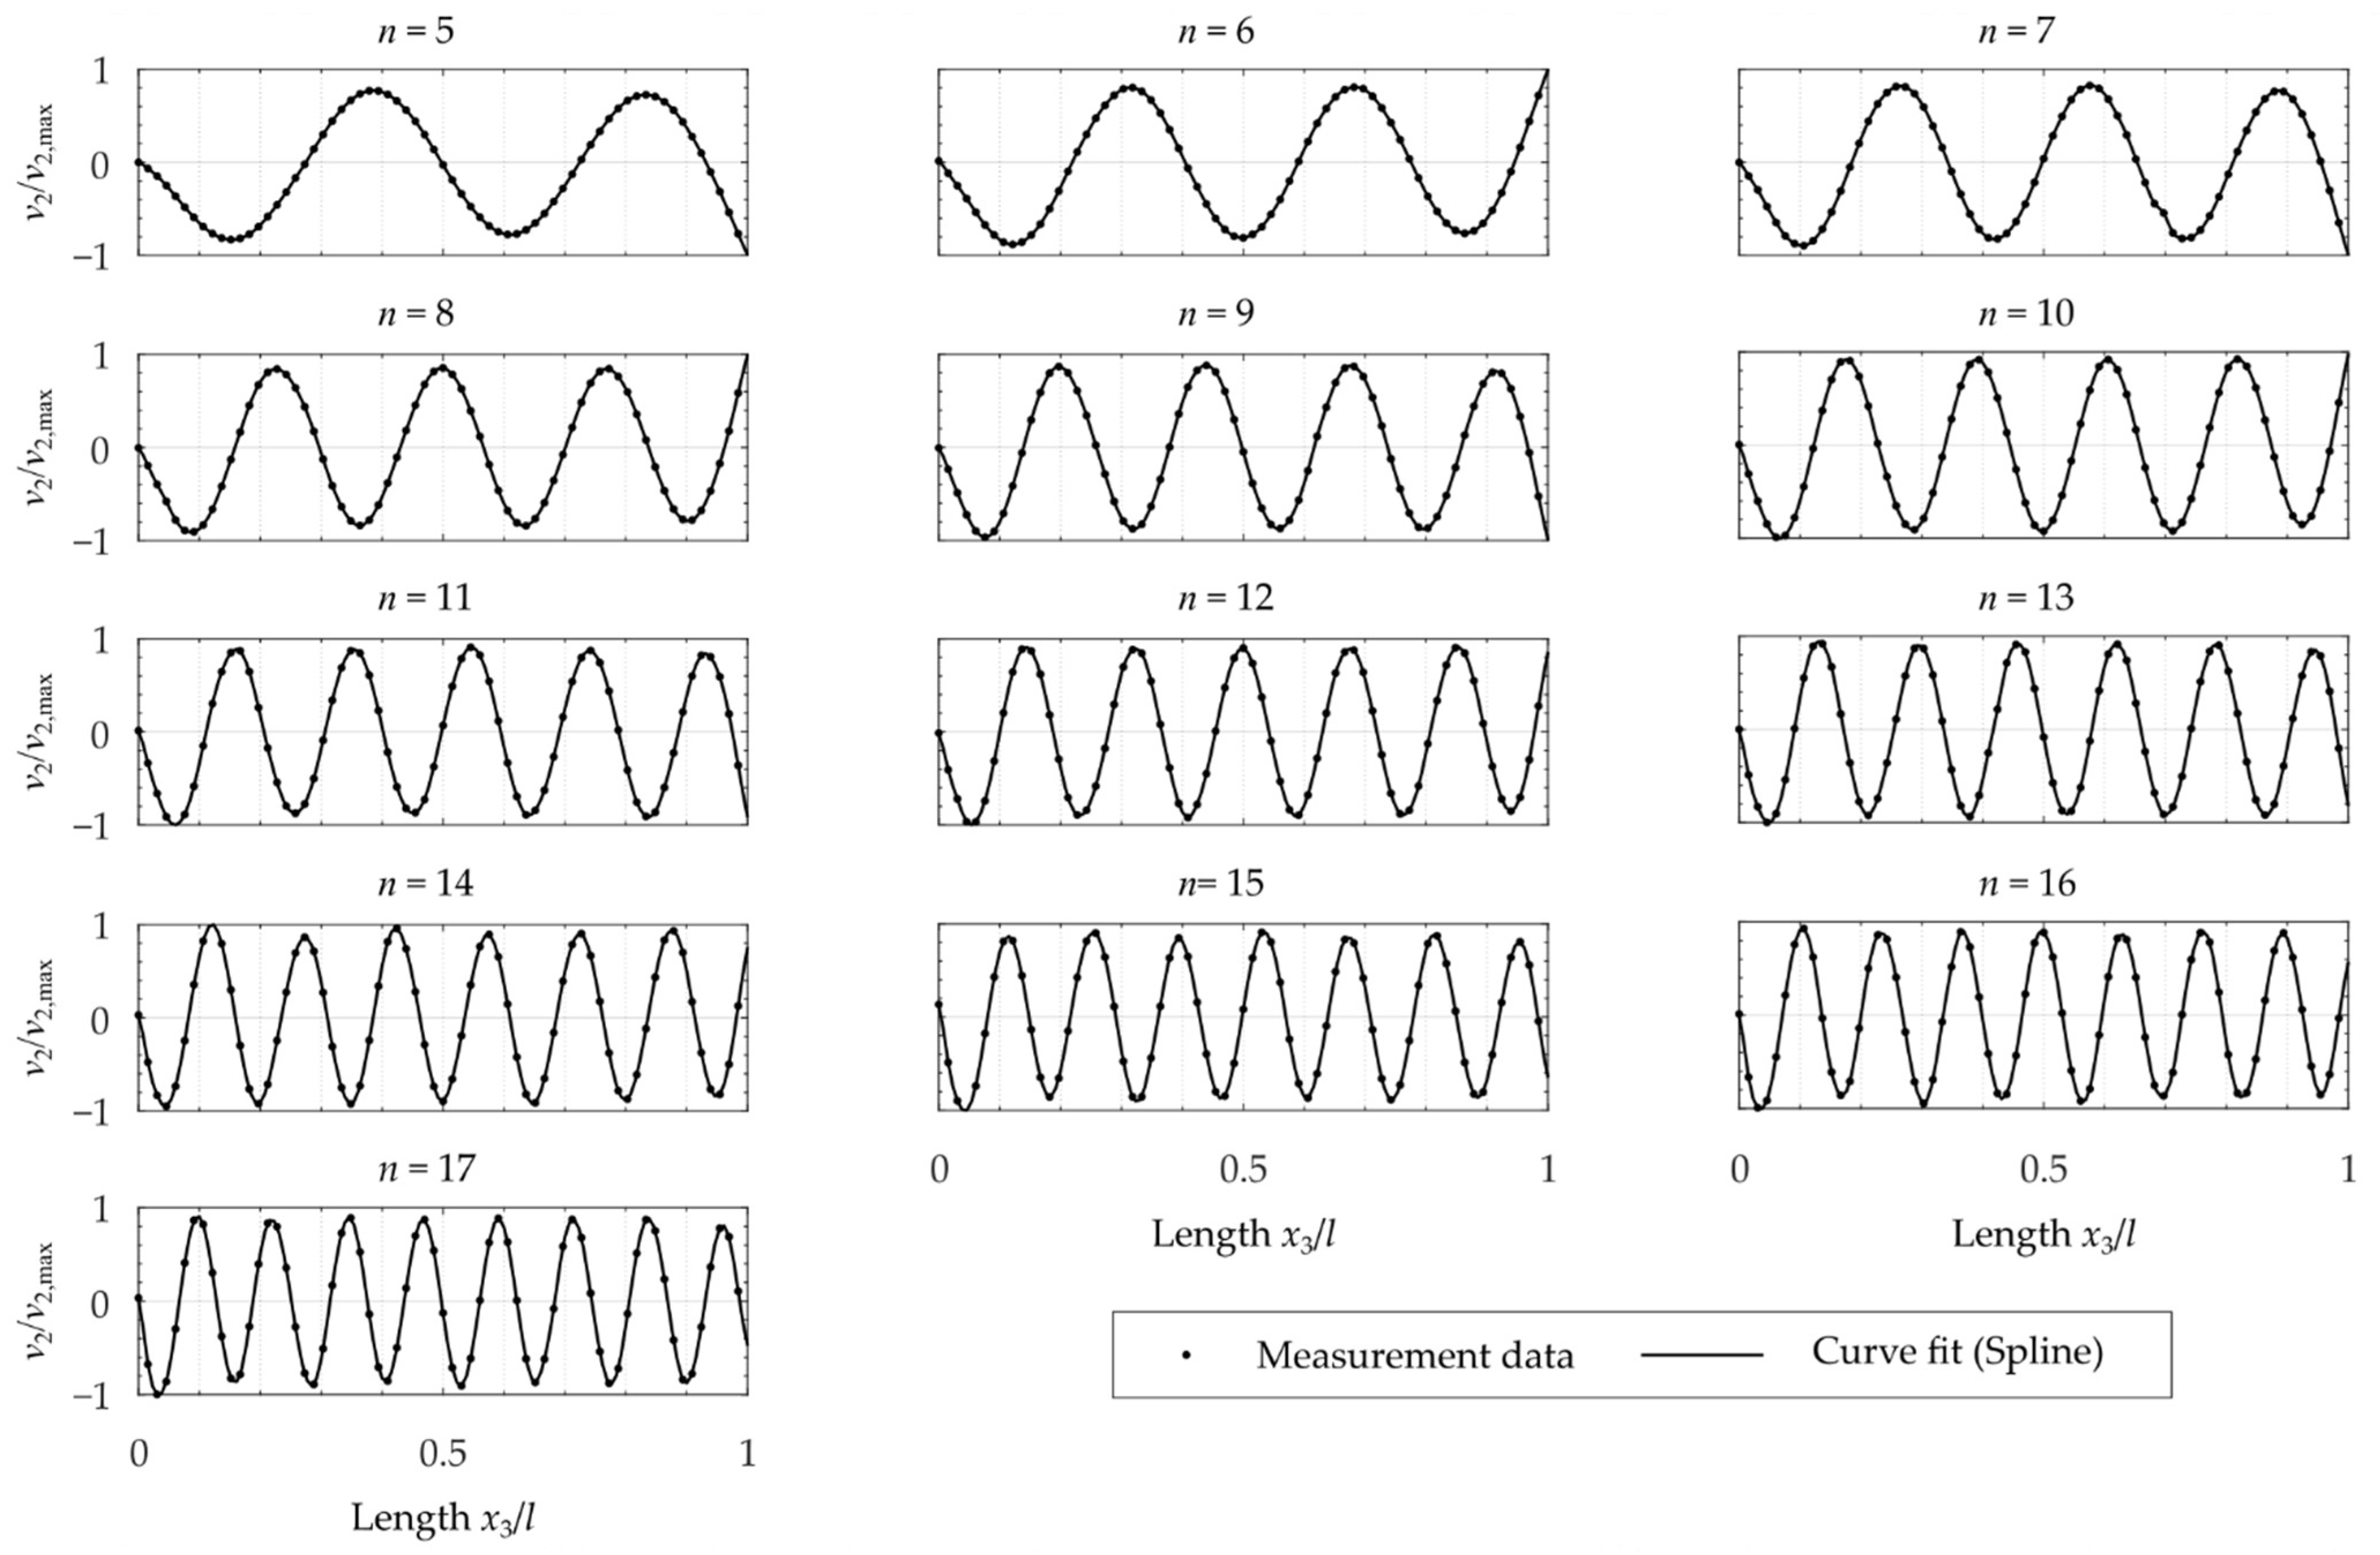
3.4. Resulting Velocity Amplitudes and Resonance Frequencies

The investigation of the natural frequencies f n of the orders n = 5 , 6 , , 17 of the investigated specimens resulted in a maximum relative deviation of ( f n , ξ f n ) / f n < 1 % with ξ = 1 , 2 , , 10 specimens (see Figure 6). The positions of the median values of the box graph showed right-skewed distributions. Since the vibration behavior of the polymeric test specimens depends directly on their geometry, the variations in the resonance frequencies that occurred were, among other factors, due to the slightly different dimensions of the test specimens and the minimally varying clamping length.
The natural frequencies f n as well as the mechanical loss factors tan δ were determined using the average frequency spectrum of the velocity v ^ 2 ( f ) under the assumption that the amplitude of the force signal applied to the excitation transducer is maintained approximately constant with frequency. However, due to resonances of the used test setup, the force amplitude cannot be kept constant, thus the response of the beam must be divided by the force amplitude. Furthermore, for the given experimental setup, only the velocity of the clamping adapter v 2 , e and the velocities of the beam v 2 were known. Consequently, the ratio of response to force amplitude cannot be determined. For this reason, in the current study, the natural frequencies and the loss factors were obtained using the frequency spectra of the beam’s velocities v ^ 2 ( f ) .
At the time t ¯ when the deflection reaches its maximum w 2 , e ( t ¯ ) = w ^ 2 , e , the velocity of the base excitation reaches a value of v 2 , e = 0 (Figure 7). Thus, at this time, the measured velocities v 2 ( x , t ) are equal to the relative velocities v 2 , r e l ( x , t ) = v 2 ( x , t ) v 2 , e ( t ) . Considering the resulting velocities, it can be seen that the defined geometrical boundary conditions Equations (17) and (18) were satisfied. Furthermore, the velocities v 2 ( x , t ¯ ) show a similar distribution as the vibrations of a single cantilever beam. Furthermore, it can be seen that the velocity maxima show a slight delay along the beam axis in the direction of the beam’s free end. However, this delay is quite small and, thus, was not quantified by means of the carried-out measurements. Nevertheless, it shows that the considered beam vibrations are damped vibrational modes.

3.5. Dynamic Mechanical Properties

The storage modulus E calculated by means of the Euler–Bernoulli theory decreases with increasing frequencies, while the storage modulus determined using the Timoshenko theory increases (Figure 8). However, for a frequency range up to 2 kHz, similar values of E were obtained for both theories. The classical Euler–Bernoulli theory does not include the effects of the terms involving rotary inertia or shear deformation. Thus, in this frequency range, the Euler–Bernoulli theory is applicable. For higher frequency modes, the effects of rotary inertia or shear deformation have to be involved. The loss modulus E calculated with the Timoshenko theory resulted in slightly higher values than the values obtained by means of the Euler–Bernoulli theory (Figure 8).
The application of the used test method has been found to produce desired results when used for testing materials consisting of one homogeneous layer. The resulting mechanical loss factors tan δ from DMA measurements on an identical material complement the measured values in the low-frequency range without major frequency dependence (Figure 9).
For the used test setup, large errors in the calculated properties can be a result of relatively small measurement errors. To minimize such systematic deviations, the measurement approach should be applied to well-damped viscoelastic materials only and the signal-to-noise ratio should not be very high. Thus, the displacement amplitude of the base excitation should not be chosen too small. The applicability of the used test configurations for anisotropic material polymeric materials, such as composites, has to be tested in further investigations. The evaluation of these materials requires a more in-depth analytical description of the base-excited beam’s vibrations and its resulting vibration-damping properties. However, using the test method illustrated in the current study enables the characterization of these materials, as well.

4. Conclusions

The used test setup of a piezoelectrically driven base excitation of a polymeric specimen and the non-contact velocity and temperature measurement reliably enables the measurement of the beam’s velocities, as well as its surface temperature. Evaluating the resonance frequencies and the 3 dB bandwidth, the viscoelastic properties of the polymer were successfully measured over a frequency range of 1 to 16 kHz. For the determination of these properties, the application of the Timoshenko beam theory was required due to the resulting higher frequency modes. As a result of preliminary investigations, the material behavior could be considered linear viscoelastic; the resulting temperature increase had no considerable effect on the specimen’s cyclic deformation and the applied displacement amplitude had no effect on the viscoelastic properties. However, the clamping force affected the boundary conditions and, thus, the beam’s vibrational behavior. The used test method as well as the resulting mechanical properties can be used for different applications in structural vibrations.

Author Contributions

Conceptualization, M.D., M.K. and N.M.; methodology, M.K. and M.D.; formal analysis, M.K.; investigation, M.K.; resources, N.M. and M.D.; writing—original draft preparation, M.K., R.B. and M.D.; writing—review and editing, M.K., M.D., R.B. and N.M.; visualization, M.K.; supervision, N.M.; project administration, M.D. and N.M.; funding acquisition, M.D., M.K. and N.M. All authors have read and agreed to the published version of the manuscript.

Funding

This research was funded by the German Research Foundation (grant no. DA 1701/1).

Data Availability Statement

The data presented in the current study are available on request from the corresponding author.

Conflicts of Interest

The authors declare no conflict of interest related to the current study.

References

  1. Menard, K.P.; Menard, N.R. Dynamic Mechanical Analysis; CRC Press: Boca Raton, FL, USA, 2020; ISBN 9780429190308. [Google Scholar]
  2. Kostka, P.; Holeczek, K.; Höhne, R.; Filippatos, A.; Modler, N. Extension and application of dynamic mechanical analysis for the estimation of spatial distribution of material properties. Polym. Test. 2016, 52, 184–191. [Google Scholar] [CrossRef]
  3. Sessner, V.; Liebig, W.V.; Jackstadt, A.; Schmid, D.; Ehrig, T.; Holeczek, K.; Gräbner, N.; Kostka, P.; von Wagner, U.; Weidenmann, K.A.; et al. Wide Scale Characterization and Modeling of the Vibration and Damping Behavior of CFRP-Elastomer-Metal Laminates—Comparison and Discussion of Different Test Setups. Appl. Compos. Mater. 2021, 28, 1715–1746. [Google Scholar] [CrossRef]
  4. Read, B.E.; Dean, G.D. The Determination of Dynamic Properties of Polymers and Composites; Wiley: Hoboken, NJ, USA, 1978; ISBN 0-470-26543-4. [Google Scholar]
  5. Hufenbach, W.; Böhm, R.; Langkamp, A.; Kroll, L.; Ritschel, T. Ultrasonic evaluation of anisotropic damage in multiaxially textile-reinforced thermoplastic composites made from hybrid yarns. Mech. Compos. Mater. 2006, 42, 151–162. [Google Scholar] [CrossRef]
  6. Almaraz, G.M.D.; Martínez, A.G.; Sánchez, R.H.; Gómez, E.C.; Tapia, M.G.; Juárez, J.C.V. Ultrasonic Fatigue Testing on the Polymeric Material PMMA, Used in Odontology Applications. Proced. Struct. Integ. 2017, 3, 562–570. [Google Scholar] [CrossRef]
  7. Backe, D.; Balle, F.; Eifler, D. Fatigue testing of CFRP in the Very High Cycle Fatigue (VHCF) regime at ultrasonic frequencies. Compos. Sci. Technol. 2015, 106, 93–99. [Google Scholar] [CrossRef]
  8. Almaraz, G.M.D.; Gómez, E.C.; Juárez, J.C.V.; Ambriz, J.L. Crack initiation and propagation on the polymeric material ABS (Acrylonitrile Butadiene Styrene), under ultrasonic fatigue testing. Frat. Ed Integrità Strutt. 2015, 34, 498–506. [Google Scholar] [CrossRef]
  9. Mignogna, R.B.; Green, R.E.; Duke, J.C.; Henneke, E.G.; Reifsnider, K.L. Thermographic investigation of high-power ultrasonic heating in materials. Ultrasonics 1981, 19, 159–163. [Google Scholar] [CrossRef]
  10. B, V.; Jade, N.; Bhirodkar, S. Measurement of damping properties of beeswax and cosmetic wax using Oberst beam method. Vibroeng. Procedia 2019, 29, 54–59. [Google Scholar] [CrossRef]
  11. Ozer, M.S.; Koruk, H.; Sanliturk, K.Y. Testing non-magnetic materials using Oberst Beam Method utilising electromagnetic excitation. J. Sound. Vib. 2019, 456, 104–118. [Google Scholar] [CrossRef] [Green Version]
  12. Dannemann, M.; Holeczek, K.; Leimert, J.; Friebe, S.; Modler, N. Adapted measuring sequence for the determination of directional-dependent dynamic material properties using a bending resonance method. Polym. Test. 2019, 79, 1–10. [Google Scholar] [CrossRef]
  13. Katunin, A. Evaluation of Criticality of Self-Heating of Polymer Composites by Estimating the Heat Dissipation Rate. Mech. Compos. Mater. 2018, 54, 53–60. [Google Scholar] [CrossRef]
  14. Katunin, A.; Pawlak, S.; Wronkowicz, A. Evaluation of Structural Degradation of Polymeric Composites Subjected to Self-Heating by the Thermal Diffusivity Analysis. Arab J. Sci. Eng. 2018, 43, 4541–4547. [Google Scholar] [CrossRef] [Green Version]
  15. Boccardi, S.; Carlomagno, G.M.; Meola, C.; Russo, P.; Simeoli, G. Evaluation of polypropylene based composites from thermal effects developing under cyclic bending tests. Compos. Struct. 2017, 182, 628–635. [Google Scholar] [CrossRef]
  16. Ledi, K.S.; Hamdaoui, M.; Robin, G.; Daya, E.M. An identification method for frequency dependent material properties of viscoelastic sandwich structures. J. Sound. Vib. 2018, 428, 13–25. [Google Scholar] [CrossRef]
  17. Liao, Y.; Wells, V. Estimation of complex Young’s modulus of non-stiff materials using a modified Oberst beam technique. J. Sound Vib. 2008, 316, 87–100. [Google Scholar] [CrossRef]
  18. Wojtowicki, J.-L.; Jaouen, L.; Panneton, R. New approach for the measurement of damping properties of materials using the Oberst beam. Rev. Sci. Instrum. 2004, 75, 2569–2574. [Google Scholar] [CrossRef] [Green Version]
  19. Kucher, M. Hochfrequent beanspruchte Polymerstrukturen für den Einsatz als endodontische Instrumente. Ph.D. Thesis, Technische Universität Dresden, Dresden, Germany, 2022. [Google Scholar]
  20. Curtis, D.C.; Moore, D.R.; Slater, B.; Zahlan, N. Fatigue testing of multi-angle laminates of CF/PEEK. Composites 1988, 19, 446–452. [Google Scholar] [CrossRef]
  21. Kenny, J.M.; Marchetti, M. Elasto-plastic behavior of thermoplastic composite laminates under cyclic loading. Compos. Struct. 1995, 32, 375–382. [Google Scholar] [CrossRef]
  22. Leveuf, L.; Marco, Y.; Le Saux, V.; Navrátil, L.; Leclercq, S.; Olhagaray, J. Fast screening of the fatigue properties of thermoplastics reinforced with short carbon fibers based on thermal measurements. Polym. Test. 2018, 68, 19–26. [Google Scholar] [CrossRef] [Green Version]
  23. Shrestha, R.; Simsiriwong, J.; Shamsaei, N. Load history and sequence effects on cyclic deformation and fatigue behavior of a thermoplastic polymer. Polym. Test. 2016, 56, 99–109. [Google Scholar] [CrossRef]
  24. Shrestha, R.; Simsiriwong, J.; Shamsaei, N. Mean strain effects on cyclic deformation and fatigue behavior of polyether ether ketone (PEEK). Polym. Test. 2016, 55, 69–77. [Google Scholar] [CrossRef]
  25. Shrestha, R.; Simsiriwong, J.; Shamsaei, N.; Moser, R.D. Cyclic deformation and fatigue behavior of polyether ether ketone (PEEK). Int. J. Fatigue 2016, 82, 411–427. [Google Scholar] [CrossRef]
  26. Simsiriwong, J.; Shrestha, R.; Shamsaei, N.; Lugo, M.; Moser, R.D. Effects of microstructural inclusions on fatigue life of polyether ether ketone (PEEK). J. Mech. Behav. Biomed. Mater. 2015, 51, 388–397. [Google Scholar] [CrossRef] [PubMed]
  27. Abbasnezhad, N.; Khavandi, A.; Fitoussi, J.; Arabi, H.; Shirinbayan, M.; Tcharkhtchi, A. Influence of loading conditions on the overall mechanical behavior of polyether-ether-ketone (PEEK). Int. J. Fatigue 2018, 109, 83–92. [Google Scholar] [CrossRef]
  28. Röchling Sustaplast. Technical Data Sheet—SustaPEEK. Available online: https://www.roechling.com/de/industrial/werkstoffe/thermoplastische-kunststoffe/showpdf?selectedUid=1756&slang=0&cHash=2150716fb11be797f9bddb6b83e018a4 (accessed on 10 June 2021).
  29. Lakes, R. Viscoelastic Materials; Cambridge University Press: Cambridge, UK, 2009; ISBN 9780511626722. [Google Scholar]
  30. Dresig, H.; Holzweißig, F.; Rockhausen, L. Maschinendynamik. Symposium Universität-GH- Essen, 26–28 June 1984; Springer: Berlin/Heidelberg, Germany, 2011; ISBN 978-3-642-16010-3. [Google Scholar]
  31. Möser, M.; Kropp, W.; Cremer, L.; Heckl, M. Körperschall. Physikalische Grundlagen und Technische Anwendungen (German Edition); Springer: Dordrecht, The Netherlands, 2009; ISBN 978-3-540-49048-7. [Google Scholar]
  32. Magnus, K.; Popp, K.; Sextro, W. Kontinuumsschwingungen. In Schwingungen; Magnus, K., Popp, K., Sextro, W., Eds.; Springer Fachmedien Wiesbaden: Wiesbaden, Germany, 2016; pp. 269–309. [Google Scholar]
  33. Wauer, J. Kontinuumsschwingungen. Vom Einfachen Strukturmodell Zum Komplexen Mehrfeldsystem, Mit 74 Aufgaben und 41 Beispielen; Vieweg+Teubner: Wiesbaden, Germany, 2008. [Google Scholar]
  34. Kaneko, T. On Timoshenko’s correction for shear in vibrating beams. J. Phys. D Appl. Phys. 1975, 8, 1927–1936. [Google Scholar] [CrossRef]
  35. Baur, E.; Brinkmann, S.; Osswald, T.A.; Schmachtenberg, E.; Saechtling, H. Saechtling Kunststoff Taschenbuch; Hanser: München, Germany, 2007; ISBN 978-3-446-40352-9. [Google Scholar]
Figure 1. Experimental setup: (a) arrangement of the used measurement devices, (b) detailed view of the base-excited specimen, (c) simplified model (single point laser vibrometer, A; scanning laser vibrometer, B; infrared camera, C; function generator, D; optical table, E; amplifier, F; specimen, G; clamping adapter, H; fixed piezoelectric adapter, I; mounting of actor, J; grub screw, K; clamping plate, L).
Vibration 05 00024 g001
Figure 2. Influence of the actuator’s voltage amplitude U ^ e on the specimen’s vibration behavior (evaluation of the average frequency spectra v ^ 2 ( f ) , tightening torque M t = 1.1 Nm): (a) resonance at around 2.4 kHz, (b) resonance at around 15 kHz.
Vibration 05 00024 g002
Figure 3. Influence of the tightening torque M t (voltage amplitude of the actuator U ^ e = 11 V): (a) Resonance at 1.5 kHz, (b) Resonance at 15 kHz.
Vibration 05 00024 g003
Figure 4. Temperature distribution after a measuring time of t = 209 s (tightening torque M t = 1.1 Nm, voltage amplitude of the actuator U ^ e = 54 V, excitation frequency f e = 12.4 kHz).
Vibration 05 00024 g004
Figure 5. Time curve of the change of displacement amplitude v ^ 2 v ^ 2 | t = 0 at the position x = (2.5 mm, 0, 65 mm) and of the average temperature difference Δ ϑ (new unloaded sample, tightening torque M t = 1.1 Nm, voltage amplitude of the actuator U ^ e = 11 V, excitation frequency f e = 13.4 kHz).
Vibration 05 00024 g005
Figure 6. Variation of the measured natural frequencies (bending mode) f j , ξ of the polymeric specimen ξ = 1 ,   2 ,   ,   10 (tightening torque M t = 1.1 Nm, voltage amplitude of the actuator U ^ e = 11 V).
Vibration 05 00024 g006
Figure 7. Measured velocity distribution v 2 ( t ¯ ) at the time of maximum displacement of excitation u 2 , e ( t ¯ ) = u ^ 2 , e for a harmonic mono-frequency excitation at the determined resonance frequencies f e = f n with n = 5 ,   6 , ,   17 (tightening torque M t = 1.1 Nm, voltage amplitude of the actuator U ^ e = 11 V).
Vibration 05 00024 g007
Figure 8. Resulting mechanical properties of PEEK (tightening torque M t = 1.1 Nm, voltage amplitude of the actuator U ^ e = 11 V): (a) storage modulus E , (b) loss modulus E .
Vibration 05 00024 g008
Figure 9. Frequency dependence of the mechanical loss factor tan δ based on dynamic mechanical analysis (DMA) and the evaluation of the base-excited beam’s damping behavior.
Vibration 05 00024 g009
Table 1. Experimental parameters for vibration measurement.
Parameter 1Used Value/Description
General settings
Output   voltage   amplitude   and   offset   U ^ e From 2.3 V to 54 V
Investigated frequency rangeFrom 1 kHz to 16 kHz
Measurement   velocity   of   excitation   v 2 , e ( t ) Scanning laser vibrometer (SLV)
Measurement   velocity   of   excitation   v 2 ( x , t ) One-point laser vibrometer (OLV)
Tightening   torque   M t From 0.5 Nm to 1.7 Nm
Determination of natural frequencies f j and mechanical loss factors   tan δ ( f j )
Excitation   signal   actuator   U e ( t ) Linear sweep
Measuring time12.8 s
Excitation   frequency   f e 1 kHz to 16 kHz
Sampling frequency128 kHz
Signal filterNo filter
Window functionRectangular window
Data collection modeFast Fourier transform (FFT)
Determination of natural bending vibration modes
Excitation   signal   actuator   U e ( t ) Harmonic mono-frequency excitation, Equation (1)
Measuring time0.512 s
Excitation   frequency   f e = f n Resonant excitation
Sampling frequency128 kHz
Signal filterNo filter
1 The parameters were determined on the basis of various preliminary investigations.
Publisher’s Note: MDPI stays neutral with regard to jurisdictional claims in published maps and institutional affiliations.

