1. Introduction
Building cladding constitutes the first structural component upon which blast pressure is applied during an external explosion incident. Hence, cladding should be designed accordingly, aiming at preventing the blast wave from entering the building and averting hazardous consequences in the building interior. If cladding is sufficiently strong, the main structure also needs to resist the explosion effects, as it offers support to the cladding. Thus, the main structure should also be designed against blast loading and, more specifically, against the dynamic reactions transmitted to it from the cladding.
However, while cladding is usually designed against blast loading assuming plastic energy dissipation, it may be desirable to design the main structure elastically. The main structure is generally considered as non-sacrificial [
1,
2], and the integrity of the main columns, at least, should be sustained, ensuring that they exhibit minimal lateral displacements with limited P-Δ effects [
3]. Hence, the blast-induced dynamic forces transmitted to the supporting structure by the cladding should be reduced to the highest extent. Such dynamic actions on the supporting structure may be altered by properly modifying the cladding characteristics, i.e., its resistance, stiffness, and mass.
In this context, the cladding membrane behavior has been found to be critical, as it leads to increased in-plane and out-of-plane reaction forces [
4,
5]. Generally, the cladding is designed assuming inelastic flexural action against blast effects, but it may also be designed with catenary action [
6]. However, in order for membrane resistance (catenary action) to be efficiently used, large deformations are needed, and the respective connections should be designed accordingly, exhibiting appropriate strength and ductility. These structural implications, associated with membrane action, have limited the exploitation of membrane action in typical structural engineering practice. On the other hand, the opposite is the case in blast-resistant design, as catenary action is extensively applied to safeguard structures against progressive collapse through slabs and tie beams [
7], to protect laminated glass panes with PVB layers [
8], or to serve as a reserve safety for structural components that have exhausted their bending strength and ductility [
6].
The effects of panel stiffness on its maximum reaction forces have been analytically examined in [
9] for the case of a clamped rectangular plate. It was found that in the elastic limit of both the quasi-static and the impulsive regime, the transmitted membrane forces were significantly increased with thickness decrease. Sandwich panels consisting of a face plate, a core, and a back plate have also been found to lead to increased reaction stretching forces when subjected to blast loading [
4]. When compared with equivalent thickness solid plates with significant membrane behavior, it was shown that the sandwich panels lead to lower out-of-plane reaction forces [
5].
The membrane resistance is even more significant for glass panes due to their small thickness. As noted in [
10], membrane forces are increased when laminated glass is deformed. This happens up to the post-crack phase, where only membrane resistance is activated, and the respective reaction forces (both in-plane and out-of-plane) are so large that they should be calculated in detail for the glass fixings design.
In the present research study, the influence of cladding membrane behavior on the supporting structure was examined through dimensionless SDOF (Single Degree of Freedom) models. The dimensionless SDOF models were employed because they can lead to generalized observations about a variety of cladding material and geometric arrangements that can be described by the respective material model. Dimensionless diagrams are produced offering quantitative and qualitative estimations about the role of cladding membrane behavior over the supporting structure. The observations are demonstrated and verified through a numerical model of a typical steel cladding-to-supporting structure application.
2. Dimensionless SDOF Analysis of the Cladding to the Supporting Structure System
2.1. Derivation of Equations of Motion
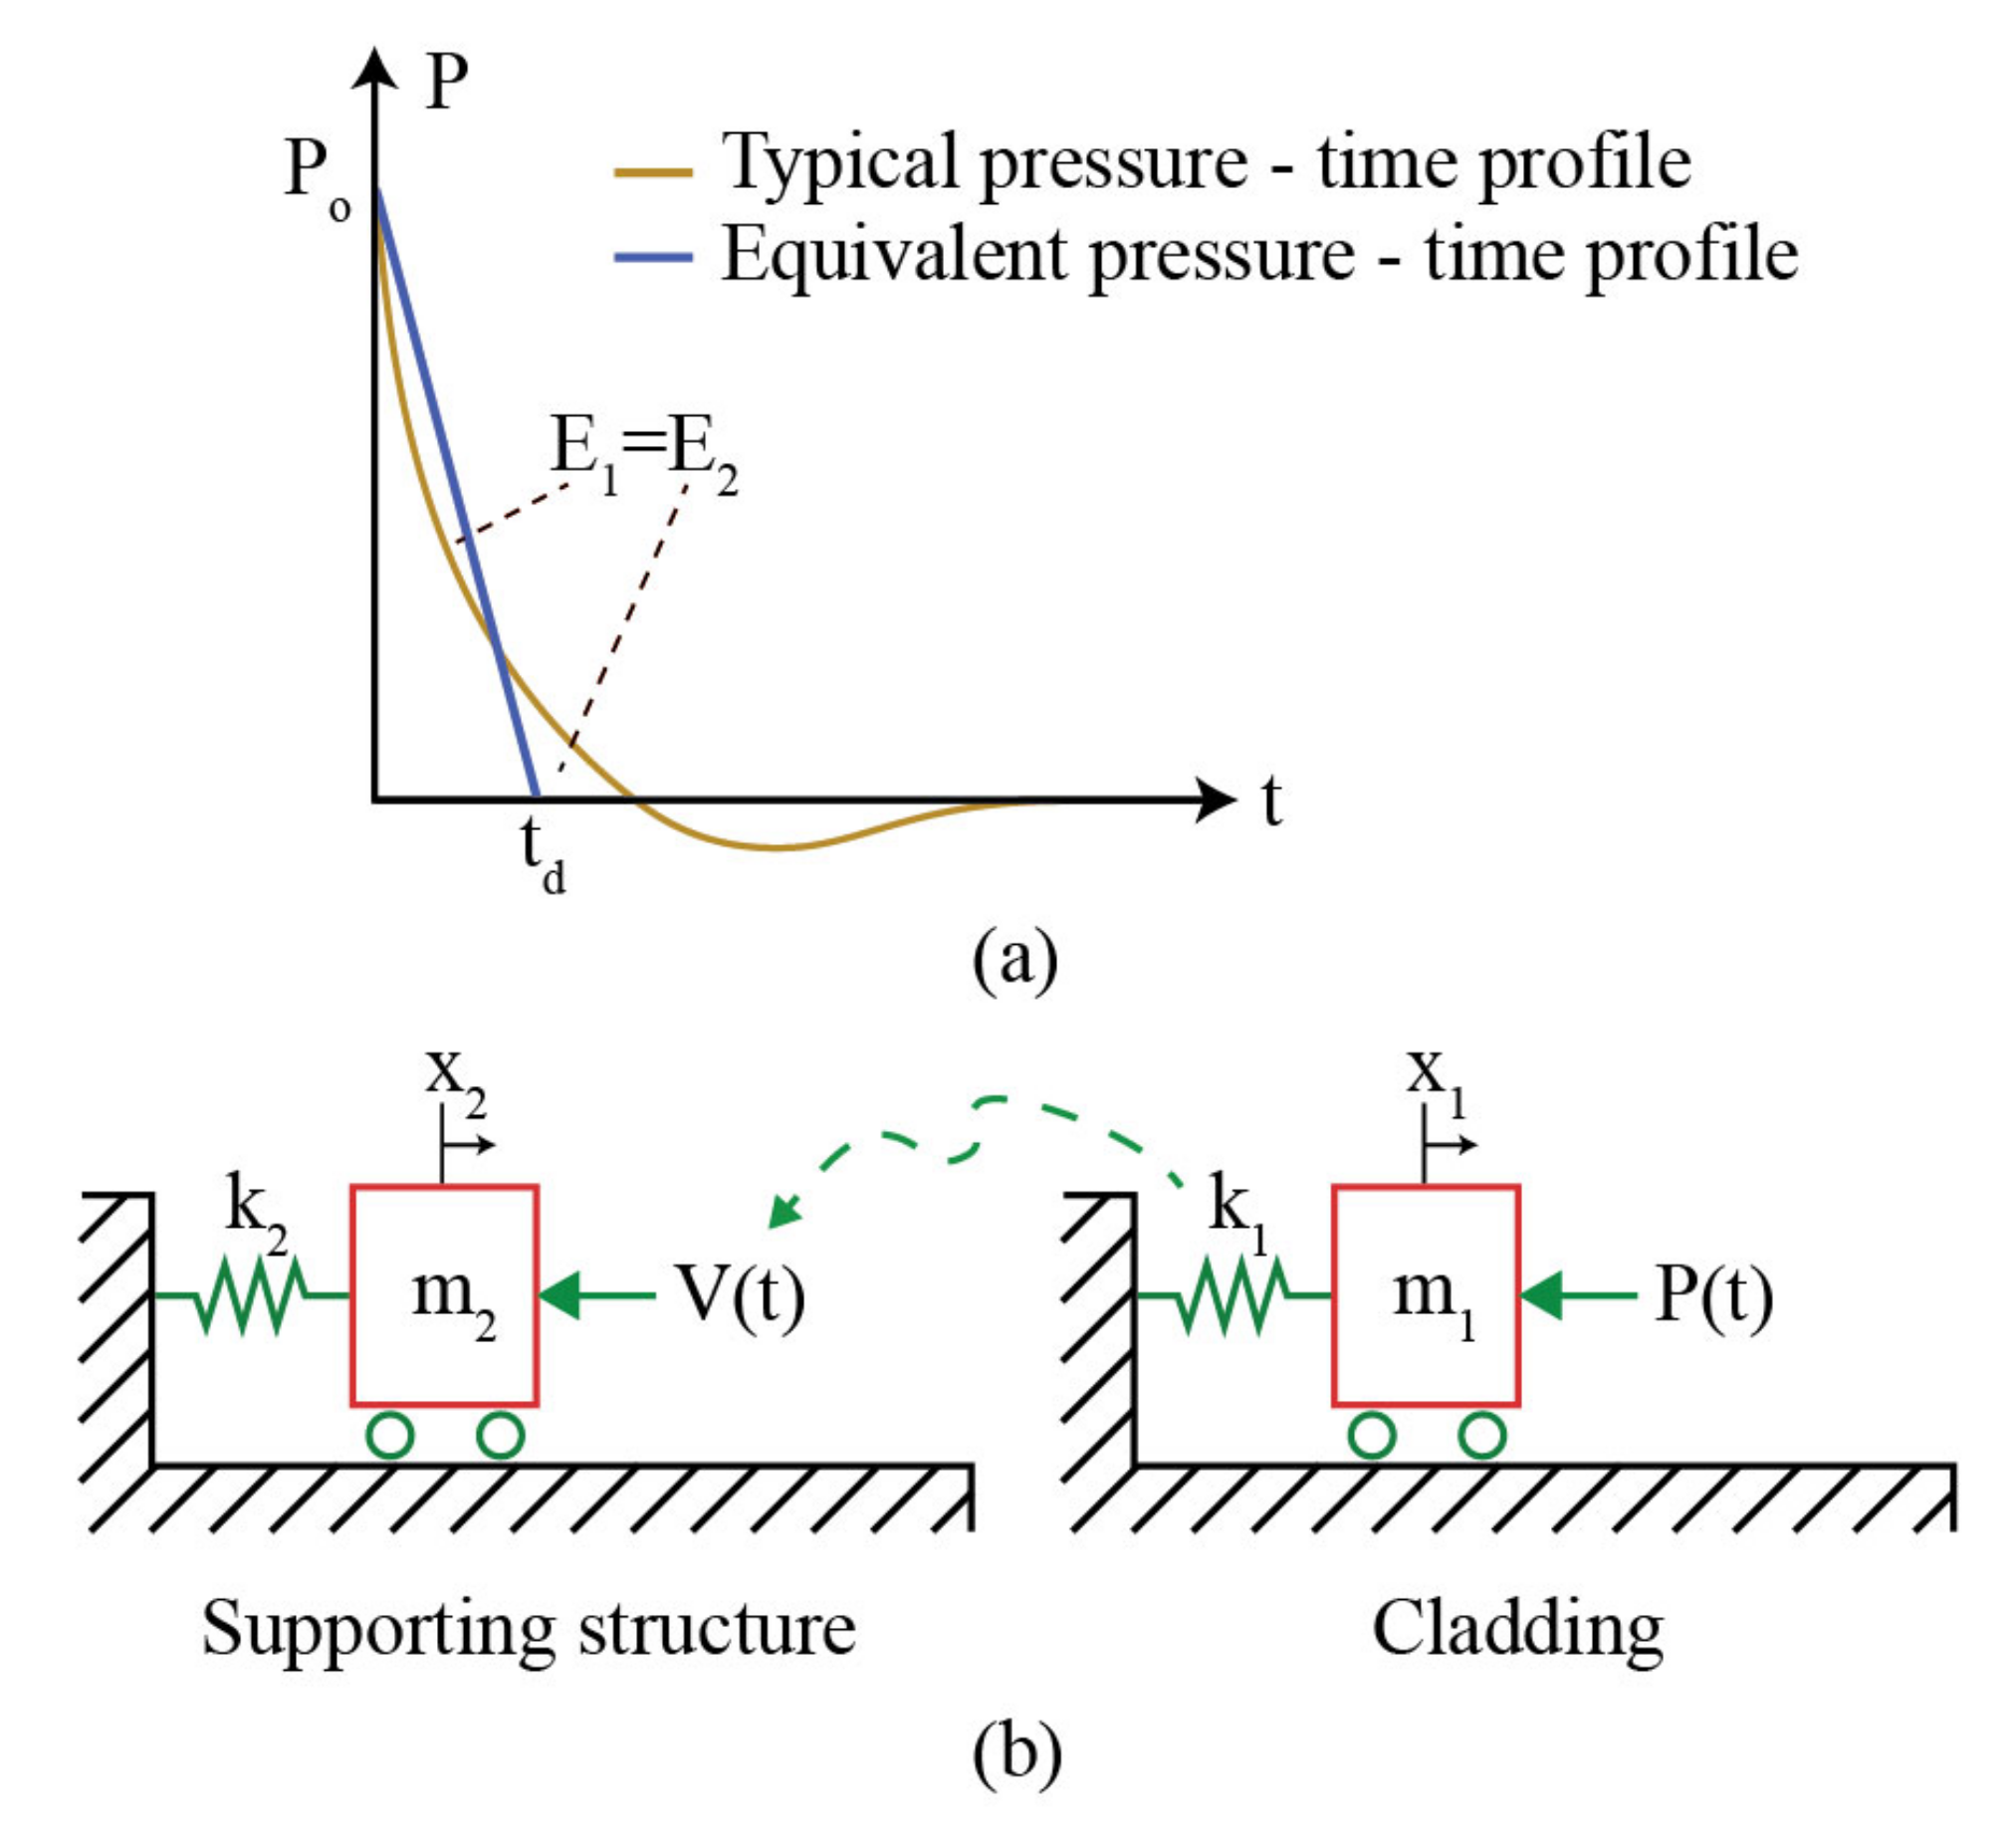
The modeling of the cladding-to-supporting structure system was accomplished through a two-step SDOF time history analysis, as shown in
Figure 1.
First, an SDOF analysis was performed representing the cladding subjected to blast loading (first step). Subsequently, another SDOF analysis was performed representing the supporting structure subjected to the dynamic reactions of the cladding (second step). The corresponding displacements are denoted by x1 (cladding) and x2 (supporting structure).
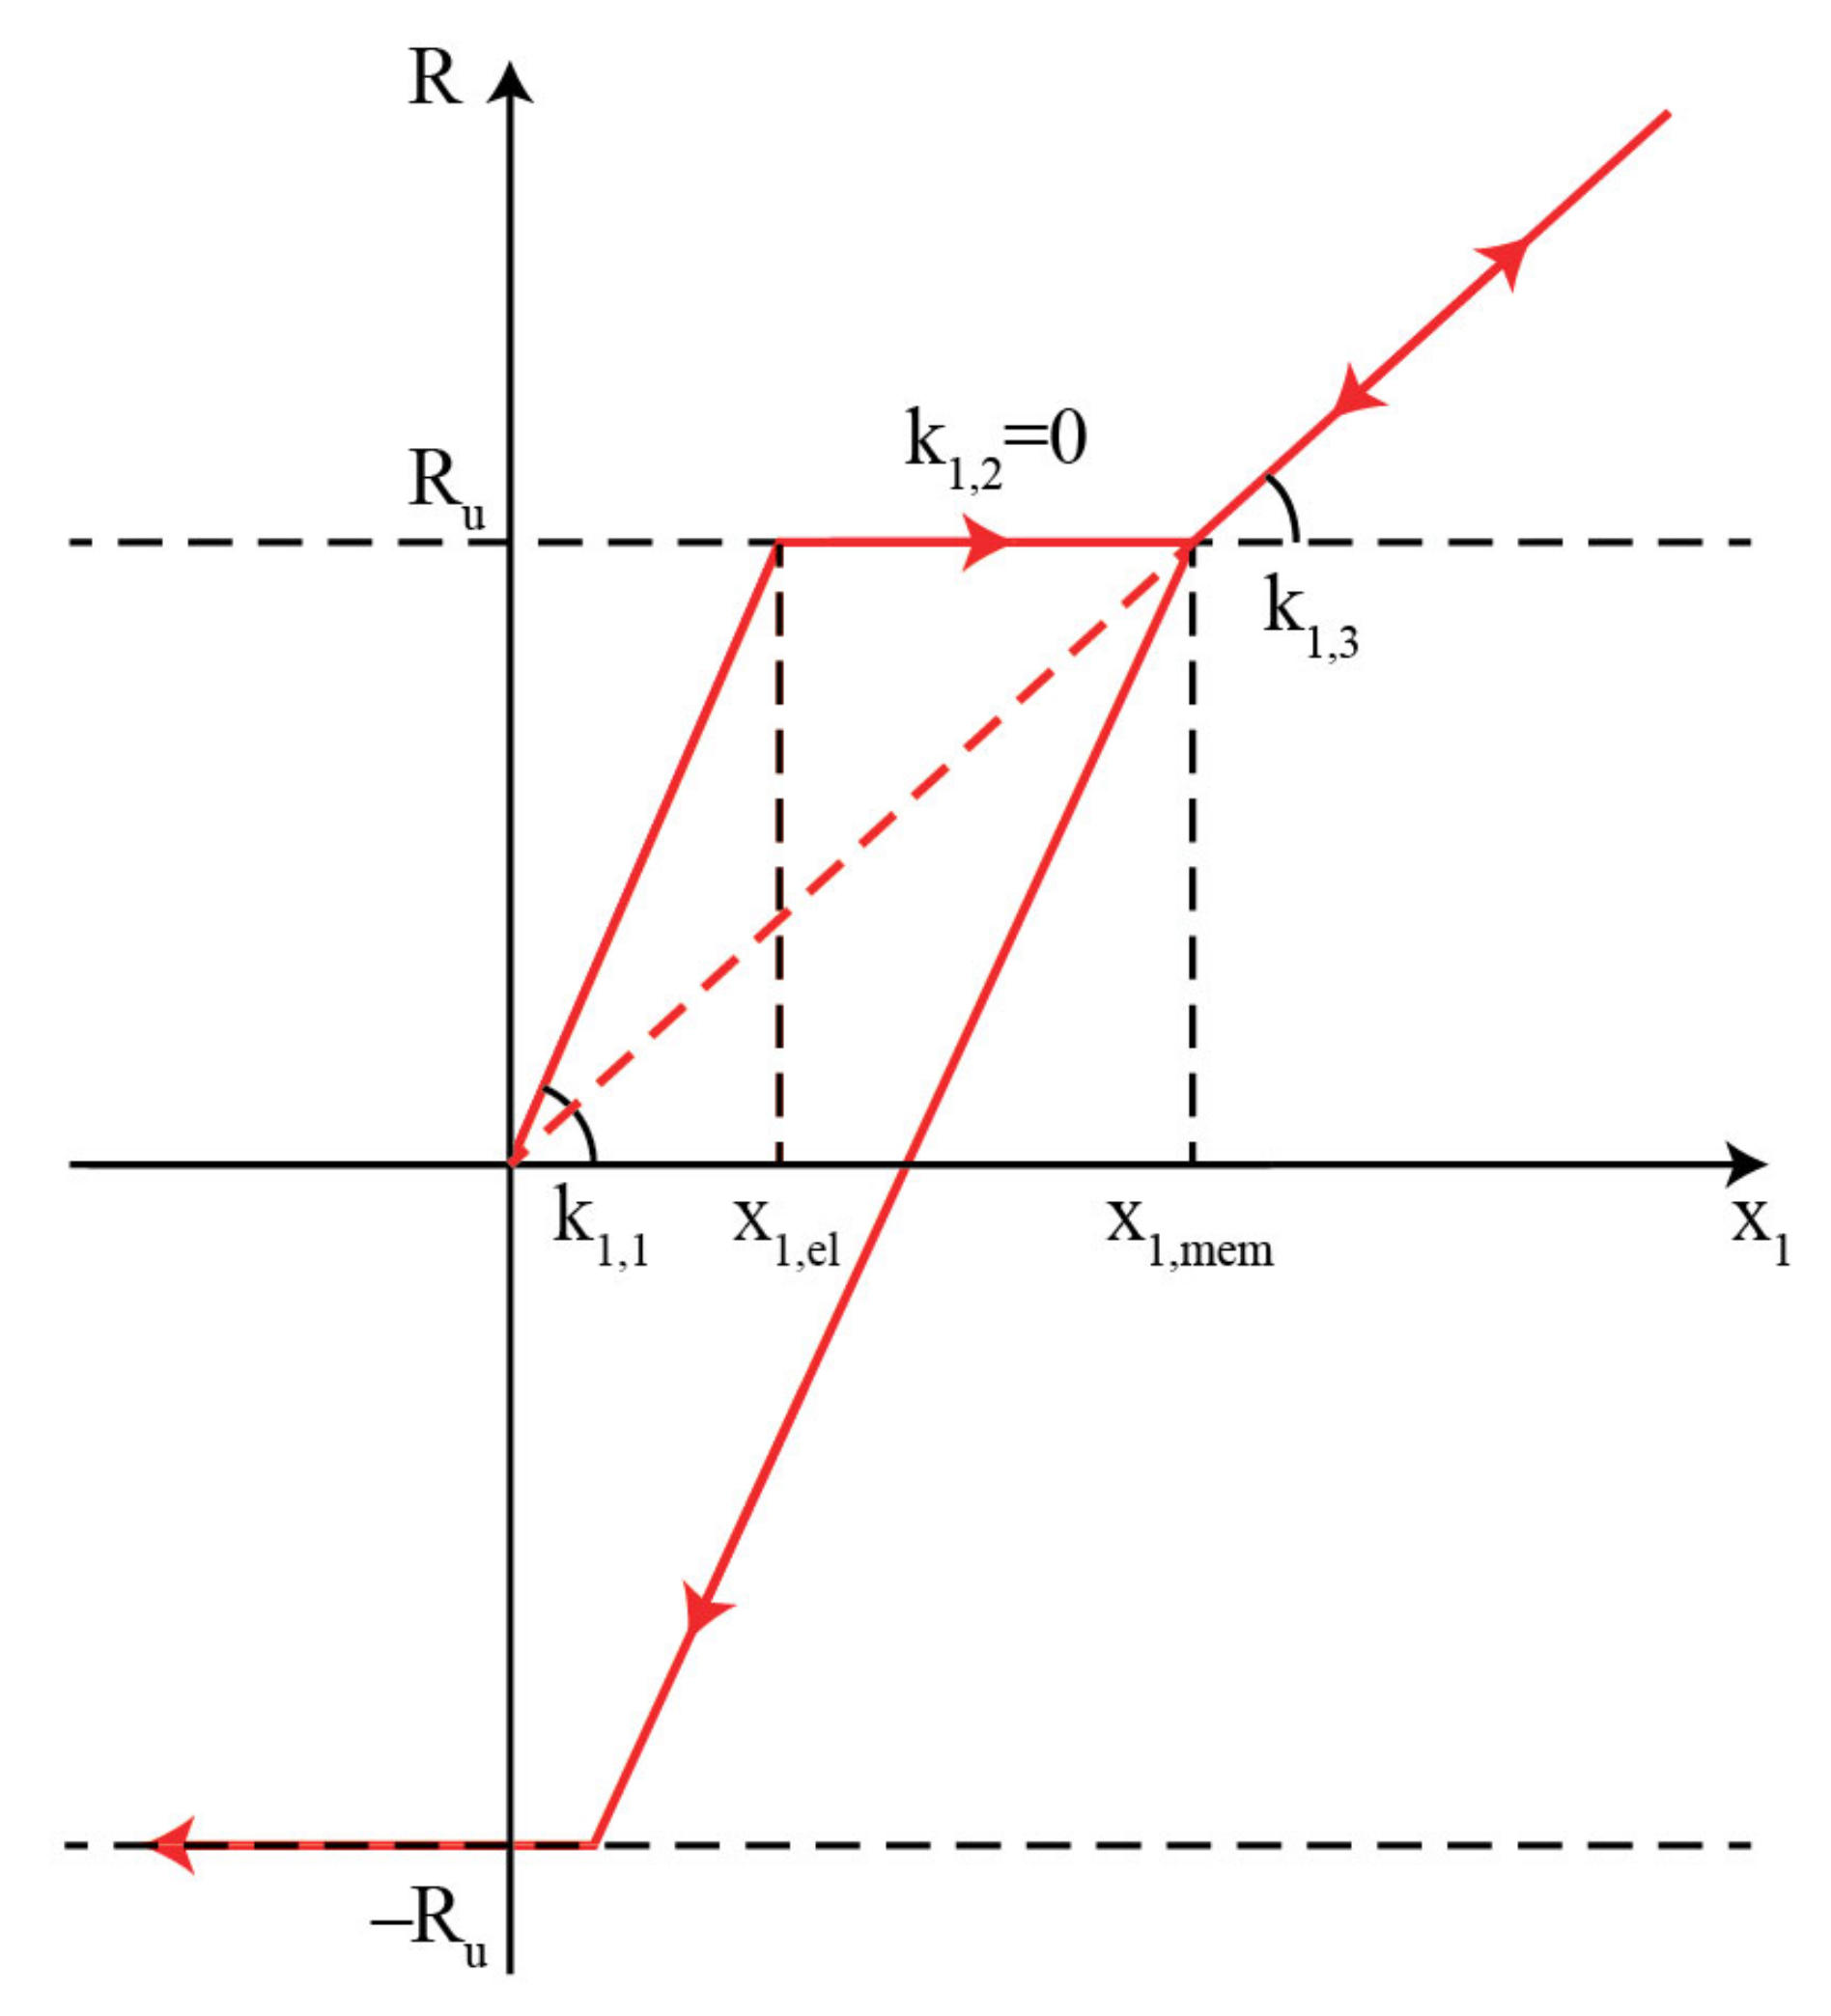
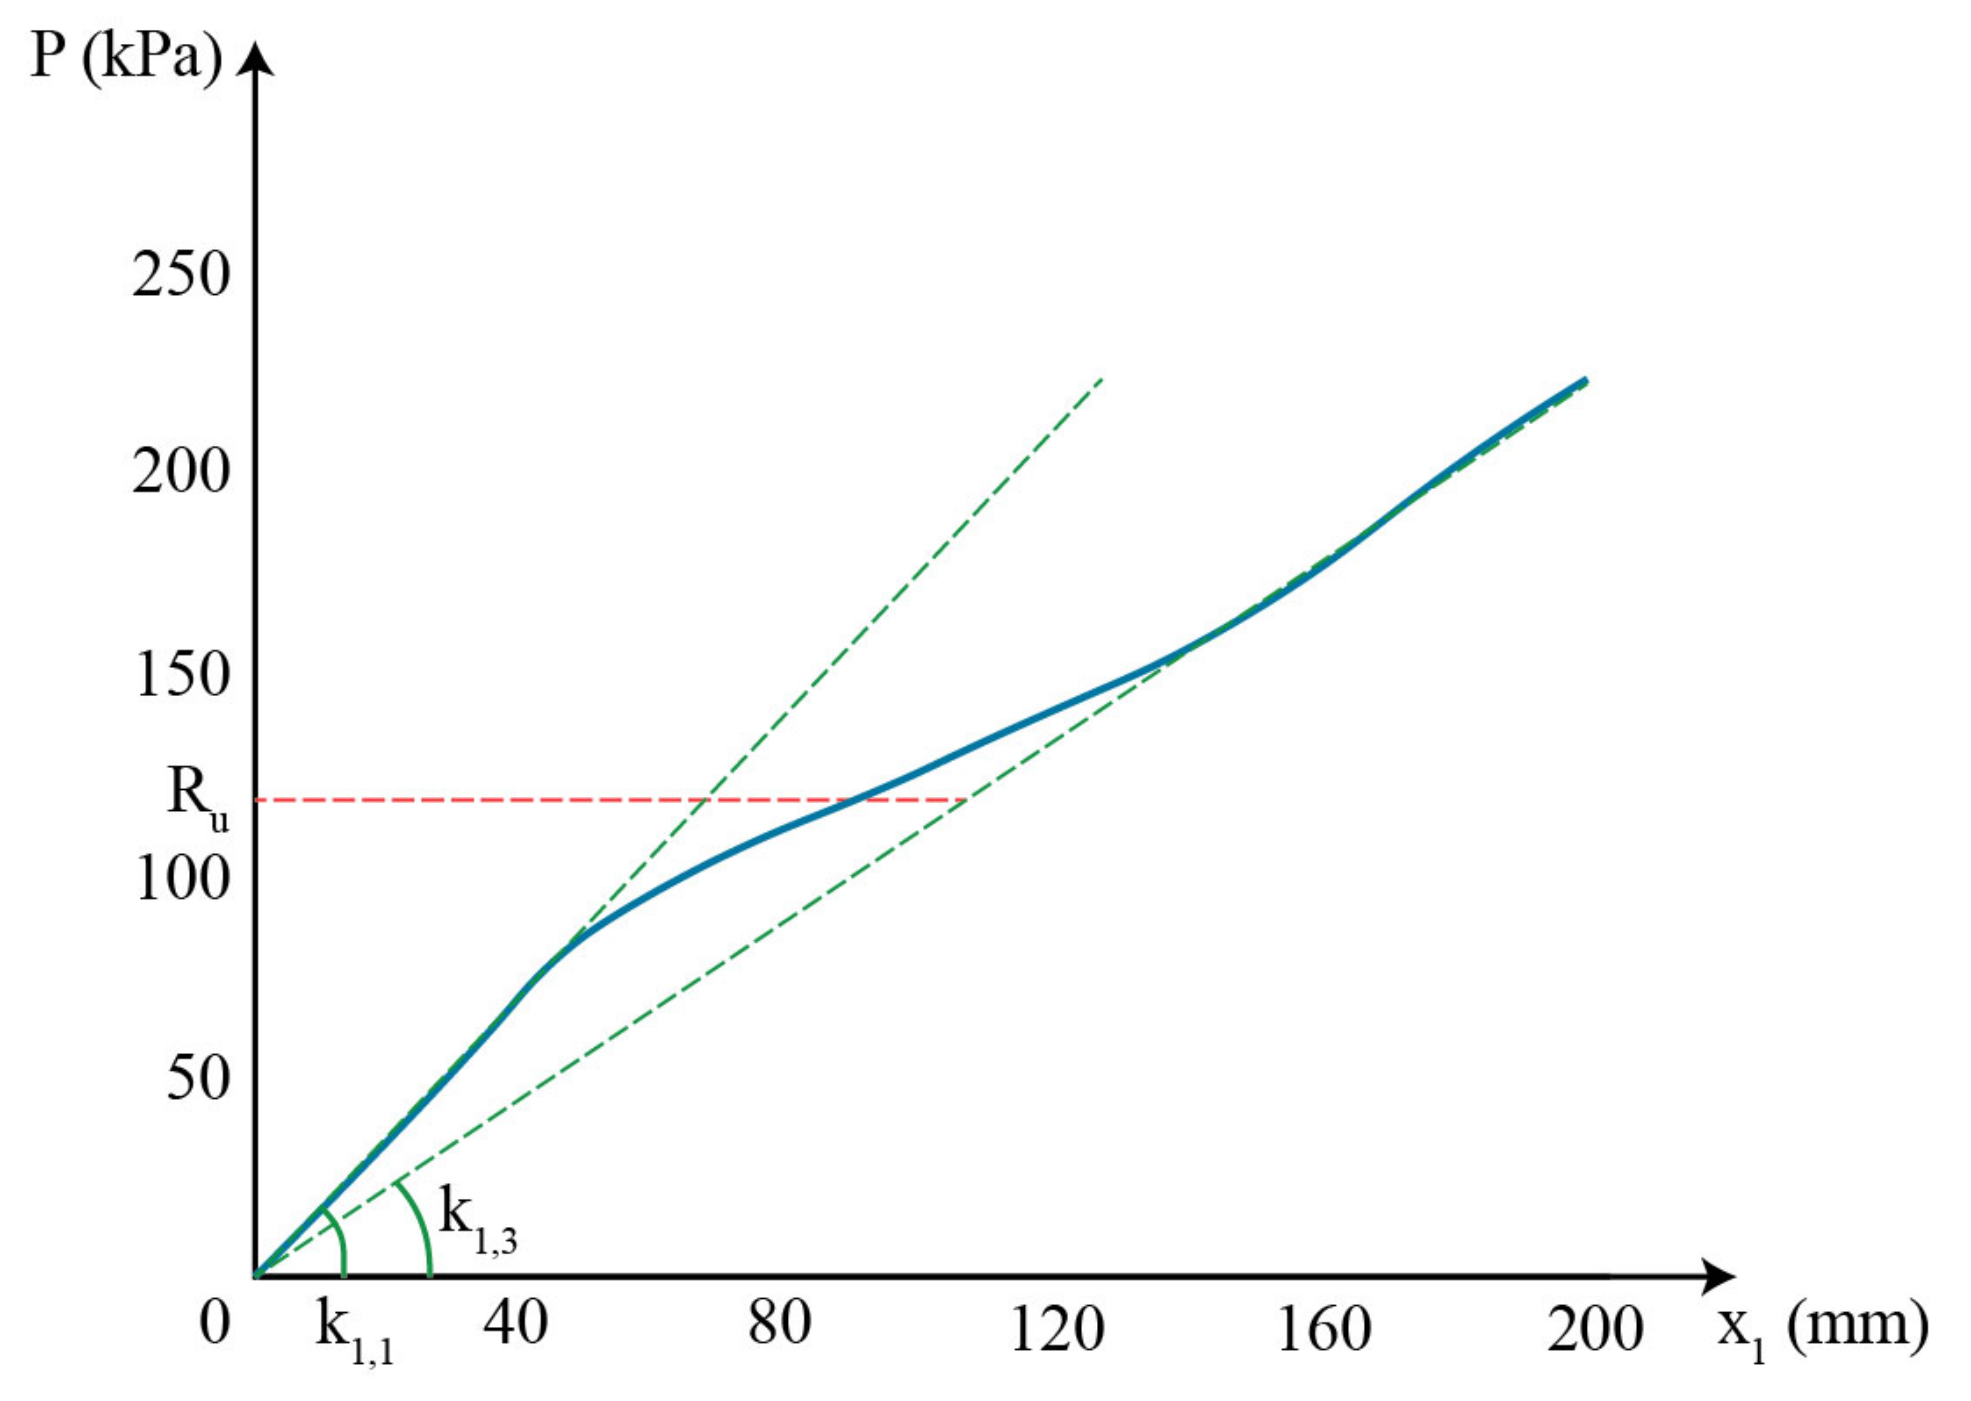
The spring that is associated with cladding stiffness is described by the force–displacement diagram of
Figure 2. Generally, the membrane effects can be incorporated through various methodologies. An analytical methodology for predicting the maximum displacement of a structural component subjected to blast loading by taking into account the membrane effects of the cladding has been presented in [
11]. Along with this methodology, extended SDOF approaches with membrane properties have also been presented in [
12,
13]. In the present study, the approach that is prescribed in [
13] was adopted. According to this approach, an initial elastic stiffness
k1,1 is assigned to the SDOF. When the cladding reaches its ultimate resistance
Ru, its stiffness is set to zero (
k1,2 = 0), until the cladding develops sufficiently large displacements (
x1,mem) to initiate membrane action.
If the membrane stiffness
k1,3 is lower than the bending stiffness
k1,1, the cladding exhibits both bending and membrane behavior. However, if the membrane stiffness
k1,3 is significantly higher than the bending stiffness
k1,1, the cladding can be considered to be a purely tensile structure, depending only on
k1,3 and neglecting both
k1,1 and the horizontal plasticity branch in the force–displacement diagram. This difference is discussed further in
Section 3 (both bending and membrane stiffness) and
Section 4 (membrane structure).
The unloading curve of the force–displacement diagram was applied as suggested in [
14]. More specifically, the unloading curve corresponds to linear material and nonlinear geometry. Thus, the horizontal branch of the loading curve, which accounts for the effects of plasticity, is neglected in the unloading phase. Plasticity is then reactivated during rebound if the force reaches the cladding negative ultimate resistance,
–Ru.
The cladding and supporting structure masses are denoted by
m1 and
m2, respectively. Along with mass
m1, the load–mass transformation factor is employed in order to appropriately convert the cladding component into an SDOF, where a
1,1, b
1,1, a
1,2, and b
1,2 constitute the respective coefficients for the cladding dynamic reactions [
15]. Furthermore, the supporting structure spring is considered as elastic (due to its non-sacrificial characteristics explained in
Section 1) and is denoted by
k2.
The corresponding equations of motion and dynamic reactions
V(
t) of the cladding SDOF are described by Equations (1)–(7), separated into the various regions of cladding response, i.e., the elastic region, the plastic region, and the membrane action region. The equations are also applicable during the unloading of the cladding SDOF in a similar manner as for the aforementioned regions. In these equations, the blast loading
P(
t) is applied as an equivalent triangular load, as discussed in [
16] and shown in
Figure 1, while the cladding membrane stiffness is calculated by employing the cladding axial resistance
Np and length
L. Moreover, damping has not been accounted for because it has negligible effects in blast-resistant design [
17,
18]. The support reaction
V(
t) is doubled when applied to the supporting structure because it refers to the reactions of both adjacent cladding components.
The equations of motion can be further developed in non-dimensional form through the parameters of Equations (8)–(11). The non-dimensionalization of the displacement is performed by dividing with the static displacement
xst2 =
Po/k2, while the non-dimensionalization of time is performed by dividing with the blast positive phase duration
td and natural period of the supporting structure
T2.
By applying a similar procedure with the one described in [
15], Equations (1)–(7) can be converted into Equations (12)–(18). According to these equations, the maximum displacement of the supporting structure can be estimated through the maximum value of
n2, which constitutes the
DLF2 (Dynamic Load factor, ratio of maximum displacement
xmax2 to static displacement
xst2) of the supporting structure.
The above differential equations were solved in MATLAB [
19] for a wide range of the five dimensionless parameters
m2/
m1,
k2/
k1,1,
Ru/Po,
k1,3/
k1,1, and
td/T2. The Newmark average acceleration method was applied with γ = 0.5, β = 0.25, and a sufficiently small time step in order to capture the maximum displacement at the first oscillation cycle, as noted in [
20].
2.2. Assumptions and Limitations
The range of validity of the described two-step SDOF analysis is restricted by several limitations, which are summarized as follows:
- ◾
The actual cladding-to-supporting structure system is more complicated with regard to the distribution of mass and stiffness than the employed lumped mass SDOF models. The respective transformation factors are considered uniform throughout the analyses.
- ◾
For the sake of simplicity, the dynamic reactions
V(
t) correspond to simply supported components with uniformly distributed load and uniformly distributed mass (
a1,1 = 0.39,
b1,1 = 0.11,
a1,2 = 0.38,
b1,2 = 0.12 [
21]). It is noted that the respective values of the dynamic reactions in fixed components are approximately equal with the ones in the simply supported components.
- ◾
Plasticity can only be captured by the horizontal branch of the force–displacement diagram, while in actual cases the cladding’s response may be composed of multilinear regions with smooth transitions.
- ◾
Membrane action, which is considered through stiffness k1,3, is only an approximation of the physical system’s response, where the membrane action increases rapidly with increases in displacement, depending also on the cladding’s connections and on the supporting structure stiffness.
- ◾
The force–displacement unloading branches and the respective stiffness and resistance values constitute reasonable estimations of the actual behavior. No cyclic loading or buckling was examined.
- ◾
Strain rate effects can efficiently be accounted for with the use of dynamic increase factors, as indicated in [
6].
- ◾
Close-in or contact explosions that may lead to shear failure and perforation in the cladding are not taken into account. It is assumed that the charge is positioned at sufficient distance from the cladding so that the developing blast pressure is uniformly distributed.
- ◾
Blast loading was applied as an equivalent triangular load with the same maximum pressure and positive impulse as the actual exponential blast loading, by altering the blast positive phase duration and neglecting the negative phase effects.
In future extension of the present research, some of these limitations could be overcome by properly accounting for more sophisticated models of the distribution of mass and stiffness, the support reactions, the force–displacement diagram of the cladding, the strain rate effects, and the blast loading. However, the results obtained from the two-step analysis and presented in the following
Section 3 and
Section 4 are considered to be sufficiently accurate despite these limitations, as also confirmed by the numerical results presented in
Section 5.
3. Influence of Cladding with Both Bending and Membrane Stiffness
The two-step SDOF analysis can be uniquely described by the five parameters identified in
Section 2.1. Appropriate values were assigned to these parameters in order to produce the qualitative and quantitative diagrams shown in the present section. These parameters are further detailed as follows:
- ◾
m2/m1: The mass of the supporting structure (m2) is typically lower than the cladding mass (m1). Hence, the cases of m2/m1 = 0.1 and m2/m1 = 1.0 are presented.
- ◾
k2/k1,1: The stiffness of the supporting structure (k2) is significantly larger than the cladding bending stiffness (k1,1). Hence, the cases of k2/k1,1 = 10.0 and k2/k1,1 = 100.0 are presented.
- ◾
Ru/Po: The ultimate resistance of the cladding (Ru) may be either larger or lower than the maximum blast pressure (Po). As a consequence, two extreme values were assigned to this ratio (Ru/Po = 0.1 and Ru/Po = 2.0), as well as three intermediate values (Ru/Po = 0.5, 1.0, 1.5).
- ◾
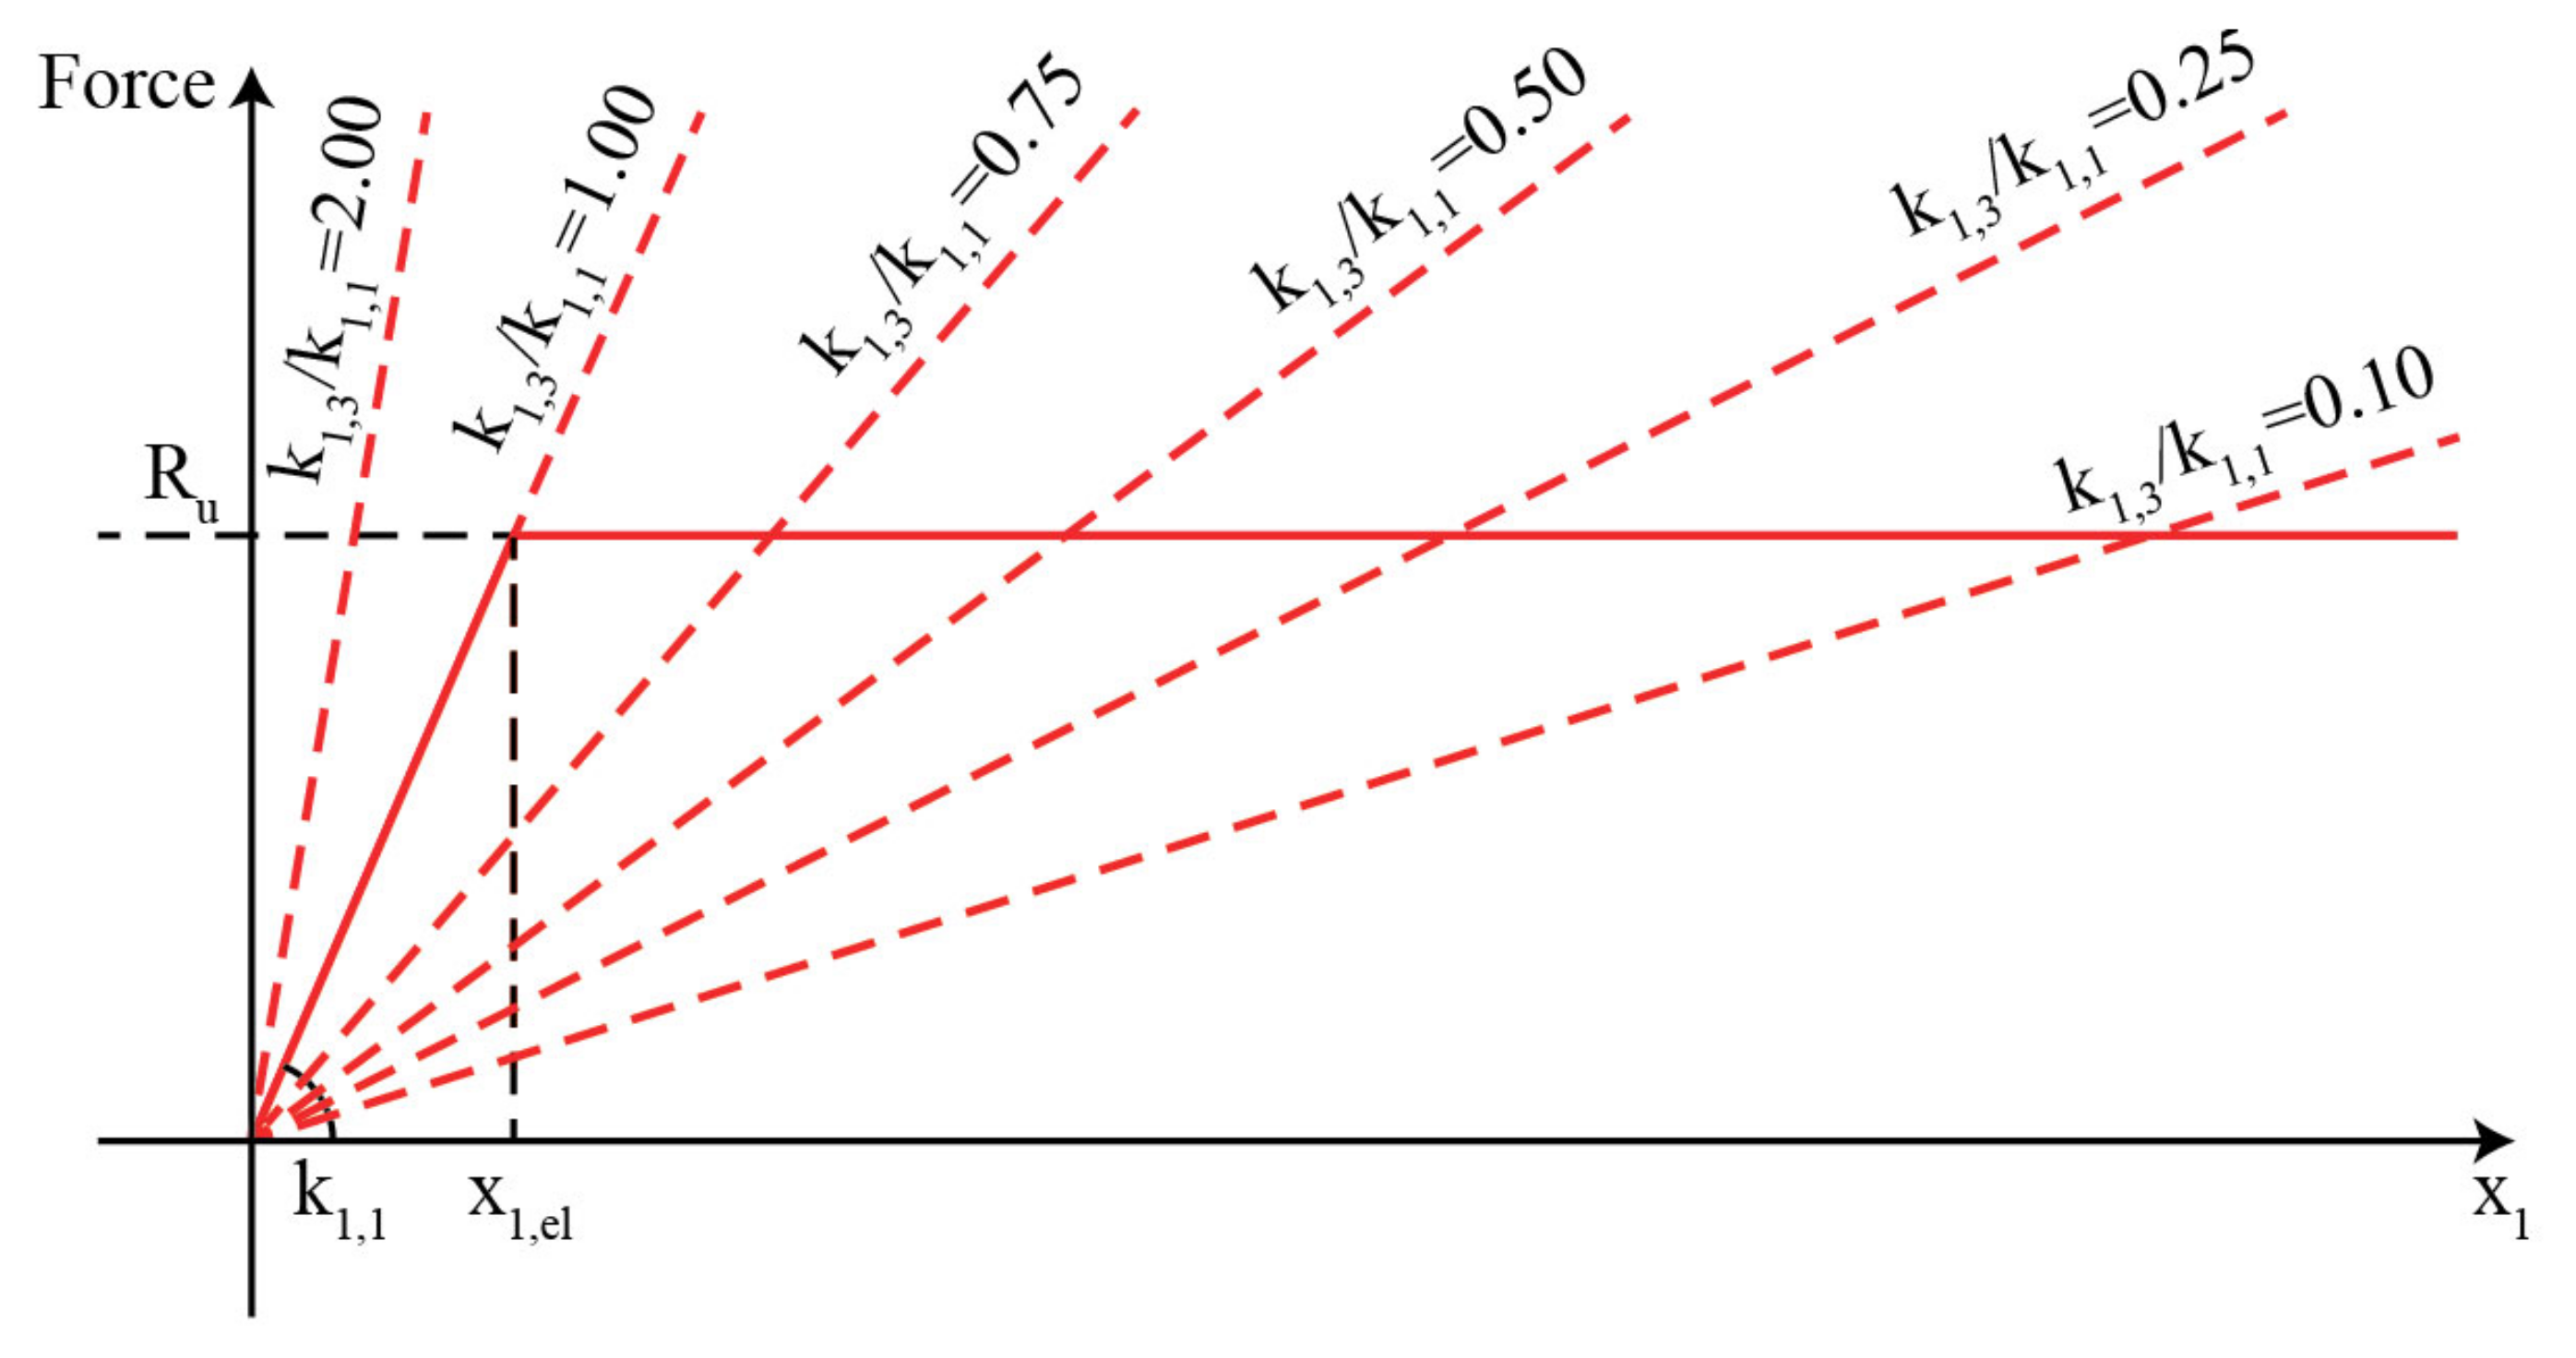
k1,3/
k1,1: Six cases were examined with regard to the cladding membrane stiffness. These cases are presented in
Figure 3 and can be described by only flexural response without plasticity (
k1,3/
k1,1 = 1.00, 2.00), flexural and early membrane response (
k1,3/
k1,1 = 0.50, 0.75), and flexural and late membrane response (
k1,3/
k1,1 = 0.10, 0.25). The discussed ratios are also examined in [
13].
- ◾
td/T2: A wide spectrum of
td/T2 ratios was investigated in order to efficiently calculate the
DLF2 at all response types, i.e., at the impulsive regime (
td/T2 < 0.1), the dynamic regime (0.1 <
td/T2 < 10.0), and the quasi-static regime (
td/T2 > 10.0) [
21]. More specifically,
DLF2 was calculated at 401 points ranging from
td/T2 = 0.01 to
td/T2 = 100.0. In the same context with the well-known ductility ratio or DLF diagrams used in blast-resistant design [
22], the
td/T2 ratio was applied in the horizontal axis of the diagrams that are shown in this study.
It is noted that despite the reasonable selection of specific values in the aforementioned parameters, the observations that are made in the present section about the cladding membrane behavior influence on the supporting structure were also verified at additional values of the parameters. Hence, these observations can be considered to be of general validity for a wide range of cladding-to-supporting structure arrangements.
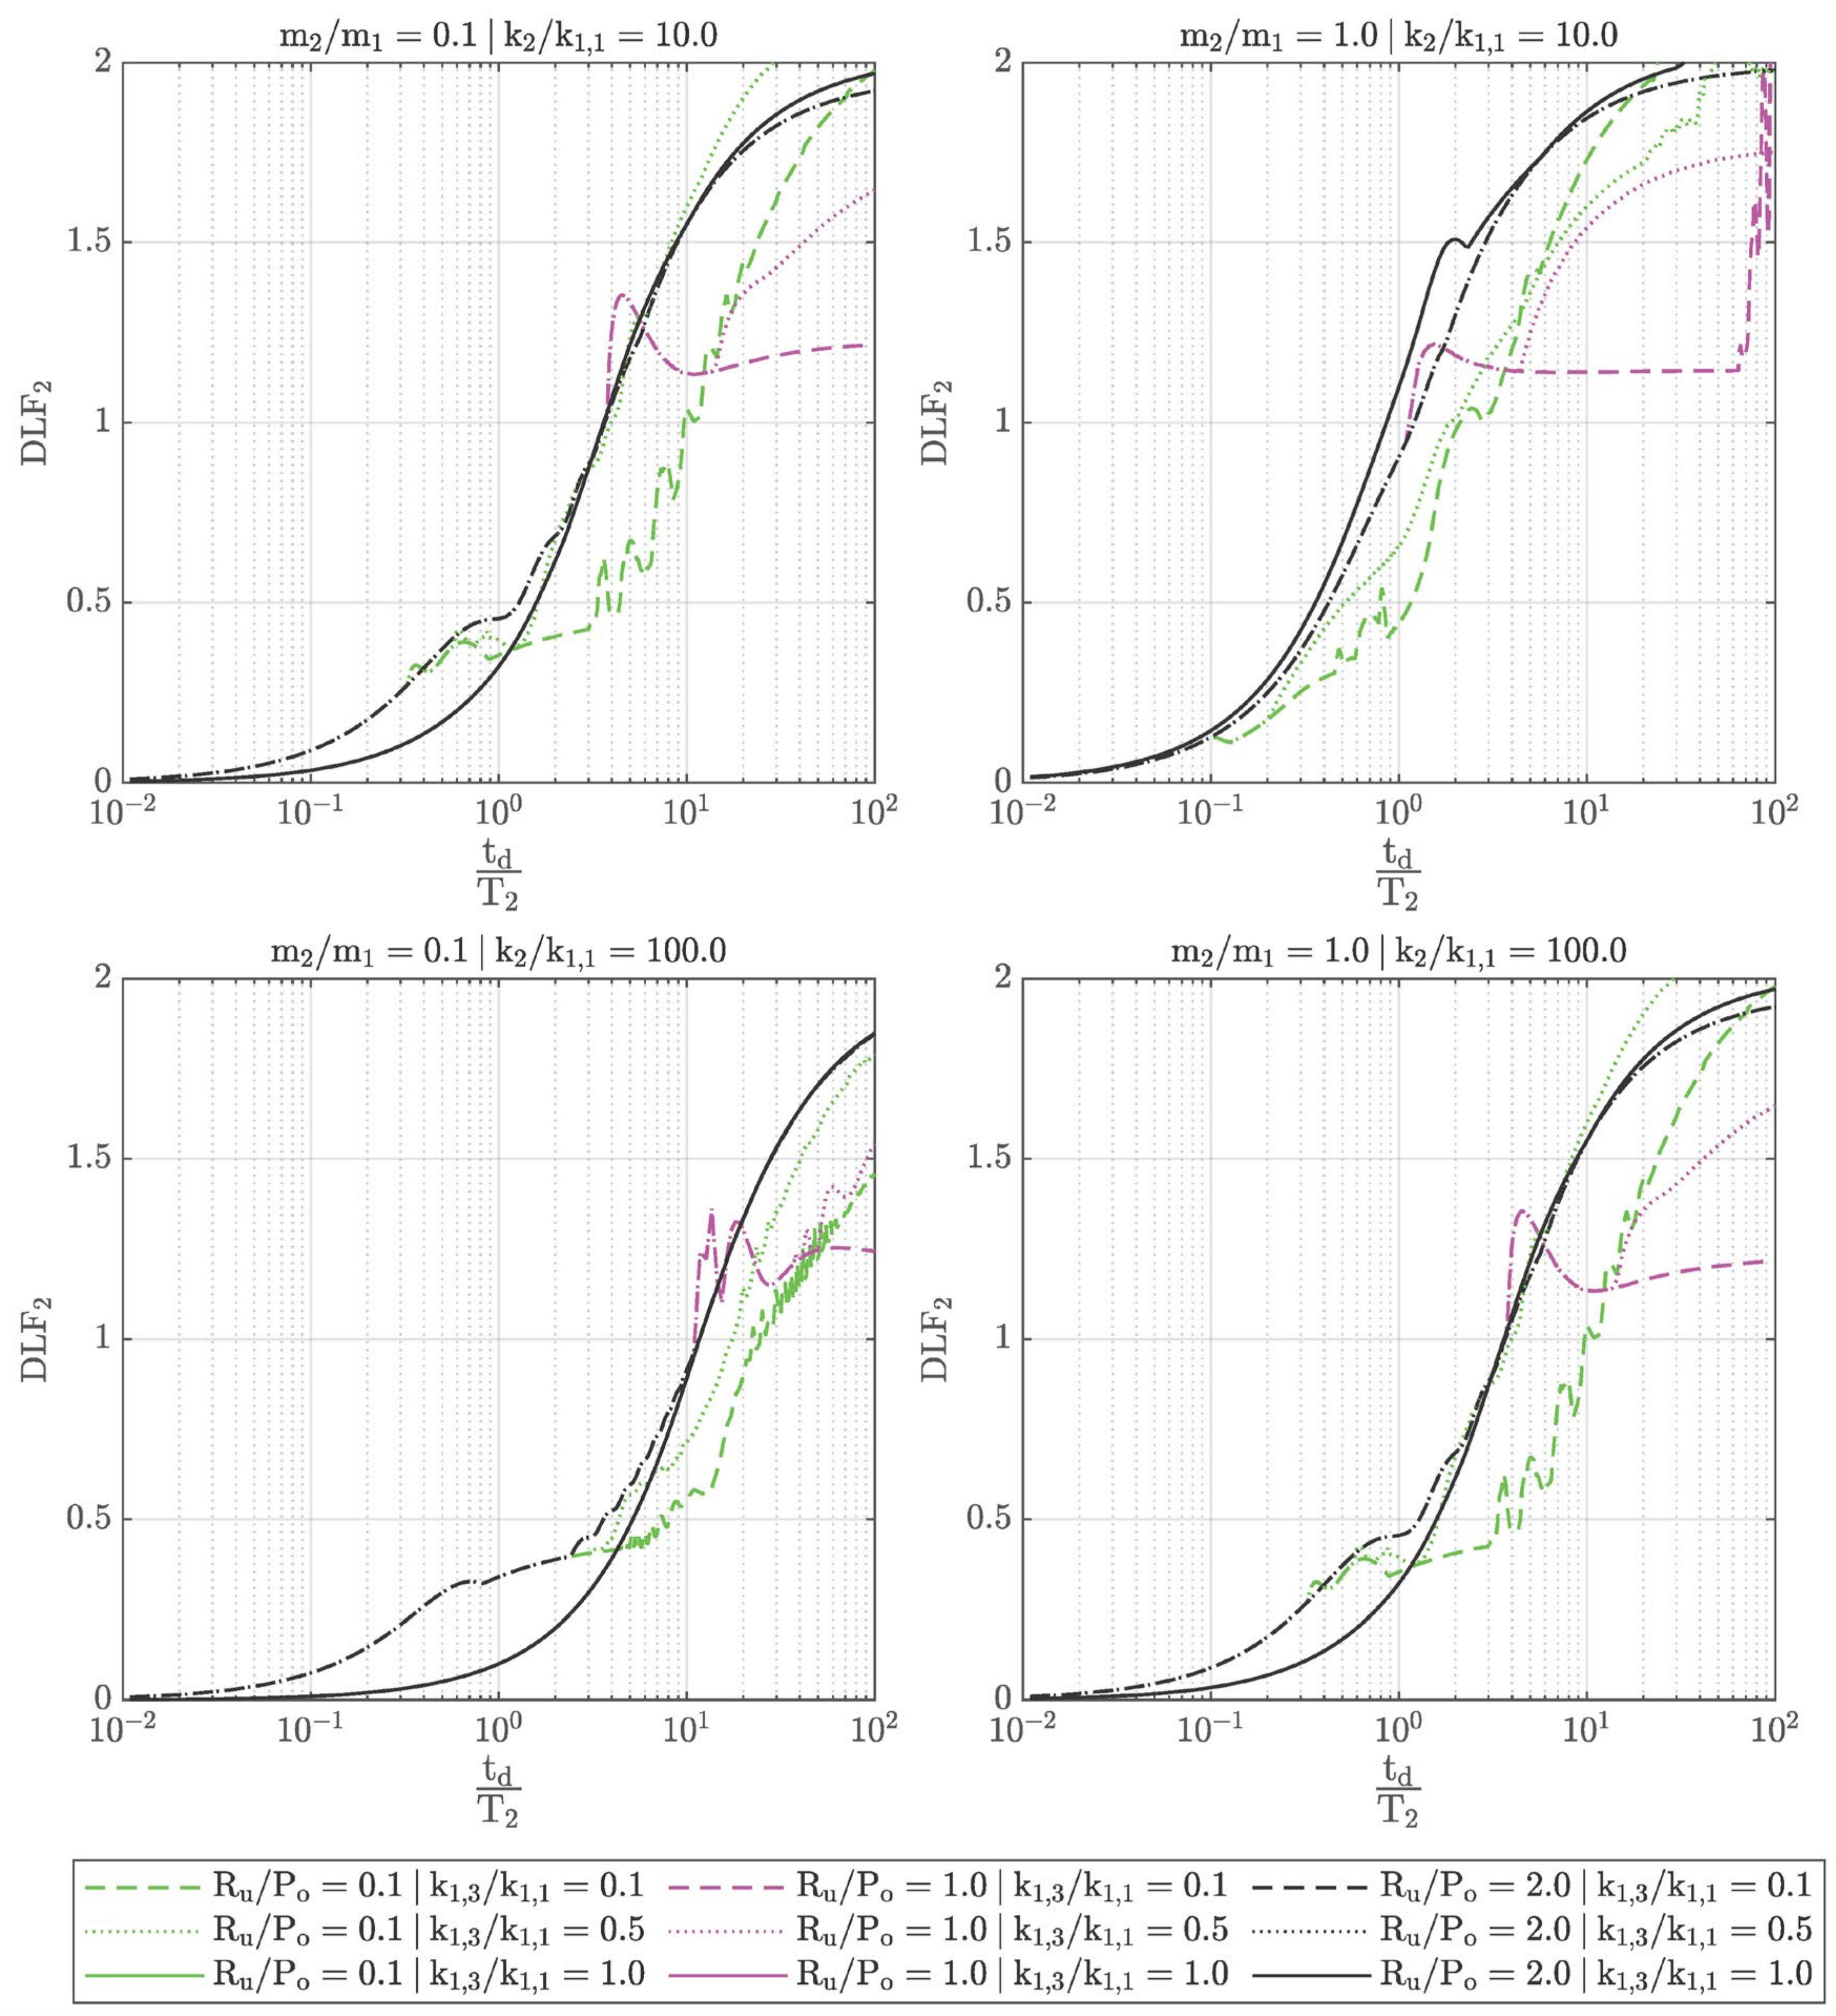
The diagrams included in
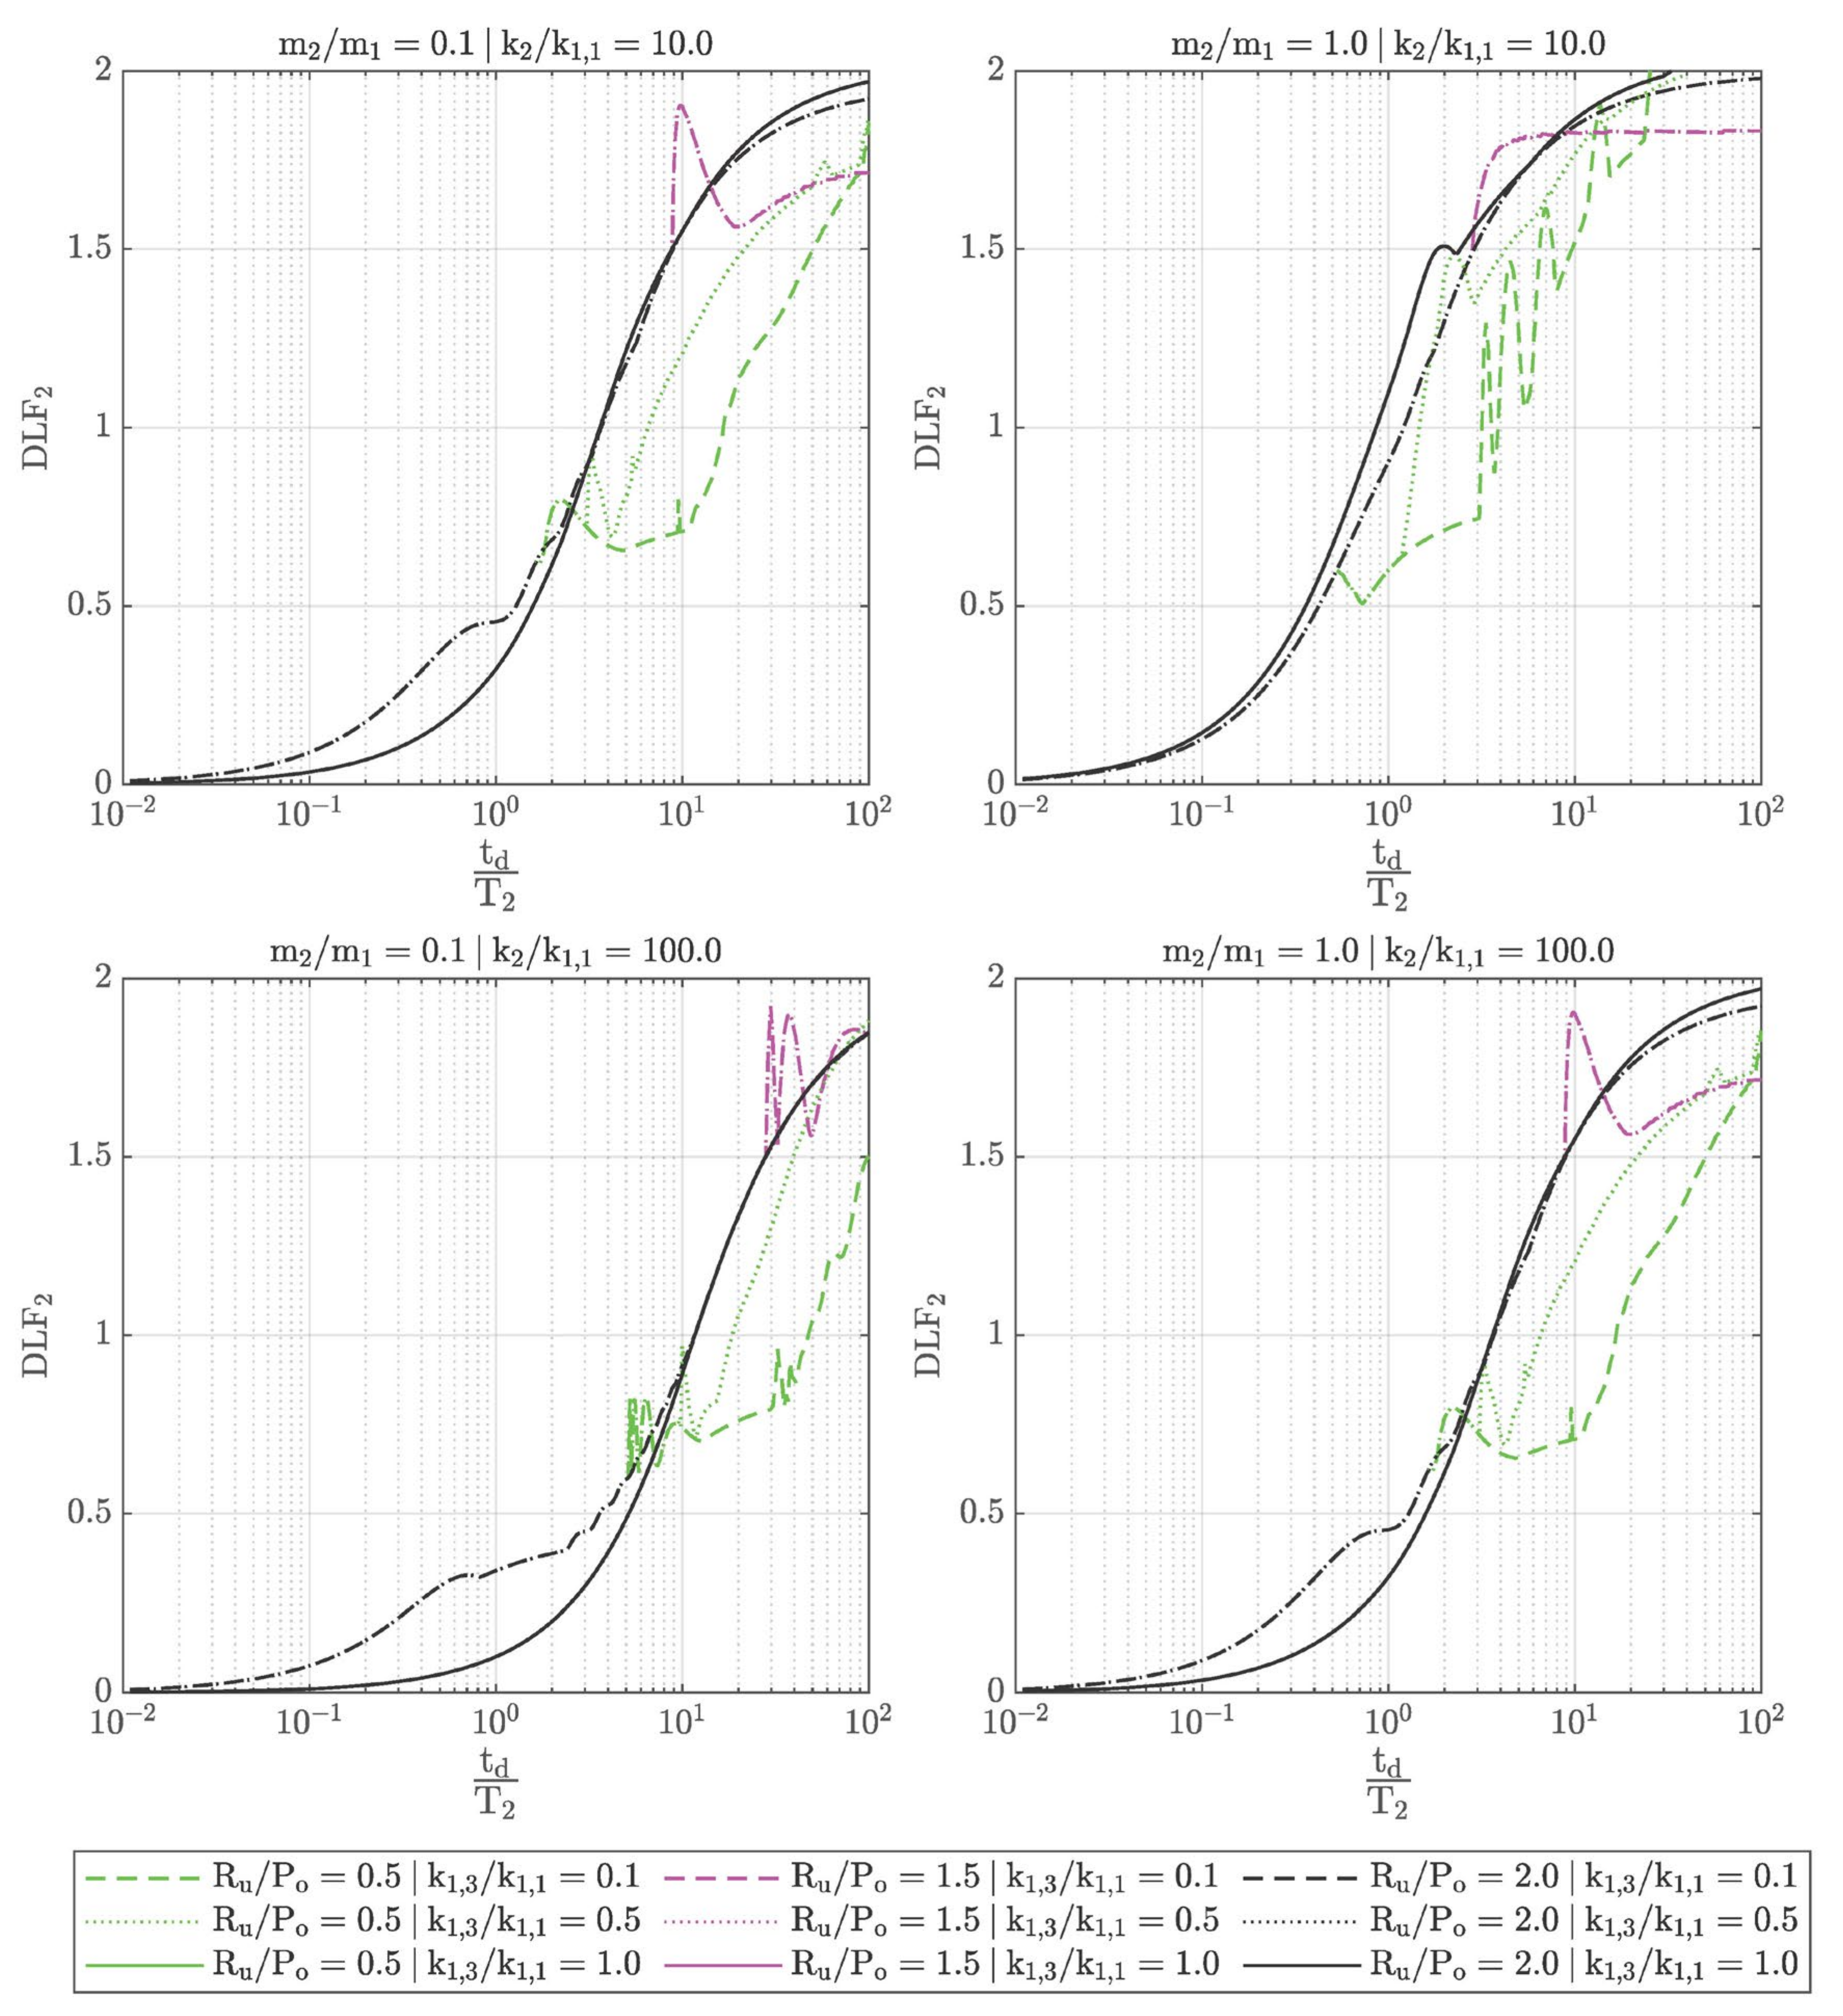
Figure 4 and
Figure 5 were produced with the aforementioned representative values. More specifically, both figures refer to the same mass and stiffness ratios (
m2/
m1 = 0.1, 1.0,
k2/
k1,1 = 10.0, 100.0, and
k1,3/
k1,1 = 0.1, 0.5, 1.0) but different resistance ratios (
Ru/Po = 0.1, 1.0, 2.0 in
Figure 4,
Ru/Po = 0.5, 1.5, 2.0 in
Figure 5). The resistance ratio
Ru/Po = 2.0 is common between the two figures because it represents the elastic cladding response. Hence, all possible observations should be made by comparing the other curves with the
Ru/Po = 2.0 curve (black curve), which is the same for all stiffness ratios.
Similar diagrams are presented in
Figure 6 but with fixed values for the mass ratio
m2/
m1 and bending stiffness ratio
k2/
k1,1, as their main purpose is to capture the effect of membrane stiffness ratio
k1,3/
k1,1 in combination with the resistance ratio
Ru/Po. The selected values were representing typical cladding-to-supporting structure arrangements, i.e.,
m2/
m1 = 0.1 and
k2/
k1,1 = 10.0.
The main contribution of the cladding to the response of the supporting structure is presented in the dynamic and the quasi-static regime. This observation is supported by the fact that the lower the resistance ratio Ru/Po is, the lower the positive phase duration to natural period ratio td/T2 is, for which the cladding comes into effect. Hence, the cladding influence could be exhibited in the impulsive regime only for significantly low resistance ratios Ru/Po, low stiffness ratios k2/k1,1 and k1,3/k1,1, as well as high mass ratios m2/m1.
With regard to the dynamic and the quasi-static regime, the influence of the cladding can be calculated by the reduction in the DLF2 curve (in black) at the same positive phase duration to natural period ratio td/T2 as the one of interest. The reduction can have limited or extended magnitude and is strongly dependent upon the various examined parameters. Furthermore, the reduction may be present either for only a narrow range or, conversely, for a wide range of td/T2 ratios.
More specifically, the resistance ratio Ru/Po seems to have a prevalent role in the response of the supporting structure. When Ru/Po is low (i.e., equal to 0.1 or 0.5), the effects on DLF2 are exhibited early and can be estimated to have an approximately 30~50% reduction in the displacement of the supporting structure. However, this is not applicable for all membrane stiffness ratios k1,3/k1,1 because, when the membrane action is significant (k1,3/k1,1 = 0.5, 1.0), plastic dissipation cannot be efficiently activated, and the respective effects on DLF2 are minor. Increases in cladding displacements lead to substantial membrane action with simultaneous increase in the corresponding support reactions acting over the supporting structure. Hence DLF2 ends up being the same as if blast loading were applied directly to the supporting structure (via the corresponding tributary area), without taking into account the cladding characteristics.
A similar behavior is observed for large resistance ratios Ru/Po but, in this case, the DLF2 reduction is applicable for a range of positive phase duration to natural period ratios td/T2 only in the quasi-static regime. Hence, cladding ductility is utilized differently with respect to the supporting structure response regime. Large resistance ratios Ru/Po should be used only in the quasi-static regime, while small resistance ratios Ru/Po should be used both in the dynamic and the quasi-static regime. However, at all resistance ratios Ru/Po the membrane stiffness ratio k1,3/k1,1 should be as small as possible in order for plastic energy absorption to take place.
The effects of mass and bending stiffness are significant and effective at the whole spectrum of positive phase duration to natural period ratios
td/T2. More specifically, it is preferred for mass
m1 to have large values and bending stiffness
k1,1 to have small values. In this way, the inertial resistance mechanism of the cladding comes into effect. This mechanism is associated with decreased cladding velocity and, thus, with reduced kinetic energy applied to the cladding [
6]. The reduced kinetic energy is critical because it is subsequently converted into strain energy and, thus, into reduced displacements for the supporting structure.
4. Influence of Cladding as a Membrane Structure
Generally, cladding could be designed with negligible bending stiffness in contrast with its membrane stiffness. Then, cladding can be considered as a membrane structure, without bending stiffness
k1,1 and resistance
Ru. This case is indicated by parameters
k1,3/
k1,1 = 1.0, 2.0 of
Figure 3. Pertinent
DLF2 results of this type of structure are presented in
Figure 7 for multiple mass and stiffness ratios.
As observed, the cladding mass and stiffness exhibit significant influence over the supporting structure. Increases in mass m1 and decreases of membrane stiffness k1,3 may reduce DLF2 by as much as 70%. Furthermore, these effects are active across the whole range of positive phase duration to natural period ratios td/T2, i.e., at the impulsive, dynamic, and quasi-static regime. This fact is of particular interest because the effects of the resistance ratio Ru/Po are mainly applicable to the dynamic and the quasi-static regime, while they are also dependent upon the maximum pressure Po for the determination of Ru and the proper design of the cladding. Hence, designing the cladding with low membrane stiffness and increased mass could yield substantial effects over the DLF2 without the need for the beforehand estimation of maximum blast pressure Po.
5. Case Study
A case study of a typical cladding-to-column arrangement was selected in order to verify the proposed two-step SDOF analysis and demonstrate the membrane effects of cladding over the supporting structure. A numerical model was prepared in ANSYS Explicit Dynamics software [
23], and appropriate NTFE (Nonlinear Transient Finite Element) analyses executions were performed.
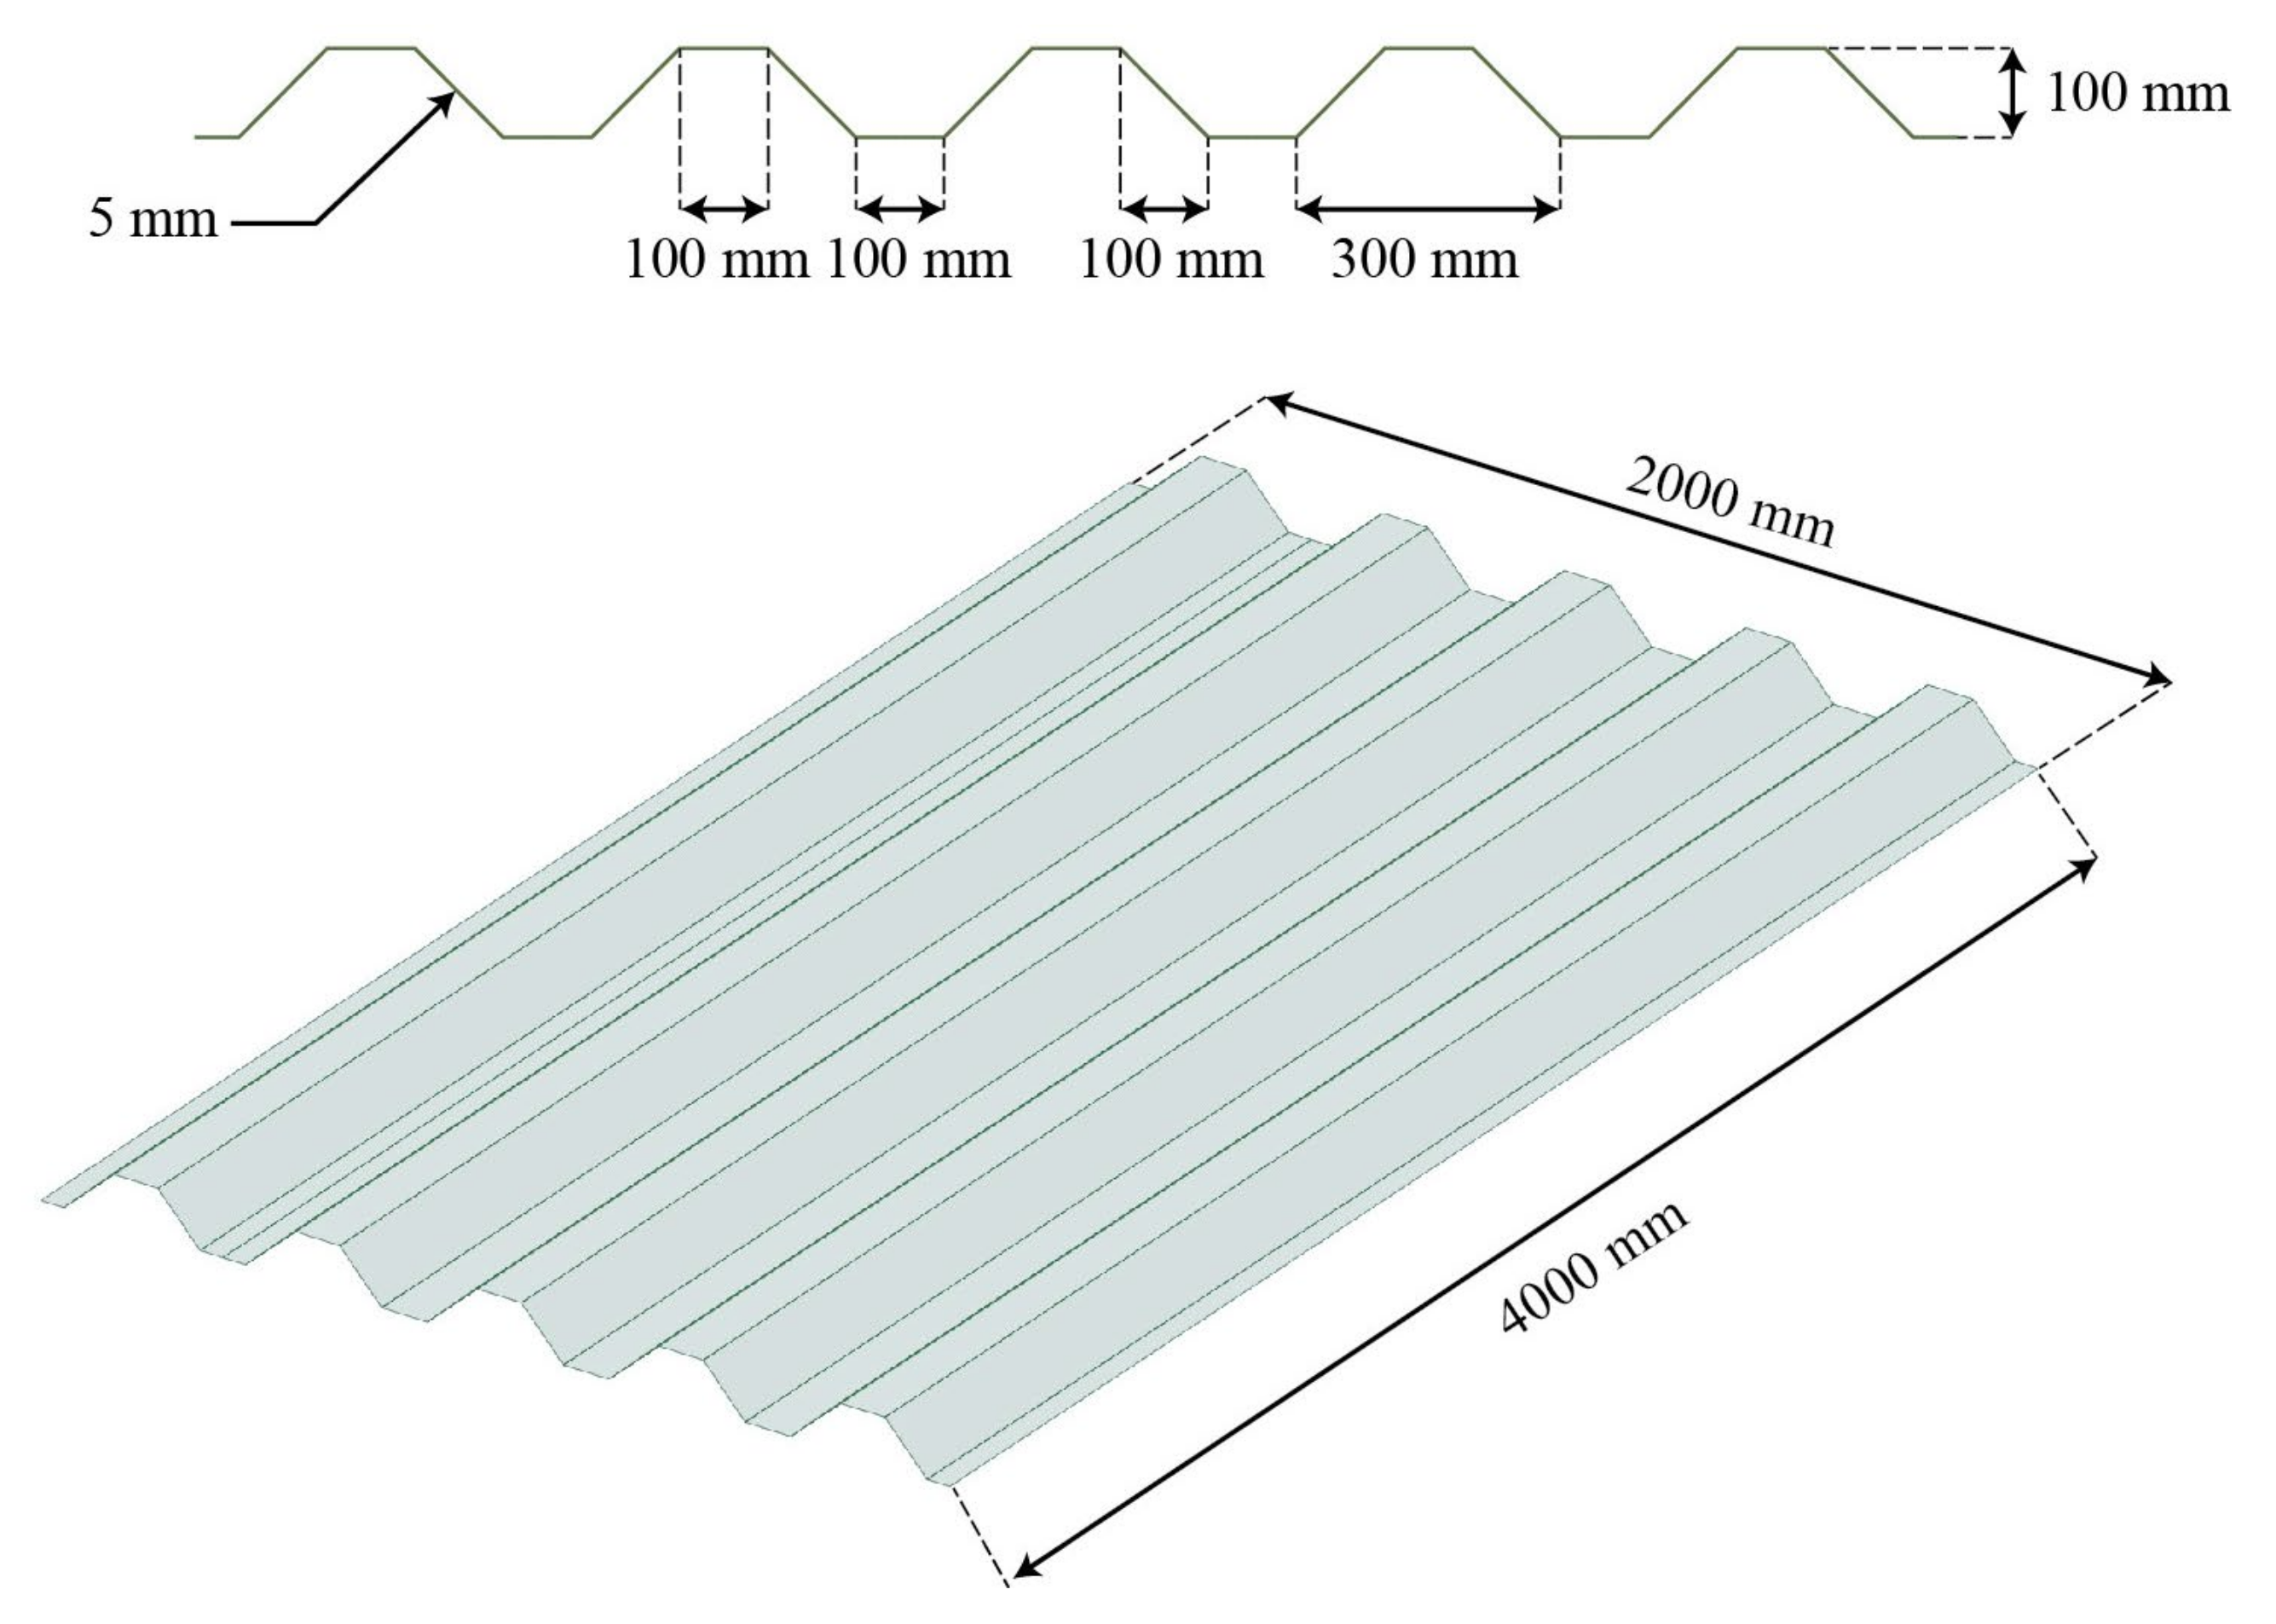
The considered cladding comprised a steel trapezoidal sheet with a height of 100 mm, thickness of 5 mm, crest width of 100 mm, and valley width of 100 mm, as shown in
Figure 8. Its geometry was similar to the profiled sheeting that was used in [
24], and its static pressure–displacement curve was calculated as indicated in
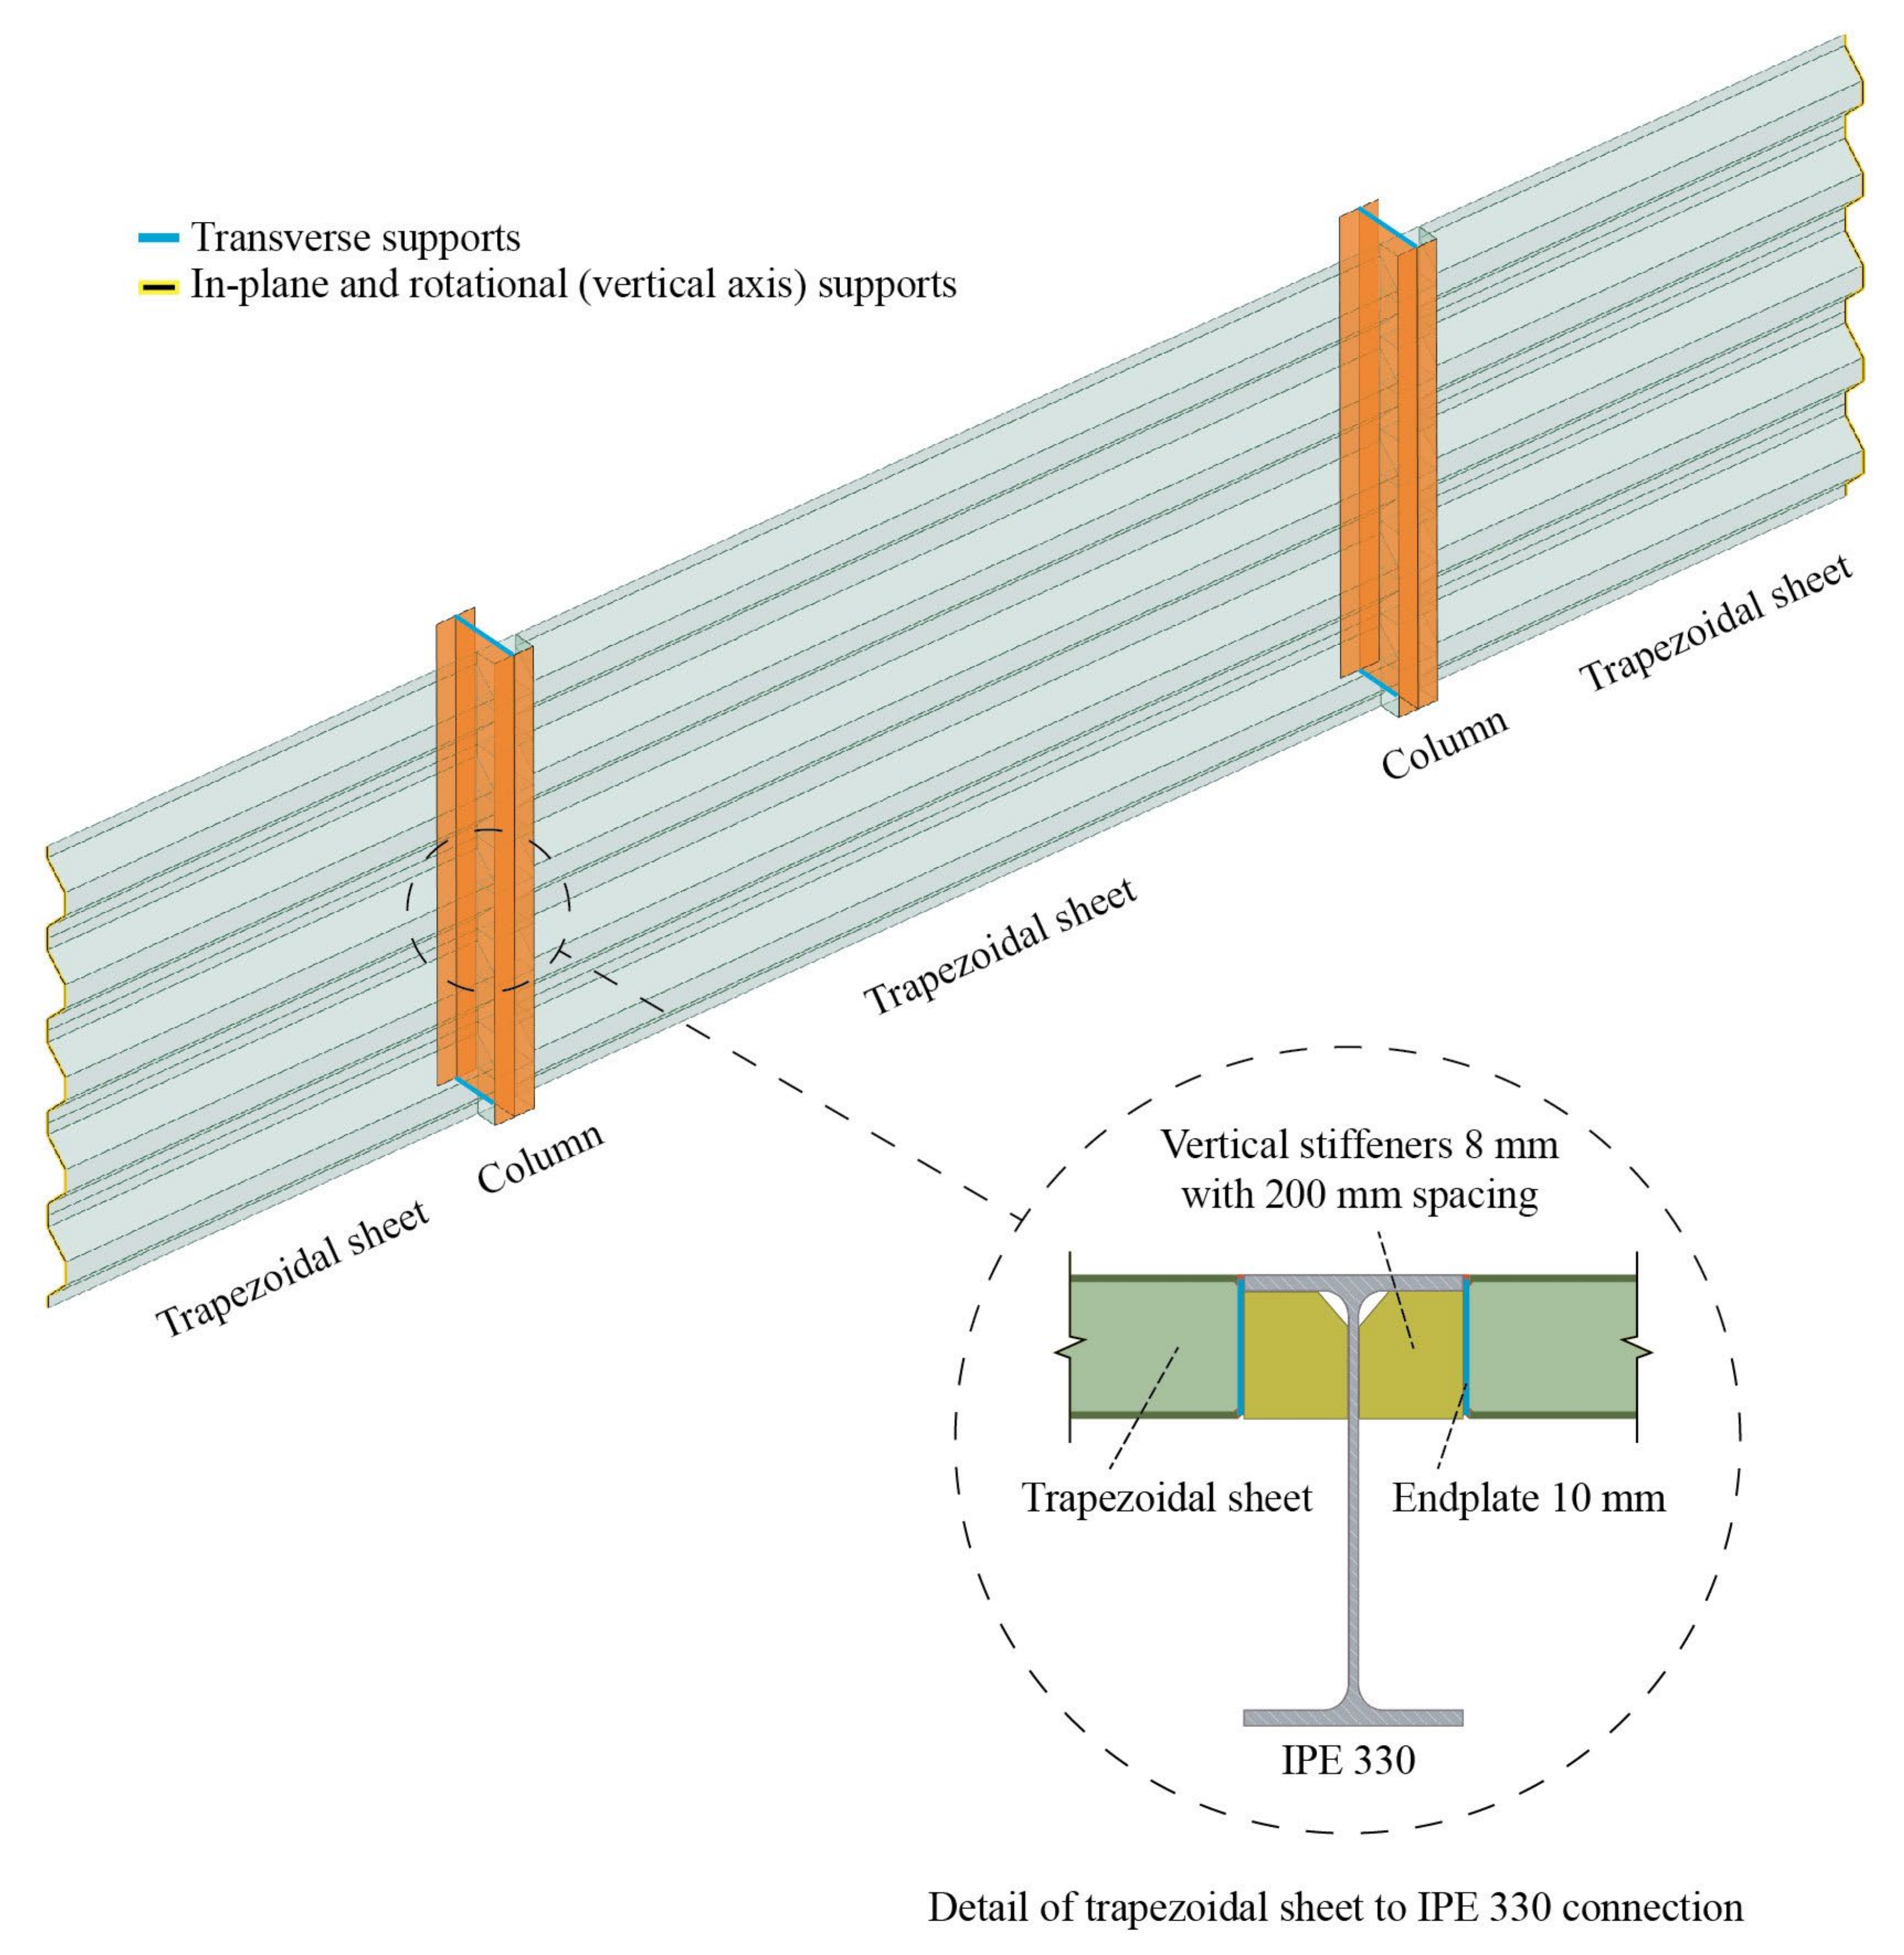
Figure 9. The supporting structure comprised IPE 330 columns that were considered to be pinned-pinned, while the trapezoidal sheeting was assumed to be welded to the columns through the detail presented in
Figure 10. The column spacing and length were defined as 4 m and 2 m, respectively.
The selected material was steel S355 [
25] with a yield strength of 410 MPa [
26] due to the static increase factor (representing the difference between the designed steel quality and the actual steel quality). In the numerical model the hardening effects were taken into account by considering the Johnson–Cook model [
27], while the strain rate effects were taken into account by considering the Cowper–Symonds model [
28]. These models are described by Equation (19), with the relevant values shown in
Table 1 for the hardening parameters (
B,
θ) and for the strain rate parameters (
D,
q) [
29,
30]. In Equation (19), plastic stress, yield strength, plastic strain, and plastic strain rate are denoted by
σ,
A,
εpl, and
, respectively. These effects were accounted for in the two-step SDOF analysis through the Dynamic Increase Factor (
DIF), which was assigned to the resistance
Ru.
Blast loading was applied as an equivalent triangular pressure, as shown in
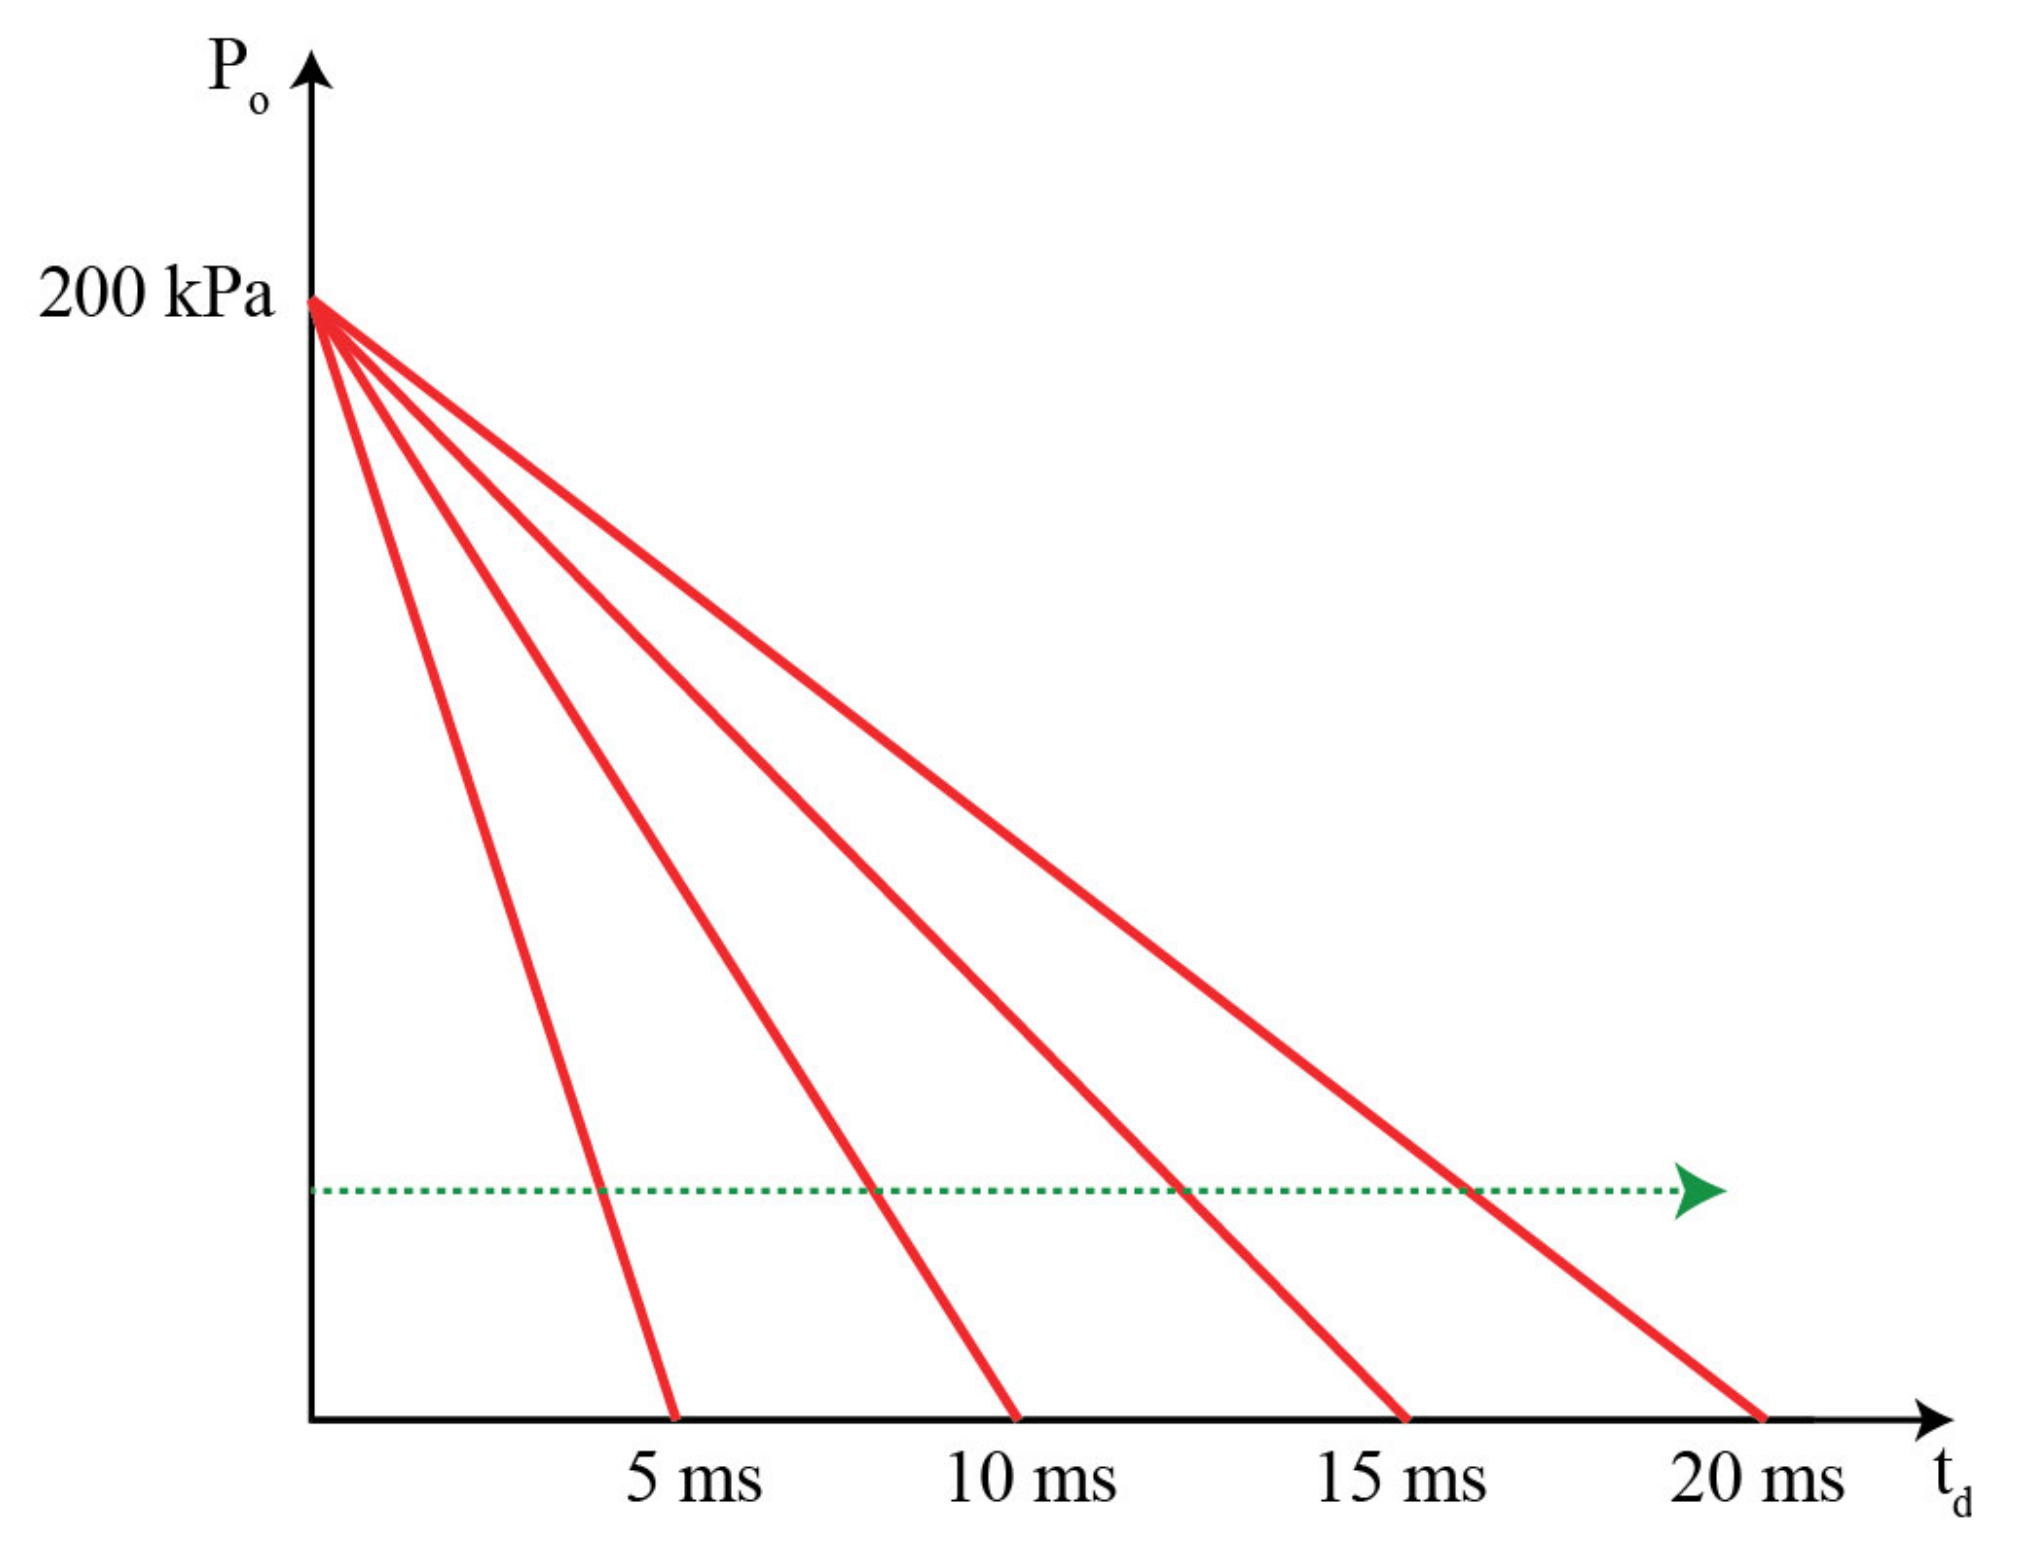
Figure 1. A pressure amplitude of 200 kPa was applied, as it reflects a typical mid-range blast loading (e.g., 20 kg at a stand-off distance of 10 m), which is considered as appropriate, assuming that the panel belongs to a building with perimeter protection (fence and barriers). A variety of maximum blast pressure–impulse combinations was applied to the cladding. All combinations had the same maximum blast pressure but different positive phase duration, as indicated in
Figure 11. This pressure control procedure was chosen because each curve that was shown at the relevant
DLF2 diagrams of the previous paragraphs can be produced by fixed values at all parameters, except for the positive phase duration
td, which dictates the ratio
td/T2. It is noted that pressure control can be achieved though positive phase duration by increasing impulse, which is the integral of pressure over time.
The procedure that was used in the two-step SDOF analysis was the same as the one described in paragraph 2. However, along with masses
m1 and
m2, proper
KLM factors (load–mass transformation factors) [
21] were applied in order to convert the structural components into SDOF models with approximately the same displacement time history. The contribution of these factors is shown in Equations (20)–(26), and the respective values are presented in
Table 2.
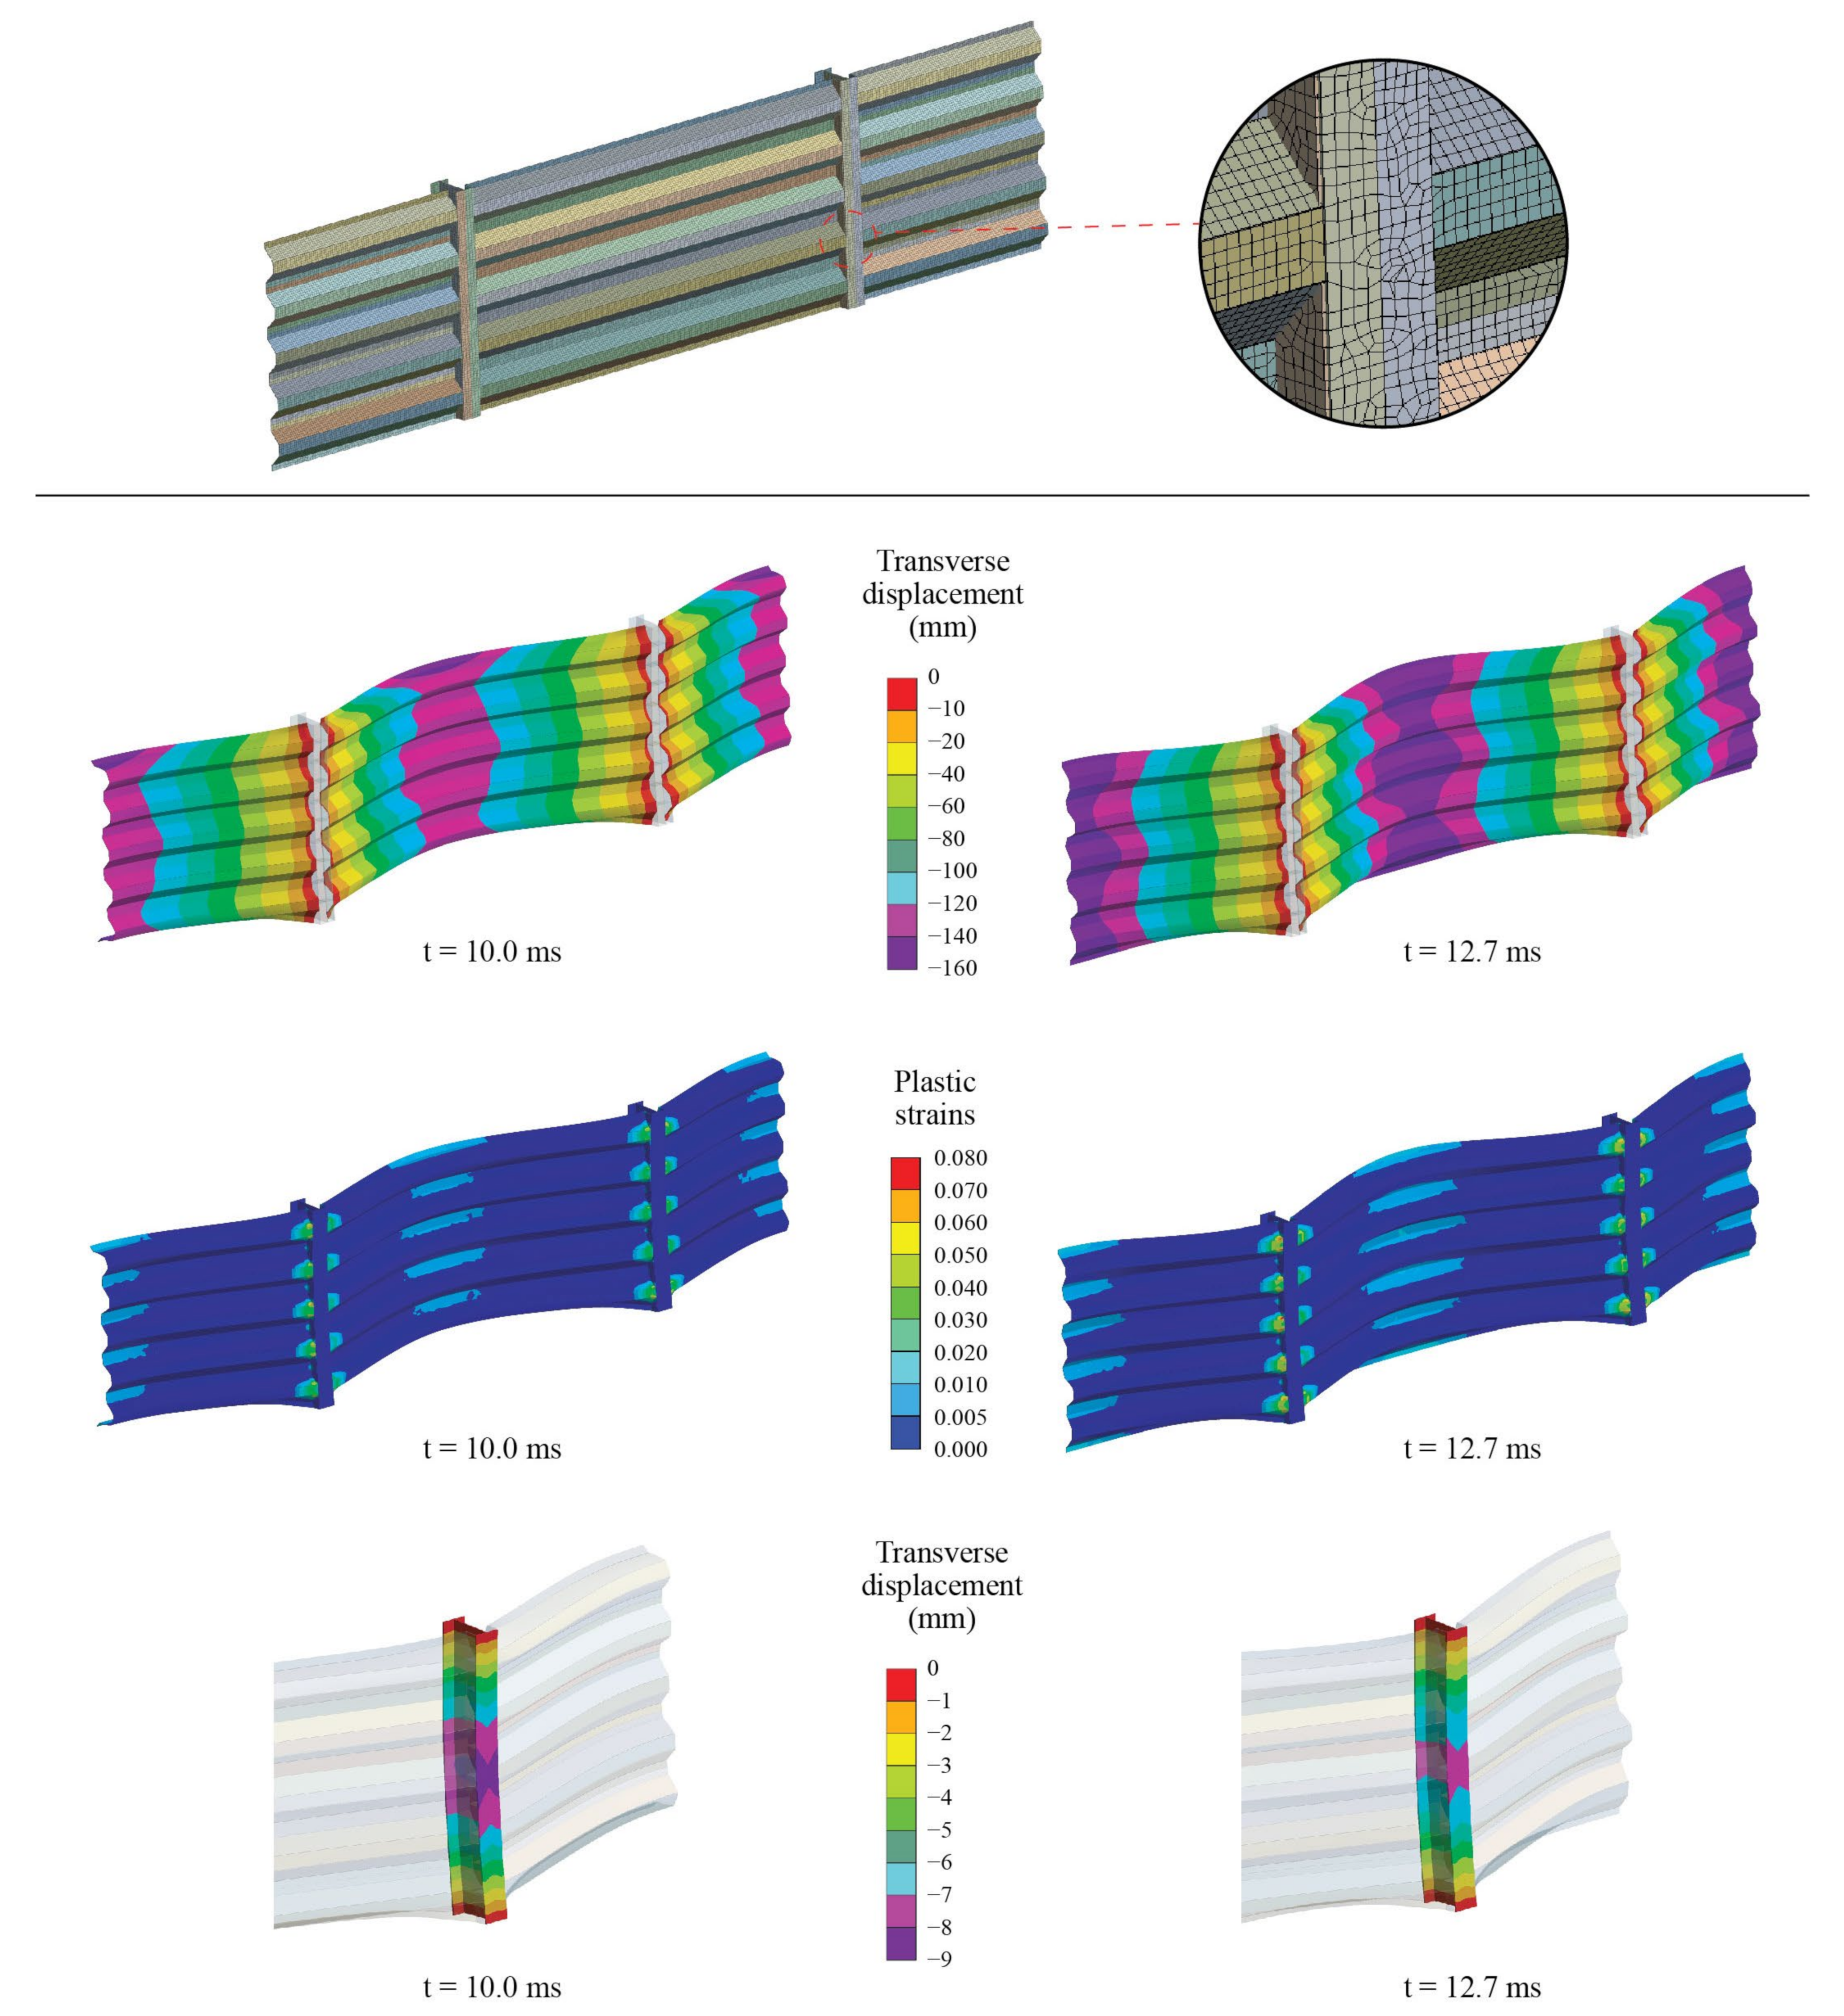
The numerical model was created with shell elements of sufficiently dense mesh (20 mm), as indicated in
Figure 12. It was confirmed that the mesh was sufficient through parametric analyses with denser mesh, which exhibited approximately the same results. The duration of the analyses was large enough to capture the maximum displacement and plastic strains of both the cladding and the columns, while the timestep was small enough to satisfy the Courant criterion [
23]. As a whole, twenty analyses were performed with each one having a different blast loading defined by an increasing positive phase duration from 1 ms to 20 ms with 1 ms step.
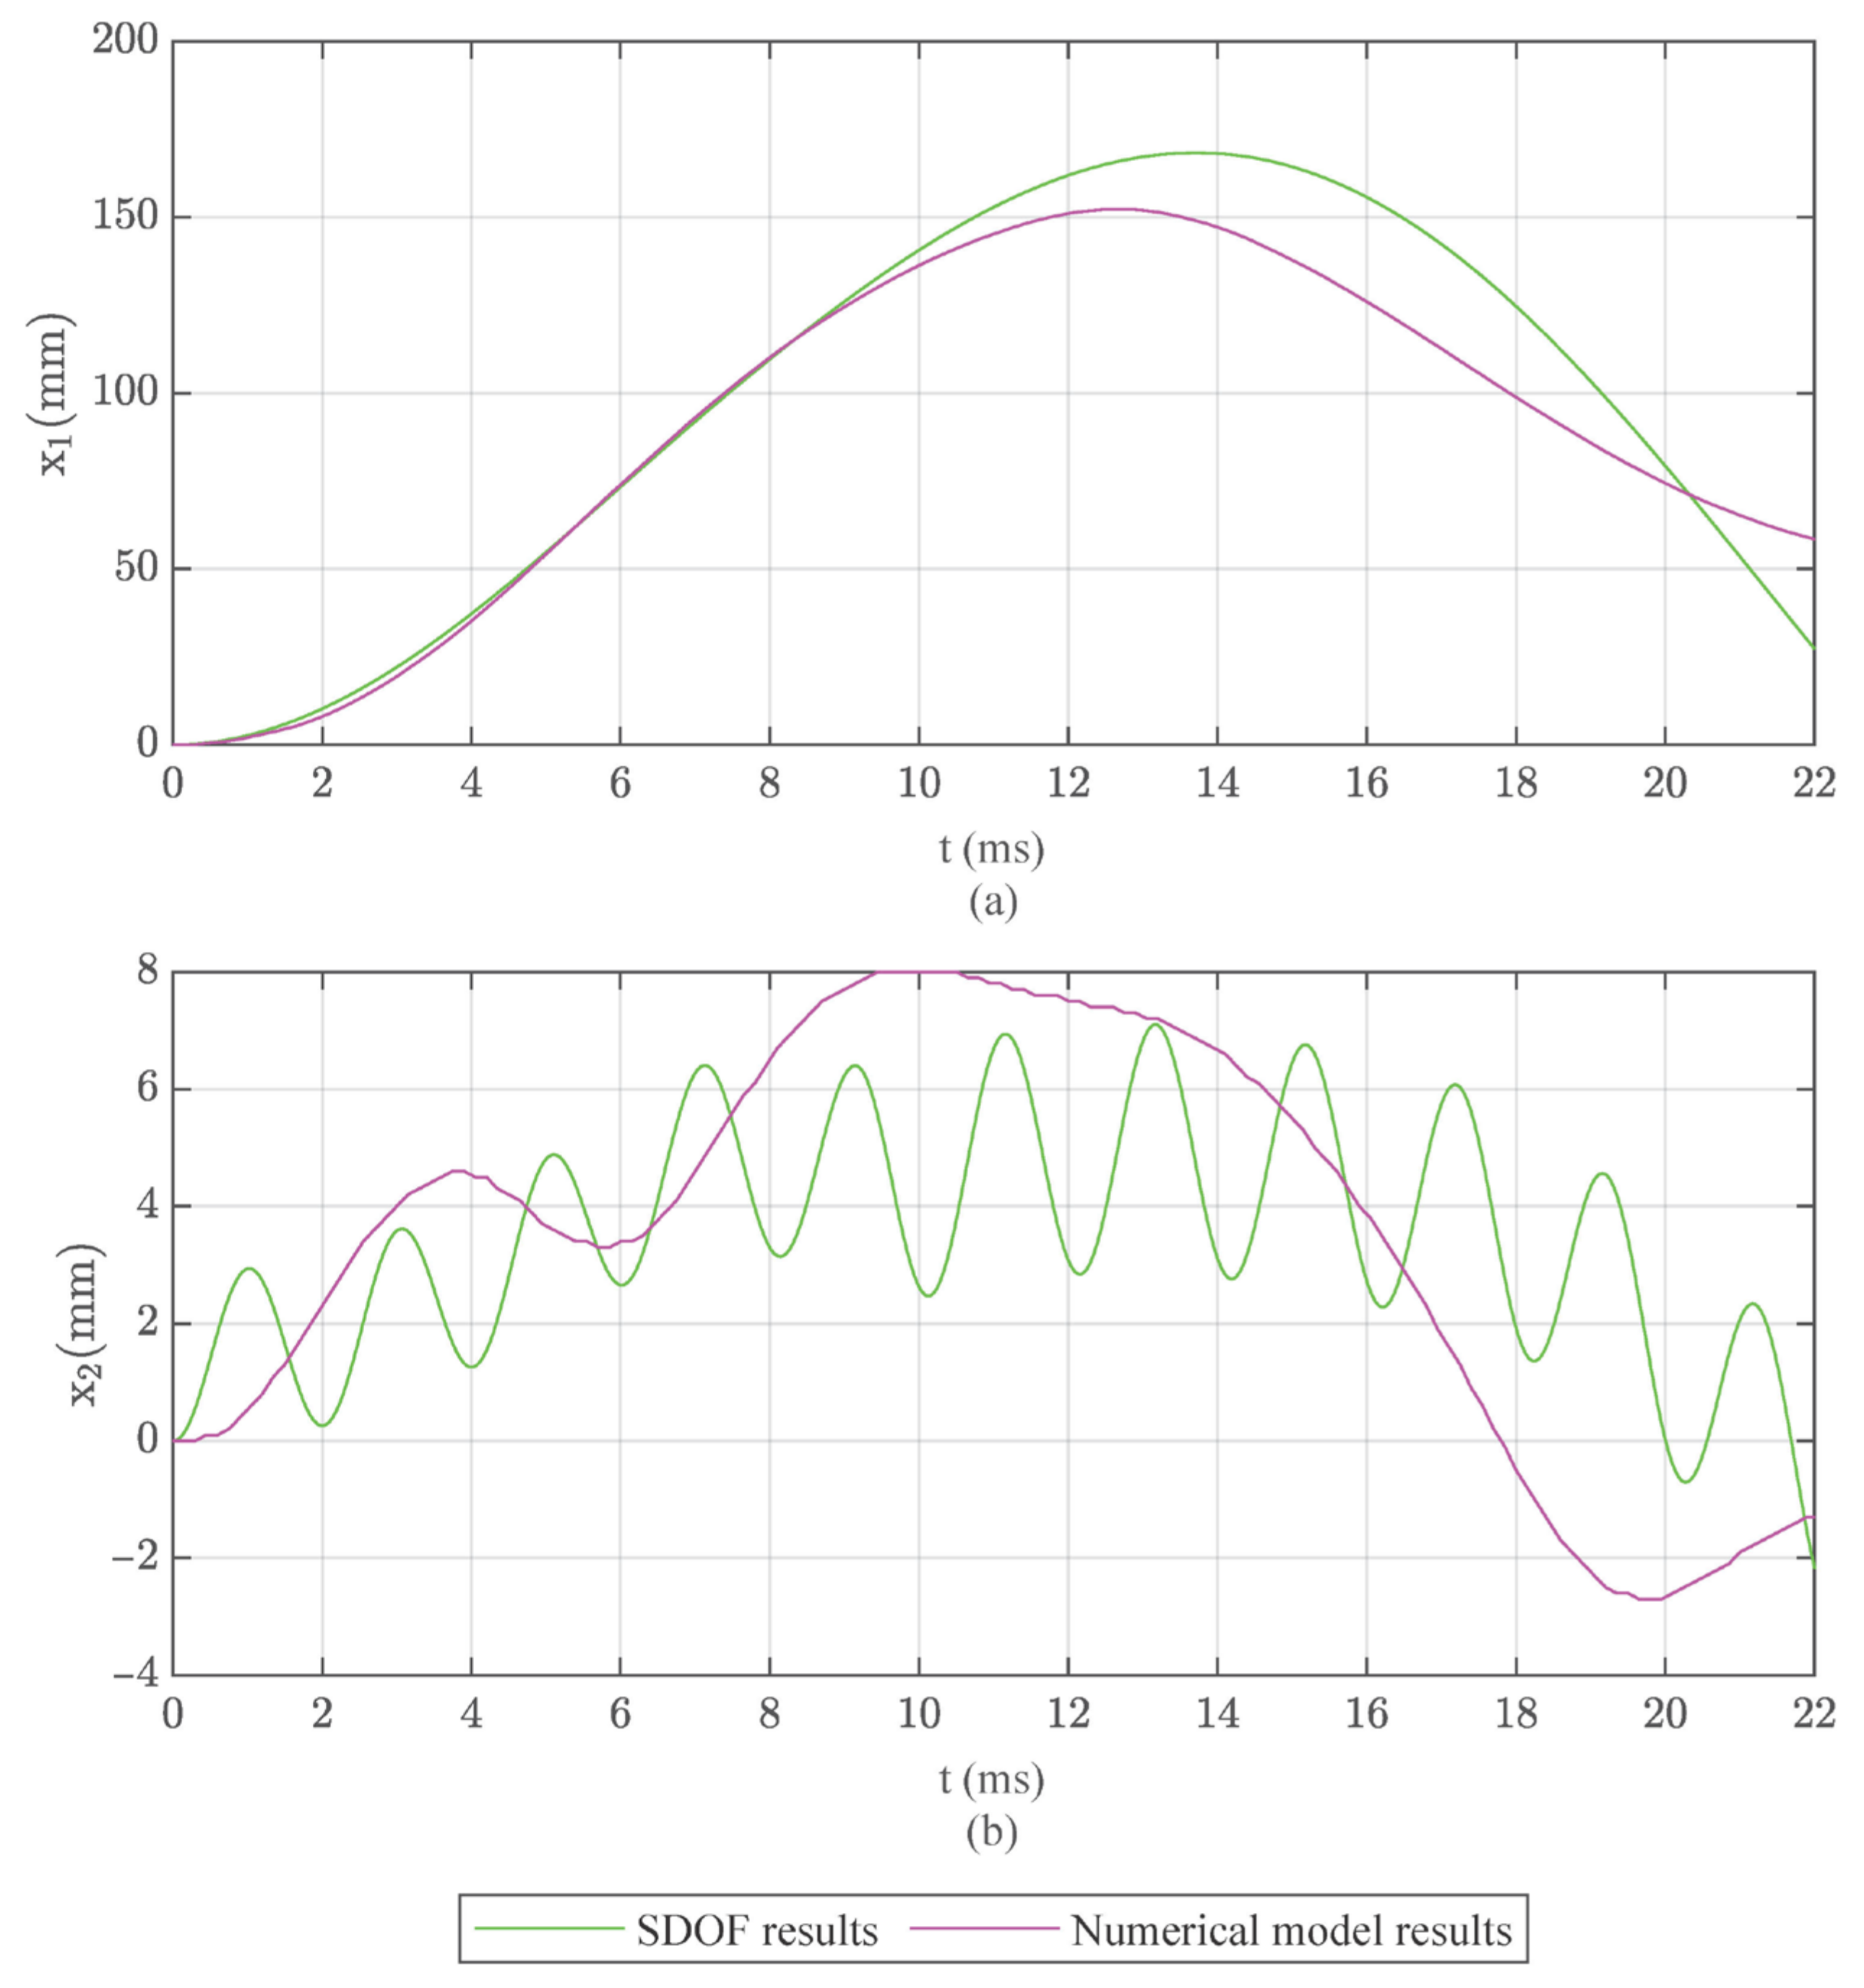
The analysis with the 15 ms positive phase duration was selected as an example in order to display both the numerical model and the two-step analysis results. This positive phase duration was selected because it was large enough for the cladding to enter into the membrane branch of its resistance curve. The numerical model results are presented in
Figure 12, while the comparison with the two-step SDOF analysis is presented in
Figure 13.
The displacements and plastic strains of the numerical model are displayed at the instances of 10.0 ms and 12.7 ms, where the maximum displacement of the column and the cladding are exhibited, respectively. As shown, cladding maximum displacement was extended beyond x1,mem; thus, membrane action of the cladding was initiated. Furthermore, significant plastic strains were observed at the ends and the middle of the cladding, while the columns remained elastic.
Regarding the comparison with the two-step SDOF analysis, the results were verified through the numerical model. The maximum displacements of both the cladding and columns as well as the time of maximum displacement were similar between the two approaches.
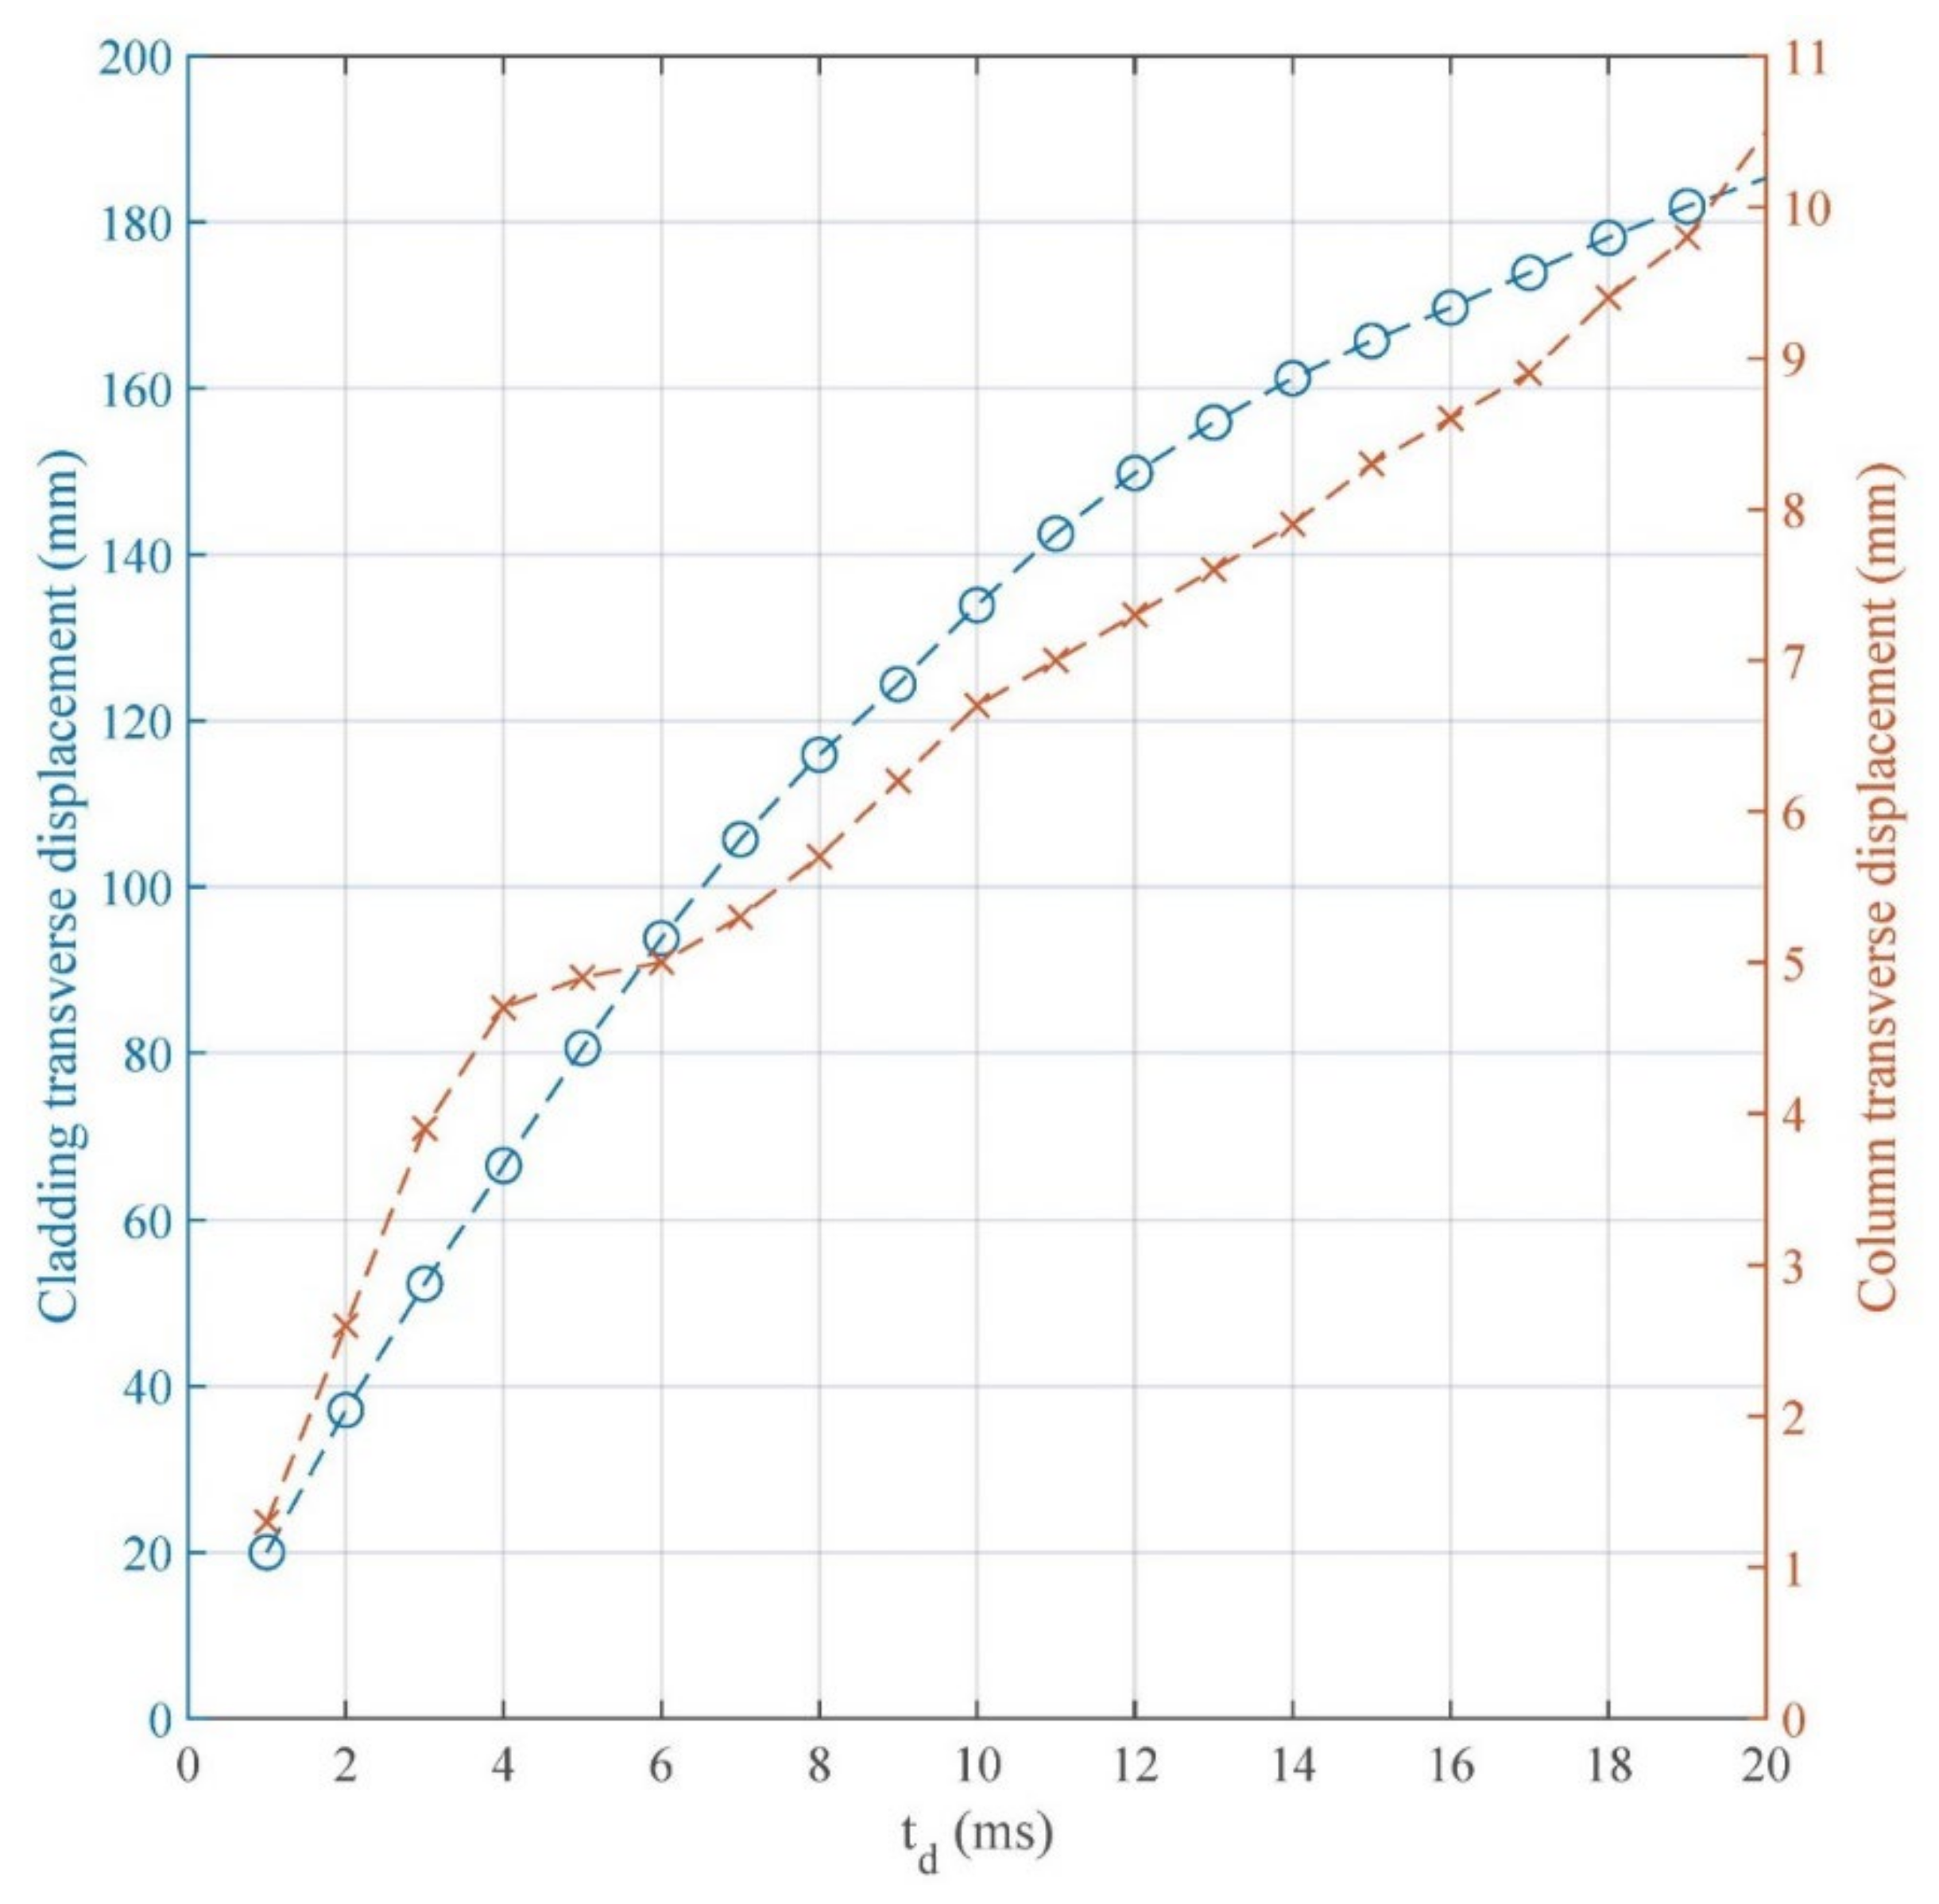
Furthermore, useful observations were made through the pressure control procedure, which was applied to the numerical model in order to check the response of the columns by constantly increasing impulse. As presented in
Figure 14, for small positive phase durations
td, column maximum displacement is linearly increased. Within the range of 4 ms to 8 ms the column displacement is approximately constant, while beyond 8 ms it is further increased until 18 ms. When the positive phase duration is over 18 ms, the column enters into plasticity, and its displacements are rapidly increasing.
The negative effects of the cladding membrane action are exhibited through the fact that it constitutes an obstacle to plastic energy dissipation. More specifically, bending-induced plastic strains are beneficial to the supporting structure. However, plastic strains caused by membrane action result in larger support reactions, thus leading to significant increase in the supporting structure displacements. When the cladding’s response exceeds x1,mem, the upper limit of resistance Ru for the support reactions stops being applicable.
6. Conclusions
The effects of cladding membrane behavior on the supporting structure were explored, focusing on two cases of cladding response. The first case referred to the response of cladding with both bending and membrane stiffness, while in the second case, flexible cladding with only membrane stiffness was considered. The results of the investigation were considered in non-dimensional form so that they would be applicable to multiple cladding-to-supporting structure configurations. The observations were concentrated on the fundamental parameters of the cladding, i.e., the cladding mass m1, resistance Ru, bending stiffness k1,1, and membrane stiffness k1,3.
It was shown that increased membrane stiffness k1,3 leads to the enlargement of the support reactions, thus escalating the displacement of the supporting structure. Moreover, when cladding membrane action is initiated, the beneficial effects of cladding plasticity are countered by the contribution of the axial forces to the support reactions. On the contrary, if membrane stiffness is limited, an upper limit is observed in the support reactions, depending on resistance Ru. Hence, it is preferential that energy absorption is activated though bending behavior instead of membrane behavior.
In addition, when resistance has a low value with regard to maximum blast pressure Po, the effects of plasticity are observed both in the dynamic and the quasi-static regime, but they are not constant, as they are limited when positive phase duration td is increased. However, when resistance has a high value, the effects of plasticity are observed only in the quasi-static regime.
In contradiction to this fact, the effects of mass m1 and bending stiffness k1,1 are applicable to the whole spectrum of positive phase durations td and natural periods T2, regardless of the impulsive, the dynamic, and the quasi-static regime. More specifically, the supporting structure displacements are limited through increased mass and low bending stiffness in the cladding. In this case, the cladding responds slowly to blast loading, thus yielding low support reactions to the supporting structure. Furthermore, the effects of cladding mass and bending stiffness are applicable to all pressure–impulse combinations, while the effects of resistance depend on the characteristics of blast loading.
As a whole, the observations of the present article are critical for the design of cladding subjected to blast loading. It has been shown that membrane behavior results in adverse consequences for the supporting structure, as it yields unconservative reaction forces, and it should not be neglected during the design procedure. Moreover, membrane behavior should only be activated as a reserve, in order to protect cladding from failure. This is of particular interest for a building façade, where displacements and P-Δ effects at the main lateral resisting system should be limited.
