1. Introduction
Elastomer materials and rubber o-rings are invisible components in day-to-day life, while still invaluable in their function. Hence, these are crucial in the application inside a vehicle drivetrain. Especially innovative electric drivetrains and electric motors require significant different materials in comparison to conventional combustion engines. In comparison to a conventional combustion engine, an electric engine possesses a different operating principle. From this different operation and generation of forces result high engine orders. These engine orders are significantly higher than in conventional combustion engines. In combination with the rotary frequency of the machine, the increased engine orders result in high frequency excitations forces and structural excitations [
1]. Therefore, suitable material data and analysis is needed to simulate and predict the structural dynamics and behaviours [
1,
2,
3].
A frequency response function (FRF) describes the relation between a system excitation and a system response of a dynamic system. In the context of this work, FRFs are used to represent the relationship between the force excitation and the acceleration response in the measurements on the fixture. The vibration and transmission behaviour of a linear system are completely characterized by the system excitation, the transfer function, and the system response. Peaks in the FRF indicate structural resonances in the dynamic system [
4,
5].
Transfer path analysis (TPA for short) aims to describe and understand the sound development from a defined source point to a target point. The coherence is used as a measure of the quality of a transfer function measurement. The coherence describes the degree of linear dependence between two signals. Accordingly, the coherence can be used to assess the influence of disturbances on the value of the transfer function. With a coherence value of 1, there is an ideal linear relationship between the excitation and response signal and no interference is present. This ensures the quality of the measurement and the results. In practical application, coherence values greater than 0.8 are accepted [
6,
7].
Elastomers can be elastically deformed over large expansions. Due to the fact that the stress–strain curve is not linear, the behaviour is called hyperelastic. Elastomers are also viscoelastic. It combines an elastic and a viscous material behaviour. The definition of elasticity describes the reversible material behaviour. The viscous part, on the other hand, concerns a stress against shear. This shear occurs at a defined speed, which means that a material property can be time- and frequency-dependent. The active principles of elasticity and viscosity act simultaneously. However, these active principles are distributed differently in different materials and under different conditions [
8,
9,
10,
11,
12,
13,
14].
Elastomers are mainly used in the application as sealing rings and sealing elements. In regard to testing these components, some norms are known. The aim of these norms is to check and ensure the sealing function [
15,
16,
17].
The author has designed a fixture for transfer path analysis. The aim of this fixture is to examine the sealing ring components for their frequency response functions and, if possible, to characterize them [
18]. In the context of this paper, the suitability of this new fixture for the use in characterizing and modelling of elastomer o-rings is being evaluated. For this purpose, the high frequency behaviour of the elastomer o-rings is therefore investigated. The o-rings are mounted inside the fixture, which results in their designated geometric condition and pretension. The sealings are considered isolated, without any elaborate parts from the electric motor. A frequency spectrum up to 6.5 kHz is being considered.
2. Materials and Methods
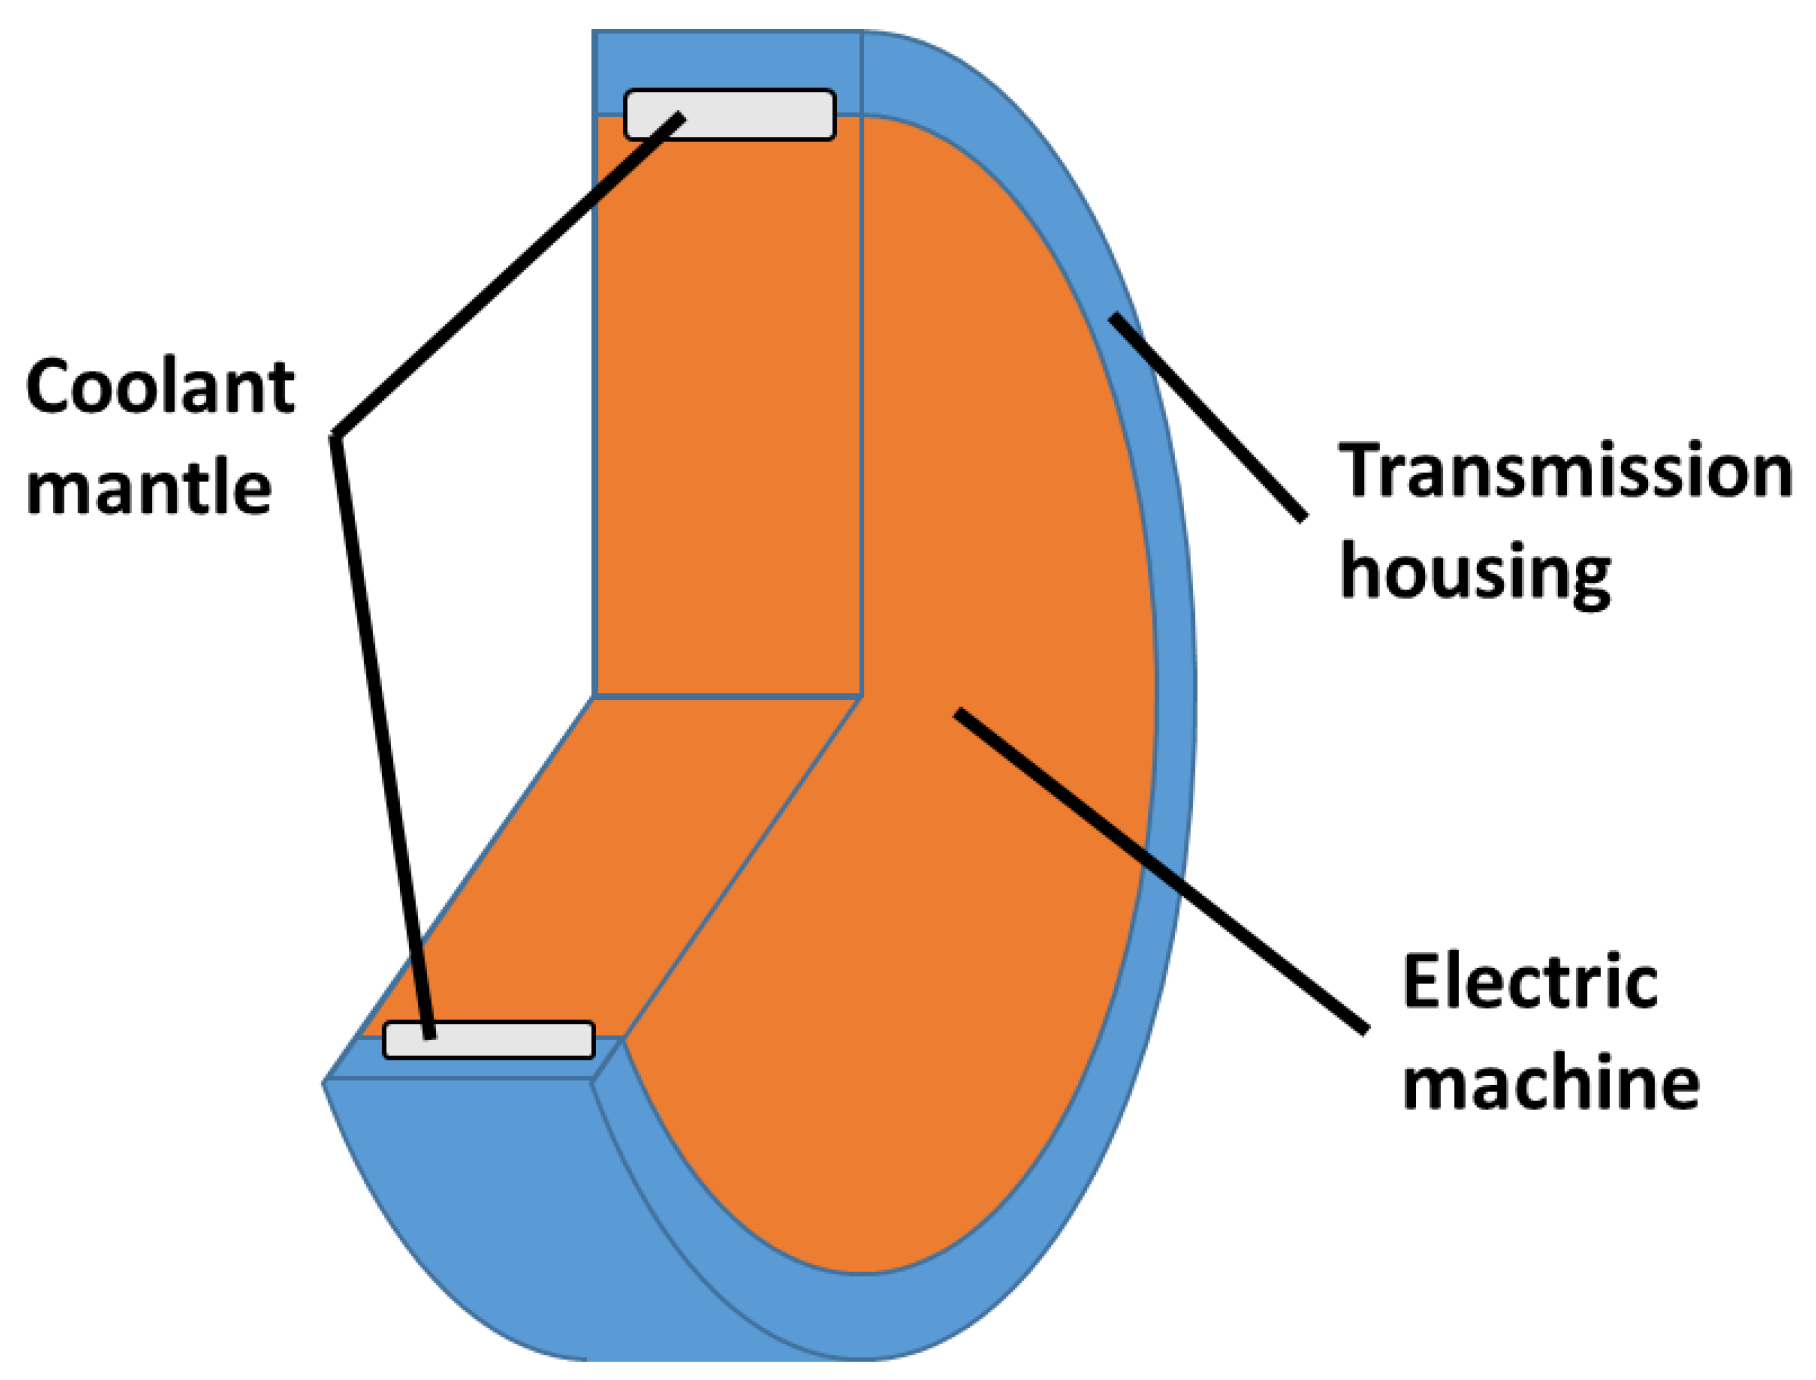
This chapter sets out the methodology and the novel fixture used to obtain the results. The fixture is derived from the electrical motor. In the electric motor, elastomer sealing rings are used to seal and restrict a cooling mantle. This cooling mantle is located between the outside of the electric motor stator and the inside of the outer transmission housing. The cooling mantle thus surrounds the entire electrical motor in a thin gap. The elastomer sealing rings are also positioned in this thin cylindrical gap. As in
Figure 1 depicted.
During assembly, the elastomer rings are stretched onto the inner cylinder. This leads to a static expansion in radial and tangential direction. The o-rings have a hardness of 70 shore. Then the inner cylinder with the elastomer rings is pressed into the outer ring. This causes the elastomer rings to experience static compression in the radial direction. The dynamic load on the elastomer rings can be applied in all three spatial directions.
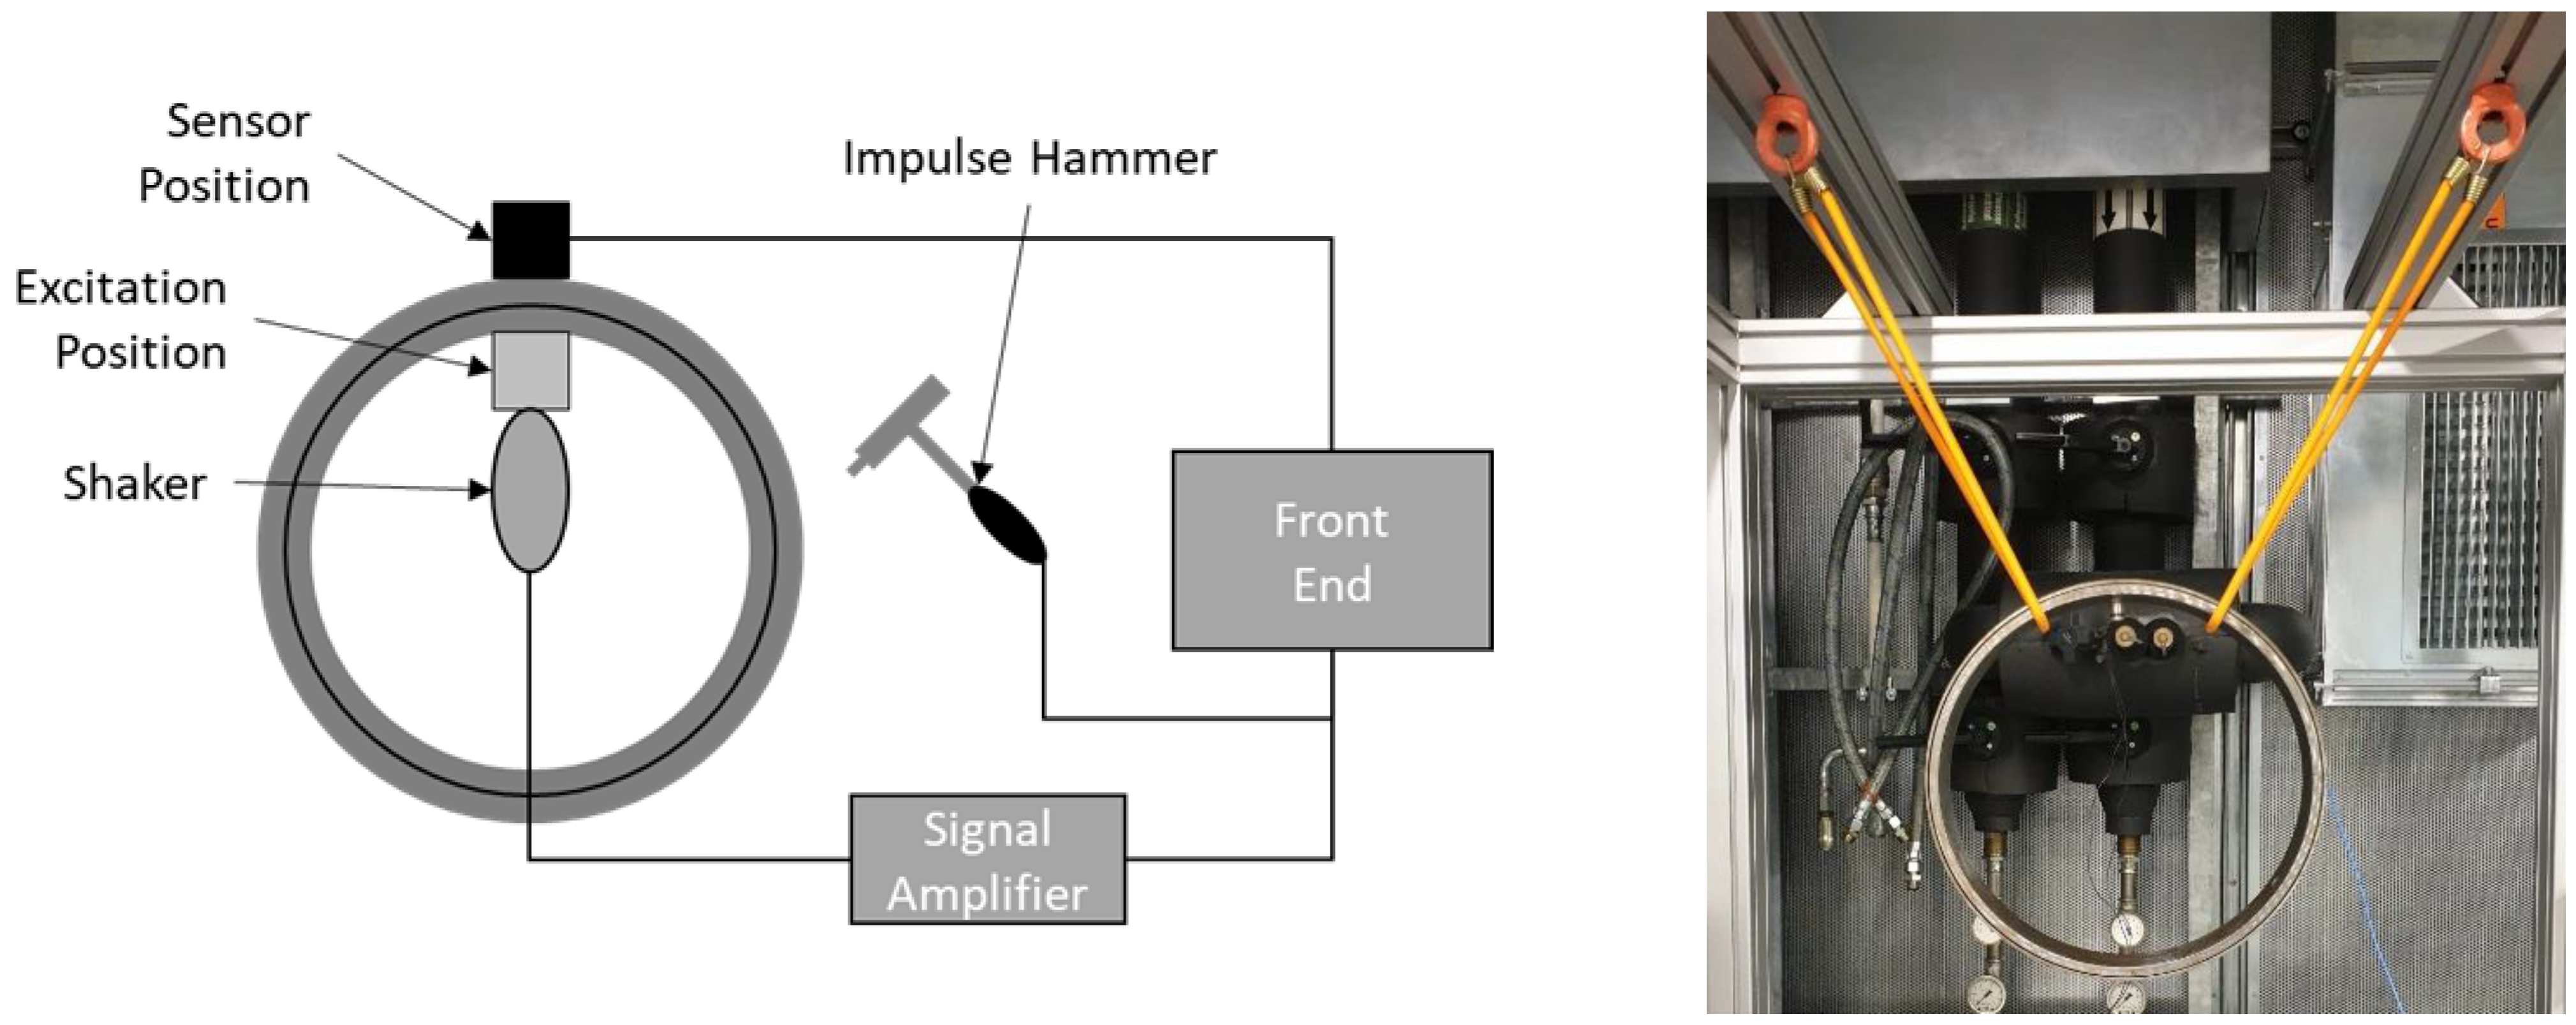
The fixture used reproduces the static stress condition of the elastomer sealing rings and ensures that they are in the intended assembly condition. Two concentric cylinders made of steel are used for this purpose. The inner cylinder has two grooves into which the elastomer sealing rings are expanded and positioned. Then the inner steel ring—together with the elastomer rings—is inserted into the outer steel ring. The final state is depicted in
Figure 2. The fixture for measuring the elastomer sealing rings is freely suspended from a fixed steel frame using elastomer expanders. An impulse hammer and a high frequency miniature shaker serve as excitation sources. As depicted in
Figure 3.
An impulse hammer is used as one excitation source. This impulse hammer has an integrated force sensor on the impact side of the hammer. The modal hammer PCB-086C03 is used with a hard steel tip.
A high-frequency miniature shaker is used as a second excitation source for the forced excitation. With the shaker, the force is applied orthogonally to the surface. The frequency spectrum of the shaker covers a bandwidth of 0.5–10 kHz. The shaker has an integrated force sensor. Proportional to the applied voltage, the shaker can apply a maximum averaged force of 0.7 Nrms.
The structural system delivers an acceleration response to the force excitation. In order to record this response signal, the system is equipped with acceleration sensors. The sensors used are triaxial acceleration sensors of the type PCB-356A15.
The entire fixture shown is subjected to a transfer path analysis. For this purpose, the frequency response function (FRF) between two defined measuring points is calculated. In this application, the quotient of the acceleration reaction and the force excitation is calculated. The detection of the reaction is done on the other opposing side of the structure, from where the excitation happens. In the context of this work, an excitation is carried out in radial, axial, and tangential spatial directions. As a response, the same respective direction as in the excitation is considered.
The frequency range considered starts at 500 Hz and ends at 6500 Hz.
3. Results
After the materials and methods have been presented in the previous chapters, the results of the measurements will be discussed here. For this purpose, the FRFs in form of the inertance, the coherence, and the phase are presented.
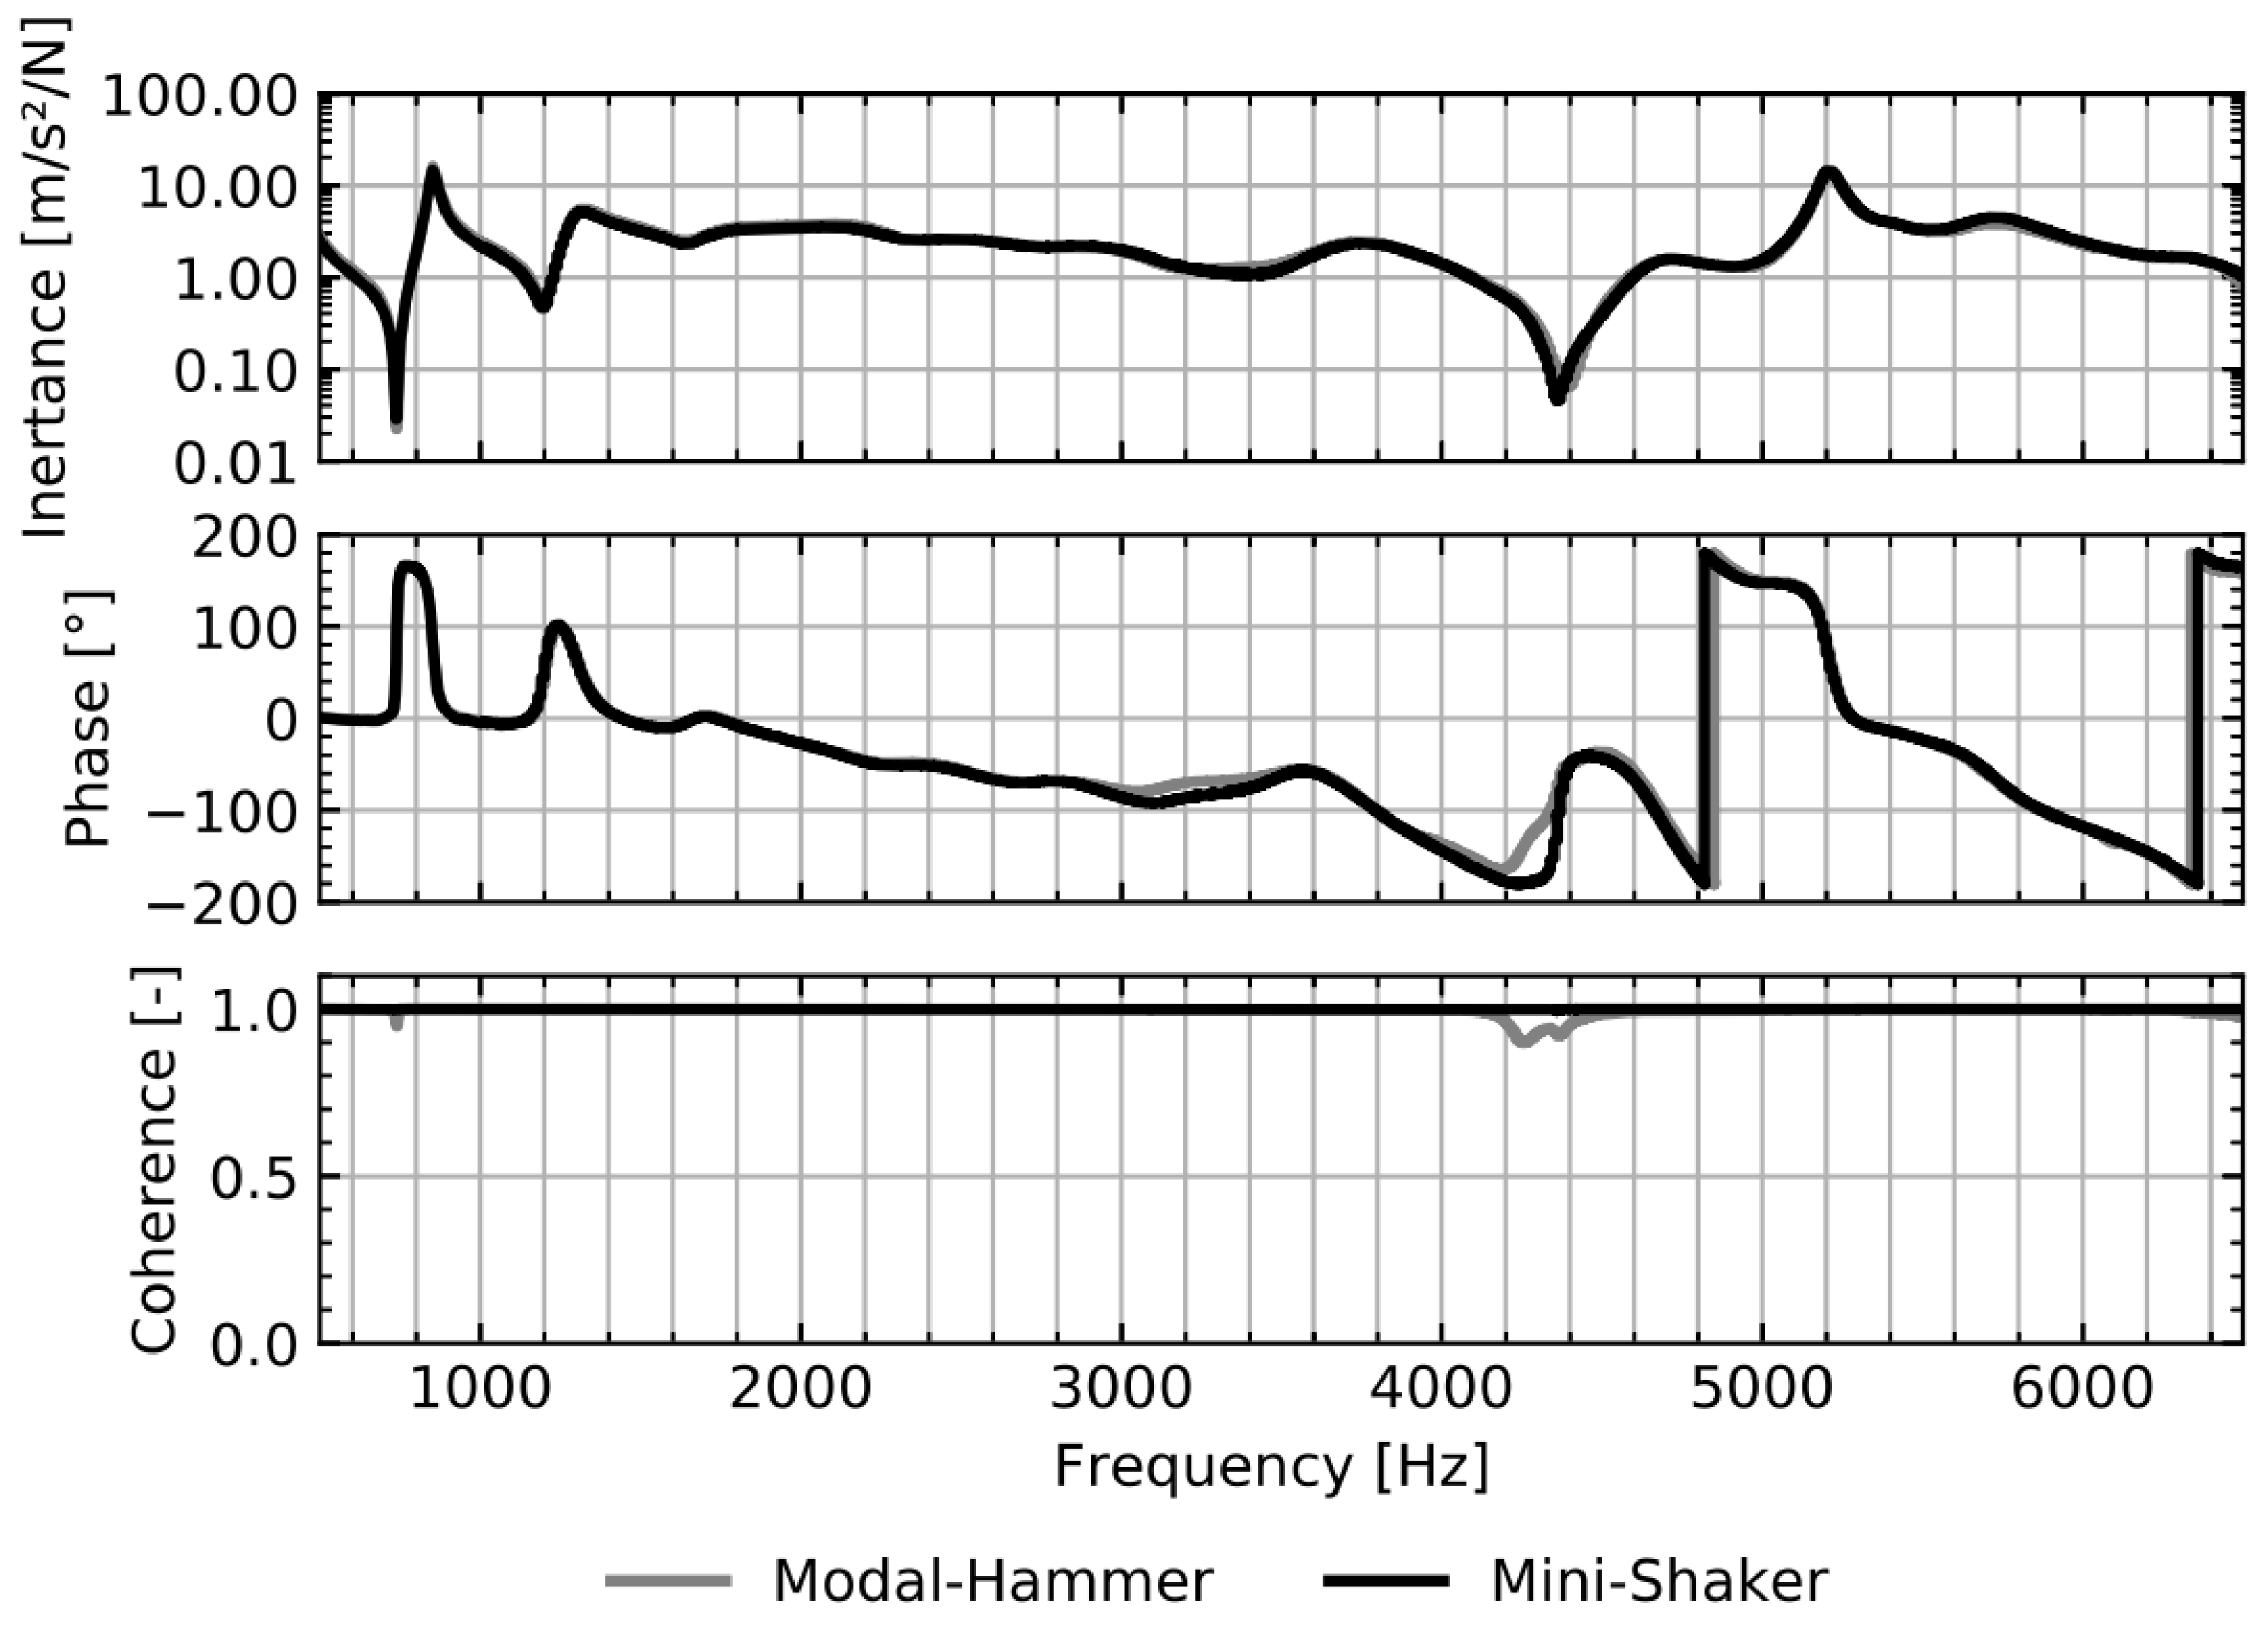
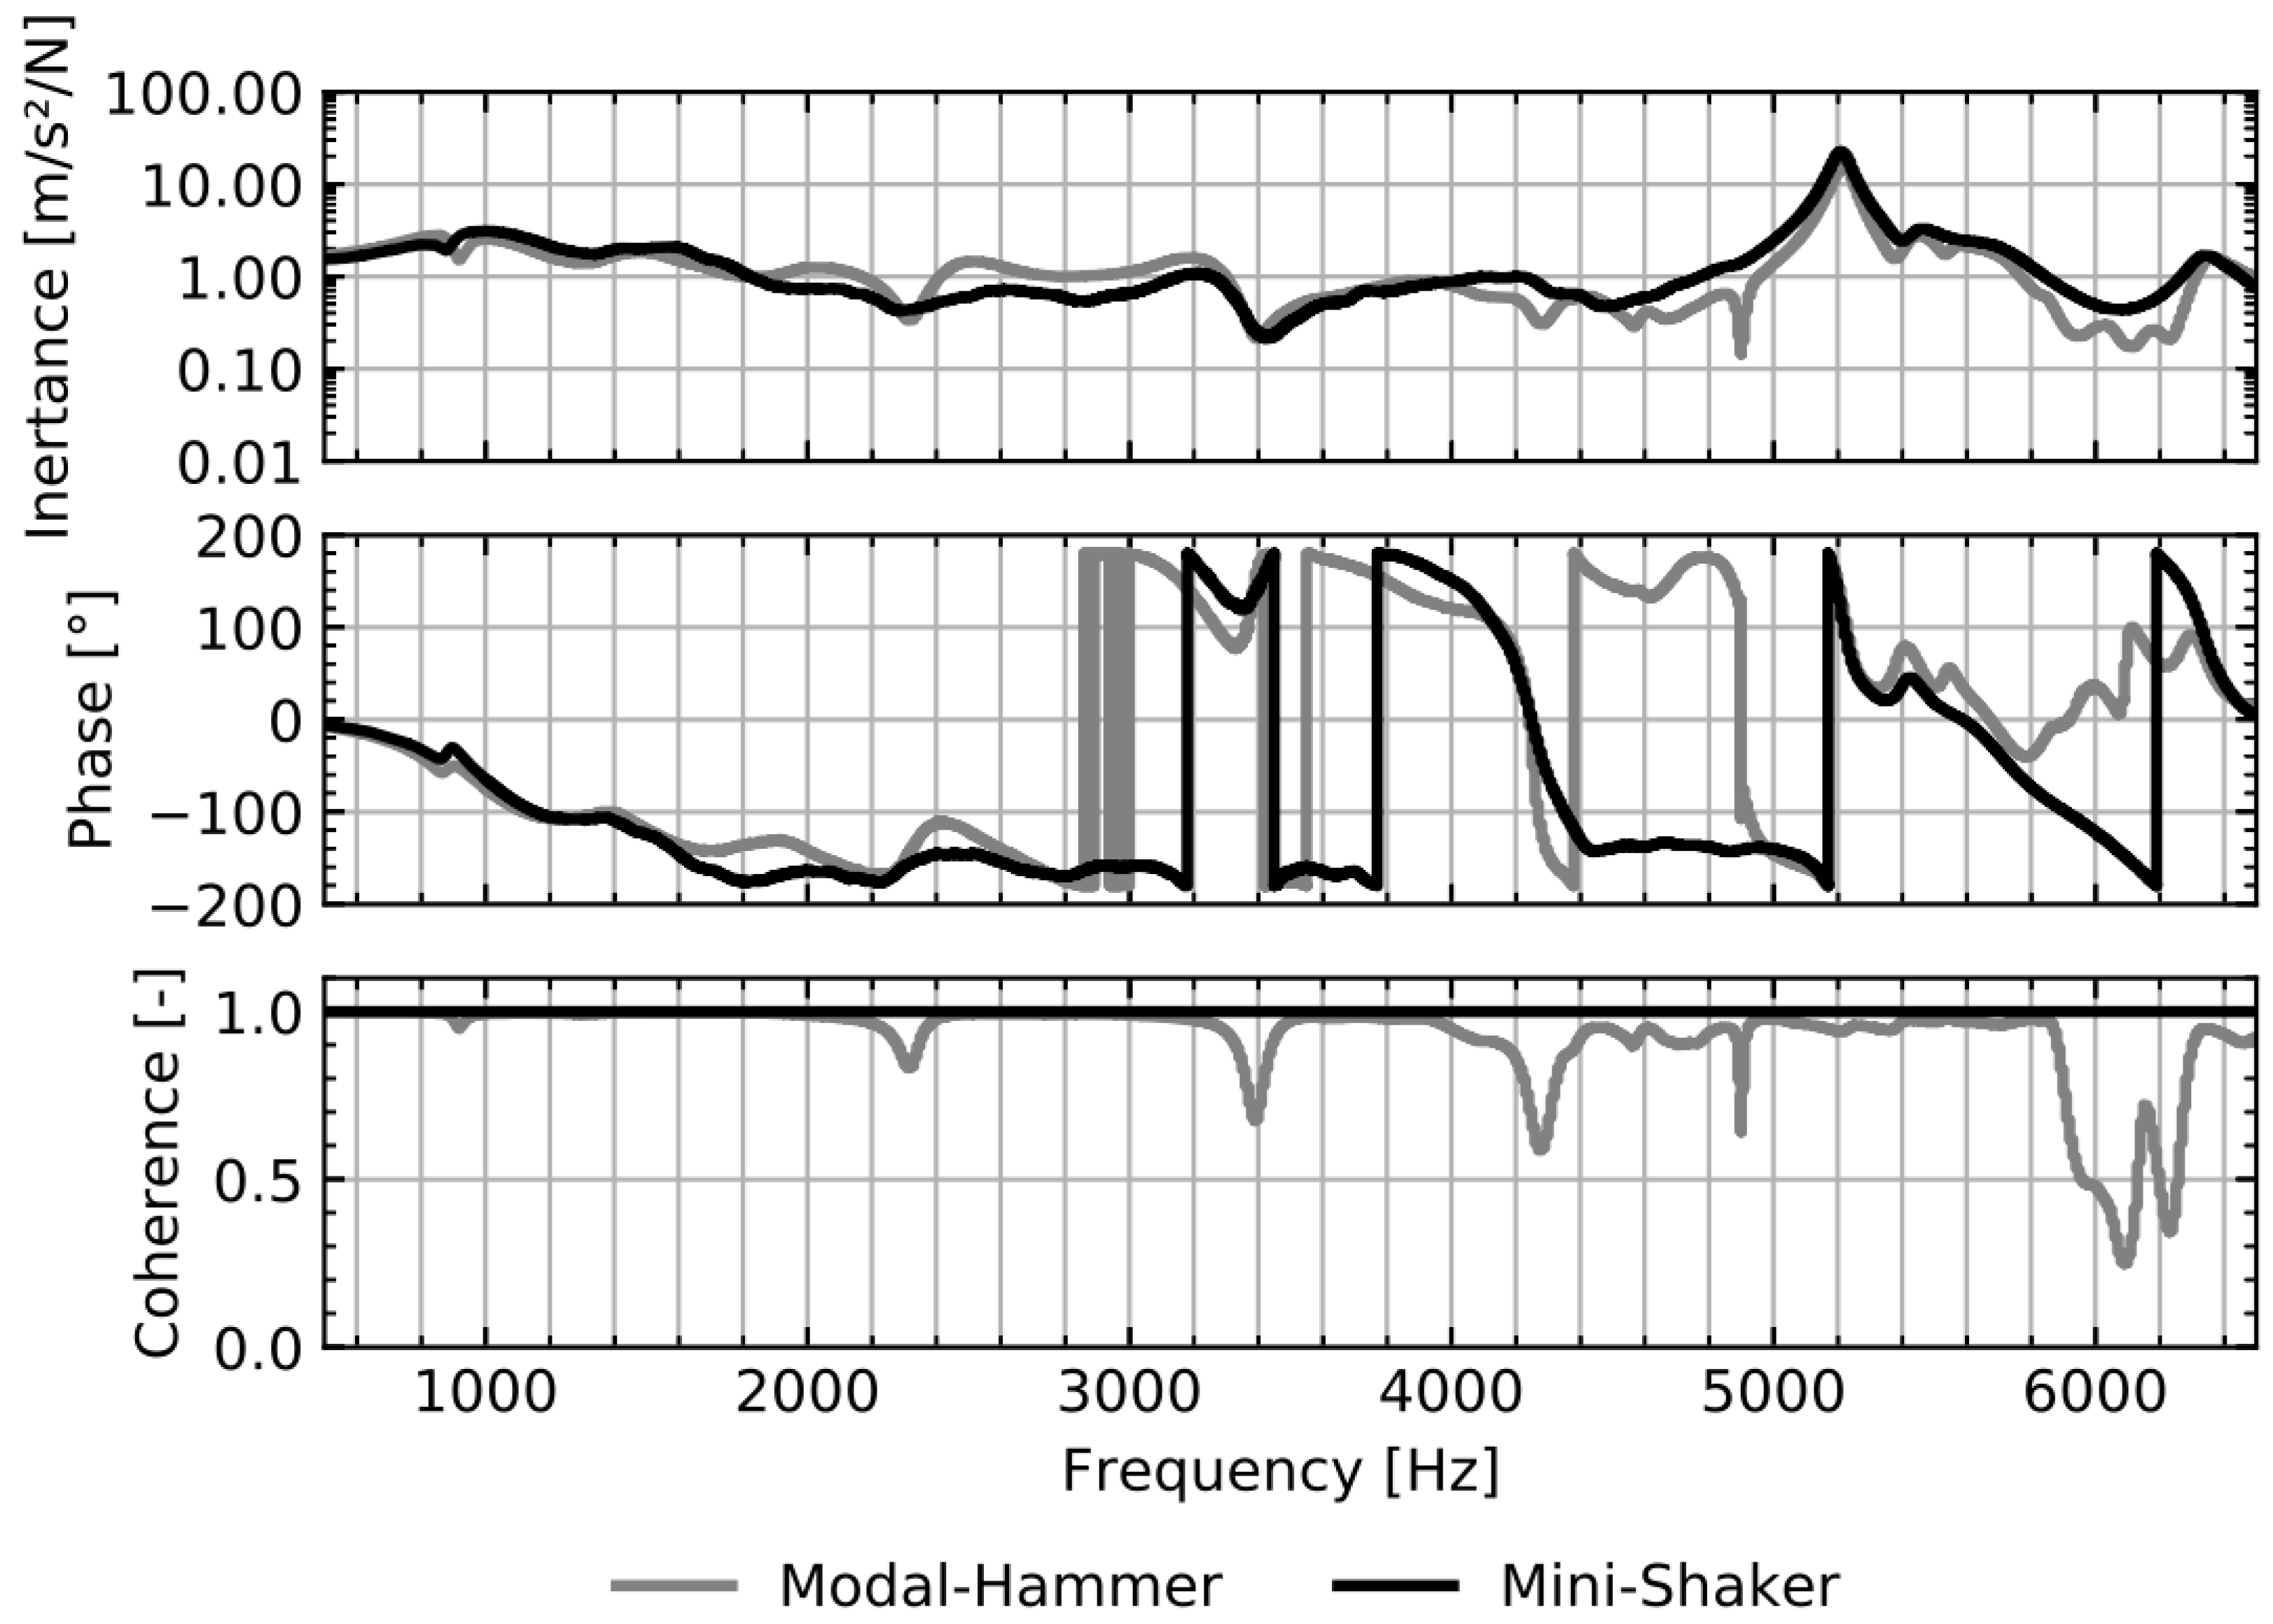
In
Figure 4, the inertance, coherence, and phase are shown for the excitation point and measurement point at 0° coordinate in the radial direction of excitation. Both an impulse hammer and a miniature shaker served as excitation sources.
The figure shows that the FRFs for both excitation sources have a good agreement for the complete considered frequency range. The only deviation is visible between 4200 and 4400 Hz, where the anti-resonance for the impulse-hammer excitation is not distinct and the amplitude of the FRF is higher. In the same frequency range, there is a difference in the phase response. Considering the coherence for the shaker excitation, the value remains at the maximum value 1. The coherence of the impulse hammer excitation shows a slight deviation from the value of 1 at the frequency of about 750 Hz, without any further correlation with the inertance and phase. An increased deviation is observable between 4200 and 4400 Hz. In this frequency range, the coherence for the impulse hammer excitation drops to a level of 0.9. While this value is over the acceptable threshold of 0.8, the frequency range corresponds with the deviation visible in the graph of the inertance and the phase. For all other frequencies of the considered spectrum, the coherence for both excitation sources remains 1 and both the inertance and the phase correspond with one another.
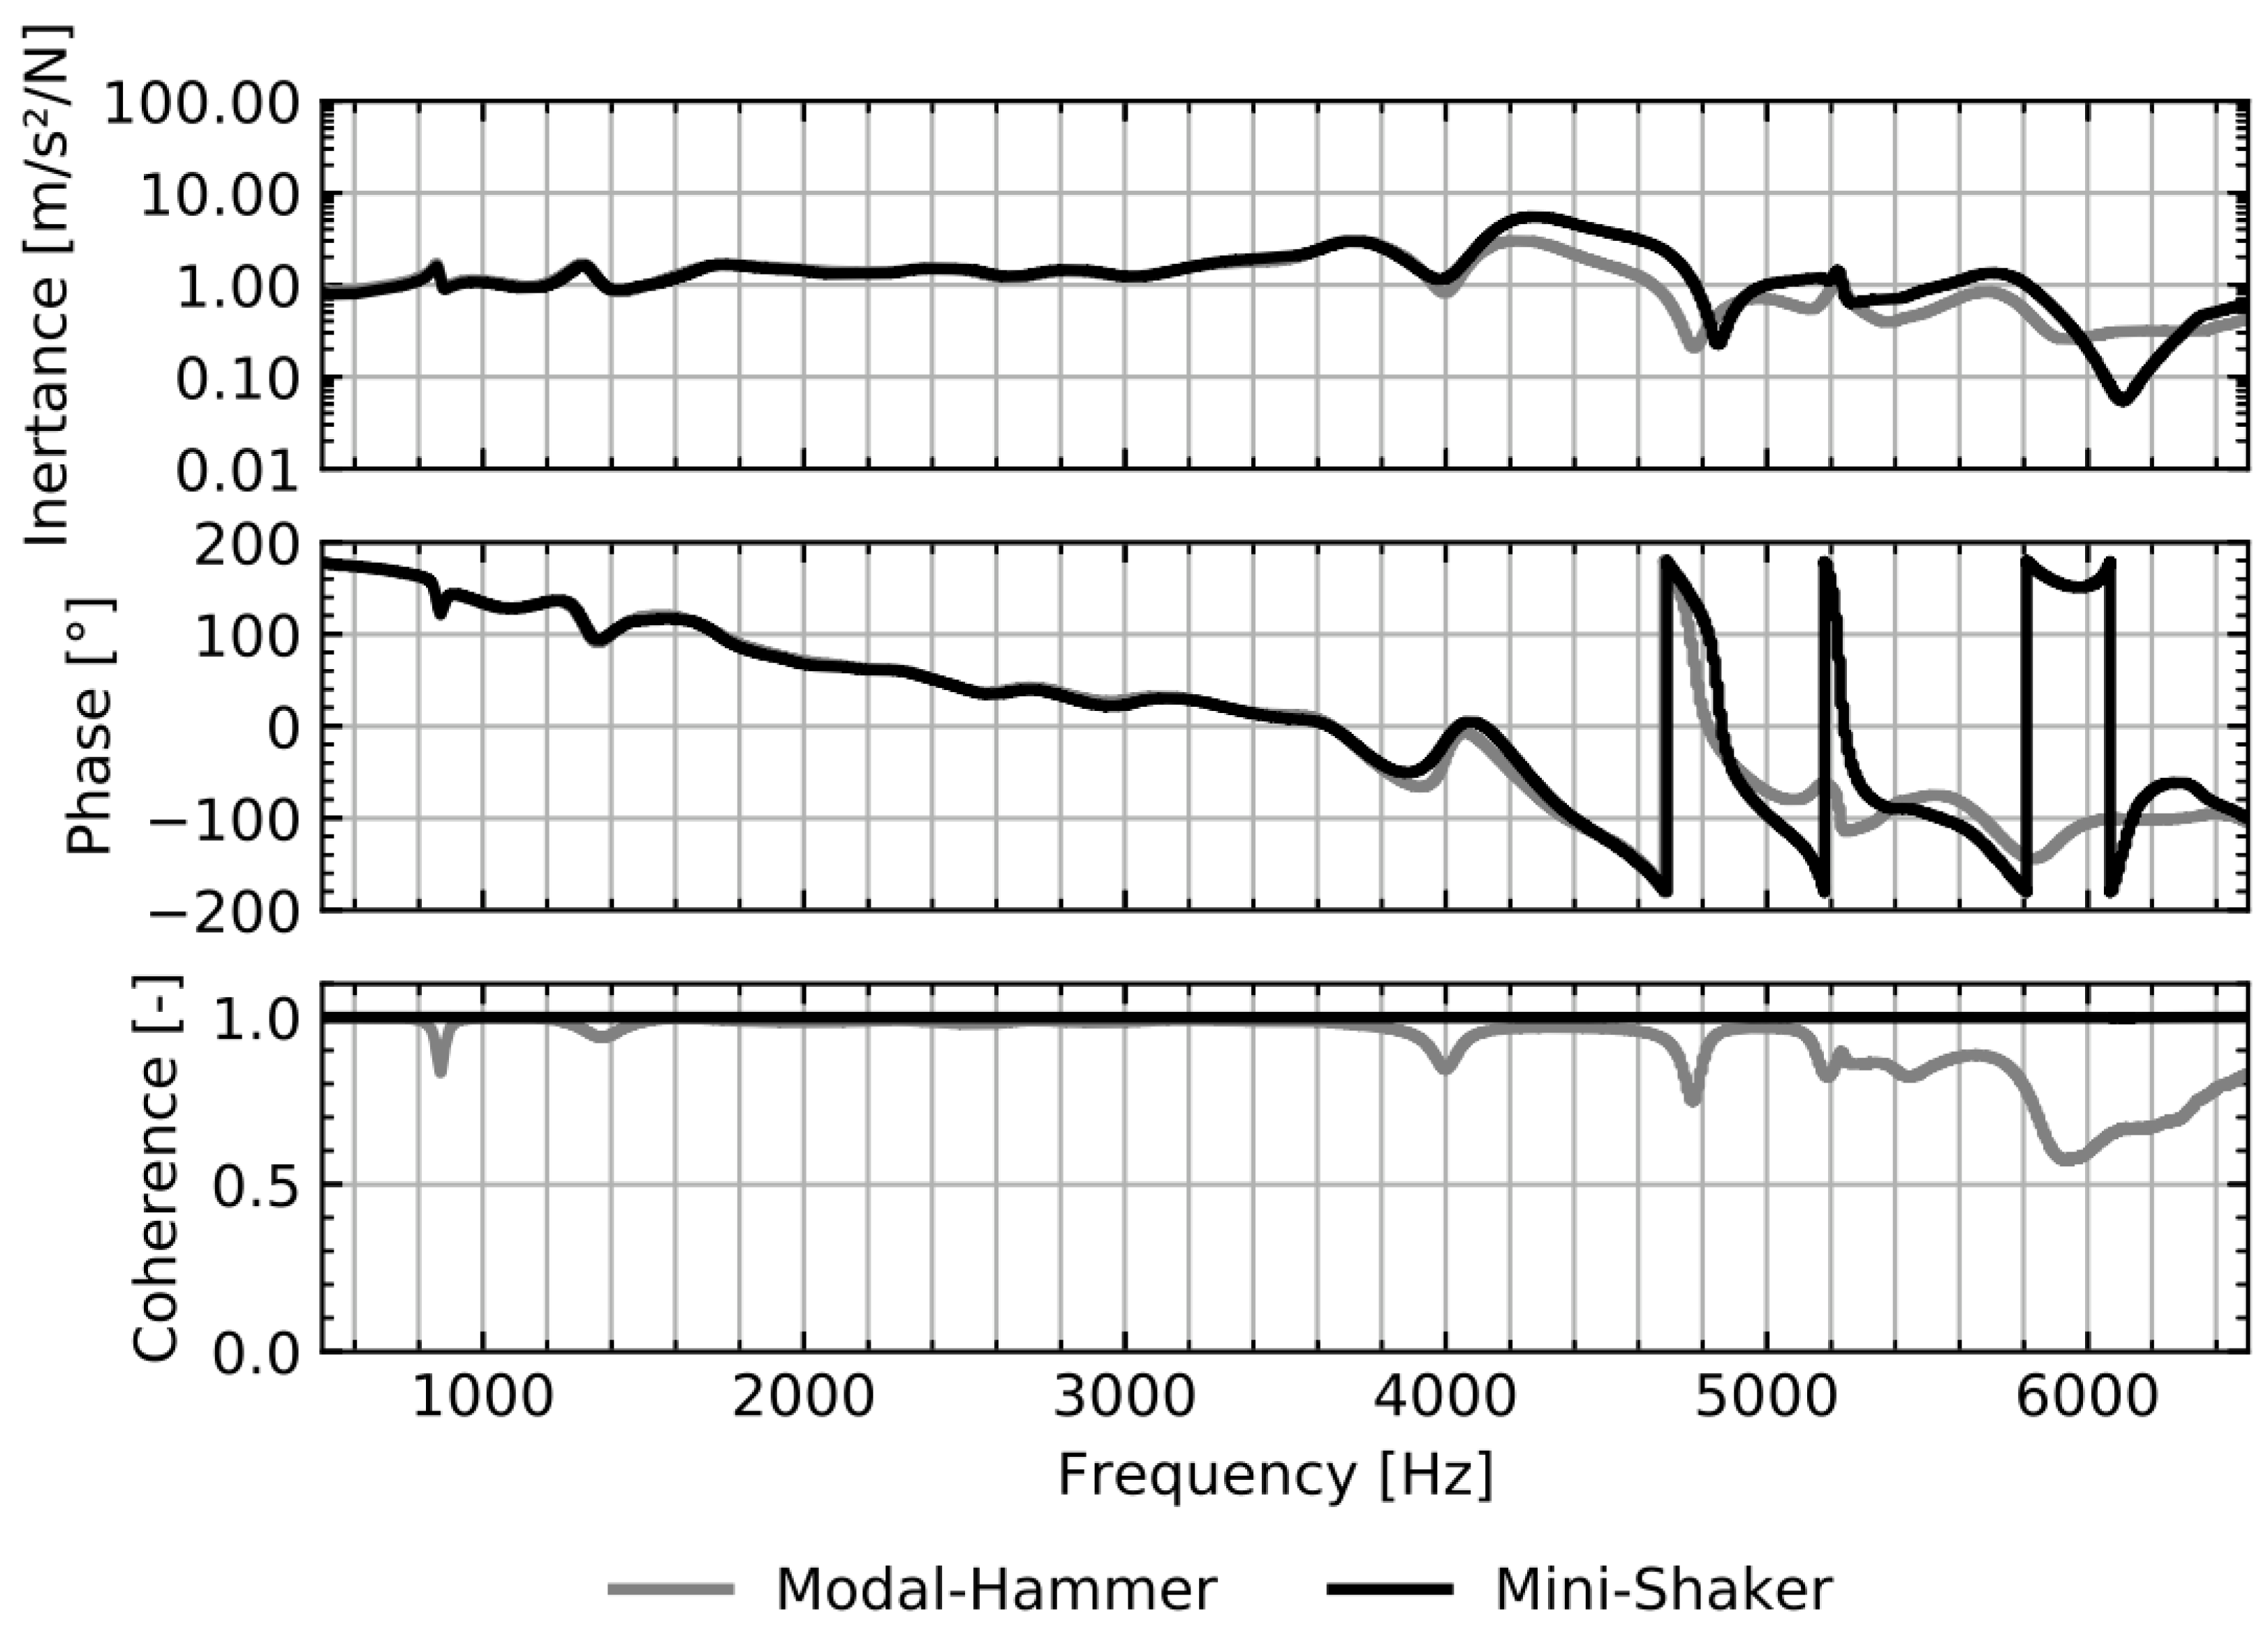
The following
Figure 5 shows the measurement results for the tangential direction. Identical to the previous figure, the FRF, the phase and the coherence are visualized.
The FRFs for both excitation sources are similar in amplitude and frequency below a frequency of 3800 Hz. Starting from 3800 Hz, the amplitude of the impulse hammer excitation drops below the level of the shaker excitation. The resonance frequencies of the impulse hammer excitation are also deviating. As the frequency increases, the curves deviate noticeably from each other. For the phase response, an identical behaviour is observed. Below 3800 Hz, both the excitation sources have the same phase response and deviate noticeably for higher frequencies.
The coherence of the shaker excitation is consistently at a value of 1. The hammer excitation shows small drops at 850 Hz and 1400 Hz, while still remaining over 0.8. It has no effect onto the FRF and phase response. Above 3800 Hz, the coherence of the hammer excitations begins to drop significantly. The lowest point is reached at a level of 0.6. This behaviour corresponds with the deviations in the FRF and phase response. With a decreasing level of coherence, the deviations in the phase response are significant.
The following
Figure 6 shows the measurement results for the exciters impulse hammer and miniature shaker in axial direction.
The FRFs for both excitations are similar until the frequency of 2300 Hz. Above 2300 Hz, both FRFs begin to deviate. From 3800 Hz on, the amplitude level for the hammer excitation drops below the one for the shaker excitation. The FRF for the hammer excitation shows a sudden drop at 4900 Hz.
The Phase response behaves analogously to the FRFs. Below 2300 Hz, there is no significant difference between both excitations. Staring from 2300 Hz, significant differences between both phase responses are visible. The hammer excitation indicates additional phase jumps, which are not visible with the shaker excitation.
Identical to the cases of the radial and tangential direction, the coherence of the shaker remains 1 throughout the complete frequency spectrum. The coherence of the hammer excitation shows frequent den deep drops above 2300 Hz. Especially the values at 3400, 4250, and 4900 Hz drop below the level of 0.8. The deepest and widest drop in the coherence happens between 5700 and 6500 Hz. In this frequency range, the coherence drops to a level of 0.25.
4. Discussion
For both excitation sources, both the FRFs and the phase response show deviations from each other over large ranges of the frequency spectrum. These deviations occur in frequency ranges, where the coherence of the impulse hammer excitation drops below 1. This can be caused due to nonlinear properties of the system or due to insufficient measurement quality. Either way, this makes the plausibility of the impulse hammer excitation more difficult, in comparison with the shaker excitation. Especially in higher frequencies, the deviation and the coherence drop down increase. An assessment of the behaviour in the frequency spectrum over 6.5 kHz is to be done. It is expected that the coherence of the impulse hammer will continue to decrease with increasing frequency.
From the relative comparison of the excitation directions, a strong difference in behaviour between the axial and the tangential direction becomes apparent. The axial excitation direction shows stronger coherence dips than the tangential excitation direction. This may be due to the fact that the dynamic loading of the two elastomer sealing rings happens different. One explanation can be that the displacement in tangential direction is more and stronger restricted than the axial direction. Furthermore, different resonance mode shapes of the structure could cause the drops in coherence. Further investigations on the resonance mode shapes could be helpful.
Based on the measurement results and the constant coherence, the fixture in combination with the shaker excitation is suited to measure the FRFs of an elastomer sealing rings component up to 6.5 kHz. A current limitation is the small force and amplitude of shaker excitation. It allows only the consideration of FRFs in the linear viscoelastic material behaviour. To consider further nonlinear effects of the material, another excitation source is needed, one which generates more force and a bigger amplitude. The presented fixture can still be used.
5. Conclusions
In this paper, a novel fixture for transfer path analysis of elastomeric sealing rings up to a frequency of 6.5 kHz was evaluated.
The relative comparison of the excitation sources shows that the coherence of the impulse hammer decreases for higher frequencies. This makes the plausibility of the measurement results—obtained with a modal hammer—more difficult. An assessment of the behaviour in the frequency spectrum beyond 6.5 kHz still has to be done and will be part of future and further investigations. It is expected that the coherence of the impulse hammer will continue to decrease. Therefore, the shaker excitation is recommended. For the shaker excitation, no drops in the coherence are observed. This leads to an increased confidence in the quality and accuracy of the obtained results.
From the relative comparison of the excitation directions with the impulse hammer, a strong difference in the behaviour between the axial and the tangential direction becomes apparent. The axial excitation direction shows stronger coherence dips than the tangential excitation direction. In the radial excitation direction, the coherence function shows consistently acceptable values. This can be because the two elastomer sealing rings experience different loading from the dynamic excitation. For dynamic excitation with the high-frequency miniature shaker, the coherence is ideal in all three spatial directions.
The measurement results and the coherence with the high-frequency miniature shaker as exciter show that the device is suitable for measuring the elastomer sealing rings at high frequency. This enables the future and further work of relative comparison of different elastomer materials, with the same geometry. At the same time, the effects of the choice of material on the transmission behaviour of the elastomer sealing rings can be investigated in the future. Such investigations are planned to be part of further work.
Another comparison is possible with a FEA simulation. In such a simulation, it can be assessed how accurately an elastomer sealing ring needs to be modelled and simulated in its transmission behaviour to capture the realistic material behaviour. This investigation is part of future work. For future work, a frequency analysis for the separate parts of the fixture is also planned. This will allow to perform a detailed validation of the FEA model.
A possible extension for the setup is different excitation sources and excitation sources with defined excitation amplitudes or larger force amplitudes. This enables the fixture for the assessment of the force and amplitude dependence of the elastomer sealing rings.
6. Patents
SCHNELL, Michael; GRADTKE, Marvin: Vorrichtung und Verfahren zur Prüfung von Dichtringen und/oder Validierung von Werkstoffdaten von Dichtringen. Daimler AG. Anmeldenr. 102,019,007,911.6, Deutschland. 9 July 2020. Deutschland. Veröffentlichungsnr. DE 102,019,007,911 A1.


