1. Introduction
Railway bridges are essential components of any railway transportation infrastructure system. These bridges are affected by natural disasters and other environmental effects like extreme temperature changes, weathering, and corrosion, etc. In addition to showing signs of distress due to aging, these bridges are subjected to increasing operational demand. All these issues could lead to structural damages of various types. If these damages are not detected at an early stage, it could cause the costly failure of bridges. A significant number of these bridge failures could be avoided through the application of maintenance strategies that would detect signs of damage at an early stage so that appropriate measures could be taken to prevent more severe damage.
Railway bridges are usually monitored through the traditional application of visual inspections and non-destructive testing (NDT). Such methods, while still important and certainly have their advantages, are time-consuming and inconvenient for bridge owners and operators since the bridge needs to be closed from being operational during the inspection. The accuracy of the visual and NDT-based condition assessment depends on the level of experience of the inspector and, therefore, susceptible to human error. Often some critical components can not be inspected in this manner due to the location of such components being inaccessible. Thereby such methods could be unreliable and inconsistent in their findings [
1]. As a result, developing SHM methods to assist the on-site monitoring practice of railway bridges is increasingly becoming an area of interest, and implementation of various SHM techniques for railroad bridge management needs to be given high priority for research and development [
2]. SHM, however, may not be relied upon to detect all types of damage and its performance depends on the accuracy of collected data, and the robustness of the methodologies. A well-developed SHM system when complemented with an on-site inspection and NDT-based assessment techniques can improve the overall bridge condition assessment process.
Various researchers around the world have developed methods for condition assessment of various types of bridges (for example [
3,
4,
5,
6,
7,
8,
9,
10,
11,
12,
13]). The damage detection methods presented in the literature can be categorized as parametric and non-parametric methods. Parametric methods usually, while they can provide more information on the type of damage compared to their non-parametric counterparts for damage detection, require the development and updating of detailed finite element models, which often is not possible due to lack of availability of necessary physical data to build the model. This is especially true for large bridges and old bridges for which construction details are not available [
14]. Hence, non-parametric statistical feature-based damage detection methods have been gaining popularity for the health monitoring of bridges over recent years. Non-parametric methods do not rely on the structural properties of the bridge as its parameters are not directly related to the physical characteristics of the system, rather damage-sensitive features are extracted from the reference structure using measured structural responses, and the structure is assessed for changes in those features.
Most researchers working on the SHM of railway and highway bridges have focused on the numerical and experimental investigations of common types of bridges such as girders and truss bridges. Wang et al. presented a damage detection method through experimental testing of a girder-type timber bridge for which displacement data were obtained through the application of a concentrated load [
15]. A damage index was developed based on the difference of displacement measurement between two symmetrical locations along the bridge. While the method shows promising results in identifying and locating damage, it does so by indicating two different symmetrical elements even when damage is at one location and, therefore, does not distinguish between damage in one location and damage in both symmetrically opposite locations. Zhan et al. developed an operational acceleration response-based method to locate and quantify the damage in railway bridges, in which damage is identified in terms of response sensitivity matrices [
16]. While the presented strategy is promising, the method is effective only when the same train at the same speed is used for measuring the response of the bridge at the undamaged and damaged state. A wavelet transformation-based damage detection method was proposed by Beskhyroun et al. They used the dynamic response of a steel railway bridge to actuator-applied excitation as the data for wavelet transformation [
17]. In this study, the damage is detected by comparing the damage indicator under baseline and damaged conditions. While the method is successful in detecting and locating damage, it is based on actuator applied excitation, which requires onsite testing, and, therefore, may not be suitable for day-to-day continuous monitoring.
Bowe et al. developed a damage detection method by analyzing vehicle accelerations induced by train-track-bridge interaction [
18]. Using the wavelet transformation technique, this method showed the potential to detect and locate the damage in terms of changes in pseudo frequency. However, only a simple beam has been studied to represent a railway bridge, which may not represent the three-dimensional behavior of a bridge. Gonzalez and Karoumi used bridge acceleration data as the primary input and proposed a damage indicator based on the prediction error of the ANN system [
19]. However, one limitation of their study is that a simply supported beam is represented as a railway bridge. Moreover, to ensure accuracy, the position and speed of the train load needs to be known. George et al. developed an energy-based method to detect damage in the bridge under train traffic load by comparing the normalized signal energies of the vertical acceleration response of the healthy and damaged bridge [
20]. At present, though, the method can detect the presence of damage only. Quirke et al. developed a damage detection method for railway bridges by comparing the changes in the longitudinal profile of the bridge in response to a passing train [
21]. The method detects damage when the damage location is closer to the mid-span. When the damage is closer to the support, the performance of the proposed method is not as effective.
Zhu and Zhang developed a damage detection method for bridge structures under moving load using the delay vector variance method [
22]. Numerical studies on a simply supported beam under moving vehicle loads were conducted to investigate the influence of different crack models in identifying damage. In this study, the nonlinearity of bridge dynamic response in a vehicle–bridge coupling system was used to detect damage that showed robustness to noise and is not influenced by the location of sensors, which is encouraging for practical implementation. The method was tested on a simple beam-type bridge with large stiffness ignoring the effect of geometric nonlinearity. The results are promising for the simple-beam test. Shahsavari et al. proposed a damage assessment method for a steel-truss bridge using a wavelet-based energy rate index as the indicator of damage [
23]. Through numerical validation study, it was shown that the method can detect damage in truss elements such as diagonals and bottom chords, provided the damage is very severe (reduction of geometric properties by 70% or more). For small to moderate damage levels, the method can not assess the difference between the baseline bridge and the damaged bridge. Ruffels et al. recently investigated a model-free damage detection method using a laboratory model of a steel-arch bridge [
24]. The method compared the vibration response from the undamaged bridge to the damaged bridge and utilized two outlier detection methods, the Mahalanobis distance and the Kolmogorov–Smirnov test, as indicators of damage. While the results are promising, there are instances when damage was not detected, and the method could not predict the severity of the damage. The authors have developed an operational acceleration-based method for railway bridges using a sensor-clustering technique [
25,
26,
27]. Based on the numerical and experimental results, the method was able to identify and locate damage in bridge elements in terms of a damage feature calculated as the difference of fit ratios between the actual response and the predicted response from a time-series model. While the method is promising, damage localization performance could be improved. The framework presented in this paper focuses on improving the performance of the damage localization of that previous work.
In general, the modal-based and other acceleration-based methods usually provide global information of damage as shown by the researchers. Strain-based SHM can overcome some of these issues. Strain analysis can be an effective means to estimate structural parameters, and its application for damage detection has been shown in the previous decades [
28,
29,
30]. Strain monitoring is usually less expensive compared to other measurements like acceleration [
8,
31]). Moreover, strain-based methods have high sensitivity to local damage [
32]. On the contrary, acceleration-based methods may not so sensitive to local damage and usually provide global information of the condition of structure [
33]. Therefore, strain measurements could be more reliable for health monitoring even under noisy conditions. Various strain-based damage detection methods for bridges have been presented in the literature (such as [
34,
35,
36,
37,
38]). However, the performance of the strain-based method is often limited by the availability of the number of strain sensors. Even when all the elements of a structure are monitored with strain sensors, damage localization could be influenced by redistribution of forces, and consequently, additional structural elements apart from the damaged elements could be identified as damaged. Therefore, while both acceleration and strain-based damage detection methods have their advantages and can certainly serve the purpose of identifying damage in bridge structures, there is still a need for research to improve the damage localization performance especially for complicated bridge systems such as truss bridges that consist of numerous elements.
This research builds on the authors’ previous works [
26,
37] to propose a new damage detection framework that takes into account the information obtained from both acceleration and strain data in response to the passage of trains. A new damage feature is developed, which consists of damage features from acceleration and strain data analysis. Through numerical validation studies, it will be shown that the new damage feature is significantly more effective in achieving improved damage localization and relative quantification performance over individual methods for damages occurring at various locations of a railway truss bridge.
2. Derivation of the Damage Feature
The dynamic responses (accelerations, velocities, and displacements) of a structure are governed by the equation of motion (EOM). This equation for the linear dynamic response of a structure with
N Degrees of Freedoms (DOFs) can be written in simple form as Equation (1). Here,
M, C, K represent mass, damping, and stiffness matrices of the system, respectively. The vectors,
are displacements, velocities, and accelerations, respectively. The external forcing function is denoted by P. If the free response is considered, the EOM of the
ith row of an
N DOF system can be expressed as shown in Equation (2).
Equation (2) contains velocity and displacement terms. The time-series model used in the study only incorporates acceleration response since in real-life bridges, obtaining velocity and displacement responses under a moving train can be very difficult. Therefore, the central difference technique is implemented in the 2nd derivative of Equation (2) to replace the velocity and displacement terms leaving Equation (2) with acceleration response only. Then finally rearranging, Equation (3) is obtained. The detailed derivation can be found in Azim and Gül [
25].
It can be seen that for
ith DOF, the sum of
jth DOFs is the contribution from adjacent DOFs. Rewriting Equation (3) for
by subtracting
from acceleration components on both sides of the Equation (3), finally, Equation (4) is obtained.
It can be observed from Equation (4) that a model could be generated to calculate the output of the ith DOF by using other DOFs of the system. However, in a structure with multiple degrees of freedom, the mass and stiffness matrices are sparse matrices with most off-diagonal elements being zero or close to zero. Therefore, an assumption can be made that the output of the ith DOF can be predicted using the outputs of its adjacent DOFs rather than all the other DOFs.
In this manner, similar equations can be written for each row and different models can be created for each DOF of the structure. Each row of Equation (4) can be considered as a sensor cluster with a reference DOF and its adjacent DOFs. Therefore, different linear time series models can be created to establish different models for each sensor cluster and changes in these models can indicate the presence of damage along with its location and severity. In this study, time series models are used to fit the above dynamic response of a structure. The Auto-Regressive Moving Average with eXogenous (ARMAX) input time series model to represent the relationship between input, output, and error terms of a system can be written as Equation (5),
where
y(
t),
x(
t), and
e(
t) are output, input, and error terms of the model, respectively. The unknown parameters of the model are shown with
ai,
bi, and
di. The model orders are
na,
nb, and
nd. By changing the model orders, different time-series models can be defined.
In this study, time series model parameters are obtained by the least square error method. Model orders are obtained by observing the delay in input and output terms in Equation (4) and are set as 0 for
na and 2 for
nb. Based on these, the final form of ARMAX mode for the proposed methodology can be obtained as shown in Equation (6).
Equation (6) is used to create different sensor clusters. These clusters can then be used to extract damage-sensitive features to identify, locate, and estimate the relative severity of the damage. After creating the ARMAX models for both healthy and damaged conditions utilizing the sensor clustering framework, Damage Features (DFs) are extracted from the ARMAX models. For this study,
DF is defined as the difference between Fit Ratios (FR).
FR is expressed as a normalized root mean squared error as shown in Equation (7) where
ym,
yp, and
ym are measured output, predicted output, and mean of measured output data, respectively.
The damage-sensitive features are extracted from the instrumented nodes and denoted as
DFNa.
DFNa is calculated using Equation (8). Here,
FR1 is the fit ratio of the actual response to the predicted response from the ARMAX model for the damaged bridge.
FR2 is the fit ratio obtained by fitting the damaged actual response to the predicted baseline response from the ARMAX model. When the structure is damaged, the ARMAX model based on baseline data cannot fit the damaged data adequately enough compared to the ARMAX models based on damaged data due to the changes in the structural properties. Therefore, by comparing the differences in values of
DFNa s between different DOFs, the presence of damage, its location, and relative severity can be assessed.
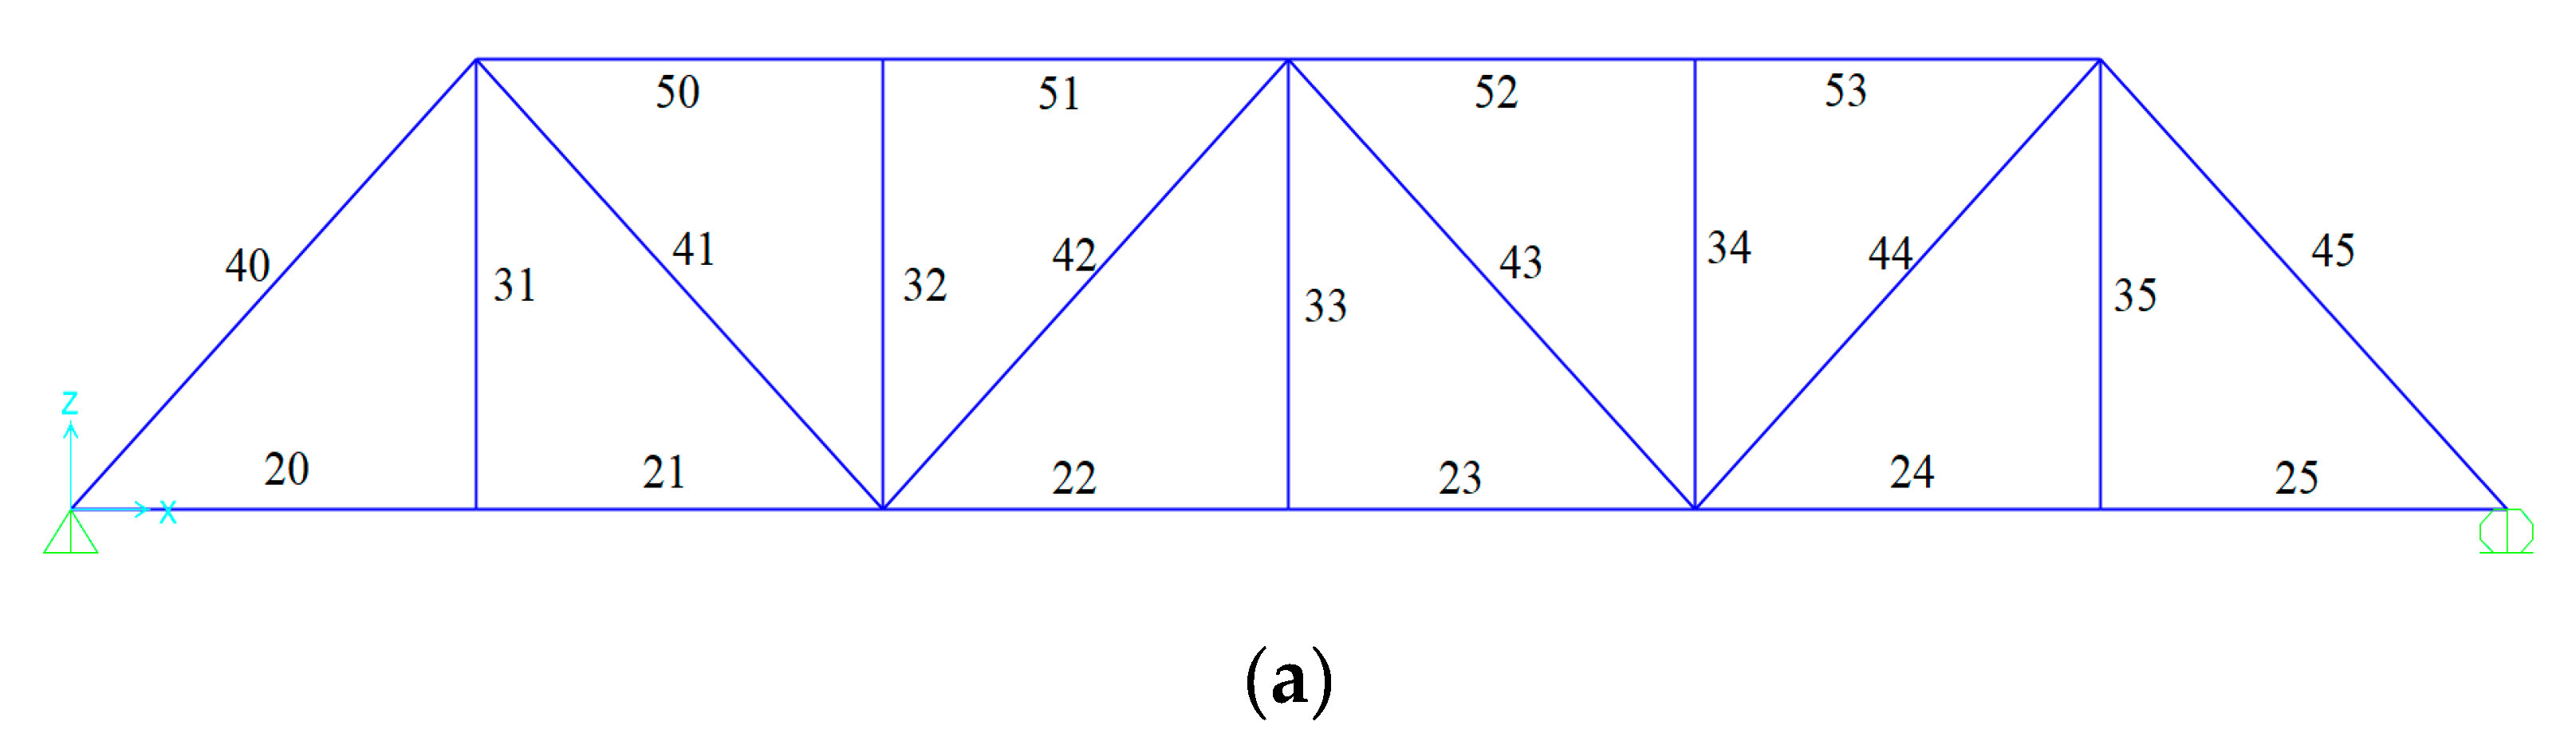
For a truss bridge, two separate sensor clustering systems are implemented: One cluster is based on vertical DOFs and the other cluster is based on longitudinal DOFs. For the former system, vertical acceleration responses and for the latter longitudinal acceleration responses are utilized for the time series analysis. The philosophy is that trusses carry the load through an axial force transfer mechanism. Therefore, any structural change in the members aligned in vertical and longitudinal directions will result in high DFs in the corresponding cluster systems. So, any damage in a vertical member should show high DFs in the vertical cluster analysis and no damage in the longitudinal cluster system. Similarly, damage in the top and bottom chords will show high DFs in the longitudinal cluster only. The diagonal members have both vertical and longitudinal directional components and, hence, should indicate the presence of damage in both the clusters.
First, a threshold DFNa is obtained from the baseline bridge considering no damage. In ideal conditions with no measurement noise, environmental effects, and no operational variation (i.e., no change in train load and speed between simulations), the threshold DFNa will be zero. However, in this research, random noise is added, and train speed and load are changed. This threshold is calculated by comparing the acceleration response of the baseline bridge to two different trains (Tr-1 and Tr-2). For this research, the trains considered are COOPER E80 (Tr-1) and COOPER E90 (Tr-2) at 40 km/h and 50 km/h, respectively. Both these trains are AREMA standard design train loads for railway bridges. Tr-2 carries 12.5% more load per axle. The two responses are repeated 200 times with an added artificial random noise (applied as 5% of maximum Root Mean Square (RMS) of the standard deviation of the acceleration response) and DFNa s are calculated. Then the corresponding to 99% confidence interval is chosen as a threshold which is denoted as . The threshold reflects the variation in acceleration response due to operational variability and measurement noise. Once the threshold is established, any DFNa above the threshold is 99% likely due to structural change from the baseline bridge (i.e., damage).
Once
for both vertical and longitudinal clusters are obtained, various damage cases are simulated and
s are obtained for these cases. The
are then normalized with respect to the maximum
observed from each simulation to obtain
as shown in Equation (9). Then the normalized
is subtracted from the
values to obtain
which is shown in Equation (10). If the value of
becomes less than zero (i.e., the nodal damage features less than the threshold and thereby likely remain the same as the baseline), then these are set to zero.
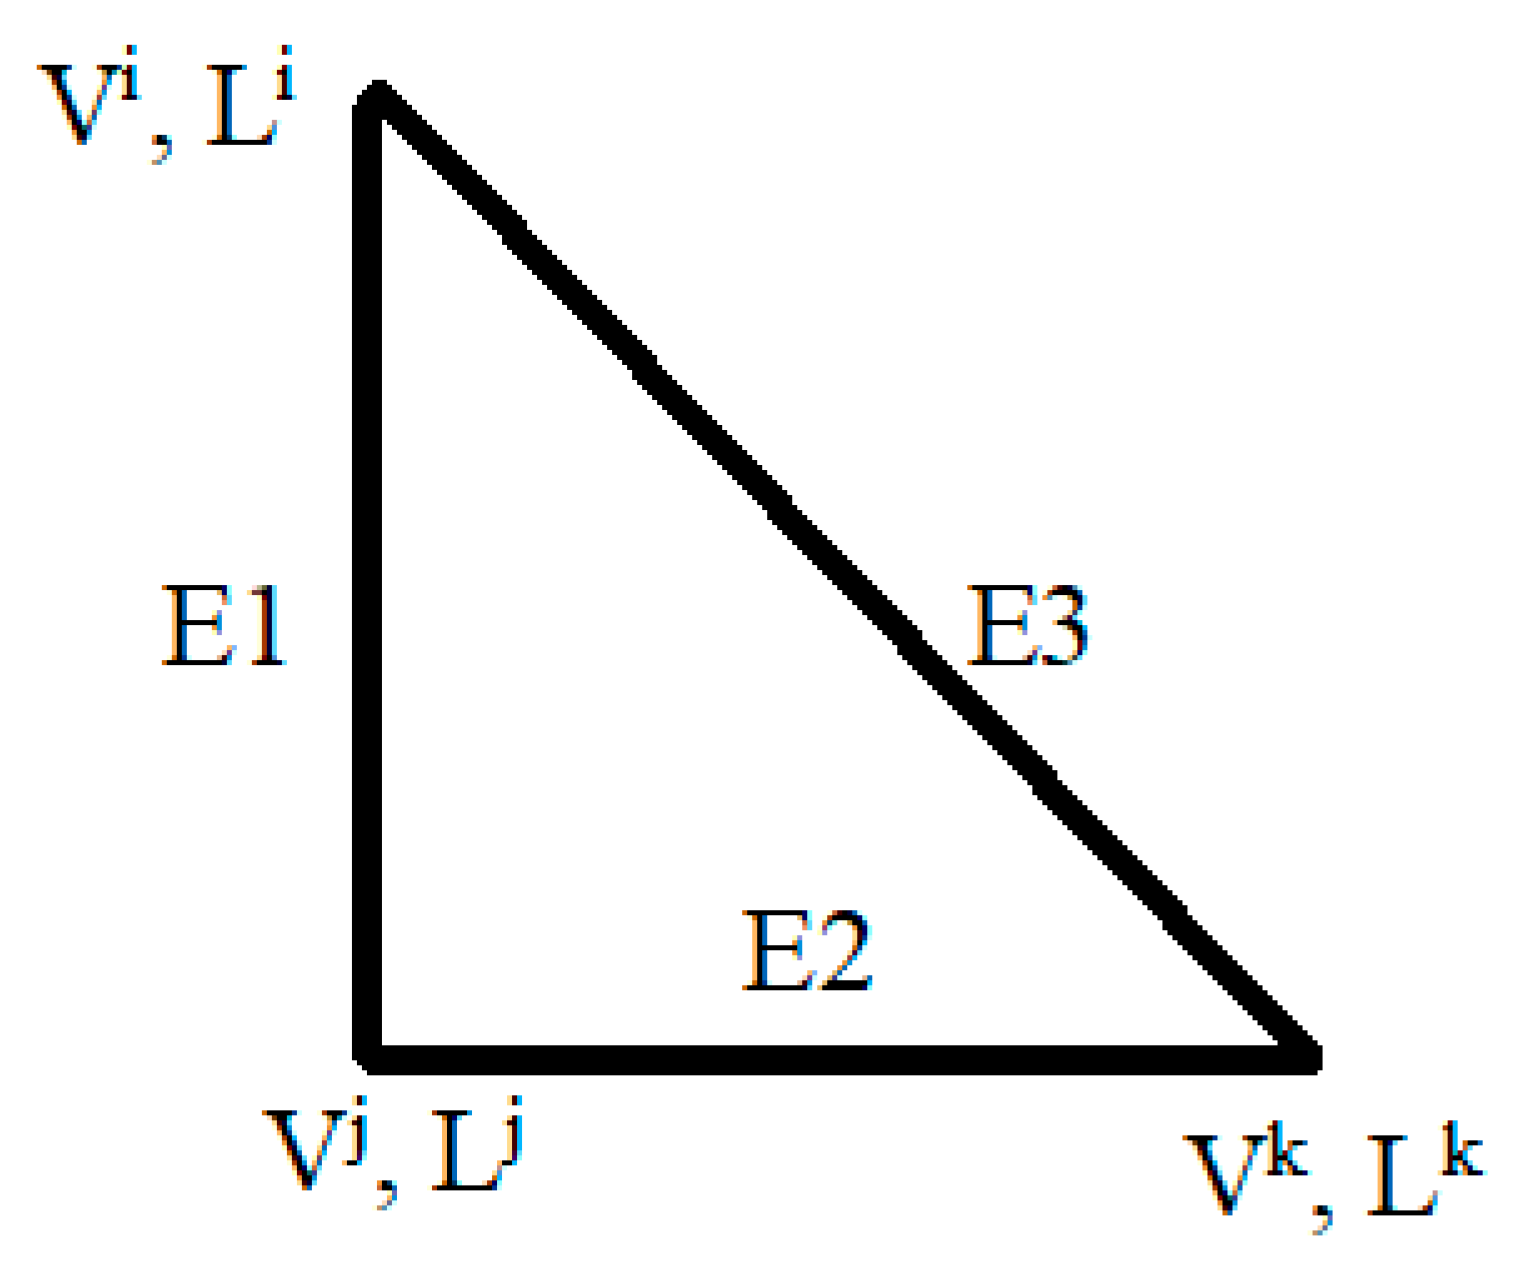
To convert the nodal damage features to element level damage features, for each element x,
of the nodes joining that element along the direction of its longitudinal axis are multiplied together to calculate the damage feature
for that element. Since longitudinal and vertical acceleration data are considered from the two nodes at both ends of an element, such multiplication prevents false identifications of baseline elements, which would result if the
are added instead of multiplied (in that case, just one
above the threshold will falsely identify damage). The process of converting
to
for the vertical and longitudinal cluster analysis (
and
respectively) is shown in
Figure 1 and Equation (11). Consider
Figure 1 as a three-element truss. The element E1 in
Figure 1 is located between nodes i and j. Since this is a vertical element, the element damage feature
is calculated by multiplying the vertical damage features of nodes i and j (
and
, respectively). For example, if both
and
are above the threshold, but
are less than the threshold (i.e., zero), that means only vertical element E1 is damaged and not the diagonal element E3. So, multiplying the nodal damage features will correctly identify damaged element E1 as the value of
will be greater than zero. At the same time, this procedure will prevent false identification of damage in the element E3 as the value of
will be zero. In this manner, a robust element level damage feature from acceleration data analysis is established.
Now, the development of the strain-based damage feature is presented. This proposed method utilizes the strain-time history of the elements of the truss bridge in response to train loading. Therefore, the first step is to obtain the strain response of the truss members and construct the strain matrix
S(t) after the passage of a train, which is shown in Equation (12). Thus, each column of the matrix
S(t) is the strain time-history of each truss element.
Here, Ns is the number of sensors, n is the number of observations in the analyzed data window (n > Ns);
Principal component analysis is performed on the strain dataset which provides
Ns number of eigenvalues λ
i, with
Ns orthogonal eigenvectors
ψi. These are obtained utilizing Equations (13) and (14). The coefficient of variation between each measurement is computed and covariance Matrix,
C is formulated, the size of which is N
s * N
s. Here,
is the mean of
S.
Then, eigenvalues and vectors are obtained by satisfying the equation shown in Equation (11) where
ψ and
λ are eigenvector matrix and eigenvalue matrix, respectively.
These eigenvectors are called principal components where each coefficient within a vector represents each sensor. These eigenvalues are sorted in decreasing order, i.e., λ
1 > λ
2 > … The corresponding eigenvectors ψ
i (
i = 1,2, …,
Ns) represent the principal components from each time-history response with decreasing order of variance with ψ
1 having the greatest variance. Since these components are orthogonal vectors, the first two PCs, from truss elements can be plotted in a 2-D principal component space as coordinates considering ψ
1 and ψ
2 as orthogonal axes. Then the geometric distance, D is obtained for each sensor using Equation (15).
After obtaining
D values for both baseline and damaged bridge, a damage feature (
DFEs), is proposed, which is extracted from instrumented elements by comparing the
D values as shown in Equation (16) where
Db and
Dd represent distances for baseline and damaged bridge principal components, respectively.
If no structural changes occur, the values of baseline DFEs are expected to be very small. Similar to the acceleration-based method, under an ideal condition with no measurement noise, environmental effects, and no operational variation (i.e., no change in train load and speed between simulations), the baseline/threshold DFEs will be zero. Since operational strain data is used, these baseline DFEs values could be attributed to the operational variability and measurement noise. When damage occurs, high DFEs values will be observed for the elements damaged or affected by the damage. Therefore, by observing the changes in the DFEs, the damage could be detected and located.
The threshold damage feature for the strain () is calculated for the baseline bridge to account for measurement noise and operational variation. This threshold is calculated by comparing the strain response of the baseline bridge to two different trains (Tr-1 and Tr-2) in presence of measurement noise. Each of these data sets is simulated 200 times with an added 5% artificial noise and DFEs are obtained. Then DFEs with 99% confidence are chosen as threshold DI for each condition; in other words, the likelihood of DFEs exceeding the threshold without structural change is only 1%.
Then, the
DFEs after each simulation are normalized with respect to the maximum
to obtain
as shown in Equation (17). Finally, the normalized
is subtracted from all
to obtain
which is shown in Equation (18). If the value of
becomes less than zero (i.e., the damage features less than the threshold and thereby likely undamaged), then these are set to zero.
Finally, the new damage feature is calculated by multiplying
individually with
and
and then adding these terms together as shown in Equation (19).
Equation (19) is formed by multiplying the strain damage feature with the damage features from the longitudinal cluster and vertical cluster analysis. identifies damage in any elements regardless of their orientation. As described previously, the is used to detect damage in longitudinal and diagonal elements while is utilized to detect damage in vertical and diagonal elements. When is multiplied with and , such multiplication removes false identification from individual analysis, and results in improved damage localization performance. Finally, the multiplied damage features are added together to assess the overall condition of the bridge.
4. Analysis and Results
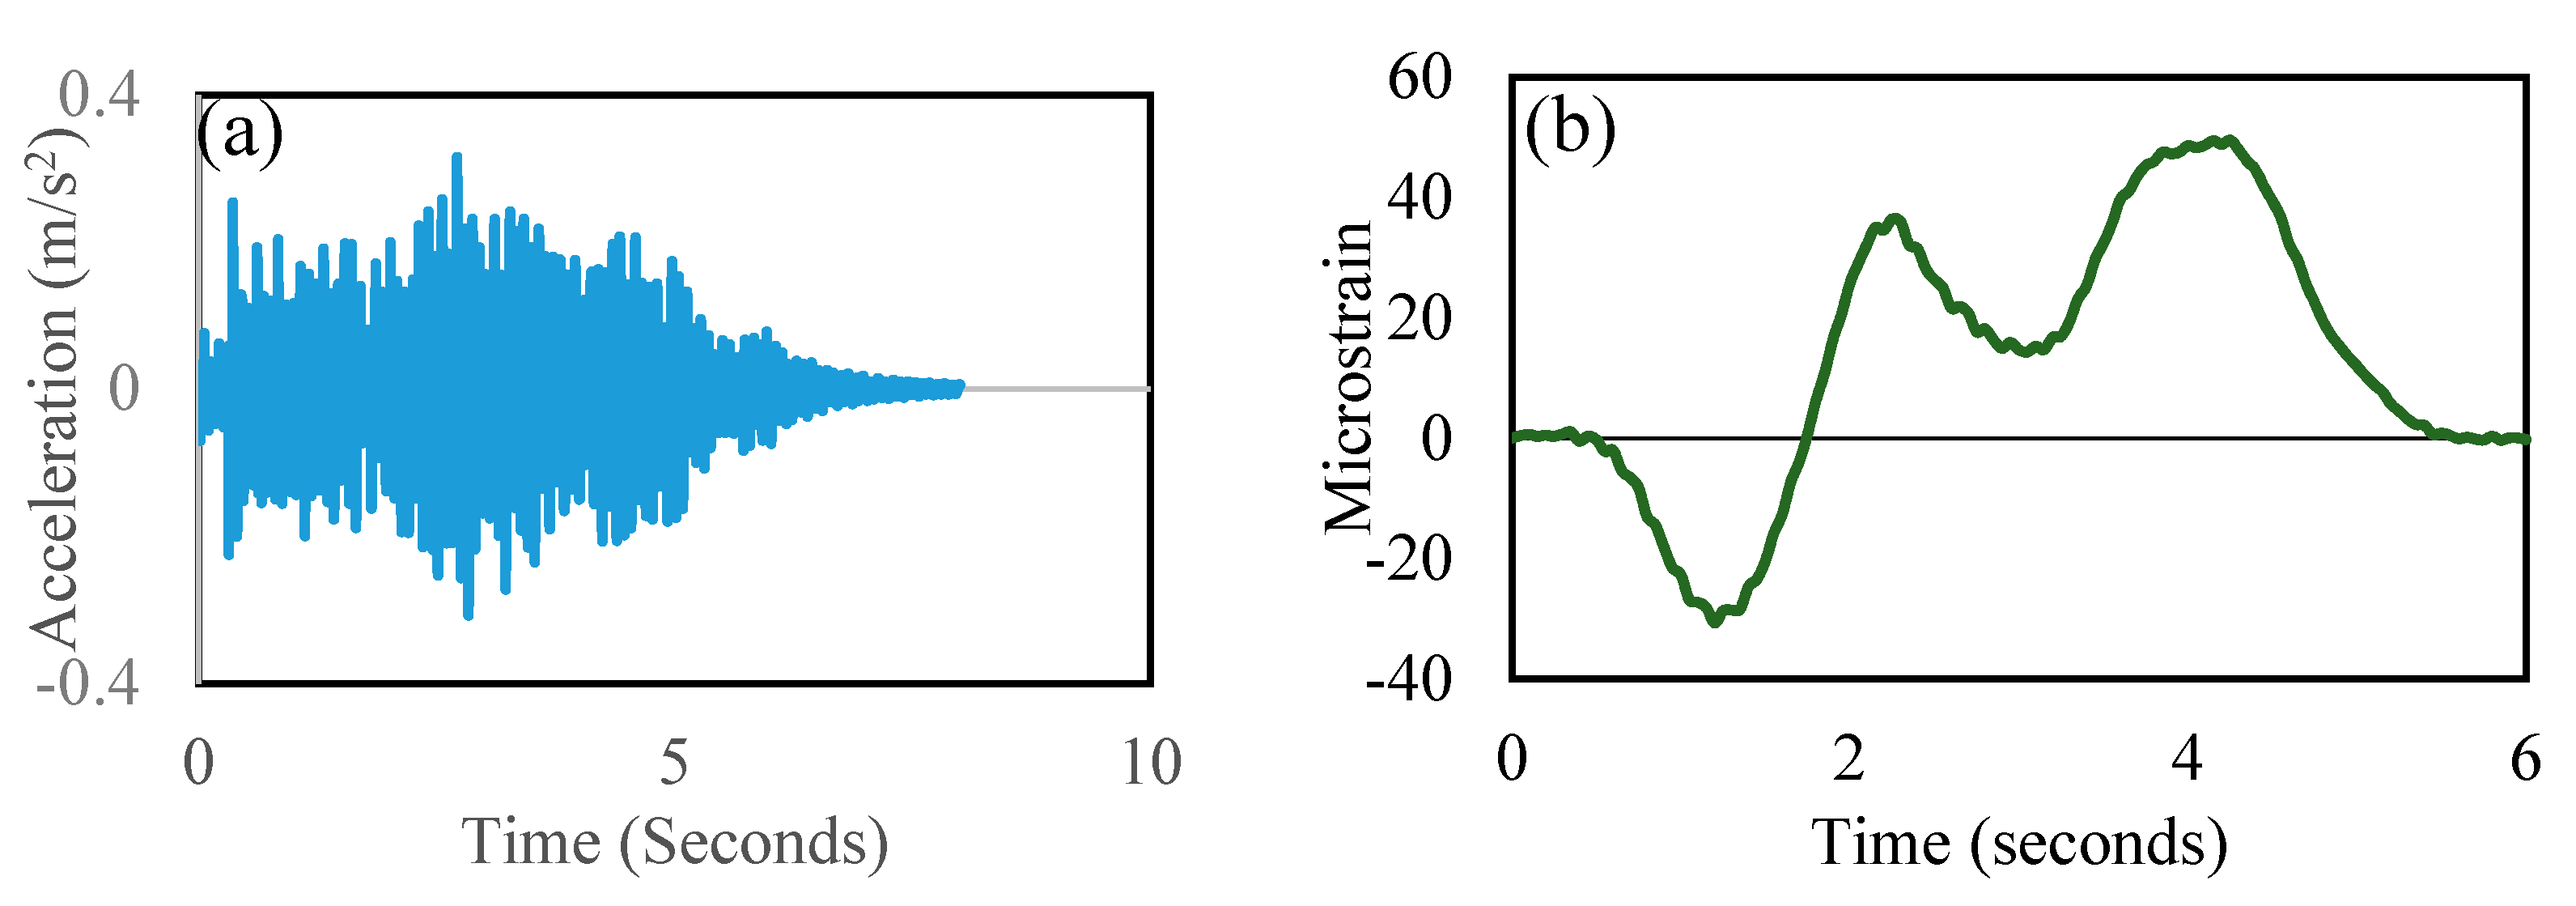
The analyses of the following damage cases demonstrate the validity of the proposed damage detection framework. In this research, the damage is simulated by reducing the modulus of elasticity along the entire length of individual truss elements, which is representative of a decrease of stiffness in structural elements. Such damage in a real-life bridge occurs gradually and, therefore, is suitable for assessment at an early stage. Operational acceleration and strain responses have been obtained in response to the passage of two trains carrying different axle loads at two different speeds as mentioned previously. Typical acceleration and strain response plots obtained from the linear time-history analysis are shown in
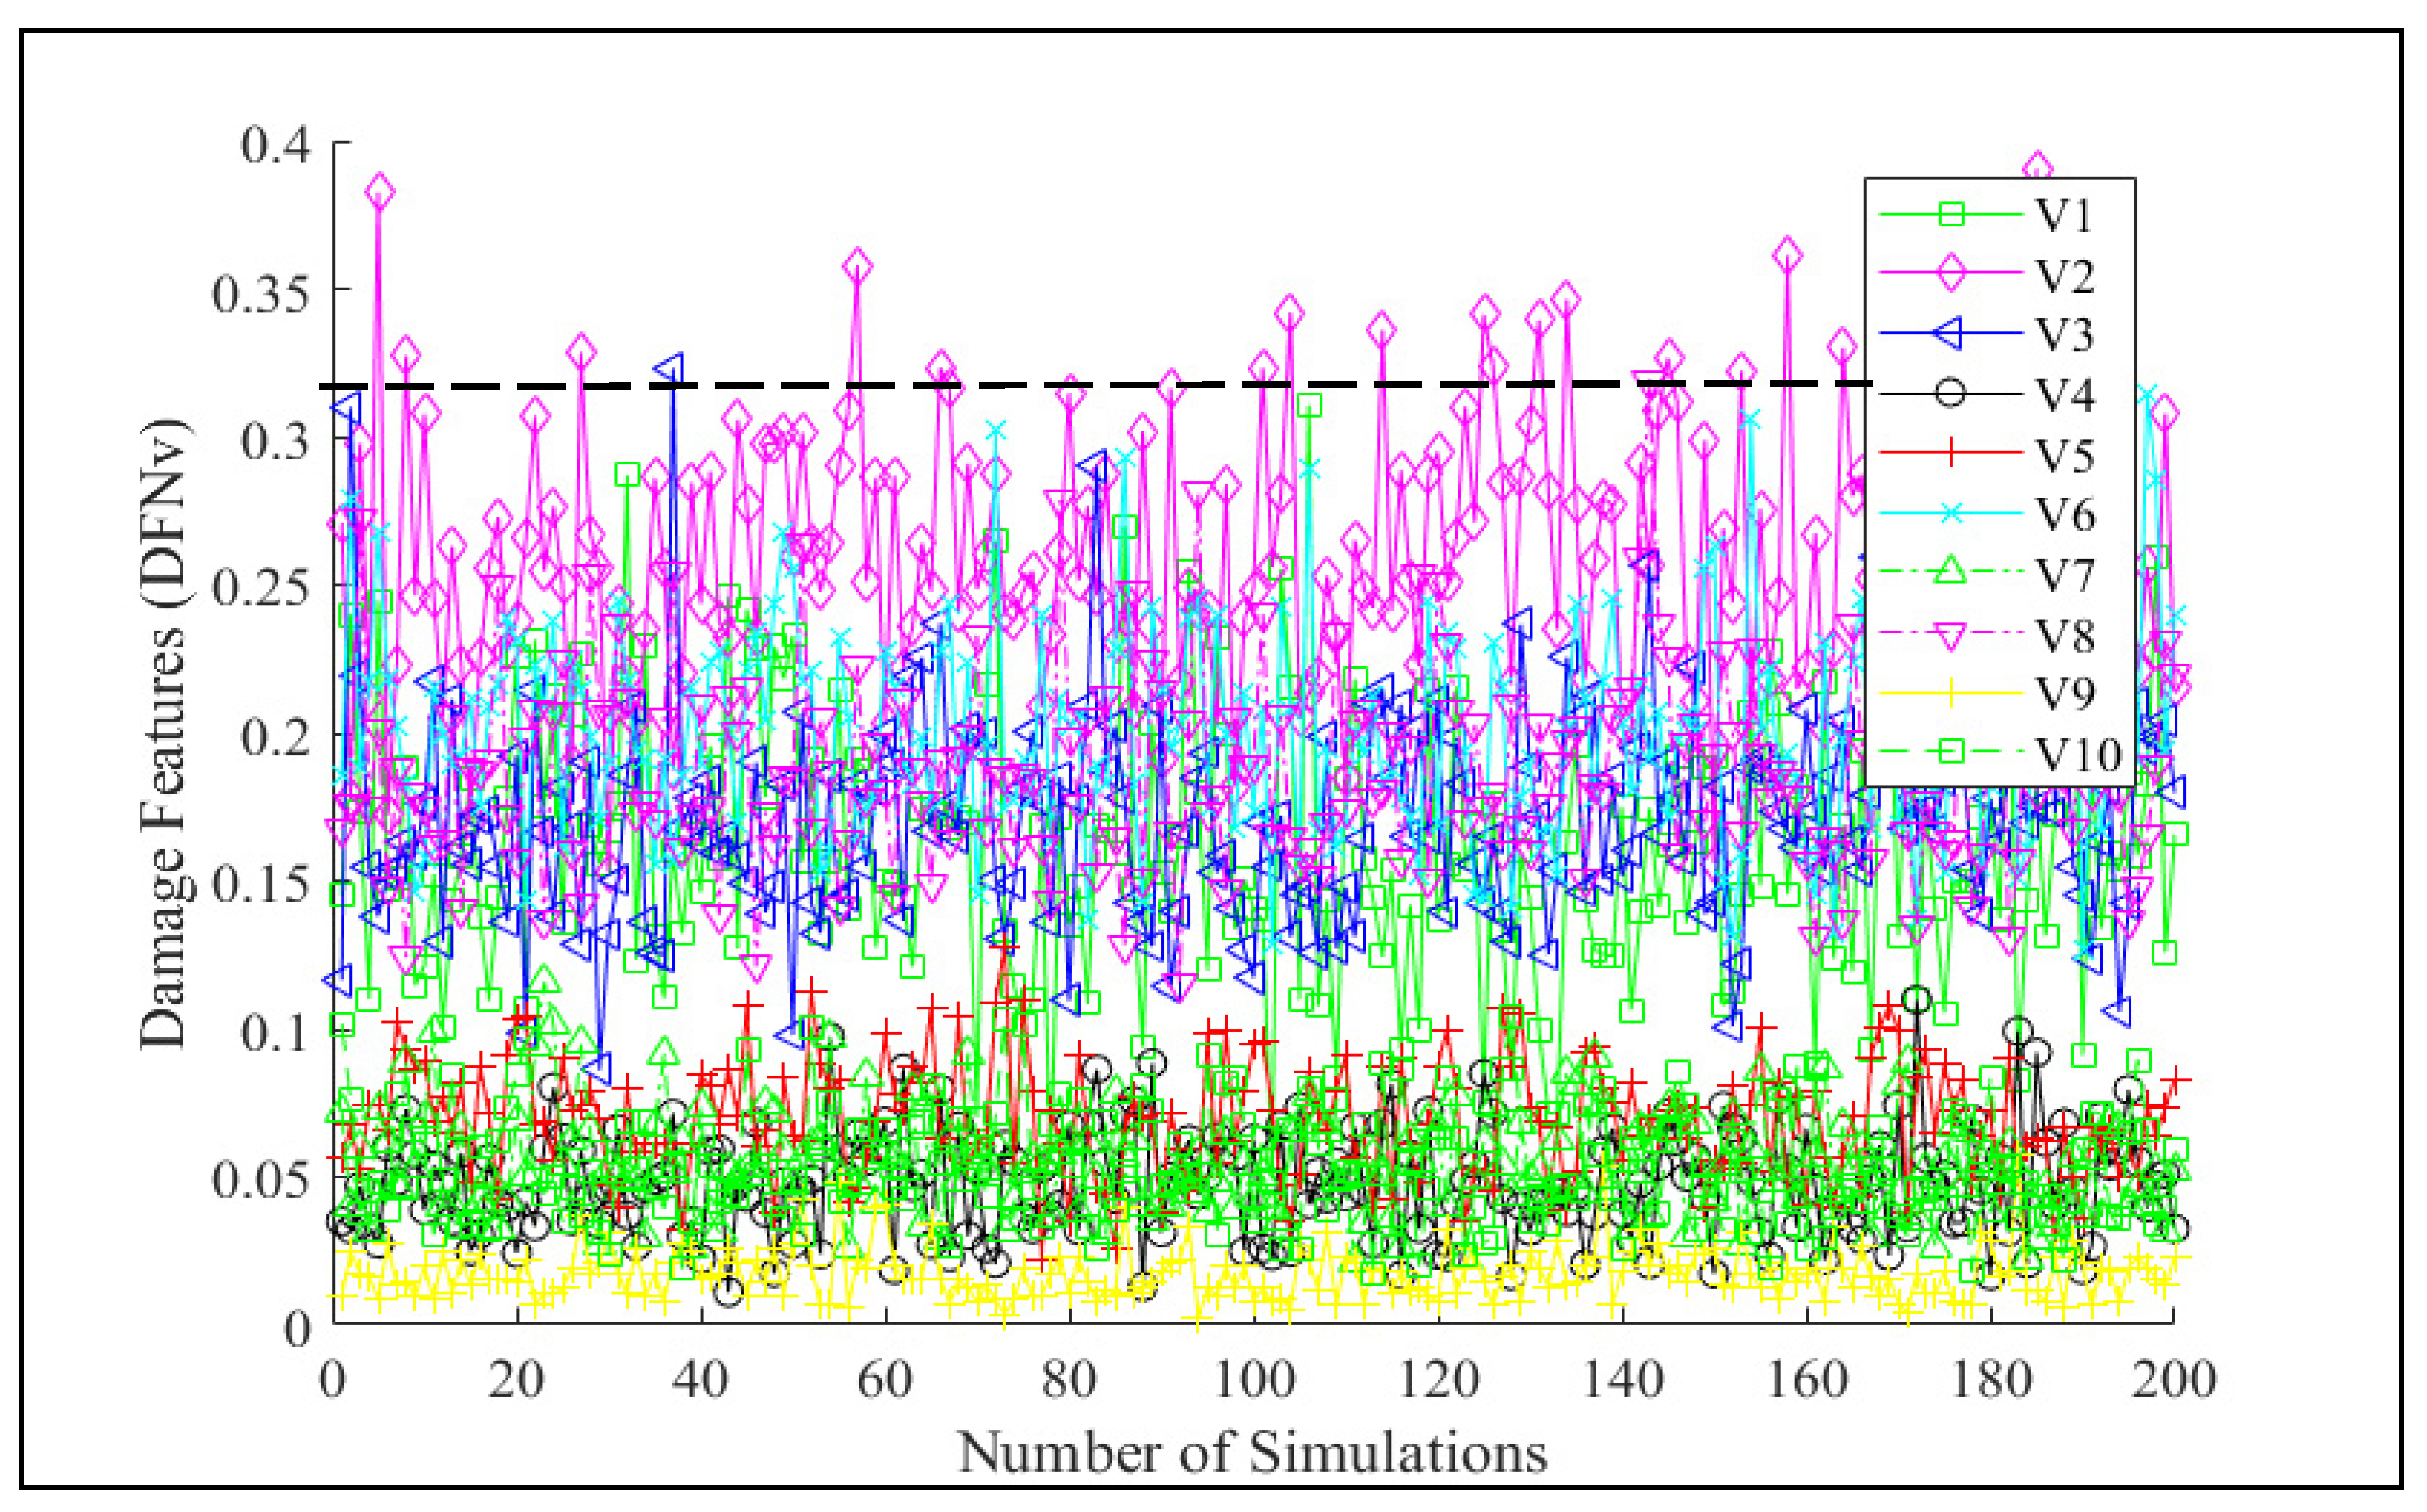
Figure 5. Based on the procedures described in the theoretical derivation section, initially, threshold damage features for acceleration-based and strain-based methods are calculated from the analyses of the baseline bridge responses. In this research, the values of 0.32, 1.5, and 3.3 have been obtained as thresholds for
DFNV,
DFNL, and
DFEs, respectively, with 99% confidence intervals. For example, the
DFNV from the vertical acceleration analysis of the baseline bridge is presented in
Figure 6. The dotted black line corresponds to a value of 0.32, which is estimated as the
DFNV_Thr with a 99% confidence interval.
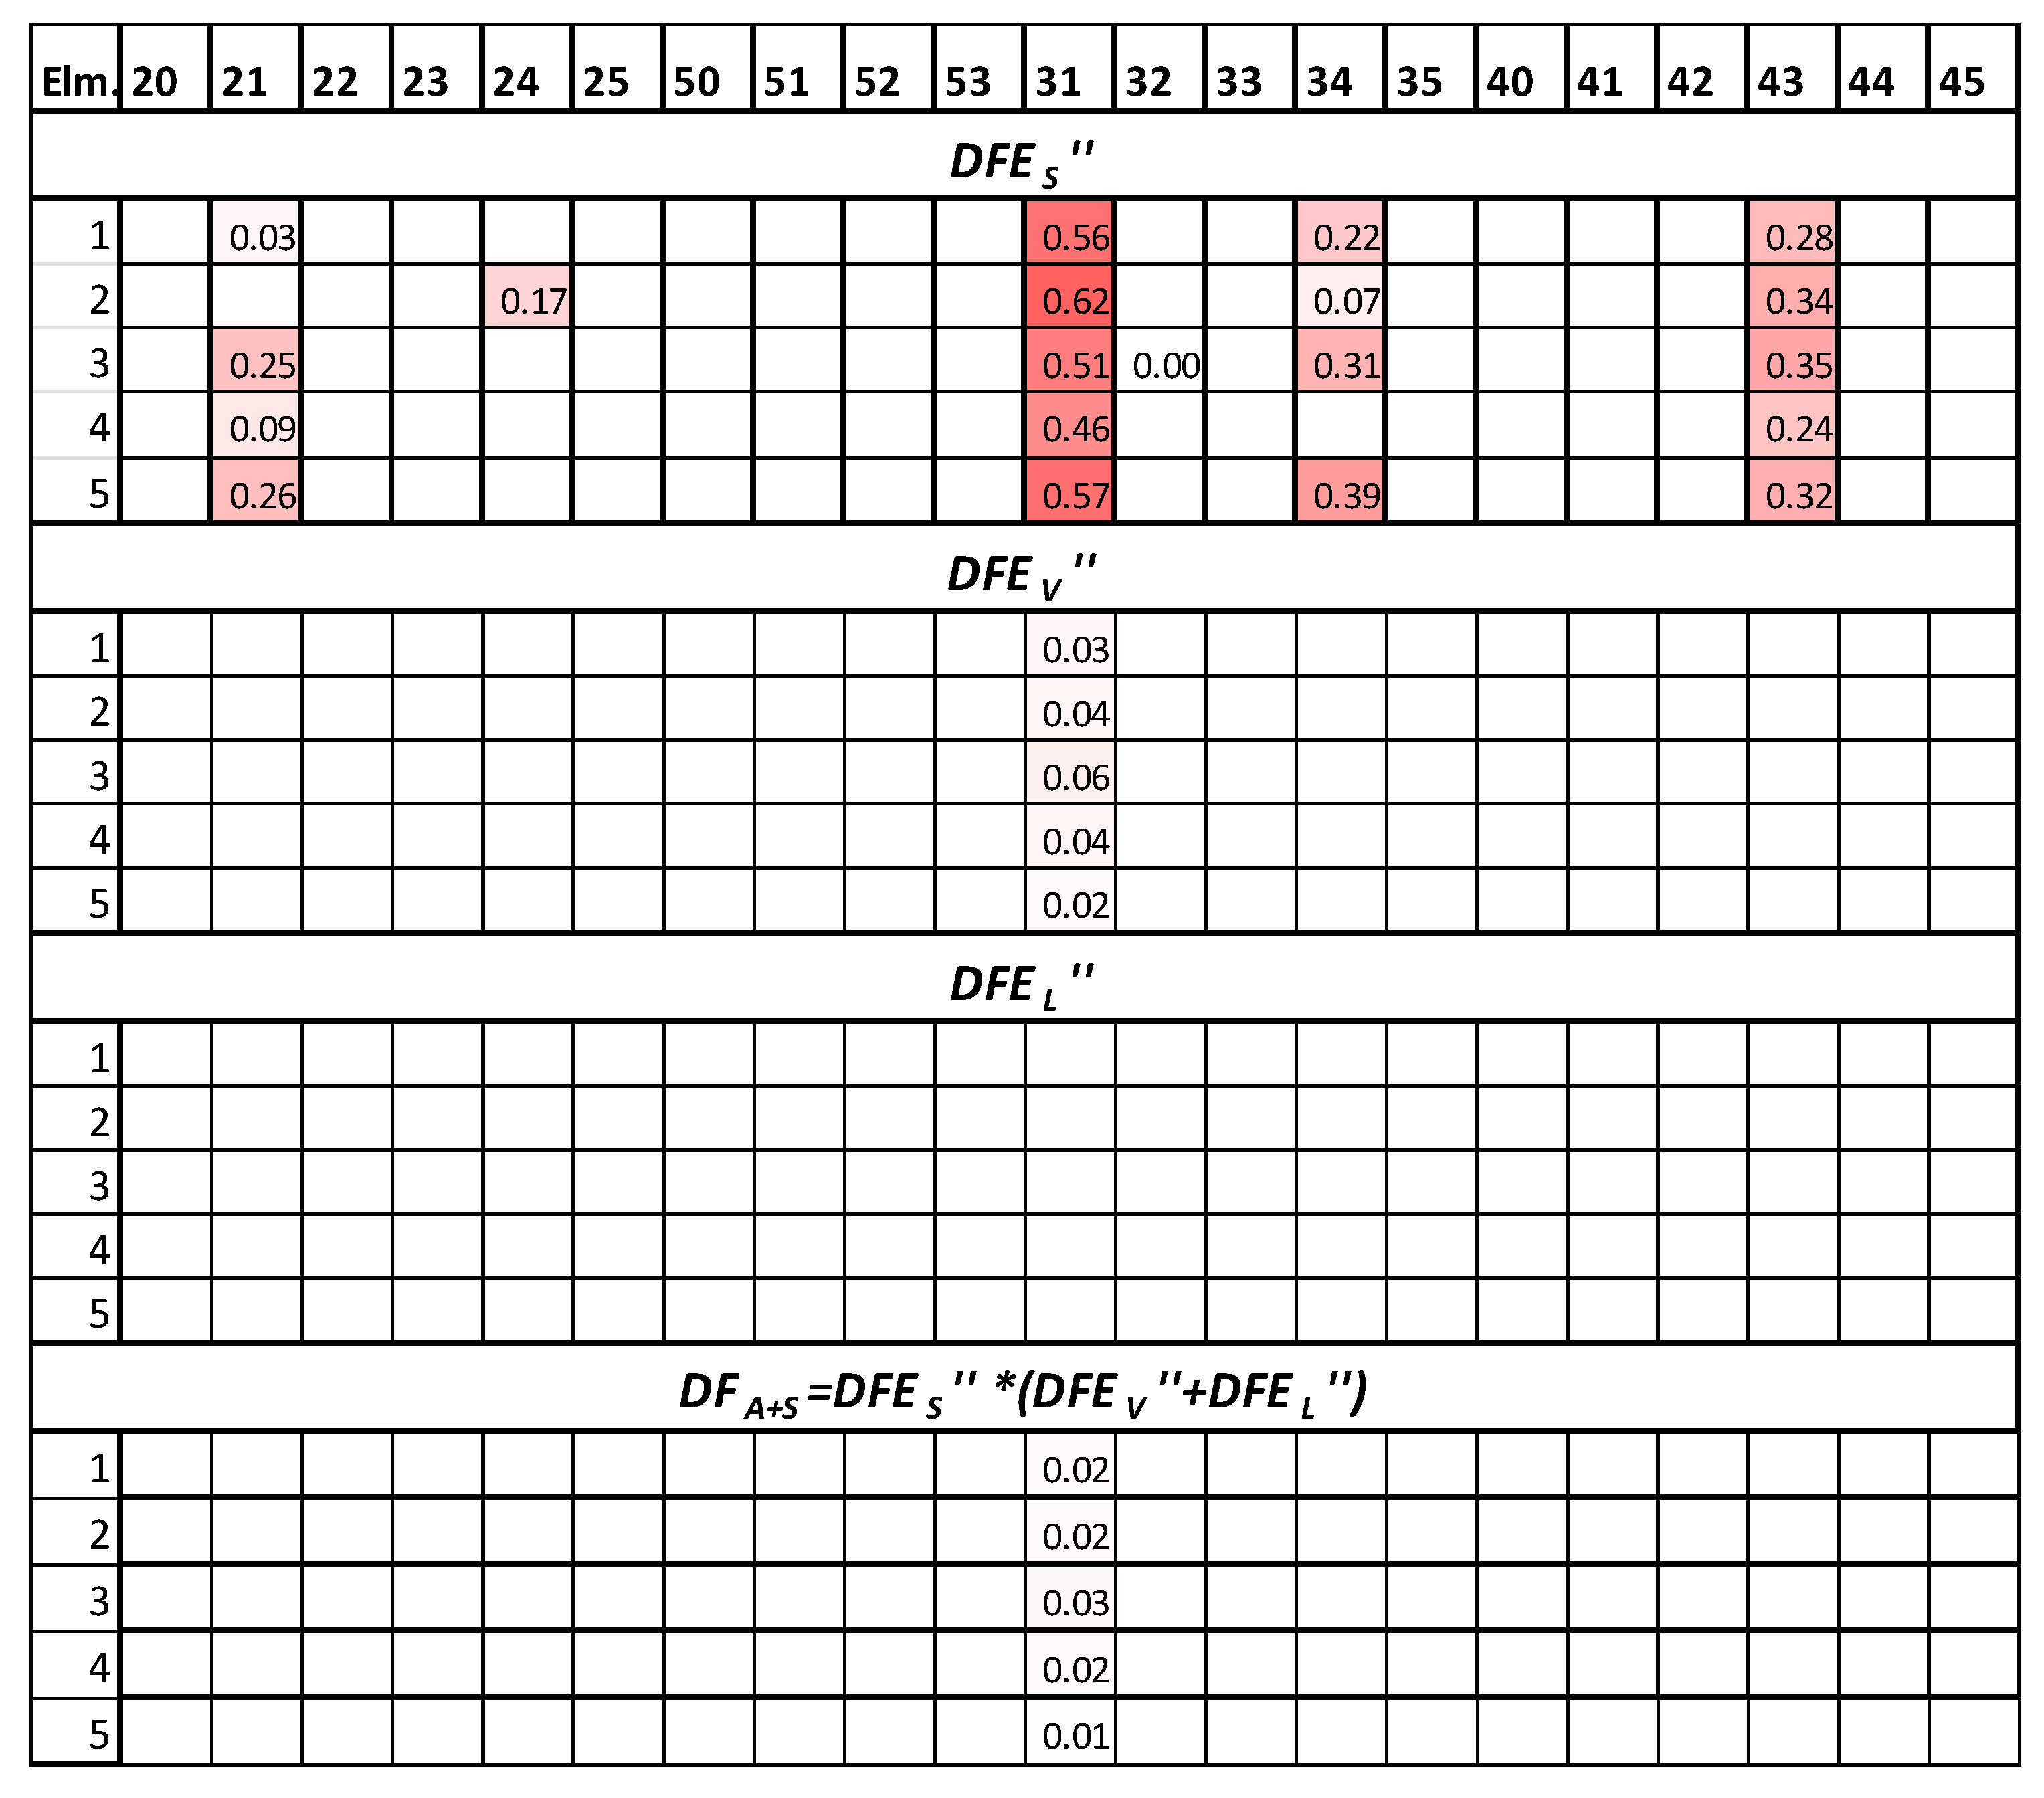
For damage detection, each damage case is simulated five times with 5% artificial random noise added to the original response. The magnitudes of the damage features are color-coded based on severity.
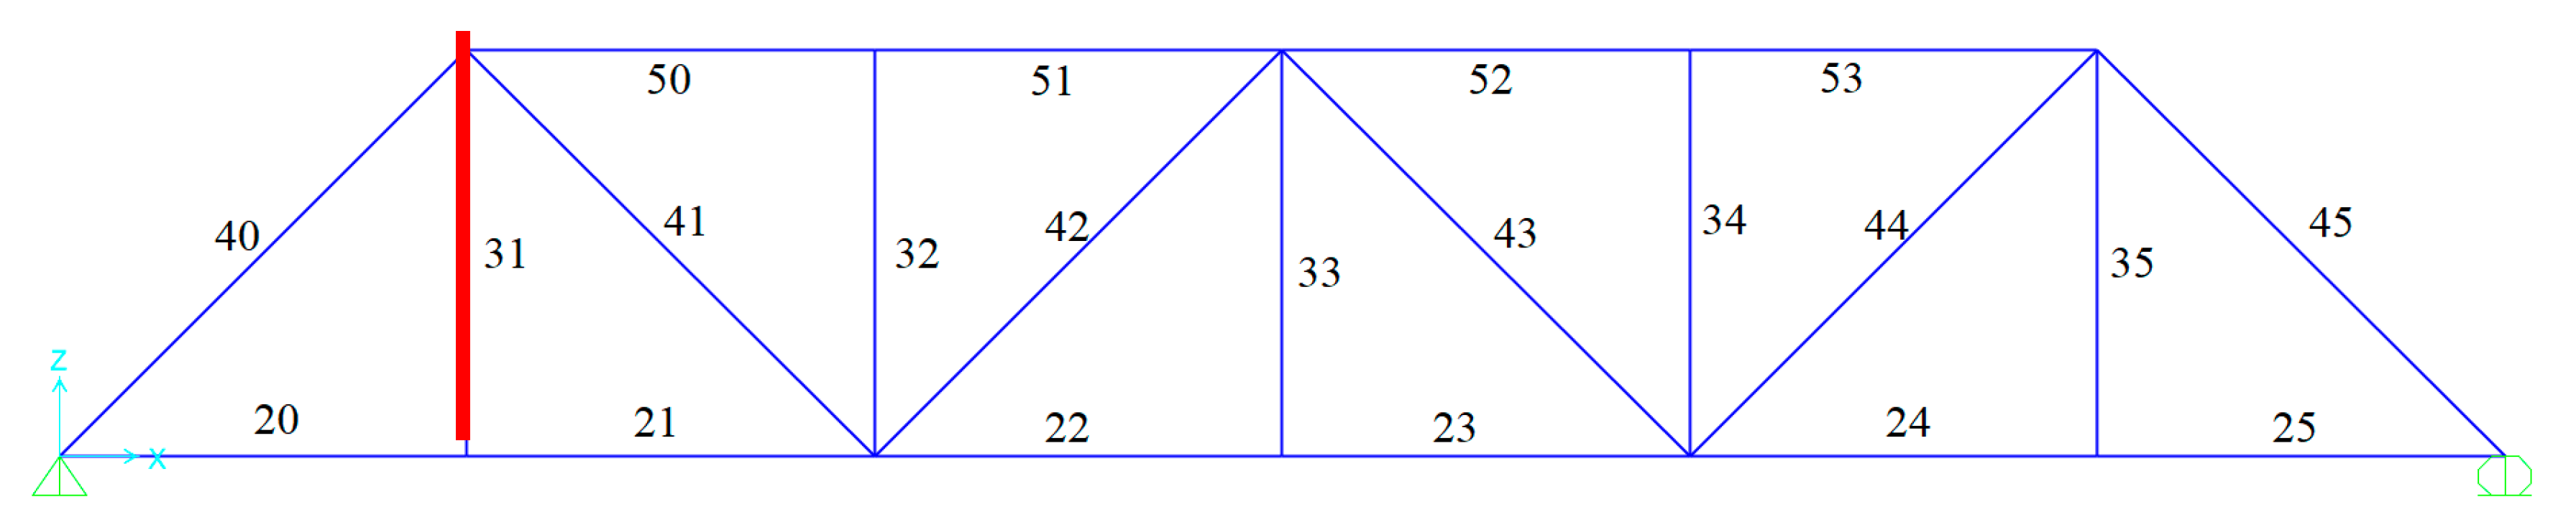
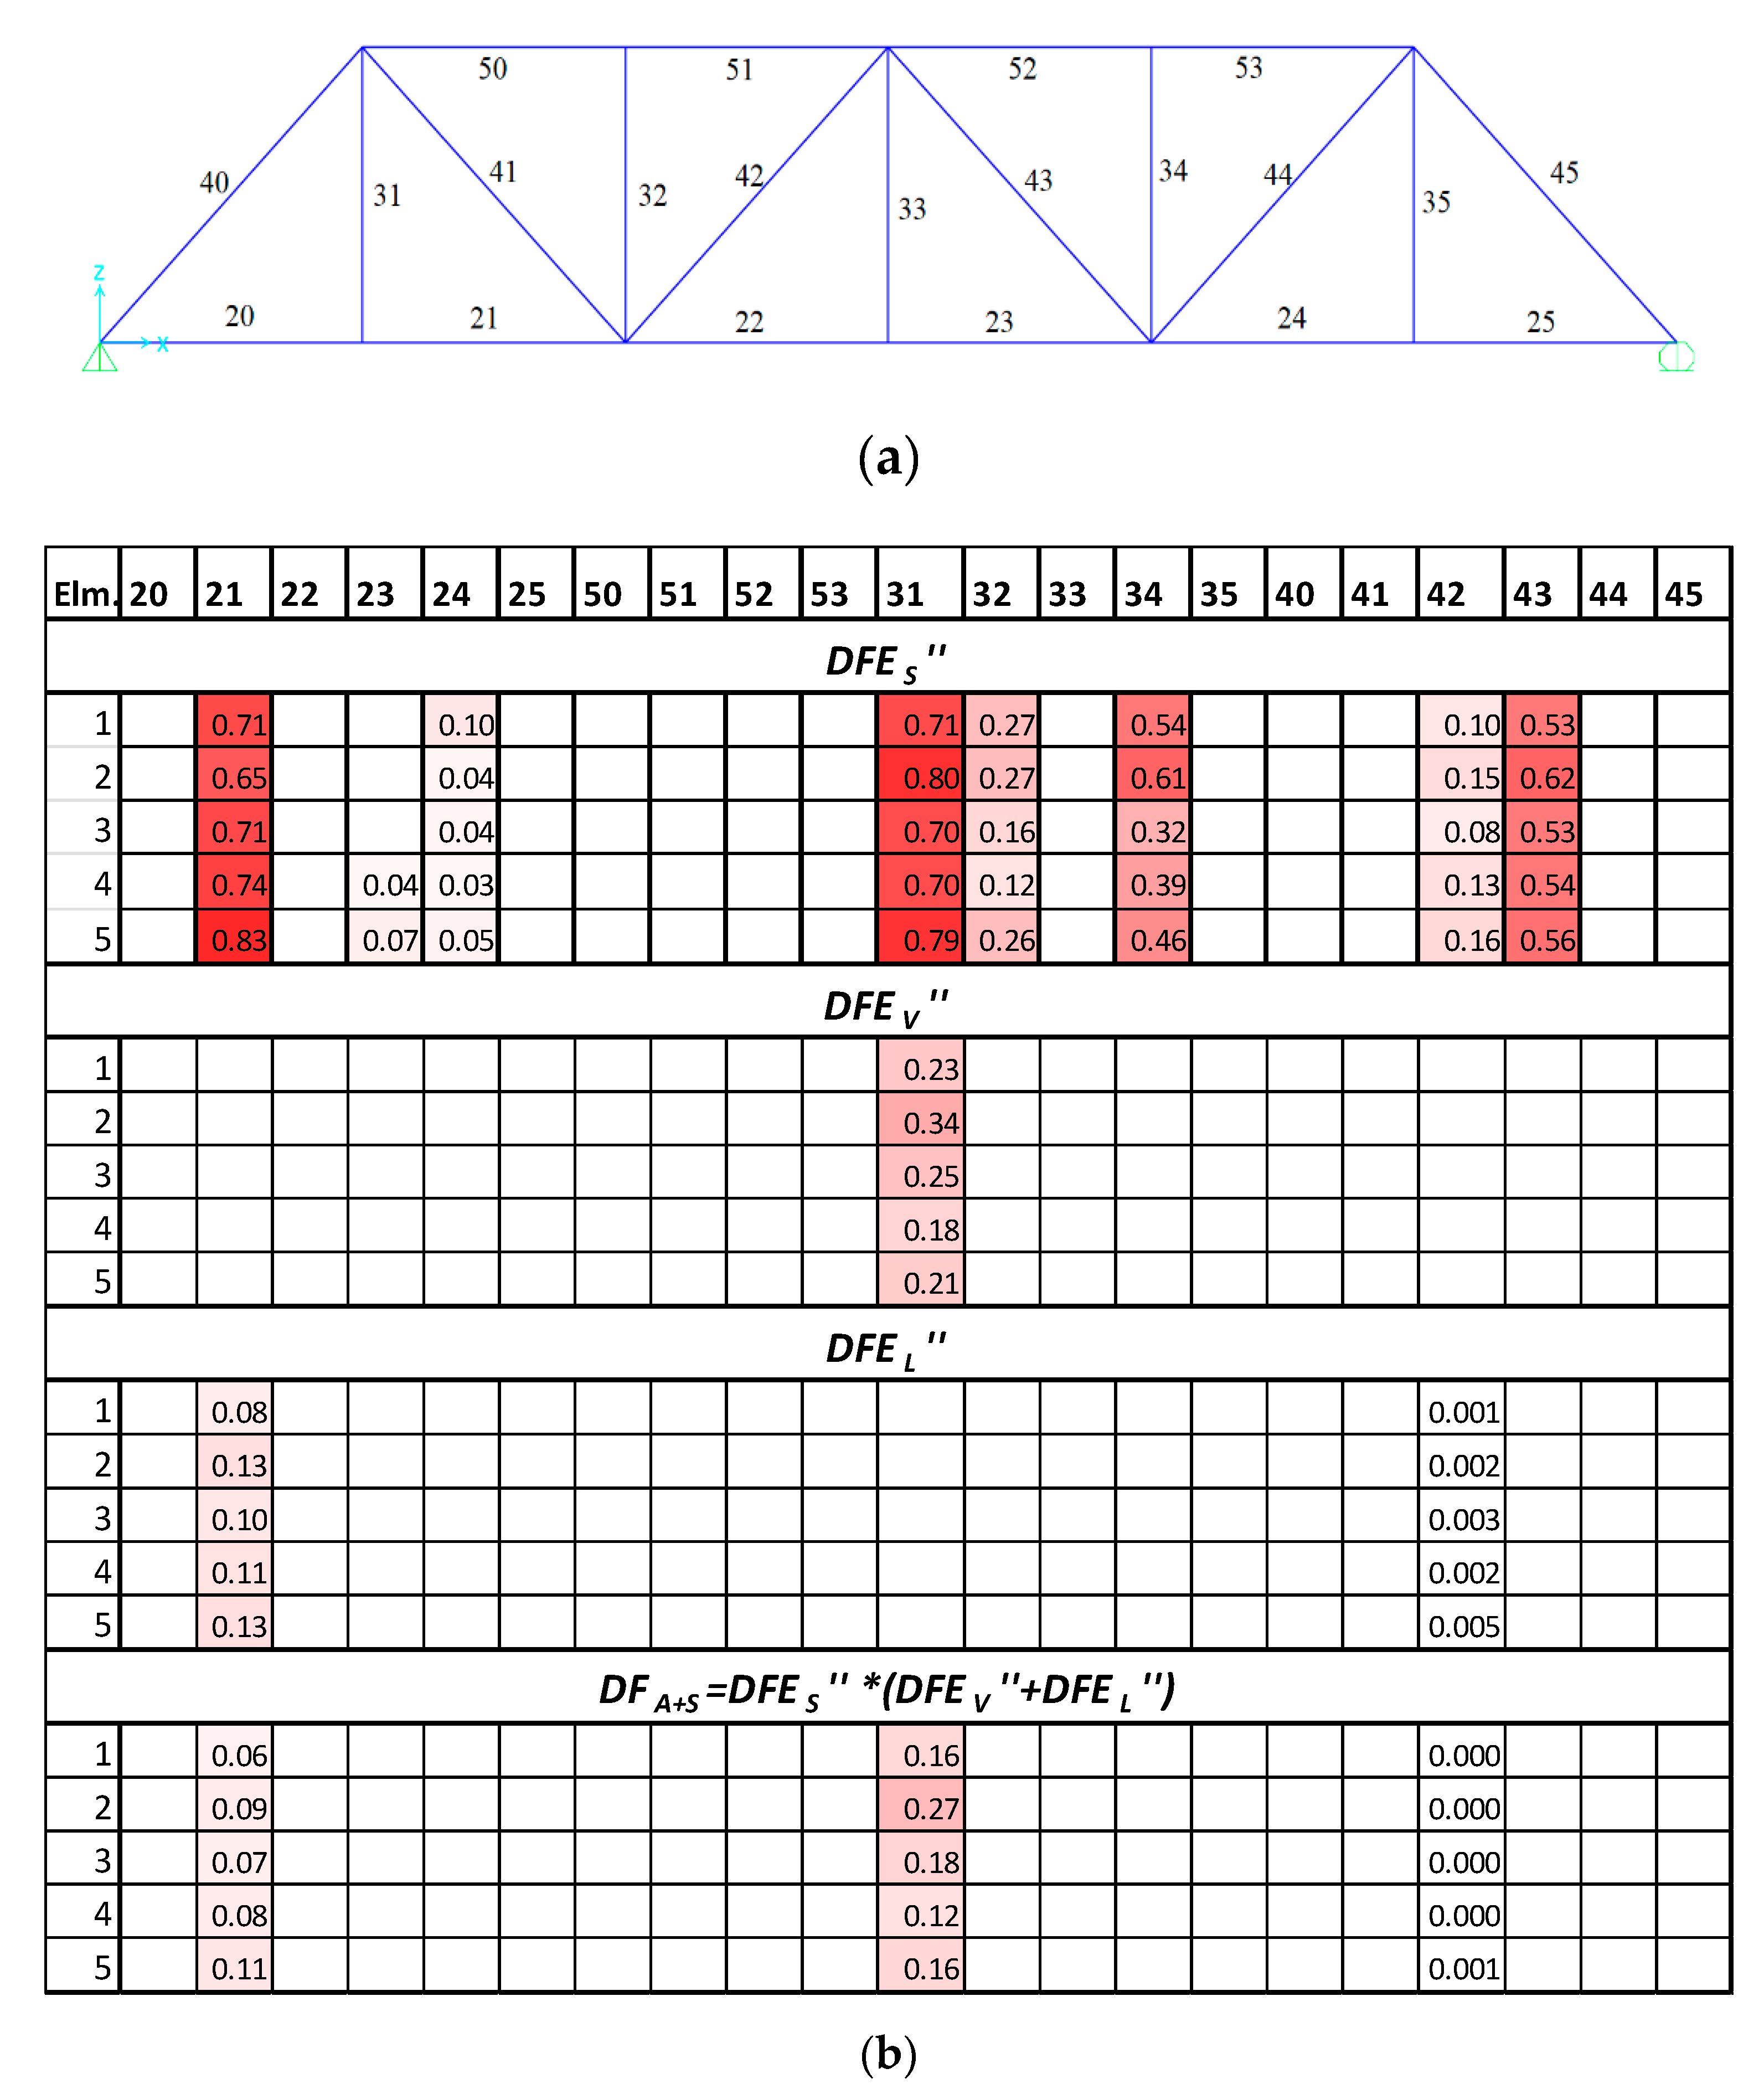
4.1. Damage Case-1: Stiffness Reduction in Element 31 by (a) 10%, and (b) 20%
In this damage case, element 31, which is a vertical element of the truss bridge is simulated as damaged by reducing its stiffness by (a) 10% and (b) 20%. The actual location of damage in the truss bridge is shown in
Figure 7. The results of the proposed damage detection framework are shown in
Figure 8 and
Figure 9.
It can be seen from
Figure 8 that at 10% damage severity, strain analysis identifies and localizes damage at element 31. However, it also identifies elements 21, 32, 34, and 43 as damaged. While the acceleration data analysis through vertical cluster shows elements 31, 40, and 41 as damaged with almost similar levels of severity. The longitudinal cluster expectedly does not identify any damage since the damage is in the vertical element. The newly proposed damage feature detects the location of actual damage and its severity. A similar pattern is observed at a 20% damage level with higher values in response to increased damage severity as shown in
Figure 9.
It is noticeable in the results that, the combined damage features for case-1(a) in which element 10 is damaged due to 10% stiffness loss, are very small (in the range between 0.01 to 0.03). This is due to the vertical acceleration-based damage features being too low. This means that the acceleration-based method can locate damage in that element, but the values are very close to the baseline (i.e., not much difference in acceleration response between baseline bridge and when there is 10% damage in element 31). When the same element is damaged by 20%, as shown in
Figure 9, the damage features are increased to the range of 0.18 to 0.26 and are consistent with the other damage cases where element 31 is damaged (such as case-4 and case-6 that are discussed in the later sections).
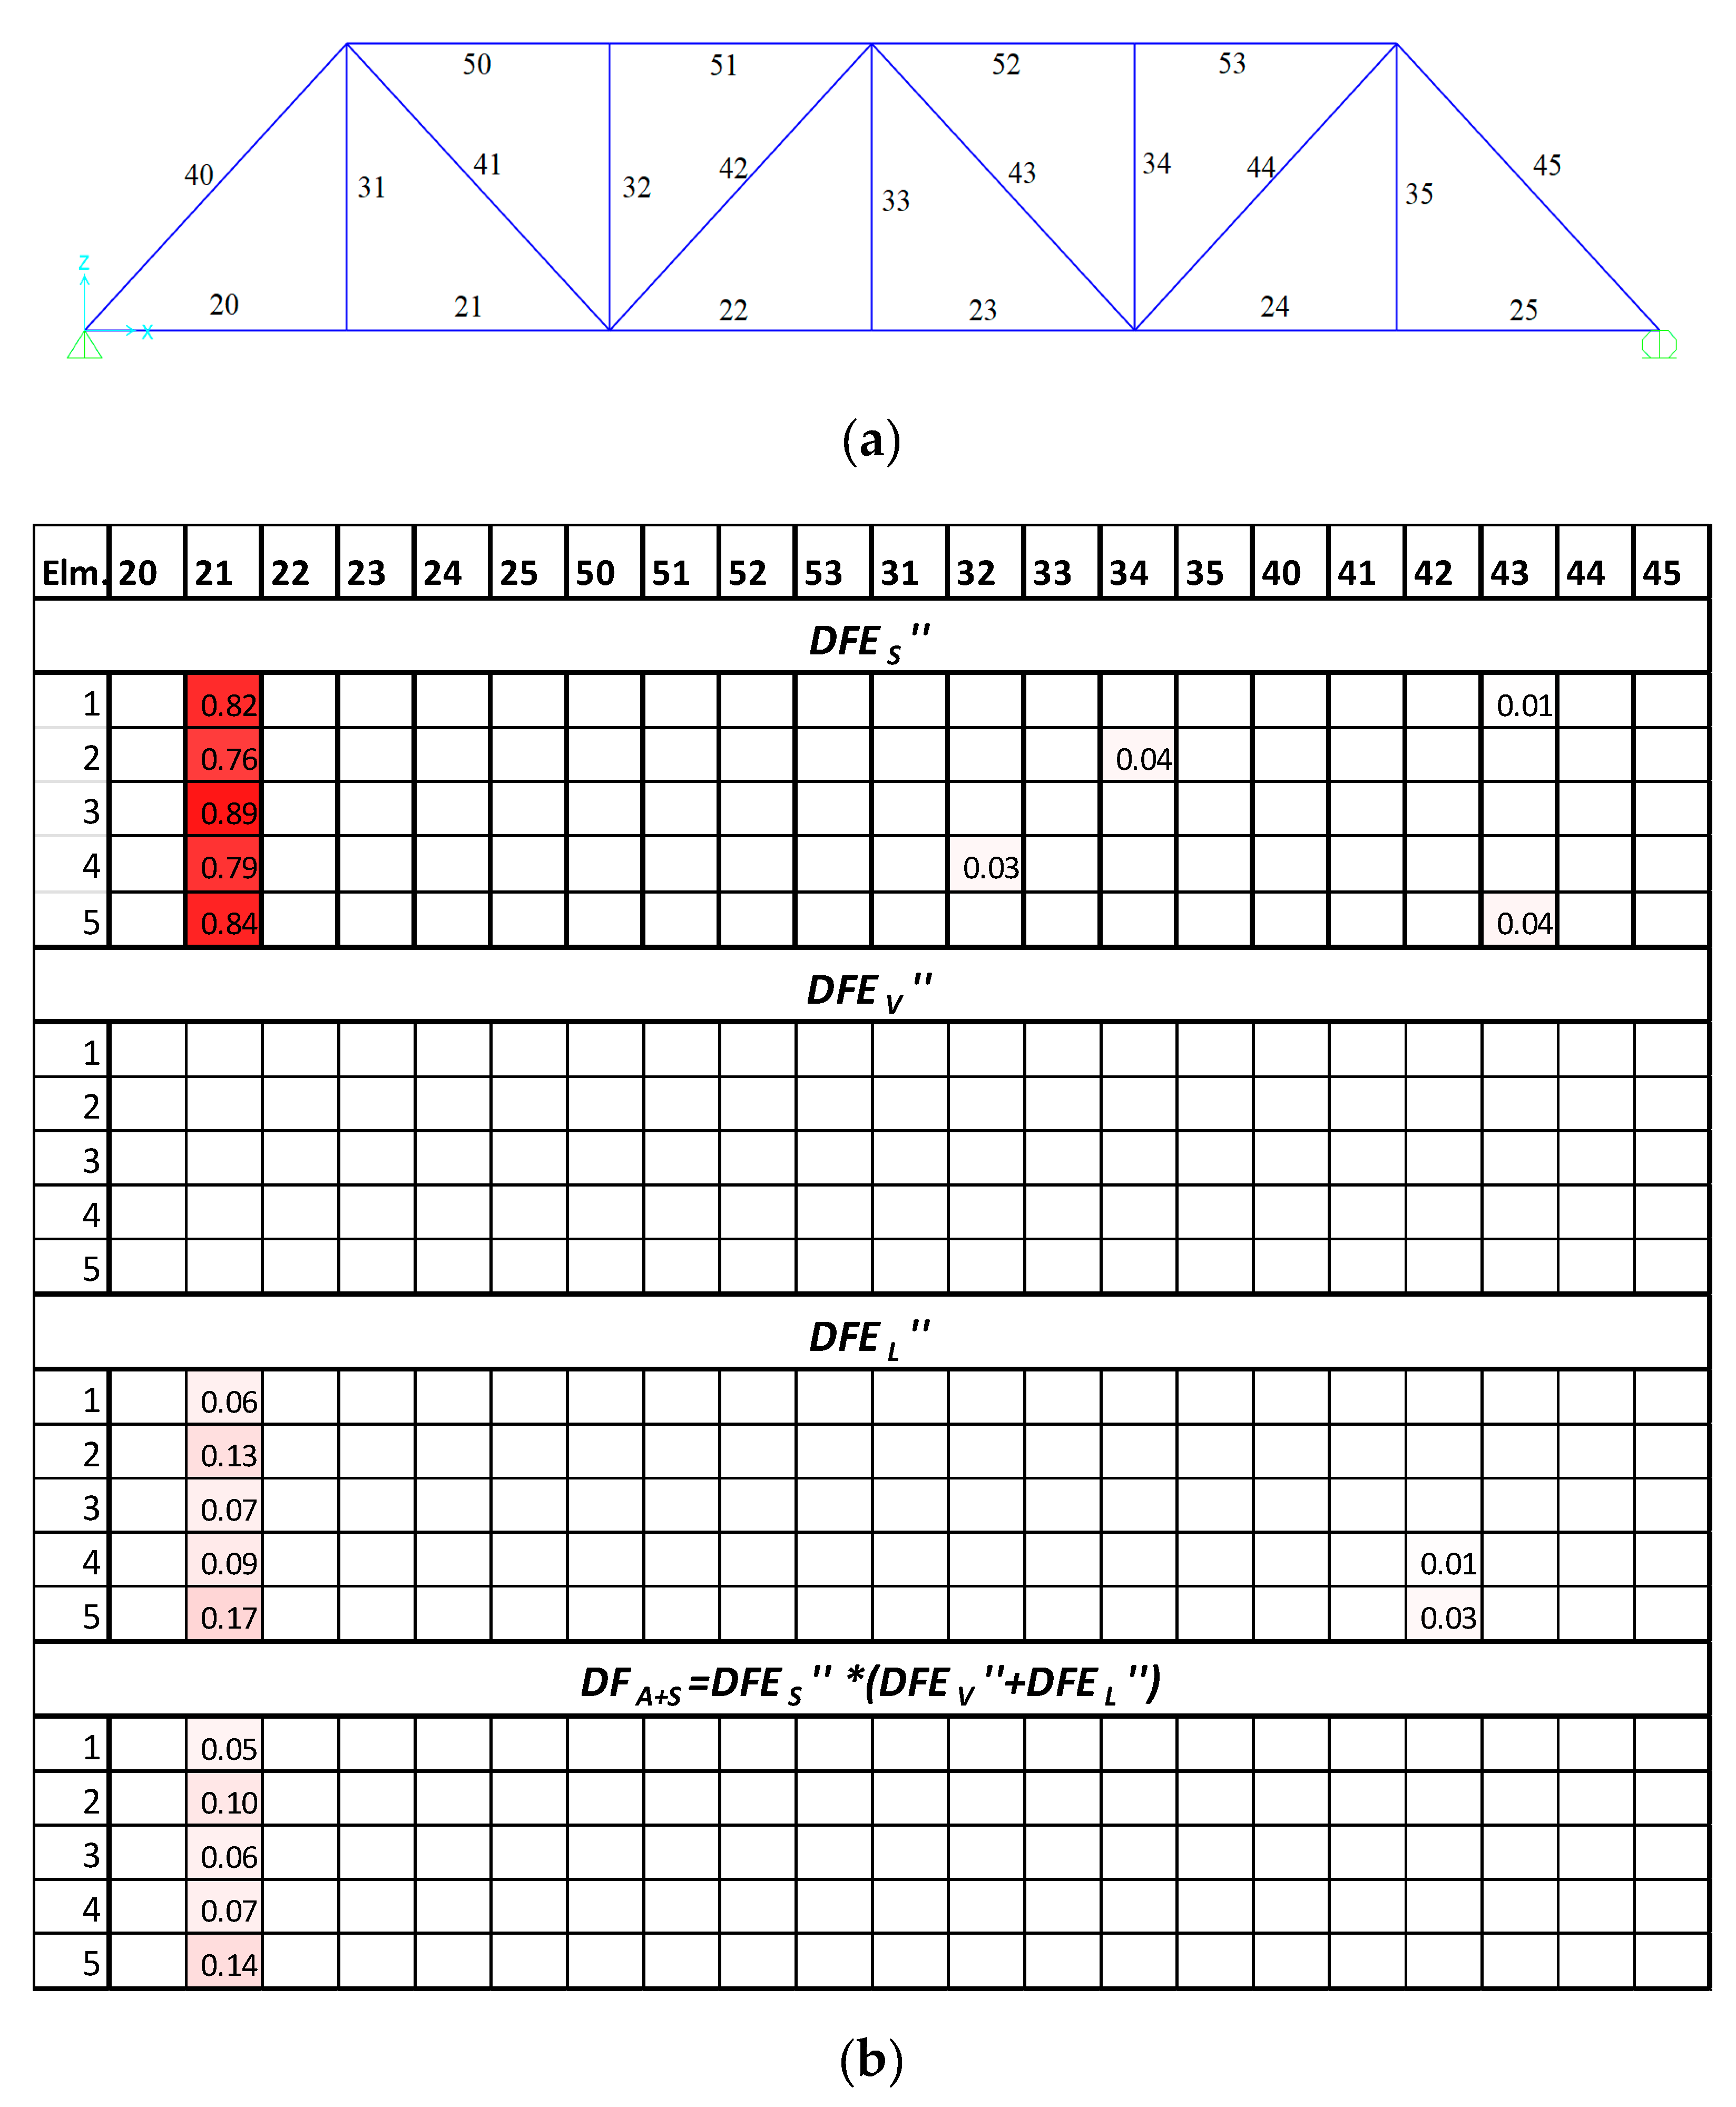
4.2. Damage Case-2: Stiffness Loss in Longitudinal Element 21 by 20%
In this damage case, truss bottom chord element 21 is simulated as damaged due to the reduction of stiffness by 20%. The location of the actual damage is shown in
Figure 10a. The results from the proposed damage detection framework are presented in
Figure 10b.
In this damage case, it is seen that in this case, both stain analysis and longitudinal analysis identify the damage element 21. Since damage is in the longitudinal direction, the vertical cluster expectedly does not show any damage. The proposed damage feature, however, is still useful as it removes the false results, which are obtained in some simulations mainly due to the effect of noise.
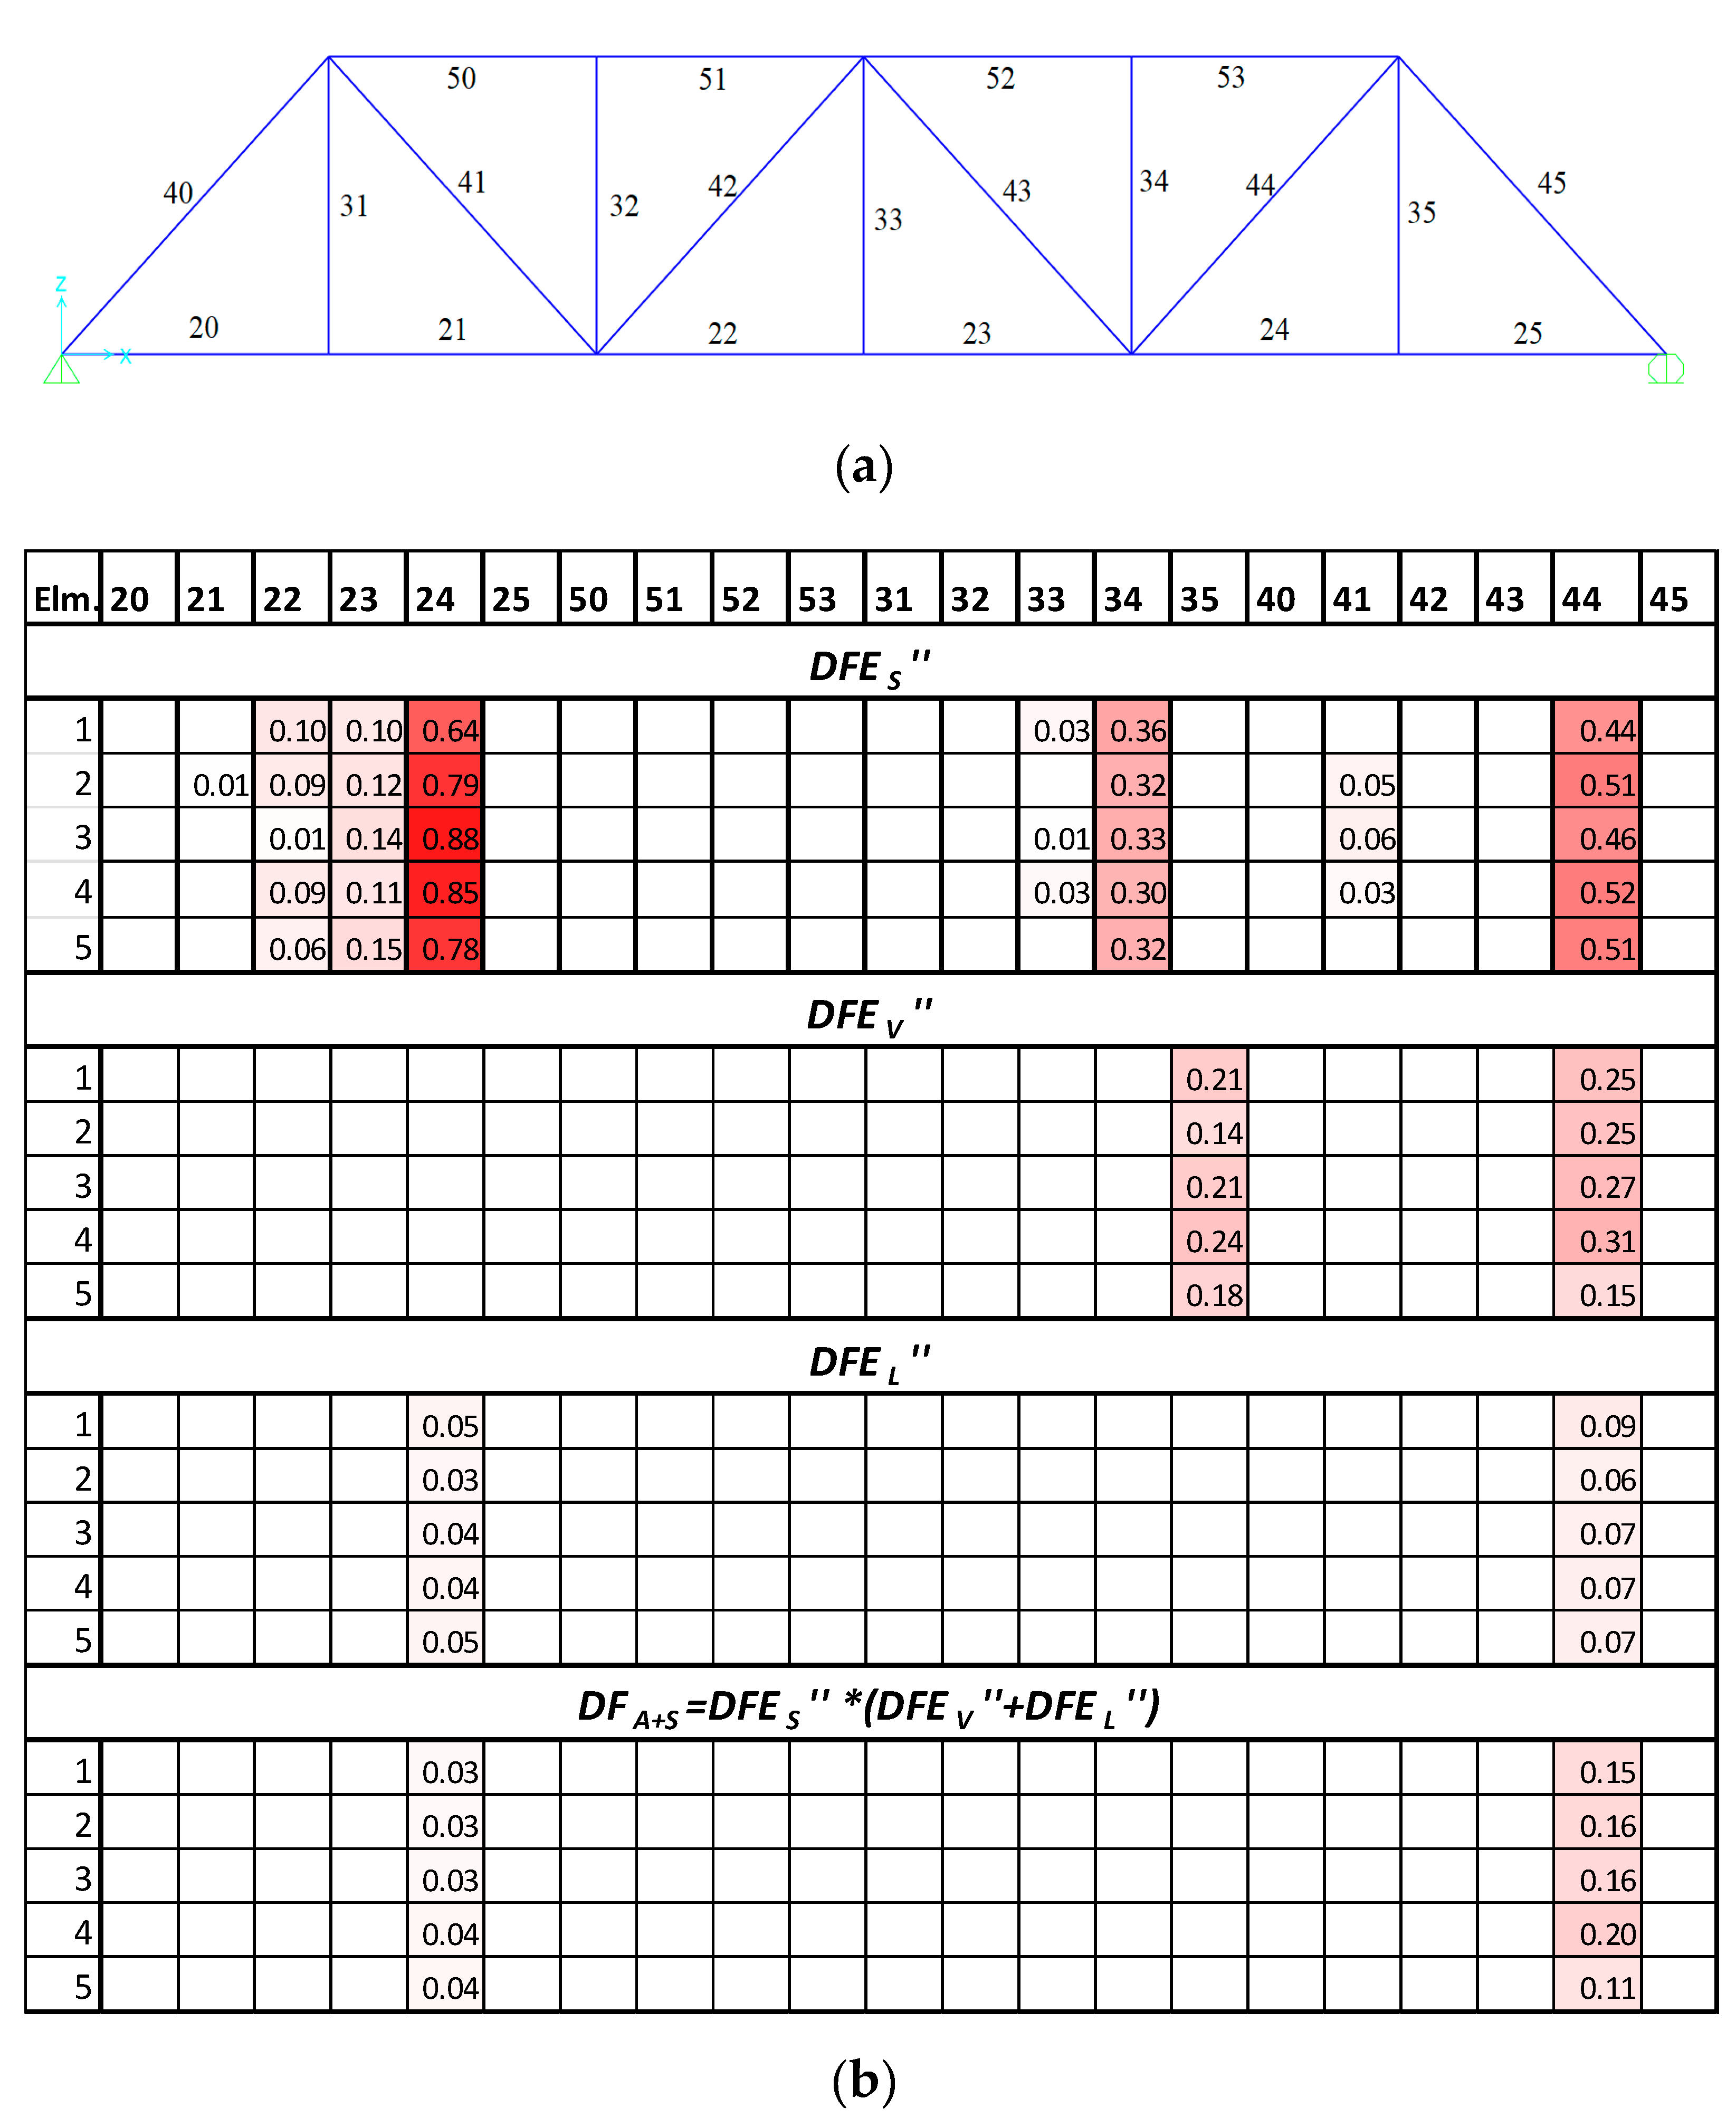
4.3. Damage Case-3: Stiffness Loss in Diagonal Element 44 by 20%
In this damage case, diagonal element 44 is simulated as damaged due to a reduction of stiffness by 20%. The location of the actual damage is shown in
Figure 11a. The results from the proposed damage detection framework are presented in
Figure 11b.
In this damage case, the strain analysis can identify and locate the damaged element 44 while additionally identifying elements 23 and 34 as damaged. Elements 23 and 34 are both connected to element 44. The vertical cluster analysis identifies elements 44 and 35 as damaged, while the longitudinal cluster mainly identifies element 44 as damaged while still showing some damage features for element 43, which is mainly due to the effect of noise. The proposed damage feature, however, removes all the false identification and exactly locates element 44 as damaged.
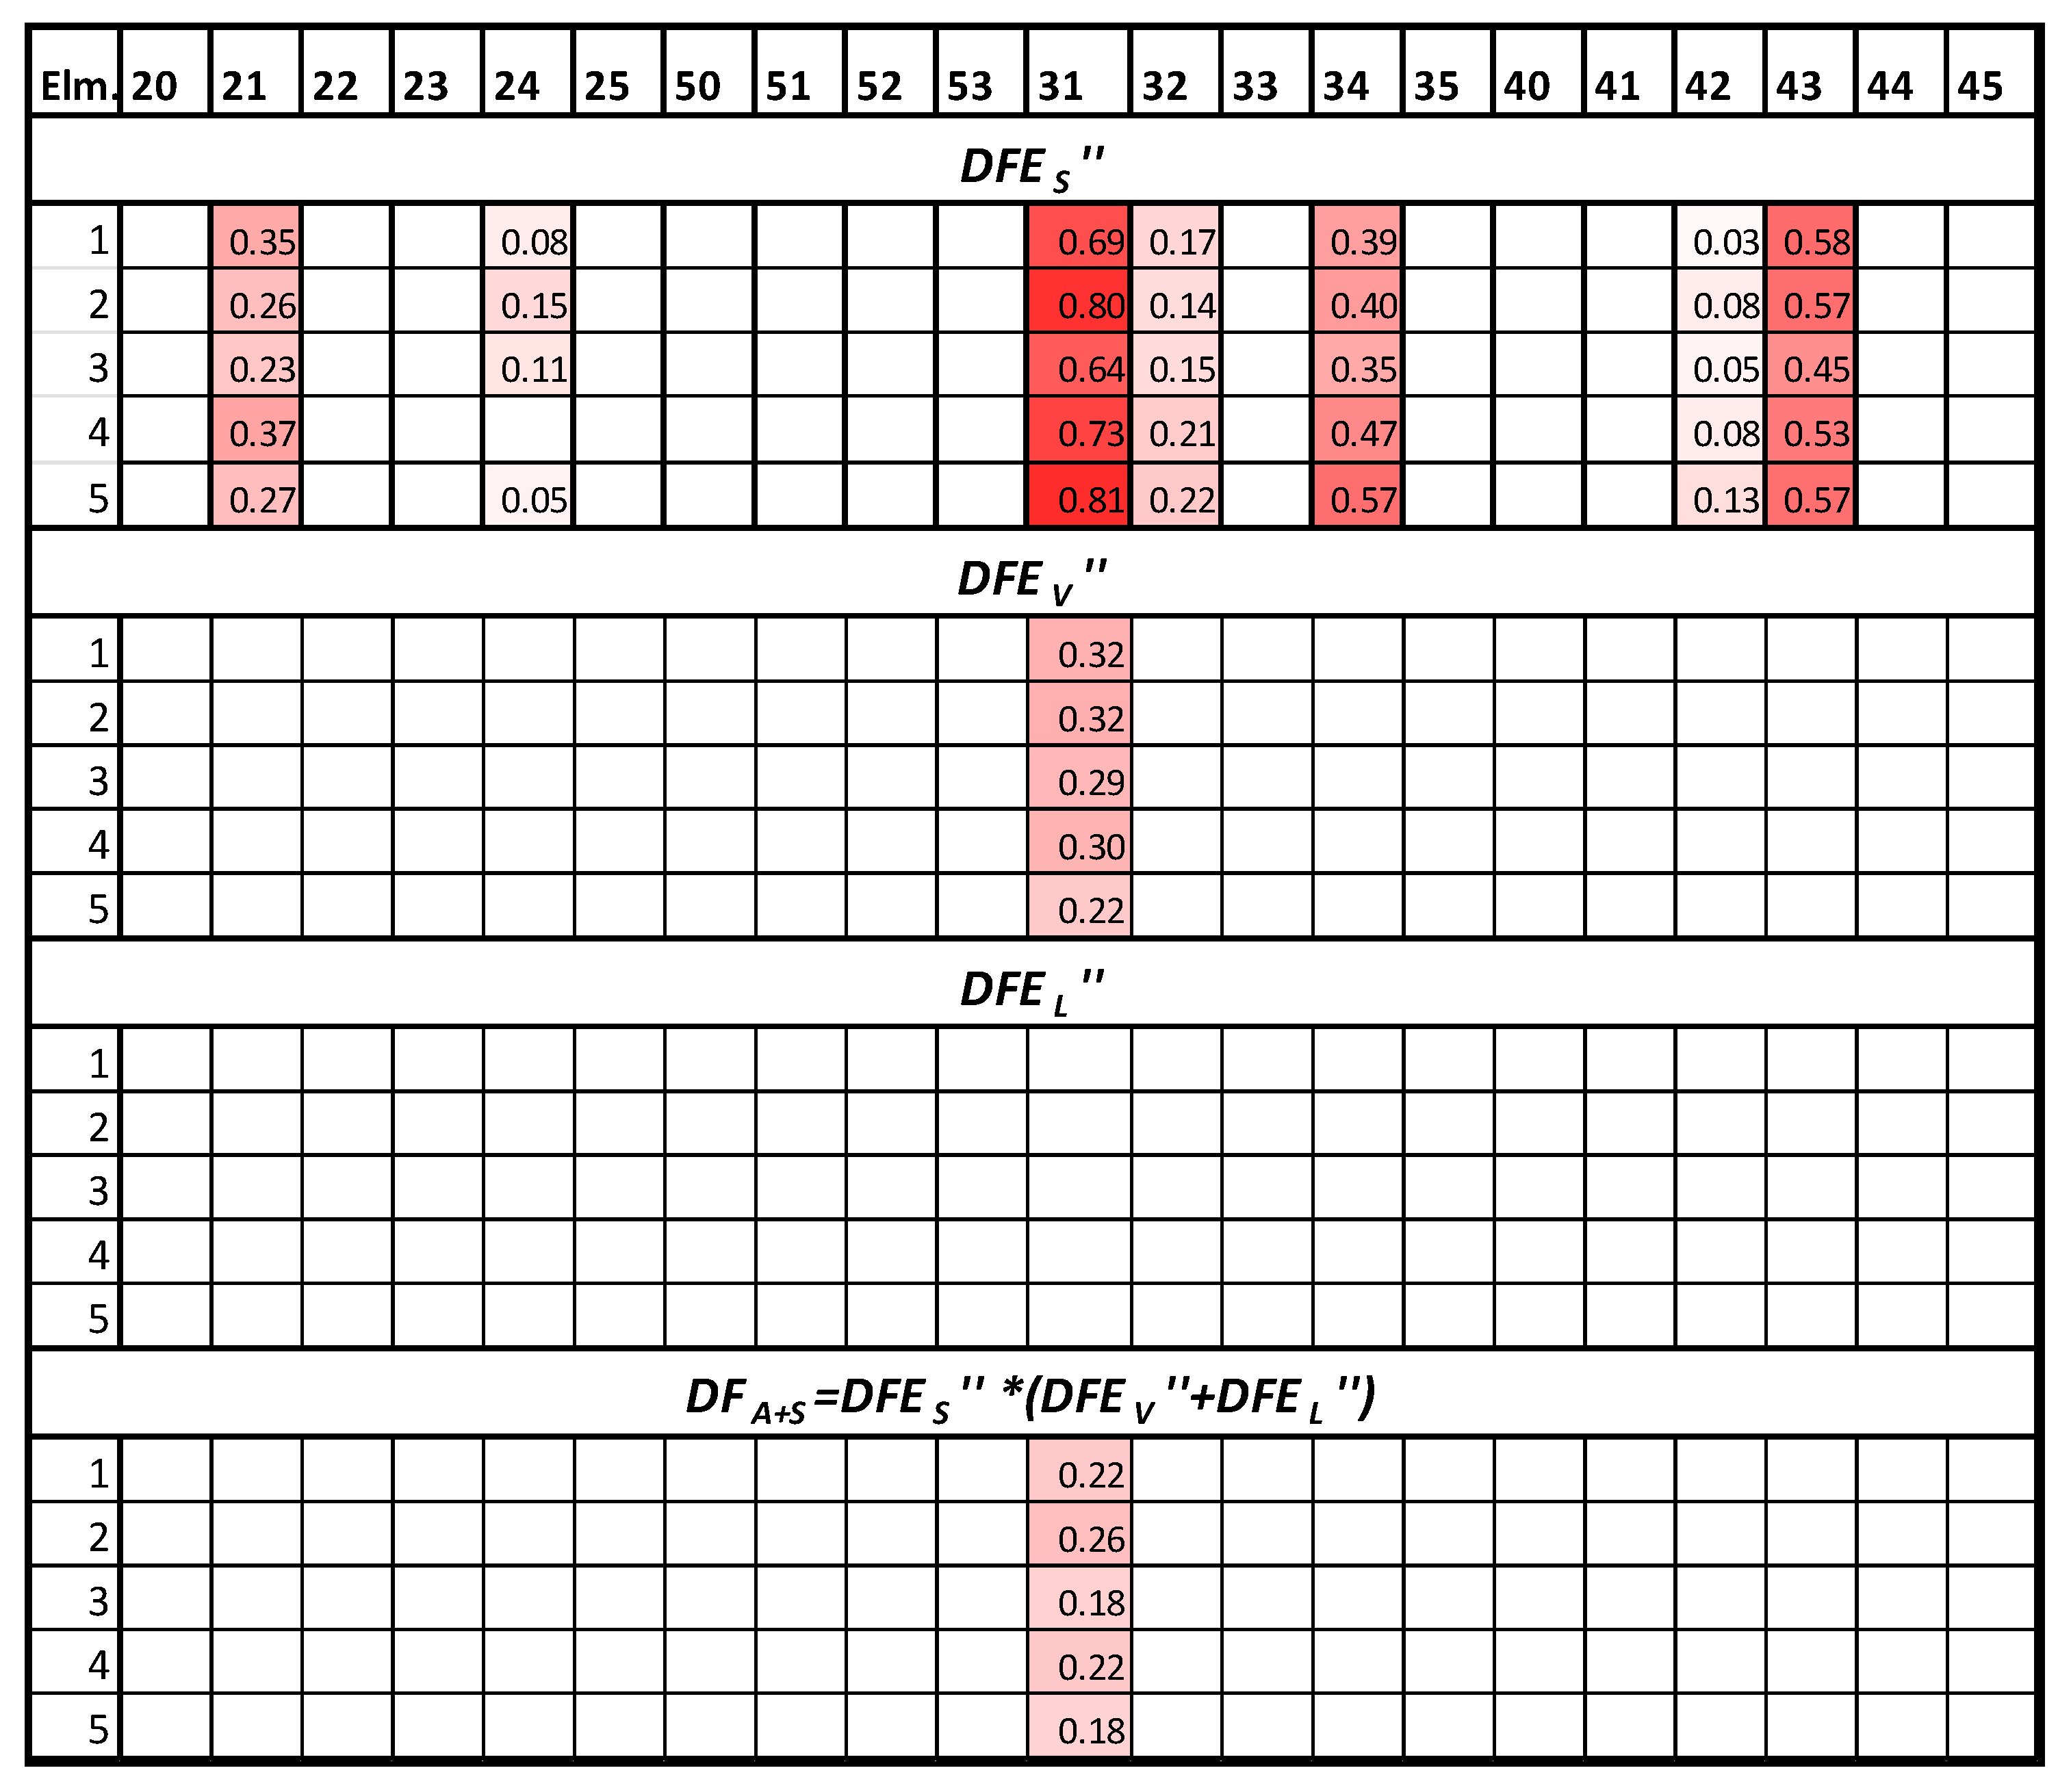
4.4. Damage Case-4: Stiffness Loss in Elements 21 and 31 by 20%
In this damage case, truss elements 21 and 31 are simulated as damaged due to a reduction of stiffness by 20%. The location of the actual damage is shown in
Figure 12a. The results from the proposed damage detection framework are presented in
Figure 12b.
In this damage case, the strain analysis can identify and locate the damaged elements 21 and 31. However, strain analysis also identifies additional elements 24, 32, 34, 42, and 43 as likely damaged. While elements 32 and 42 are connected to the actual damage elements 21 and 31, elements 34 and 43 are not connected to either of them and, therefore, are falsely identified. One way to improve the damage detection performance based on strain is to increase the number of sensors but that is not always feasible. The vertical acceleration analysis was able to identify and isolate damage in element 31. The longitudinal acceleration analysis was able to identify and locate element 21. The proposed damage feature makes it more apparent that the damage is likely in these two elements.
It is observed in these results that, for the same levels of damage, the DFA+S values are around 2–3 times higher for the vertical element 31 compared to longitudinal element 21. This is mainly due to the variation in and values for these elements, respectively. Vertical acceleration analysis results produce higher DFs for vertical elements compared to longitudinal acceleration-based DFs for longitudinal elements for the same level of damage severity. The operational acceleration data is obtained in response to the passage of trains with axle loads in the vertical direction with no load in the longitudinal direction. So, vertical acceleration is the direct response to the passage of trains and has a significantly higher magnitude than longitudinal acceleration. As a result, the vertical acceleration is more sensitive to the damage than the longitudinal acceleration. By comparing the DFA+S of element 31 at 20% severity with those obtained in damage case-1 at 10% severity, it is shown that, as the severity of damage in an individual damage increases, so does the corresponding DFA+S values for that element.
4.5. Damage Case-5: Stiffness Loss in Elements 24 and 44 by 20%
In this damage case, truss elements 24 and 44 are simulated as damaged due to a reduction of stiffness by 20%. The location of the actual damage is shown in
Figure 13a. The results from the proposed damage detection framework are presented in
Figure 13b.
In this damage case, the strain analysis identifies and locates the damaged elements 24 and 44. However, strain analysis also identifies additional elements 22, 23, and 34 as likely damaged. The vertical acceleration analysis was able to identify and isolate damage in element 44 but falsely identifies element 35. The longitudinal acceleration analysis was able to identify and locate elements 24 and 44. The proposed damage feature eliminates other false identifications, and it becomes clear that the actual damage locations are in elements 24 and 44.
It is observed that for the same level of damage,
DFA+S values are around five times higher for the diagonal element 44 compared to the longitudinal element 24. This is due to two reasons. As explained in the previous damage case, for the same level of damage, the
are more sensitive compared to
s as can be seen in
Figure 10b where the average
and
s are around 0.08 and 0.25, respectively, for element 44. Besides, both the
and
s contribute to the total
DFA+S for element 44, while only
contribute to element 24.
4.6. Damage Case-6: Stiffness Loss in Elements 21, 31, and 44 by 20%
In this damage case, truss elements 21, 31, and 44 are simulated as damaged due to a reduction of stiffness by 20%. The location of the actual damage is shown in
Figure 14a. The results from the proposed damage detection framework are presented in
Figure 14b.
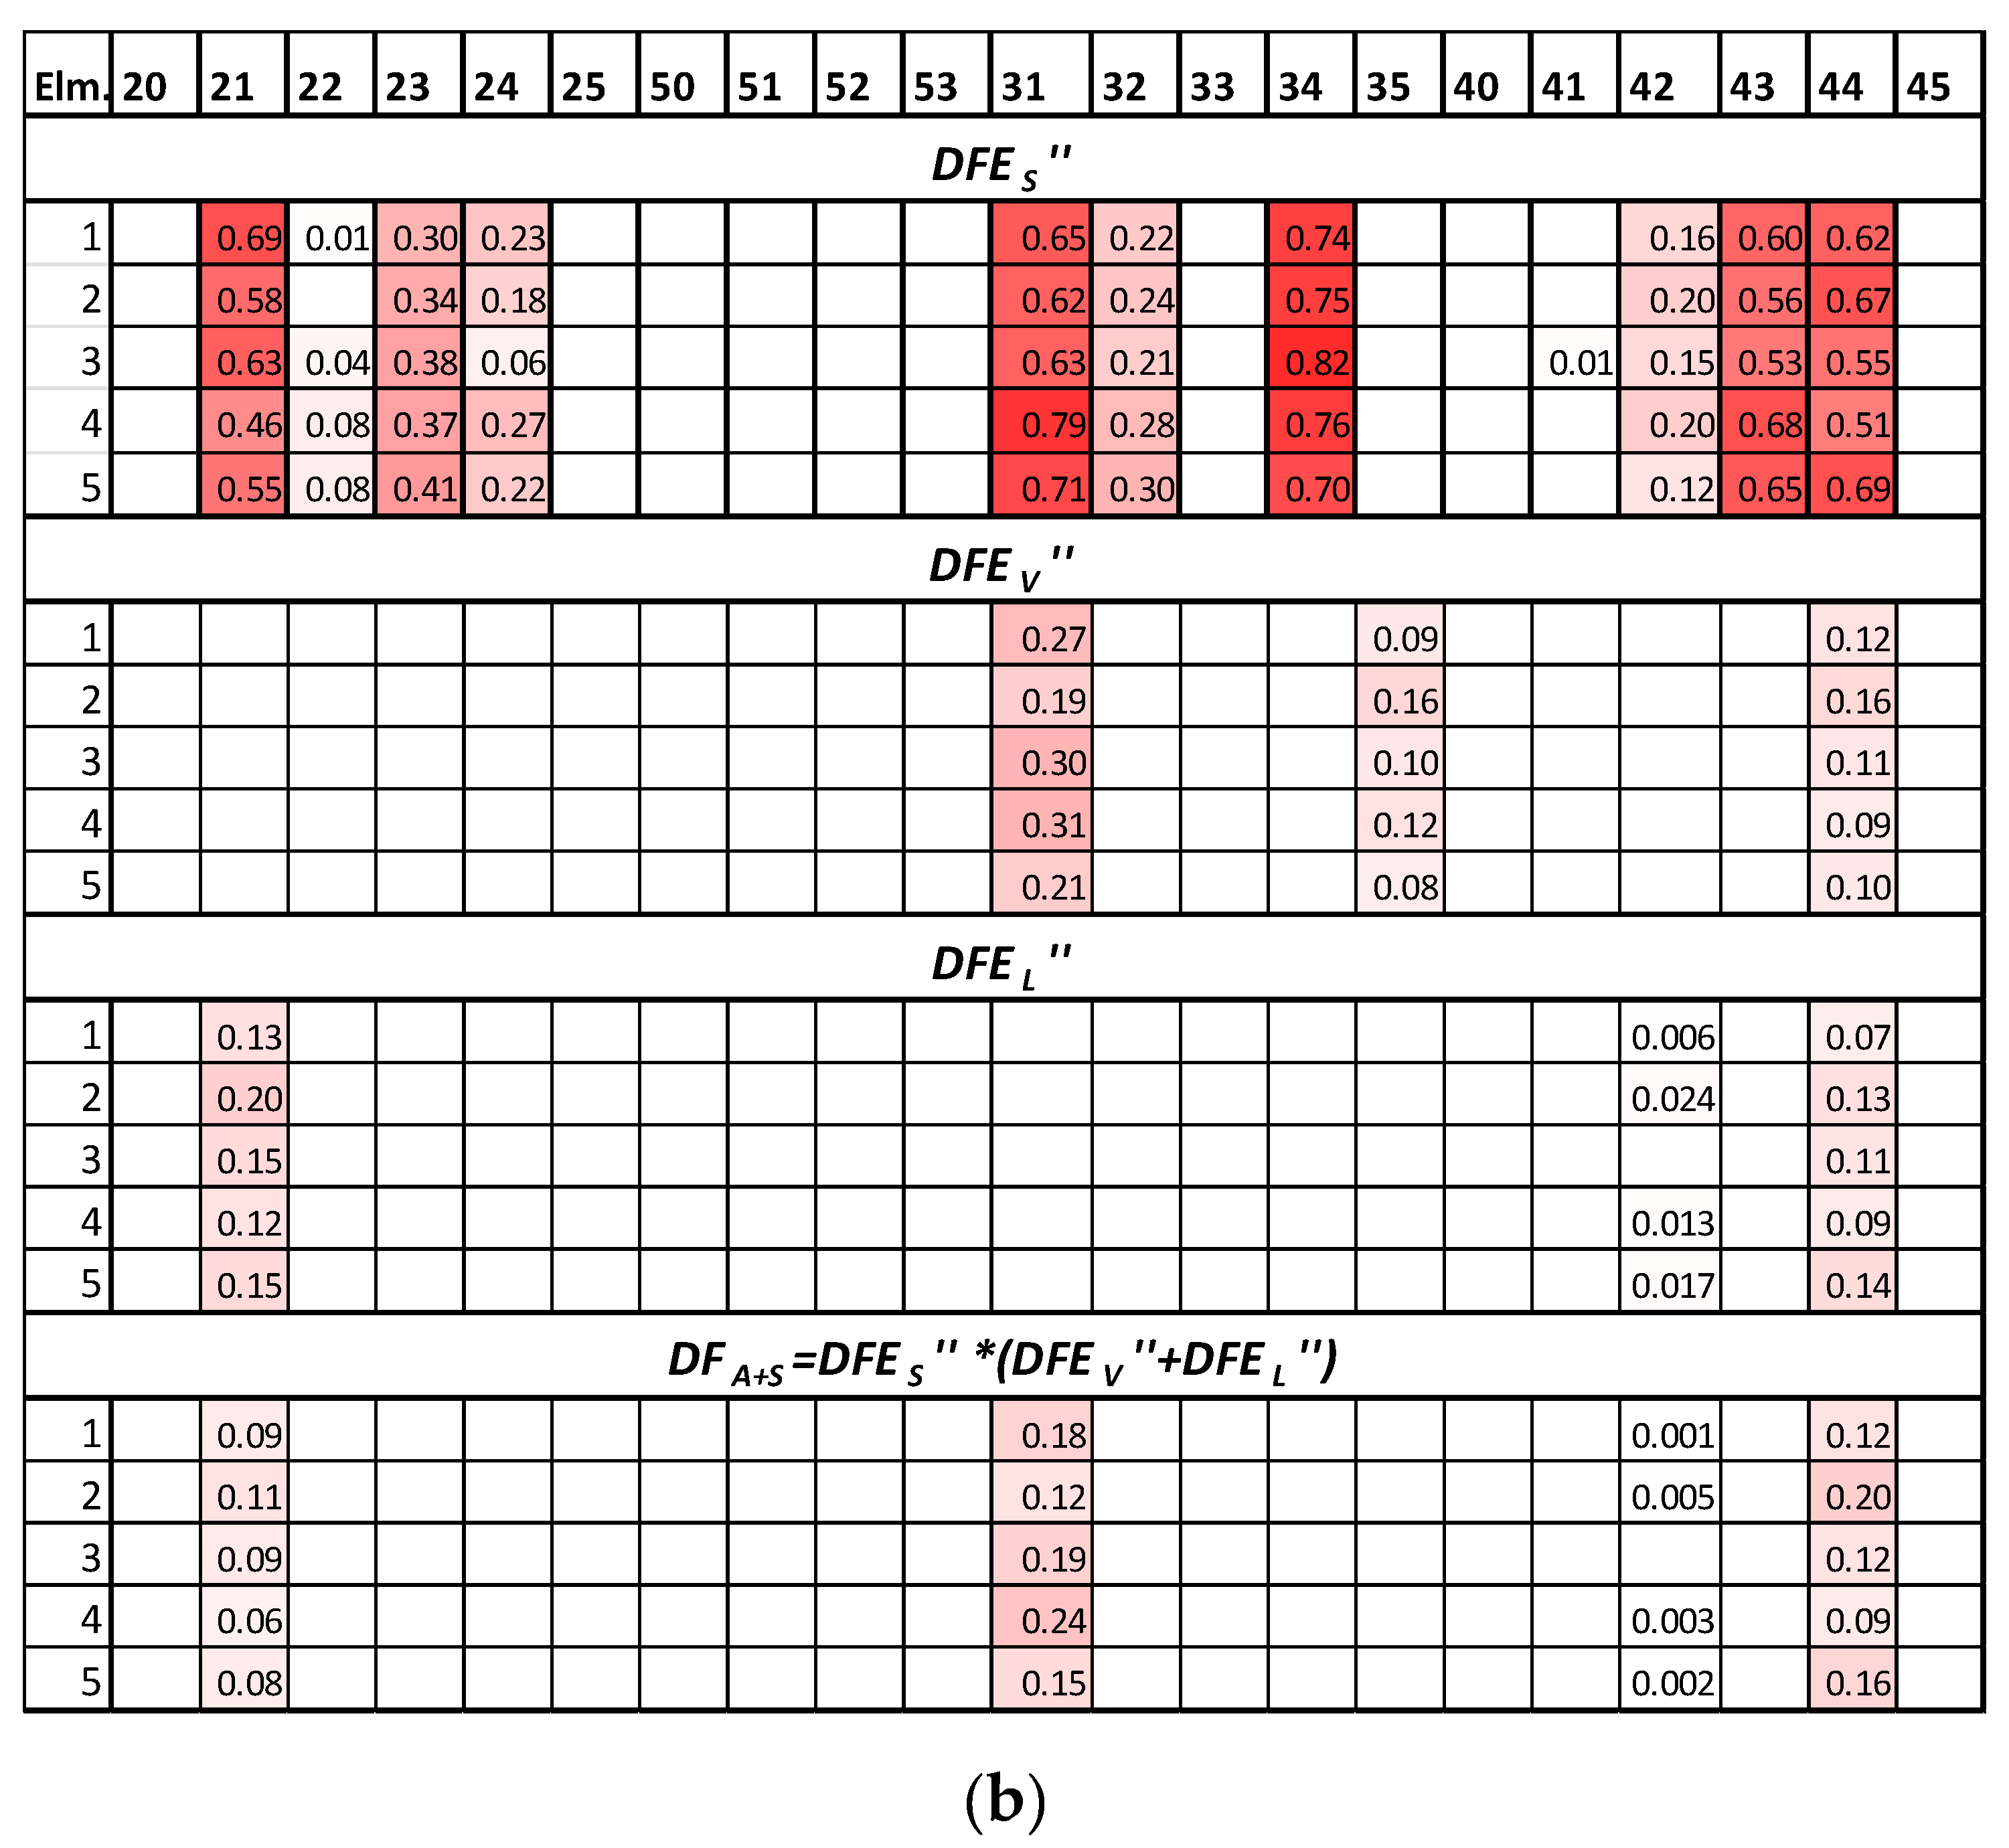
In this damage case, the strain analysis identifies various elements as damaged in addition to the actual damaged elements 21, 31, and 44. The vertical acceleration analysis was able to identify and isolate damage in elements 31 and 44 but falsely identifies element 35. The longitudinal acceleration analysis was able to identify and locate elements 21 and 44. Similar to previous damage cases, the newly proposed damage feature that the actual damage locations are in elements 21, 31, and 44 and shows its usefulness especially in identifying multiple damaged elements.
While observing the results of all these damage cases, it could be noticed that some information of relative severity between elements is lost (i.e., the same level of damage exhibit different magnitudes of damage features) due to normalization and multiplication of damage features. Such a step achieves the intended purpose of isolating the location(s) of damage. However, the severity of damage to an individual element can still be observed since the DFA+S for that element will continue to increase in response to increased severity as shown through the analyses of damage case-1 and case-4. Once the location is pinpointed, the individual DFs can be analyzed further to assess the comparative severity of damage between elements.
4.7. Damage Detection of Elements with Reduced Instrumentation
In this research, the newly proposed damage feature DFA+S achieves the purpose of improved damage localization by multiplying acceleration-based damage features with the strain-based damage features. Therefore, this framework will be effective, if the damaged element is monitored by strain gauge and biaxial accelerometers at the same time. For this reason, damage in the elements that are connected to the support (elements 20, 25, 40, and 45) cannot be located using this procedure. Damage in these elements, however, can be detected by placing strain-gauges in these elements and observing the strain damage features . Similarly, for elements that are not monitored with strain gauges, but instrumented with accelerometers, the condition of those can be assessed based on the and . Thus, the presented framework is versatile enough to offer the bridge owners and operators an option to formulate an effective data acquisition plan depending on the desired level of performance and economical constraints. For example, very critical elements could be monitored using both acceleration and strain data for improved damage localization, while other elements can be evaluated using either acceleration response or strain response.
5. Conclusions
Since even short-to-medium span truss bridges usually consist of many elements, it is a challenge to accurately localize the likely damage element. In this regard, this article presents a novel data-driven damage detection framework for railway truss bridges using commonly measured operational response (acceleration and strain) of the bridge, which achieves the purpose of improved damage localization. The presented method relies on the comparison of free acceleration response after the passage of a train from the baseline and the damaged bridge due to the passage of a single vehicle. Similarly, the strain damage feature is validated when comparing data from the passage of a single train at a time. So, the presented damage detection framework is suited to railway bridges. Trains usually pass over railway bridges following a schedule and usually, there is a time gap between each passage of a train. This makes the process of acquisition of useful free vibration data for railway bridges convenient, unlike other types of bridges (such as highway bridges) where vehicle movements are random and often multiple vehicles pass over the bridge at the same time.
The results show that the proposed new DF could provide more information on damage and the likely location over individual acceleration and strain-based DFs. The newly proposed DF eliminates the false-positive results identified by individual acceleration and strain-based DFs due to force redistribution and measurement noise. It is shown that, in all the damage scenarios investigated, the new DFs can isolate the affected elements among many truss elements, which is the main contribution of this new method.
In this study, the efficiency of the proposed method is demonstrated for the distributed loss of stiffness. The proposed damage detection framework applies to internal damages (i.e., damage in truss elements). Damages such as a change in support condition affect multiple truss elements at the same time even though the elements themselves are not damaged. However, localization of external damages, such as support change and support settlement, is not within the scope of this framework. In addition, detection of damage within a connection and other highly localized damages such as those caused by cracking and buckling of elements are not within the scope of our current research, since identification and localization of cracks with strain gauges and nodal acceleration data is usually not feasible. Such damages could be assessed using visual, visual-aided, and NDT methods. The effects of environmental condition changes are not considered in this study, which could influence the strain data, and consequently, the damage detection results like it affect most damage detection methods in the literature. For real-life application, the proposed method needs to be complemented with techniques to separate the effect on the DFs due to temperature changes from the damage. Currently, the authors’ research team is working on developing damage detection methods by incorporating the use of artificial neural networks to compensate for environmental effects [
42,
43,
44,
45]. The effect of train-track-bridge interaction is not considered in this study since the response is obtained from fixed sensors mounted on the bridge and, therefore, should not be affected significantly by such interaction. Despite such limitations, this method shows promise for practical implementation and further studies addressing the limitations should improve the efficiency of the proposed method.
One of the challenges of the SHM methods is how to optimize the number of sensors for meaningful performance. While the presented framework requires extensive instrumentation, the benefit of such a framework is that it combines two damage features to improve the damage localization performance of individual damage features. Individually, each method assesses the condition of the bridge and localizes damage as shown in the results. So, if one type of response is not available due to the unavailability of sensors, the other method should be utilized to assess the condition. In that case, the combined damage feature does not apply. Similarly, if the number of sensors is reduced, the performance of the overall framework will also be reduced. The authors believe that future research should build upon the proposed method and focus on optimizing the framework.
The presented damage detection framework could complement the current practices regarding monitoring of truss railway bridges and assist in improving the existing SHM techniques. Moreover, once the system is installed, continuous real-time monitoring is possible since the method is mostly operational data-driven. It offers the opportunity to detect damage at relatively early stages to develop economical maintenance strategies and address the problem before it becomes too costly to repair. Future research should focus on validating the presented framework through experimental investigations and application to real-life bridges.


