1. Introduction
People who are transported in vehicles moving on irregular off-road conditions can be exposed to extensive whole-body vibration (WBV) and repeated shock. Depending on their severity, the transmitted vibrations can force the human body to respond in a nonlinear manner. The nonlinear characteristics of human response under WBV in sitting, standing, and semisupine positions have been studied by many researchers. In most of these studies, the nonlinearity was presented in the form of softening behavior, where the principal peaks in the transfer functions—transmissibility [
1,
2,
3], apparent mass [
1,
3,
4,
5], mechanical impedance [
6,
7], and absorbed power [
8]—shift to the left to lower frequencies with increasing vibration magnitudes. While there is ongoing debate on the source of nonlinearity in the human response under vibration with different magnitudes, one limiting factor in most current studies is in the magnitude of vibration used during testing—mostly less than 3 m/s
2 root mean square (RMS).
The source of the human softening response with increasing vibration magnitudes has been investigated by many researchers. Most of these studies were conducted on humans in seated positions with limited studies on standing [
9] and supine [
1] positions. Hinz and Seidel [
10] exposed four seated male subjects to sinusoidal WBV between 2 and 12 Hz. They demonstrated that the resonance frequencies in the resulting transmissibility and apparent mass graphs were lower at the higher vibration level. The location of the primary resonance frequency for the apparent mass was shifted from 4.5 to 4.0 Hz with an increase in the acceleration level from 1.5 to 3.0 m/s
2 RMS. Fairley and Griffin [
4] measured the apparent mass of 60 seated human subjects, including males, females, and children, and observed a decrease in the mean resonance frequency from 6 to 4 Hz with an increase in acceleration from 0.25 to 2.0 m/s
2 RMS. Matsumoto and Griffin [
3] investigated the effect of vibration magnitudes on the transmissibility and apparent mass of eight seated subjects under random WBV with acceleration magnitudes between 0.125 and 2 m/s
2 RMS in the frequency range of 0.25–20 Hz. They showed a drop in the principal resonance frequency of the apparent mass from 6.4 to 4.75 Hz as the vibration magnitude increased from 1.25 to 2 m/s
2 RMS. They recognized that these trends were similar to those observed with the transmissibilities. Huang [
11] demonstrated nonlinear behavior in the apparent mass and transmissibility of seated and semisupine subjects during vertical random vibration (0.25 to 20 Hz) at seven vibration magnitudes from 0.0313 up to 2 m/s
2 RMS.
There is ongoing debate regarding the source of nonlinearity in the human response to low-frequency vibration with increasing vibration magnitudes. In their work on apparent mass, Matsumoto and Griffin [
5] showed that the nonlinear characteristics in the apparent masses of seated subjects were less clear when muscle tension in the abdomen and buttocks was controlled. They suggested that the changes in muscle tension during vertical WBV may be part of the nonlinear biodynamic responses. These findings were confirmed by Mansfield et al. [
2]; they found that the change in resonance frequency between 0.5 and 1.5 m/s
2 RMS was significantly smaller for the tense posture than for the relaxed upright posture. They also implied that muscle tension directly or indirectly influences the peaks in the apparent mass. Muscle tension could directly influence the response of the body by affecting the tonic vibration reflex or the phased back muscle activation during vibration exposure. Vogt et al. [
6] found stiffening behavior when they studied the driving-point mechanical impedance of seated subjects under variable static acceleration. In this case, the resonance frequency of the mechanical impedance increased when the static acceleration of the centrifuge was increased. This stiffening behavior may result when the subjects stiffen their muscles to support their bodies when they realize they are going to be exposed to greater constant accelerations.
In his PhD thesis, Huang [
11] investigated the source of nonlinearity under vibration with increasing magnitudes. He conducted comprehensive studies on groups of 12 subjects in the seated, standing, and semisupine positions under different vibration magnitudes. He also used different types of transfer functions, including apparent mass, transmissibility, and mechanical impedance, in his investigation. Huang’s conclusion was that tissue thixotropy in the contacting regions, and not muscle activation, is the main source of softening behavior in the human response. Many researchers would agree that involutory and voluntary muscle activations and tissue thixotropy are the main sources in the nonlinearity of the response of the human body under increasing vibration magnitude; however, it is not clear under which circumstances people will show softening or stiffening behaviors.
One limitation of existing studies in the literature is the limited magnitude of the maximum vibration that was used in these studies, generally being less than 3 m/s
2 RMS. In real-life scenarios, such as evacuation or transport under severe irregular terrain conditions, the human body can be exposed to vibration that exceeds the traditional values used in the experimentations in the literature. This work presents a case study of the responses of 26 supine subjects transported inside an army medical vehicle on irregular terrains that simulate real-life scenarios. The objective of this case study is to investigate the resulting nonlinearity under such circumstances and to determine if the resulting transfer functions have characteristics similar to those demonstrated in the literature. The article is organized in four sections. Following this introduction section,
Section 2 presents the materials and methods used,
Section 3 presents the results, and
Section 4 contains the discussion and conclusions.
3. Results
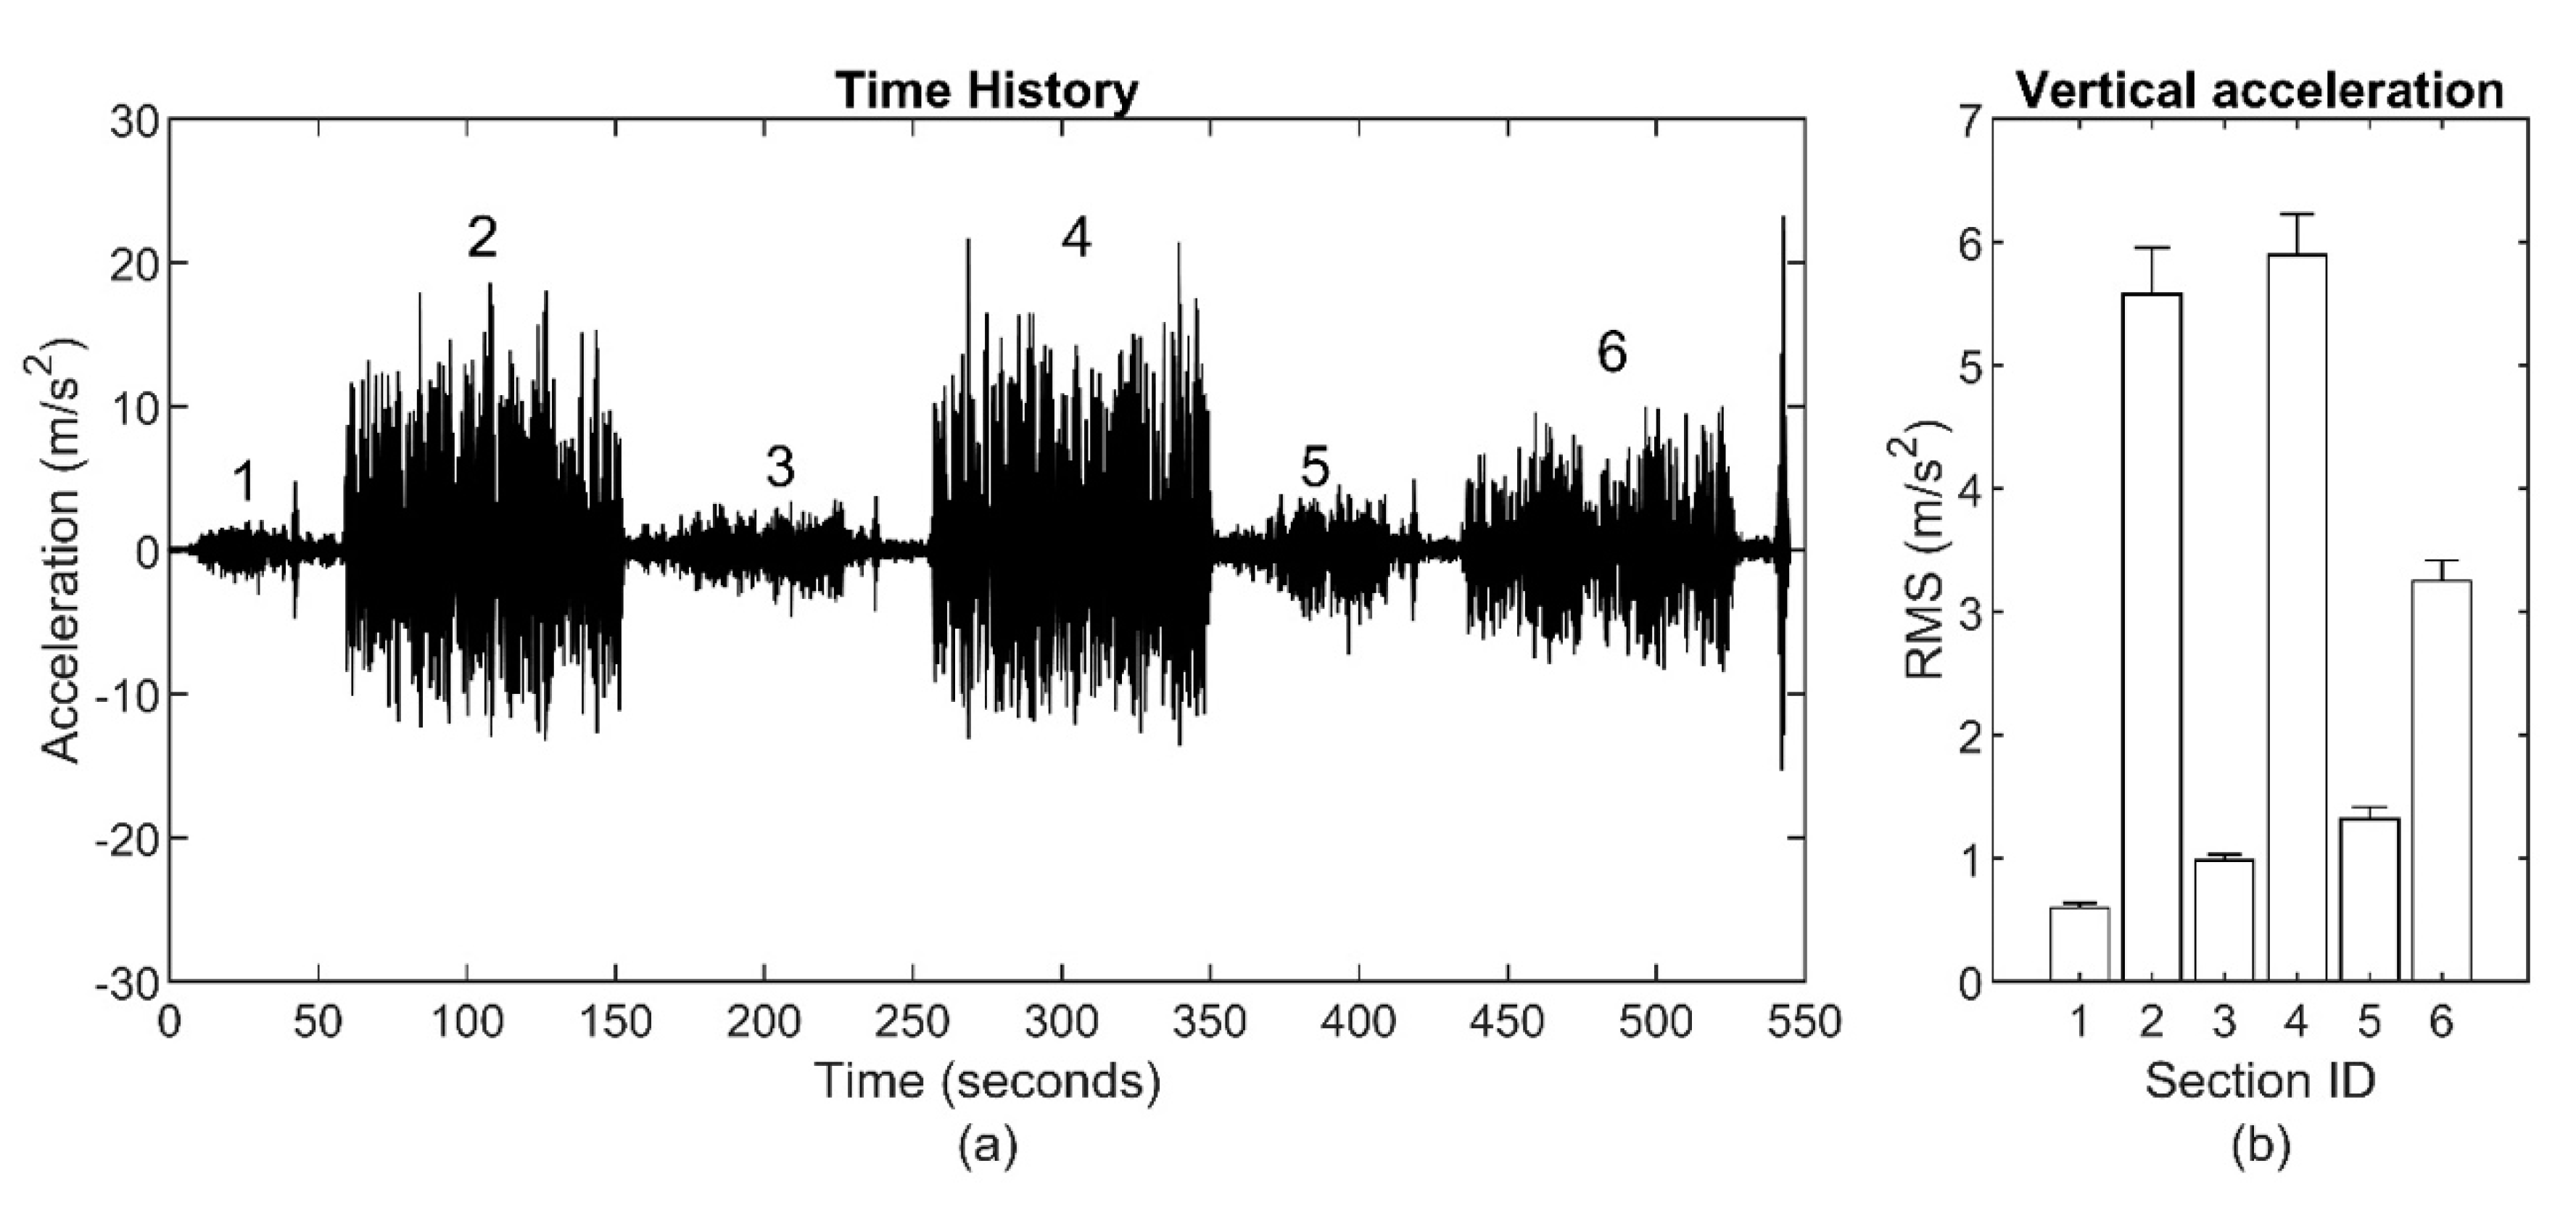
Data collected on the vehicle floor and participants’ body segments were postprocessed to calculate the transmissibility and coherence functions across the various road conditions (
Figure 1).
Figure 2,
Figure 3 and
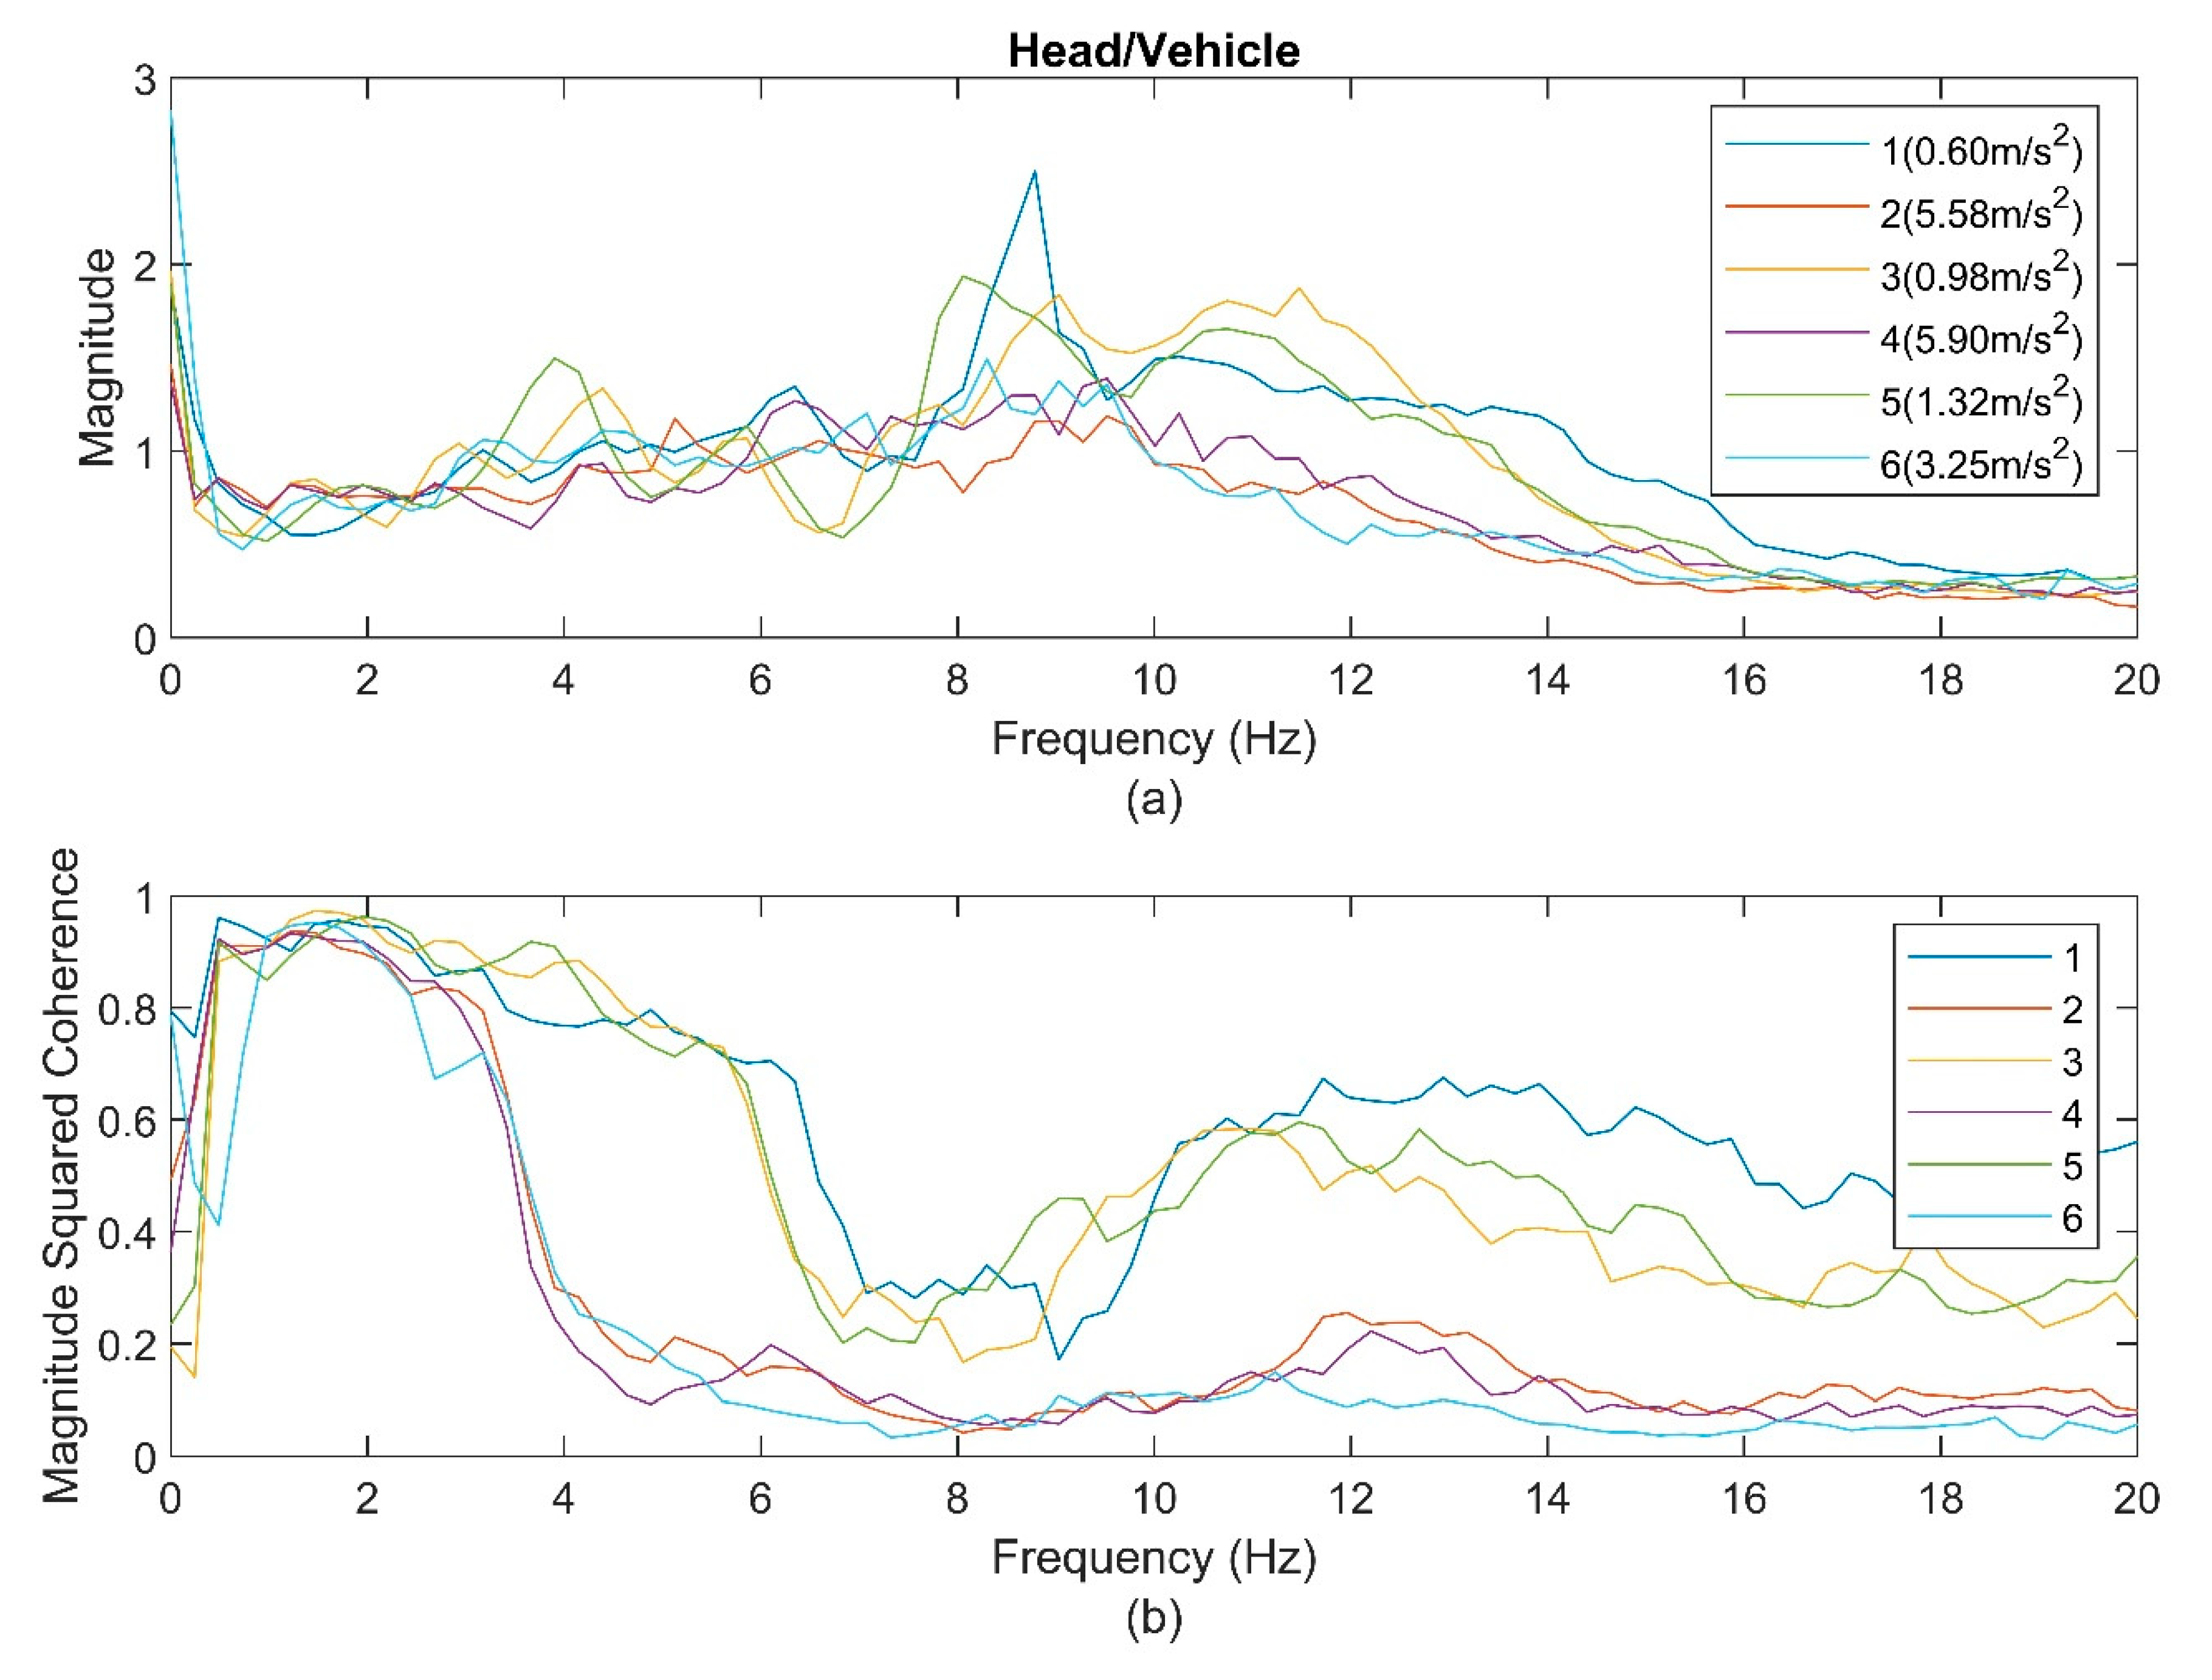
Figure 4 show the average transmissibility and their average coherence graphs for the head, torso, and pelvis during the six track conditions. For the head (
Figure 2), the resulting data showed several small peaks with one obvious peak between 8 and 12 Hz. The coherence functions demonstrated a distinct difference between the LVM and HVM groups with a sudden drop after 3.5 Hz for the HMV group. The peak frequencies in the transmissibility functions decreased with the increasing magnitude of the vehicle’s vertical acceleration RMS for the LVM. The peak frequency (8.2 Hz) for Section 5 was lower than that of Sections 1 and 3 (8.7 Hz). Meanwhile, the HVM group showed a higher peak, around 9.0 Hz, for the different sections in this group.
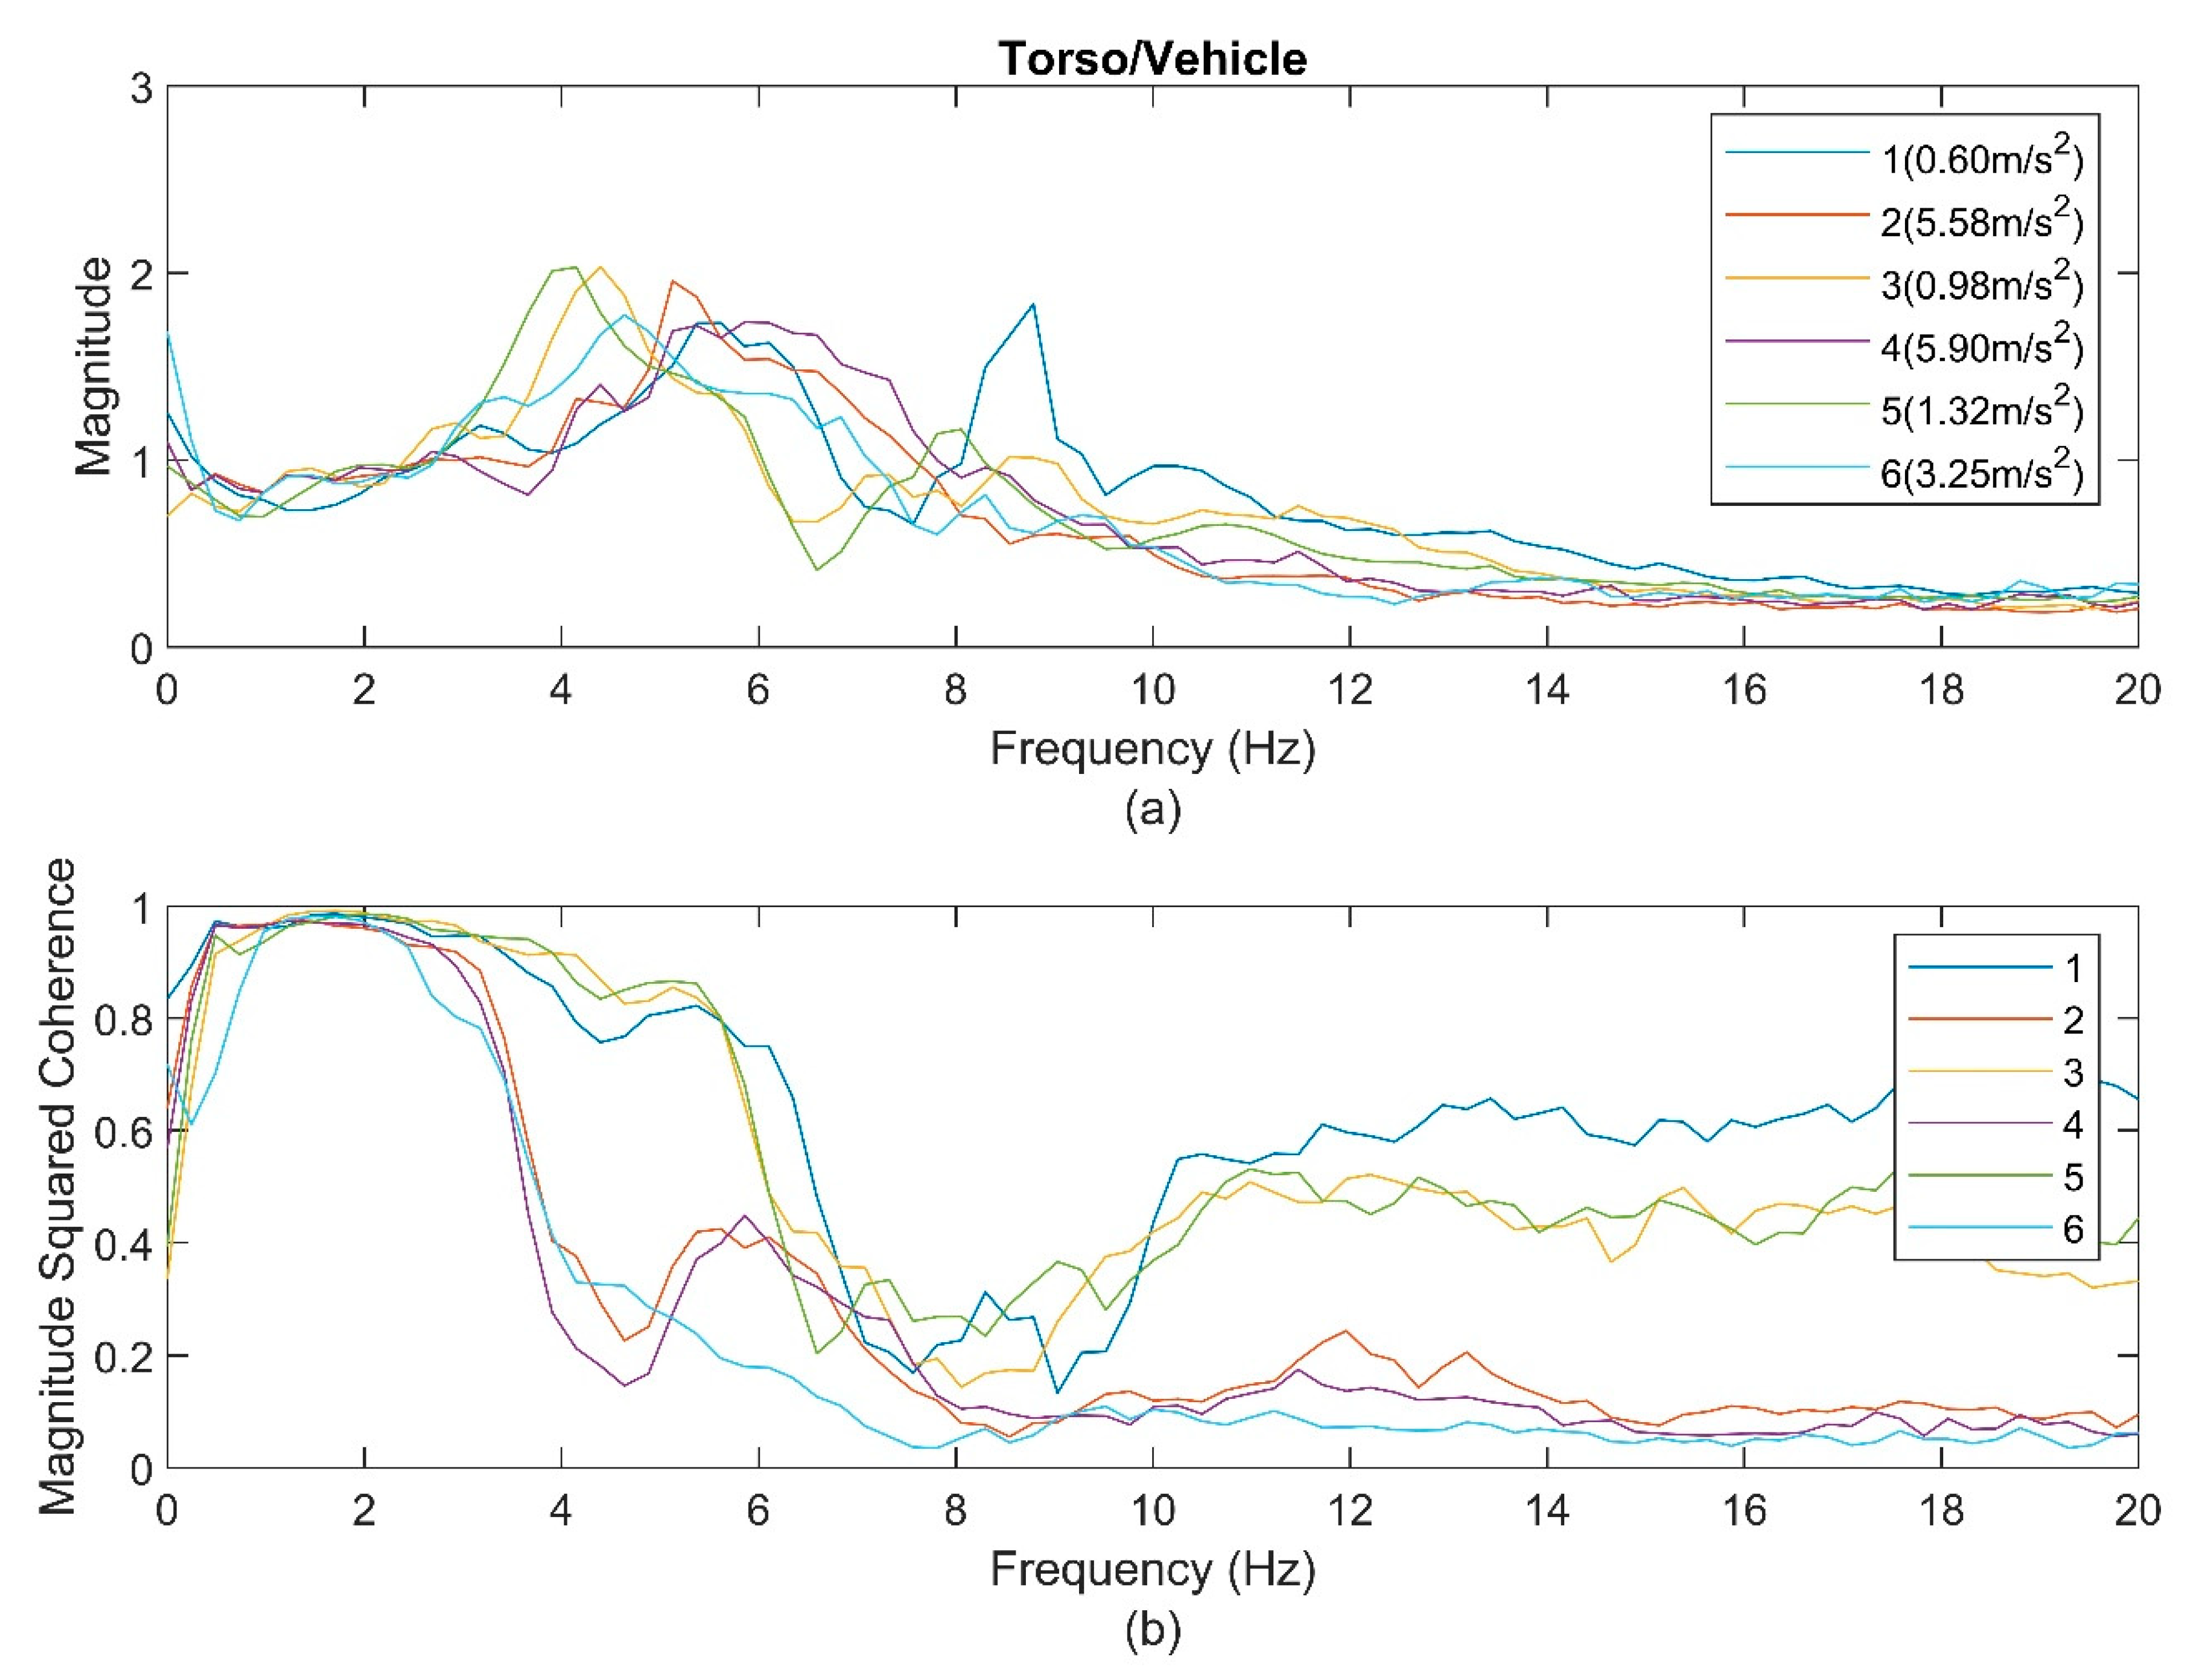
For the torso (
Figure 3), the resulting data for all sections showed obvious major peaks between 4 and 6 Hz. The peak frequencies for the LVM group were 5.5 Hz for Section 1, 4.4 Hz for Section 3, and then 4.2 Hz for Section 5, indicating softening behaviors. The peak frequencies for the HVM were 4.7 Hz for Section 6, 5.1 Hz for Section 2, and 5.9 Hz for Section 4, indicating stiffening behaviors. There were secondary peaks between 8 and 10 Hz, but they were not easy to follow. The coherence (
Figure 3b) showed a linear relationship for all sections until 3.5 Hz and then dropped. However, the drop in the coherence of the HVM group was steeper than that of the LVM group. The coherence for the LVM dropped after 3.5 Hz but then bounced back and created two humps around 5–7 Hz and 10–14 Hz. It appears that the peaks in the transmissibility graphs occurred at the frequencies where the coherence bounced back and created a hump.
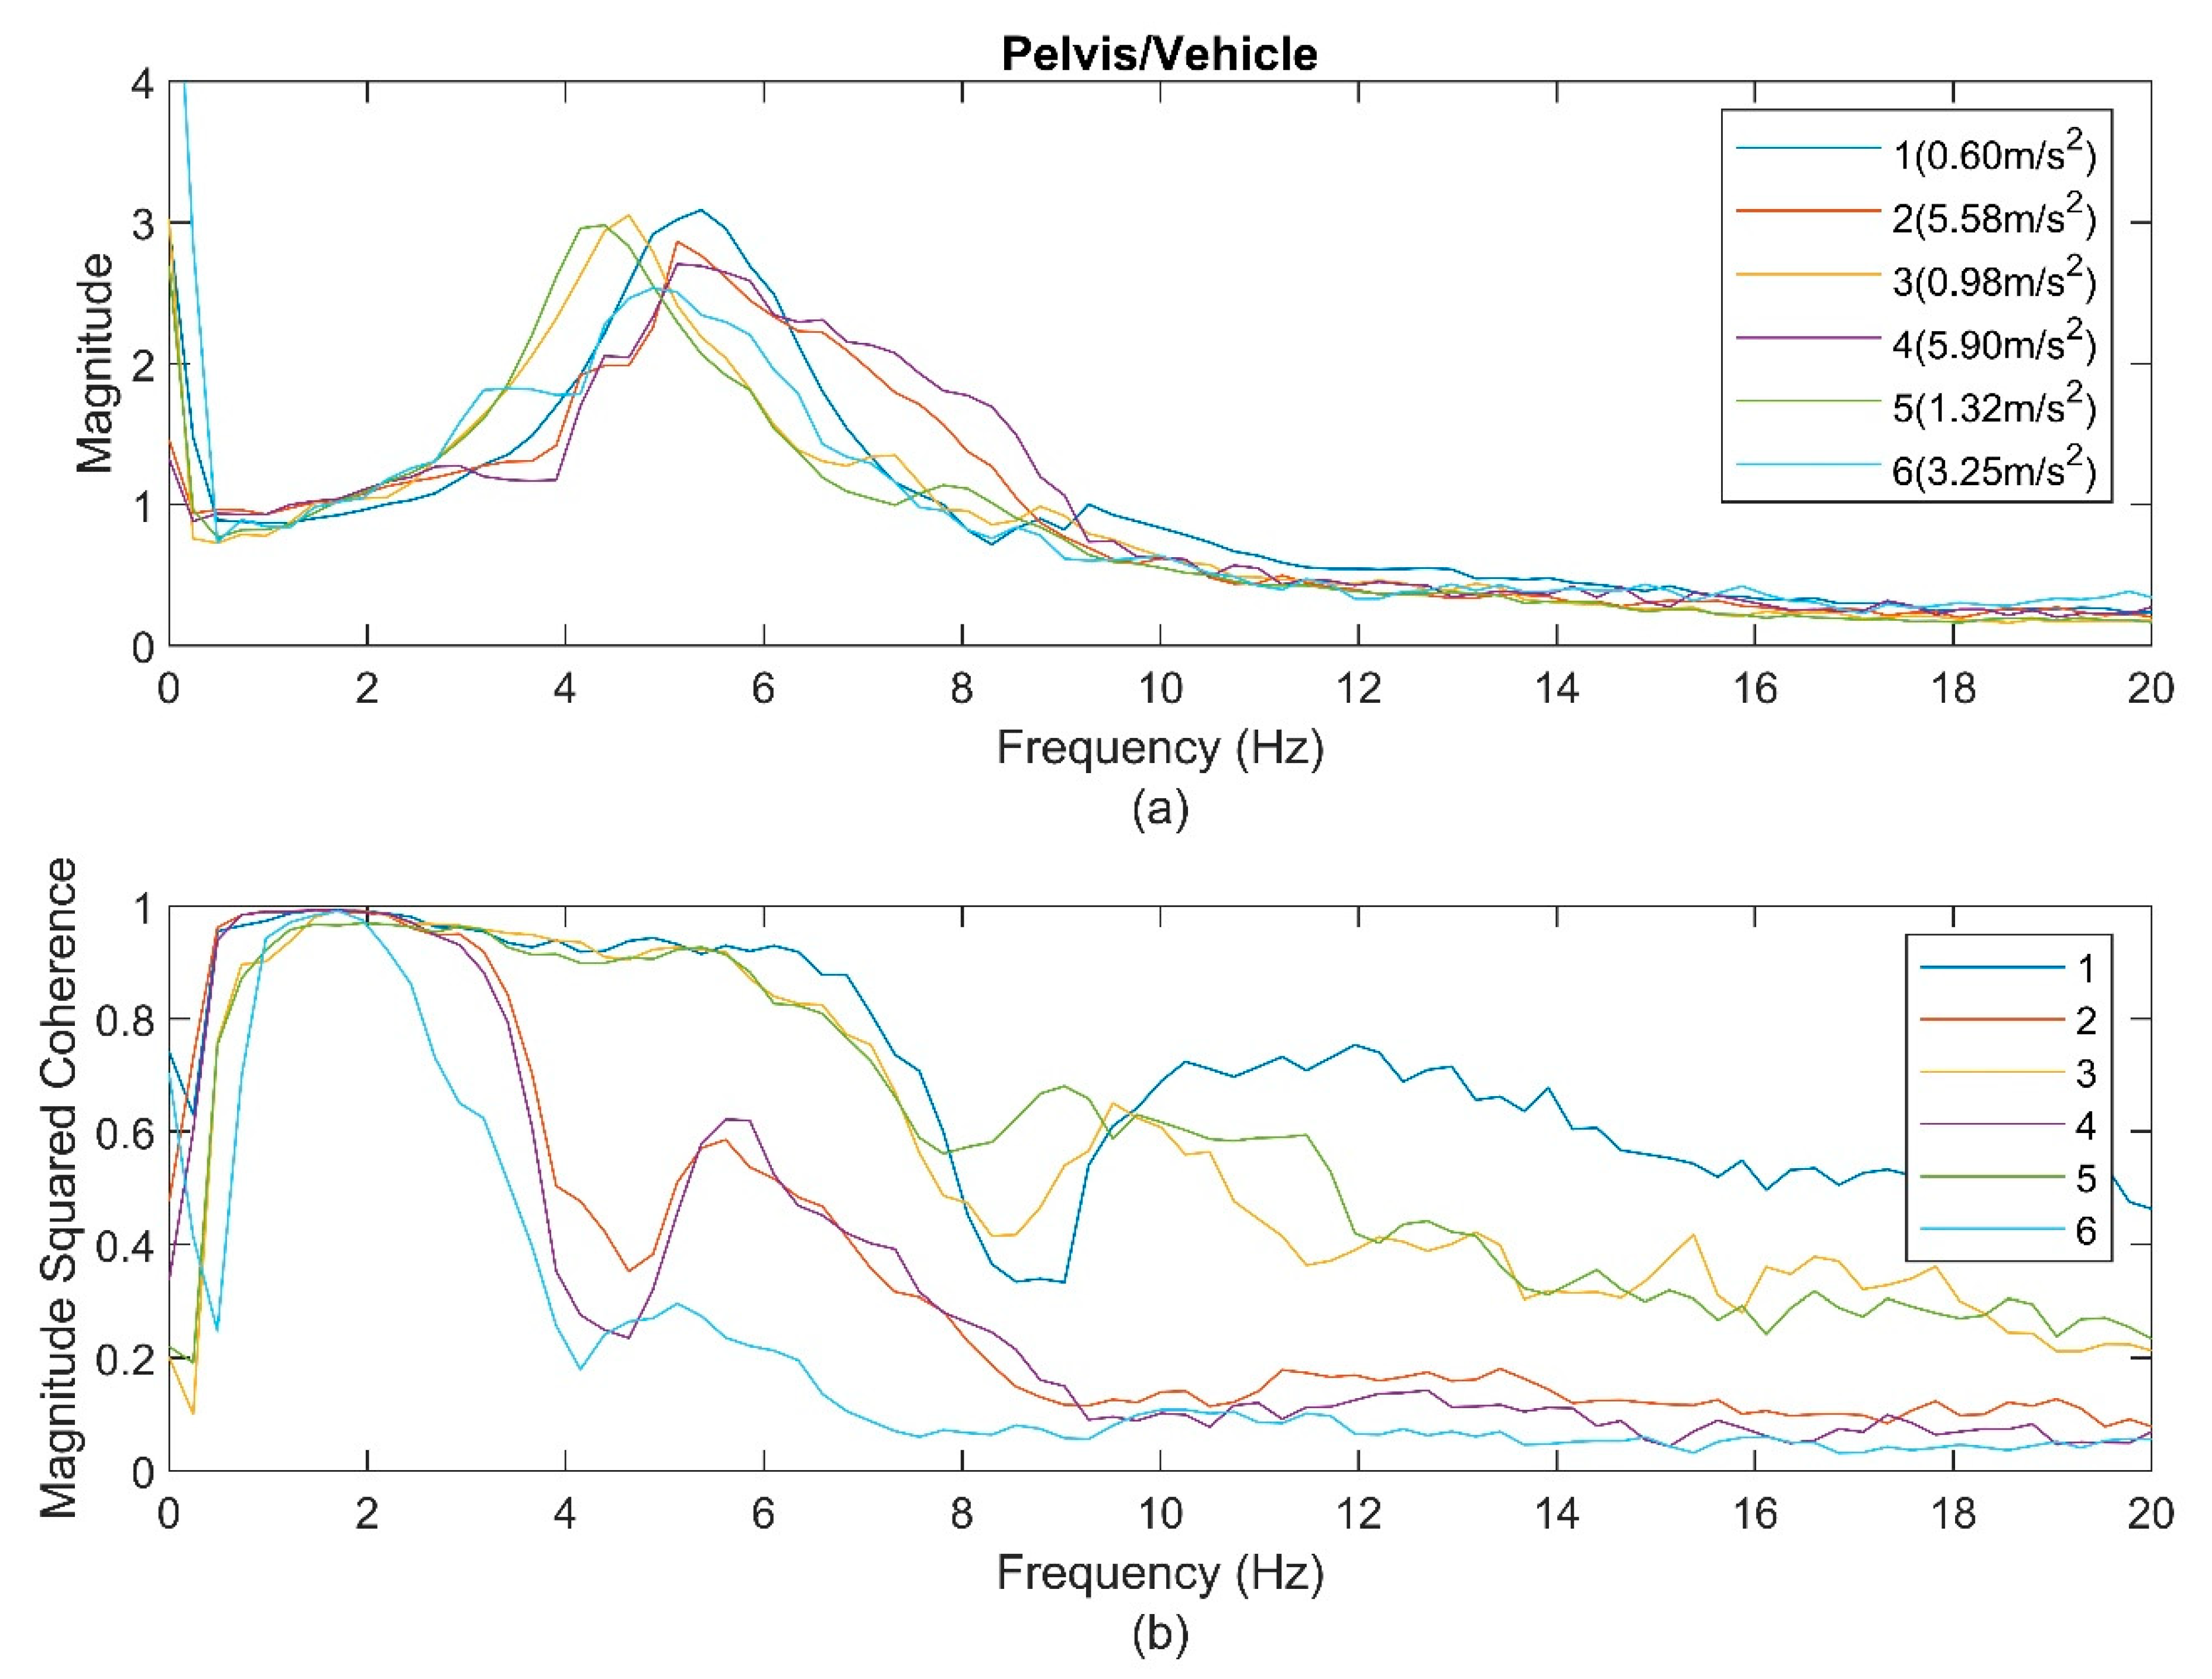
Compared to the transmissibility at the head and torso, the transmissibility of the pelvis showed only one obvious peak for the six sections (
Figure 4). The peak frequencies in the LVM group were 5.5 Hz for Section 1, 4.6 Hz for Section 3, and 4.4 Hz for Section 5. Meanwhile, the peak frequencies in the HVM group were 4.9 Hz for Section 6 and 5.2 Hz for Sections 2 and 4. The coherence graphs showed characteristics similar to those of the torso; however, they showed more gradual drops after 6 Hz for the LVM group and after 3.5 Hz for the HVM group.
The average peak frequencies of the transmissibilities and their SD at the head, torso, and pelvis relative to the vehicle floor (as shown in
Figure 2,
Figure 3 and
Figure 4) are presented for each section in
Table 1. Based on these average peak values and their SD, the corresponding
p-values are provided in
Table 2 and
Table 3 for the LVM group and the HVM group, respectively. In
Table 2, a
t-test is conducted in a pairwise comparison between combinations of two sections at the head, torso, and pelvis for the LVM group. Similar information is depicted in
Table 3 for the HVM group. For example, in
Table 2, the second and third values in the third row present the
p-values of Sections 1 to 3 and Sections 1 to 5, respectively, at the peak frequencies at the head.
For the LVM group, at the head, Sections 1 and 3 showed higher peak frequencies than Section 5 with p-values of 0.0022 and <0.0001, respectively. At the same time, there was no significant difference between Sections 1 and 3. At the torso, Section 1 had a higher first peak frequency than Sections 3 and 5, with p < 0.0001. In contrast, Section 1 had a higher second peak frequency than Section 5 (p < 0.0001), but did not have an obviously higher second peak frequency than Section 3 (p-value = 0.0635). Moreover, Section 3 also had higher first and second peak frequencies than Section 5, with p-values of 0.0495 and <0.0001, respectively. At the pelvis, Section 1 had a higher peak frequency than Sections 3 and 5, with a p-value of <0.0001. Section 3 also had a higher peak frequency than Section 5, with a p-value of 0.0069.
When the HVM group is sorted by ascending input magnitude at the vehicle floor, Section 6 shows a lower peak frequency for the head than Sections 2 and 4, with p values of <0.0001 and 0.0128, respectively. However, Section 2 does not have an obviously lower peak frequency than Section 4. At the torso, both Section 6 and Section 2 have a lower peak frequency than Section 4 (p < 0.0001). Meanwhile, Section 6 has a lower peak frequency than Section 2 (p < 0.0001). At the pelvis, Section 4 shows a higher peak frequency than Sections 2 and 6, with p values of <0.0098 and 0.0185, respectively.
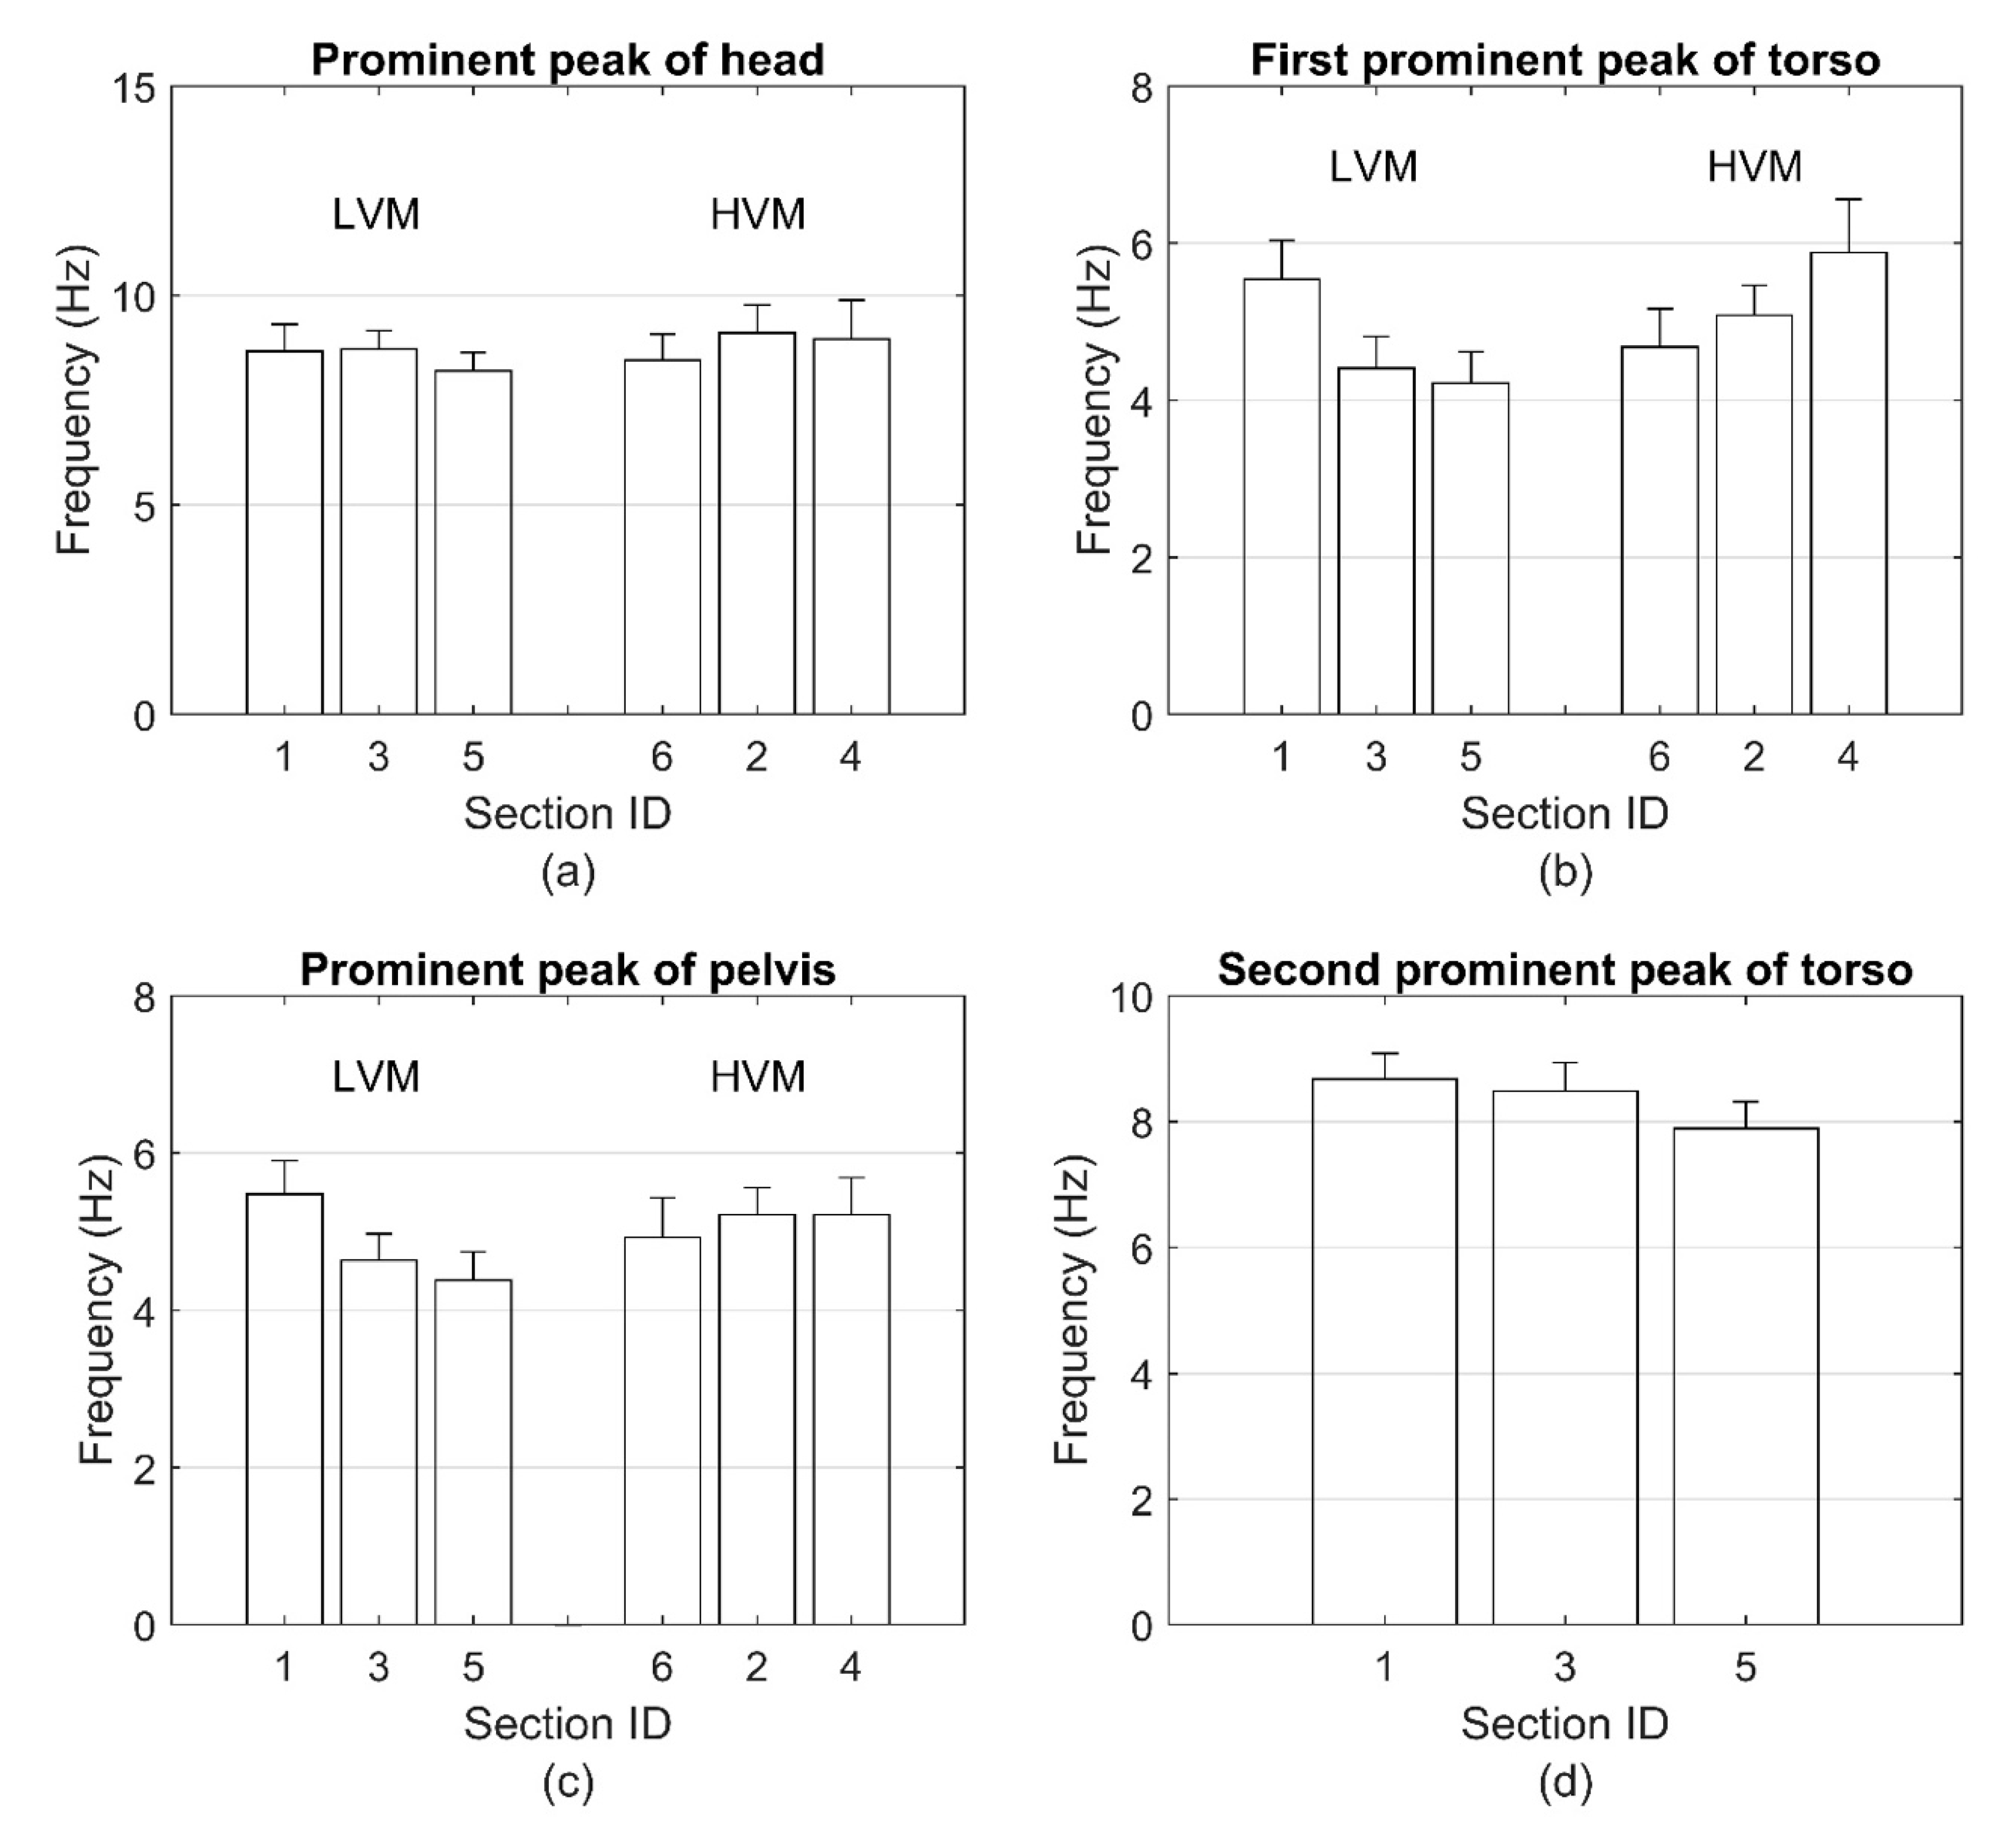
To show the relationship between the peak frequencies and input magnitudes visually, all prominent peaks of transmissibility and their SD are plotted in
Figure 5 for the LVM group and the HVM group. Because only the LVM group has a second prominent peak at the torso, there are only three bar plots for Sections 1, 3, and 5 in
Figure 5d. By combining the information from
Figure 5 and that from
Table 1,
Table 2 and
Table 3, it is clear that the prominent peaks descend with the increase of the input magnitude at the vehicle floor for the LVM group, while the prominent peaks ascend with the increase of the input magnitude at the vehicle floor for the HVM group.
4. Discussion
In this work, the vertical transmissibility graphs in the gravity direction of supine human subjects exposed to WBV with increasing vibration magnitudes showed nonlinear behaviors when the input vibration was increased from 0.6 m/s
2 to 5.9 m/s
2. The results showed softening behaviors across all segments of the human body when the magnitude of the acceleration was lower than 1.32 m/s
2 but showed stiffening behaviors when the vibration magnitudes exceeded 3.25 m/s
2. A similar nonlinearity trend was seen at the head, torso, and pelvis of the human subjects. While the softening behavior is similar to what has been reported in existing literature using various transfer functions such as transmissibility, apparent mass, and impedance while in seated, standing, and supine positions, nonlinearity with dominant stiffening behaviors has not been reported in humans under increasing vibration magnitudes. It should be mentioned that stiffening behaviors were reported with humans subjected to increasing constant acceleration magnitudes [
6].
There is some debate over findings in the literature regarding the source of the nonlinear softening behavior as a result of increasing vibration magnitudes. Some researchers attributed these behaviors to tissue thixotropy rather than to voluntary or involuntary muscular activities [
1,
11]. On the other hand, some researchers observed a reduction in the softening behaviors when voluntary and involuntary muscles were activated. For example, when seated subjects were asked to tense their buttocks and abdominal muscles, they showed relatively less softening behavior [
2], which may be explained by tonic voluntary muscle activation. The findings of Mansfield et al. [
2], Mansfield and Maeda [
14], and Matsumoto and Griffin [
5] may suggest that local, and some major, muscle activations could generate stiffening behaviors that may jointly work with tissue thixotropy to affect the type of nonlinear response at these regions. Tonic muscle activation, on the other hand, such as that with static acceleration [
6], may change the response characteristics of the body by creating a stronger connectivity between its segments and produce a global stiffening rather than softening behavior.
While the coherence function for the LVM of this work dropped slowly after 6 Hz, which is similar to what was reported by Huang and Ferguson [
15], the response became more nonlinear after that. Under the HVM condition, a steep drop after 3.5 Hz took place and then stepped up again slightly at higher frequencies. The transmissibility graphs showed peaks when the coherence was in the process of stepping up. This characteristic of the coherence may indicate very strong nonlinearity for the HVM, where the transmissibility graphs showed stiffening behaviors by the first major peak moving to the right. Now, when the coherence magnitude becomes low, that does not mean the data is less trustworthy; the low coherence values reflect the degree of nonlinearity in the system [
9]. Nevertheless, the significant drop in the coherence of the HVM group could also be a result of the calculation of the coherence function and the effect of the cross-axis components [
13,
15,
16].
It appears that the literature would agree that tissue thixotropy and voluntary and involuntary muscle activation are the main sources of the resulting nonlinearity in human response under varying vibration magnitudes. Therefore, the resulting nonlinearity can be shifted to softening or stiffening depending on the amount of the voluntary muscle activation of the supine human. For instance, the current work showed that the subjects demonstrated softening behavior in the LVM, and the translation into stiffening behaviors under HVM can be related to more involvement of voluntary muscle activation. Indeed, videos showed that subjects were bracing their bodies when the road became bumpier under HVM. This could also be similar to the stiffening experiences the subjects encountered under increasing static acceleration in the literature [
6,
7]. Also, the disappearance of the second peak in the transmissibility at the torso and pelvis in the current work may add another layer of information regarding the stiffening behavior. It may indicate an increasing coupling effect between the body parts because of the tonic activation of major muscles in the body; this would increase the coupling between the body parts and may result in a system with lower degrees of freedom.
One limitation of this study is that the input motion was measured at the litter base, which was connected to the vehicle floor, and not at the interface between the supine human body and the supporting surface [
17]. That was done because data collected by the accelerometer at the interface were corrupted and were not trusted for use in the analysis. Still, the data collected at the litter base showed consistent trends across all subjects and all segments of the human participants and could present realistic behaviors. Another technical issue that may affect the results of this work is that with higher vibration magnitude and considerable body movements that may involve translational and rotational motions, the projection of the data in the body coordinate system may have suffered some inaccuracy even though the data from the accelerometers were carefully projected [
17]. In spite of these concerns, the transmissibility and coherence graphs showed repeatable behaviors with statistically significant values for most cases. Because of the effect of inter- and intrasubject variability, there is a chance that the results of this work could change when using more subjects. Nevertheless, the number of subjects used in this study was not out of the scope of the number of subjects used in similar studies on the nonlinearity of human response to WBV. For example, four subjects were used in the study by Hinz and Seidel [
10], and eight subjects were used by Matsumoto and Griffin [
3] in their investigations on the nonlinearity of seated subjects in WBV. Furthermore, twelve subjects were used by Huang and Griffin [
1] in their study on the effect of nonlinearity on the biodynamic response of semisupine humans during WBV.
The new finding of this work could be very important for future modification of transport systems working in severe off-road conditions; therefore, more work should be conducted in the future to confirm these results. Future work may include verifying the results in a lab setting, increasing the number of subjects, and conducting accurate measurements of the input vibration at the interface between the human body and the contact surfaces.


