Article

Satellite- and Reanalysis-Based Assessment of Wind, Terrain, and Burn Severity During the May 2022 Suleiman Range Wildfire

State Key Laboratory of Fire Science, University of Science and Technology of China (USTC), Hefei 230027, China
*
Author to whom correspondence should be addressed.
Fire 2026, 9(7), 283; https://doi.org/10.3390/fire9070283
Submission received: 6 April 2026 / Revised: 2 June 2026 / Accepted: 25 June 2026 / Published: 6 July 2026

Abstract

Wind is a fundamental driver of wildfire behavior, yet wind–fire relationships remain poorly characterized in the mountainous regions of South Asia, where ground-based observations are scarce. This study examines the wildfire in the Suleiman Range of western Pakistan for May 2022, integrating Moderate Resolution Imaging Spectroradiometer (MODIS) active fire detection, Landsat-derived burn severity, ECMWF Reanalysis v5 (ERA5) meteorological data, and Shuttle Radar Topography Mission (SRTM) topography data. Twenty-nine wildfire-classified detections (Fire Radiative Power, FRP range 6.0–52.1 megawatts (MW)) were analyzed across the Sherani, Musakhel, and Dera Ismail Khan (D.I. Khan) districts between 18 and 29 May 2022. The ERA5 wind speed at the fire points was moderately positively correlated with the FRP, although strong collinearity with temperature prevented the separation of the effects of wind and temperature. The wind direction was highly consistent throughout the event. Spread events were defined as consecutive detection pairs; among pairs separated by more than 2 km, four were aligned with the ERA5 downwind direction. These findings are consistent with synoptic winds broadly contributing to eastward fire progression, whereas local-scale spread was likely modulated by the terrain-channeled winds that ERA5 cannot resolve at its ~27 km grid scale. Elevation was strongly negatively correlated with the FRP. The burn severity analysis indicated that approximately 86 km2 of burn occurred, predominantly at low-to-moderate severity. This integrated workflow offers a transferable template for characterizing wildfire behavior in data-sparse mountainous regions.

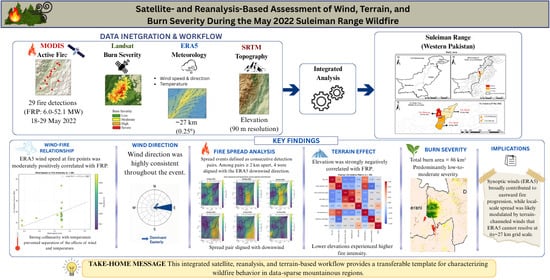
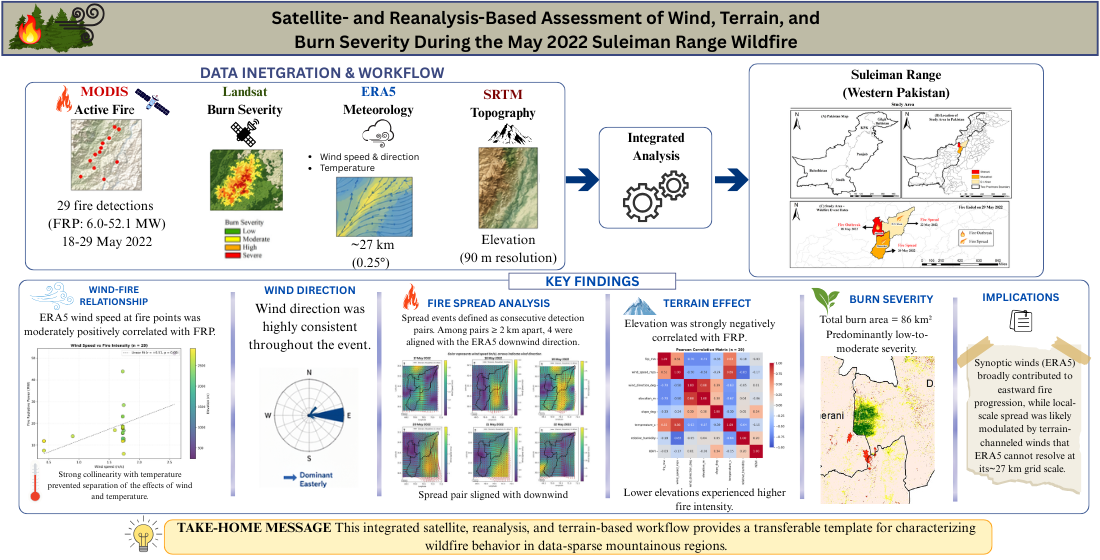
Graphical Abstract

1. Introduction

1.1. Global Perspective on Wildfire Escalation and Climate Feedback

Wildfires have emerged as a dominant force of ecological and atmospheric transformation, annually affecting between 300 and 400 million hectares of land [1] and increasingly evolving into “megafires” of unprecedented intensity and duration [2]. The relationship between wildfire activity and climate change is increasingly recognized as a positive feedback loop, in which rising temperatures and prolonged droughts create highly flammable conditions while resulting in emissions that further accelerate the greenhouse effect [2,3]. This phenomenon is particularly acute in high-altitude and arid regions where vegetation moisture is low and ecosystem resilience is low [4]. Recent global syntheses such as the State of Wildfires 2023–2024 report further documenting how the 2023–2024 fire season produced record-breaking emissions in Canada, the largest single recorded wildfire in the European Union (Greece), and widespread fires in western Amazonia, underscoring the global character of recent fire-regime change [5].

1.2. Regional Vulnerability: Pakistan’s Forest Ecosystem Under Threat

Pakistan faces unique challenges in wildfire management, with limited forest cover estimated at approximately 4.5% of the total land area [6]. The northern highlands and western mountainous ranges, including the Hindu Kush and Suleiman ranges, are the nation’s primary timber and watershed reservoirs, yet they are increasingly besieged by fire [7,8].
This vulnerability was starkly demonstrated in May 2022, when a wildfire in the Suleiman range burned for almost two weeks and destroyed an estimated 35% of a UNESCO World Heritage Pinus gerardiana (Chilghoza pine) forest [9,10]. Historically, fire management in Pakistan has been hampered by a lack of real-time observations and sparse forest road networks that delay suppression responses [3,8], creating an urgent need for localized research that identifies the specific drivers of fire behavior in this region [8,11,12,13].
Recent regional studies have begun to document this growing fire pressure. Multidecadal MODIS analyses of the Hindu Kush–Himalaya region revealed that fire frequency has increased sharply during the past decade, with pronounced pre-monsoon peaks in March and April [4]. Ground-based assessments of subtropical chir pine forests in northern Pakistan have characterized vegetation layer-specific severity, revealing that surface and intermediate-canopy strata are most affected by anthropogenic ignitions during the dry season [14], whereas machine-learning vulnerability mapping of the same forest type identifies steep, dry, south-facing slopes as the primary high-risk landscape units [12]. However, these regional studies have focused almost exclusively on fire occurrence and susceptibility mapping, with only rare quantitative analyses of wind–fire interactions during specific high-impact events.

1.3. Meteorological and Topographic Drivers of Fire Behavior

Wind is one of several drivers of fire behavior, alongside fuels and topography, and its relative role varies across regions and fire events. Wind is widely recognized as a primary driver of fire spread and is often more critical than temperature alone in determining the actual behavior of a fire front [15]. Wind-driven fires are characterized by significantly greater canopy damage and faster rates of spread and can overcome traditional fuel breaks [16], and in urban-adjacent forests such as Margalla Hills in Islamabad, the direction of the wind has been shown to influence both the length of the fire front and the deployment of firefighting assets [15]. The mountainous fire systems of the broader Himalayan region offer informative comparisons: microlevel analyses in the northwestern Himalayas indicate that local topography, weather, and human activity jointly govern fire spread [17]. In the broader Himalayan region, a 2025 analysis of atmospheric conditions during wildfire events in the Indian Himalayan region of Uttarakhand revealed that the El Niño–Southern Oscillation and Indian Ocean Dipole phases, together with pre-fire-season precipitation patterns from western disturbances, were dominant atmospheric drivers of wildfire spread, whereas the influence of wind speed varied with the prevailing synoptic regime [18]. These contrasting findings highlight that the role of wind in mountainous fire regimes is event- and region specific.
Topography modulates fire behavior through elevation, slope, and aspect, which create microclimates that influence fuel moisture and ignition probability [19,20]. Slope is a particularly critical factor in fire acceleration, as the preheating of fuels occurs more rapidly on steeper inclines [20], whereas aspect controls solar exposure and thus fuel dryness [4]. Environmental risk assessments in the Palas Valley of Kohistan have shown that the combination of steep slopes and south-facing aspects creates high-risk zones during the pre-monsoon season [19]. Understanding these topographical gradients is essential for identifying high-risk areas, as they dictate the physical constraints within which fires must operate [21]. However, the practical use of meteorological reanalysis to characterize wind–fire interactions in such terrain is constrained by spatial resolution. Coarse-resolution reanalysis products (e.g., ERA5, ~27 km grid) are known to underestimate near-surface wind speeds by 30–50% in complex terrain and cannot resolve terrain-channeled local winds [22,23]. This resolution limit has important implications for how reanalysis-based fire studies should be interpreted in mountainous regions such as the Suleiman Range.

1.4. Synthesis and Study Rationale

Despite the growing global fire literature, integrated analyses combining multispectral satellite data with reanalysis meteorology and topographic information remain limited in the Pakistani context [24,25], and the unique topography of western Pakistan in particular has been underrepresented in regional fire science. The scientific contribution of the present work is therefore threefold. First, it provides the first integrated, multidataset characterization of a high-severity wildfire event in the Suleiman Range, a mountainous subregion that houses Pakistan’s largest Pinus gerardiana reserves. Second, it provides an explicit workflow by which publicly available satellite and reanalysis data can be combined to extract event-scale wind–fire metrics—including circular statistics for wind direction and a noncircular spread-event alignment test—in regions lacking dense ground-based observations. Third, it confronts the methodological limit of coarse-resolution reanalysis in topographically complex landscapes, incorporating this limit explicitly into the design and interpretation of the analysis rather than treating it only as a post hoc caveat.
This study aims to address these gaps by combining satellite remote sensing, burn severity mapping, and statistical correlation analysis to characterize the influence of wind on fire spread and intensity. While multiple factors govern wildfire behavior in mountainous terrain, the present study is deliberately scoped as an exploratory case study focused on wind alongside topography. Our objective is not to construct a multivariate predictive model but to determine whether measurable wind–fire relationships can be identified from publicly available datasets in a data-sparse region. Specifically, we address the following questions: (1) How do the wind speed and direction vary temporally during the event? (2) What is the relationship between the wind conditions and the FRP? (3) How do the elevation and slope covary with the FRP? (4) What are the spatial patterns of burn severity, and how do they relate to wind exposure and forest type? In addressing these questions, we also examine the methodological implications of using coarse-resolution reanalysis to characterize fire behavior in topographically complex landscapes—a question of relevance to fire studies across the broader Hindu Kush–Himalaya region.

2. Study Area

2.1. Geographic Location and Topographical Configuration

This investigation focuses on the rugged mountainous terrains of western Pakistan, encompassing a significant portion of the Khyber Pakhtunkhwa (KPK) Province and the northern reaches of Balochistan (Figure 1). This region is geographically defined by its latitudinal extent from approximately 31° N to 37° N and a longitudinal span between 70° E and 77° E [26,27]. The landscape is dominated by the high mountain chains of the Hindu Kush and the Western Himalayas, with elevations ranging drastically from low-lying plains to peaks exceeding 7000 m (m) [26]. Specifically, in the Hindu Kush Himalaya range, the study sites are located within hilly landscapes where the elevation typically fluctuates between 2000 and 5500 m [28]. These areas are characterized by complex Cretaceous and Tertiary sedimentary strata and deep relief resulting from significant tectonic uplift [29]. The terrain is further complicated by steep slopes and varied aspects, which act as primary landscape matrices that influence soil age, hydrology, and the eventual structure of plant communities [30].

2.2. Climatic Regimes and Meteorological Variability

The climate within the study area is highly diverse, reflecting extreme altitudinal gradients. In the northern highlands, the climate is predominantly temperate to Alpine, while the southern arid regions of Balochistan experience xeric conditions [28,31]. The temperature variations are extreme; summer maxima can reach between 35 °C and 40 °C, whereas winter minima in high-altitude zones frequently decrease to as low as −15 °C [31,32]. Precipitation patterns are notoriously unpredictable and follow a bimodal distribution, driven by the South Asian monsoon in summer and the western depression during the winter and spring [26,33]. Annual rainfall varies significantly by location, ranging from 30–300 mm in the arid Balochistan province to more than 1200 mm in the more humid Western Himalayan belts [28,33]. Geostatistical analyses of meteorological stations such as Chitral, Dir, and Saidu Sharif have highlighted significant annual and monthly variability in these rainfall trends, which directly affects the fuel moisture content across the region [34].

2.3. Ecological Diversity and Forest Composition

The study area is home to a wide array of terrestrial ecosystems, which are categorized into distinct forest types on the basis of altitudinal zones and indicator species [35].
These include:
  • Moist temperate forests: when situated between 1600 and 3100 m, these forests are dominated by conifers such as Kail (Pinus wallichiana), deodar, fir, and spruce [20,36].
  • Subtropical pine forests: occupying the 800–1600 m zone, where Chirpine (Pinus roxburghii) is the dominant species and is often associated with broad-leaved trees such as Quercus incana and Olea ferruginea [36].
  • Dry temperate and xeric woodlands are found in the Koh-e-Safaid and Balochistan ranges; these feature unique species such as Chilghoza pine and the world’s oldest Juniper forests (Juniperus excelsa), the latter of which was declared a Biosphere reserve in 2013 [33,37].
  • Alpine scrub and coniferous forests: These areas are prevalent in the highest reaches of the Kurram Valley and HKH (Hindukush–Karakoram–Himalayas) ranges and are characterized by Sino-Japanese phytosociological types [37,38].
Collectively, natural vegetation covers approximately 4.8% to 5.1% of Pakistan’s total land area, with KPK accounting for the highest regional share at approximately 15.6% [39,40].
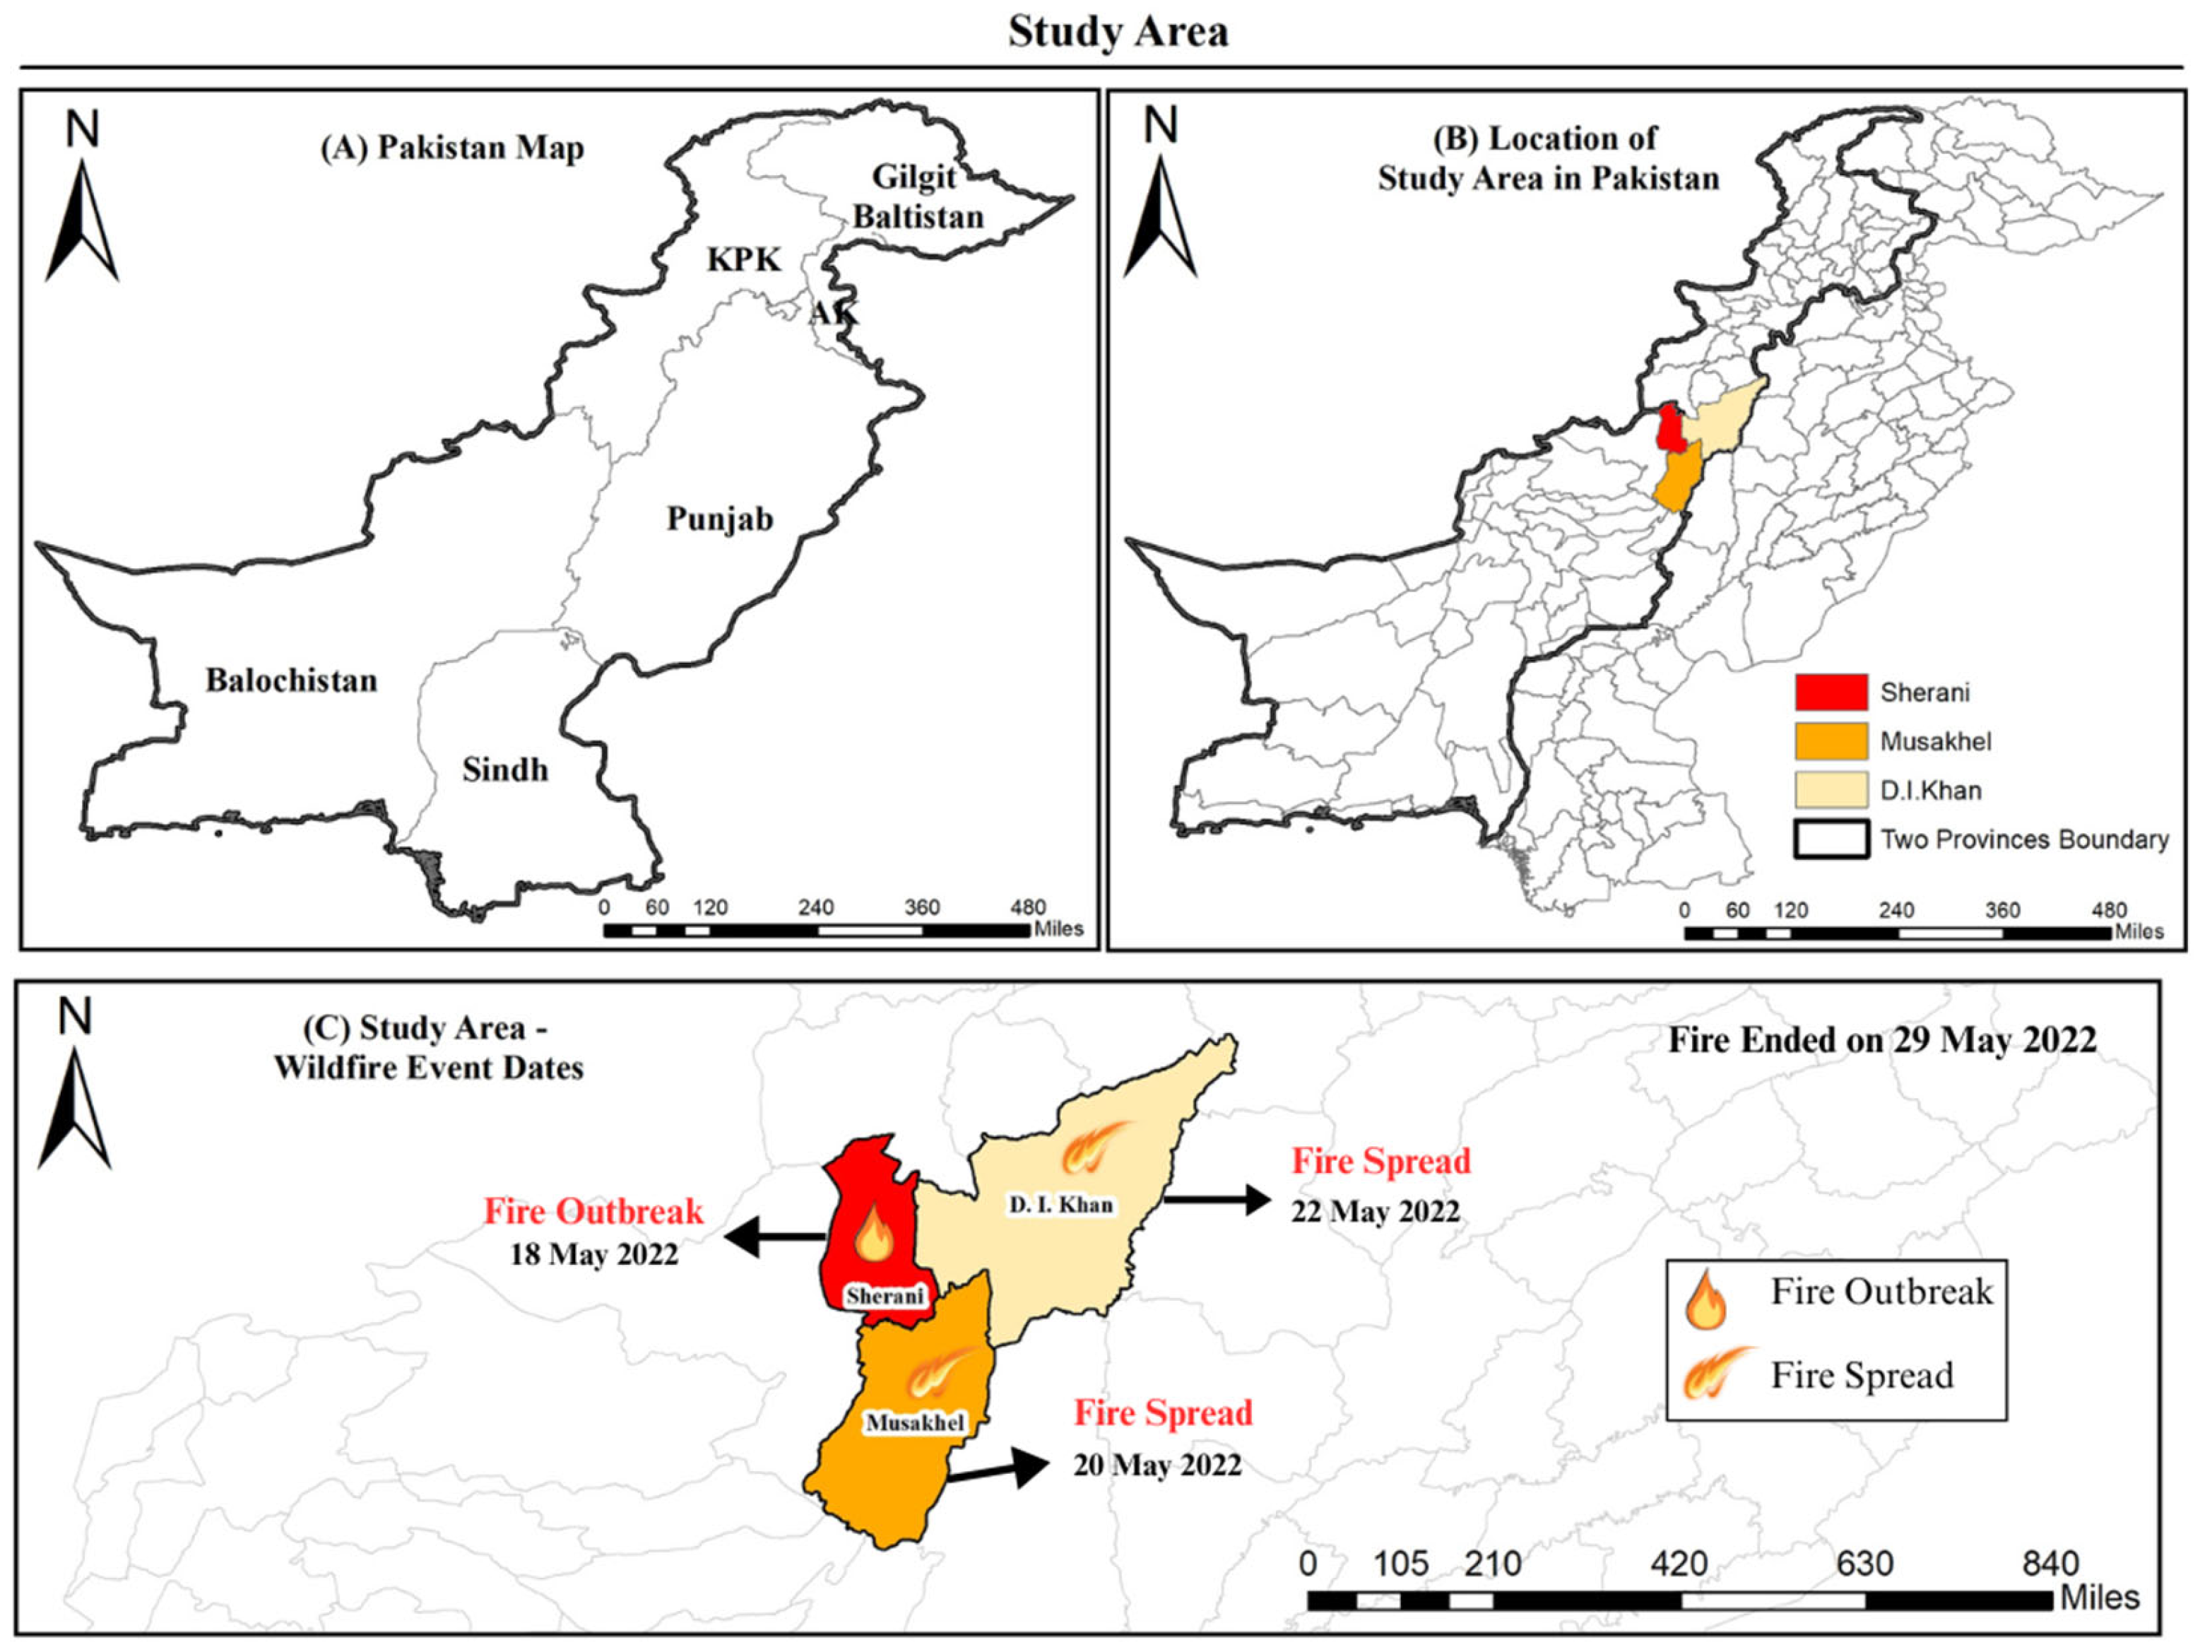
The wildfire began on 19 May 2022, in the Sherani–Musakhel border region and spread eastward toward D.I. Khan, persisting until 29 May (Figure 1C). The event affected approximately 86 km2, providing an opportunity to examine wind–fire interactions in a data-sparse region where climate projections indicate increasing fire risk.

3. Methods

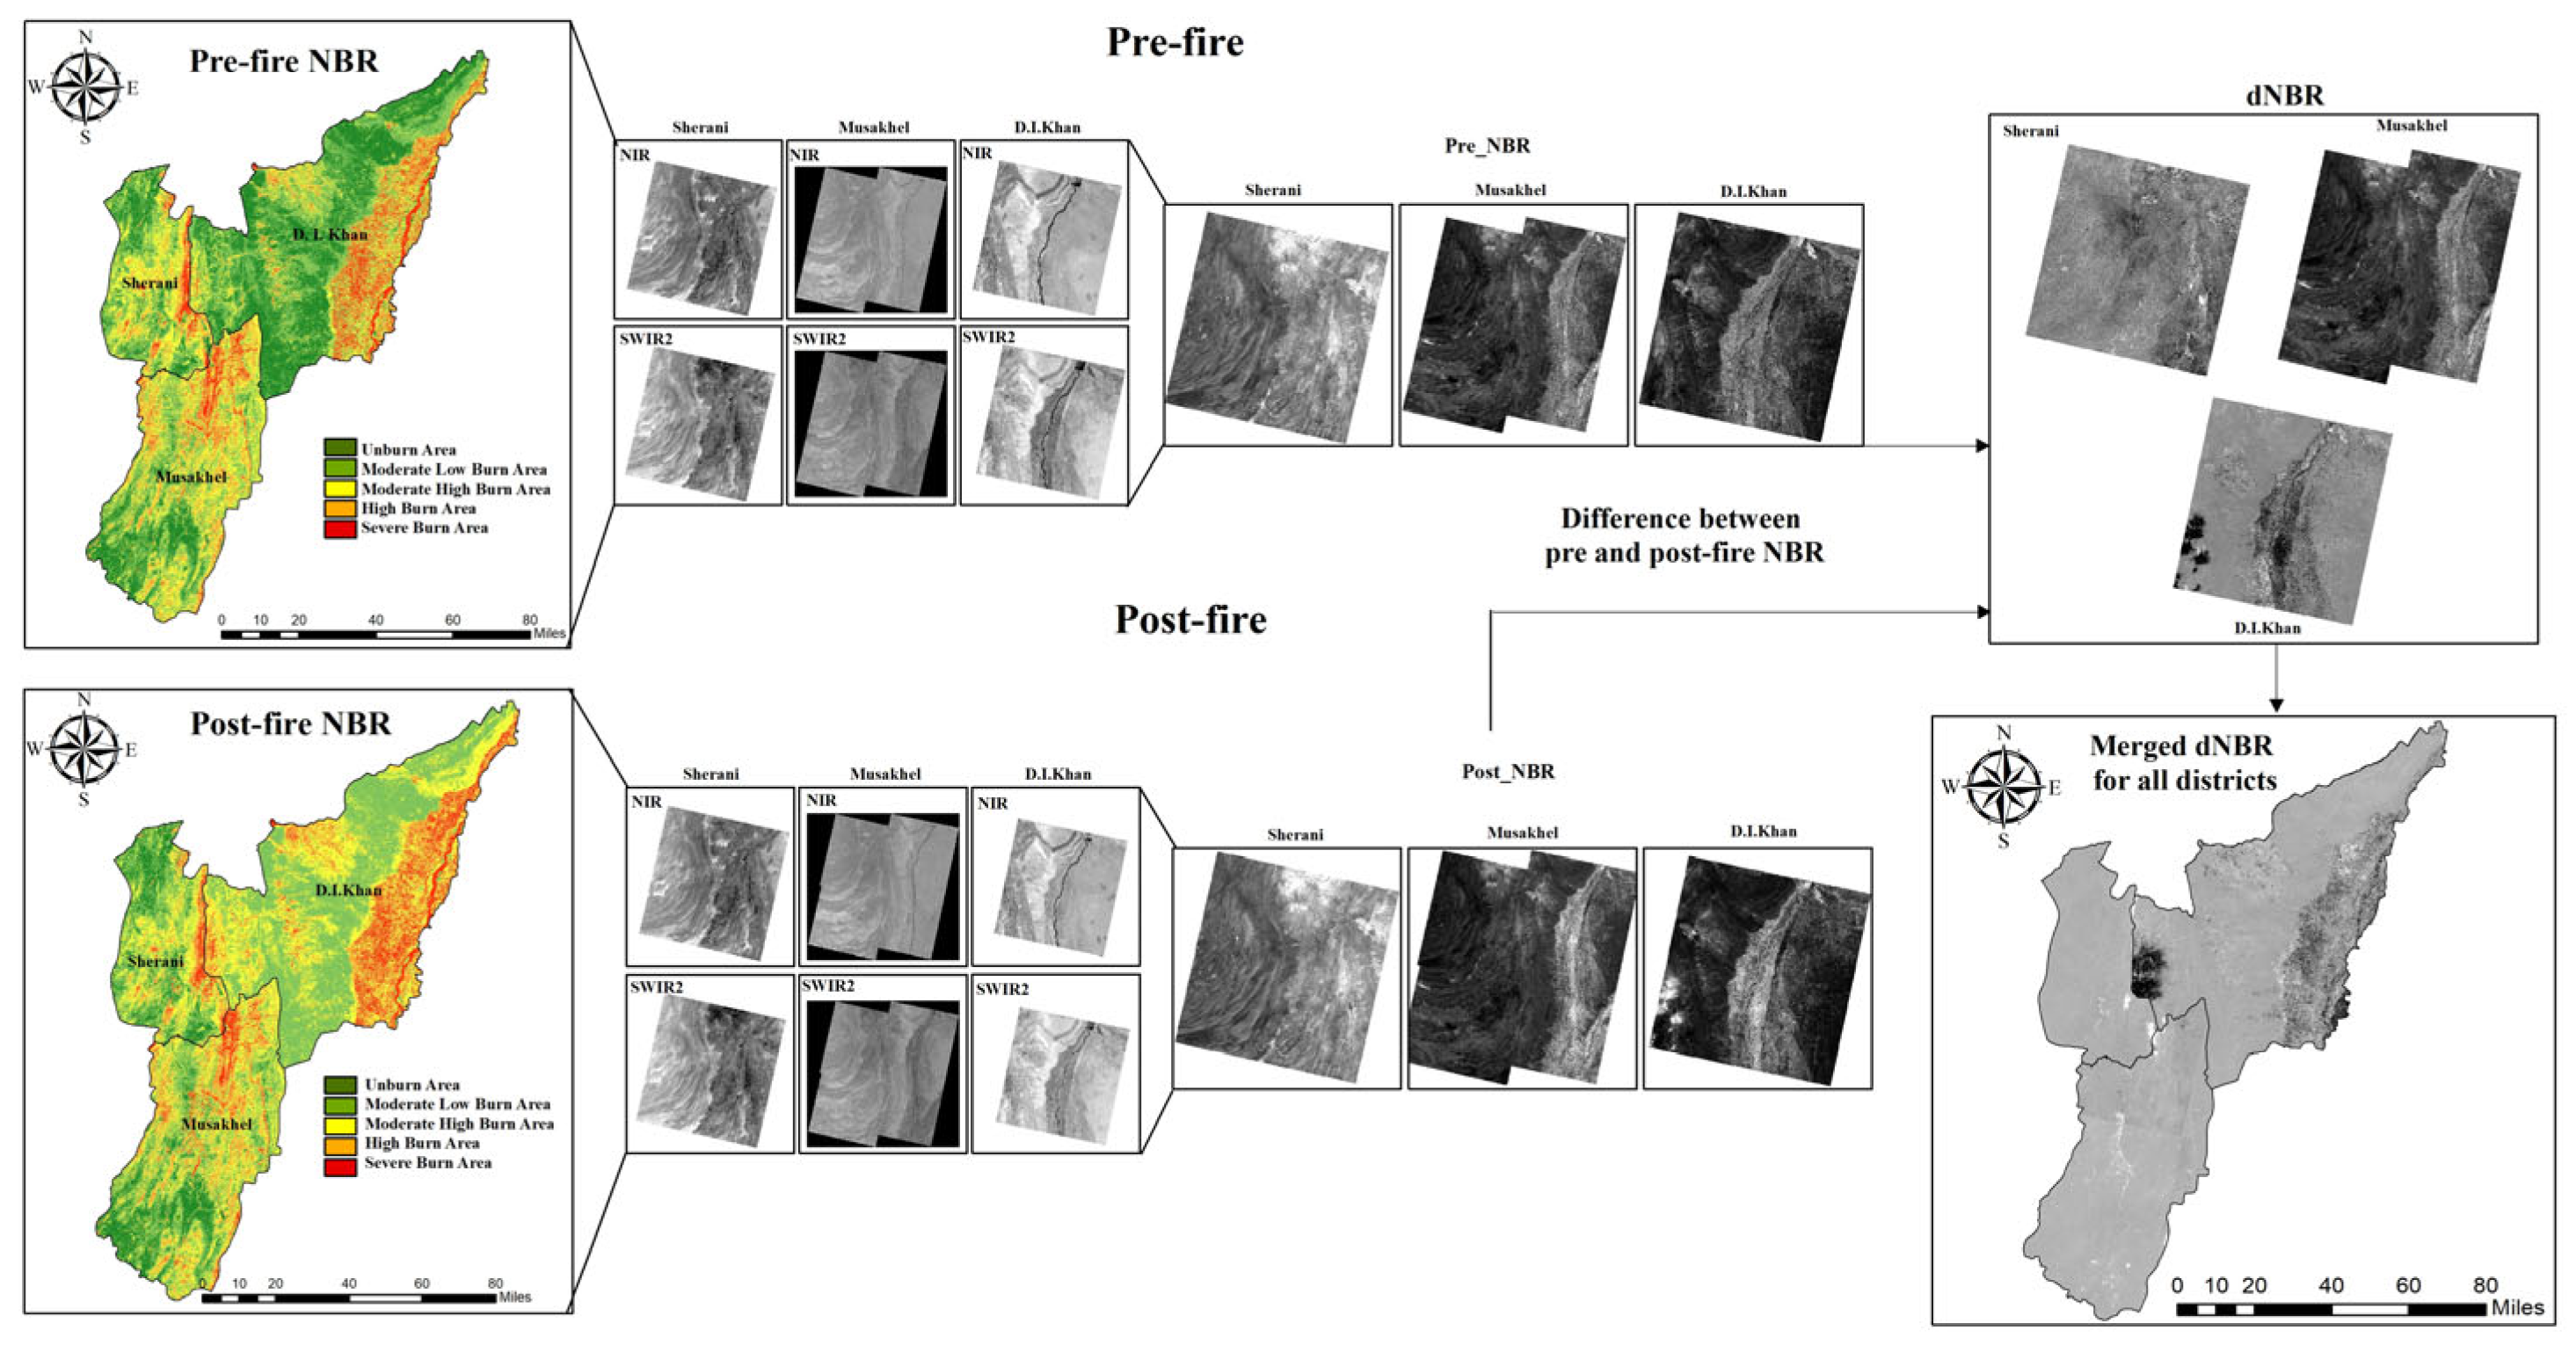
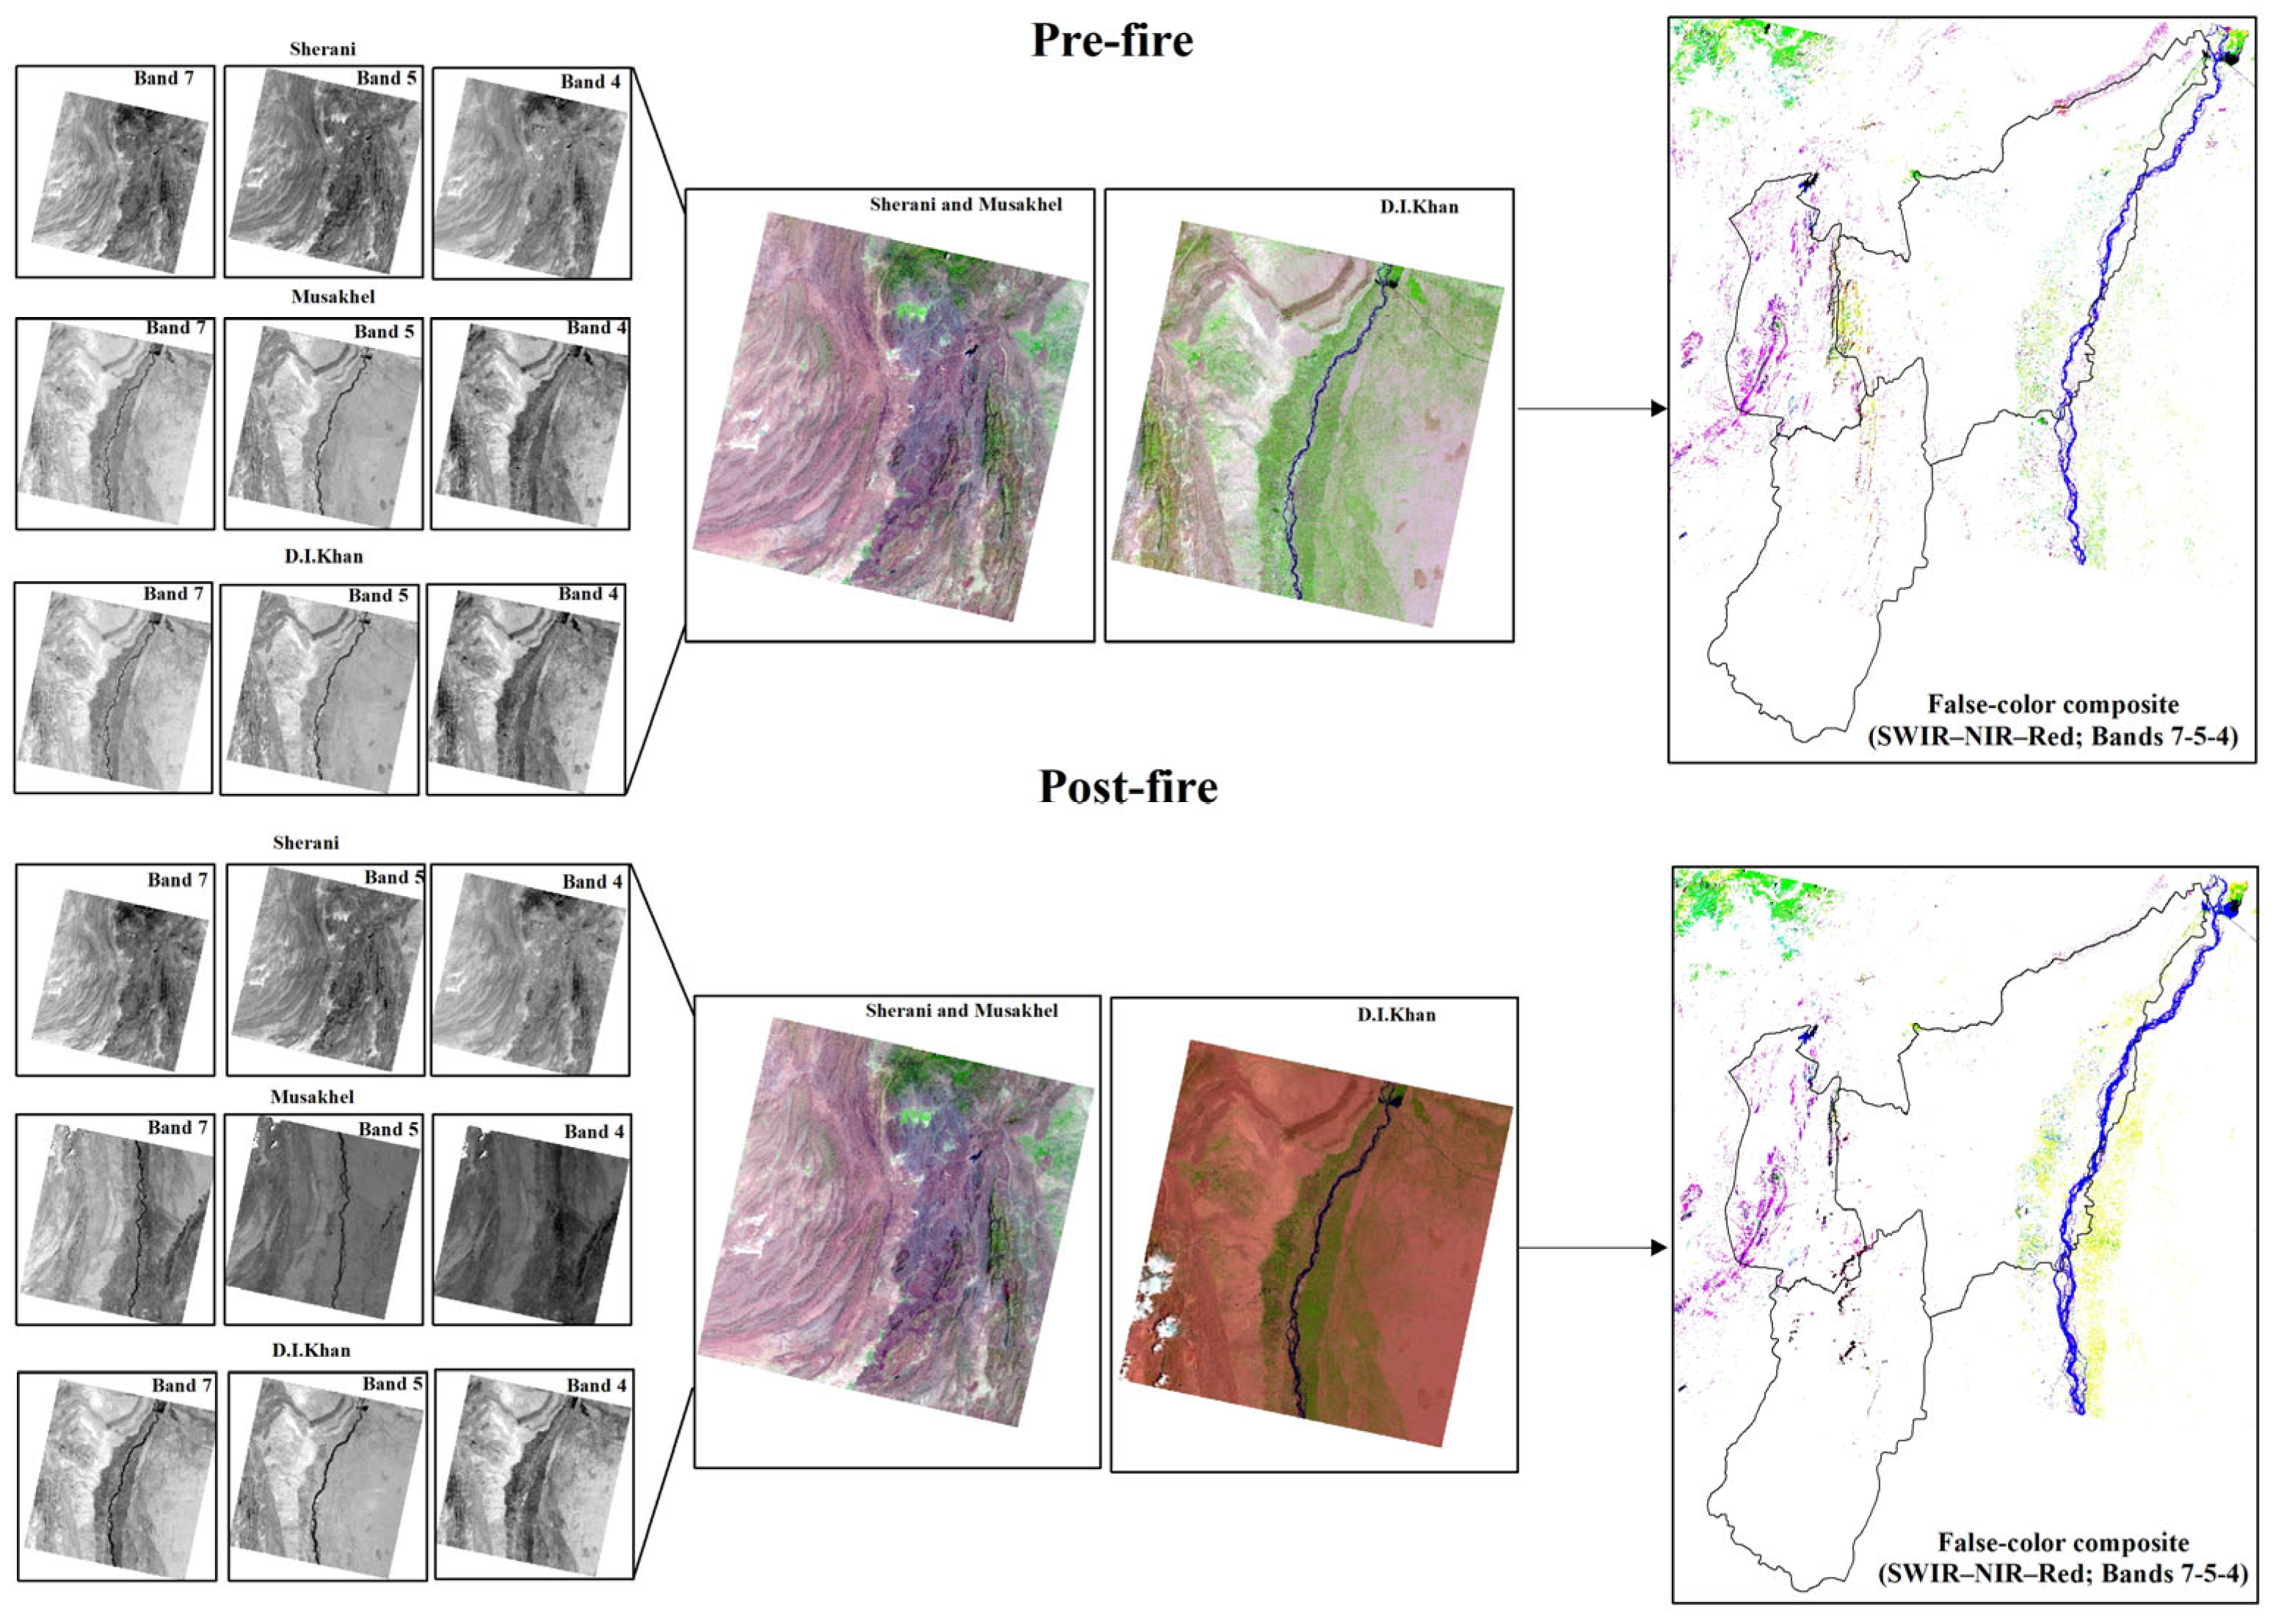
In this study, an integrated approach combining remote sensing data, meteorological reanalysis products, topographic information, and statistical analysis was used to investigate the relationship between wind conditions and wildfire behavior during the May 2022 fire event in western Pakistan. The methodological framework consisted of four main components: (1) acquisition and processing of satellite-derived fire data, (2) calculation of burn severity indices, (3) extraction of meteorological and topographic variables, and (4) statistical analysis of wind–fire relationships. The pre-fire and post-fire normalized burn ratio (NBR) calculations are shown in Figure 2, and a false-color Landsat composite highlighting the burn scar is shown in Figure 3.

3.1. Satellite Data Acquisition and Fire Detection

Active fire locations were obtained from the Fire Information for Resource Management System (FIRMS), which distributes data from the MODIS sensors aboard NASA’s Terra and Aqua satellites. We retrieved the complete MODIS Collection 6.1 active fire archive for the period 19–29 May 2022, covering the full duration of the wildfire event and the surrounding region (latitudes 24.3–35.8° N, longitudes 66.6–75.3° E; total of 1921 detections). The MODIS active fire algorithm identifies thermal anomalies at a spatial resolution of 1 km using a contextual approach that compares the brightness temperature of a candidate pixel with that of neighboring pixels [41]. Each type of fire detection includes the latitude, longitude, acquisition date and time, FRP, confidence level, and satellite platform.
FRP, measured in MW, represents the rate of radiant energy emitted by the fire and serves as a reliable proxy for fire intensity and combustion rate [42]. To isolate the May 2022 Suleiman Range wildfire from other fire activities in the region (predominantly low-confidence detections and agricultural burning across the Indus Plains), we applied a sequential filtering procedure (Table 1). First, we restricted the archive to a study area bounding box covering the Sherani, Musakhel, and D.I. Khan districts (31.30–31.80° N, 69.85–70.45° E), yielding 174 detections. Next, we classified each detection within the study area using a joint criterion based on confidence, FRP, and temporal persistence at the same location: detections meeting confidence ≥ 80 and FRP ≥ 10 MW and persistence ≥ 2 days were classified as wildfire_high, and detections meeting confidence ≥ 70 and FRP ≥ 5 MW were classified as wildfire_moderate. The detections for which the confidence was ≥50 and the FRP was <10 MW were treated as agricultural burns, and those for which the confidence was lower were excluded. The final wildfire-classified dataset included 29 detections (14 wildfire_high + 15 wildfire_moderate), which were used for all subsequent wind–fire analyses.

3.2. Assessment of Burn Severity Using NBR and dNBR

To quantify the ecological impact of the wildfire and assess spatial patterns of burn severity, we utilized Landsat 9 Operational Land Imager (OLI-2) imagery acquired before and after the fire event. Pre-fire imagery was obtained for 8 May 2022 (path 152, row 038), whereas post-fire imagery was acquired on 9 June 2022 (path 152, row 038), ensuring minimal cloud cover and consistent acquisition geometry.
The NBR was calculated using the near-infrared (NIR) and shortwave infrared (SWIR) bands, which are sensitive to vegetation health and burn scar detection, respectively. The NBR is defined as follows (Equation (1)):
N B R = ρ N I R ρ S W I R ρ N I R + ρ S W I R
where ρ N I R represents the reflectance in the near-infrared band (Band 5 for Landsat 8/9, 0.85–0.88 μm) and ρ S W I R represents the reflectance in the shortwave infrared band (Band 7, 2.11–2.29 μm). Healthy, photosynthetically active vegetation has high NBR values (typically >0.4), whereas burned areas have significantly lower NBR values because of decreased NIR reflectance and increased SWIR reflectance [44].
The dNBR was computed by subtracting the pre-fire NBR from the post-fire NBR (Equation (2)):
d N B R = N B R p r e - f i r e N B R p o s t - f i r e
dNBR values provide a continuous measure of burn severity, with higher positive values indicating more severe burning. Following standard classification approaches [44], we categorized dNBR values into four severity classes: low severity (dNBR 0.1–0.27), moderate severity (0.27–0.44), high severity (0.44–0.66), and severe (>0.66). Unburned areas where dNBR values fell below 0.1 were classified. All NBR and dNBR calculations were performed in QGIS 3.28 using the native raster calculator, and burned area polygons and shapefiles were made in Python (3.12.0) using the rasterio and numpy libraries, with final visualization and map production completed in ArcGIS 10.8.

3.3. Land Cover Classification

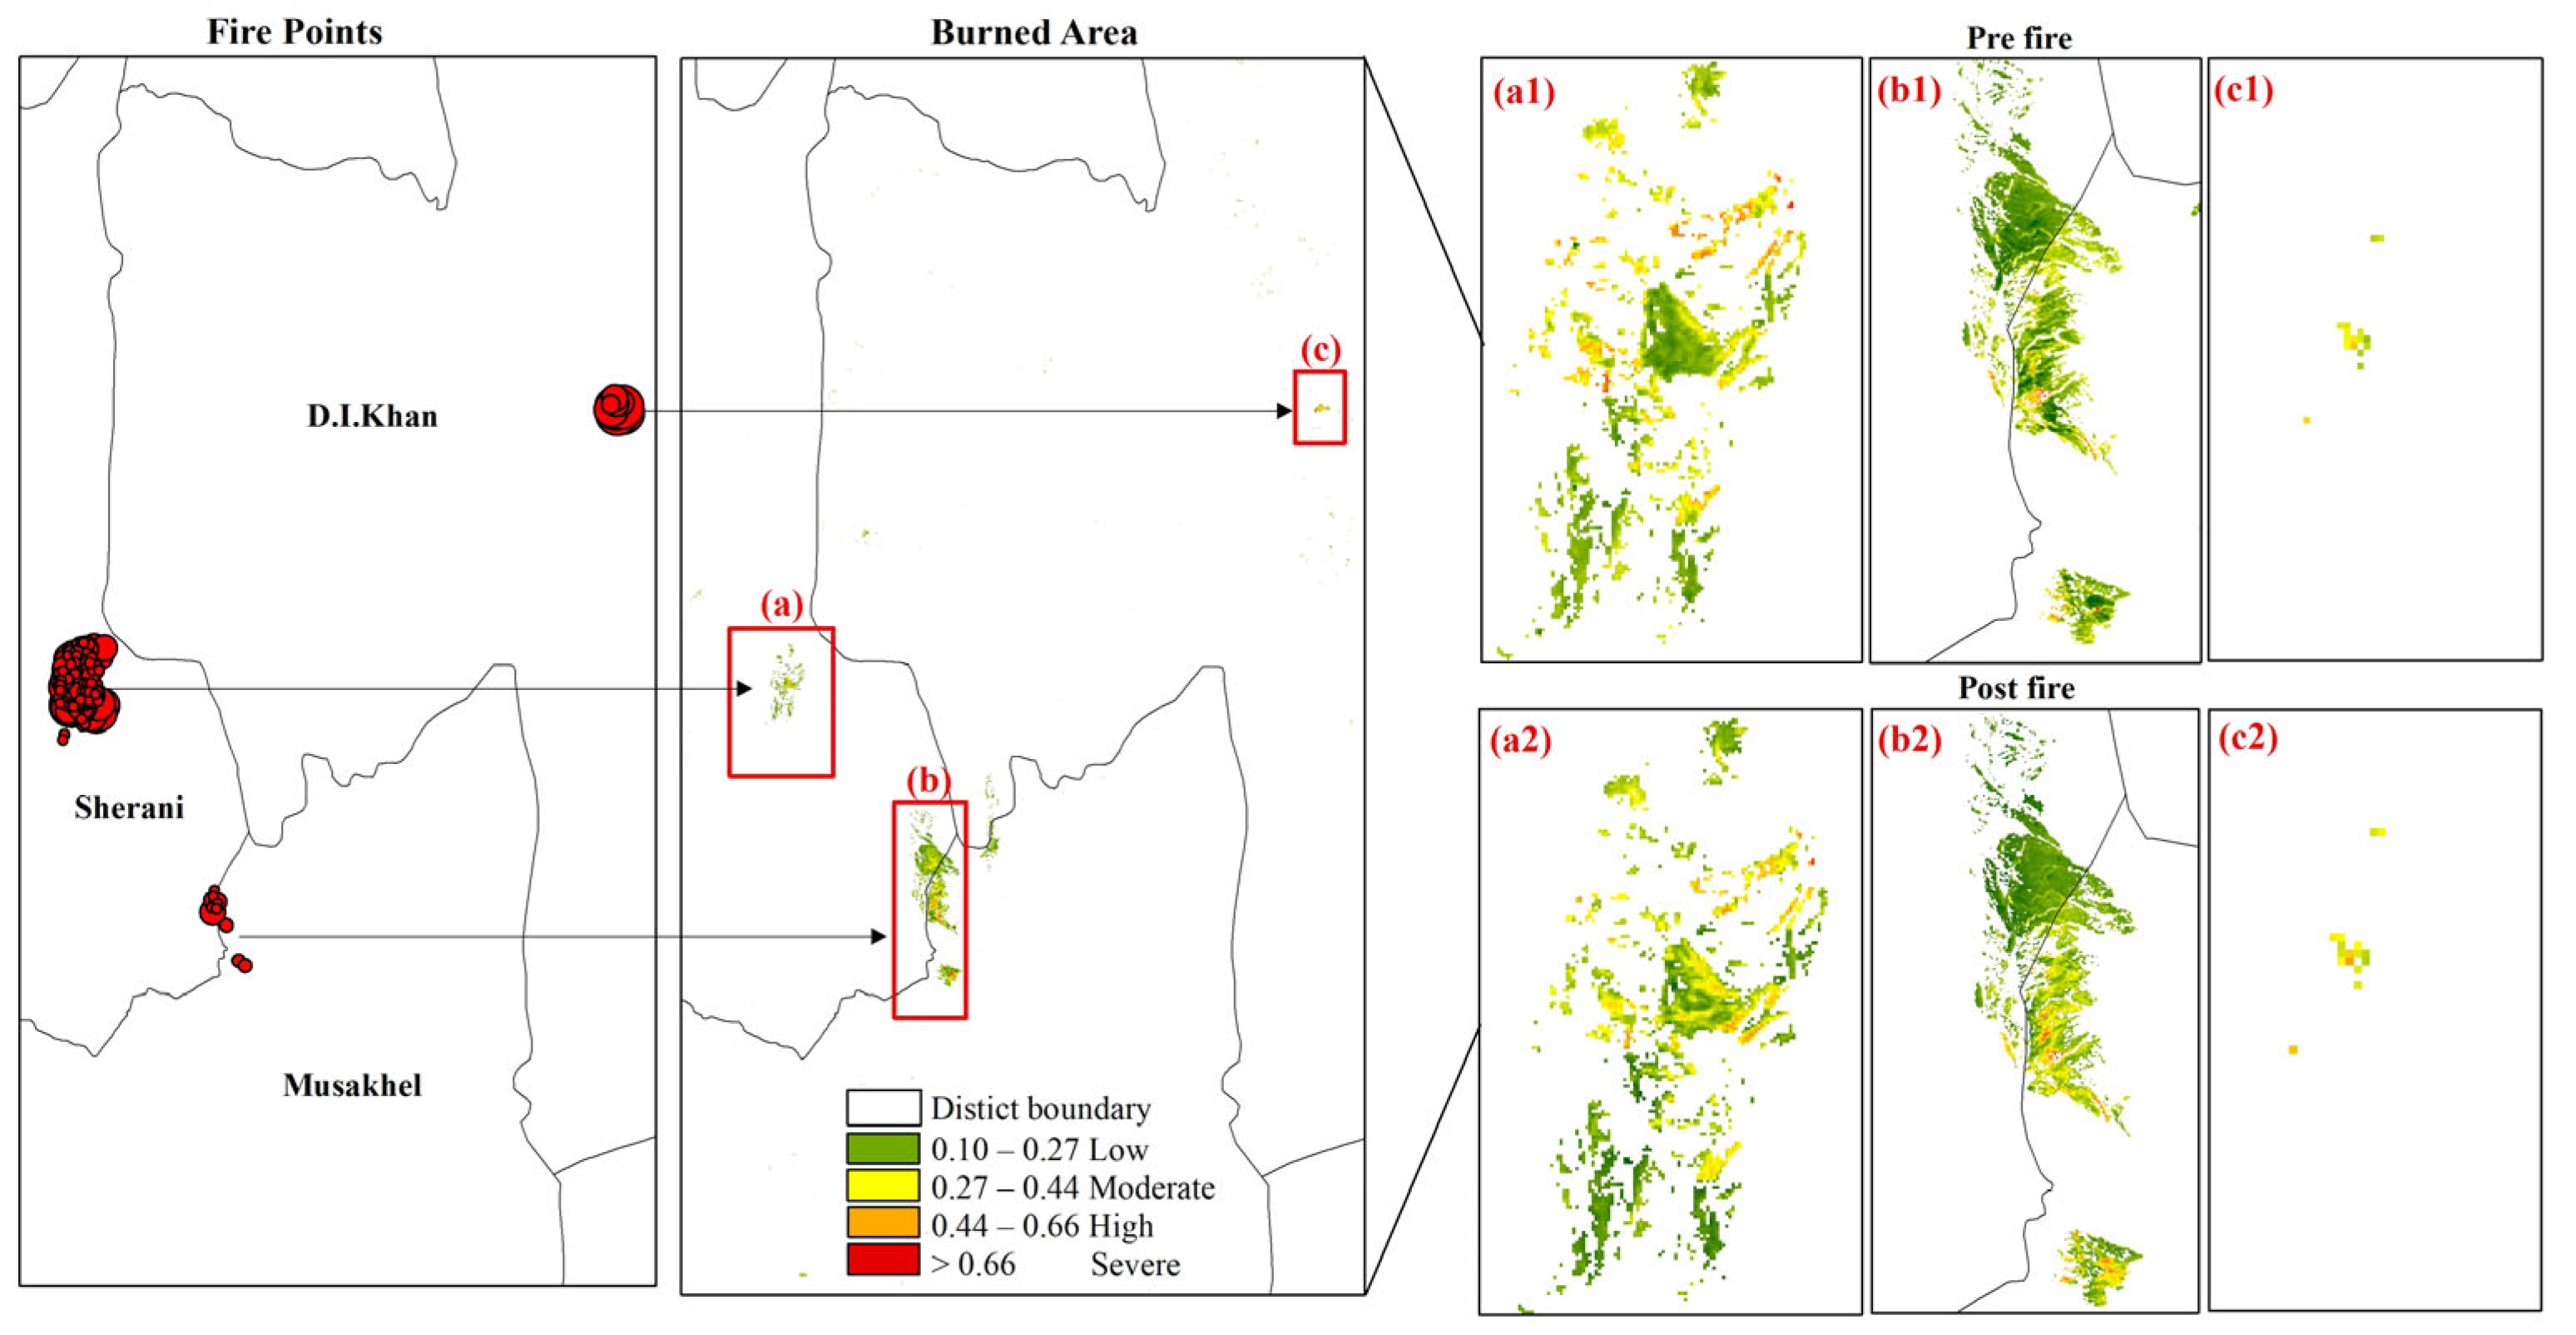
Land cover information was derived from the European Space Agency’s WorldCover 10 m resolution product for 2021, which provides global land cover mapping with 11 classes. For this study, we aggregated the original classes into two broad categories: vegetated (including trees, shrubs, grassland, and cropland) and non-vegetated (barren land, rock, and urban areas). This classification was used only to filter FIRMS fire points, excluding detections occurring on non-burnable land cover types such as barren land and urban areas. This step ensured that only fire points with available fuel were retained for analysis (Figure 4).
The spatial relationships between the number of active fires detected by the MODIS and changes in vegetation before and after the fire are shown in Figure 4. The main panel shows wildfire-classified fire points (red circles) distributed across the three districts, with the highest concentrations in Sherani and Musakhel. The black outline represents the 86 km2 burned area derived from the dNBR analysis. The three inset panels (1, 2, and 3) present the pre-fire and post-fire vegetation conditions for all three burned areas. In the pre-fire images, healthy vegetation appears green, while post-fire images reveal the burn scar as a reddish tone. This visual comparison reveals that the fire points fall within areas that experienced significant vegetation change, validating the results of the MODIS detection and dNBR classification.

3.4. Topographic Data

Topographic variables were derived from the NASA SRTM digital elevation model (DEM) at 30 m spatial resolution [45]. We downloaded the SRTM tile covering the study area, which spans latitudes 31° N to 32° N and longitudes 69° E to 70° E. Elevation values were extracted for each fire location using bilinear interpolation. Slope was calculated from the DEM using 3 × 3 moving window algorithms, which estimate the maximum rate of change in elevation between a central pixel and its neighboring cells [46].
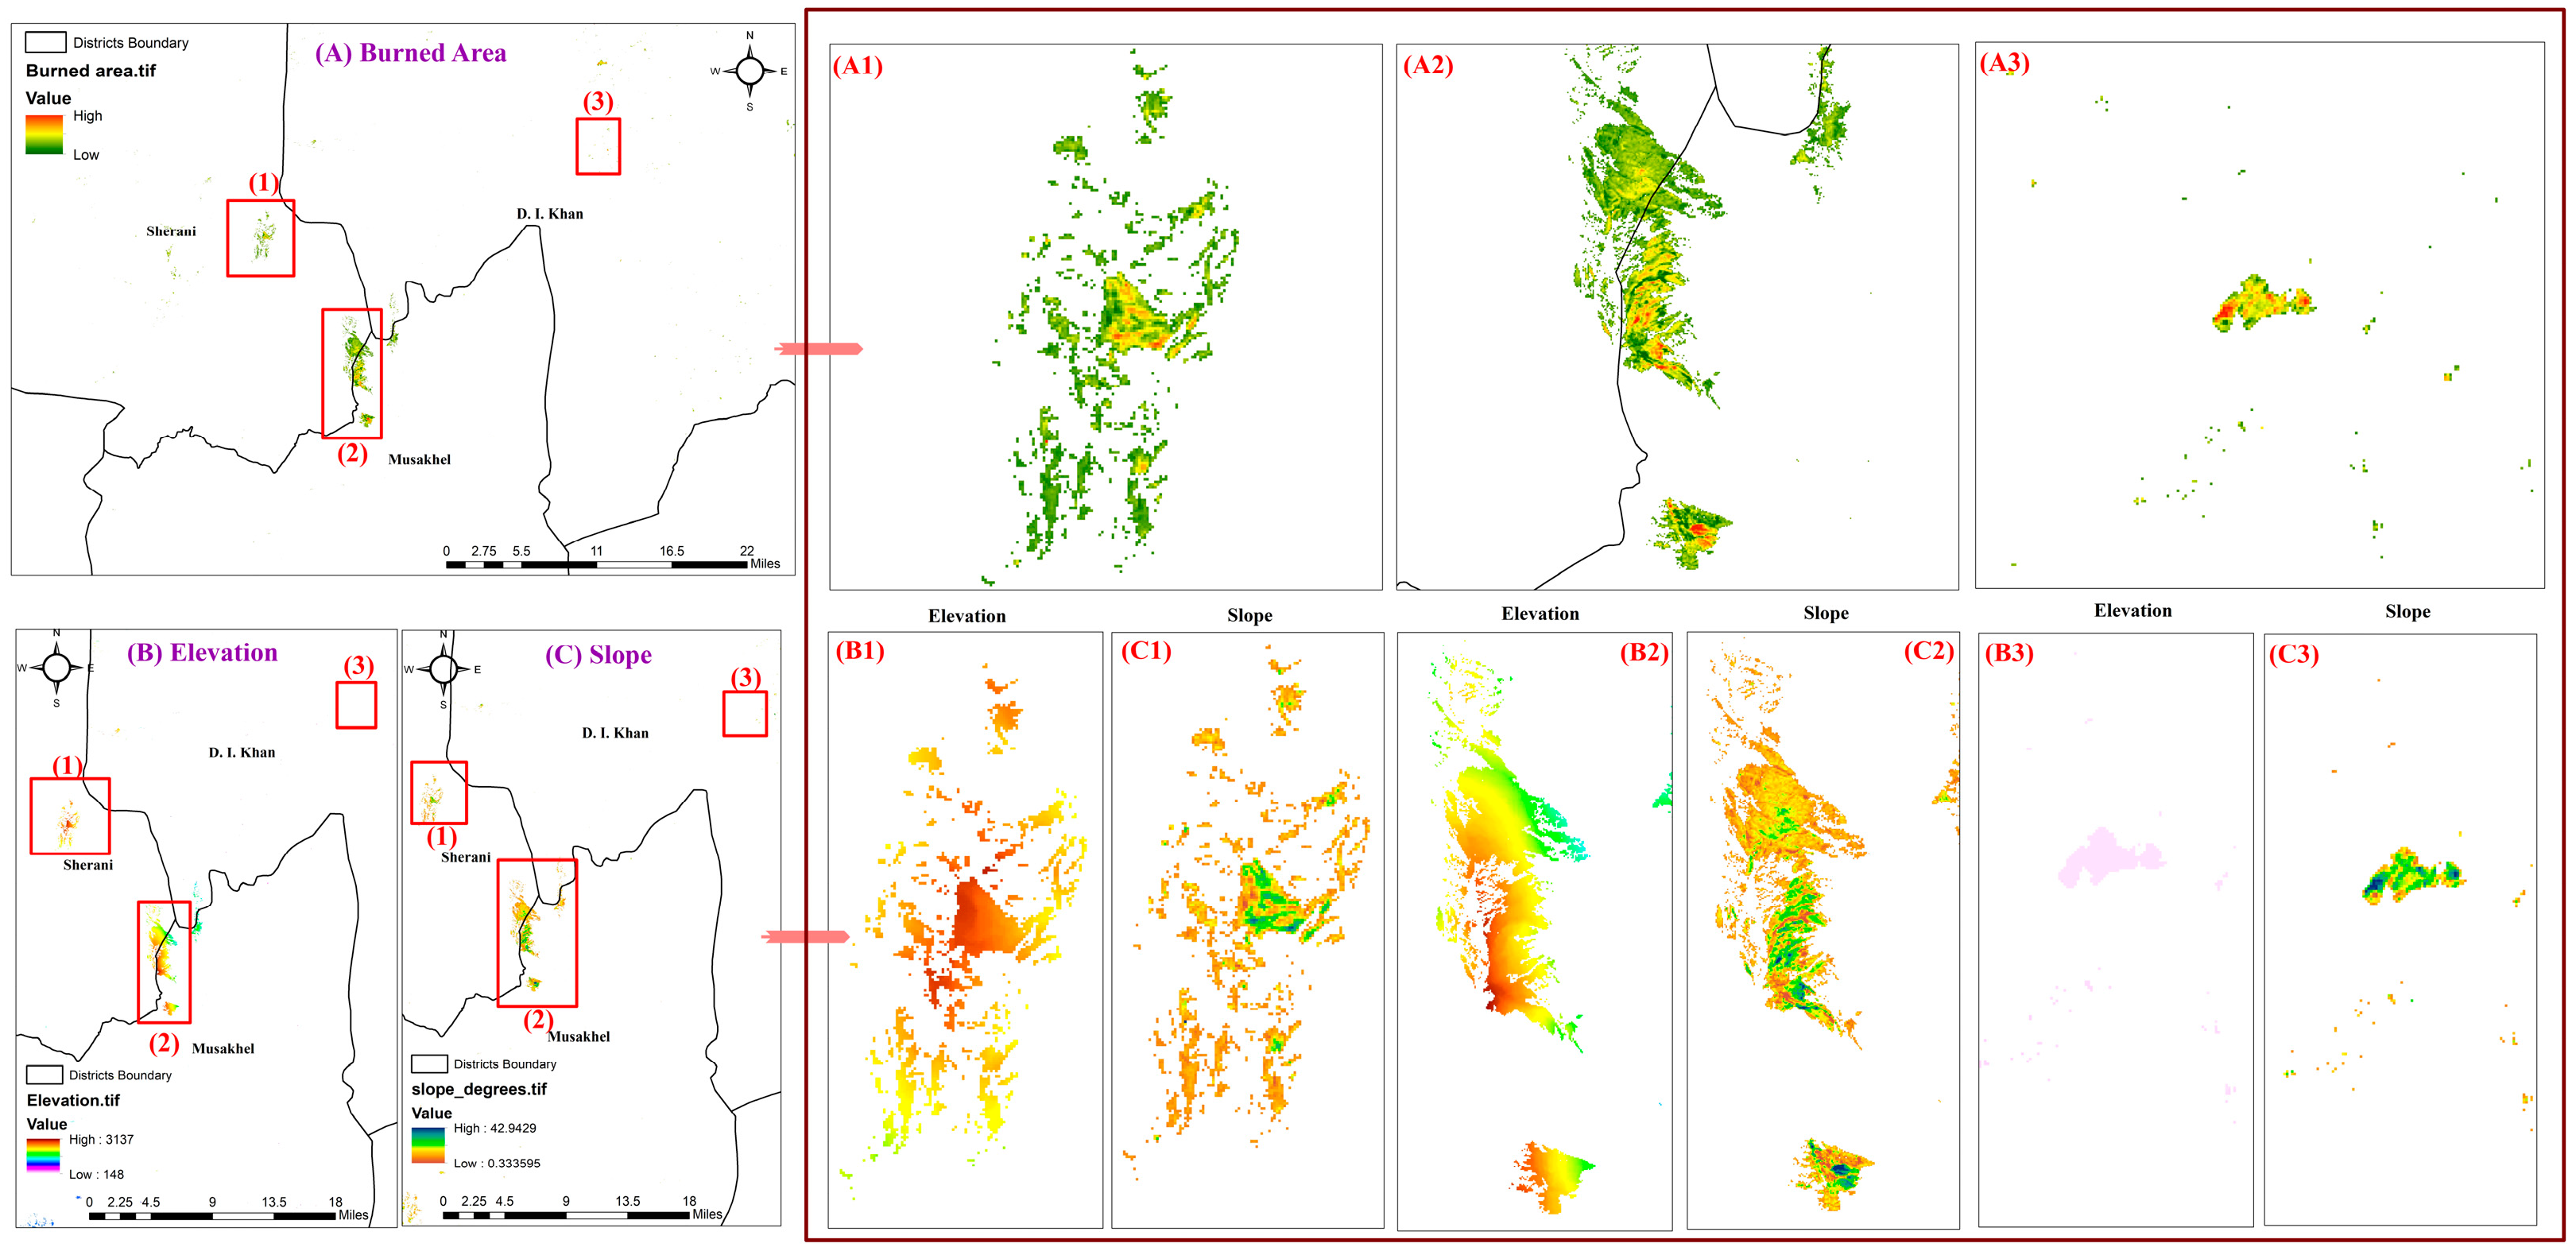
To focus the analysis on the extent of the burned area, we clipped both the elevation and slope rasters to the burned area polygon derived from the dNBR. The resulting elevation and slope maps, zoomed to the 86 km2 fire footprint, are shown in Figure 5.

3.5. Meteorological Data Extraction

Wind speed, direction, temperature, and humidity data were obtained from the European Centre for Medium-Range Weather Forecasts (ECMWF) ERA5 reanalysis product, which provides hourly global atmospheric data at 0.25° × 0.25° spatial resolution (approximately 27.8 km at the equator). ERA5 combines model simulations with observational data to generate consistent, high-quality atmospheric estimates [46]. For the study period (18–29 May 2022), we extracted 10 m u and v wind components (u10 and v10), 2 m temperature (t2m), and 2 m dewpoint temperature (d2m).
The wind speed was then calculated using the Euclidean norm of the u and v components (Equation (3)).
W S = u 2 + v 2
The wind direction, measured in degrees clockwise from north, was computed as follows (Equation (4)):
W D = ( 180 π × a r c t a n 2 ( u , v ) ) m o d 360
For each active fire detection event, we extracted the nearest ERA5 grid cell in both space and time. The temperature was converted from Kelvin to Celsius. Relative humidity was estimated from the temperature and dewpoint using the Magnus formula.
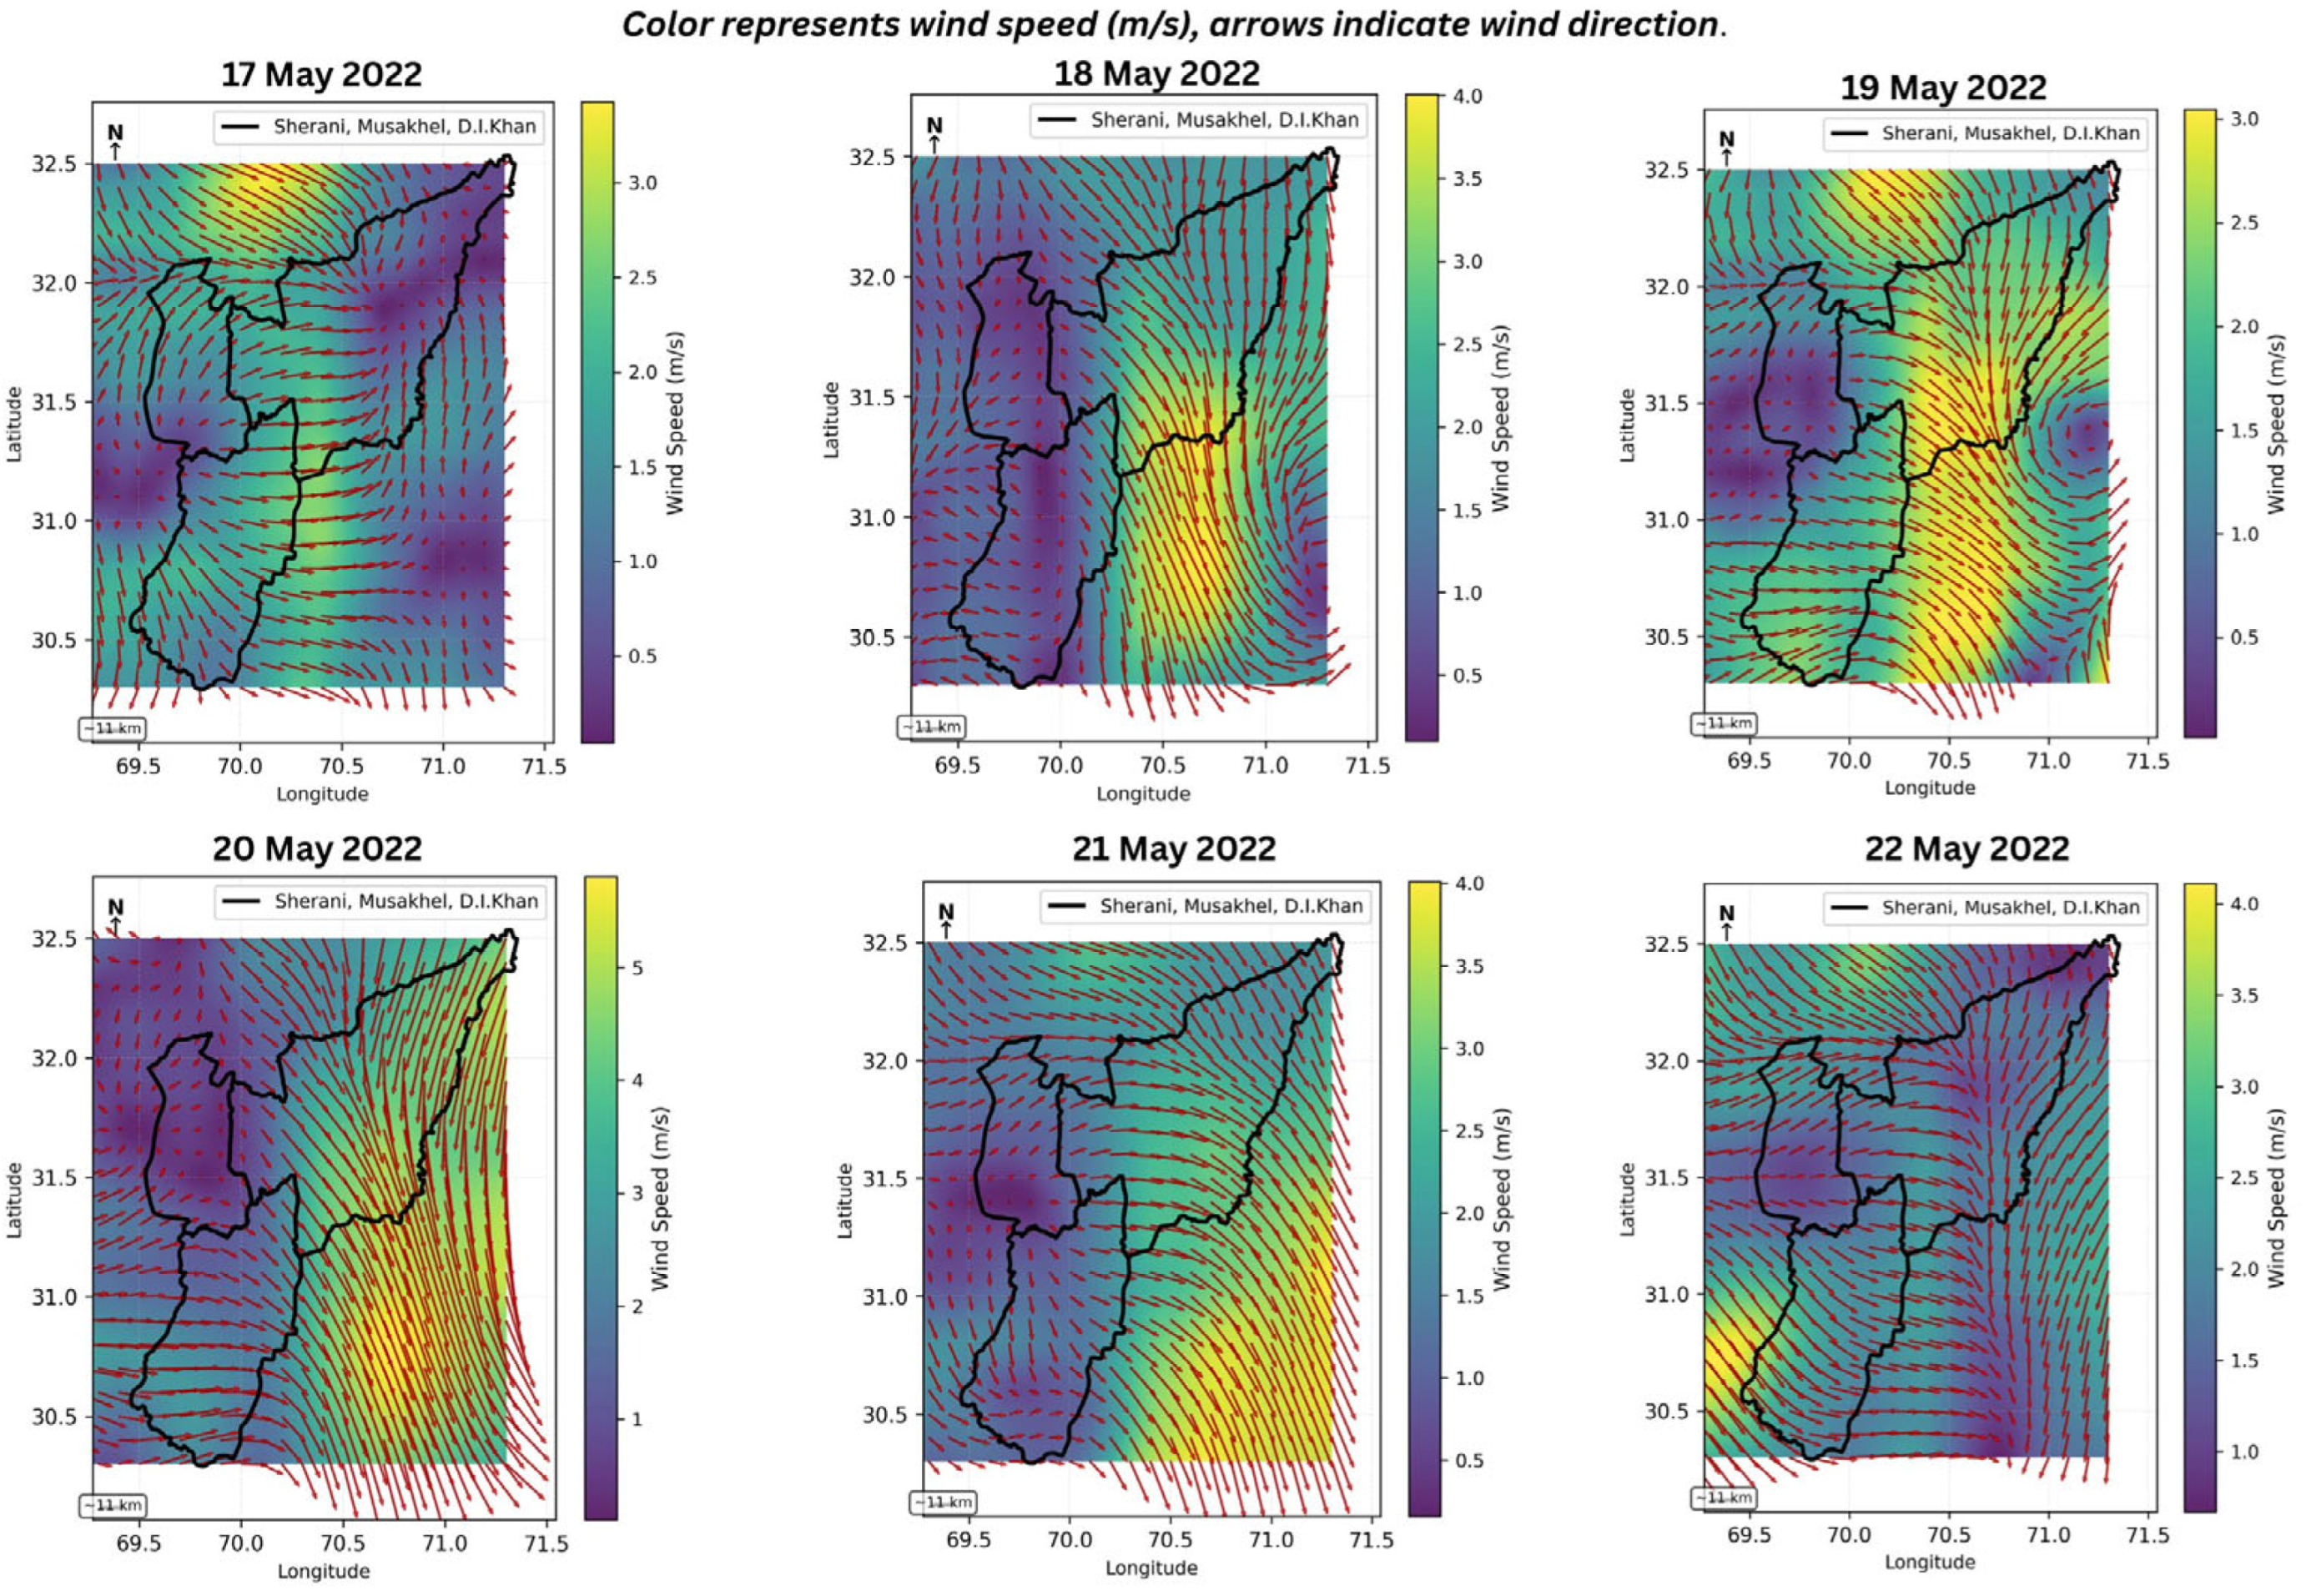
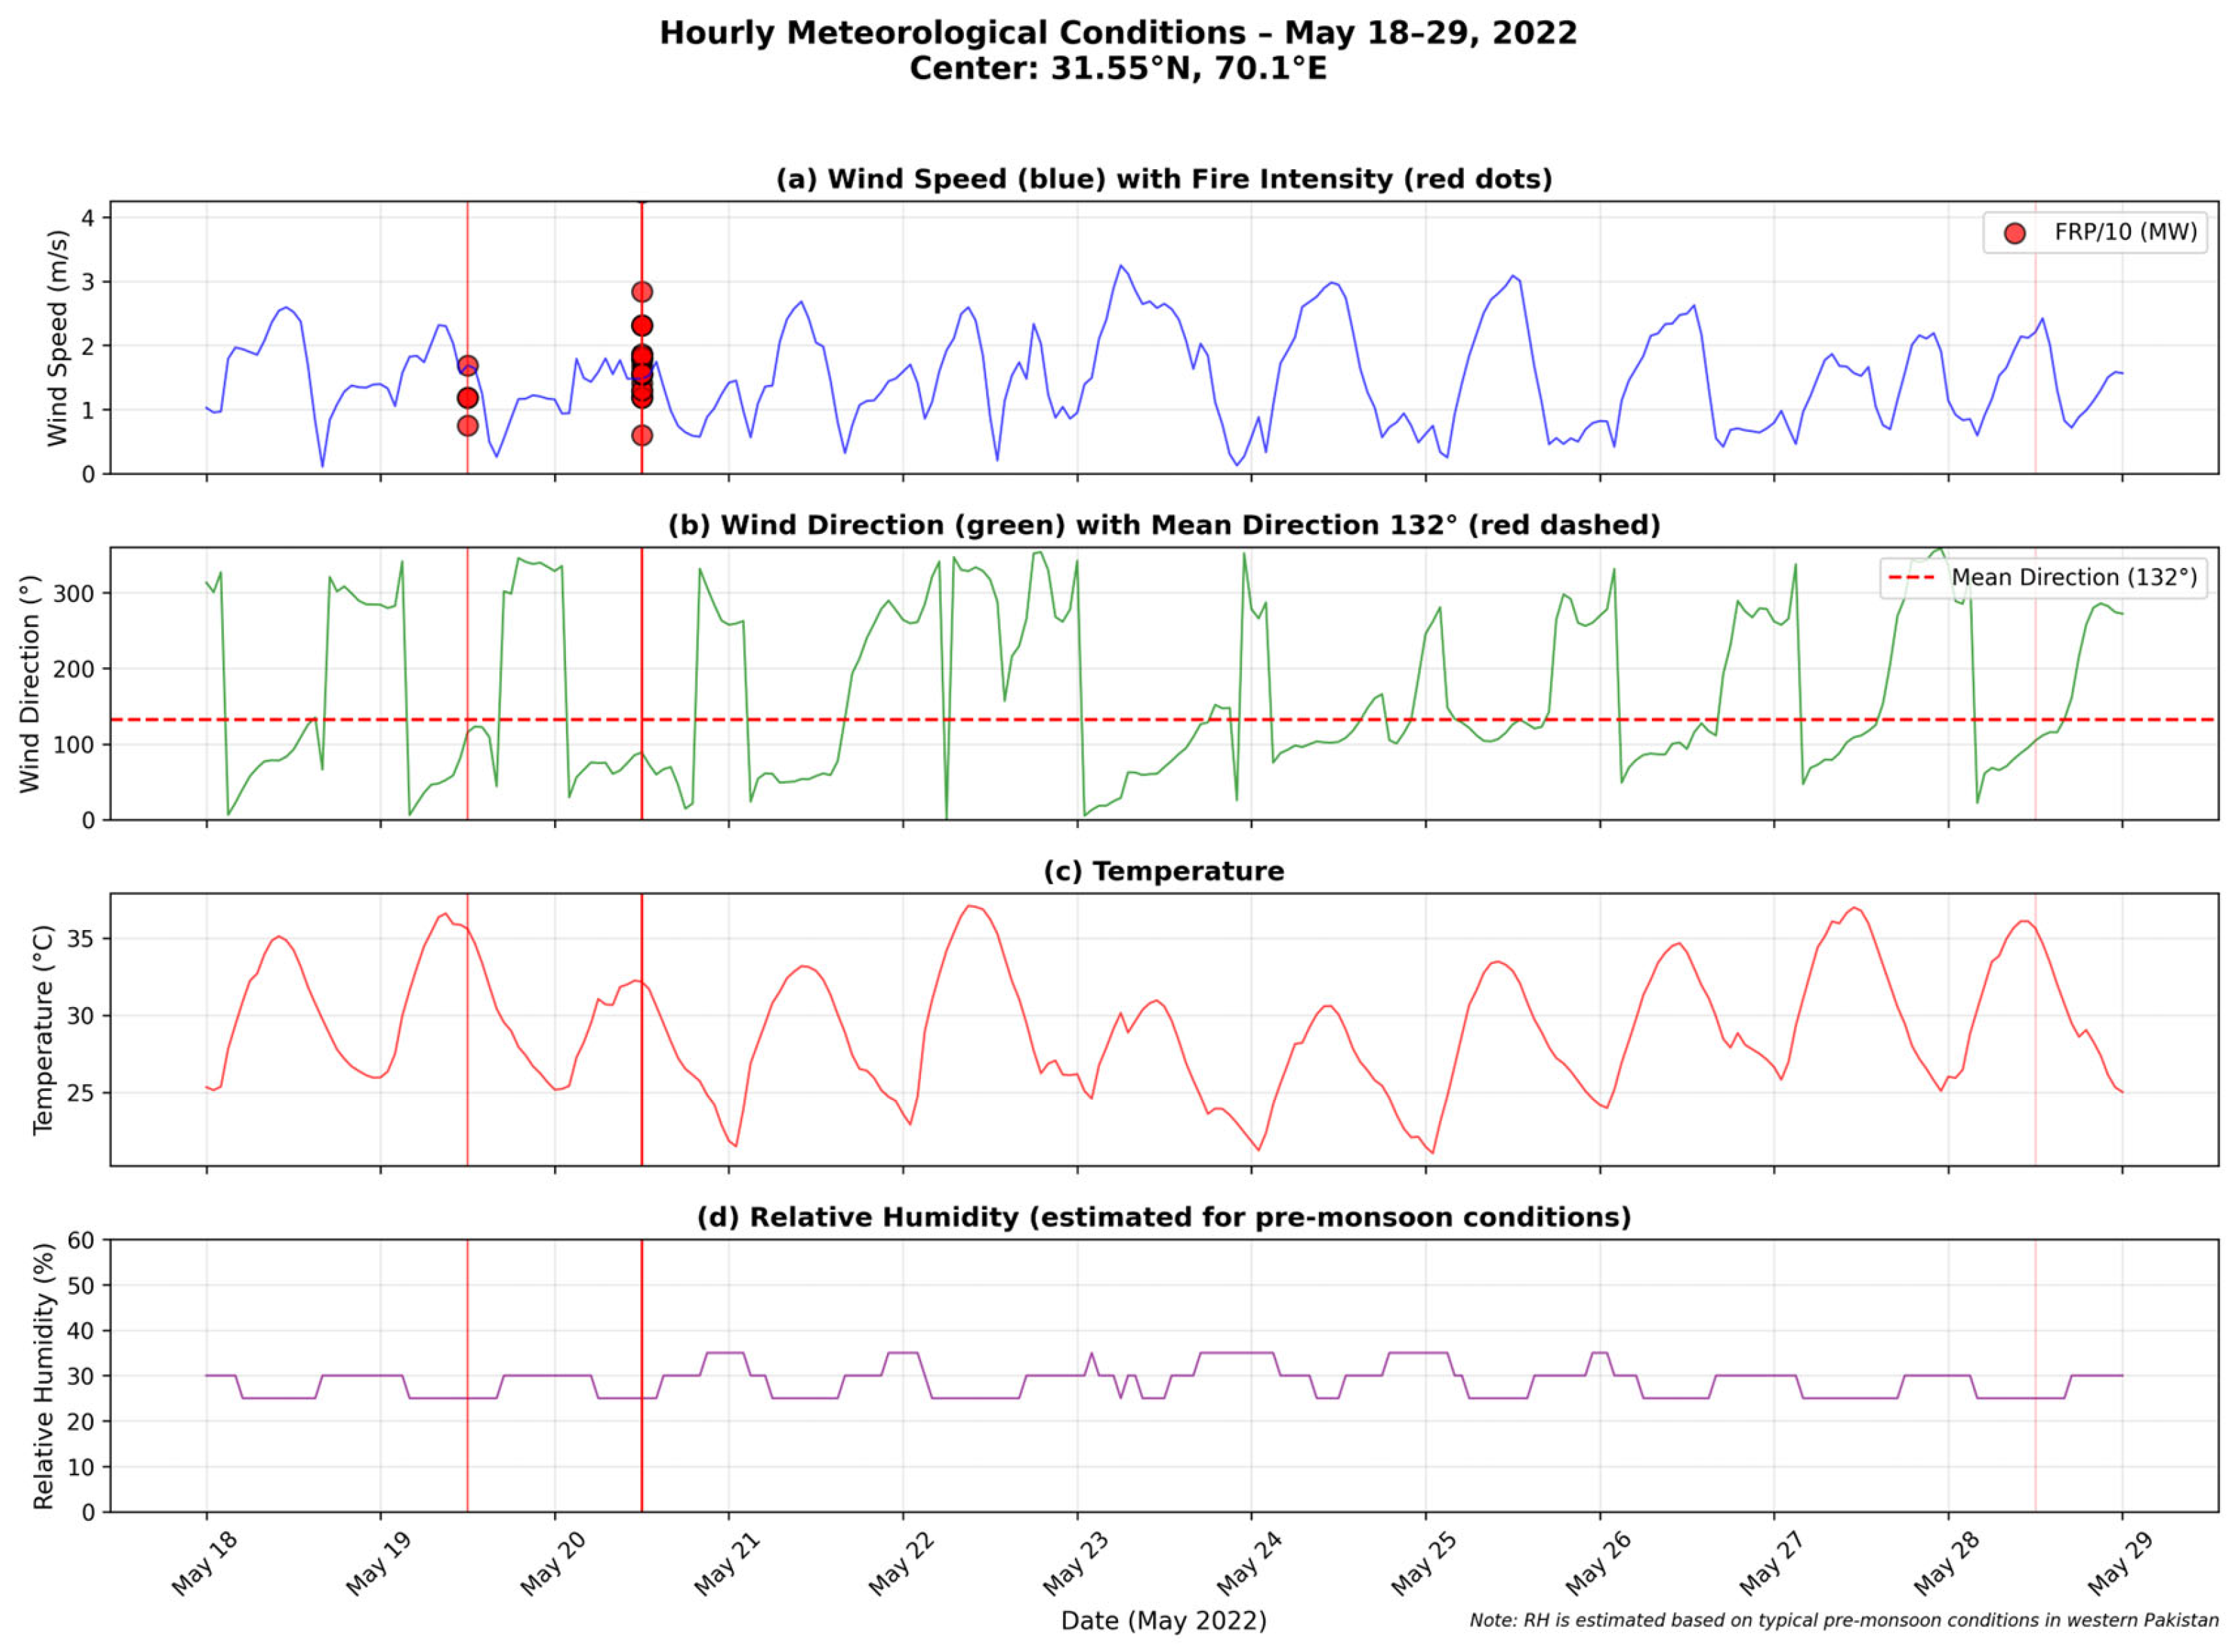
Daily wind maps for the study period are shown in Figure 6. Hourly variations in meteorological conditions are presented in the meteogram (Figure 7), where the red vertical lines indicate the MODIS detection times.

3.6. Analysis of the Fire Spread Direction

To examine whether the observed fire progression was consistent with the prevailing wind direction, we identified spread events from the temporal sequence of MODIS active fire detections following the general approach of Parks (2014) [47]. A spread event was defined as any pair of consecutive MODIS fire detections ordered by acquisition date, independent of their geographic bearing relative to the wind direction. This definition deliberately avoids pre-filtering by directional alignment, which renders any subsequent test of the wind-spread agreement circular.
For each pair, we computed (i) the great circle bearing from the earlier detection to the later detection (the observed spread direction) and (ii) the predicted downwind direction as the ERA5 wind-from direction at the time of the earlier detection plus 180°. An event was classified as “aligned with the prevailing wind” if the absolute angular difference between the observed bearing and predicted downwind direction was less than 45°. This 45° tolerance accounts for the combined MODIS geolocation uncertainty (~1 km) and ERA5 wind direction uncertainty (~10–15°).
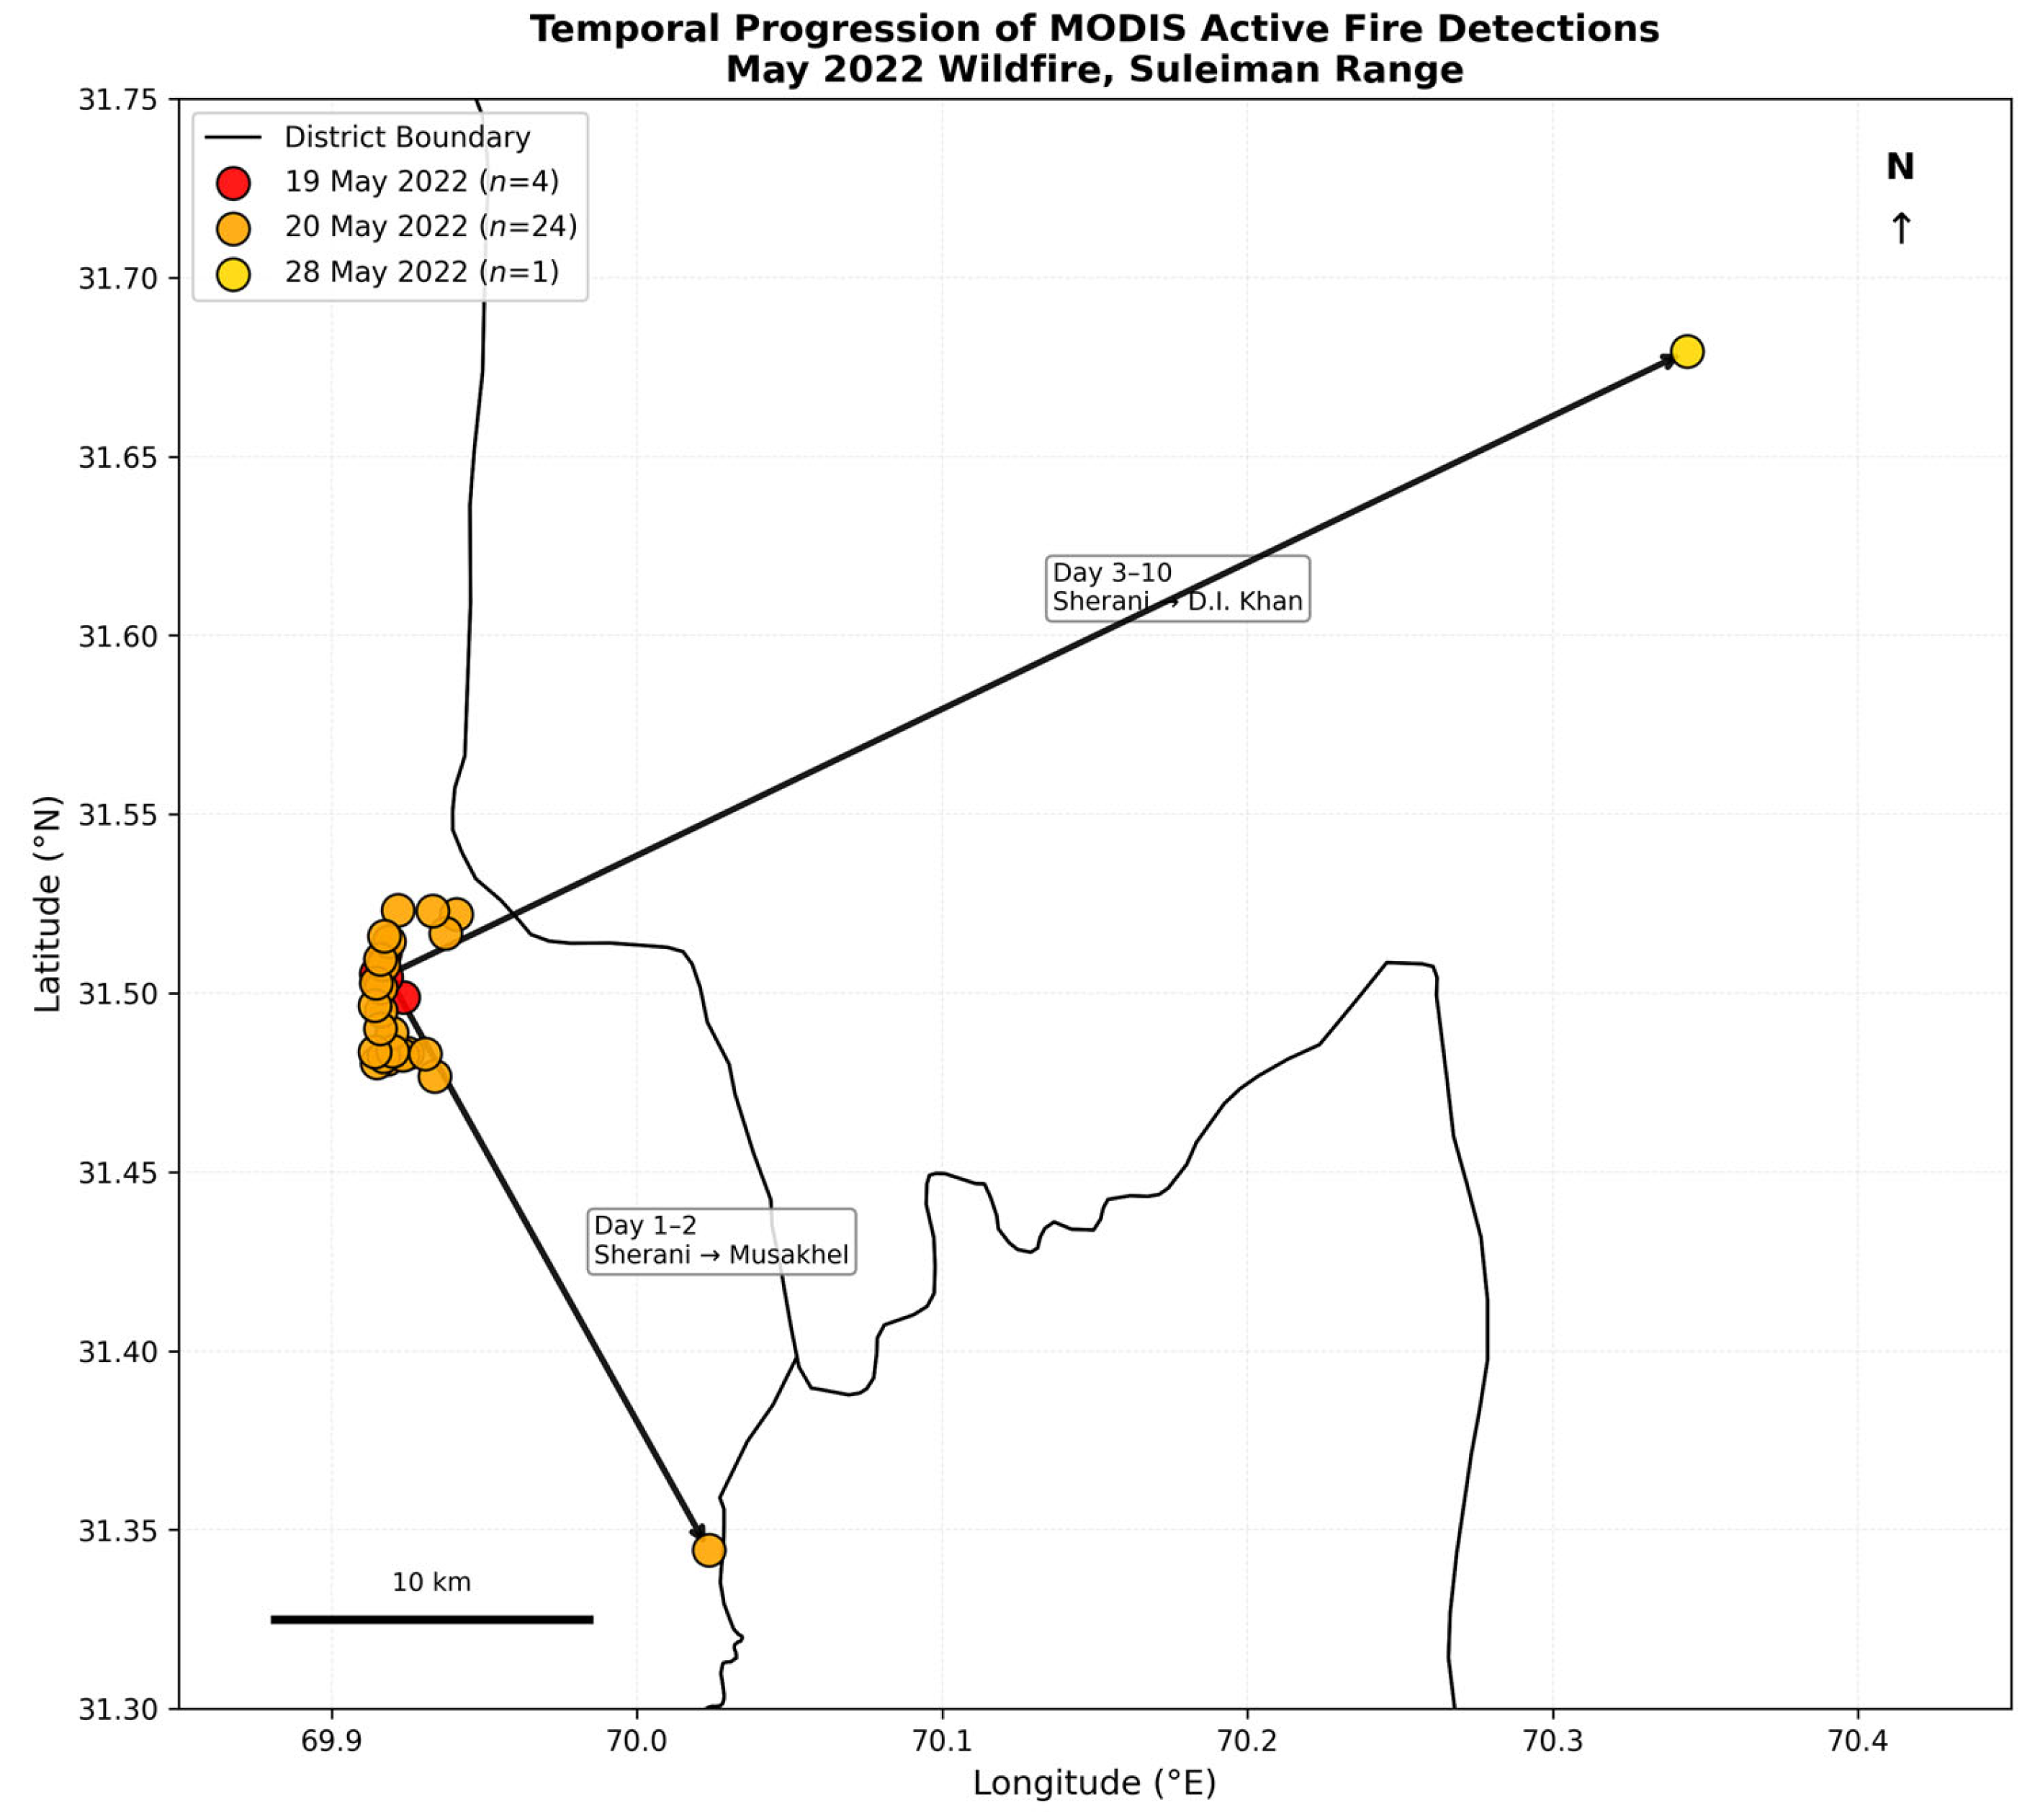
A total of 28 spread events were identified from the 29 wildfire-classified fire detections. The daily progression of the fire is illustrated in Figure 8. The statistical significance of the alignment rate was assessed using a one-sided binomial test against the null hypothesis that alignment occurs at chance level (here taken as 25%, corresponding to a 90° aligned arc out of 360°).

3.7. Statistical Analysis

Pearson correlation analysis was performed to quantify the relationships between the FRP and selected environmental variables, including the wind speed, wind direction, temperature, relative humidity, elevation, slope, and NDVI. Correlation coefficients were used to assess the strength and direction of linear associations among the variables, and the results were visualized using a correlation matrix. All the statistical tests were two-tailed, with α = 0.05.
The wind direction data were analyzed using circular statistics. The circular mean and circular standard deviation were calculated following established methods [48]. The distribution of the wind directions was visualized to examine the prevailing wind patterns during the study period, and the per-point wind vectors at each fire detection were mapped spatially to examine the wind direction in relation to the fire points.
The relationship between the wind speed and fire intensity was further explored using scatter plot analysis. All the statistical analyses were implemented in Python (3.12.0) using the pandas, numpy, scipy, and matplotlib libraries.

4. Results

The results of this study provide a comprehensive characterization of the May 2022 wildfire event in western Pakistan, with particular emphasis on the relationships between wind conditions and fire behavior. Our analysis integrates active fire detection, burn severity mapping, wind field visualization, and statistical correlation to elucidate the drivers of fire intensity and spread patterns. The findings are organized into five subsections: (1) temporal dynamics of fire activity and wind conditions, (2) spatial patterns of burn severity, (3) wind direction analysis, (4) statistical relationships between environmental variables and fire intensity, and (5) fire spread analysis.

4.1. Temporal Dynamics of Fire Activity and Wind Conditions

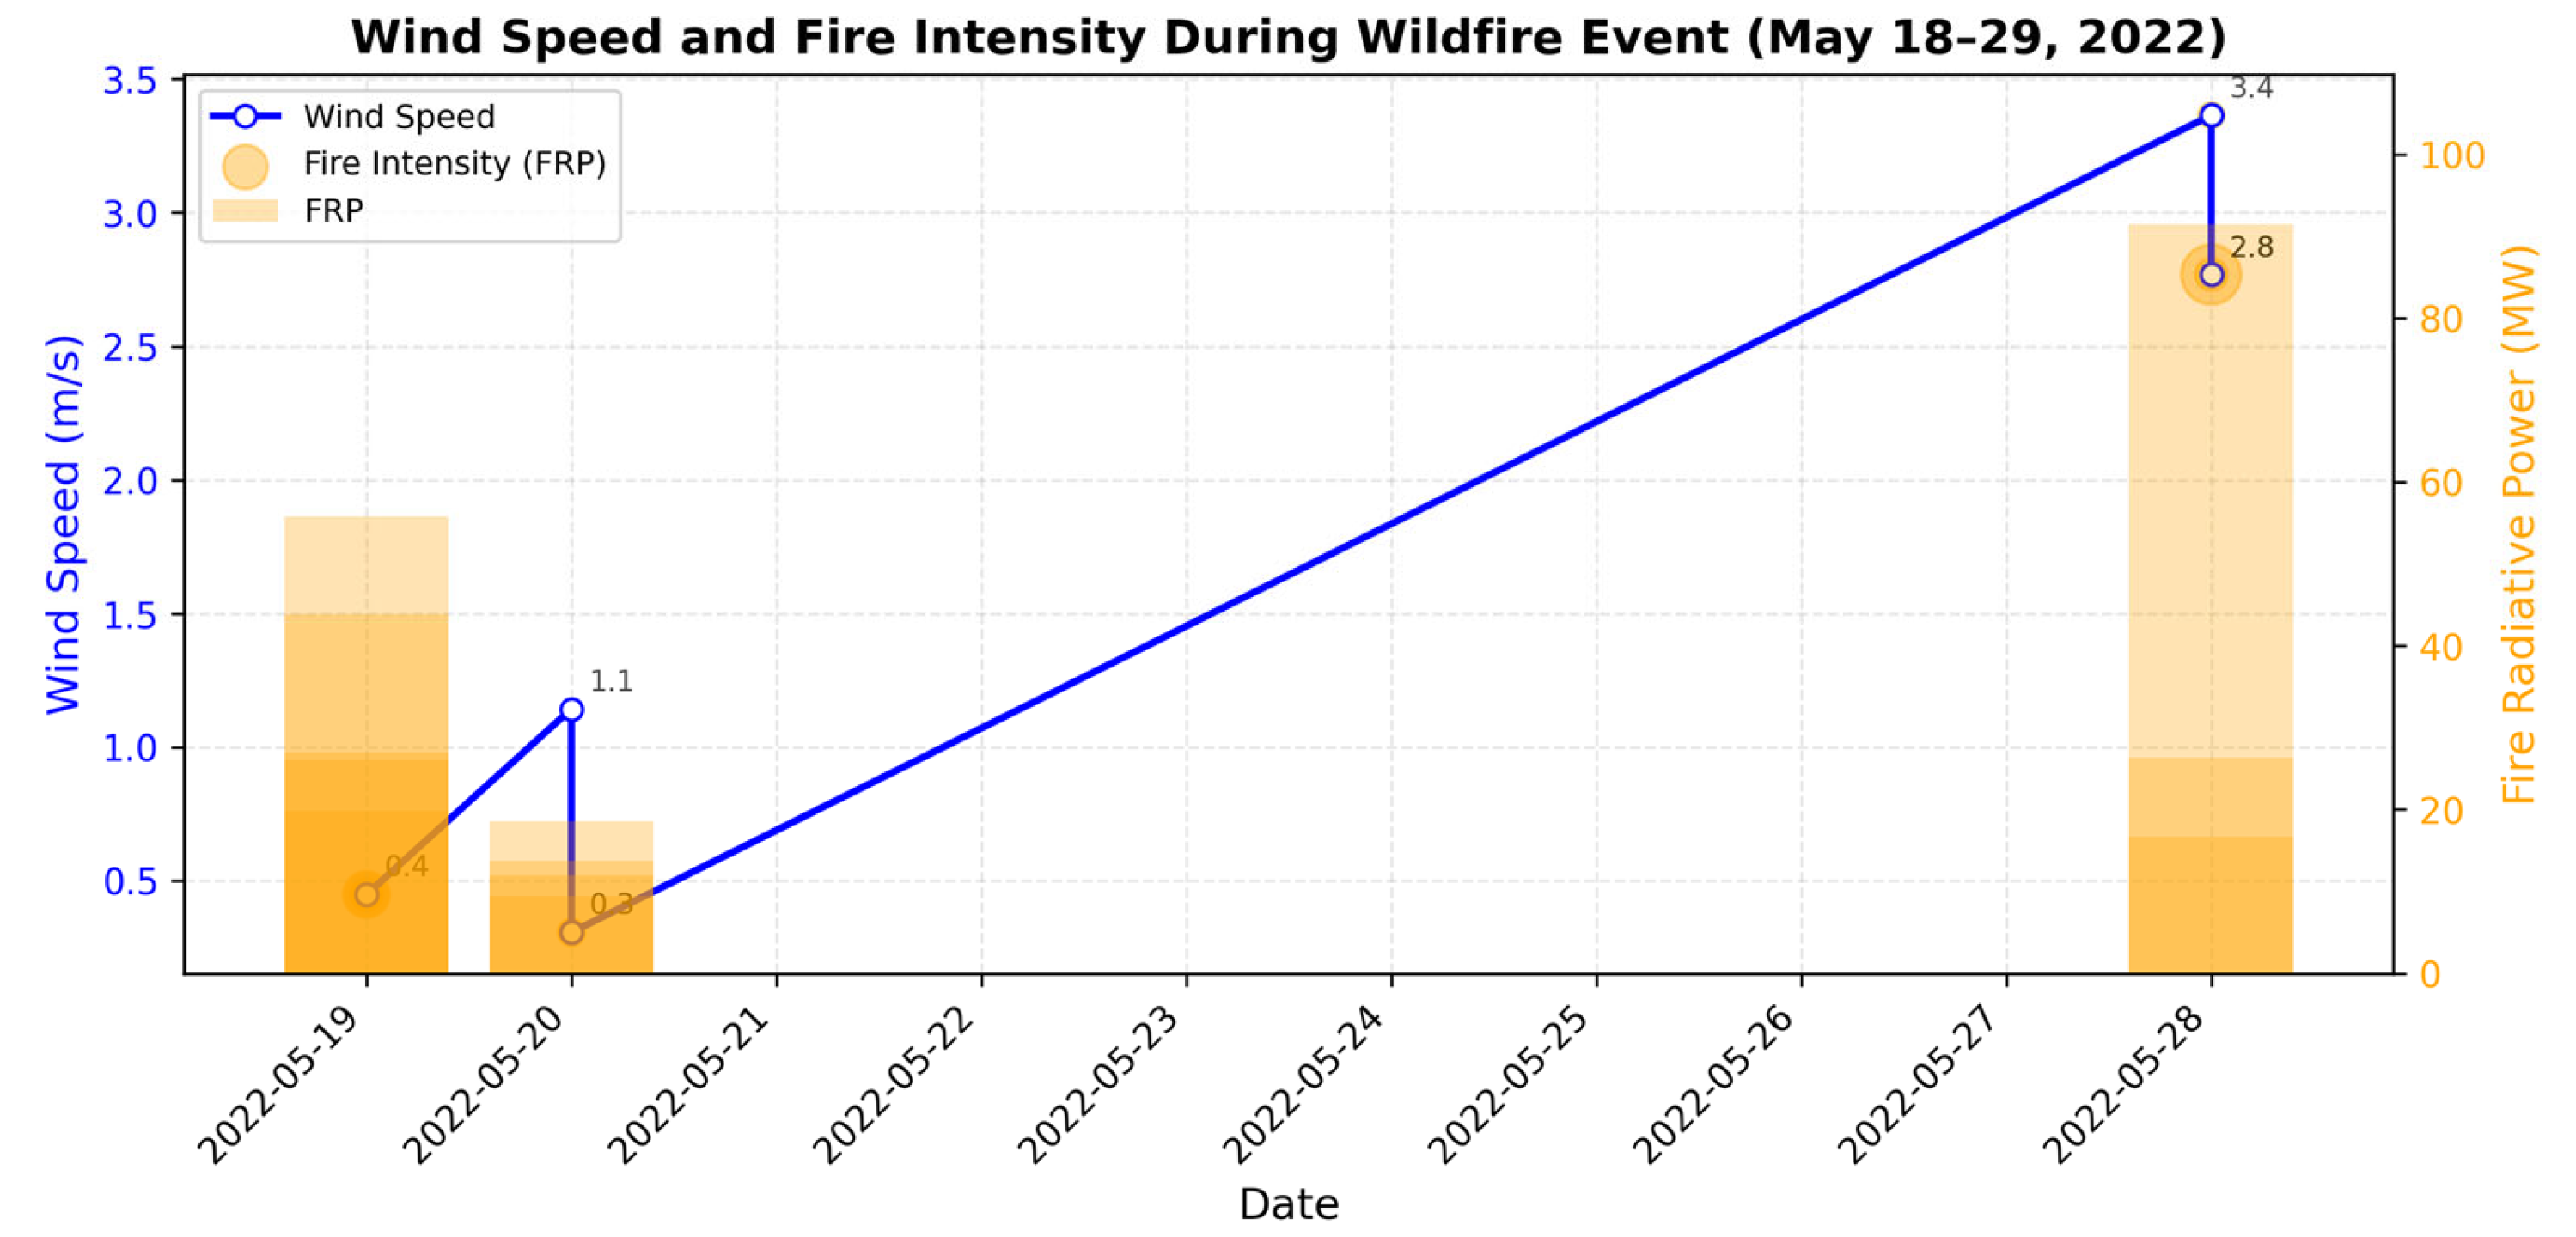
The 29 wildfire-classified MODIS detections were distributed unevenly across three days of activity: 19 May (n = 4), 20 May (n = 24), and 28 May (n = 1), with no high-confidence detections from 21–27 May (Figure 9). The daily mean FRP increased during the event: 12.0 MW on 19 May, 17.9 MW on 20 May, and 52.1 MW from the single 28 May detection in D.I. Khan. The daily mean ERA5 wind speed similarly increased from 0.71 m/s on 19 May to 1.69 m/s on 20 May and 2.58 m/s on 28 May (overall range 0.42–2.58 m/s; mean ± SD: 1.59 ± 0.46 m/s). The 2 m air temperature ranged from 23.0 °C to 39.5 °C (mean 29.5 ± 2.9 °C), and the relative humidity ranged from 9.9% to 26.2% (mean 13.1 ± 4.7%), indicating consistently dry conditions characteristic of the pre-monsoon period in this region. The prolonged event led to intensified suppression efforts by national and provincial agencies during its later stages [49,50].

4.2. Spatial Patterns of Burn Severity

dNBR analysis revealed spatial patterns of burn severity across the study area (Figure 5). The total burned area was estimated at approximately 86 km2, with severity classes distributed as low severity (dNBR 0.10–0.27) accounting for 23.2 km2 (26.9% of the burned area), moderate severity (0.27–0.44) for 59.9 km2 (69.5%), high-severity (0.44–0.66) accounting for 2.8 km2 (3.3%), and severe (>0.66) accounting for 0.3 km2 (0.3%) (Table 2). The few high-severity patches were located in the mountainous terrain of the Sherani district, where steep slopes and continuous vegetation cover are expected to support more intense fire behavior on a localized basis.
The 29 wildfire-classified MODIS detections (Section 3.1) were distributed across the study area with a strong temporal and elevational structure. Four detections on 19 May 2022 occurred in a tight cluster on the Sherani–Musakhel border at elevations of 2701–2886 m (mean 2749 m), with FRP values of 7.5–16.8 MW. The bulk of the dataset (24 detections) occurred on 20 May 2022, spanning a broader elevation range of 1981–2914 m (mean 2540 m) and an FRP range of 6.0–43.8 MW; these detections extended southward toward the Musakhel district boundary while remaining within the highlands. The final detection on 28 May 2022 occurred in D.I. Khan district at a substantially lower elevation of 235 m, with the highest FRP of the event (52.1 MW). This downslope progression across the fire timeline—from highland forest detection (19–20 May) to lower-elevation grassland detection (28 May)—produced the negative elevation–FRP correlation reported in Section 4.4, with the highest fire intensity associated with the lower-elevation grassland fuel rather than with the higher-elevation forest cover.

4.3. Wind Direction Analysis

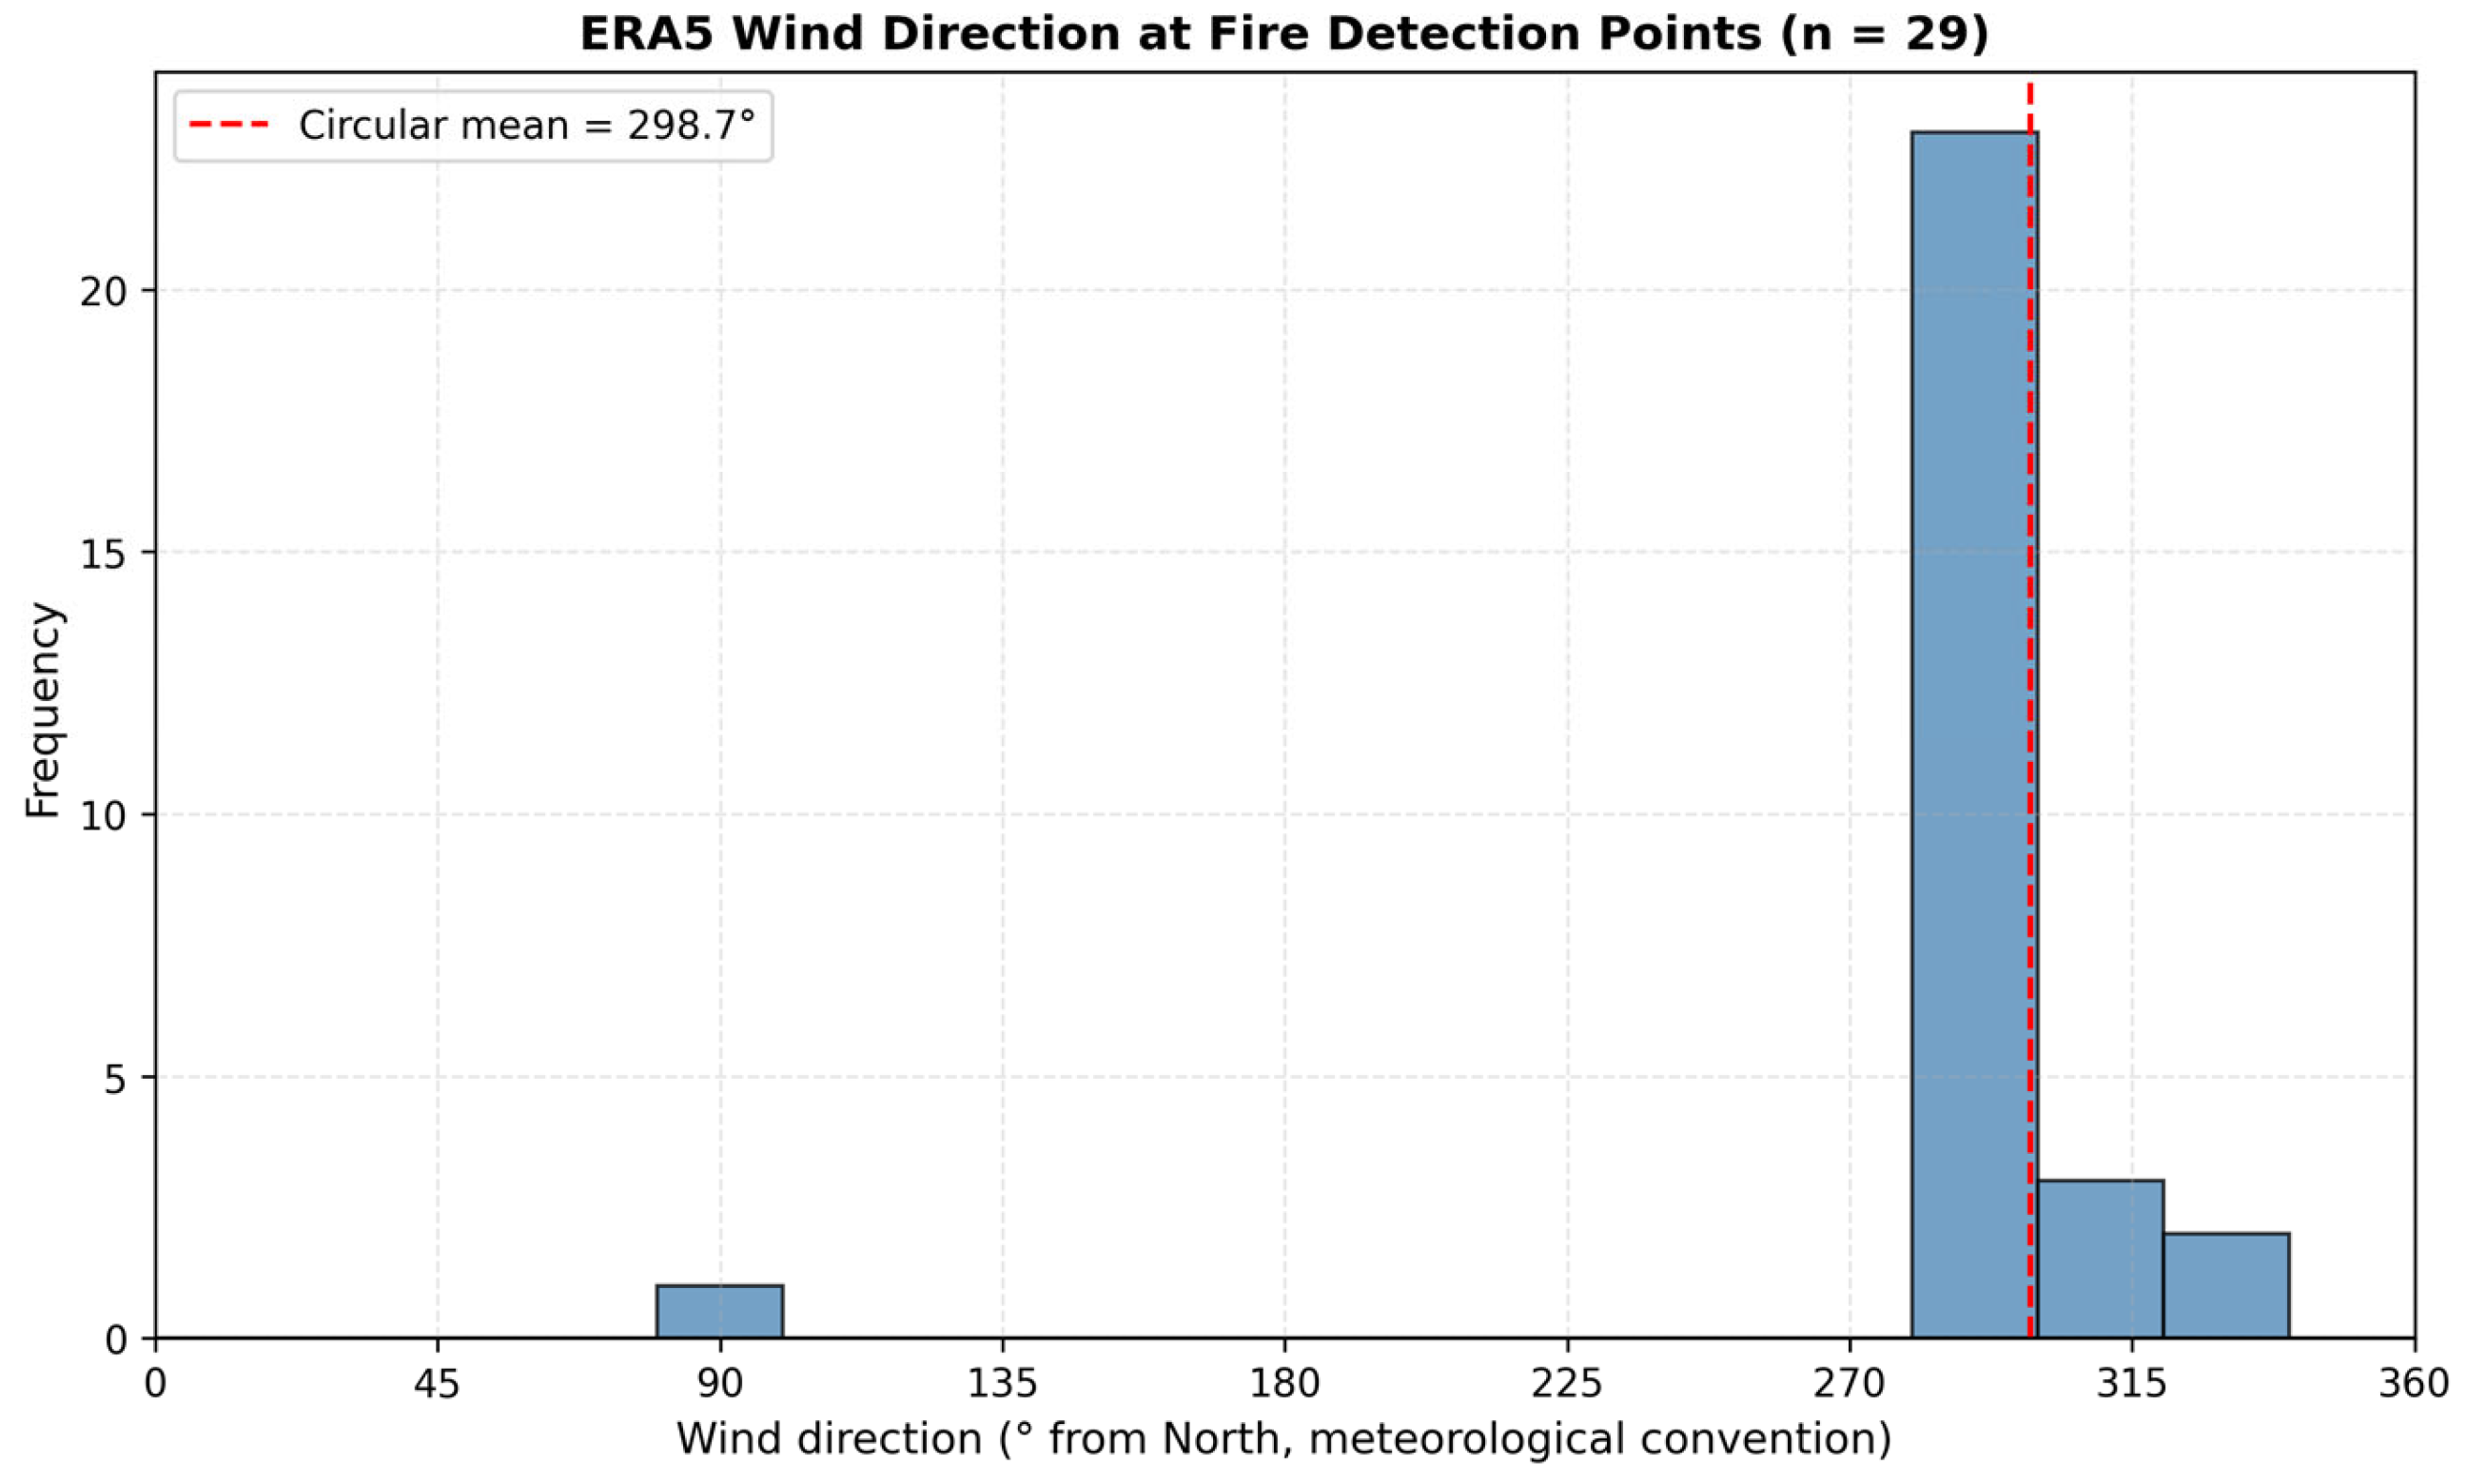
The ERA5 wind direction at fire detection locations was highly consistent throughout the event, with the majority of observations concentrated between 280° and 340° (Figure 10). The circular mean wind direction across all 29 wildfire detections was 298.7°, with a circular standard deviation of 23.3°, corresponding to winds blowing from the west–northwest toward the east–southeast. This low directional variability, spanning ten days of the event, indicates persistent synoptic-scale flow during the pre-monsoon period.
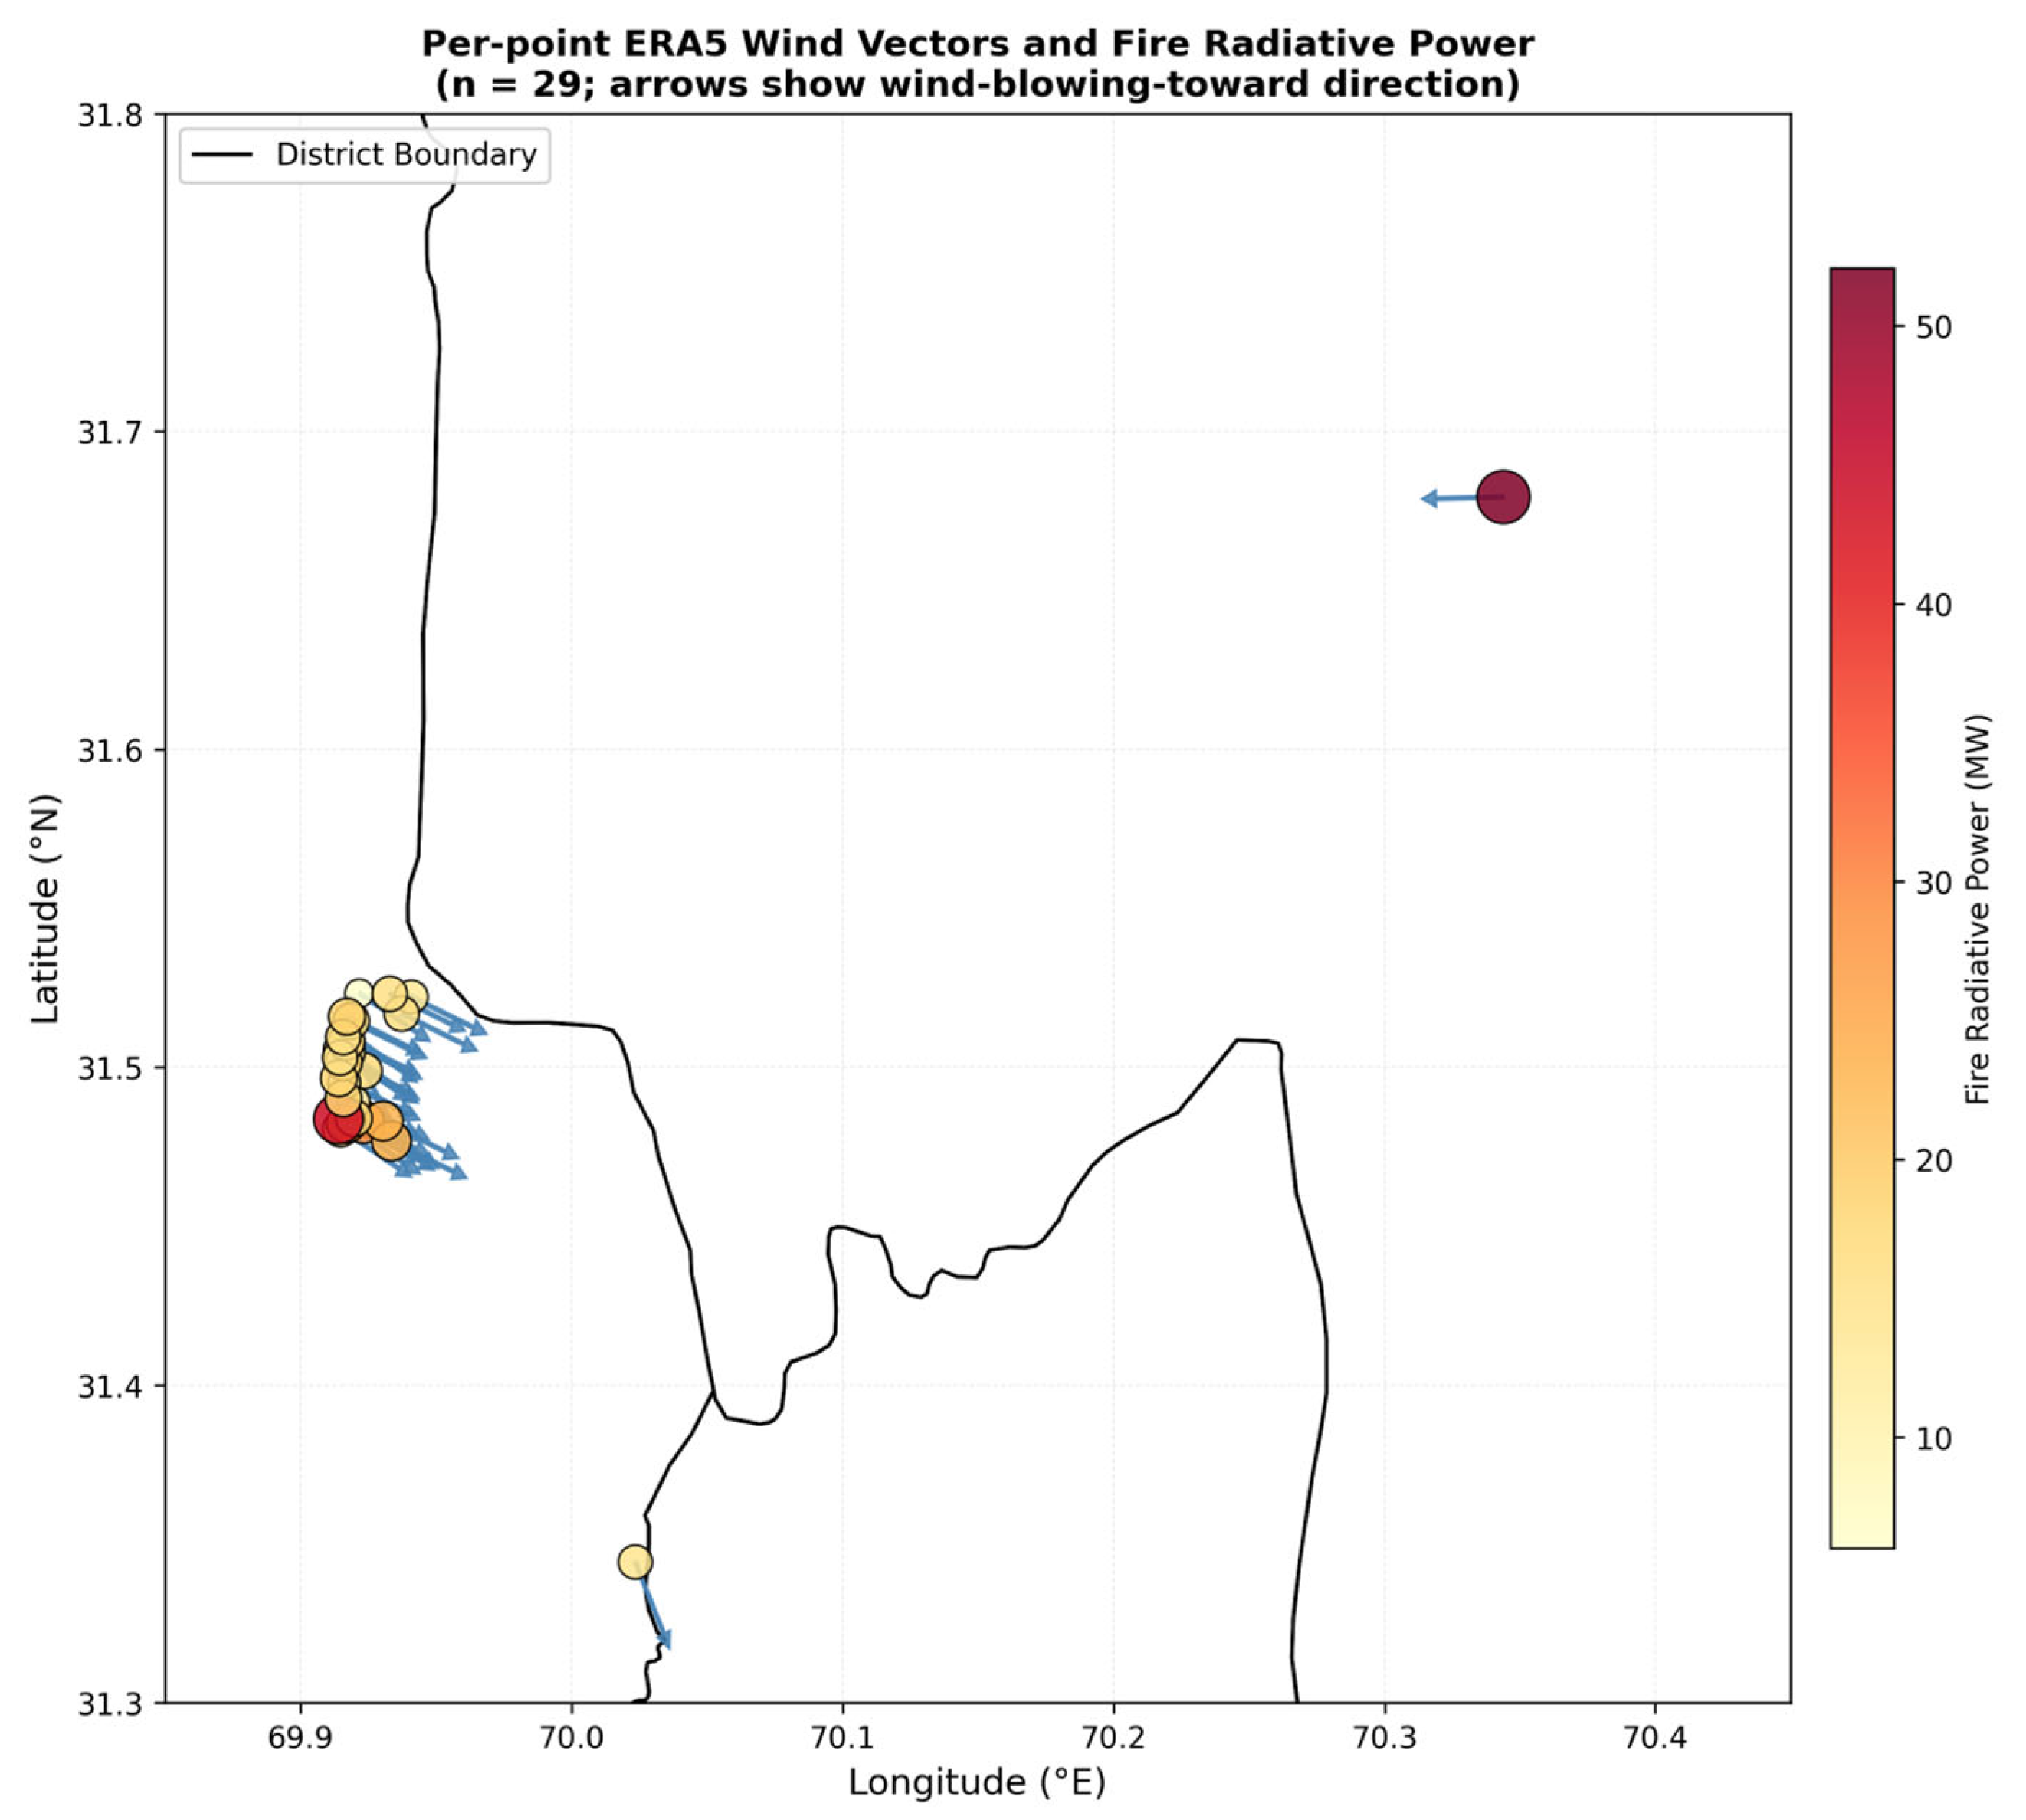
The per-point wind vectors for each fire detection are shown in Figure 11. The arrows depict the ERA5 wind direction at the date and time of each MODIS detection, with the arrow length fixed for visual consistency; marker size and color encode the FRP at each point. The single highest-FRP detection (52.1 MW) on 28 May 2022 occurred in the lower-elevation D.I. Khan area, whereas a tight cluster of moderate-FRP detections on 19–20 May 2022 (6.0–28.5 MW) occurred in the higher-elevation Sherani–Musakhel border region. The relationship between this consistent west–northwesterly wind direction and the observed fire progression (Figure 8) is examined quantitatively in Section 4.5 and discussed in Section 5.1.
The directional variability of the wind, quantified by the circular standard deviation (23.3°), was at the lower end of the values typically reported for complex terrain (often 30–50°) [48]. This consistency indicates that during the May 2022 event, the synoptic flow was dominant at the ~27 km scale of ERA5; however, as discussed in Section 4.5 and Section 5.1, the alignment between the ERA5 downwind direction and the observed direction of fire spread was only partial at the spread-event scale. We attribute this partial alignment to the inability of coarse-resolution reanalysis to resolve terrain-channelled near-surface winds in this complex landscape.

4.4. Statistical Relationships Between Environmental Variables

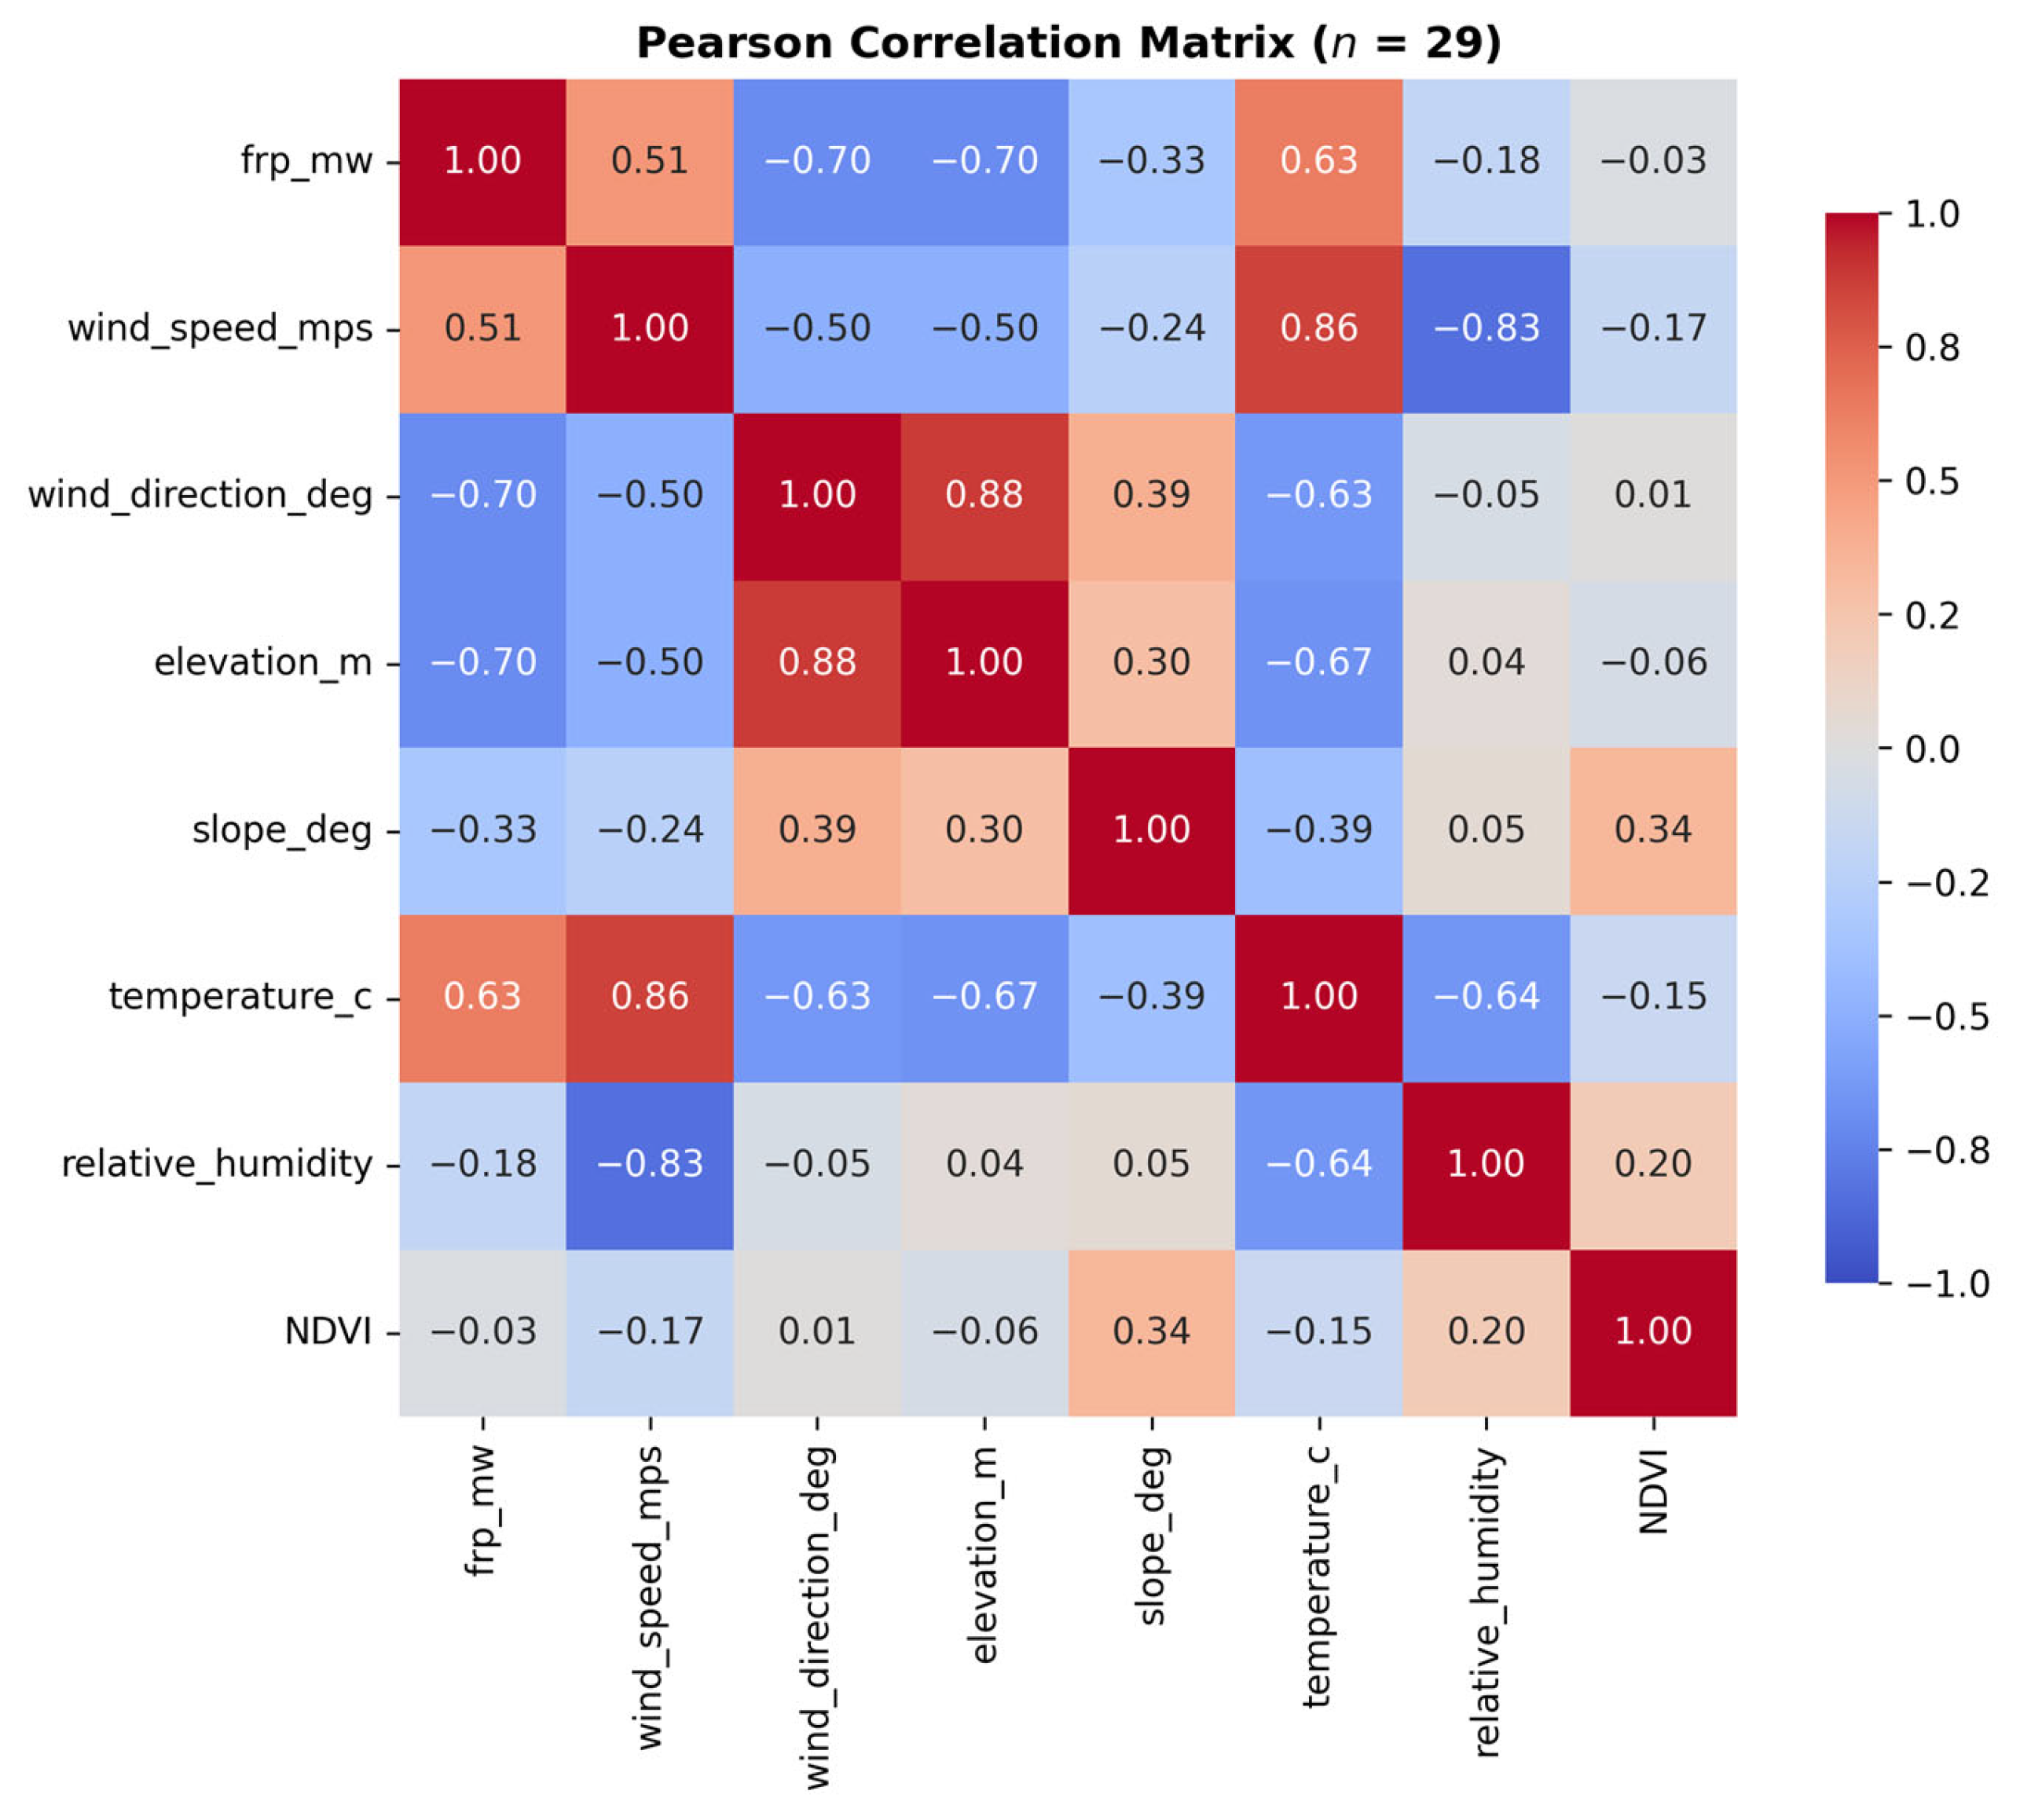
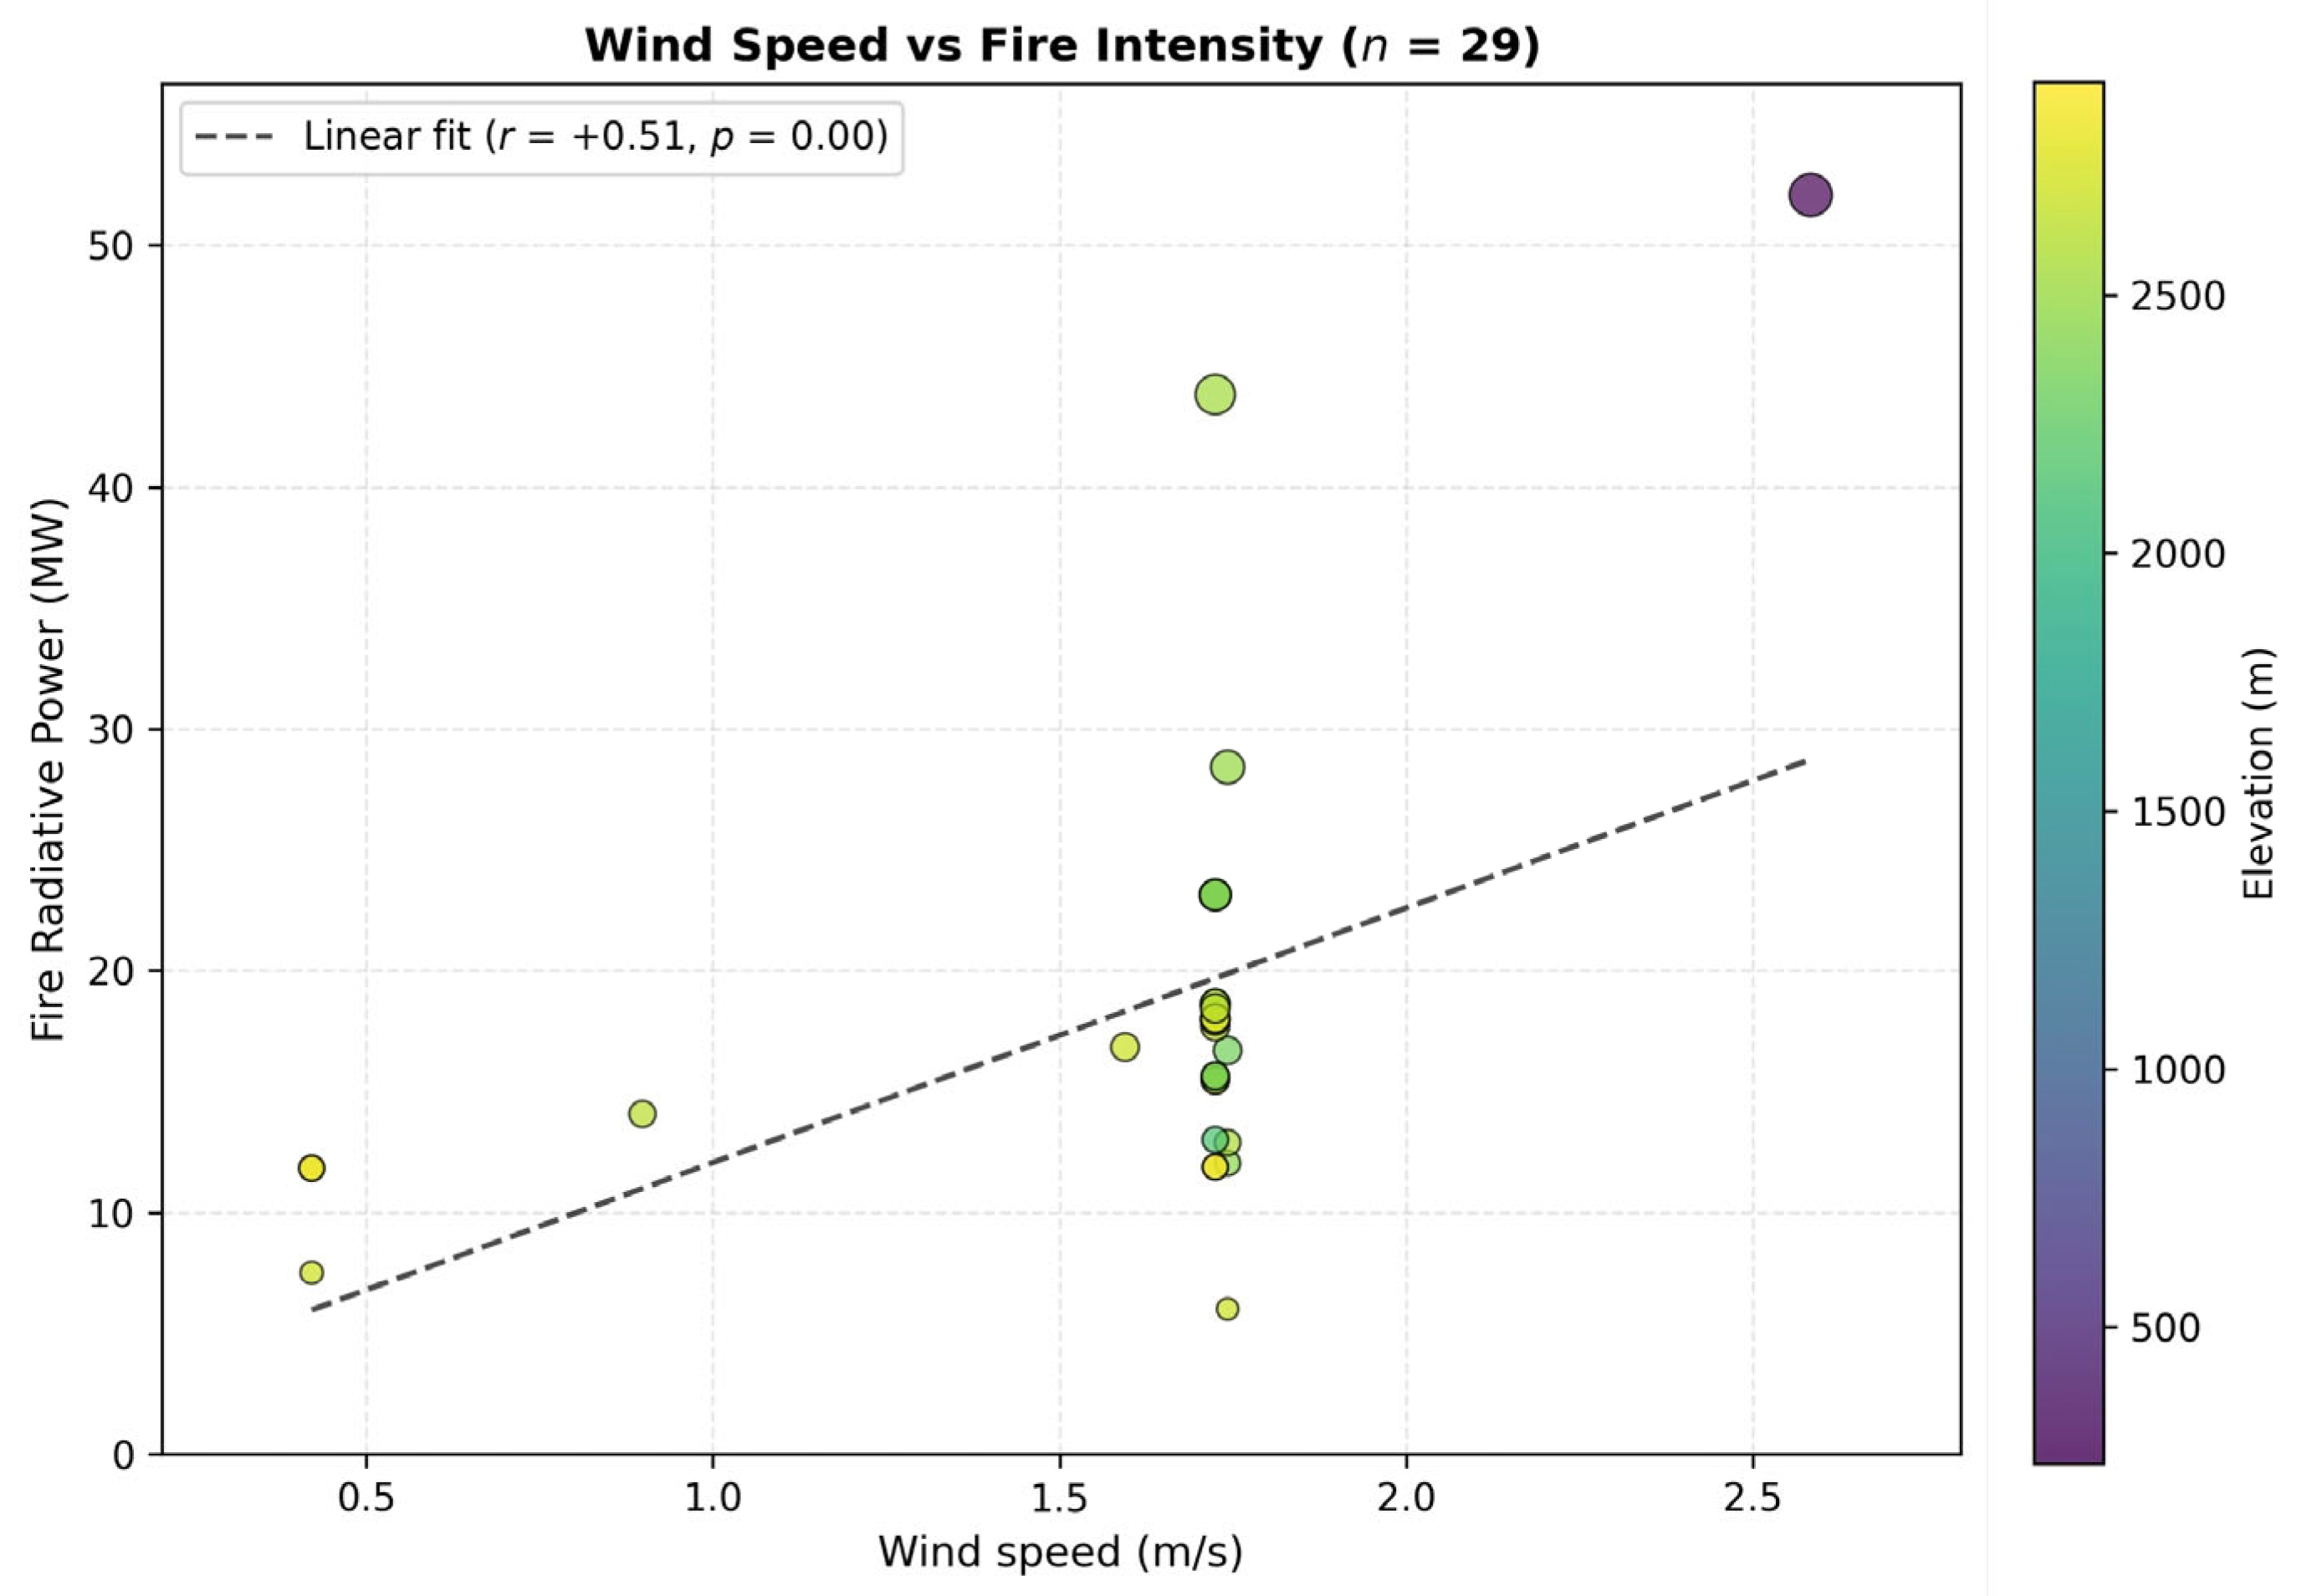
Correlation analysis revealed several statistically significant associations between environmental variables and the FRP (Figure 12). The ERA5 wind speed at the fire detection points was moderately positively correlated with the FRP (r = +0.51; p = 0.005; n = 29), indicating that higher wind speeds tended to coincide with higher FRPs during the event. The temperature exhibited a comparable positive correlation with the FRP (r = +0.63, p < 0.001), and the two meteorological predictors were strongly collinear (wind speed vs. temperature: r = +0.86, p < 0.001). This collinearity precludes the statistical attribution of an independent wind-speed effect on the FRP from this dataset alone: both the wind speed and temperature increased from 19 May to 28 May, so any apparent wind–FRP association partly reflects temperature-driven changes in fuel dryness, and vice versa. We therefore interpret the wind speed–FRP correlation descriptively as a feature of this single fire event rather than as causal evidence.
Topographic variables showed substantially stronger associations with the FRP than with the wind speed did. Elevation correlated negatively with FRP (r = −0.70, p < 0.001), with the single highest-FRP detection (52.1 MW) occurring at 235 m in the lower-elevation D.I. Khan area, whereas higher-elevation Sherani–Musakhel forest detections (2500–2900 m) produced lower-FRP values (6.0–28.5 MW). Slope showed a weaker negative correlation with the FRP (r = −0.33, p = 0.081) at the threshold of conventional statistical significance. The NDVI essentially showed no linear relationship with the FRP (r = −0.03, p = 0.88), and the relative humidity also showed a weak, non-significant negative association (r = −0.18, p = 0.35).
The bivariate relationship between the wind speed and FRP, color-coded by elevation, is shown in Figure 13. Visualization reveals that the wind speed and elevation are inversely structured within the dataset: most low-elevation points (D.I. Khan plains) occur at the highest wind speeds, whereas most high-elevation points (Sherani–Musakhel highlands) occur at lower wind speeds. This co-variation, combined with the small sample size, limits the strength of inferences drawn from these correlations and emphasizes the need for multievent or multi-season datasets to disentangle the relative contributions of meteorology, topography, and fuel structure.

4.5. Fire Spread Analysis

Spread events were defined as all 28 consecutive MODIS detection pairs in the temporally ordered fire dataset (n = 29 detections, 19–28 May 2022), with no pre-selection based on the wind direction or geographic relationship. For each pair, the geographic bearing from the earlier detection to the later detection was computed and compared with the ERA5 downwind direction at the earlier point (wind-from direction + 180°). A spread event was considered aligned with the synoptic wind when the angular difference fell within ±45° of the downwind direction.
Among all 28 pairs, six (21.4%) aligned with the ERA5 downwind direction within ±45° (Table 3). However, 24 of the 29 detections occurred on a single day (20 May 2022) in close spatial proximity. Many same-day pairs represent sequential MODIS samples of an active fire front rather than discrete spread events. To restrict the analysis to spread events at distances exceeding the MODIS 1 km nominal pixel resolution, we re-evaluated alignment using only pairs separated by ≥2 km. Among these eight pairs, four (50.0%) aligned with the ERA5 downwind direction within ±45°, which is well above the 25% baseline expected by chance under a ±45° tolerance.
The geographic axis of fire progression (Figure 8)—from the Sherani–Musakhel border region on 19–20 May to D.I. Khan on 28 May—corresponds to a generally eastward direction of advance. The ERA5 circular mean wind direction during this period (298.7°, equivalent to a downwind direction of 118.7°) was likewise oriented east–southeast. These findings indicate that the synoptic-scale wind direction broadly contributed to the observed eastward fire progression. The 50% point-by-point alignment rate, while above chance, is well below what would be expected if the synoptic winds fully governed the fire-front direction. We interpret this partial alignment as consistent with the documented limitations of coarse-resolution reanalysis in topographically complex landscapes: the ~27 km grid resolution of ERA5 cannot capture the terrain-channeled near-surface winds that determine the precise direction of fire front propagation at sub-grid scales [22,23].

5. Discussion

The results of this study provide a critical characterization of wind–fire dynamics in the complex terrains of western Pakistan, emphasizing the synergistic effects of meteorological forcing and topographic constraints. Our integrated remote sensing and statistical approach reveals a hierarchical control on fire behavior, with topographic factors exerting the strongest individual influence, followed by wind speed and direction.

5.1. Wind–Fire Relationships and the Limits of Reanalysis in Complex Terrain

The temporal co-occurrence of higher ERA5 wind speeds and elevated FRP across the 19–28 May 2022 study period is consistent with the well-established theoretical role of wind in modulating fire spread and combustion rates [51]. However, three factors constrain the interpretation of this case. First, the Pearson correlation between the wind speed and FRP across the 29 wildfire detections (r = +0.51, p = 0.005) is statistically significant and stronger than that commonly reported in single-event studies. However, the small sample size and the concentration of 24 of 29 detections on a single day (20 May) limit the statistical power of this estimate. We therefore treat the correlation as descriptive of this event rather than as inferential evidence of a general relationship between wind speed and intensity. Second, the wind speed and 2 m temperature were strongly collinear across the short study period (r = +0.86, p < 0.001), reflecting coincident temporal trends from 19 May to 28 May. This collinearity prevents the statistical separation of the independent effects of wind and temperature on the FRP within this dataset. Third, the FRP itself is an instantaneous satellite-derived radiative quantity influenced by overpass time, the flaming area within a 1 km MODIS pixel, view geometry, and intervening smoke or cloud; therefore, it is not equivalent to fireline intensity in terms of operational fire behavior [42]. Any inference from the FRP to the combustion energetics must accommodate these measurement limits. FRP is therefore not equivalent to fireline intensity as defined in operational fire behavior frameworks [42].
Wind direction analysis offers a more nuanced interpretive frame. The ERA5 wind direction at the 29 fire points was highly consistent throughout the event (circular mean 298.7°, circular standard deviation 23.3°), indicating persistent west–northwesterly synoptic flow with a corresponding downwind direction toward the east–southeast (118.7°). The observed fire progression—from the Sherani–Musakhel border region (19–20 May) to D.I. Khan (28 May)—occurred in a generally eastward direction, broadly compatible with this synoptic downwind axis. Quantitatively, 4 of the 8 spread events at distances exceeding 2 km (50.0%) aligned with the ERA5 downwind direction within ±45°—well above the 25% baseline expected by chance—and supported the interpretation that the synoptic wind direction contributed to the overall direction of fire advance.
However, the alignment is partial rather than complete, and the point-by-point fit between individual MODIS detection bearings and ERA5 downwind directions is weaker than would be expected if synoptic winds fully governed fire front propagation. This partial alignment suggests that ERA5 (~27 km grid resolution) cannot resolve the near-surface winds that actually advect the fire front in complex terrain. In topographically complex landscapes, near-surface winds are strongly modified by sub-grid features: valleys channel flow, ridges accelerate or block it, and diurnal heating generates upslope and downslope flows that are absent from synoptic-scale reanalysis [22,23]. The Suleiman Range, with its steep relief and approximately north–south ridge–valley system, is the kind of landscape in which such channeled flows are expected to dominate the local wind field. ERA5 therefore describes the synoptic context (broad west–northwest-to-east–southeast (WNW-to-ESE) flow toward the Indus Plains) but not the fire-driving local wind at the spread-event scale. This interpretation is consistent with prior work reporting that ERA5 underestimates near-surface wind speeds by 30–50% in mountainous environments and poorly resolves diurnal and terrain-induced wind variability [22,23].
The methodological implication for fire studies in data-sparse complex terrains is that coarse reanalysis wind directions can be used to characterize the synoptic context of a fire event. However, it should not be relied upon as a stand-alone predictor of the fire-front direction at sub-daily, sub-grid scales without supporting higher-resolution wind information or explicit topographic wind modeling. Dense ground-based weather observations are unavailable in the Suleiman Range and much of the broader Hindu Kush–Himalaya region. In their absence, research-grade dynamical downscaling, mesoscale weather models, or networks of inexpensive surface wind sensors would substantially strengthen wind–fire characterization in future studies.

5.2. Topographic Associations with Fire Intensity

In the present dataset, topographic variables showed substantially stronger associations with the FRP than with the wind speed. Elevation correlated negatively with FRP (r = −0.70, p < 0.001), and slope showed a weaker negative association at the threshold of statistical significance (r = −0.33, p = 0.081). The Sherani–Musakhel–D.I. Khan study area spans a broad topographic gradient from the Indus piedmont in the east to the Suleiman Range crest in the west, with elevations ranging from 148 m to 3137 m and slopes ranging from 0° to 43° (Figure 5). The 29 wildfire-classified detections sampled this topographic gradient unevenly. Twenty-eight detections occurred in the Sherani–Musakhel highland cluster at elevations of 1981–2914 m (FRP 6.0–43.8 MW, mean 17.1 MW), and a single late-event detection on 28 May 2022 occurred at 235 m in the D.I. Khan piedmont, which produced the highest individual FRP of the event (52.1 MW).
This contrast—high-FRP grassland at low elevation versus moderate-FRP forest at high elevation—is consistent with documented differences in fuel characteristics across the elevation gradient. The lower-elevation Indus piedmont supports fine, cured, well-aerated grass and shrub fuels that ignite readily and burn rapidly during the pre-monsoon period when the degree of grass curing typically exceeds 80%. Such fuels are known to support high instantaneous FRP values at the MODIS 1 km scale [42]. In contrast, the Chilghoza pine forests of the Sherani–Musakhel highlands provide larger total fuel loads but coarser woody fuels with higher fuel moisture, tending to produce lower per-pixel FRP even when the total energy release is large [20,37]. This interpretation is also consistent with the predominance of low- and moderate-severity burning documented by the dNBR analysis (Figure 5), which indicates that the bulk of the burned area experienced surface fire behavior rather than crown fire behavior.
The slope–FRP association in this dataset (r = −0.33, p = 0.081) is weak and at the threshold of conventional significance. Slope effects on the fire spread rate and preheating are well established at the within-event scale [52], but the present dataset cannot isolate these effects from co-varying changes in elevation, fuel type, and wind exposure. As with the elevation correlation, the slope–FRP association reflects the spatial juxtaposition of two distinct landscape units—the steep highland interior of Sherani–Musakhel and the gentler piedmont of D.I. Khan—rather than a continuous physical mechanism operating across the dataset.
Comparisons with regional studies underscore the importance of fuel structure alongside topography. Studies in the plateau regions of Yunnan and the mountains of northern Morocco have identified elevation and slope as dominant spatial controls of fire occurrence, with topographic variables outperforming meteorological variables in explaining where fires occur [16,21]. Our findings are consistent with this body of work in identifying topography as a key co-variate of fire intensity. However, they reported that the direction of the elevation–FRP relationship can reverse when the elevation gradient corresponds to a transition between forest and grassland fuel types. In future work, joint analyses of elevation, slope, and explicit fuel-type classification (e.g., ESA WorldCover or field-based fuel mapping) across multiple events would be needed to separate these effects systematically.

5.3. Ecological Implications of Burn Severity Patterns

The burn severity analysis revealed that the May 2022 wildfire was overwhelmingly low to moderate in severity. Low-severity burns covered 23.2 km2 (26.9% of the burned area), moderate-severity burns covered 59.9 km2 (69.5%), and high-severity and severe burns were limited, covering 2.8 km2 (3.3%) and 0.3 km2 (0.3%), respectively (Table 2). The predominance of low- and moderate-severity burning has important ecological implications for the Chilghoza pine forests of the Sherani district. This species is adapted to low-intensity surface fires, which can reduce understory competition and promote regeneration without causing canopy mortality [10,53]. The severity pattern observed here suggests that the bulk of the fire consumed grass, shrub, and litter layers rather than the forest canopy. This is consistent with surface fire behavior in the highland forest interior and the rapid combustion of fine fuels at the lower-elevation margins.
However, the combination of steep terrain (slopes up to 43°), persistent west–northwesterly winds, and continuous fuel availability across the highland forest creates conditions that could support more intense fire behavior. Drier or windier circumstances would likely amplify this risk. The limited but existing high-severity patches (2.8 km2, 3.3% of the burned area) serve as a reminder that risk remains, particularly in years with extended pre-monsoon dry periods or anomalously low fuel moisture. Recent vulnerability assessments of subtropical pine forests in Pakistan have suggested that such high-risk zones may benefit from spatially targeted fire prevention strategies, including fuel breaks, fuel-load monitoring, and early warning systems [12].

5.4. Comparison with Regional Fire Regimes

The May 2022 event in western Pakistan differs from fire regimes reported in other parts of the country. In Margalla Hills, fires are typically smaller in area but more frequent and are driven by a combination of human ignitions and seasonal drought [17,54]. In the Hindu Kush region of northern Pakistan, fires are often constrained by higher elevations and lower temperatures, with shorter fire seasons and lower FRP values [20,30]. In contrast, the Suleiman Range experiences a more arid pre-monsoon climate with prolonged dry periods, which may enable larger fires when ignition occurs under favorable wind conditions, as suggested by the May 2022 event.
Previous research on Margalla Hills fires reported that the average quarterly mean wind speed correlated with the daily severity rating of forest fires [17]. The present case study identifies a similar positive association between the ERA5 wind speed and the FRP (r = +0.51, p = 0.005). However, as noted in earlier sections, the near-complete collinearity between the wind speed and 2 m temperature in this dataset (r = +0.86) prevents the independent attribution of a wind-speed effect. The present results should be regarded as broadly consistent with Margalla Hills’ findings rather than as independent confirmation. Studies in the neighboring Hindu Kush region have identified slope and elevation as primary controls on fire occurrence patterns [11,19], which is consistent with our finding that topographic variables exhibited the strongest individual associations with the FRP during this event. Comparable satellite-based dNBR analyses across the Indian Himalayas have likewise documented long-term increases in burned area linked to land surface temperature, pre-fire soil moisture, and vegetation conditions, demonstrating the wider regional applicability of remote-sensing-based burn severity mapping in mountainous South Asia [55].

5.5. Implications for Fire Monitoring in Data-Sparse Mountain Regions

The findings of this exploratory case study point toward several considerations for fire monitoring and research priorities in the Suleiman Range and other data-sparse mountainous regions, rather than prescriptive operational recommendations that the present analysis cannot fully support.
First, the substantial mismatch between the ERA5 wind direction and observed fire progression highlights the need for higher-resolution wind information in fire studies of complex terrain. Coarse-resolution reanalysis can provide useful synoptic context, but it should not be used as a stand-alone basis for predicting fire spread in topographically complex landscapes. Where feasible, dynamical downscaling of reanalysis to a few-kilometer grid (e.g., WRF), assimilation of available station observations, or simpler topographic wind models can substantially improve representation of the near-surface wind field that fire fronts actually experience [22,23]. In regions such as the Suleiman Range, where surface-based meteorological stations are sparse, even a small number of well-sited automatic weather stations on representative ridges and valleys would meaningfully constrain the local wind field.
Second, monitoring of pre-monsoon fire activity in the Suleiman Range and adjacent Hindu Kush regions remains valuable despite data limitations. The May 2022 event burned approximately 86 km2, predominantly at low to moderate severity, and affected ecologically and economically significant Chilghoza pine stands at mid-elevations. Continued multi-sensor surveillance combining MODIS and VIIRS active fire detections with periodic Landsat or Sentinel-2 burn severity mapping is appropriate for detecting and documenting such events, particularly given limited ground access during active fire periods.
Third, future fire risk and management planning in the region would benefit from integrating satellite observations with fuel condition indicators (e.g., live and dead fuel moisture proxies, NDVI departures from seasonal climatology), socioeconomic information on ignition sources, and—where possible—operational-grade meteorological forecasts. Investment in regional early warning capability, which builds on existing efforts in the broader Hindu Kush Himalaya region [56], offers a more promising path than reliance on any single data source does. Specific recommendations for fuel management, prescribed burning, or fuel-break placement in particular elevation bands or forest types would require dedicated field-based fire behavior and fuel load studies that the present case study cannot substitute for.

5.6. Limitations and Future Work

This study has several limitations. First, the four datasets used in this analysis have markedly different native resolutions (MODIS 1 km, Landsat 30 m, ERA5 ~27 km, and MOD13Q1 NDVI 250 m), introducing unquantified uncertainty when comparing grid-averaged ERA5 winds with sub-kilometer fire-front behavior. MODIS-active fire detections (1 km resolution) cannot capture fine-scale fire dynamics, whereas ERA5 (~27 km resolution) smooths local topographic effects on wind patterns and is known to underestimate near-surface wind speeds in complex terrain by approximately 30–50% [22,23]. Our reported wind speeds at fire points (0.42–2.58 m/s) should therefore be interpreted as conservative estimates of the actual near-surface flow. Ground-based observations from Pakistan Meteorological Department stations were not available for the fire period, preventing a quantitative bias assessment against in situ measurements. Consequently, the wind speeds reported here (0.42–2.58 m/s) should be interpreted as lower-bound estimates.
Second, the fire event was relatively short in duration (11 days). The total of 29 wildfire-classified detections—24 of which occurred on a single day (20 May) in close spatial proximity—constrained the statistical power of the correlation and spread-alignment analyses and introduced spatial autocorrelation into the dataset. The ≥2 km distance filter applied in the spread-alignment analysis (Section 4.5) partly mitigates this by excluding near-coincident pairs within a single MODIS pass, but formal spatial autocorrelation diagnostics (e.g., Moran’s I) would be appropriate for future multi-event datasets with broader spatial coverage. We have therefore treated all the quantitative results as descriptive of this single event rather than as inferential evidence for general wind–fire relationships.
Third, the burn severity classification relied on the standard USGS/Key & Benson [38] dNBR thresholds without independent field validation, as ground access was not feasible during active burning in this remote terrain. Cross-validation against the MCD64A1 MODIS burned-area product or independent Sentinel-2 burn-area estimates would increase confidence in the severity classification. Socioeconomic variables (distance to roads, population density, land use) were not included but are known to influence fire ignition and suppression patterns in Pakistan [57,58]. Field-based fuel-load and fuel-moisture data, which would be valuable for interpreting the FRP–elevation and FRP–slope relationships documented here, were also not available and would require dedicated ground campaigns that are difficult to conduct during active fire events in this remote terrain.
Fourth, the present study intentionally focused on wind as the primary meteorological driver, which is in line with the original research objectives. A more complete multivariate analysis incorporating live and dead fuel moisture, antecedent precipitation, and anthropogenic ignition factors would improve the interpretation of fire behavior. The strong collinearity between the wind speed and 2 m temperature observed in this dataset (r = +0.86, p < 0.001) reflects coincident temporal trends across the short 11-day window and prevents the attribution of independent meteorological effects. Longer multi-event records—ideally combining synoptic-scale and downscaled wind information—would help disentangle these drivers.
Future work would benefit from several extensions of the present analysis. These include higher-resolution satellite data (e.g., VIIRS at 375 m and Sentinel-2 at 10 m) for finer-scale fire-front mapping, the application of dynamical downscaling (e.g., WRF) to obtain near-surface wind fields at a few-kilometer grid, and the performance of fuel mapping in representative forest and grassland landscapes of the Suleiman Range.

6. Conclusions

This exploratory case study examined the May 2022 wildfire in the Suleiman Range of western Pakistan using MODIS active fire detection, Landsat-derived burn severity, ERA5 reanalysis, MOD13Q1 NDVI, and SRTM topographic data. The integrated workflow illustrates both the value and the limits of public satellite and reanalysis datasets for characterizing wildfire behavior in data-sparse mountainous regions.
dNBR analysis indicated that the fire burned approximately 86 km2, predominantly at low to moderate severity (low: 26.9%; moderate: 69.5%; high: 3.3%; severe: 0.3%). Limited high-severity burning was associated with the Chilghoza pine stands in the Sherani–Musakhel highlands, warranting continued monitoring of these ecologically and economically important forests.
Across 29 wildfire-classified detections, the ERA5 wind speed at fire points (0.42–2.58 m/s) showed a moderate positive Pearson correlation with the FRP (+0.51, p = 0.005). We treat this correlation as descriptive of this event rather than as inferential evidence of a general relationship, given the small sample size and the concentration of 24 of 29 detections on a single day. Strong collinearity between the wind speed and 2 m temperature (r = +0.86, p < 0.001) across the short fire period further precluded the attribution of independent meteorological effects. The wind direction at the fire points was highly consistent (circular mean 298.7°, circular standard deviation 23.3°), corresponding to flow from the west–northwest toward the east–southeast—broadly compatible with the observed eastward fire progression from the Sherani–Musakhel border region to the D.I. Khan piedmont. Quantitative spread analysis revealed that 4 of the 8 spread events at distances exceeding 2 km (50%) aligned with the ERA5 downwind direction within ±45°, well above the 25% baseline expected by chance.
Topographic variables showed substantially stronger associations with the FRP than with the wind speed alone: elevation (r = −0.70, p < 0.001) and slope (r = −0.33, p = 0.081). The negative elevation–FRP correlation reflects the contrast between moderate-FRP detection in the high-elevation Chilghoza pine forest interior and the single highest-FRP detection (52.1 MW) in the lower-elevation grassland of the D.I. Khan piedmont. This suggests that fuel type—rather than elevation per se—modulates the per-pixel intensity signal recorded by the MODIS.
The principal methodological lesson is that coarse-resolution reanalysis describes the synoptic atmospheric context but does not resolve the local terrain-channeled winds that determine fire-front behavior in complex landscapes. Fire studies in data-sparse mountainous regions therefore benefit from higher-resolution wind information—through dynamical downscaling, mesoscale modelling, or networks of well-sited surface stations—and from explicit fuel-type classification across multiple events. Despite the limitations inherent in a single-event case study, the integrated workflow demonstrated here provides a transferable template for wildfire characterization in other data-sparse mountainous regions of South Asia and beyond. Future studies in similar environments should therefore prioritize higher-resolution wind information and explicit fuel-type classification.

Author Contributions

R.K.: Conceptualization, methodology, data curation, visualization, investigation, software and validation and writing-original draft preparation. S.W.: Supervision. All authors have read and agreed to the published version of the manuscript.

Funding

This work was supported by the National Natural Science Foundation (52321003).

Data Availability Statement

All the data used in this study are publicly available from the following sources: MODIS active fire data from NASA FIRMS (https://firms.modaps.eosdis.nasa.gov/, accessed on 5 March 2026), Landsat imagery from USGS EarthExplorer (https://earthexplorer.usgs.gov/, accessed on 12 March 2026), ERA5 reanalysis from ECMWF Copernicus Climate Data Store (https://cds.climate.copernicus.eu/, accessed on 18 March 2026), SRTM DEM from NASA EarthData (https://earthdata.nasa.gov/, accessed on 22 March 2026), and ESA WorldCover from ESA Climate Change Initiative (https://esa-worldcover.org/, accessed on 25 March 2026). The processed datasets and codes used for analysis are available from the corresponding author upon reasonable request.

Conflicts of Interest

The authors declare that they have no conflicts of interest.

Abbreviations

The following abbreviations are used in this manuscript:
FRPFire Radiative Power
NBRNormalized Burn Ratio
dNBRDifferenced Normalized Burn Ratio
NDVINormalized Difference Vegetation Index
MODISModerate Resolution Imaging Spectroradiometer
FIRMSFire Information for Resource Management System
ERA5ECMWF Reanalysis 5
ECMWFEuropean Centre for Medium-Range Weather Forecasts
DEMDigital Elevation Model
SRTMShuttle Radar Topography Mission
NIRNear-Infrared
SWIRShortwave Infrared
MWMegawatts
u10Zonal Wind Component (10 m height)
v10Meridional Wind Component (10 m height)
KPKKhyber Pakhtunkhwa
HKHHindukush–Karakoram–Himalayas
GISGeographic Information System

References

  1. Shahzad, F.; Mehmood, K.; Hussain, K.; Haidar, I.; Anees, S.A.; Muhammad, S.; Ali, J.; Adnan, M.; Wang, Z.; Feng, Z. Comparing machine learning algorithms to predict vegetation fire detections in Pakistan. Fire Ecol. 2024, 20, 57. [Google Scholar] [CrossRef]
  2. Xu, Z.; Li, J.; Cheng, S.; Rui, X.; Zhao, Y.; He, H.; Xu, L. Wildfire Risk Prediction: A Review. arXiv 2024, arXiv:2405.01607. [Google Scholar]
  3. Mannan, A.; Feng, Z.; Ahmad, A.; Beckline, M.; Saeed, S.; Liu, J.; Shah, S.; Amir, M.; Ammara, U.; Ullah, T. CO2 Emission Trends and Risk Zone Mapping of Forest Fires in Subtropical and Moist Temperate Forests of Pakistan. Appl. Ecol. Environ. Res. 2017, 17, 2983–3002. [Google Scholar]
  4. Thapa, S.; Maraseni, T.; Dhonju, H.K.; Shakya, K.; Shakya, B.; Apan, A.; Banerjee, B. Predictive Assessment of Forest Fire Risk in the Hindu Kush Himalaya (HKH) Region Using HIWAT Data Integration. Remote Sens. 2025, 17, 2255. [Google Scholar] [CrossRef]
  5. Jones, M.W.; Kelley, D.I.; Burton, C.A.; Di Giuseppe, F.; Barbosa, M.L.F.; Brambleby, E.; Hartley, A.J.; Lombardi, A.; Mataveli, G.; McNorton, J.R.; et al. State of Wildfires 2023–2024. Earth Syst. Sci. Data 2024, 16, 3601–3685. [Google Scholar] [CrossRef]
  6. Filippelli, E.; Ahmad, A.; Diolaiuti, G.A.; Senese, A. National-Scale Economic Valuation of Forest Ecosystem Services in Pakistan Using Sentinel-2 Data. Land 2026, 15, 308. [Google Scholar] [CrossRef]
  7. Abbas, A. The Repercussions of Deforestation. Dawn. 3 November 2025. Available online: https://www.dawn.com/news/print/1952710 (accessed on 1 April 2026).
  8. Nafees, M.; Rashid, W.; Sultan, H.; Khan, N.H.; Khurshid, M.; Ali, W.; Bohnett, E. Occurrence, Probable Causes, and Management of Forest Wildfires in the Northern Highlands of Pakistan. Environ. Chall. 2024, 15, 100930. [Google Scholar] [CrossRef]
  9. Shabbir, A.; Zia, S.; Kazim, A.H.; Kasi, M.; Jamshed, M.A.; Waseem, L.A.; Iqbal, N.; Abbasi, Q.H.; Ur-Rehman, M. Detecting Post-Fire Burn Severity Level Using Sentinel-2 and MODIS Satellite Data. Preprint 2024. [Google Scholar] [CrossRef] [PubMed]
  10. PPI News Agency. Balochistan Govt Claims Controlling Forest Inferno. PPI News Agency, 23 May 2022. Available online: https://ppinewsagency.com/balochistan-govt-claims-controlling-forest-inferno-2/ (accessed on 1 April 2026).
  11. Iman, A.; Rahman, A.; Rahman, G. Geospatial Analysis of Wildfire Patterns and Temporal Trends in Kohat Division, Pakistan, Using Remote Sensing and GIS. Ecol. Quest. 2025, 36, 65–81. [Google Scholar] [CrossRef]
  12. Muhammad, S.; Nizami, S.M.; Mehmood, K.; Hussain, M.; Anees, S.A.; Shahzad, F.; Khan, W.R. Machine Learning-Based Forest Fire Vulnerability Assessment in Subtropical Chir Pine Forests of Pakistan. Fire Ecol. 2025, 21, 72. [Google Scholar] [CrossRef]
  13. Daraz, U.; Bojnec, Š.; Khan, Y. Socio-Economic Determinants of Human Negligence in Wildfire Incidence: A Case Study from Pakistan’s Peri-Urban and Rural Areas. Fire 2024, 7, 377. [Google Scholar]
  14. Muhammad, S.; Ali, A.; Mehmood, K.; Ahmad, H.; Hayat, M.; Khan, M.T.; Arbab, N.; Nizami, M.; Fahad, S. Temporal Variations in Burn Severity Among Various Vegetation Layers in Subtropical Pinus roxburghii (Chir Pine) Forest of Hindu Kush Mountain Range. Trees For. People 2024, 18, 100664. [Google Scholar]
  15. Tariq, A.; Shu, H.; Siddiqui, S. Monitoring Forest Fire Using Geo-Spatial Information Techniques and Spatial Statistics: One Case Study of Forest Fire in Margalla Hills, Islamabad, Pakistan. Preprint 2020. [Google Scholar] [CrossRef] [PubMed]
  16. Green, K.; Tukman, M.; Loudon, D.; Schichtel, A.; Gaffney, K.; Clark, M. Sonoma County Complex Fires of 2017: Remote Sensing Data and Modeling to Support Ecosystem and Community Resiliency. Calif. Fish Wildl. J. 2020, 106, 14–45. [Google Scholar] [CrossRef]
  17. Paul, B.; Dumka, U.C.; Bar, S. Forest Fire Regimes in the Northwestern Himalayas: Unravelling Microlevel Impact of Topography, Weather, and Human Activity on Fire Behaviour. Int. J. Remote Sens. 2025, 46, 2492413. [Google Scholar]
  18. Prabhakaran, A.; Srivastava, P. Analysis of prevailing atmospheric conditions during wildfire events in the Indian Himalayan region. Q. J. R. Meteorol. Soc. 2025, 151, e4918. [Google Scholar]
  19. Rahman, A.; Khan, N.; Bräuning, A.; Ullah, R.; Rahman, I.U. Effects of Environmental and Spatial Gradients on Quercus-Dominated Mountain Forest Communities in the Hindu-Kush Ranges of Pakistan. Saudi J. Biol. Sci. 2022, 29, 2867–2877. [Google Scholar] [PubMed]
  20. Wang, H.; Zhang, J.; Zhong, H.; Chen, L.; Fan, C. Effects of Slope on Fireline Shape and Heat Transfer in Surface Fires. Appl. Therm. Eng. 2025, 275, 126914. [Google Scholar] [CrossRef]
  21. Tariq, A.; Shu, H.; Gagnon, A.S.; Li, Q.; Mumtaz, F.; Hysa, A.; Siddique, M.A.; Munir, I. Assessing Burned Areas in Wildfires and Prescribed Fires with Spectral Indices and SAR Images in the Margalla Hills of Pakistan. Forests 2021, 12, 1371. [Google Scholar] [CrossRef]
  22. Tarek, M.; Brissette, F.P.; Arsenault, R. Evaluation of the ERA5 Reanalysis as a Potential Reference Dataset for Hydrological Modelling over North America. Hydrol. Earth Syst. Sci. 2020, 24, 2527–2544. [Google Scholar] [CrossRef]
  23. Zuo, P.; Chen, X.; Zhu, L. Applicability Assessment of ERA5 Surface Wind Speed Data Across Different Landforms in China. Atmosphere 2025, 16, 956. [Google Scholar] [CrossRef]
  24. Rafaqat, W.; Iqbal, M.; Kanwal, R.; Song, W. Study of Driving Factors Using Machine Learning to Determine the Effect of Topography, Climate, and Fuel on Wildfire in Pakistan. Remote Sens. 2022, 14, 1918. [Google Scholar] [CrossRef]
  25. Amin, G.; Imtiaz, I.; Haroon, E.; us Saqib, N.; Shahzad, M.I.; Nazeer, M. Assessment of Machine Learning Algorithms for Land Cover Classification in a Complex Mountainous Landscape. J. Geovis. Spat. Anal. 2024, 8, 34. [Google Scholar] [CrossRef]
  26. Rahman, G.; Rahman, A.; Ullah, S.; Dawood, M.; Moazzam, M.F.U.; Lee, B.G. Spatio-Temporal Characteristics of Meteorological Drought in Khyber Pakhtunkhwa, Pakistan. PLoS ONE 2021, 16, e0249718. [Google Scholar] [CrossRef] [PubMed]
  27. Pakistan Almanac. Khyber Pakhtunkhwa at a Glance. Available online: http://pakistanalmanac.com/khyberpakhtunkhwa-at-a-glance/ (accessed on 1 April 2026).
  28. Ahmad, A.; Khan, M.; Ahmad, T.; Ahmad, S.; Ullah, S.; Farooqi, A. Carbon Dynamics with Stand Structure and Species Diversity in the Hindu Kush Himalaya Ranges of Pakistan. Sci. Rep. 2025, 15, 35440. [Google Scholar] [CrossRef] [PubMed]
  29. Stauffer, K.W. Reconnaissance Geology of the Central Mastuj Valley, Chitral State, Pakistan; Open-File Report 75-556; U.S. Geological Survey: Reston, VA, USA, 1975. [Google Scholar]
  30. Ullah, H.; Khan, S.M.; Jaremko, M.; Jahangir, S.; Ullah, Z.; Ali, I.; Ahmad, Z.; Badshah, H. Vegetation Assessments Under the Influence of Environmental Variables from the Yakhtangay Hill of the Hindu-Himalayan Range, North Western Pakistan. Sci. Rep. 2022, 12, 20973. [Google Scholar] [CrossRef] [PubMed]
  31. Vujić, A.; Radenković, S.; Barkalov, A.; Tubić, N.K.; Likov, L.; Tot, T.; Popov, G.; Ačanski, M.; Gašić, S.; Popović, A.; et al. Taxonomic Revision of the Merodon tarsatus Species Group (Diptera, Syrphidae). Arthropod Syst. Phylogeny 2023, 81, 201–256. [Google Scholar] [CrossRef]
  32. Ullah, R.; Khan, N.; Rahman, A. Comparison of Invaded and Non-Invaded Sites: A Case Study of Rough Cocklebur (Xanthium strumarium L.) An Alien Invasive Species. Appl. Ecol. Environ. Res. 2021, 19, 1533–1548. [Google Scholar] [CrossRef]
  33. Kousar, S.; Khan, N.; Abbas, Z.; Harun, N.; Ishaq, K.; Khan, T.; Bussmann, R.W. Documenting the Wild Edible Plant’s Resources Used by Pushtoons, Balochis and Brahvis as Survival Strategy in the Arid Province of Balochistan, NW Pakistan. Preprint 2023. [Google Scholar] [CrossRef] [PubMed]
  34. Dawood, M.; Rahman, A.; Rahman, G.; Nadeem, B.; Miandad, M. Geo-Statistical Analysis of Climatic Variability and Trend Detection in the Hindu Kush Region, North Pakistan. Environ. Monit. Assess. 2024, 196, 4. [Google Scholar]
  35. Abbas, Z.; Khan, S.M.; Alam, J.; Peer, T.; Abideen, Z.; Bussmann, R.W.; Muhammad, S. Vegetation Dynamics Along Altitudinal Gradients in the Shigar Valley (Central Karakorum) Pakistan: Zonation, Physiognomy, Ecosystem Services and Environmental Impacts. Pak. J. Bot. 2021, 53, 1865–1874. [Google Scholar] [CrossRef]
  36. Ali, A.; Ashraf, M.I.; Gulzar, S.; Akmal, M.; Ahmad, B. Estimation of Soil Carbon Pools in the Forests of Khyber Pakhtunkhwa Province, Pakistan. J. For. Res. 2020, 31, 2313–2321. [Google Scholar]
  37. Hussain, W.; Badshah, L.; Ali, A. Quantitative Aspects of the Koh-e-Safaid Range Vegetation Across the Altitudinal Gradient in Upper Kurram Valley, Pakistan. Appl. Ecol. Environ. Res. 2019, 17, 9905–9924. [Google Scholar]
  38. Ul Haq, Z.; Rasheed, S.; Manan, F.; Kamran, S.; Shah, S.A.; Ahmad, H. Phytosociological Studies, Economic Value, and Sustainable Use of Alnus nitida: A Monophyletic Species of the Western Himalayas and Hindu Kush Region of the Sino-Japanese Belt of Pakistan. In Biodiversity, Conservation and Sustainability in Asia: Volume 2: Prospects and Challenges in South and Middle Asia; Springer International Publishing: Cham, Switzerland, 2022; pp. 287–307. [Google Scholar]
  39. Khan, S.; Hassan, M.U.; Khan, A. Environment, Agriculture, and Land Use Pattern. In Climate Change and Agriculture; IntechOpen: London, UK, 2019. [Google Scholar]
  40. Bilal, M. Ecological Conservation for Climate Resilience in Khyber Pakhtunkhwa & the Merged Districts. Daily Times Pakistan. 5 March 2026. Available online: https://dailytimespk.com/ecological-conservation-for-climate-resilience-in-khyber-pakhtunkhwa-the-merged-districts/ (accessed on 1 April 2026).
  41. Giglio, L.; Schroeder, W.; Justice, C.O. The Collection 6 MODIS Active Fire Detection Algorithm and Fire Products. Remote Sens. Environ. 2016, 178, 31–41. [Google Scholar] [CrossRef] [PubMed]
  42. Wooster, M.J.; Roberts, G.; Perry, G.L.W.; Kaufman, Y.J. Retrieval of Biomass Combustion Rates and Totals from Fire Radiative Power Observations: FRP Derivation and Calibration Relationships Between Biomass Consumption and Fire Radiative Energy Release. J. Geophys. Res. 2005, 110, D24311. [Google Scholar] [CrossRef]
  43. Parks, S.A.; Holsinger, L.M.; Panunto, M.H.; Jandt, R.R.; Parisien, M.A.; Miller, C. High-Severity Fire: Evaluating Its Key Drivers and Mapping Its Probability Across Western US Forests. Environ. Res. Lett. 2018, 13, 044032. [Google Scholar] [CrossRef]
  44. Key, C.H. Landscape Assessment: Ground Measure of Severity, the Composite Burn Index; and Remote Sensing of Severity, the Normalized Burn Ratio. In FIREMON: Fire Effects Monitoring and Inventory System; U.S. Department of Agriculture, Forest Service, Rocky Mountain Research Station: Fort Collins, CO, USA, 2004. [Google Scholar]
  45. Farr, T.G.; Rosen, P.A.; Caro, E.; Crippen, R.; Duren, R.; Hensley, S.; Kobrick, M.; Paller, M.; Rodriguez, E.; Roth, L.; et al. The Shuttle Radar Topography Mission. Rev. Geophys. 2007, 45, RG2004. [Google Scholar] [CrossRef]
  46. Singh, Y.; Bhandari, S.; Tamang, D.; Basnet, A.; Shrestha, R.; Awasthi, B. Comparison and Suitability Assessment of Slope Calculation Algorithms on Different Terrains Using Aerial Survey. Int. Arch. Photogramm. Remote Sens. Spat. Inf. Sci. 2019, 42, 129–136. [Google Scholar] [CrossRef]
  47. Parks, S.A. Mapping day-of-burning with coarse-resolution satellite fire-detection data. Int. J. Wildland Fire 2014, 23, 215–223. [Google Scholar]
  48. Jammalamadaka, S.R.; Sengupta, A. Topics in Circular Statistics; World Scientific: Singapore, 2001; Volume 5. [Google Scholar]
  49. Pakistan Today. Military Continues Relief Efforts to Control Balochistan Forest Fire. Pakistan Today, 21 May 2022. Available online: https://www.pakistantoday.com.pk/2022/05/21/military-continues-relief-efforts-to-control-balochistan-forest-fire (accessed on 1 April 2026).
  50. Arab News. Three Killed as Fire in World’s Largest Pine Nut Forest in Pakistan Enters Tenth Day. Arab News, 19 May 2022. Available online: https://www.arabnews.com/node/2085611/pakistan (accessed on 1 April 2026).
  51. Rothermel, R.C. A Mathematical Model for Predicting Fire Spread in Wildland Fuels; USDA Forest Service, Intermountain Forest & Range Experiment Station: Ogden, UT, USA, 1972; Volume 115. [Google Scholar]
  52. Seddouki, M.; Benayad, M.; Aamir, Z.; Tahiri, M.; Maanan, M.; Rhinane, H. Using Machine Learning Coupled with Remote Sensing for Forest Fire Susceptibility Mapping. Case Study Tetouan Province, Northern Morocco. Int. Arch. Photogramm. Remote Sens. Spat. Inf. Sci. 2023, 48, 333–342. [Google Scholar] [CrossRef]
  53. The Express Tribune. Persisting Wildfires. The Express Tribune, 7 June 2022. Available online: https://tribune.com.pk/story/2360315/persisting-wildfires (accessed on 1 April 2026).
  54. Haq, N.U.; Kontakiotis, G.; Janjuhah, H.T.; Rahman, F.; Tabassum, I.; Khan, U.; Khan, J.; Ahmad, Z.; Jamal, N. Environmental Risk Assessment in the Hindu Kush Himalayan Mountains of Northern Pakistan: Palas Valley, Kohistan. Sustainability 2022, 14, 16679. [Google Scholar] [CrossRef]
  55. Mamgain, S.; Roy, A.; Karnatak, H.C.; Chauhan, P. Satellite-based long-term spatiotemporal trends of wildfire in the Himalayan vegetation. Nat. Hazards 2023, 116, 3779–3796. [Google Scholar]
  56. Chen, R.; He, B.; Quan, X.; Lai, X.; Fan, C. Improving Wildfire Probability Modeling by Integrating Dynamic-Step Weather Variables over Northwestern Sichuan, China. Int. J. Disaster Risk Sci. 2023, 14, 313–325. [Google Scholar] [CrossRef]
  57. Yang, C.; Yao, P.; Wang, Q.; Wang, S.; Xing, D.; Wang, Y.; Zhang, J. XGBoost-Based Susceptibility Model Exhibits High Accuracy and Robustness in Plateau Forest Fire Prediction. Forests 2026, 17, 74. [Google Scholar] [CrossRef]
  58. Jalilian, S.; Shataee, S. Forest Wildfire Risk Mapping, Performance Comparison of Machine Learning Algorithms. Preprint 2023. [Google Scholar] [CrossRef] [PubMed]
Figure 1. Study area map. (A) Pakistan with provincial boundaries. (B) Detail of the Sherani, Musakhel, and D.I. Khan districts along the Balochistan–KPK border. (C) Wildfire progression timeline (19–28 May 2022). Fire detections are colored by date: red (19 May), orange (20 May), and yellow (29 May).
Fire 09 00283 g001
Figure 2. Pre-fire and post-fire NBR maps derived from Landsat 9 (NIR and SWIR2 bands). The differentiated NBR (dNBR) was computed from these layers to assess burn severity across the study area.
Fire 09 00283 g002
Figure 3. False-color composite (SWIR2–NIR–Red, Bands 7-5-4) from Landsat 9, showing pre-fire (8 May 2022) and post-fire (9 June 2022) conditions. In this band combination, healthy vegetation appears bright green, bare soil appears pink to light brown, water bodies appear dark, and recently burned areas appear in distinctive reddish-brown tones due to elevated SWIR2 reflectance from charred surfaces.
Fire 09 00283 g003
Figure 4. Spatial distribution of MODIS active fire points and burned areas with pre-fire and post-fire vegetation conditions. The main map shows wildfire-classified fire points (red circles) overlaid on the burned area boundary (black outline). Insets (a), (b), and (c) show the three district-level burned area (Sherani, Musakhel, and D.I. Khan, respectively). Panels (a1), (b1), and (c1) present zoomed views of the pre-fire vegetation conditions (8 May 2022), and panels (a2), (b2), (c2) show the post-fire vegetation conditions (9 June 2022) for the corresponding districts, illustrating vegetation greenness before and after the fire.
Fire 09 00283 g004
Figure 5. Zoomed analysis of the 86 km2 fire footprint. The main panel show: (A) burned area classification (low: green–yellow; moderate: orange–red; high: dark red); (B) SRTM-derived elevation (30 m resolution); (C) Slope map (degrees) derived from the DEM. The right-side insects (A1A3), (B1B3), and (C1C3) show zoomed views of the Sherani, Musakhel, and D.I.Khan districts for burn severity, elevation, and slope respectively. All panel are clipped to the fire boundary. Color ramps for each variable are shown in the respective legends.
Fire 09 00283 g005
Figure 6. Daily wind speed (color gradient, m/s) and direction (red arrows) from ERA5 for 17–22 May 2022. The black outlines show district boundaries. The wind direction is shown as vectors pointing downwind.
Fire 09 00283 g006
Figure 7. Hourly meteogram at the center of the burned area (31.55° N, 70.10° E) for 18–29 May 2022. (a) Wind speed (blue line) with FRP detections (red dots). (b) Wind direction (green line); circular mean 298.7° (red dashed line). (c) Temperature. (d) Relative humidity.
Fire 09 00283 g007
Figure 8. Fire progression map. MODIS detections are colored by date: red (19 May), orange (20 May), and yellow (28 May). The fire spread from the Sherani–Musakhel border (19–20 May) east to D.I. Khan (28 May). District boundaries are in black.
Fire 09 00283 g008
Figure 9. Temporal trends in mean ERA5 wind speed (blue line, left axis) and daily maximum FRP (bars, right axis) at fire detection points during 19–28 May 2022. The bars are colored on a dark-to-light yellow gradient, with darker yellow representing higher FRP values and lighter yellow representing lower FRP values. Both wind speed and maximum FRP increase from 19 May to 28 May 2022.
Fire 09 00283 g009
Figure 10. Distribution of ERA5 wind-from direction at the 29 wildfire detection points. The histogram shows a unimodal pattern centered near 299° (west–northwesterly flow). Circular mean = 298.7° (vertical dashed line); circular standard deviation = 23.3°.
Fire 09 00283 g010
Figure 11. Spatial distribution of 29 wildfire detections. The marker size and color indicate the FRP (MW, range 6.0–52.1). The arrows show the ERA5 wind direction (downwind) at each detection time; the arrow length is fixed for visual consistency. The highest-FRP detection (52.1 MW) occurred on 28 May in D.I. Khan (upper right).
Fire 09 00283 g011
Figure 12. Pearson correlation matrix among the FRP and environmental variables (n = 29). Both the elevation and the wind direction strongly and negatively correlated with the FRP (r = −0.70 each). The wind speed is moderately correlated with the FRP (r = +0.51) but strongly collinear with the temperature (r = +0.86), preventing independent attribution.
Fire 09 00283 g012
Figure 13. Scatter plot of ERA5 wind speed versus FRP at 29 detection points. The marker color indicates the elevation (m). The dashed line shows the linear regression (r = +0.51, p = 0.005). The apparent wind speed effect is confounded by the inverse relationship between elevation and wind speed within the dataset.
Fire 09 00283 g013
Table 1. Sequential filtering criteria applied to the MODIS Collection 6.1 active fire archive (19–29 May 2022).
StepCriterionThresholdDetections RetainedRationale
1Raw MODIS C6.1 detections, 18–29 May 2022None1921All thermal anomalies detected by FIRMS in the wider region [43]
2Study area bounding box31.30–31.80° N, 69.85–70.45° E174Restrict to Sherani/Musakhel/D.I. Khan districts
3Wildfire classification: confidence ≥ 80 AND FRP ≥ 10 MW AND persistence ≥ 2 daysAll criteria satisfied14High-confidence, intense, persistent detections (wildfire_high)
4Wildfire classification: confidence ≥ 70 AND FRP ≥ 5 MWAll criteria satisfied15Nominal-to-high confidence, moderate-FRP detections (wildfire_moderate)
5Final wildfire-classified detectionsAll criteria satisfied29Used for all wind–fire and topographic analyses
The detections meeting the persistence criterion (≥2 days) or the FRP criterion (≥10 MW) were retained as wildfire points.
Table 2. Burn severity classification of the May 2022 wildfire in the Sherani, Musakhel, and D.I. Khan districts, derived from Landsat 9 dNBR analysis.
Severity ClassdNBR RangeArea (km2)Percentage
Low0.10–0.2723.226.9%
Moderate0.27–0.4459.969.5%
High0.44–0.662.83.3%
Severe>0.660.30.3%
Total Burned 86.2100%
Table 3. Summary of fire spread alignment analysis. Spread events are defined as consecutive MODIS detection pairs in temporal order; the angular difference is computed between the observed bearing and the ERA5 downwind direction at the earlier point. The chance-only alignment rate under a ±45° tolerance is 25%.
FilterPairs (n)Aligned Within ±45°Alignment Rate (%)
All consecutive pairs28621.4
Pairs separated by ≥2 km (primary)8450.0
Pairs separated by ≥5 km3133.3
Between-day pairs only2150.0
Disclaimer/Publisher’s Note: The statements, opinions and data contained in all publications are solely those of the individual author(s) and contributor(s) and not of MDPI and/or the editor(s). MDPI and/or the editor(s) disclaim responsibility for any injury to people or property resulting from any ideas, methods, instructions or products referred to in the content.