1. Introduction
Fire is a disaster resulting from uncontrolled combustion processes, typically characterized by sudden onset, stochastic behavior, and complex spatiotemporal evolution [
1,
2,
3]. According to statistics from the National Fire and Rescue Administration of China, a total of 841,000 fire incidents were reported nationwide in 2025, indicating that nearly one fire occurs every minute [
4]. This poses a serious threat to property and life safety across society.
During the development of large cities in China, municipal districts have been established to better integrate resources, optimize urban layouts, and promote coordinated regional development. Municipal districts, also referred to as “urban districts,” are characterized by the following features: they are the core components of urban entities and centers of regional economic development; their populations are primarily urban, with high urbanization levels, high population density, and a relatively concentrated floating population; and they have relatively developed economies, along with thriving social, cultural, and financial sectors. These characteristics mean that once a fire occurs in a municipal district, it is more likely to result in severe casualties and property loss.
Xiaoshan District, located in Hangzhou, Zhejiang Province, exhibits notable characteristics of a municipal district. First, Xiaoshan District is a vital economic pillar of Hangzhou, with an industrial-dominated economic system. The district has a high number of industrial plants and warehouses, and the number of high-rise buildings ranks among the top in Hangzhou. Second, Xiaoshan District has a high population density and is the only municipal district in Hangzhou with a population exceeding two million. Moreover, the successful hosting of major international events such as the G20 Summit and the Asian Games in recent years has not only driven the prosperity of the surrounding society and culture but also significantly enhanced its international visibility. Consequently, the fire safety situation in Xiaoshan District has drawn considerable attention both domestically and internationally. As an illustrative example of an economically developed, highly urbanized municipal district with a massive population and a robust manufacturing base, the fire patterns in Xiaoshan District not only reflect its unique characteristics but also, to some extent, highlight common fire safety issues prevalent in municipal districts.
Analytical methods based on statistical theory are widely used to analyze the patterns and characteristics of fire incidents due to their simplicity and accuracy, and their reliability and effectiveness have been extensively validated [
5,
6,
7,
8,
9]. Yang et al. comprehensively analyzed the spatial, temporal, and causal patterns of fire incidents across China in 1998 using historical statistical data. Their findings underscored the necessity of implementing targeted fire protection strategies to address specific societal vulnerabilities, highlighting the critical role of continuous data monitoring in disaster management [
10]. Luo et al. systematically investigated the spatial, temporal, and causal patterns of fire incidents in China from 1997 to 2017. Through comprehensive data analysis, they concluded that the country has experienced a positive shift in overall fire mitigation, demonstrating a clear downward trend in total fire frequencies and related economic loss over the study period [
11]. By evaluating a historical dataset of 782 Chinese large-scale coal mine incidents from 1950 to 2016, Zhu et al. developed an analytical framework to identify the primary drivers of severe mining disasters. They discovered that fires and explosions are highly interchangeable and predominantly responsible for major casualties [
12]. Ren et al. conducted a comprehensive statistical investigation of Chinese tunnel fire incidents between 2000 and 2016, noting a consistent annual upward trend in occurrence. Their findings highlighted that over half of the emergencies stemmed from vehicular defects, with heavy freight transport accounting for a significant 58.2% of the cases, particularly clustering around tunnel entrances and exits [
13]. By examining twenty years of national fire statistics spanning from 1991 to 2010, Xin et al. conducted a comprehensive spatial-temporal and causal analysis of fire vulnerabilities in China. They discovered that although overall residential fatality risks are decreasing over time, critical danger spikes remain highly concentrated between midnight and 4 a.m., during winter weekends, and across developed eastern regions primarily due to electrical issues [
14]. Wang et al. evaluated the impact of various ignition sources on forest fire frequencies in China by analyzing statistical records from 2003 to 2017. Their quantitative analysis revealed that comprehensive management policies and accountability systems successfully contained major ignition sources, which reduced annual fire occurrences after 2008 and stabilized the incidents below 2000 in subsequent years [
15].
In summary, existing research has conducted statistical analyses on various types of fire incidents in China from different perspectives. However, some of the incident data used are relatively outdated, making it difficult for the conclusions to fully interpret and summarize the characteristics of fires in the current era. With the rapid development of China’s economic scale and industrial structure, the urbanization rate (permanent resident urbanization rate) has been steadily increasing year by year. In the Chinese statistical system, the urbanization rate usually refers to the permanent resident urbanization rate, which is defined as the proportion of permanent residents living in urban areas relative to the total permanent resident population. By the end of 2024, China’s urbanization rate had reached 67.00%. As key components of China’s urbanization process and centers of regional economic development, municipal districts exhibit higher urbanization levels. Taking Xiaoshan District as an example, its urbanization rate reached as high as 81.9% by the end of 2024. As leaders in new-type urbanization, municipal districts serve as important windows reflecting the characteristics of fires in areas with high urbanization rates in China during this new period. Therefore, understanding the patterns and characteristics of fire incidents in Xiaoshan District offers valuable mechanism-based transferability and empirical references for improving fire safety management in municipal districts with similar urbanization levels, industrial structures, and infrastructure complexity.
Given this, this study selects fire incident data from Xiaoshan District for the period from January 2020 to December 2023, analyzing it from the dimensions of time, space, and causal factors. By mining historical fire data and comparing it with national fire situations, the characteristics of fire incidents in Xiaoshan District are summarized. Based on this, countermeasures and suggestions for fire safety management in municipal districts are proposed, aiming to provide decision-making references for relevant management authorities in understanding and preventing fire incidents in municipal districts.
The remainder of this paper is organized as follows.
Section 2 introduces the fire incident dataset and the statistical analysis methods used in this study.
Section 3 presents the overall fire situation in Xiaoshan District during the study period and analyzes the temporal, spatial, and causal characteristics of fire incidents in detail.
Section 4 discusses targeted fire prevention and control implications for highly urbanized and industrialized municipal districts, and outlines research limitations. Finally,
Section 5 summarizes the main findings of this study.
2. Materials and Methods
Fire incident data were obtained from official fire management authorities in Xiaoshan District, covering the period from January 2020 to December 2023. The dataset was primarily compiled from fire alarm records, on-site firefighting and rescue reports, and post-fire investigation records completed by fire rescue personnel after each incident. These records are routinely collected and standardized within the local fire management system, thereby providing relatively reliable information for statistical analysis.
The collected dataset included seven categories of information: time of fire occurrence, administrative region, alarm address, fire location, fire cause, casualties, and direct property loss. These variables were selected because they represent the key temporal, spatial, causal, and consequence-related characteristics of fire incidents. Specifically, the time of fire occurrence was used to analyze temporal distribution patterns; administrative region and alarm address were used to investigate spatial aggregation characteristics; fire location and fire cause were used to identify high-risk premises and ignition factors; and casualties, together with direct property loss, were used to evaluate fire severity and impact. Therefore, the selected variables provide essential support for the temporal, spatial, and causal analyses conducted in this study. Statistical analysis methods were employed to examine the distribution characteristics and influencing factors of fire incidents in Xiaoshan District.
3. Results
During the statistical period, a total of 5011 fires occurred in Xiaoshan District, resulting in 3 deaths, 2 injuries, and direct property loss of 73.4076 million CNY (Chinese Yuan). According to the classification of fire incident levels, only one relatively large fire occurred in Xiaoshan District during the statistical period, with the remainder being general fires. This relatively large fire was a cargo aircraft fire at Xiaoshan International Airport on 8 January 2022, which caused approximately 30 million CNY in property loss and no casualties.
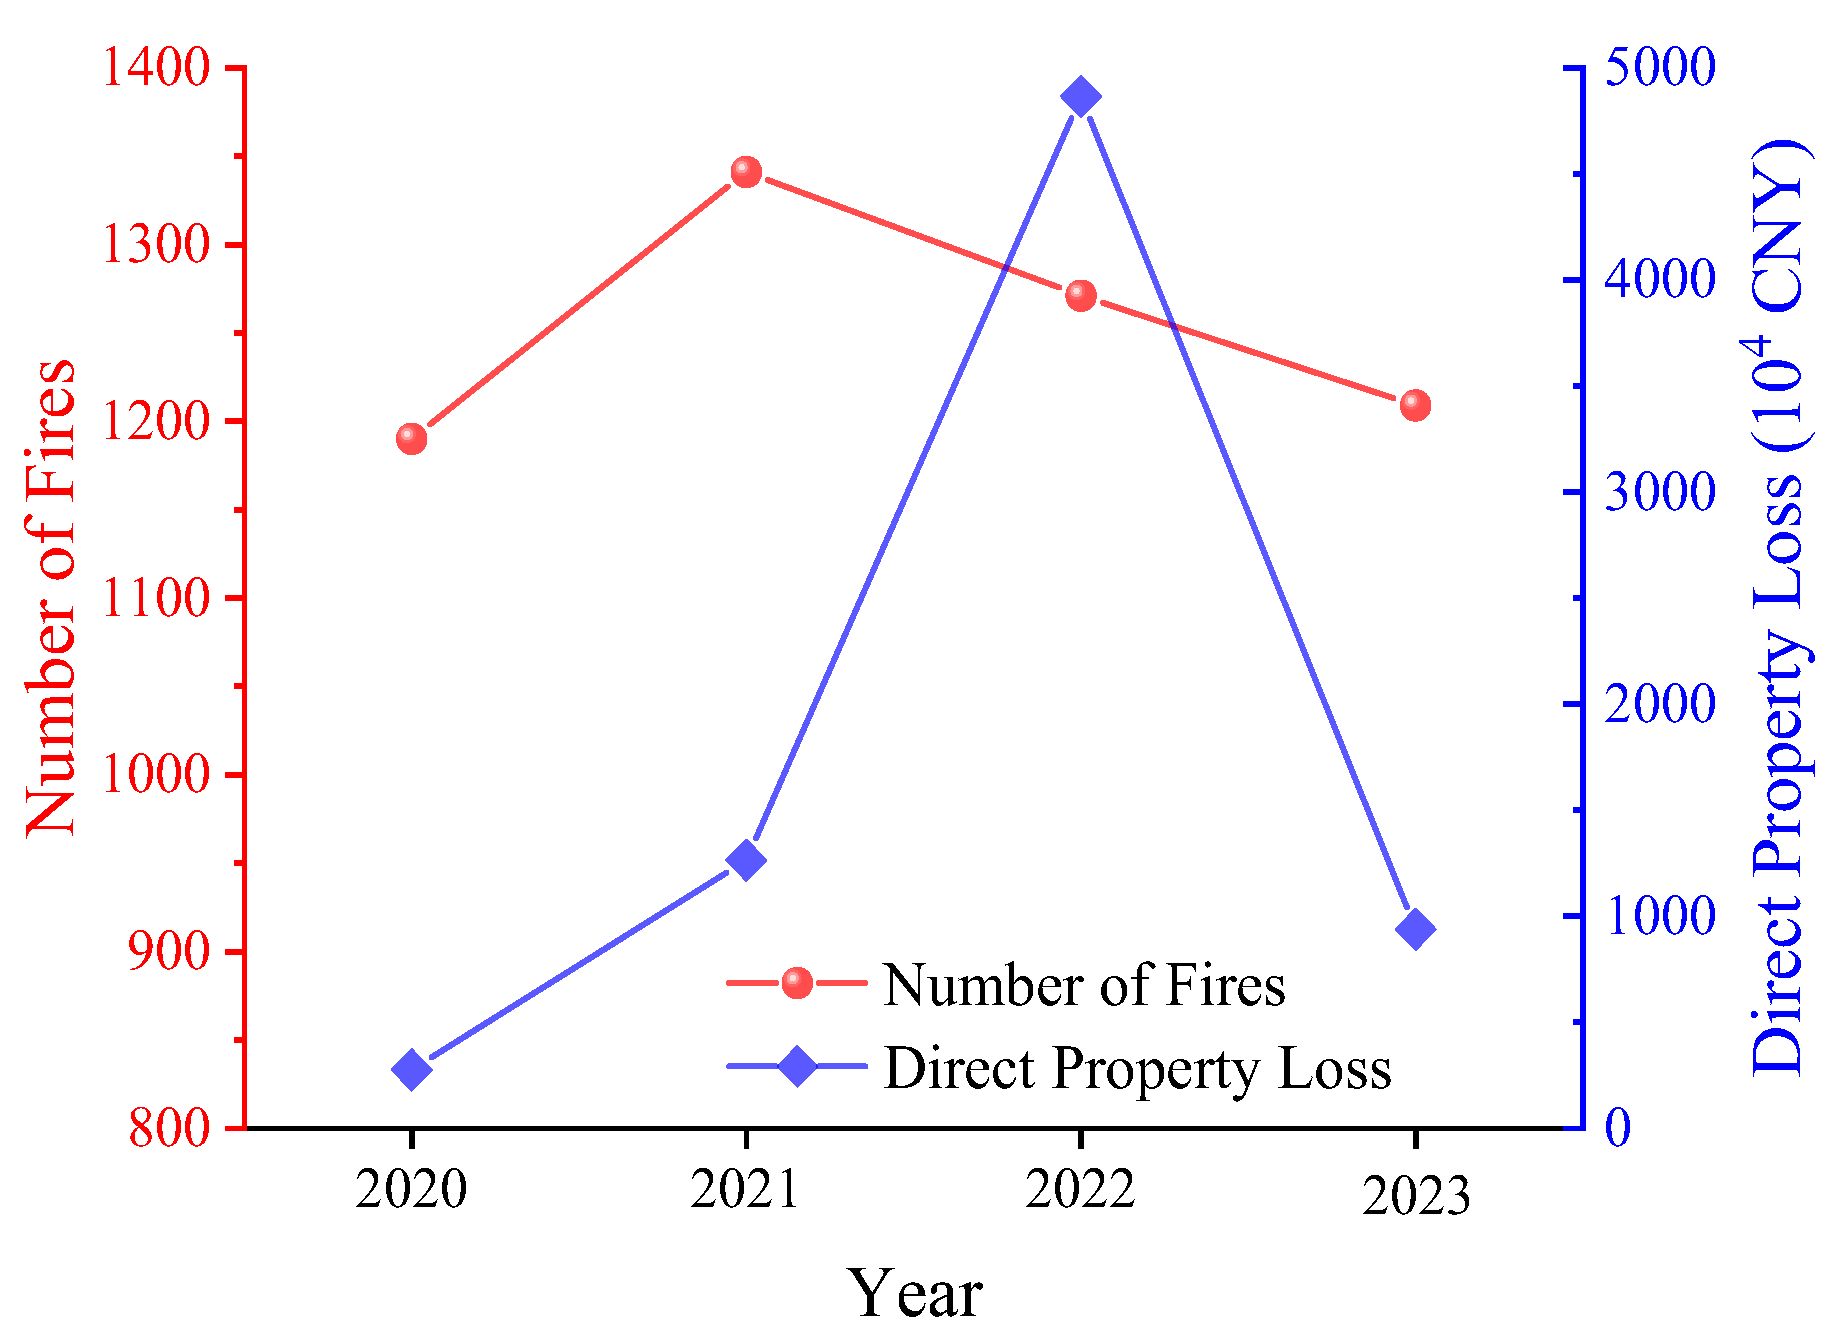
Figure 1 shows the annual variation in the number of fires and direct property loss in Xiaoshan District during the statistical period. It can be observed that the annual number of fires in Xiaoshan District ranged between 1200 and 1400, maintaining a stable fluctuation trend. Compared with the annual number of fires, annual direct property loss fluctuates more significantly. For instance, direct property loss in 2022 reached 48.642 million CNY, accounting for 66.26% of the total property loss during the statistical period and far exceeding that of other years. This was mainly due to a relatively large fire incident at Xiaoshan International Airport that year, which accounted for approximately 61.68% of the total property loss for that year.
Table 1 presents the casualties from fire incidents in Xiaoshan District during the statistical period. As shown in
Table 1, casualties occurred in all years except 2021. The causes of fire incidents resulting in casualties were electrical issues and arson, with the locations of these fires concentrated in residential premises and factories.
It should be noted that the death and injury ratio observed in Xiaoshan District during the study period was relatively low compared with publicly reported fire statistics in some other countries. From 2020 to 2023, a total of 5011 fire incidents resulted in only 3 deaths and 2 injuries, corresponding to approximately 0.60 deaths and 0.40 injuries per 1000 fires. This phenomenon should be interpreted cautiously because international fire statistics may differ substantially in terms of fire reporting thresholds, injury definitions, recording standards for minor injuries, and fire classification systems.
Several factors may have contributed to the relatively low death and injury ratio in Xiaoshan District. First, most fire incidents during the statistical period were classified as general fires with relatively limited spread and casualties. Second, municipal districts such as Xiaoshan generally possess relatively dense fire protection resources and comparatively rapid emergency response capabilities. In addition, many crowded and high-risk premises in urban districts are equipped with relatively complete fire protection facilities, which may help reduce fire-related injuries. Nevertheless, due to differences in statistical systems among countries, direct comparisons of fire injury rates should be treated with caution.
The fire incidence rate per 10,000 population [
16], fire mortality rate per 100,000 population [
17], and fire loss rate per 100 million CNY of GDP (Gross Domestic Product) [
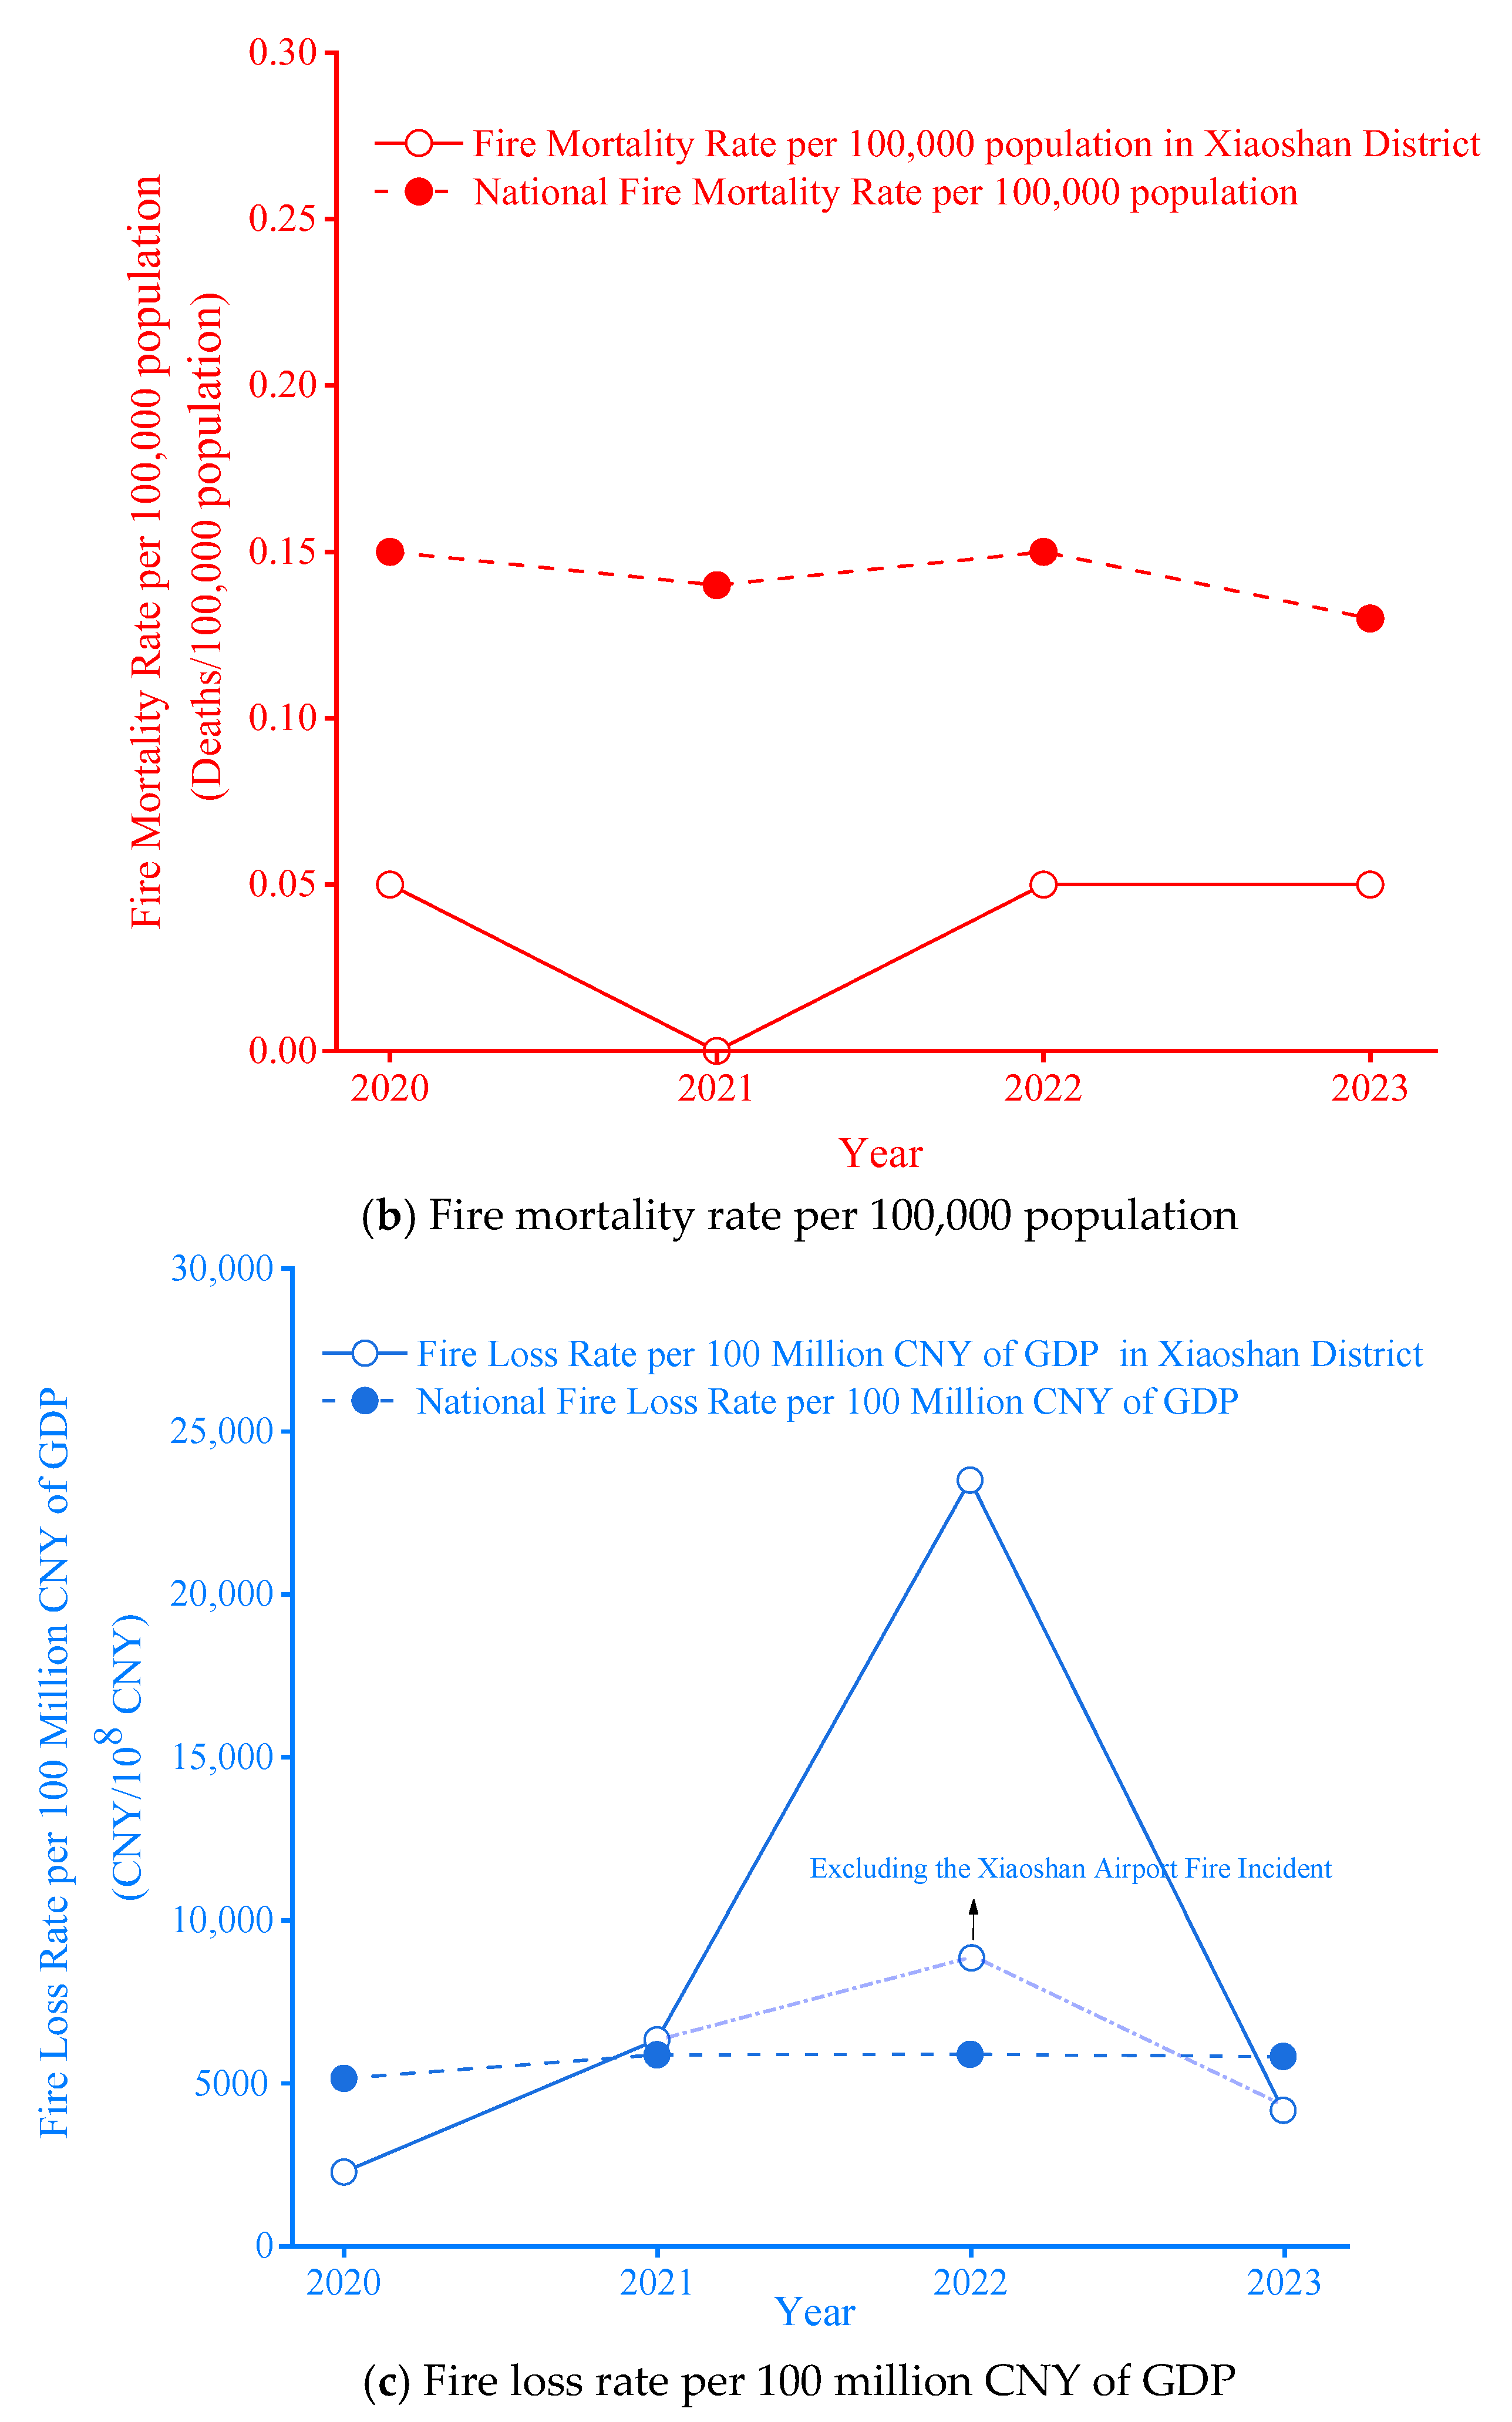
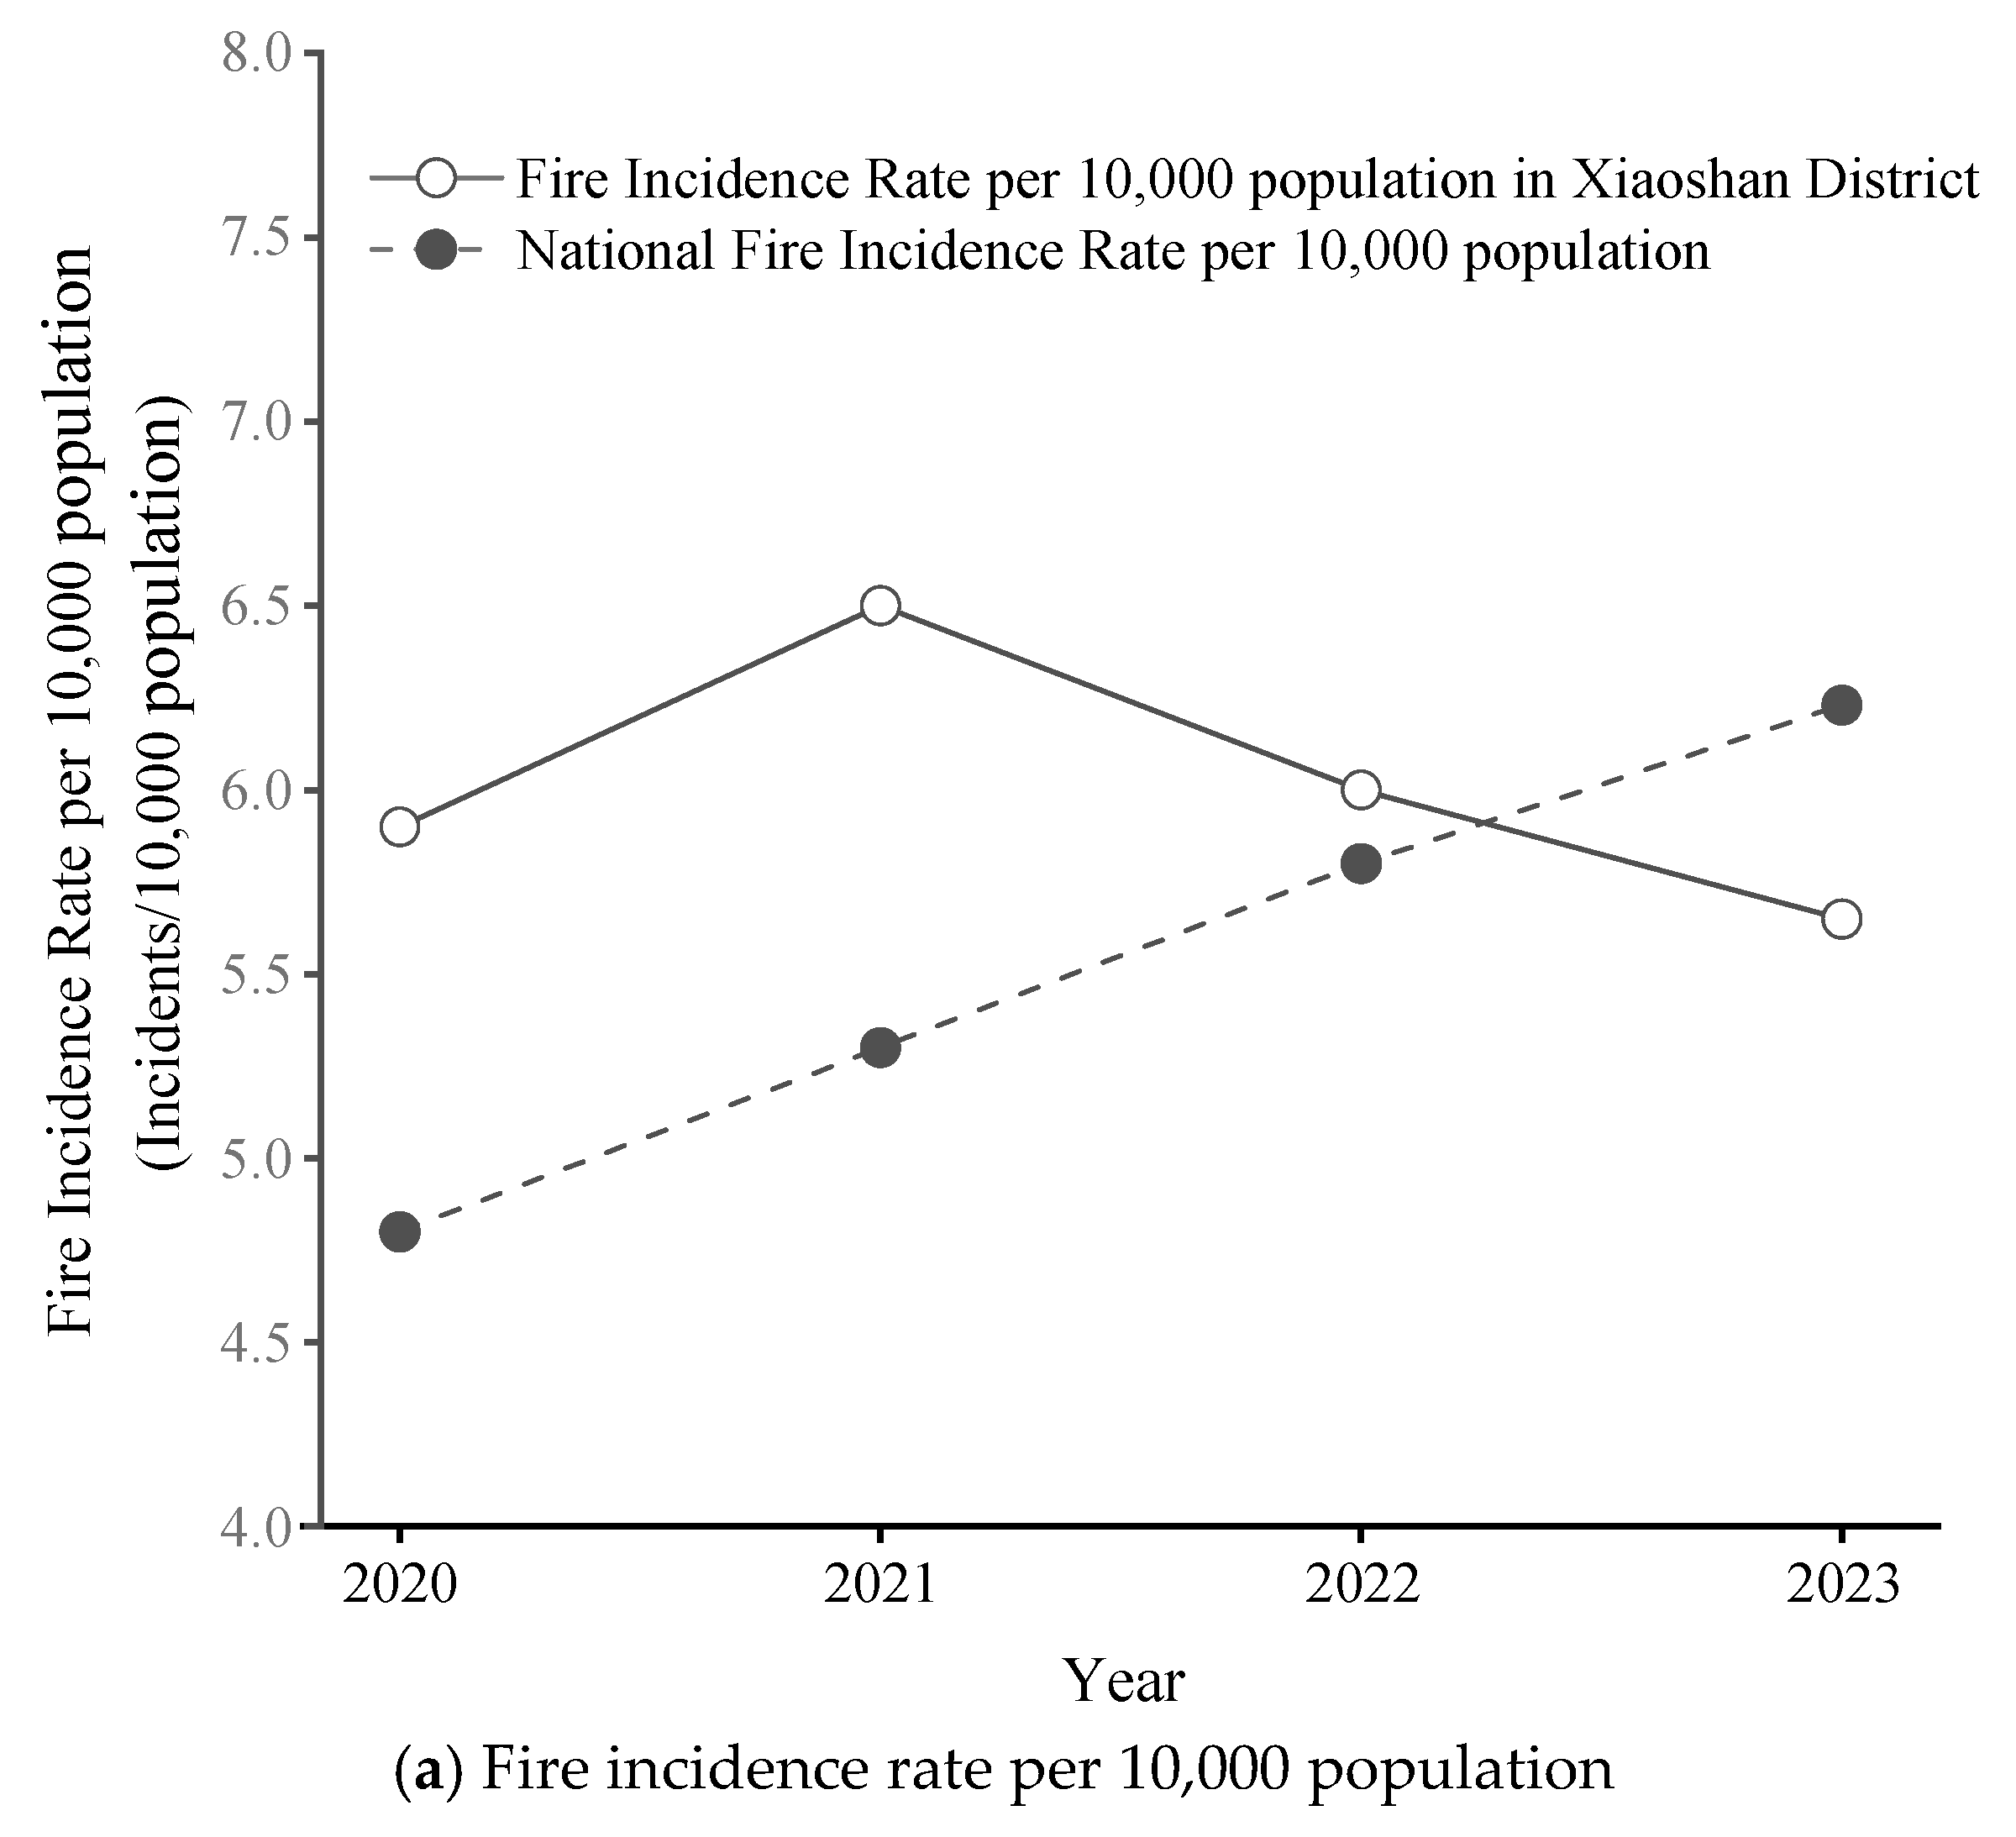
18] are important indicators for comprehensively evaluating the effectiveness of fire prevention, the impact of fire hazards, the effectiveness of emergency response systems, and the extent of fire impact on the economy in a region. This study compares the recent fire situation in Xiaoshan District with the national situation [
19,
20,
21,
22], with the results shown in
Figure 2.
As shown in
Figure 2, from 2020 to 2023, the national fire incidence rate per 10,000 population continuously increased from 4.83 to 6.23 fires per 10,000 population, indicating that the pressure on fire prevention nationwide has been increasing in recent years, and the construction of fire protection facilities still needs to be strengthened. In contrast, the fire incidence rate per 10,000 population in Xiaoshan District decreased year by year after peaking in 2021, and for the first time during the statistical period, it fell below the national average in 2023. This indicates that fire prevention and control in Xiaoshan District have been consistently improving in recent years. It also reflects that municipal districts, while experiencing rapid urbanization and industrial agglomeration, have achieved phased results by optimizing the allocation of fire protection resources and strengthening supervision. The fire mortality rate per 100,000 population in Xiaoshan District remained consistently below the national average during the statistical period, reflecting that although fires are relatively frequent in Xiaoshan District, the emergency response and fire rescue efforts are comparatively more effective, thereby minimizing casualties. This demonstrates that municipal districts, with their higher density of fire protection resources and stronger emergency response capabilities, tend to have lower casualty rates. Furthermore, during the statistical period, the fire loss rate per 100 million CNY of GDP nationwide was relatively stable (ranging from 5000 to 6000 CNY per 100 million CNY), while that of Xiaoshan District fluctuated significantly. Notably, in 2022, solely due to one relatively large fire incident at Xiaoshan International Airport, the fire loss rate per 100 million CNY of GDP in Xiaoshan District reached approximately four times the national average. This reveals that municipal districts, characterized by highly concentrated economies and complex industrial structures, are highly susceptible to significant economic loss once an incident occurs, with a risk sensitivity significantly higher than the national average. Therefore, municipal districts such as Xiaoshan District need to further optimize their fire prevention and control systems and emergency management mechanisms. This can be achieved by identifying high-fire-risk areas and key locations in advance and improving the risk resilience of critical infrastructure to reduce direct loss from fire incidents.
3.1. Time Distribution Characteristics of Fire Incidents
The occurrence of fire incidents is often closely related to time.
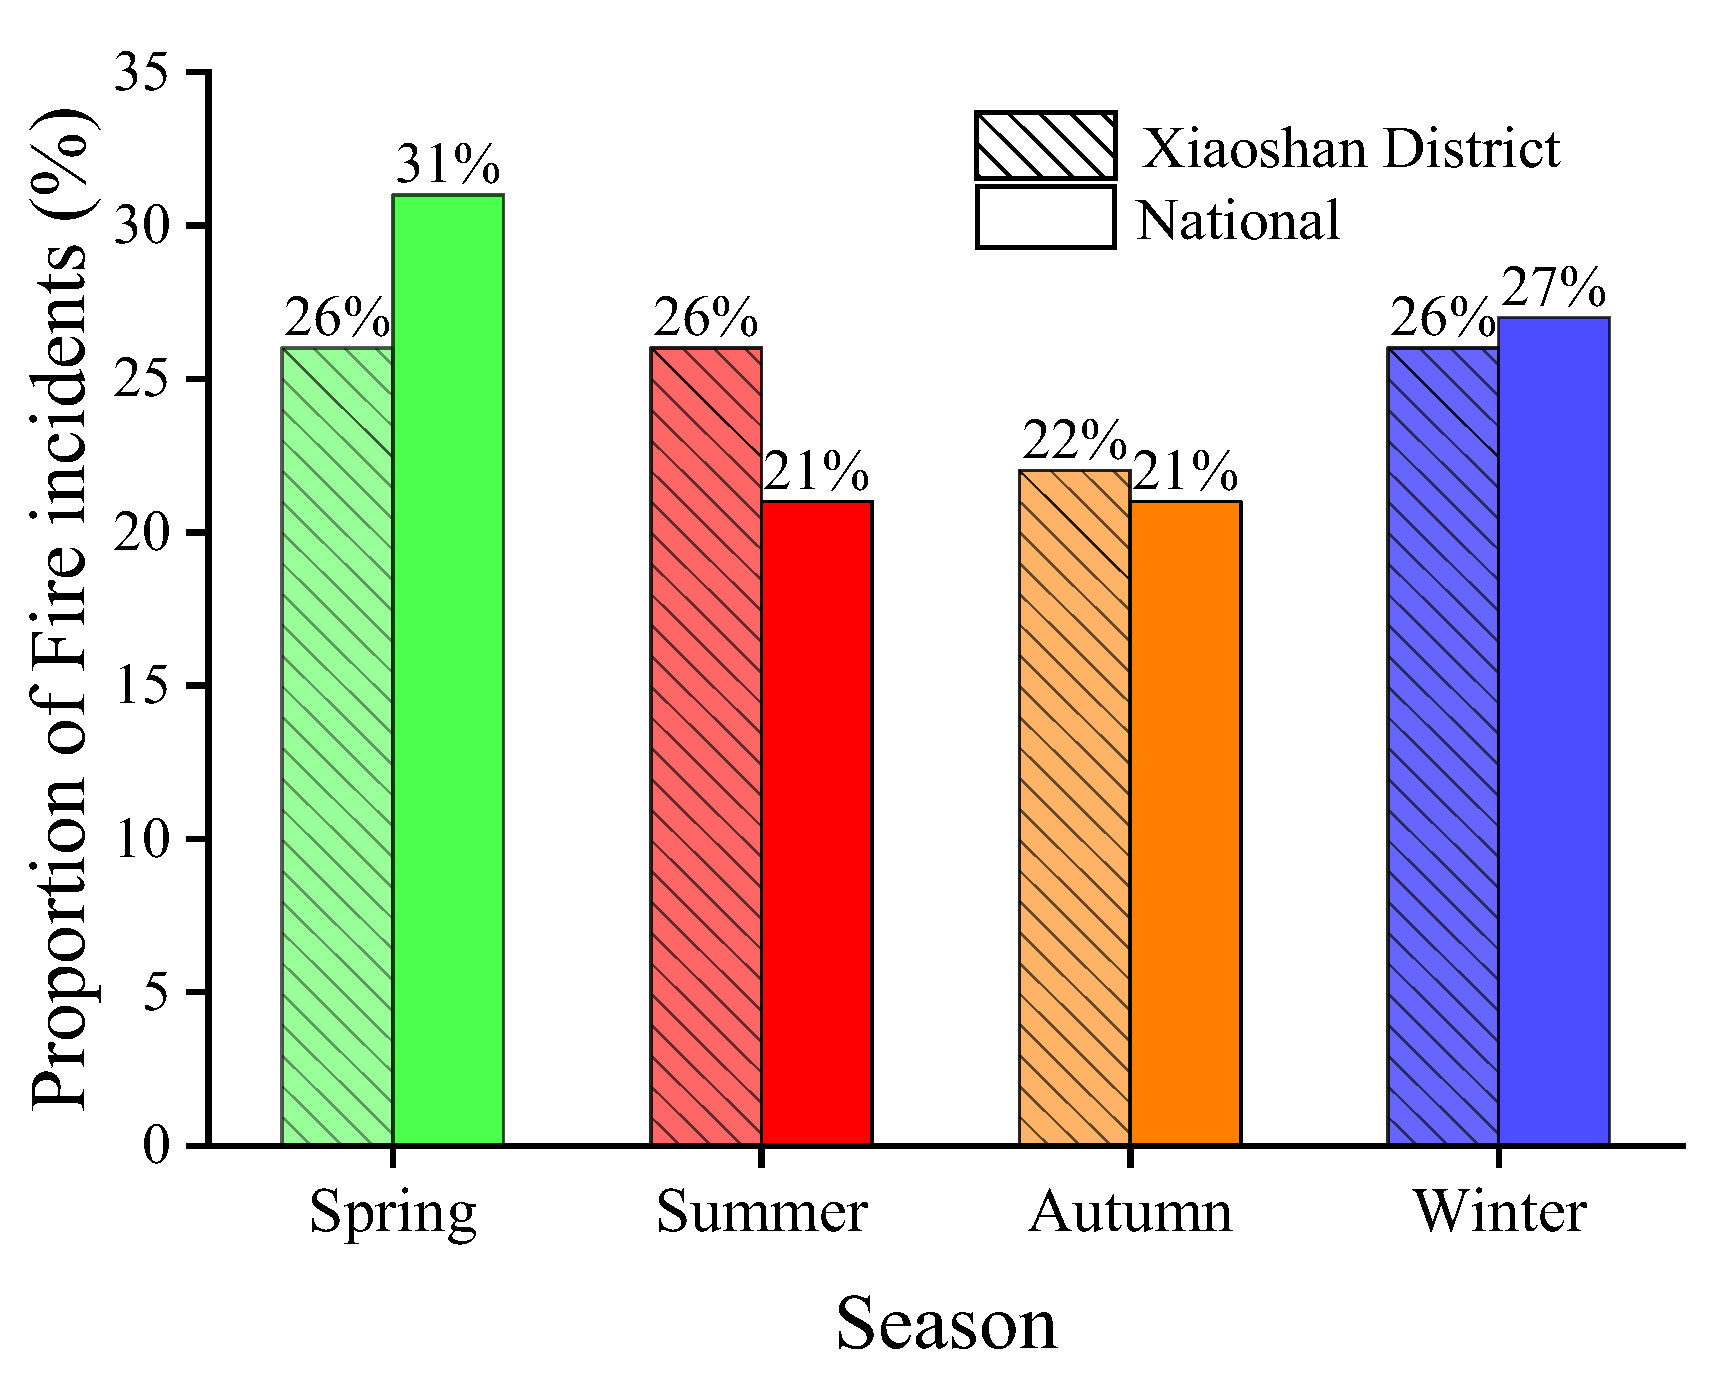
Figure 3 compares the seasonal proportion of fire incidents in Xiaoshan District with the national situation [
19].
As shown in
Figure 3, there is a significant seasonal variation in fire incidents nationwide, with higher frequencies in spring and winter, and lower frequencies in summer and autumn. The seasonal distribution of fire incidents in Xiaoshan District is similar to the national pattern in autumn and winter, while there are notable differences in spring and summer. In spring, the proportion of fire incidents in Xiaoshan District (26%) is significantly lower than the national average (31%), with a difference of 5%. This difference may be attributed to the dry climate, frequent strong winds in northern regions, and traditional farming activities such as straw burning during spring plowing, which elevate the national statistics [
23]. In summer, the proportion of fire incidents in Xiaoshan District (26%) is notably higher than the national average (21%). Further data analysis suggests that this phenomenon is related to Xiaoshan District’s high-temperature climate in summer and its spatial utilization patterns. During the four-year statistical period, Xiaoshan District experienced 113 days of temperatures ≥35 °C in summer, accounting for 30.7% of the total summer days. High-temperature conditions significantly increase the likelihood of certain types of outdoor fires. Specifically, in summer, outdoor fires caused by high temperatures and dryness, such as spontaneous combustion of vegetation or garbage in green belts, account for 53.5%, while fires caused by overheating of outdoor transformers, air conditioning units, and industrial cooling equipment account for 46.5%. This indicates that the fire risk in the district is the result of the interaction between high-temperature climate and high-density urban infrastructure. To address the summer heat challenges, districts like Xiaoshan should focus on enhancing heat dissipation monitoring of outdoor electrical facilities and clearing flammable materials from green isolation zones to implement targeted prevention.
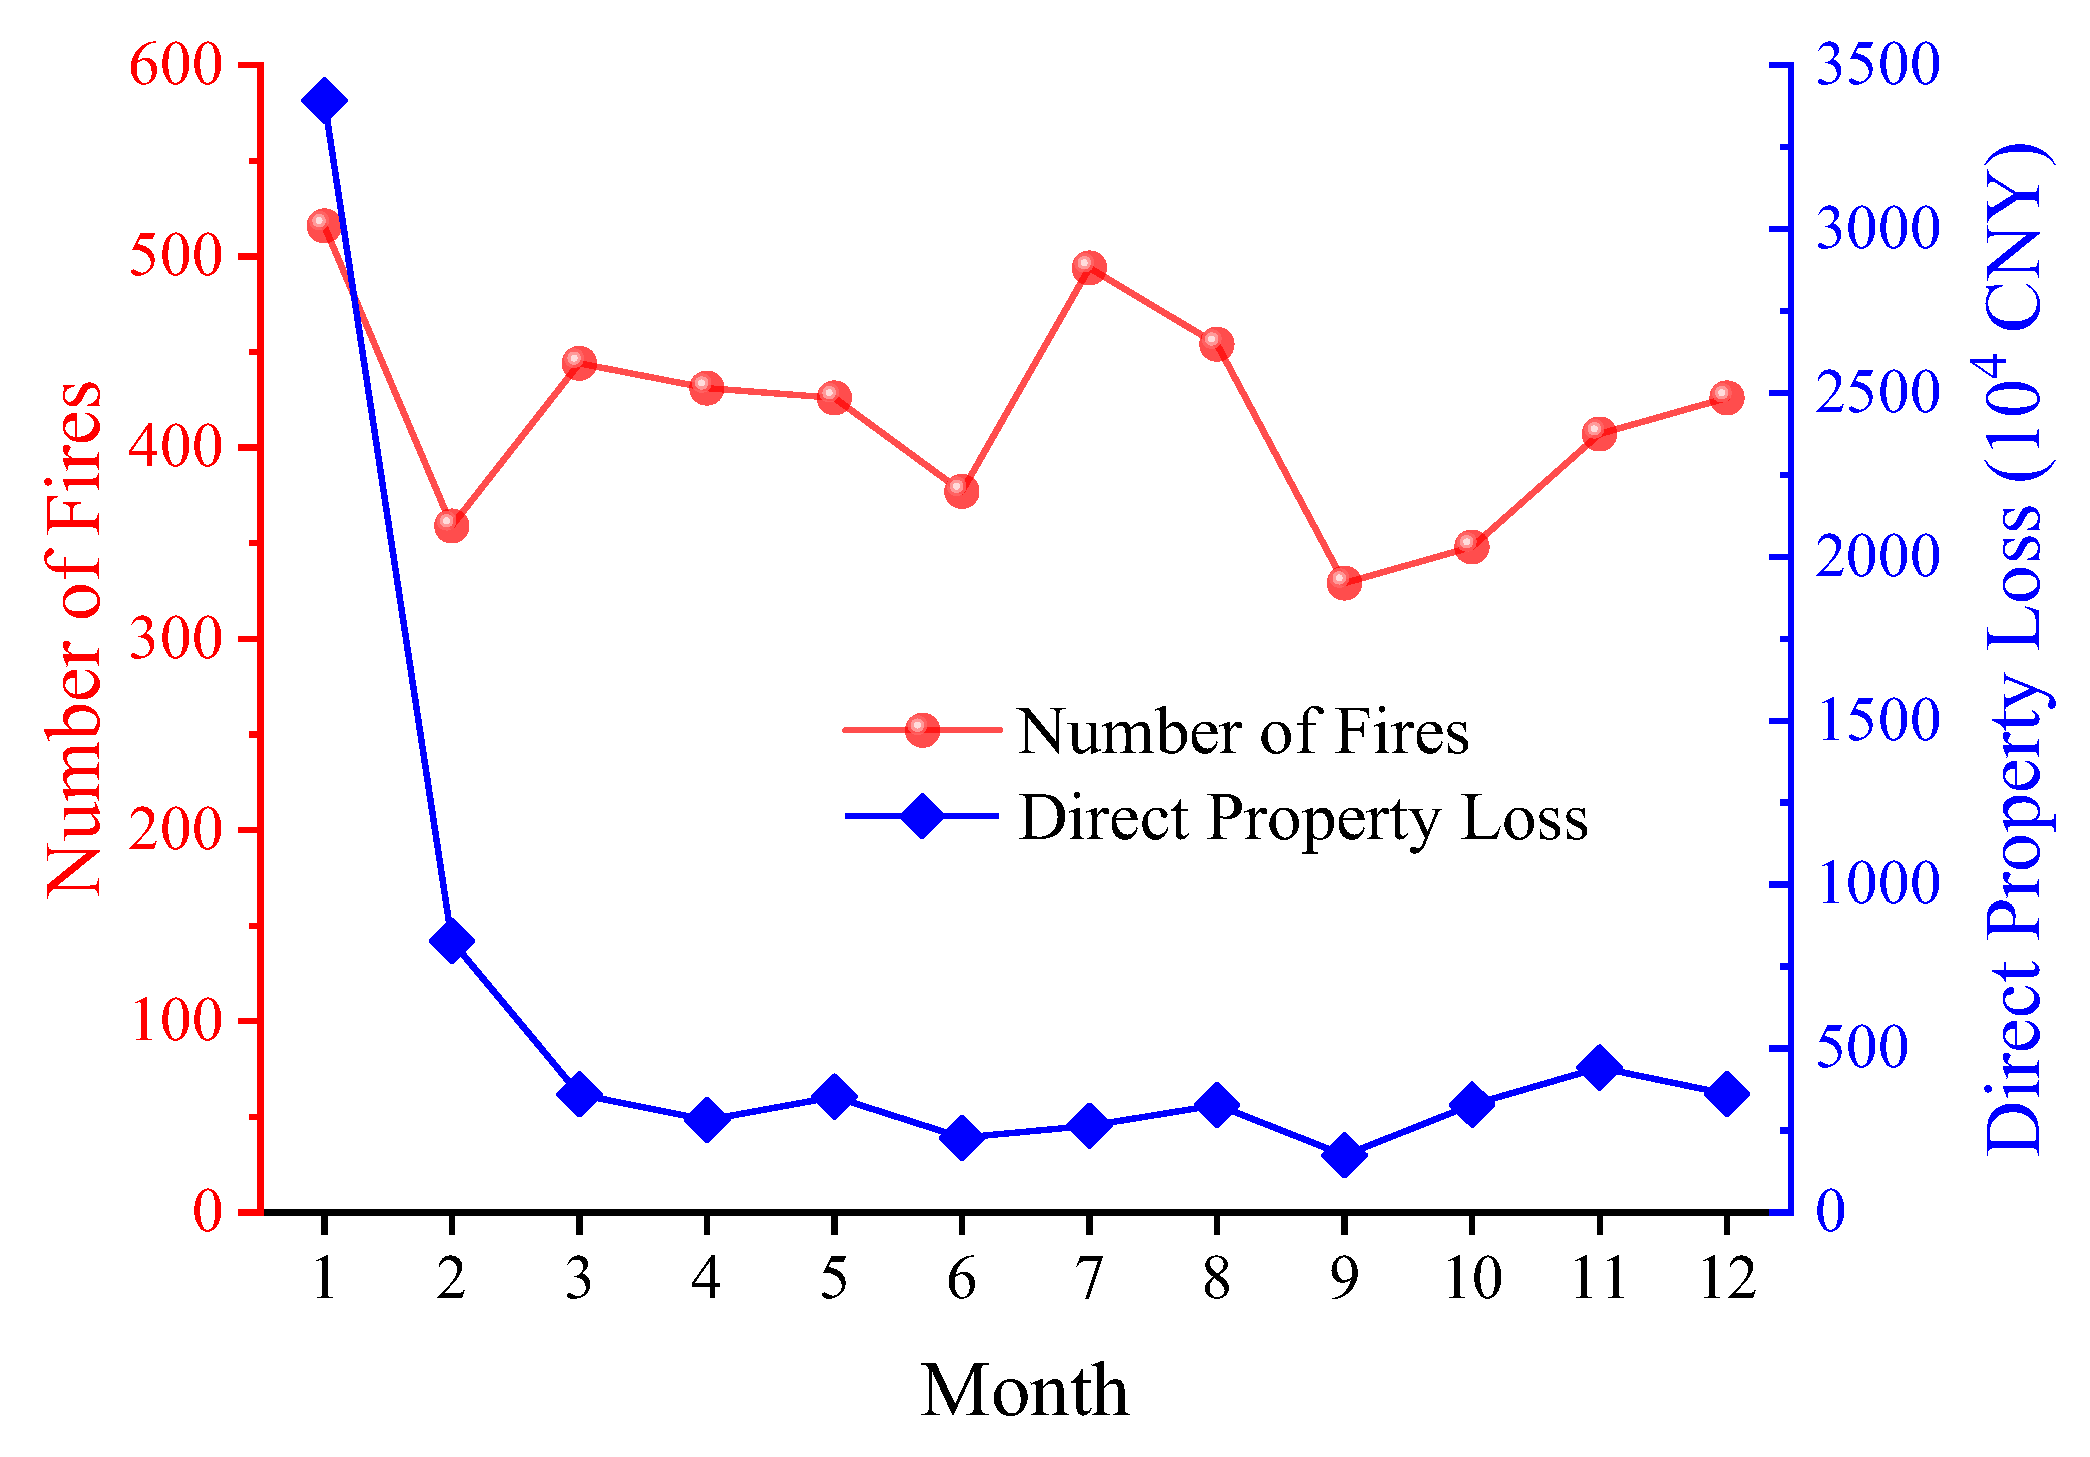
Figure 4 shows the monthly variation in the number of fires and direct property loss in Xiaoshan District. In terms of the number of fires, January, July, and August are high-incidence months, exceeding the monthly average by 23.57%, 18.30%, and 8.72%, respectively. The main reasons are that January and the summer months (July and August) are cold (hot), dry, and often see frequent use of high-power electrical appliances. Additionally, students are on winter and summer vacations, leading to concentrated human and logistics flow, which increases the number of fires [
24]. In terms of direct property loss, January, February, and November are the months with the highest property loss in Xiaoshan District. Excluding the special case of a fire incident at Xiaoshan International Airport’s cargo terminal in January, the property loss in January, February, and November exceeded the monthly average by 8.25%, 128.68%, and 22.06%, respectively. Although the number of fires in July and August is high, the direct property loss is relatively low, suggesting that fires during cold weather result in higher property loss. This may be due to the peak production and sales season during the Chinese New Year, where factories, enterprises, and households store more materials, making fire incidents more likely to cause significant loss [
25].
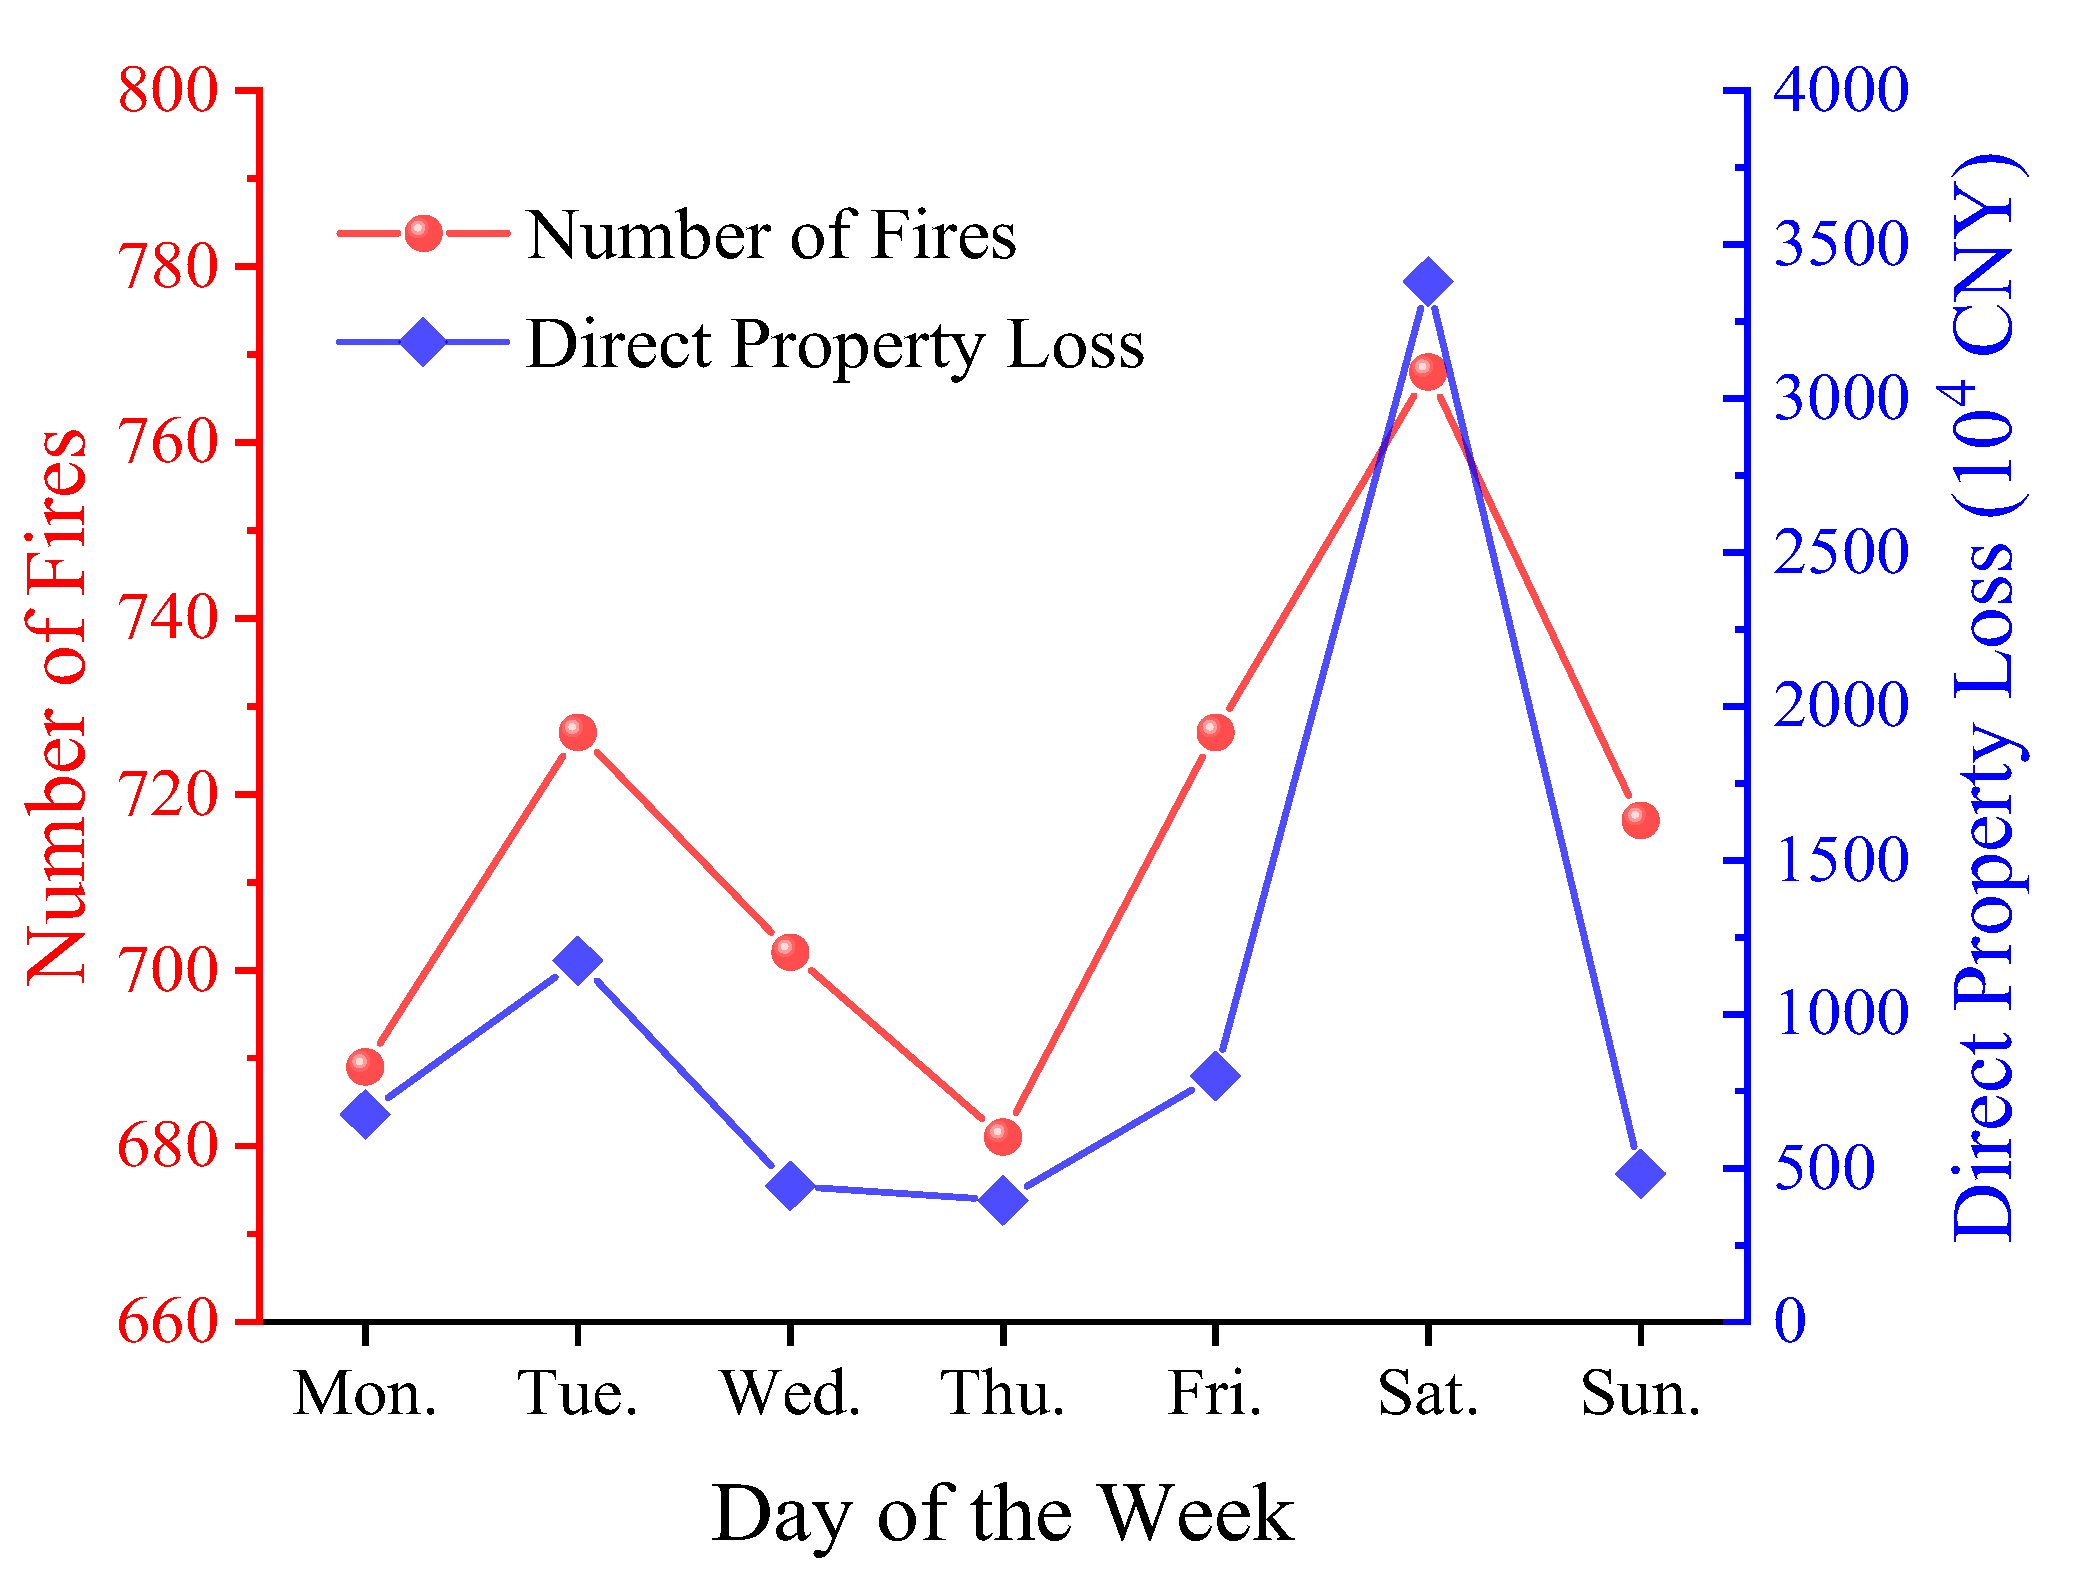
The number of fires and direct property loss in Xiaoshan District exhibit a “double peak” pattern over the week, with peaks on Tuesday and Saturday, as shown in
Figure 5. This pattern reflects the dual influence of “production rhythm” and “social life rhythm.” The Tuesday peak is more related to the periodic rhythm of industrial production. Unlike Monday, which is typically the “start-up period” for enterprises, with administrative tasks and equipment warm-up, Tuesday is often the peak day when businesses reach full production capacity. The prolonged high-load operation of machinery and the intensive logistics and warehousing significantly increase the physical exposure risk of industrial fires, leading to the peak number of fires on Tuesdays [
26]. On the other hand, the Saturday peak is a typical “weekend effect,” where people take vacations, and foot traffic in commercial centers and entertainment venues reaches its peak. At the same time, household cooking and frequent use of high-power electrical appliances increase, leading to a higher risk of fires in commercial and residential areas.
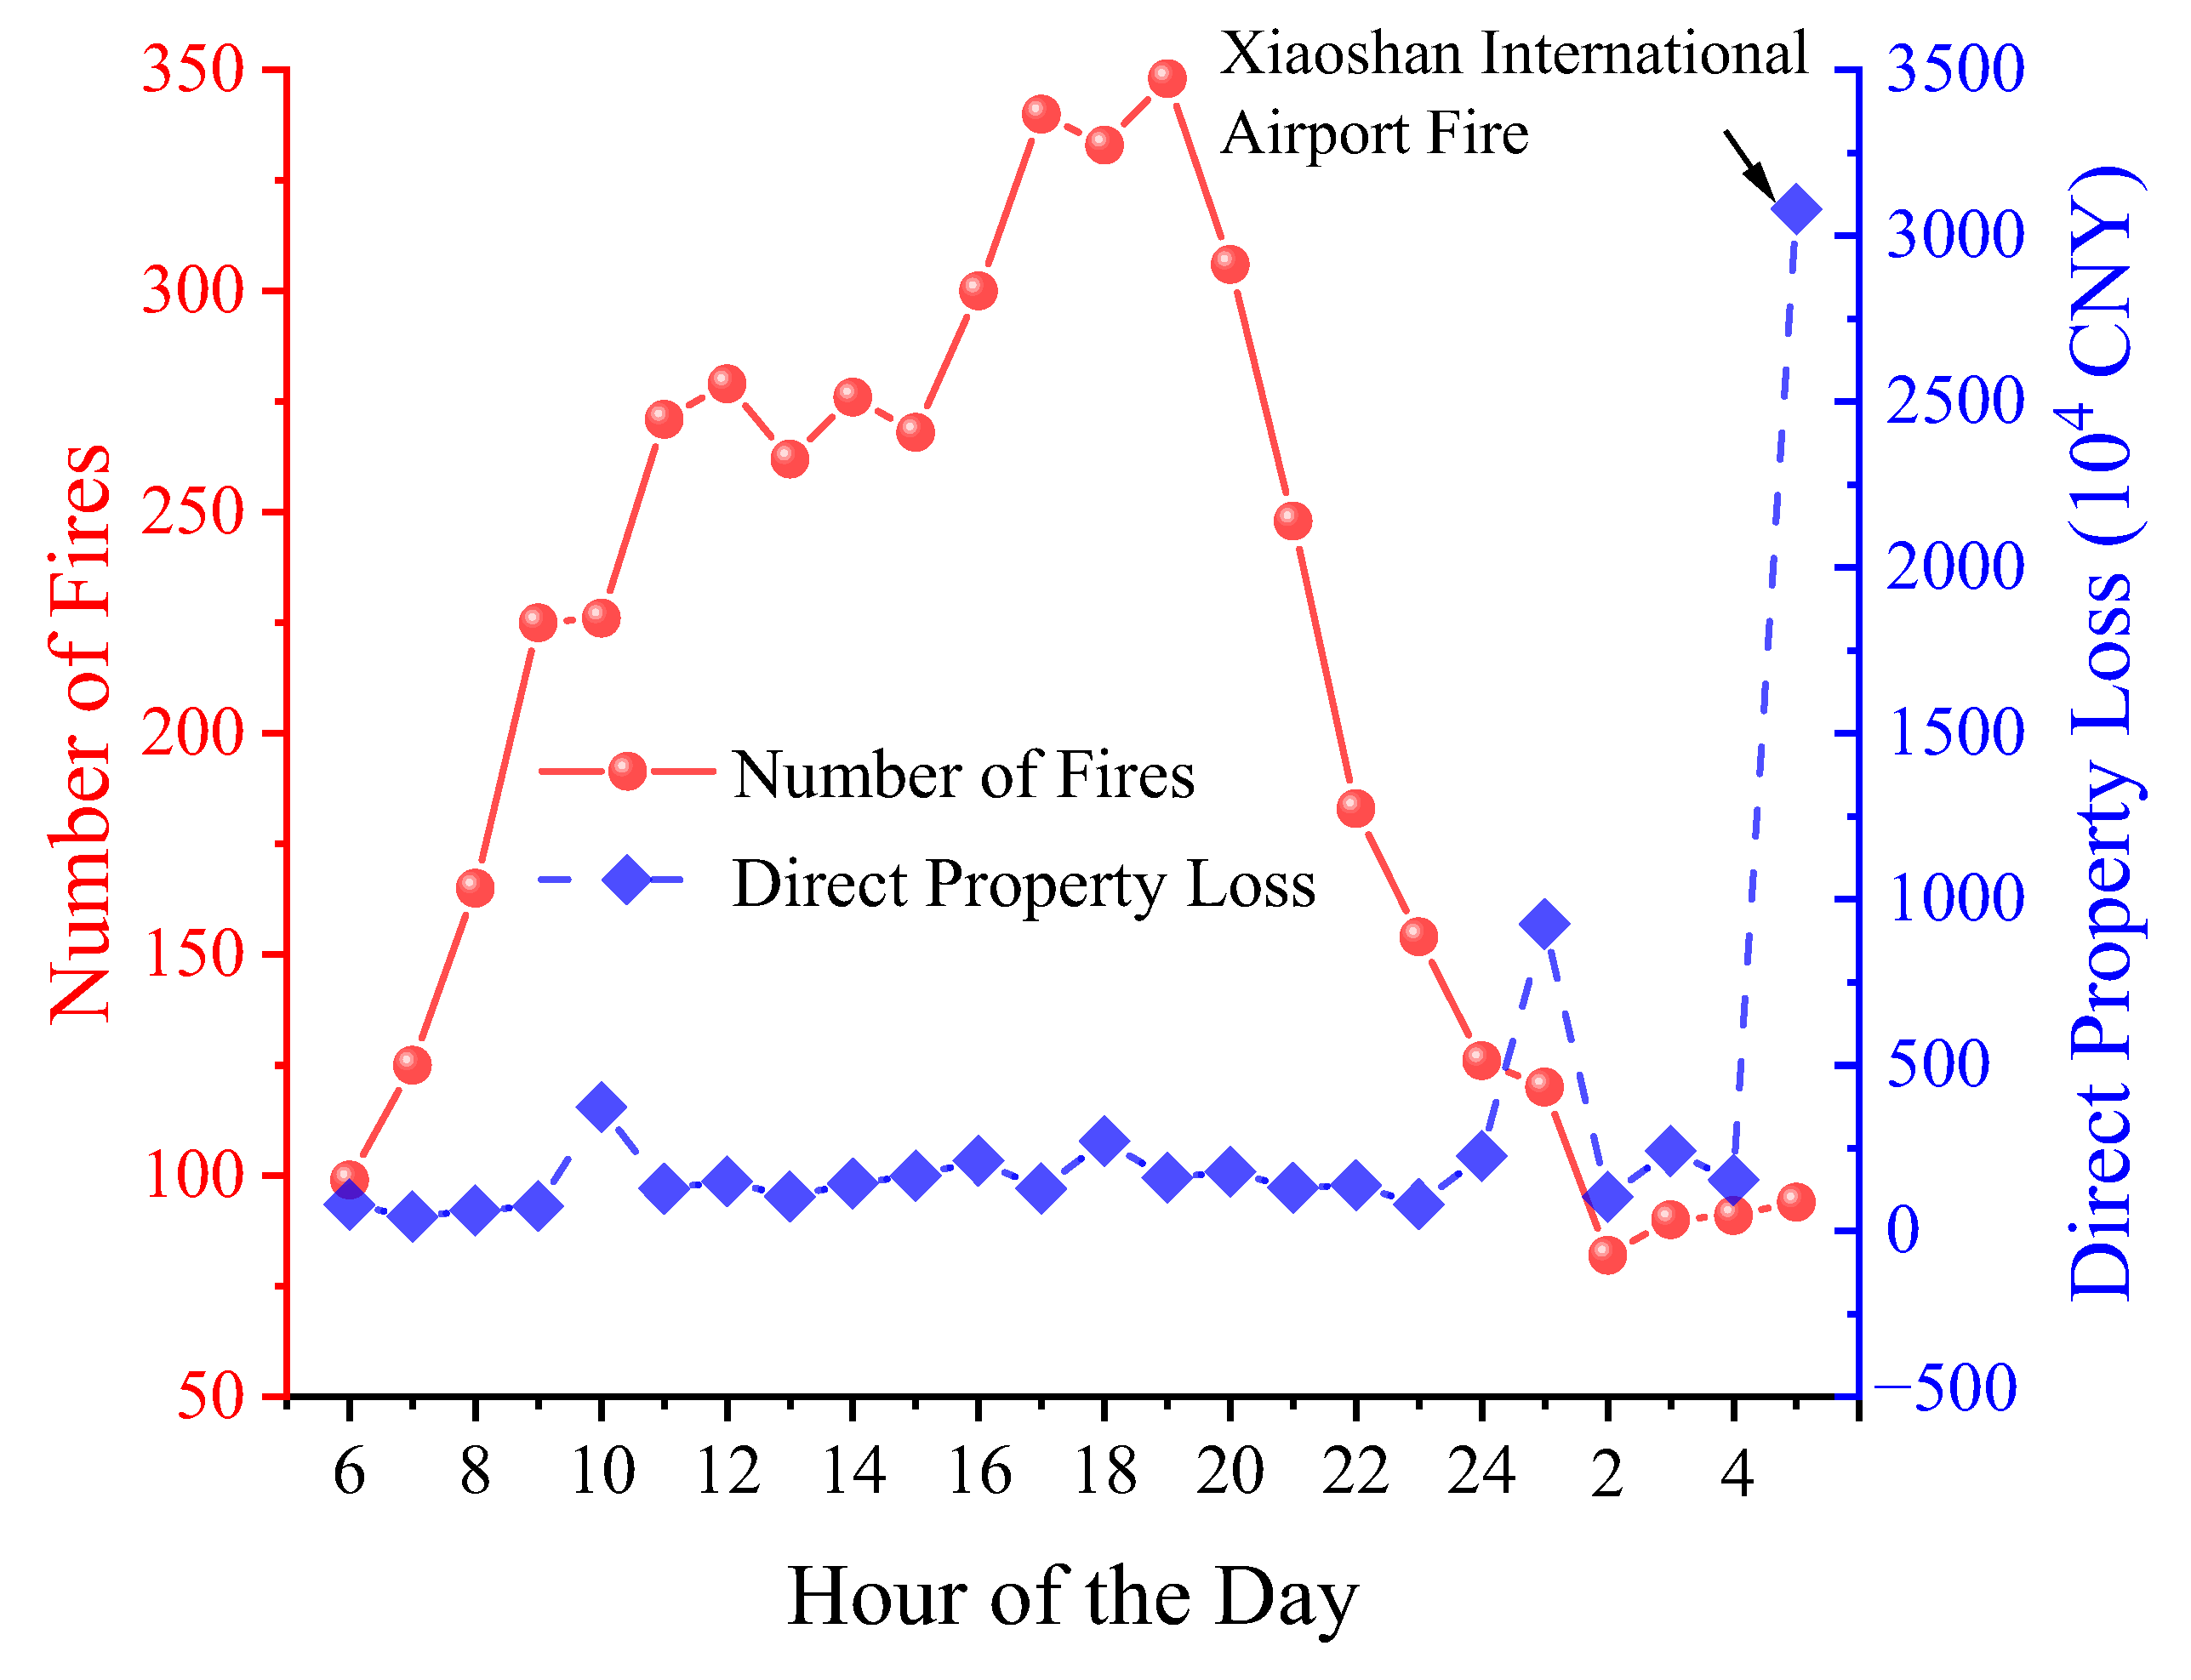
Figure 6 illustrates the hourly variation in the number of fires and direct property loss in Xiaoshan District. From
Figure 6, it can be seen that from 6 a.m., as human activities increase, the number of fires gradually rises, reaching a peak at 7 p.m., after which it gradually declines as human activities decrease. The period from 4 p.m. to 8 p.m. is the high-incidence period, with 32.47% of the day’s fires occurring during this period. In contrast, the period from 2 a.m. to 6 a.m. is the low-incidence period, with only 9.10% of fire incidents occurring during this time. From 4 p.m. to 8 p.m., some enterprises work overtime, and employees, fatigued after a full day of work, may become less attentive, increasing the risk of fires. Additionally, this period coincides with the evening peak hours, when traffic incidents are more likely to occur. At the same time, many people cook at home during this period, and the frequency of using fire and electricity increases, leading to a higher likelihood of fire incidents [
11]. In contrast, from 2 a.m. to 6 a.m., people are asleep, and fire and electricity usage decrease, resulting in fewer fire incidents. However, it is important to note that the direct property loss from fires in Xiaoshan District is mainly concentrated in the early morning hours, especially at 1 a.m. This is because people are in their sleep cycle, with reduced alertness, making it harder to detect and extinguish fires in time, which allows the fire to spread.
The relatively high direct property loss associated with early morning fires also highlights the importance of early fire detection in residential properties. Although the present dataset does not include household-level information regarding smoke alarm installation, independent smoke alarms are increasingly promoted in residential buildings in China, particularly in older residential communities, group rental housing, high-rise residential buildings, and residences occupied by elderly people. In recent years, Chinese fire safety regulations and local fire prevention policies have gradually strengthened the application of independent smoke alarms in residential settings to improve early fire warning capability and reduce casualties during nighttime fires.
Smoke alarms are particularly important during sleeping periods, when occupants may have reduced awareness of developing fires and delayed evacuation responses. Therefore, improving the installation coverage and maintenance quality of residential smoke alarms may help reduce fire-related casualties and property loss in highly urbanized municipal districts.
3.2. Spatial Distribution Characteristics of Fire Incidents
Fire incidents not only have a temporal attribute but also a strong spatial attribute.
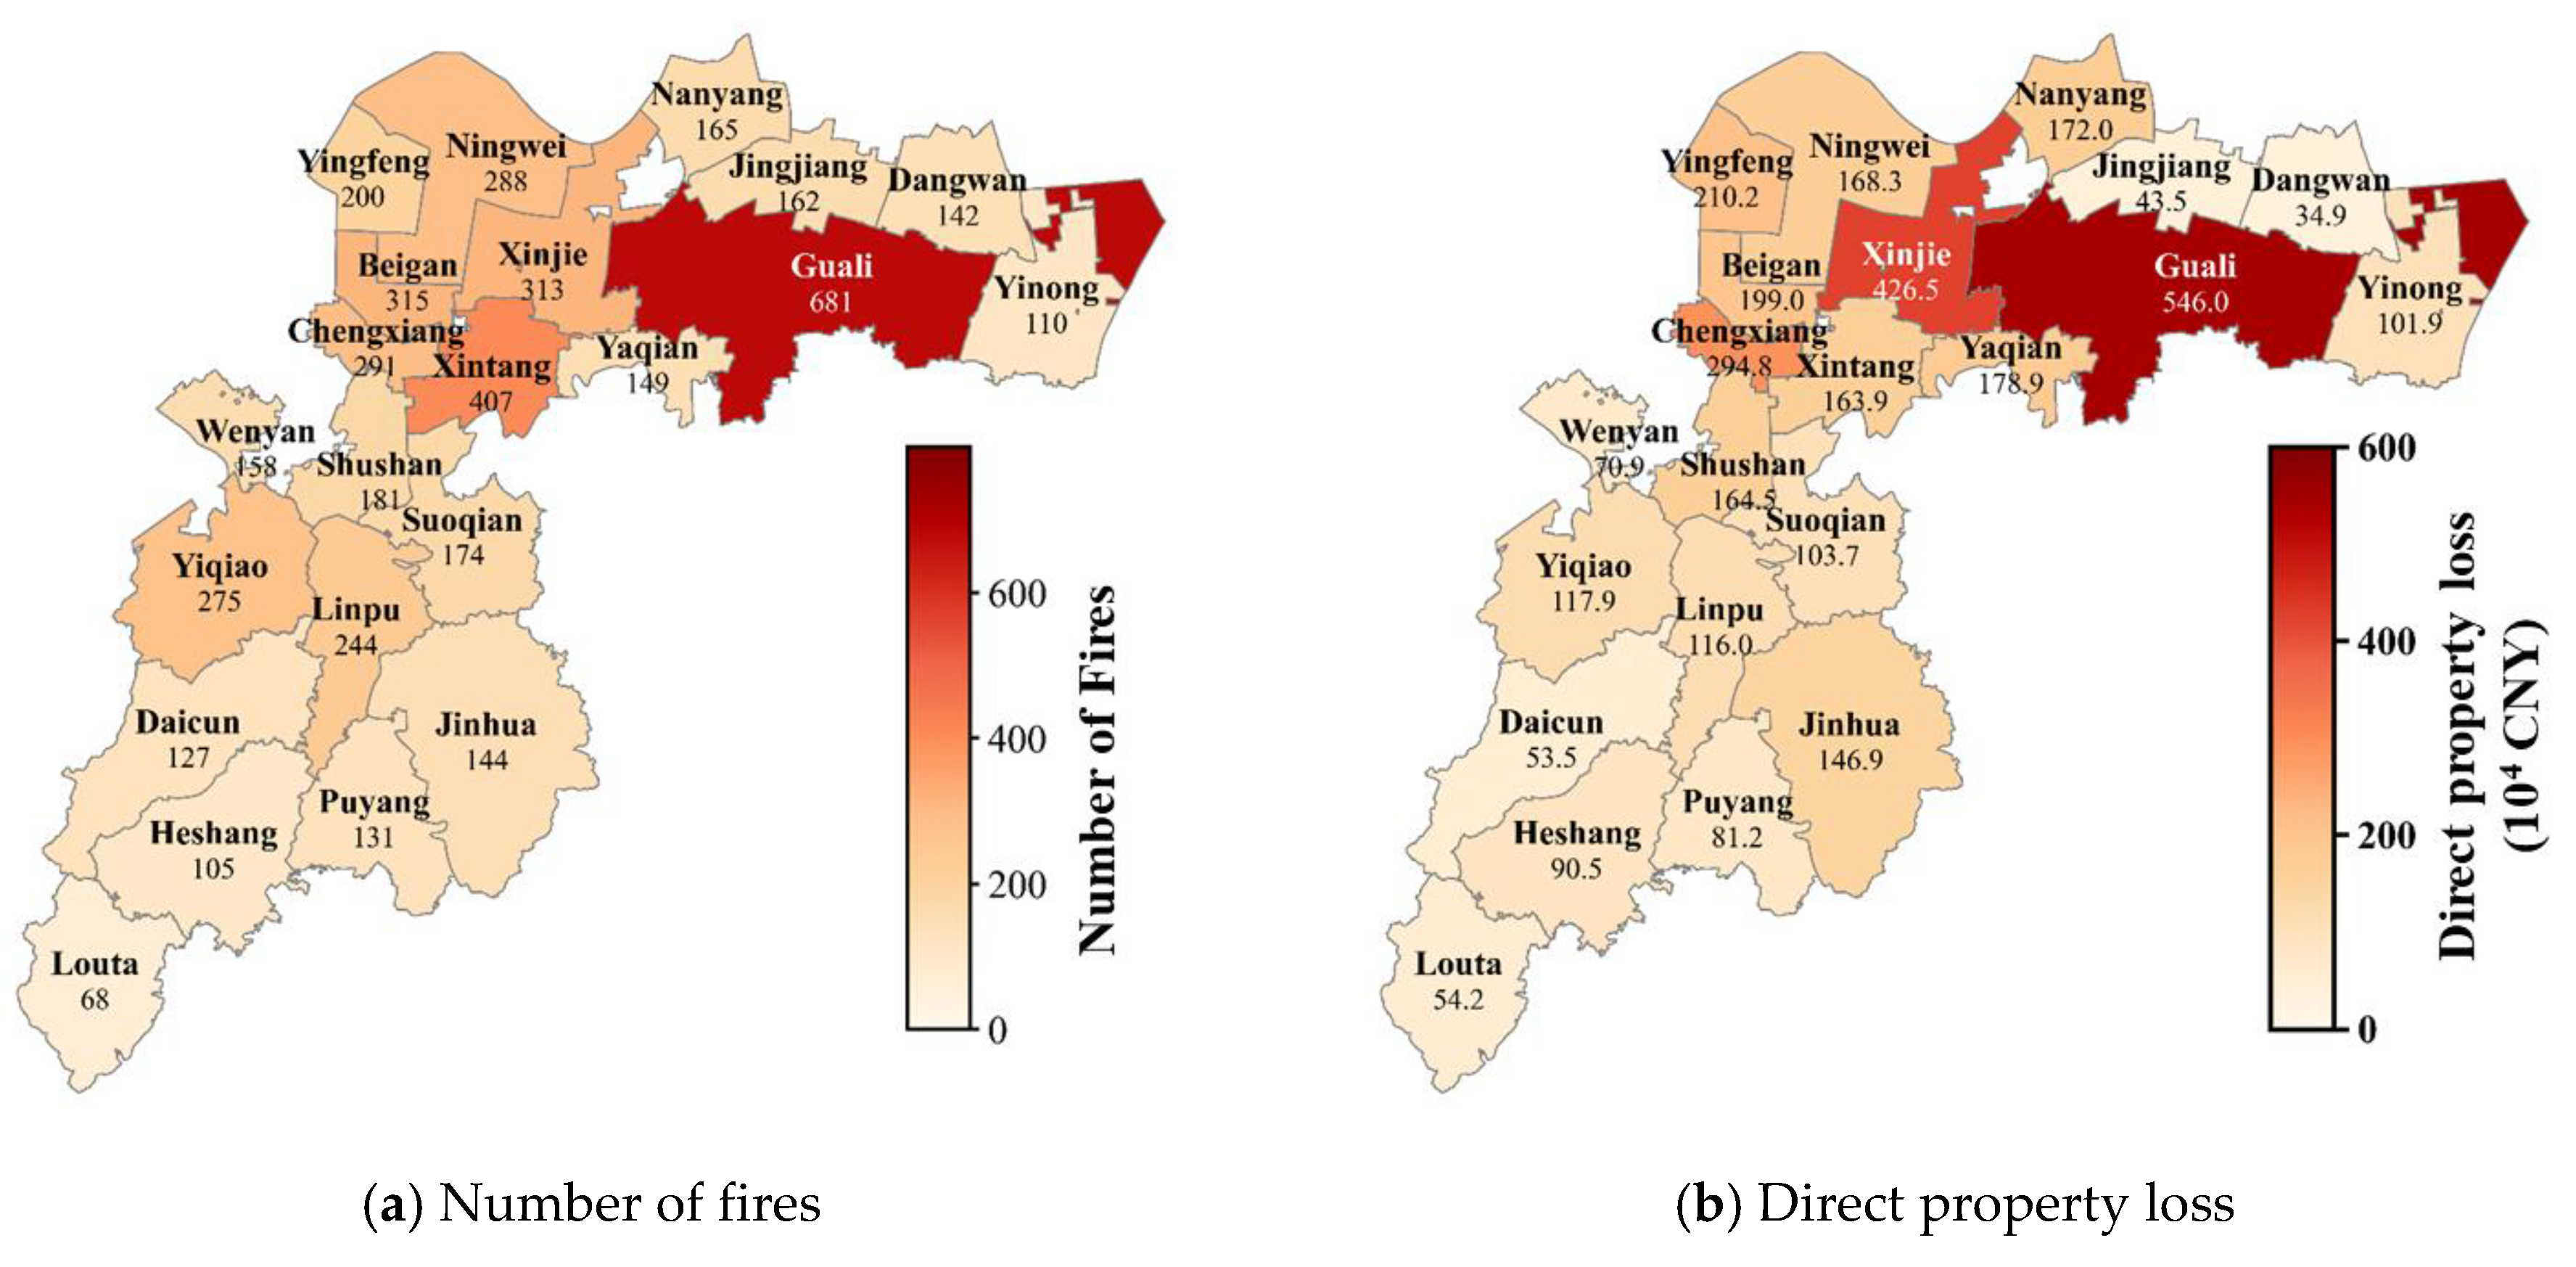
Figure 7 shows the spatial distribution of fire incidents and direct property loss in the 22 towns and subdistricts under Xiaoshan District (excluding the Xiaoshan Airport fire incident). It can be observed that high-frequency fire areas and high-loss areas exhibit spatial aggregation. A linear regression model with clear explanatory power was used to analyze the spatial difference driving mechanisms of fire incidents and direct property loss at the town–subdistrict level, revealing the deeper causes behind the spatial clustering of fires in Xiaoshan District [
2,
27].
Population and economy are key factors affecting regional fire incidents [
25]. Various population and economic indicators, such as resident population, industrial output value above designated size, service output value above designated size, total retail sales of consumer goods, GDP, and total investment in fixed assets, were selected from statistical yearbooks as explanatory variables in the model [
28,
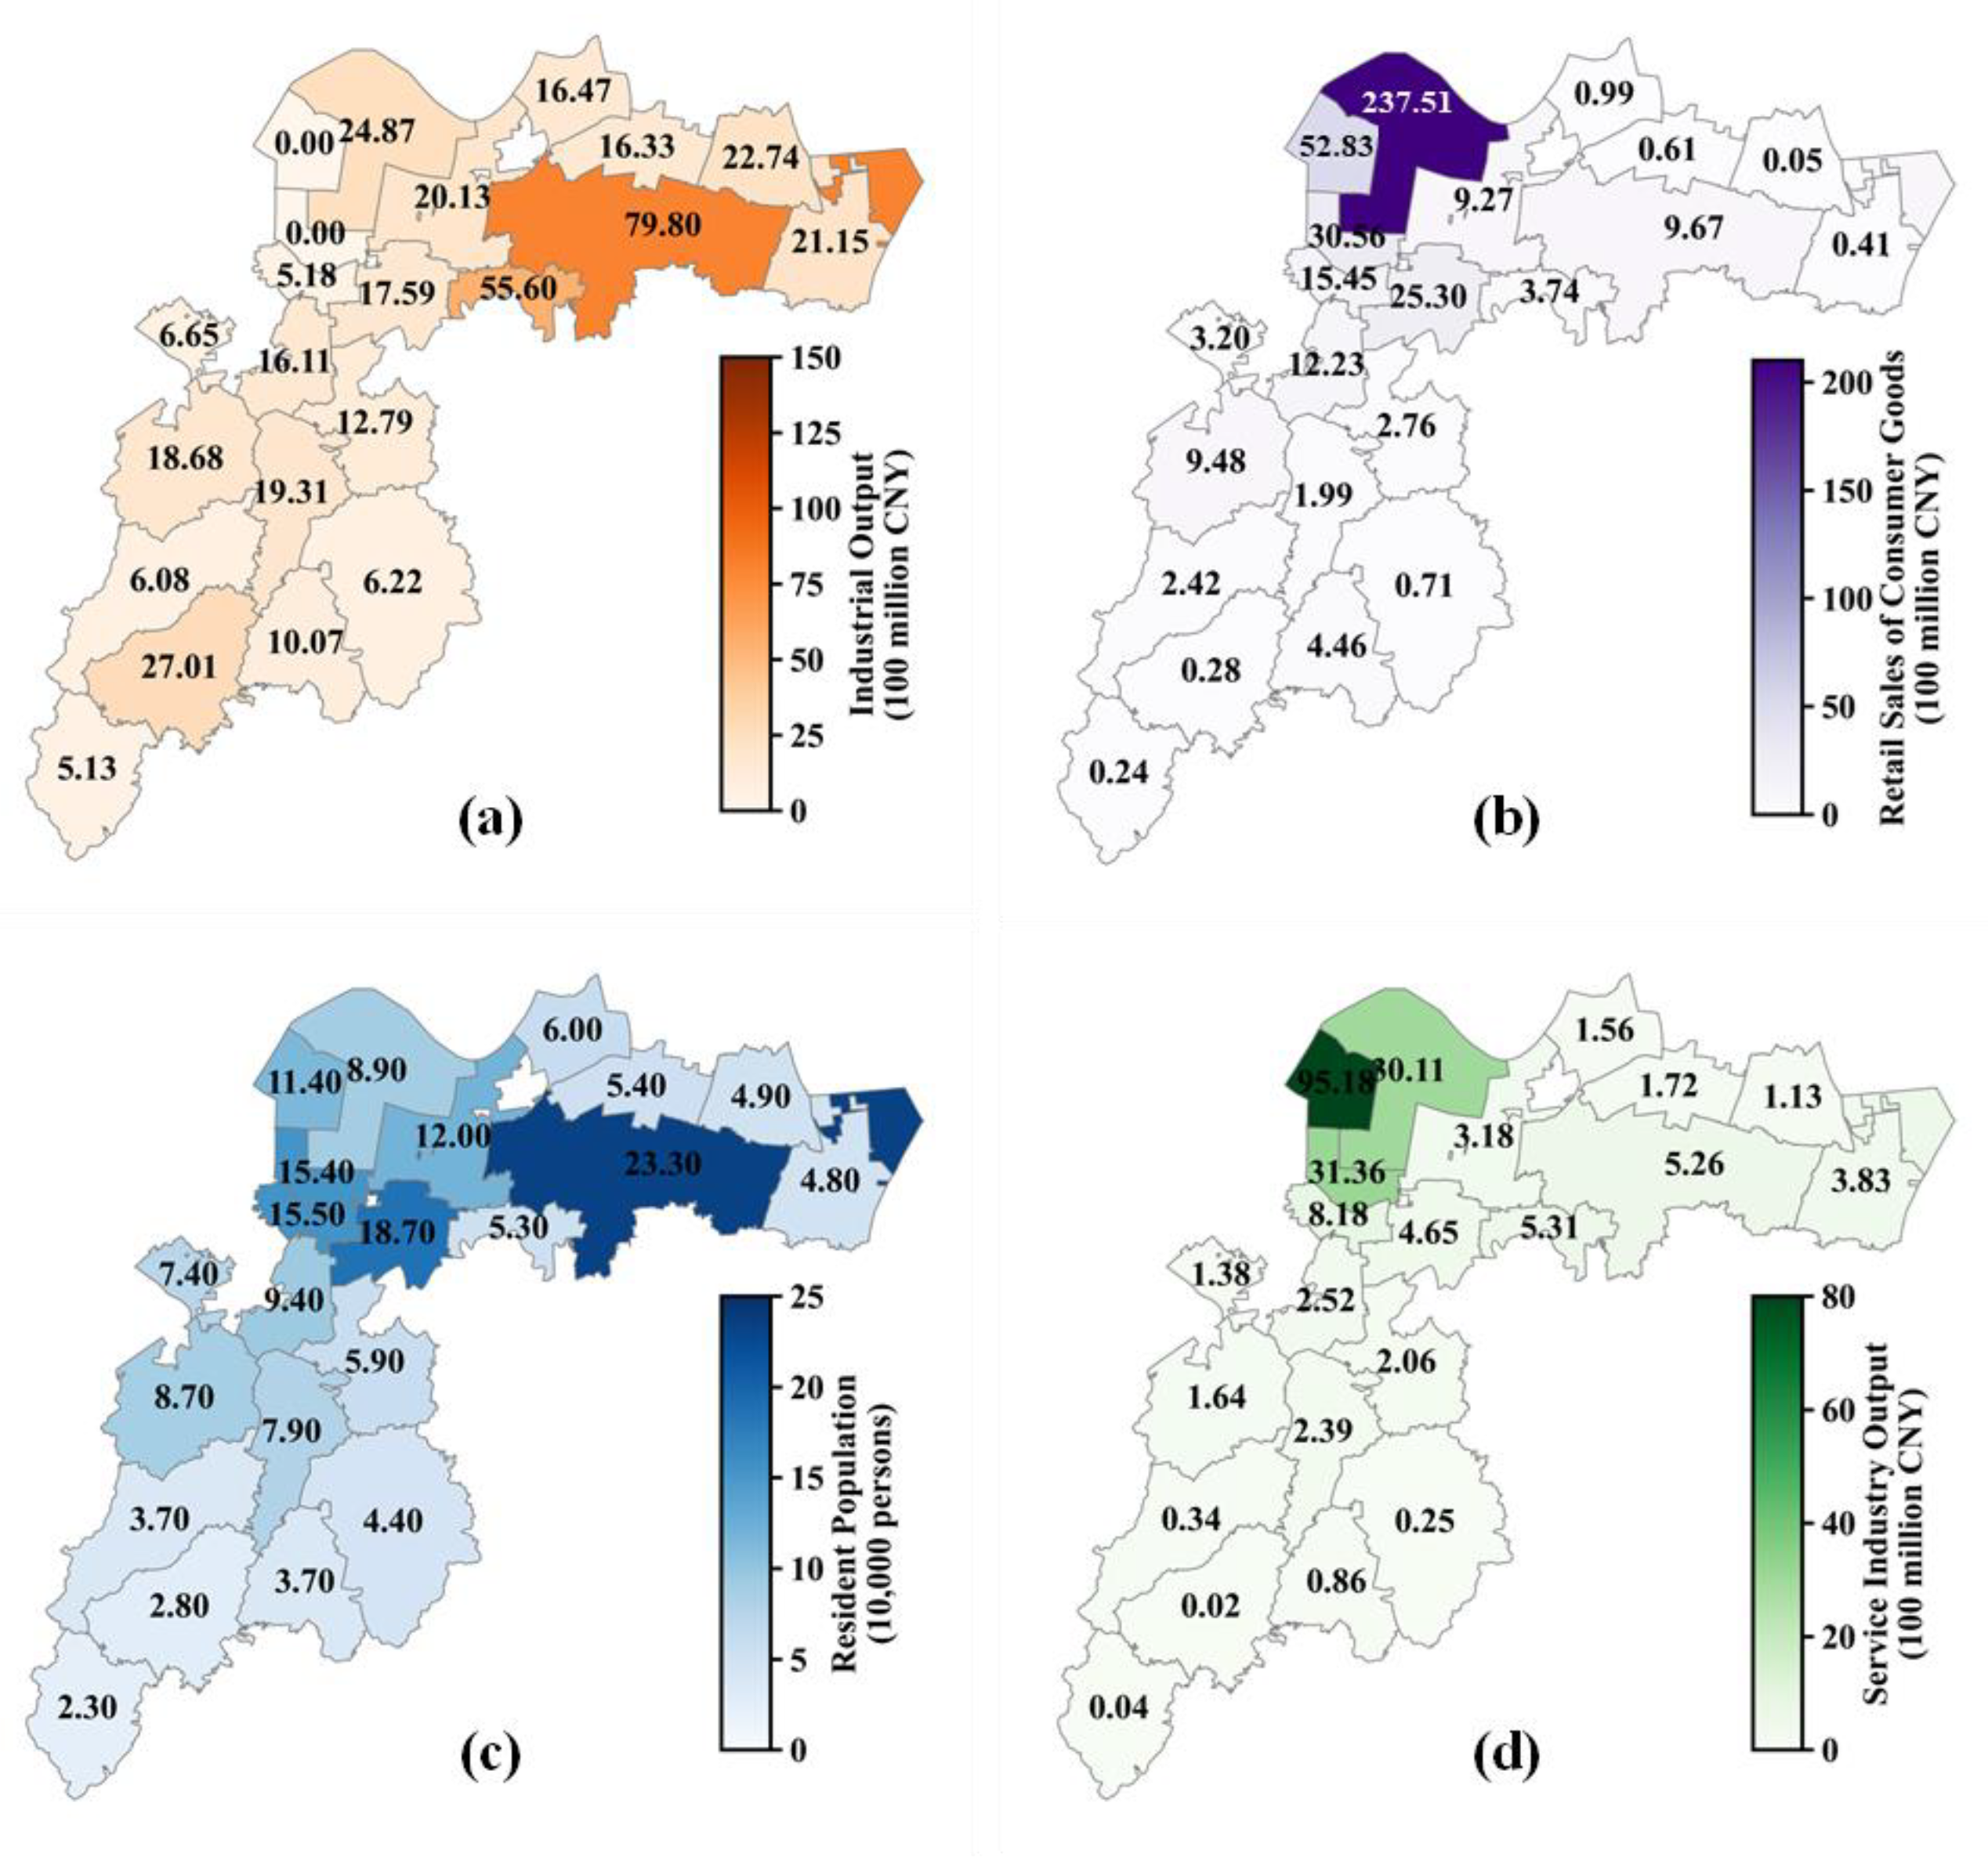
29]. The complete socio-economic dataset for the 22 towns and subdistricts is provided in
Appendix A. These variables were used to characterize differences in population concentration, industrial activity, service-sector development, commercial activity, and overall economic scale among towns and subdistricts. Specifically, resident population reflects the intensity of human activities and potential exposure to fire risk; industrial output value above designated size represents the concentration of manufacturing and production activities; service output value above designated size and total retail sales of consumer goods reflect service-sector and commercial activity levels; GDP and total investment in fixed assets indicate the overall economic scale and development intensity of each town/subdistrict. To avoid multicollinearity, the variance inflation factor (VIF) [
30] was used for the variable collinearity test, and the results are shown in
Table 2. Based on the test results, the VIF values of GDP and total investment in fixed assets were greater than 10, indicating strong correlations between these two variables and others. Therefore, variables with high VIF values were removed to reduce their impact on model stability, and the remaining four independent explanatory variables were retained to construct the regression model. Furthermore, to ensure the statistical robustness of the model, additional assumption tests were systematically performed on the finalized variables. The independence of observations was verified using the Durbin-Watson statistic, which yielded values close to 2.0, indicating the absence of significant spatial or sequential autocorrelation. The assumption of homoscedasticity was confirmed through scatter plots of standardized residuals against predicted values, which displayed a random distribution without evident funneling patterns. Finally, the normality of the residuals was validated using normal Q-Q plots, ensuring that all fundamental assumptions for reliable multiple linear regression modeling were fully satisfied.
The linear regression results of the number of fires and direct property loss in the towns and subdistricts of Xiaoshan District are shown in
Table 3. As indicated by the
R2 values, the model can explain approximately 98.1% and 87.3% of the variation in the number of fires and direct property loss, respectively, demonstrating good fit and confirming the model’s validity and explanatory power.
According to
Table 3, the resident population in towns and subdistricts of Xiaoshan District is significantly positively correlated with both the number of fires (
β = 21.5020,
p = 0.000) and direct property loss (
β = 12.0957,
p = 0.000), further confirming the reinforcing effect of population concentration on fire risk at the town and street scale. A study by Duo et al. [
31] has also shown that fire risk is significantly influenced by socio-economic factors such as population size and economic development. In particular, densely populated and economically active areas tend to experience higher fire frequency and greater associated loss due to intensive human activities and material concentration.
Industry structure is another important factor affecting fires. The industrial output value above designated size in Xiaoshan District is significantly positively correlated with both the number of fires (
β = 1.8559,
p = 0.000) and direct property loss (
β = 3.1488,
p = 0.000), which is consistent with previous studies indicating that industrial development and economic activity are important determinants of fire risk and associated loss [
32]. The increase in industrial output value usually accompanies an expansion in production scale and a more complex manufacturing process. Industries like chemicals, textiles, and machinery manufacturing involve the use of high-temperature and high-pressure equipment, as well as flammable chemicals, which can easily trigger fires if mishandled, thus posing a high fire risk.
The service output value above designated size in Xiaoshan District is positively correlated with direct property loss (
β = 1.3729,
p = 0.033) but negatively correlated with the number of fires (
β = −0.7004,
p = 0.013), which differs from the nationwide conclusion that the expansion of the tertiary industry increases fire incidents [
33]. The core reason for this difference lies in the different spatial scales of the studies: on a national scale, the expansion of the tertiary industry coincides with urbanization, and the population aggregation effect becomes more pronounced, leading to an overall increase in fire risk. However, at the town and subdistrict scale, modern service industries usually focus on light-asset offices, with lower flammable material storage, standardized electrical equipment management, and better fire protection facilities, all of which reduce the likelihood of fire incidents. However, once a fire occurs, the high-value assets in service industry premises (e.g., data center servers, high-end mall fixtures) or business interruptions can lead to substantial loss.
The total retail sales of consumer goods in Xiaoshan District are positively correlated with the number of fires (
β = 0.2855,
p = 0.011) but do not show a significant correlation with direct property loss. This finding diverges from the national trend identified by Xiong et al. [
24], who demonstrated a significant positive correlation between macroeconomic consumption indicators, number of fires, and direct property loss across China. This regional divergence can be attributed to disparities in economic development levels. Located in the highly developed Yangtze River Delta region, Xiaoshan District benefits from superior fire safety management, advanced infrastructure, and higher firefighting efficiency compared to the national average [
33]. Notably, this superior management paradigm is not merely a consequence of expanding traditional firefighting staffing; rather, it is driven by a multi-pronged strategy integrating advanced technological equipment, localized structural deployment, and rigorous professional training. The district has heavily invested in and deployed IoT-based smart fire early-warning systems alongside extensive grid-based micro-fire stations, which dramatically enhance real-time anomaly detection and grassroots readiness. Furthermore, high-frequency fire safety training programs and hands-on emergency evacuation drills are strictly mandated for personnel within high-risk commercial complexes and dense industrial units. Consequently, while heightened consumption and commercial activities inherently increase the physical exposure and likelihood of fire ignitions, these synergistic technological and organizational advantages enable exceptionally rapid, effective early-stage interventions that successfully contain fires before thermal propagation escalates. As a result, the increased incidence of fires does not translate into a proportional rise in direct property loss.
Based on the results of the linear regression model, spatial distribution maps of various variables are further plotted (
Figure 8) to visually explain the formation mechanism of fire spatial clustering in Xiaoshan District. The regression coefficients β and
p-values in
Table 3 show that the resident population and industrial output value above designated size have the most significant impact on the number of fires in the district. By comparing the spatial distribution characteristics in
Figure 7 and
Figure 8, it can be observed that regions with a higher resident population and industrial output value are often accompanied by higher fire risks. For example, Guali Town not only has the largest resident population but also ranks first in industrial output value. Accordingly, its number of fires and direct property loss are also the highest in the district. Neighboring areas such as Xintang Street and Xinjie Street show similar spatial relationships. From the spatial distribution pattern, it is evident that high-frequency fire zones and high-loss zones in Xiaoshan District significantly overlap with densely populated areas and industrial clusters. In contrast, although the industrial output value above designated size and total retail sales of consumer goods have some impact on fires, their spatial correspondence with fire hotspots is weaker due to better fire protection facilities in modern service industry clusters (e.g., Yingfeng Street) and more efficient fire management in commercial center areas (e.g., Xiaoshan Central District).
Thus, the resident population and industrial output value above designated size are the primary factors driving the spatial differentiation of the number of fires in the district, while the influence of service industry development and consumption activities is limited by their interaction with fire management levels.
3.3. Statistical Analysis of Fire Causes
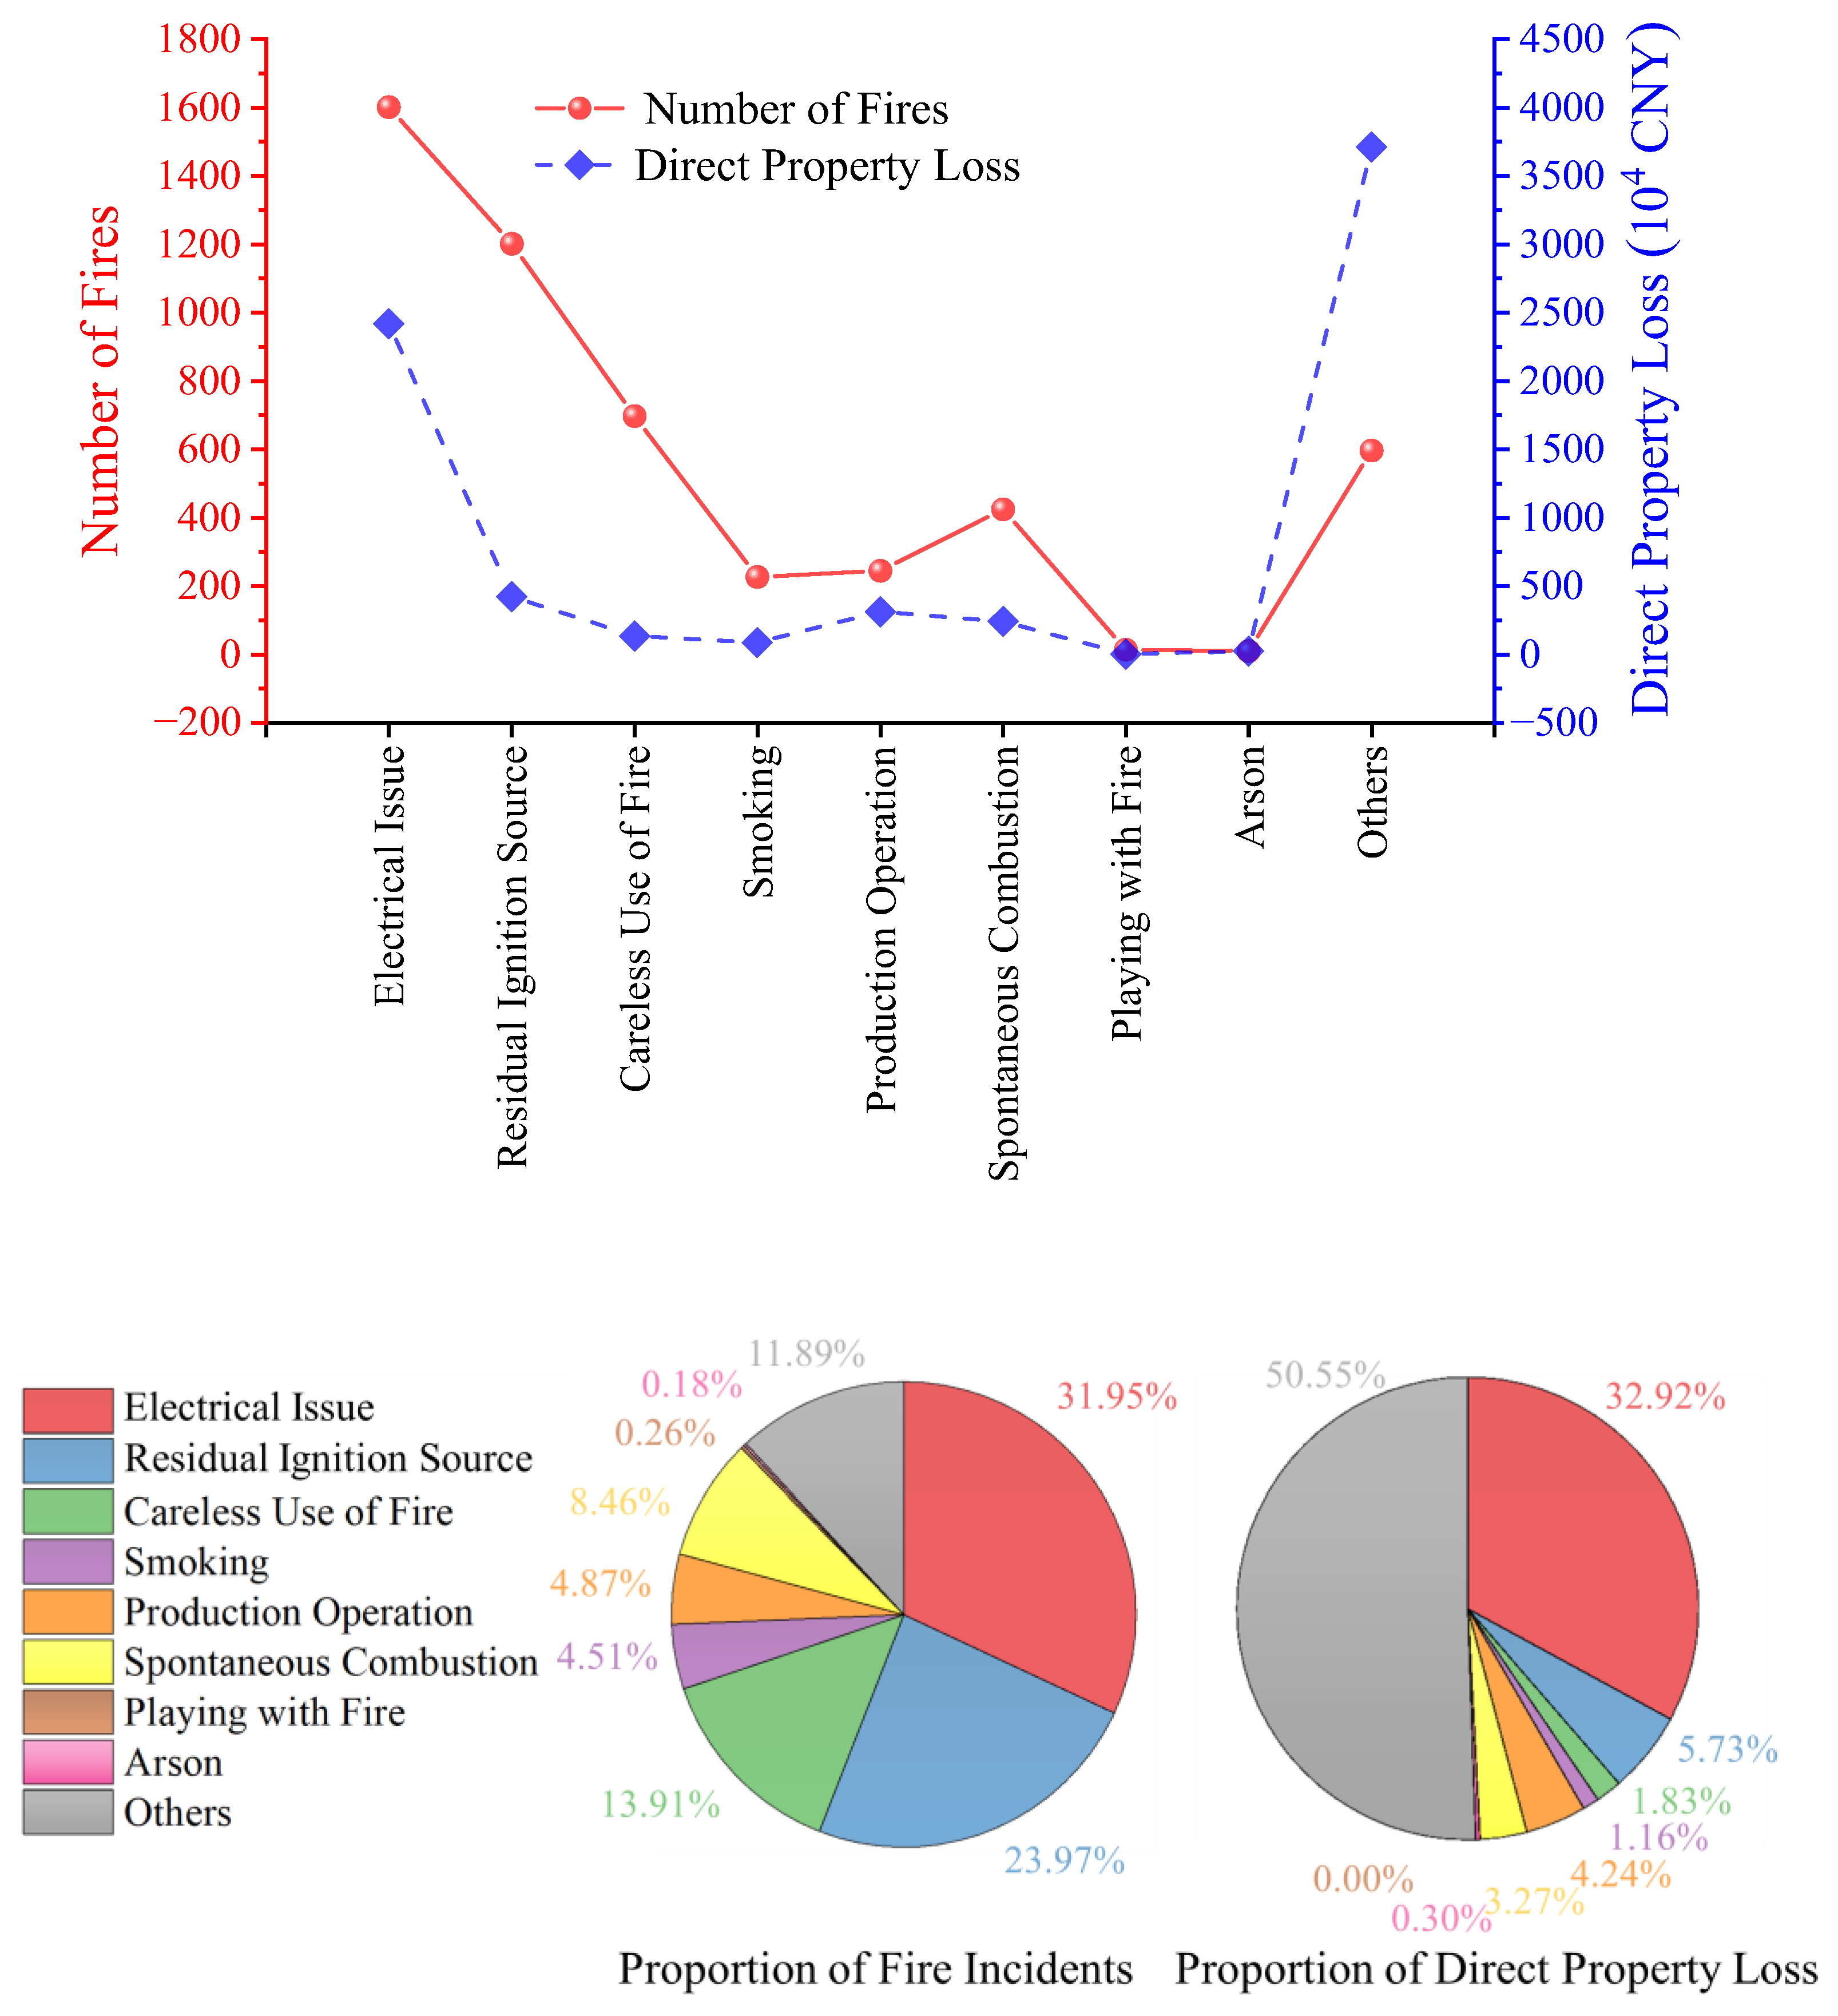
The relationship between the causes of fire incidents, the number of fires, and direct property loss in Xiaoshan District during the statistical period is shown in
Figure 9.
In terms of the number of fires, electrical issues, residual ignition sources, and careless use of fire are the three primary causes, accounting for 31.95%, 23.97%, and 13.91% of the total fire incidents, respectively. In the context of China’s fire classification system, a “residual ignition source” primarily refers to smoldering or high-temperature items carelessly left unattended by human activity—such as unextinguished cigarette butts, mosquito coils, or burning incense—that gradually ignite surrounding combustibles. Compared to national fire data [
19], electrical issues are also the leading cause of fires nationwide, accounting for 31.81%, which is comparable to Xiaoshan District. This indicates that electrical fires are not only a local problem in Xiaoshan District but also a common fire safety challenge in rapidly urbanizing regions of China. From an international perspective, the proportion of electrical fires in Xiaoshan District appears relatively high. However, this comparison should be interpreted cautiously because different countries adopt different fire reporting scopes and classification systems. For example, in the United States, 23,700 residential building electrical malfunction fires were reported in 2023, while 344,600 residential building fires were reported in the same year, indicating that electrical malfunction fires accounted for approximately 6.9% of residential building fires [
34]. However, this category is narrower than the electrical-cause fires among all recorded incidents analyzed in the present study. In England, cooking appliances were the largest ignition category for accidental dwelling fires in the year ending March 2023, accounting for 44% of these fires, while electrical distribution and other electrical appliances were recorded as separate ignition categories [
35]. In Europe, residential electrical safety reports indicate that approximately 25% to 30% of domestic fires have an electrical source [
36]. Therefore, although the 31.95% proportion of electrical fires in Xiaoshan District suggests a prominent electrical fire risk, direct numerical comparison with other countries should be made with caution due to differences in statistical definitions.
As for the residual ignition sources, the proportion of residual ignition sources as a cause of fire incidents in Xiaoshan District is significantly higher than the national average of 11.73%, indicating that special attention should be paid to fires caused by residual ignition sources in Xiaoshan District. Conversely, the proportion of fires caused by careless use of fire in Xiaoshan District is lower than the national average of 21.31%, suggesting that Xiaoshan District has been relatively effective in preventing and controlling fires caused by careless use of fire.
Regarding direct property loss, the top three causes of fire-related property loss are “Others,” electrical issues, and residual ignition sources, which account for 50.55%, 32.92%, and 5.73% of the total direct property loss, respectively. “Others” causes include static electricity, lightning, and incidents where the fire cause cannot be determined, which are the leading causes of direct property loss in Xiaoshan District, significantly higher than the national average of 8.33% for “Others” causes. This suggests that fires in the district are more diverse due to the varied functions of buildings and the complex industrial layout, making the causes of fires harder to categorize. Although fires with undetermined causes only account for a small portion of total fire incidents, the resulting losses are not negligible, such as the fire incident involving a cargo plane at Xiaoshan International Airport. Therefore, Xiaoshan District needs to strengthen fire investigations to clearly identify fire causes, trace the origins of fires, and implement targeted measures to reduce property loss caused by fires. Although the proportion of direct property loss caused by electrical fires in Xiaoshan District is lower than the national average of 48.05%, and the proportion attributed to residual ignition sources is higher than the national average of 3.73%, both causes still contribute considerably to the overall direct property loss due to their relatively high occurrence frequencies in the district.
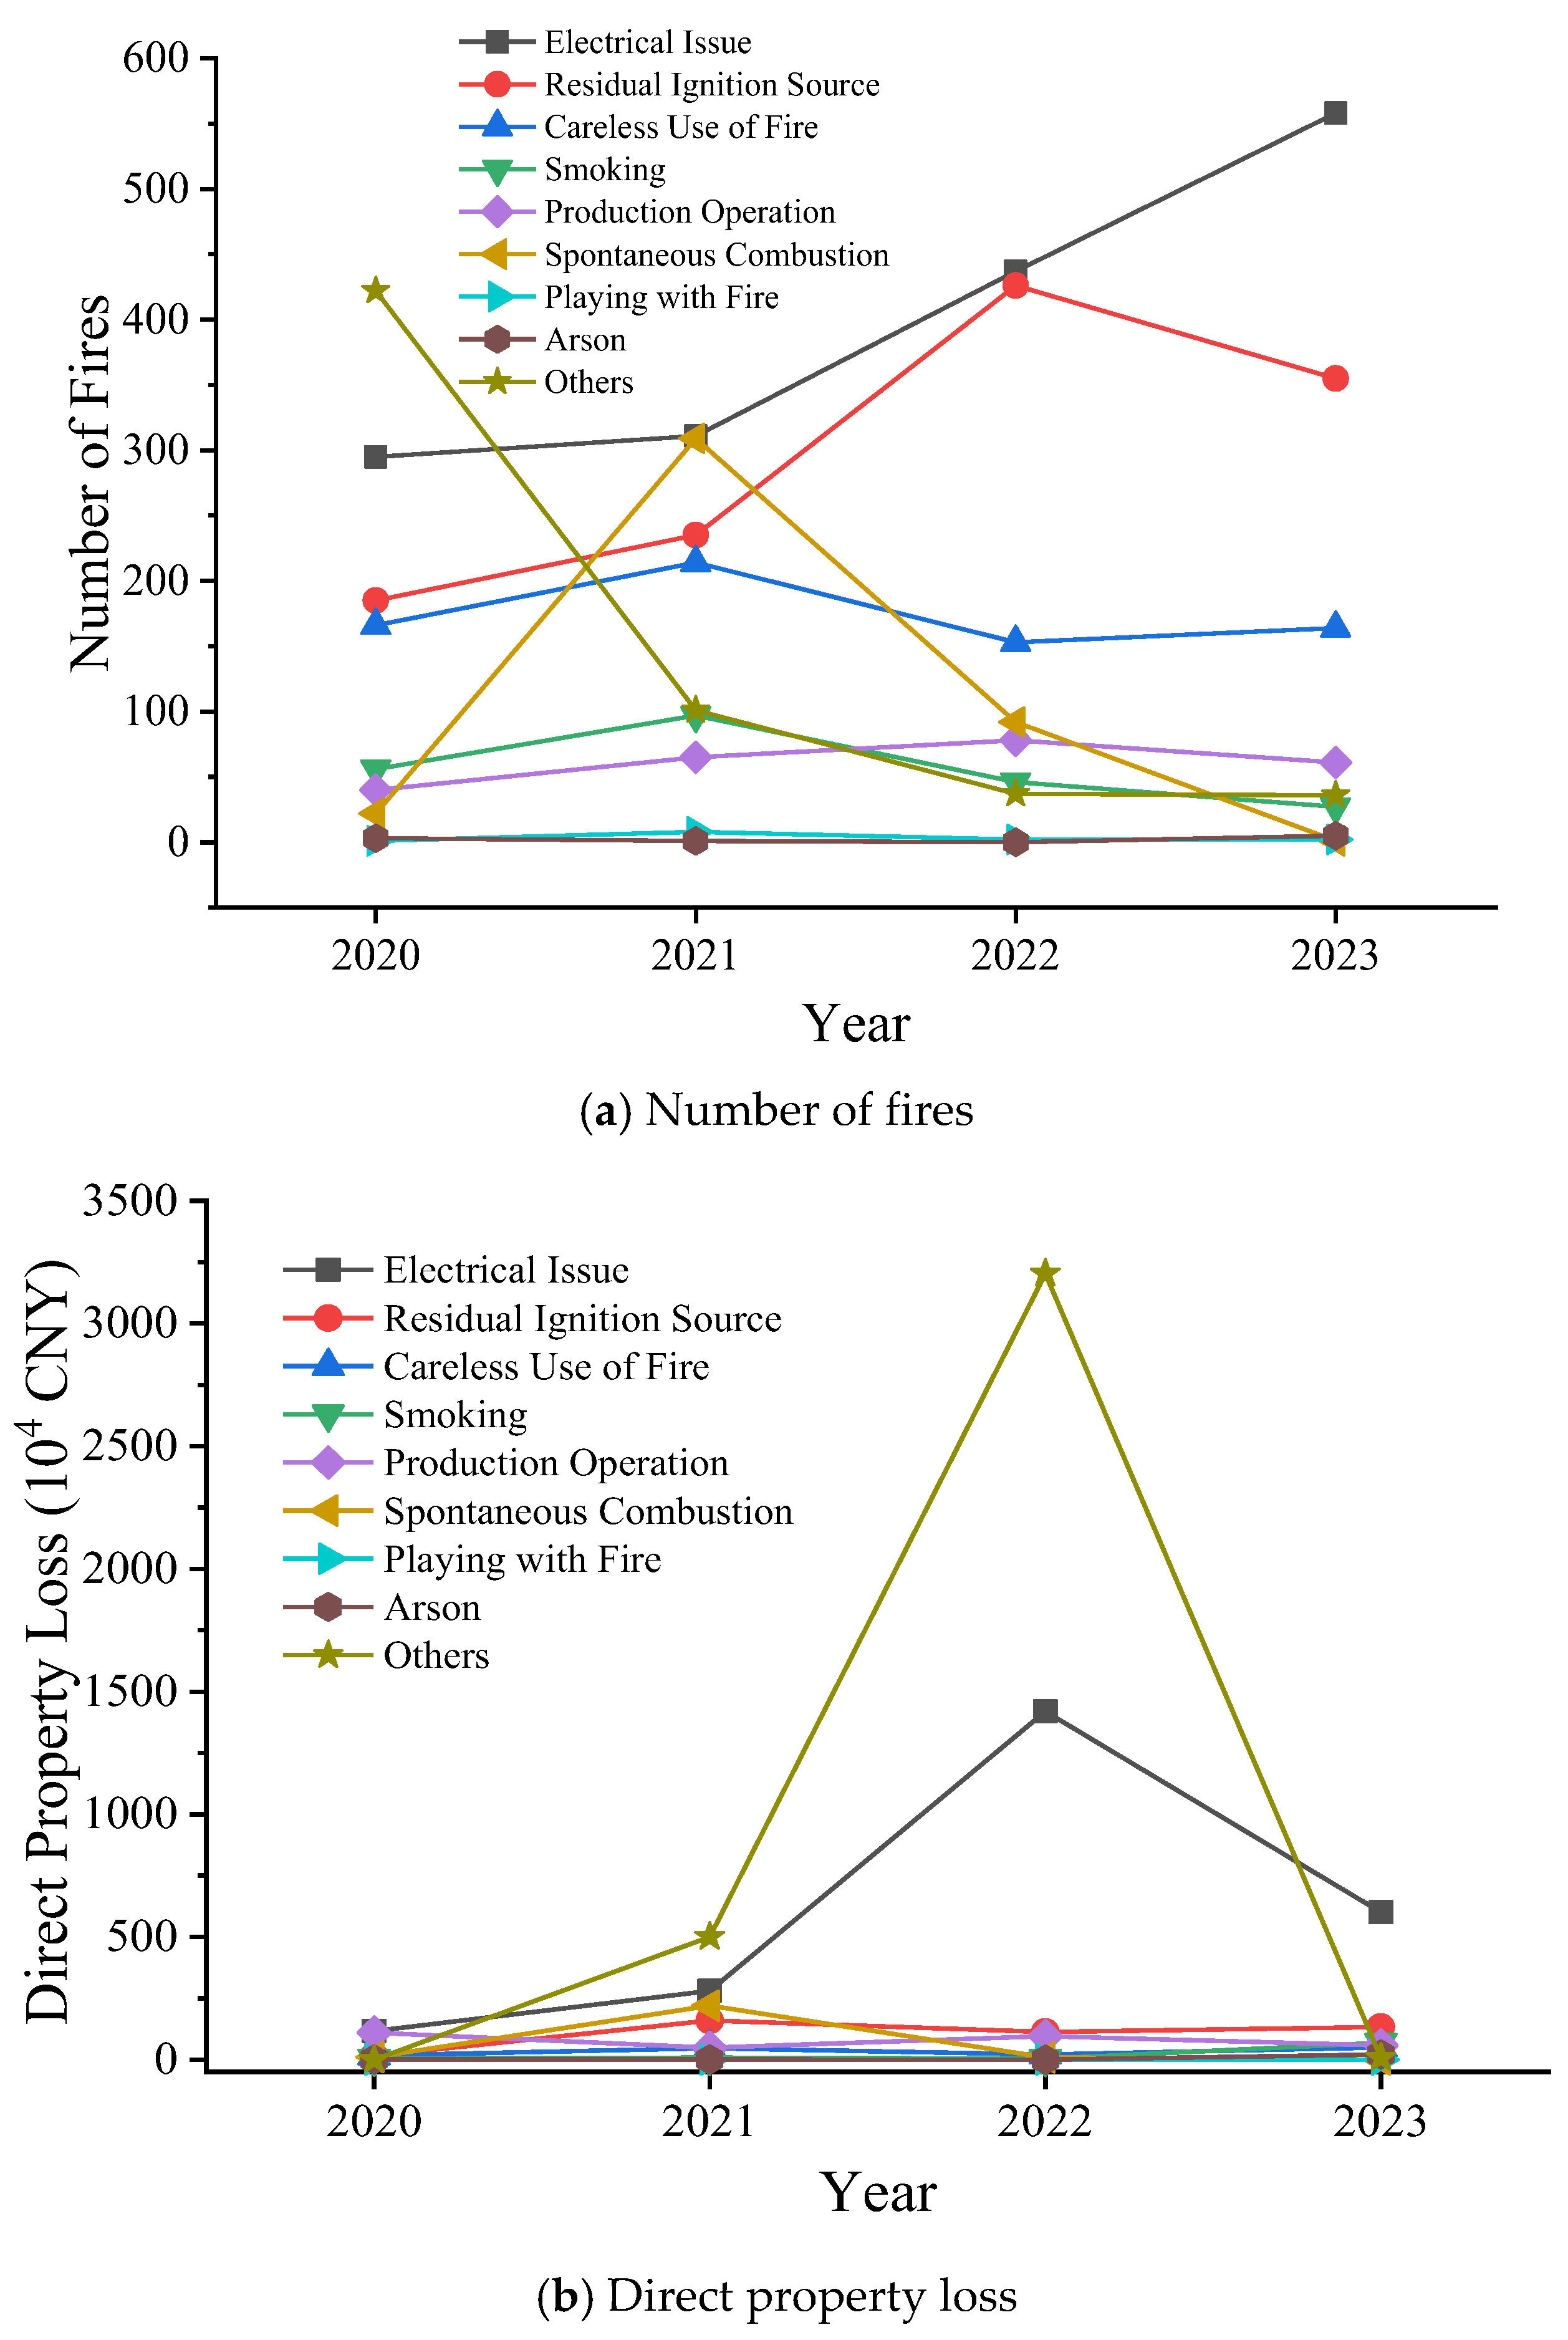
Figure 10a,b further illustrate how the number of fires and direct property loss caused by various fire causes have changed over the years. From
Figure 10a, it is evident that the number of electrical fires has been increasing steadily, maintaining its position as the leading cause of fires. Additionally, incidents caused by residual ignition sources and careless use of fire continue to fluctuate at high levels, reflecting the ongoing serious fire safety situation in Xiaoshan District in recent years. Although the number of fires caused by various factors has not decreased significantly in recent years, the curves in
Figure 10b indicate that the direct property loss associated with different fire causes has shown a generally stabilizing and improving trend. Except for electrical fires, which continue to cause significant loss, this highlights the necessity and urgency of strengthening electrical safety management. Electrical issues are not only the primary cause of fire incidents but also a key factor in causing casualties (see
Table 1). The high occurrence of electrical fires in Xiaoshan District may be closely associated with its highly urbanized and industrialized context. Dense residential electricity consumption, intensive industrial and commercial activities, aging electrical circuits in older buildings, and the rapid increase in electric bicycles, new energy vehicles, batteries, and charging facilities may all increase electrical ignition risks. Therefore, electrical fire prevention should remain a priority in municipal districts, particularly through regular inspection of electrical wiring and equipment, renovation of aging circuits, standardized charging management, and intelligent monitoring of electrical fire hazards.
4. Discussion
The results of this study should be understood from the perspective of data-driven empirical diagnosis rather than methodological innovation. Although the temporal, spatial, and causal analyses used in this study are conventional statistical approaches, the recent district-level fire incident dataset provides several important insights into the fire risk characteristics of highly urbanized municipal districts.
First, Xiaoshan District showed the coexistence of relatively frequent fire incidents and low casualty rates, suggesting that fire occurrence frequency and casualty severity may be affected by different mechanisms. Second, the direct property loss was highly sensitive to a single relatively large fire incident, indicating that critical infrastructure and high-value facilities can substantially influence the overall loss profile of municipal districts. Third, the town/subdistrict-level regression results indicate that resident population and industrial output above designated size are the main socio-economic factors associated with the spatial differentiation of fire incidents and direct property loss. Fourth, the high proportion of electrical fires and the unusually large share of direct property loss attributed to “other” causes suggest that electrical safety management and fire cause investigation should be prioritized in highly urbanized districts. These findings provide practical evidence for developing more refined and locally targeted fire safety management strategies.
Based on the statistical analysis of fire incidents in Xiaoshan District from 2020 to 2023, and using national fire statistics as a macro-level contextual reference, the following countermeasures and recommendations are proposed for highly urbanized and industrialized districts with similar development conditions:
- (1)
Addressing the temporal distribution characteristics of fire incidents: Fire prevention measures should be adjusted according to high-risk seasons and time periods. In winter, inspections should focus on residential heating, high-power electrical appliances, temporary wiring, and storage of combustible materials. In summer, greater attention should be paid to outdoor electrical facilities, transformers, air-conditioning equipment, road green belts, and isolation zones to reduce fires associated with high-temperature environments. For high-risk time periods, especially weekends, evening activity peaks, and early morning hours, dynamic duty systems and rapid response mechanisms should be strengthened. Since early morning fires may cause greater property loss due to delayed detection, nighttime fire warning and response capacity should be improved, particularly in residential communities, industrial premises, warehouses, and key public buildings. Time-specific inspection checklists can be established for key units to support more precise fire risk management.
- (2)
Addressing the spatial distribution characteristics of fire incidents: Fire safety management should be tailored to the socio-economic and functional characteristics of towns and subdistricts. For densely populated areas, the focus should be on community fire safety education, residential fire drills, smoke alarm installation and maintenance in older residential buildings, group rental housing, high-rise residential buildings, and households occupied by elderly residents. Community-level micro fire stations should also be strengthened to improve early response and self-rescue capacity. For industrially concentrated areas with high industrial output value, prevention efforts should focus on electrical equipment inspection, hazardous operation management, flammable material storage control, and closed-loop enterprise fire safety responsibility. Particular attention should be paid to high-power equipment, temporary electrical wiring, hot work, warehouses, and production sites involving combustible or flammable materials. Regular fire safety training should be provided for enterprise managers and workers to reduce ignition risks during production operations. For commercial and service-oriented areas with high retail activity and dense public gathering places, priority should be given to the maintenance of automatic fire alarm systems, sprinkler systems, emergency lighting, evacuation routes, smoke control facilities, and fire separation measures. These areas should also strengthen evacuation management, crowd-flow organization, and emergency response coordination to prevent small fires from developing into large-loss incidents.
- (3)
Addressing the causes of fire incidents: Electrical fire prevention should be regarded as a priority in highly urbanized districts. A comprehensive electrical safety management system should be established for residential, industrial, commercial, and public spaces. Regular inspection and maintenance should be conducted for electrical wiring, distribution cabinets, transformers, high-power electrical equipment, charging facilities, and temporary power connections. Particular attention should be paid to older residential communities, industrial plants, warehouses, commercial complexes, electric bicycle parking and charging areas, and new energy vehicle charging facilities. Technologies such as the Internet of Things, big data, and artificial intelligence can be used to develop online monitoring and early warning platforms for electrical fire hazards. These systems can monitor abnormal current, overload, short circuits, leakage current, and overheating in real time, thereby supporting early identification and correction of potential risks. For human-related causes such as residual ignition sources and careless use of fire, fire safety education should be strengthened through community publicity, school education, enterprise training, and routine inspections. In addition, because “other” causes contributed a large proportion of direct property loss, fire investigation procedures should be further improved to enhance the identification accuracy of complex or uncertain fire causes and provide more reliable data support for fire statistics, risk assessment, and targeted prevention.
While this study provides a comprehensive analysis of fire incidents to support fine-grained fire safety management, certain limitations must be acknowledged. First, due to data confidentiality and administrative barriers across local jurisdictions, granular comparative data from neighboring districts within Zhejiang Province or the Yangtze River Delta were inaccessible. Consequently, national statistics were employed strictly as a macro-level contextual benchmark to contrast local specificities rather than as a direct regional baseline. This single-district focus means the generalizability of the findings relies on mechanism-based transferability to areas with similar socio-economic development rather than absolute statistical representation. Second, due to data scope constraints, variables such as building types and fire protection resource distributions were omitted. Future studies should aim to collect multi-district datasets under unified statistical frameworks to conduct more robust regional comparative analyses.
5. Conclusions
- (1)
Due to its economic development and well-established fire rescue facilities, Xiaoshan District experienced mostly general fires, with one relatively large incident during the statistical period. The district’s fire mortality rate per 100,000 population was significantly lower than the national average. However, due to the high population density and active social and economic activities, the fire incidence rate per 10,000 population and the fire loss rate per 100 million CNY of GDP were higher than the national average. This indicates that municipal districts, while possessing strong fire emergency capabilities, still face high fire risks and significant sensitivity to damage due to the concentration of people and resources.
- (2)
In Xiaoshan District, the highest number of fires and the greatest direct property loss occurred in January. The proportion of fire incidents in spring and summer was significantly lower and higher than the national average, with a difference of 5% in both cases. Weekly, the highest number of fires and direct property loss occurred on Tuesday and Saturday, showing a “bimodal” pattern. Daily, the number of fires was positively correlated with human activity, with the peak period from 4 p.m. to 8 p.m. accounting for 32.47% of all fire incidents, while the low period from 2 a.m. to 6 a.m. only accounted for 9.10%. However, early morning fires caused more significant property loss (41.60% of the total direct property loss). It can be concluded that while seasonal factors have a relatively weaker impact on fire incidents in municipal districts, they are highly coupled with the rhythm of human social activities.
- (3)
The spatial distribution of fires in Xiaoshan District is closely related to population and economic factors. The resident population and industrial output value above designated size showed a significant positive correlation with both the number of fires and direct property loss. The service output value above designated size showed a significant negative correlation with the number of fires and a significant positive correlation with direct property loss. Total retail sales of consumer goods showed a significant positive correlation with the number of fires, but no significant correlation with direct property loss. Thus, the spatial distribution of the resident population and industrial output value above designated size is the primary factor driving the spatial differentiation of fire incidents in municipal districts.
- (4)
As in the national situation, electrical issues are the primary cause of fire incidents in Xiaoshan District, responsible for 31.95% of fires and 32.92% of direct property loss. Electrical issues are also a key factor in causing casualties. However, the largest proportion of direct property loss in Xiaoshan District comes from “others” causes, accounting for 50.55%, about six times higher than the national average. This highlights the particularly prominent risk of electrical fires in municipal districts and the need to strengthen electrical equipment maintenance and fire monitoring technologies. Furthermore, due to the diverse building functions, complex activity types, and multiple management entities in municipal districts, fire causes are more complicated, making it crucial to enhance the professionalism and precision of fire investigations.