Essay

Prediction Model Construction for Forest and Grassland Fire Occurrence in Sichuan Province and Its Preliminary Application in Transmission Line Scenarios

1
National Forestry and Grassland Fire Monitoring, Early Warning and Prevention Engineering Technology Research Center, Ecology and Nature Conservation Institute, Chinese Academy of Forestry, Beijing 100091, China
2
Sichuan Provincial Forest and Grassland Fire Prevention Monitoring Center, Chengdu 610081, China
3
Xinjiang Uygur Autonomous Region Altai Mountain State-owned Forest Administration Bureau, Altay 836500, China
*
Author to whom correspondence should be addressed.
Fire 2026, 9(6), 222; https://doi.org/10.3390/fire9060222
Submission received: 24 March 2026 / Revised: 16 May 2026 / Accepted: 22 May 2026 / Published: 27 May 2026

Abstract

This study integrates multi-source driving factors from 2005 to 2024, including meteorological elements, fire danger indices, vegetation, topography, and human activities, to comparatively analyze the performance of four machine learning models—RF, LightGBM, XGBoost, and DNN—in the daily scale prediction of forest and grassland fires in Sichuan Province. A Nested Cross-Validation framework, using year as the grouping variable, was employed to evaluate model robustness, and the SHAP method was introduced to quantify the driving mechanisms of the factors. The results indicate that LightGBM is the overall optimal model, with its ROC AUC reaching 0.9193 in nested cross-validation and 0.9411 in independent temporal testing, demonstrating superior predictive capability and cross-year generalization performance. SHAP analysis reveals a hierarchical structure of fire drivers: land type constitutes the a priori physical constraint for fire occurrence, meteorological and drought indicators dominate the differentiation of the risk gradient, while topography and human activities serve as spatial modulators. In an independent sample validation on 9 December 2024, high-fire-risk grids showed high consistency with the distribution of actual fire points. For transmission line application scenarios, a risk distribution map constructed by coupling fire risk values with wind speed thresholds successfully identified actual fire point areas, indicating that this framework can provide a scientific basis for forest and grassland fire prevention and for power grid enterprises to conduct precise early warning and regionalized control.

1. Introduction

Forest and grassland fires are major natural disasters with extensive global impacts, characterized by randomness and suddenness. They cause the destruction of forest and grassland vegetation within a short period, inducing ecosystem degradation and biodiversity loss, accompanied by casualties and economic losses [1,2]. To promote the shift in fire prevention and control from post-disaster response to front-end early warning, relevant studies typically construct fire occurrence probability prediction models based on statistical models or machine learning methods and subsequently conduct fire danger level zoning and driving factor identification [3,4]. Existing models include both comprehensive prediction frameworks that do not distinguish between ignition sources and targeted modeling for specific ignition mechanisms, such as lightning-ignited fires [5].
In recent years, forest and grassland fires related to transmission lines have shown a frequent occurrence trend [6]. Driven by the needs of power grid enterprises for corridor fire risk management and the insurance industry for risk assessment, the identification of forest and grassland fire risks in transmission line scenarios has gradually become an important issue [7]. However, compared with “comprehensive fires,” historical samples of fires caused by transmission lines are more scarce, making it difficult to support specialized ignition source model training and sufficient validation [8]. Limited by this, this paper intends to generate transmission line fire risk distribution maps using a combination of “comprehensive fire risk prediction + wind speed constraints.” The reliability of this approach highly depends on the generalization ability and risk value accuracy of the comprehensive model; once the model’s performance becomes unstable in cross-year or cross-regional extrapolation, the usability and credibility of the scenario-based results will decrease simultaneously. Sichuan Province is one of the provinces with a high incidence of forest and grassland fires in China. Between 2008 and 2022, forest and grassland fires caused by transmission lines accounted for 9.8%, ranking fourth in the number of ignitions by all fire sources [9]. Taking the Xichang incident in Liangshan Prefecture in 2020 as an example, a transmission line failure ignited surface weeds and caused a forest fire, resulting in serious casualties and major economic losses [10]. In addition, relevant research on comprehensive forest and grassland fire risk modeling for Sichuan Province still has three shortcomings: First, there is a relative lack of systematic comparison and optimization of the generalization capabilities of different models at the provincial scale. Among existing studies, Peng et al. [11] obtained a high AUC based on the Logistic model but did not conduct a multi-model comparison and lacked temporal extrapolation tests; although Zhang [12] compared the applicability of Maxent and Biomod2, independent data were not used for evaluation, leaving generalization capabilities difficult to confirm. Second, most existing studies use monthly scale data, which is difficult to meet the practical demands of risk warning and refined management for daily scale prediction. Third, current research mostly remains at the level of comprehensive fire danger modeling, and the application of comprehensive fire danger results to transmission line scenarios has not yet been explored.
Based on the above issues, this study takes Sichuan Province as the research object, integrates fire point data and multi-source driving factors from 2005 to 2024, constructs a daily scale binary sample set, and compares multiple machine learning models under an evaluation framework strictly grouped by year to select the optimal model with stronger generalization capability for predicting the occurrence probability of provincial comprehensive forest and grassland fires; meanwhile, interpretability methods are combined to characterize key driving factors and their directions of action. On this basis, a daily comprehensive forest and grassland fire danger distribution map for Sichuan Province is generated, and wind speed thresholds are further introduced to construct a daily risk distribution map under transmission line scenarios, finally followed by an analysis combined with real cases. The work of this paper is mainly reflected in: establishing a daily scale prediction data and evaluation system oriented toward the province to test model stability through cross-year extrapolation; completing multi-model comparisons under unified features and evaluation conditions to determine a robust model for fire danger mapping; and combining comprehensive fire danger results with wind speed constraints to achieve risk identification applications in transmission line scenarios.

2. Data

2.1. Overview of the Study Area

Sichuan Province is located in Southwest China (97°21′–108°33′ E, 26°03′–34°19′ N) and governs 21 municipal administrative regions. The province covers an area of 486,000 km2, which can be divided into three parts: Southwest Sichuan, Northwest Sichuan, and East Sichuan. Within this area, mountains account for 77.2%, hills for 12.9%, plains for 5.3%, and plateaus for 4.7% [13]. Southwest Sichuan (including Liangshan Prefecture and Panzhihua City) has a subtropical semi-humid climate; Northwest Sichuan (comprising Garzê Prefecture and Aba Prefecture) has an alpine climate; and East Sichuan (including the remaining cities and prefectures except for Liangshan, Panzhihua, Garzê, and Aba) has a mid-subtropical humid climate [14]. Sichuan Province is a major province for forestry resources in China. The main forest types include evergreen broad-leaved forest, deciduous broad-leaved forest, coniferous and broad-leaved mixed forest, and subalpine coniferous forest. The stand types prone to fires are Pinus yunnanensis forests, Picea-Abies forests, montane oak forests, and Pinus densata forests [15].

2.2. Forest and Grassland Fire Data

The fire point data for Sichuan Province from 2005 to 2024 in this study were derived from the MODIS Global Monthly Fire Location Product (MCD14ML), which is a daily dataset aggregated by month with a spatial resolution of 1 km. Data indicators include geographic location, date, brightness temperature of fire points, and fire radiative power, among others (http://firms.modaps.eosdis.nasa.gov/ (accessed on 16 May 2025)). This paper refers to the method of He et al. [16] to perform the following preprocessing on the MCD14ML data: (1) filtering points with a confidence level ≥ 90 as real fire points; (2) using land cover data to extract fire points under forest and grassland cover as forest and grassland fire points; (3) grouping fire points that simultaneously satisfy the conditions of a time interval ≤ 1 d and a distance ≤ 1 km into the same fire process, and retaining only the information related to the earliest appearing forest and grassland fire point.
To construct a binary sample set for the forest fire occurrence prediction model, a certain number of random points need to be created as non-fire points. To reduce temporal confounding effects, we adopted a matched sampling strategy at the daily scale; that is, for each day d, if the number of fire points on that day is nd, an equal number of non-fire points nd is randomly selected. Spatially, non-fire points were randomly selected within the study area with a minimum distance constraint: any non-fire point maintains a buffer distance of no less than 1000 m from fire points of the same day, historical fire points, and other non-fire points, to reduce the risks of spatial autocorrelation and information leakage. Given that the research objective is generally oriented toward province-wide risk mapping rather than being limited to the interior of the forest and grassland mask, and that vegetation flammability is an important constraint for fire occurrence, we allowed a small portion of non-fire points to fall on non-forest/grassland types. This enhances the model’s ability to identify and suppress non-combustible or low-combustibility underlying surfaces while controlling the proportion to prevent the model from over-relying on land cover as a single feature.

2.3. Drivers of Forest and Grassland Fires

Forest and grassland fires result from the coupled effects of various factors. To systematically quantify the relative influence of various driving factors on forest and grassland fires, this study constructed a comprehensive driving factor framework based on previous research [17]. This framework covers meteorological variables, vegetation characteristics, topographic conditions, and human activity indicators, and incorporates multi-source remote sensing data and reanalysis data for comprehensive selection to ensure the reliability of the selected variables in terms of temporal continuity, spatial representativeness, and regional applicability. Detailed descriptions of each driving factor and its corresponding data source are provided below (Table 1).
Land cover data: Vegetation types and their spatial distribution determine the composition and combustion potential of fire fuels, serving as an important fundamental condition for the occurrence of forest and grassland fires [18]. This study uses the GLC_FCS30D Global 30 m fine land cover dynamic monitoring dataset (1985–2022) published by the International Research Center of Big Data for Sustainable Development Goals (https://data.casearth.cn/ (accessed on 16 May 2025)). This dataset is constructed based on continuous change detection methods and contains 35 fine land cover types. The update cycle was 5 years before 2000 and has achieved annual updates since 2000.
Meteorological data: Spatiotemporal differences in meteorological conditions directly or indirectly affect fuel moisture content and play a leading role in the processes of fire ignition, spread, and intensity changes [19]. This study selected the ERA5 reanalysis dataset, the fifth generation published by the European Centre for Medium-Range Weather Forecasts (ECMWF) (https://cds.climate.copernicus.eu/ (accessed on 18 May 2025)), to obtain hourly meteorological element data from 2005 to 2024, including u and v wind speed components at 10 m height, 2 m air temperature, 2 m dew point temperature, and total precipitation. Daily wind direction was calculated and classified based on the daily mean u and v wind components. Wind direction was introduced into the model as a continuous angular variable to characterize near-surface wind-field features and the associated macro-circulation background. We acknowledge that wind direction is a periodic variable with circular continuity between 0° and 360°, and that cyclic encoding using sin(WD) and cos(WD) can reduce boundary discontinuity, particularly for DNN models. However, in this study, wind direction was retained in its original angular form to preserve its physical interpretability and facilitate SHAP-based interpretation. This representation allows the effects of specific wind-direction sectors on fire occurrence probability to be directly related to regional topography, atmospheric circulation, and transmission-line fire-risk scenarios. In contrast, sine and cosine transformation would convert wind direction into two projection components, making SHAP results less directly interpretable in terms of actual wind-direction intervals. Therefore, considering the emphasis of this study on both prediction and mechanism interpretation, the original angular form of wind direction was retained. The aforementioned meteorological elements comprehensively reflect the heat conditions, moisture status, and wind field characteristics of the study area, supporting the characterization of the meteorological background before and after fire occurrence. On this basis, to further comprehensively characterize fuel dryness and fire danger levels, this study introduced fire danger index system data provided by the Copernicus Emergency Management Service (https://ewds.climate.copernicus.eu/ (accessed on 10 October 2025)), including FWI, FFMC, DMC, DC, ISI, BUI, and KBDI. These indices are calculated based on ERA5 reanalysis data and reflect fuel moisture status and drought levels at different layers.
Topographic data: As relatively stable environmental factors, topographic conditions play an important regulatory role in fire behavior by influencing local climate, fuel dryness, and fire spread direction [20]. This study adopts the newly released GEBCO_2025 global terrain dataset (https://www.gebco.net/ (accessed on 14 May 2025)), which provides global land and ocean elevation information at a spatial resolution of 15 arc-seconds. Based on this DEM data, the elevation characteristics of the study area can be obtained, further supporting the comprehensive analysis of topographic background conditions.
Human data: Human activity is an important non-natural ignition source for forest and grassland fires, and its spatial distribution characteristics and activity intensity significantly affect the probability of fire occurrence. This study primarily selected the distribution of residential settlements and the road network as characterization variables for human activity [21]. Among these, the national residential point data is based on the names of administrative villages (communities) published by the National Bureau of Statistics (https://www.stats.gov.cn/ (accessed on 22 October 2025)). Through professional geocoding methods, village-level names were accurately matched to geographic coordinates to construct a standardized vector dataset of village-level residential settlements, reflecting human settlement and activity spatial patterns. Road data were constructed based on the OpenStreetMap (OSM) open-source platform (https://openstreetmap.org (accessed on 22 October 2025)), containing spatial distribution information of various road classes in China. The road network is not only an important indicator of areas with frequent human activity but also reflects, to a certain extent, the characteristics of fire source input and fire accessibility, providing key spatial information for characterizing the impact of human interference on the occurrence of forest and grassland fires.

3. Methods

3.1. Machine Learning Models

To evaluate the applicability of different machine learning algorithms in predicting the probability of fire occurrence and to ensure the robustness of the research results, this study performed a comparative analysis of four representative binary classification models [22,23,24,25]: Random Forest (RF), Light Gradient Boosting Machine (LightGBM), Extreme Gradient Boosting (XGBoost), and Deep Neural Network (DNN). These models encompass tree-based ensemble learning methods and deep learning methods, enabling both an examination of the models’ ability to characterize non-linear relationships between environmental factors and a comparison of predictive performance across different model structures within a complex feature space. Tree-structured models (RF, LightGBM, and XGBoost) possess significant advantages in handling multi-source environmental variables, non-linear relationships, and feature interactions, while exhibiting good robustness against noise and outliers. Conversely, through multi-layer non-linear mapping mechanisms, the DNN can automatically learn high-order feature representations, providing greater model flexibility for characterizing complex environmental driving mechanisms [26]. By systematically comparing these models under a unified feature system and evaluation framework, a comprehensive analysis was conducted on the performance differences and generalization capabilities of various machine learning models in fire occurrence probability prediction.

3.2. Model Evaluation

To evaluate the classification performance of each model in fire occurrence probability prediction, this study first constructed a confusion matrix based on the prediction results [27], including True Positive (TP), False Positive (FP), False Negative (FN), and True Negative (TN). Based on this, several evaluation metrics were calculated:
Accuracy = (TP + TN)/(TP + TN + FP + FN), measuring the overall predictive correctness of the model.
Precision = TP/(TP + FP), representing the proportion of actual positive cases among the samples predicted as positive.
Recall = TP/(TP + FN), also known as Sensitivity, used to measure the model’s ability to identify positive samples.
F1 = 2·(Precision·Recall)/(Precision + Recall), the harmonic mean of precision and recall, used for a comprehensive evaluation of classification performance under conditions of class imbalance between positive and negative samples.
Specificity = TN/(TN + FP), evaluating the model’s ability to identify negative samples.
Furthermore, this study evaluated the overall discriminative power of the models at different classification thresholds by plotting the Receiver Operating Characteristic (ROC) curve and calculating the Area Under the Curve (AUC). An AUC value closer to 1 indicates a stronger ability of the model to distinguish between positive and negative samples. Since fire samples often involve class imbalance issues, ROC-AUC provides a more robust performance evaluation [28].
To ensure the reliability and generalization of the model performance evaluation results, this study adopted a Nested Cross-Validation framework [29]. The outer cross-validation was used for model generalization performance evaluation, while the inner cross-validation was used for hyperparameter optimization, thereby effectively avoiding overly optimistic performance estimates caused by model parameter tuning. In each outer fold, the model used only the training subset for parameter tuning and performed performance evaluation on an independent validation subset. Ultimately, a robust estimate of the model’s predictive performance was obtained by calculating the mean and standard deviation of the results across multiple folds.

3.3. Hyperparameter Tuning

To optimize the predictive performance of each classification model, this study employed the Optuna hyperparameter optimization framework for automated tuning of model parameters [30]. Corresponding hyperparameter search spaces were constructed for different types of classification models based on existing research and model characteristics. During the model tuning process, the training data were further divided into training and validation subsets within the nested cross-validation framework to evaluate the performance of different hyperparameter combinations. Optuna utilizes the Tree-structured Parzen Estimator (TPE) as a sampling strategy to systematically explore candidate parameter configurations within the predefined search space, using the Area Under the Receiver Operating Characteristic Curve (ROC AUC) on the validation set as the objective function for optimization. Each model underwent a maximum of 50 optimization trials, combined with a median pruning strategy to terminate poorly performing trials early, thus improving search efficiency.

3.4. SHapley Additive exPlanations (SHAP)

To enhance the interpretability of model prediction results and reveal the potential driving mechanisms of fire occurrence, this study employed the SHapley Additive exPlanations (SHAP) [31] method for model explanation analysis. During the analysis, explanations were carried out at both global and local scales: at the global level, the relative importance of different variables for fire occurrence probability prediction was evaluated using the mean absolute SHAP values of features; at the local level, the positive and negative impacts of each variable on prediction results and their contribution directions were revealed through the distribution characteristics of single-sample SHAP values. This method provides a reliable quantitative basis for understanding the model decision-making process and key influencing factors.

3.5. Research Steps

This study focuses on fire occurrence probability modeling and evaluation, following a technical route of “Data Preparation—Model Construction—Performance Evaluation—Model Explanation—Spatial Inference.” The specific research steps are as follows:
(1) Data Processing: First, data with a resolution greater than 5 km were uniformly resampled to 5 km. The data were strictly partitioned by time, with 2005–2020 serving as the training set and 2021–2024 as the test set. To reduce the sparsity and noise impact of categorical features, this study performed a regularized merging of land-use types into four categories: forest, shrub, grass, and other, where forest, shrub, and grass represent the main combustible vegetation types, and other represents other underlying surfaces. Given that land use is a nominal variable without an ordinal relationship, one-hot encoding was used to avoid the pseudo “distance” structure introduced by integer encoding. Continuous variables were subjected to z-score normalization to eliminate numerical instability and decreased convergence efficiency caused by dimensional differences, and to reduce the interference of dimensions on feature contribution evaluation. Finally, a unified and reproducible input feature space was constructed by fixing the category set and encoding order, and by maintaining consistency using normalization parameters estimated from the training set in subsequent data phases, ensuring consistent feature dimensions and semantics across all datasets.
(2) Model Training and Nested Cross-Validation: To obtain robust estimates of model generalization performance under limited sample conditions and to avoid information leakage during the hyperparameter tuning process, this study used the Nested Cross-Validation framework to train and evaluate the models using only the 2005–2020 training set. The outer cross-validation was used to evaluate the model’s generalization ability on unknown data, and the inner cross-validation was used for hyperparameter optimization. Specifically, using the year as a grouping variable, StratifiedGroupKFold was adopted to achieve grouping by year while maintaining relatively balanced class proportions, thereby ensuring that samples from the same year would not appear in the training and validation subsets simultaneously, reducing the risk of information leakage caused by temporal correlation. The outer cross-validation was set to 10 folds; in each fold, approximately 9/10 of the year groups were used as the outer training subset, and the remaining 1/10 were used as an independent outer validation subset to obtain the generalization performance estimate for that fold. Within each outer fold, hyperparameter optimization was performed for each candidate model using only the outer training subset, with Optuna running 50 trials in the predefined parameter space. The inner cross-validation was set to 3-fold StratifiedGroupKFold (grouped by year), meaning the year groups included in the outer training subset were partitioned again into three non-overlapping subsets. Through cyclic training and validation, the 3-fold mean ROC-AUC from the inner layers was calculated as the objective function to determine the optimal hyperparameter combination. Finally, the model was refitted on the complete outer training subset using this set of optimal hyperparameters, and prediction and performance evaluation were performed only on the corresponding outer validation subset, thereby forming a robust generalization performance estimate without information leakage.
(3) Model Performance Evaluation and Comparative Analysis: In each fold of the outer cross-validation, a confusion matrix was constructed based on the model’s prediction results on the validation set, and multiple evaluation metrics, including accuracy, precision, recall, F1 value, and ROC-AUC, were calculated to measure the model’s classification performance from different perspectives. By comparing and analyzing the comprehensive performance of different models across multiple folds of cross-validation, the models demonstrating superior predictive performance and stability were selected.
(4) Determination of the Optimal Model and External Temporal Testing: Based on the comprehensive evaluation results of the nested cross-validation, the model with the best overall performance was selected. The final model was retrained on the full training dataset using the optimal hyperparameter combination obtained during nested cross-validation. Subsequently, this model was applied to the independent 2021–2024 test dataset to test the model’s generalization capability on a temporal scale. The model’s predictive performance was systematically evaluated by calculating classification evaluation metrics on the external test set, plotting ROC curves, and constructing confusion matrices. Meanwhile, the ROC-AUC obtained from external testing was compared with the mean AUC and its standard deviation from the nested cross-validation phase to test the consistency and reliability of the model’s predictive performance under temporal extrapolation conditions.
(5) Model Interpretability Analysis: To further reveal the internal mechanism of the model in predicting fire occurrence probability, this study introduced the SHapley Additive exPlanations (SHAP) method for interpretability analysis based on the optimal model. By calculating the SHAP values of each feature in the model’s prediction, the degree of influence of environmental factors and socio-economic factors on fire occurrence probability was quantified at both global and local levels. At the global level, the mean absolute SHAP values of features were used to evaluate the importance of different variables to the overall prediction results to identify key driving factors. At the local level, the positive and negative contributions of different variables and their influence directions in specific scenarios were revealed by analyzing the distribution characteristics of SHAP values in a single sample or a set of samples. This analysis helps enhance the transparency of the model’s prediction results and provides a quantitative basis for explaining the fire risk formation mechanism. To improve presentation readability, during the SHAP visualization phase, the SHAP values of the four one-hot features of LandType were summed according to additivity and merged into a single “LandType” variable for plotting. Since SHAP beeswarm plots require numerical features for color labeling, LandType was categorically encoded only for the visualization step: other = 0, forest = 1, shrub = 2, grass = 3; this encoding was not involved in model training or prediction, nor does it imply any ordinal or equidistant relationship between categories.
(6) Model Application and Verification: To test the generalization ability of the optimal model in predicting forest and grassland fire occurrence, a 5 km × 5 km spatial grid was constructed based on ArcGIS 10.8.2. 9 December 2024, a date not involved in model training and on which forest and grassland fires actually occurred, was selected as an independent validation sample. Multi-source factors such as meteorology, topography, land use/cover, and human activity for that day were spatially matched and aggregated at the grid scale to form grid-wise feature inputs. Subsequently, the optimal model was called to predict the forest and grassland fire occurrence risk for each grid unit, outputting a fire risk spatial distribution map, which was compared with the fire points of that day to evaluate the model’s predictive effectiveness.
(7) Transmission Line Scenario Application: The fire risk value threshold remains to be determined, while wind speed thresholds of 3.4 m/s and 8.0 m/s were selected. For data selection, the maximum wind speed of the day was used. On one hand, these two wind speeds represent the minimum wind speeds for Grade 3 and Grade 5 winds in the Chinese Wind Scale Standard (GB/T 28591-2012) [32], respectively. Grade 3 winds can cause branches to sway, and Grade 5 winds can cause entire trees to sway, which can lead to contact and short circuits between branches and transmission lines to varying degrees, triggering fires. On the other hand, fire occurrence often depends on instantaneous wind speed; as long as there has been strong wind during the day, there is a risk of fire. The maximum wind speed data grid for the day was aligned with the fire risk spatial distribution grid, and levels were classified using the thresholds to output a transmission line forest and grassland fire risk distribution map. Additionally, 9 December 2024, the most recent date at the time of writing with verified reports, was selected as a sample case for analysis to evaluate the potential application significance.

4. Results

4.1. Selection of the Optimal Prediction Model

4.1.1. Hyperparameter Optimization

During the inner-layer tuning process, 50 optimization trials were conducted for each model. Candidate parameter combinations were efficiently searched within a predefined parameter space, with the mean ROC-AUC from the inner 3-fold cross-validation maximized as the objective function. This approach ensured search efficiency while reducing the risk of overfitting. The final hyperparameters used for retraining and external testing were taken from the optimal parameter combination corresponding to the fold with the highest mean inner ROC-AUC across all outer folds. These are summarized in Table 2. All model training, nested cross-validation, hyperparameter optimization, and spatial simulation were performed on a Legion Y7000P IRX9 laptop(Lenovo (Beijing) Co., Ltd., Beijing, China) equipped with an Intel (R) Core (TM) i7-14650HX processor at 2.20 GHz (Intel Corporation, Santa Clara, CA, USA), an NVIDIA GeForce RTX 4060 GPU, and 16.0 GB RAM (NVIDIA Corporation, Santa Clara, CA, USA), running a 64-bit operating system on an x64-based processor. Under this computational environment, the total running time of the simulation workflow was approximately 77 min.

4.1.2. Model Performance

The results of the nested cross-validation based on year-grouping are shown in Table 3 and Figure 1. Random Forest, LightGBM, XGBoost, and DNN all demonstrated good classification and discriminative capabilities. In terms of Accuracy, LightGBM was the highest (82.45%), followed by DNN (82.12%), XGBoost (81.81%), and Random Forest (81.10%). Regarding Precision, Random Forest (85.53%) and XGBoost (85.40%) were relatively higher, while LightGBM was 84.07% and DNN was 78.17%, suggesting that RF and XGBoost have advantages in controlling false alarms. However, in terms of Recall, DNN was the highest (89.29%), exceeding LightGBM (79.98%), XGBoost (76.55%), and Random Forest (74.71%), indicating that DNN detects fire samples more comprehensively with fewer omissions. The F1 score, which synthesizes Precision and Recall, showed that DNN was the highest (0.8332), followed by LightGBM (0.8177) and XGBoost (0.8060), with Random Forest at 0.7963. Further comparison of the threshold-independent overall discriminative power (ROC AUC) revealed that LightGBM achieved the highest AUC (0.9193 ± 0.0296), slightly outperforming XGBoost (0.9189 ± 0.0299), Random Forest (0.9129 ± 0.0315), and DNN (0.9020 ± 0.0344). Overall, LightGBM exhibited the best comprehensive performance among the four models. It achieved the highest ROC AUC and Accuracy, while maintaining relatively balanced Precision and Recall, with small fluctuations across folds. Although DNN achieved the highest Recall and F1 score under the default classification threshold, these two metrics are threshold-dependent and may change when the decision threshold is adjusted. By contrast, ROC AUC provides a threshold-independent evaluation of the model’s overall discriminative ability across different classification thresholds. This property is particularly important for spatial fire-risk mapping and graded early-warning applications, in which continuous fire-occurrence probabilities are more informative than a single fixed binary classification result. Therefore, LightGBM was selected as the final optimal model because it demonstrated stronger overall discrimination, better robustness, and more stable cross-year generalization capability. In practical early-warning applications, the decision threshold can be further adjusted toward higher sensitivity to reduce missed fire detections.

4.1.3. Optimal Model Verification

To further evaluate the model’s temporal extrapolation capability and generalization stability, after completing the year-grouped nested cross-validation, LightGBM—the best-performing model—was fixed as the final model and subjected to external temporal testing on independent samples from 2021 to 2024. The results show that LightGBM achieved an ROC AUC of 0.9411 on the external test set, indicating that the model maintains excellent discriminative power on subsequent years’ data not involved in training. More importantly, this external AUC falls within the “mean ±1 standard deviation” consistency interval [0.8897, 0.9489] of the nested cross-validation AUC. This suggests a good correspondence between the performance estimates obtained during the cross-validation phase and the actual temporal extrapolation performance, with no significant overfitting or collapse in generalization performance. When classified using a threshold of 0.5, the external test set yielded an Accuracy of 84.68%, Precision of 87.06%, Recall of 81.47%, and F1 of 0.8417, maintaining a high detection rate for fire samples while ensuring low false alarms. These results collectively demonstrate that LightGBM maintains robust discriminative ability and transferability under scenarios of shifting cross-year data distributions and can serve as the final optimal model for subsequent spatial reasoning and risk mapping.

4.2. SHAP Interpretability Analysis

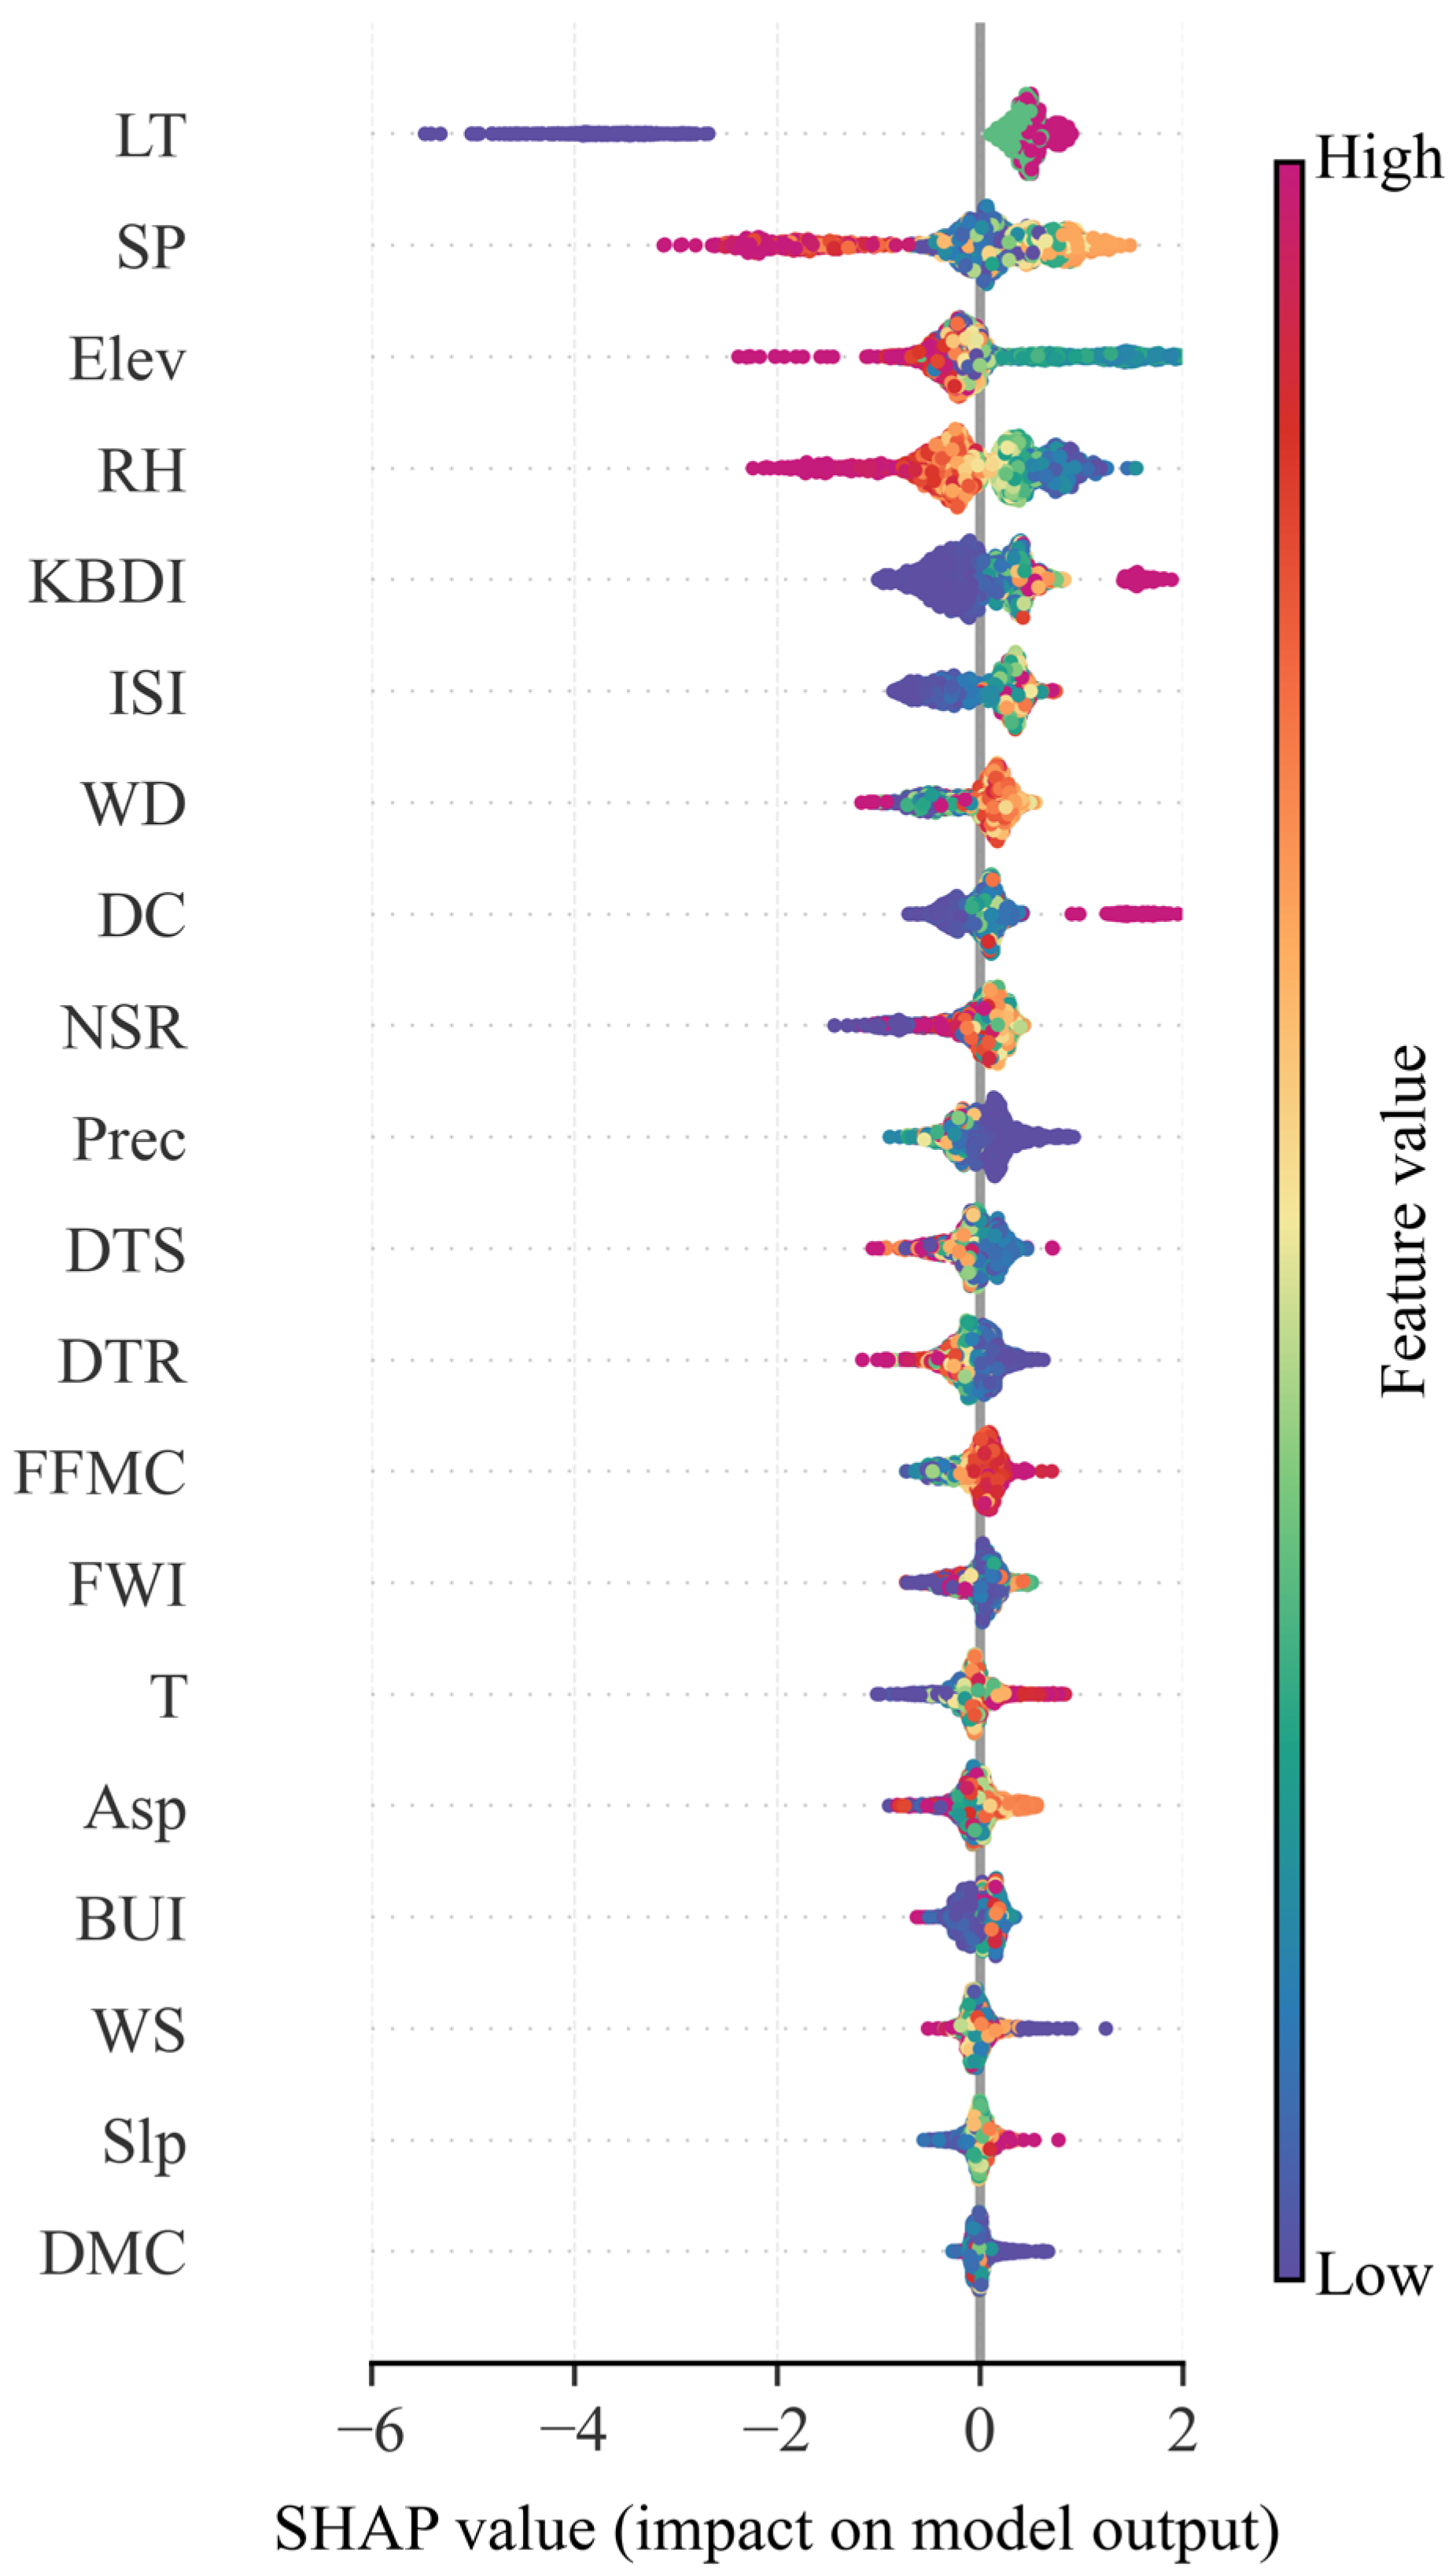
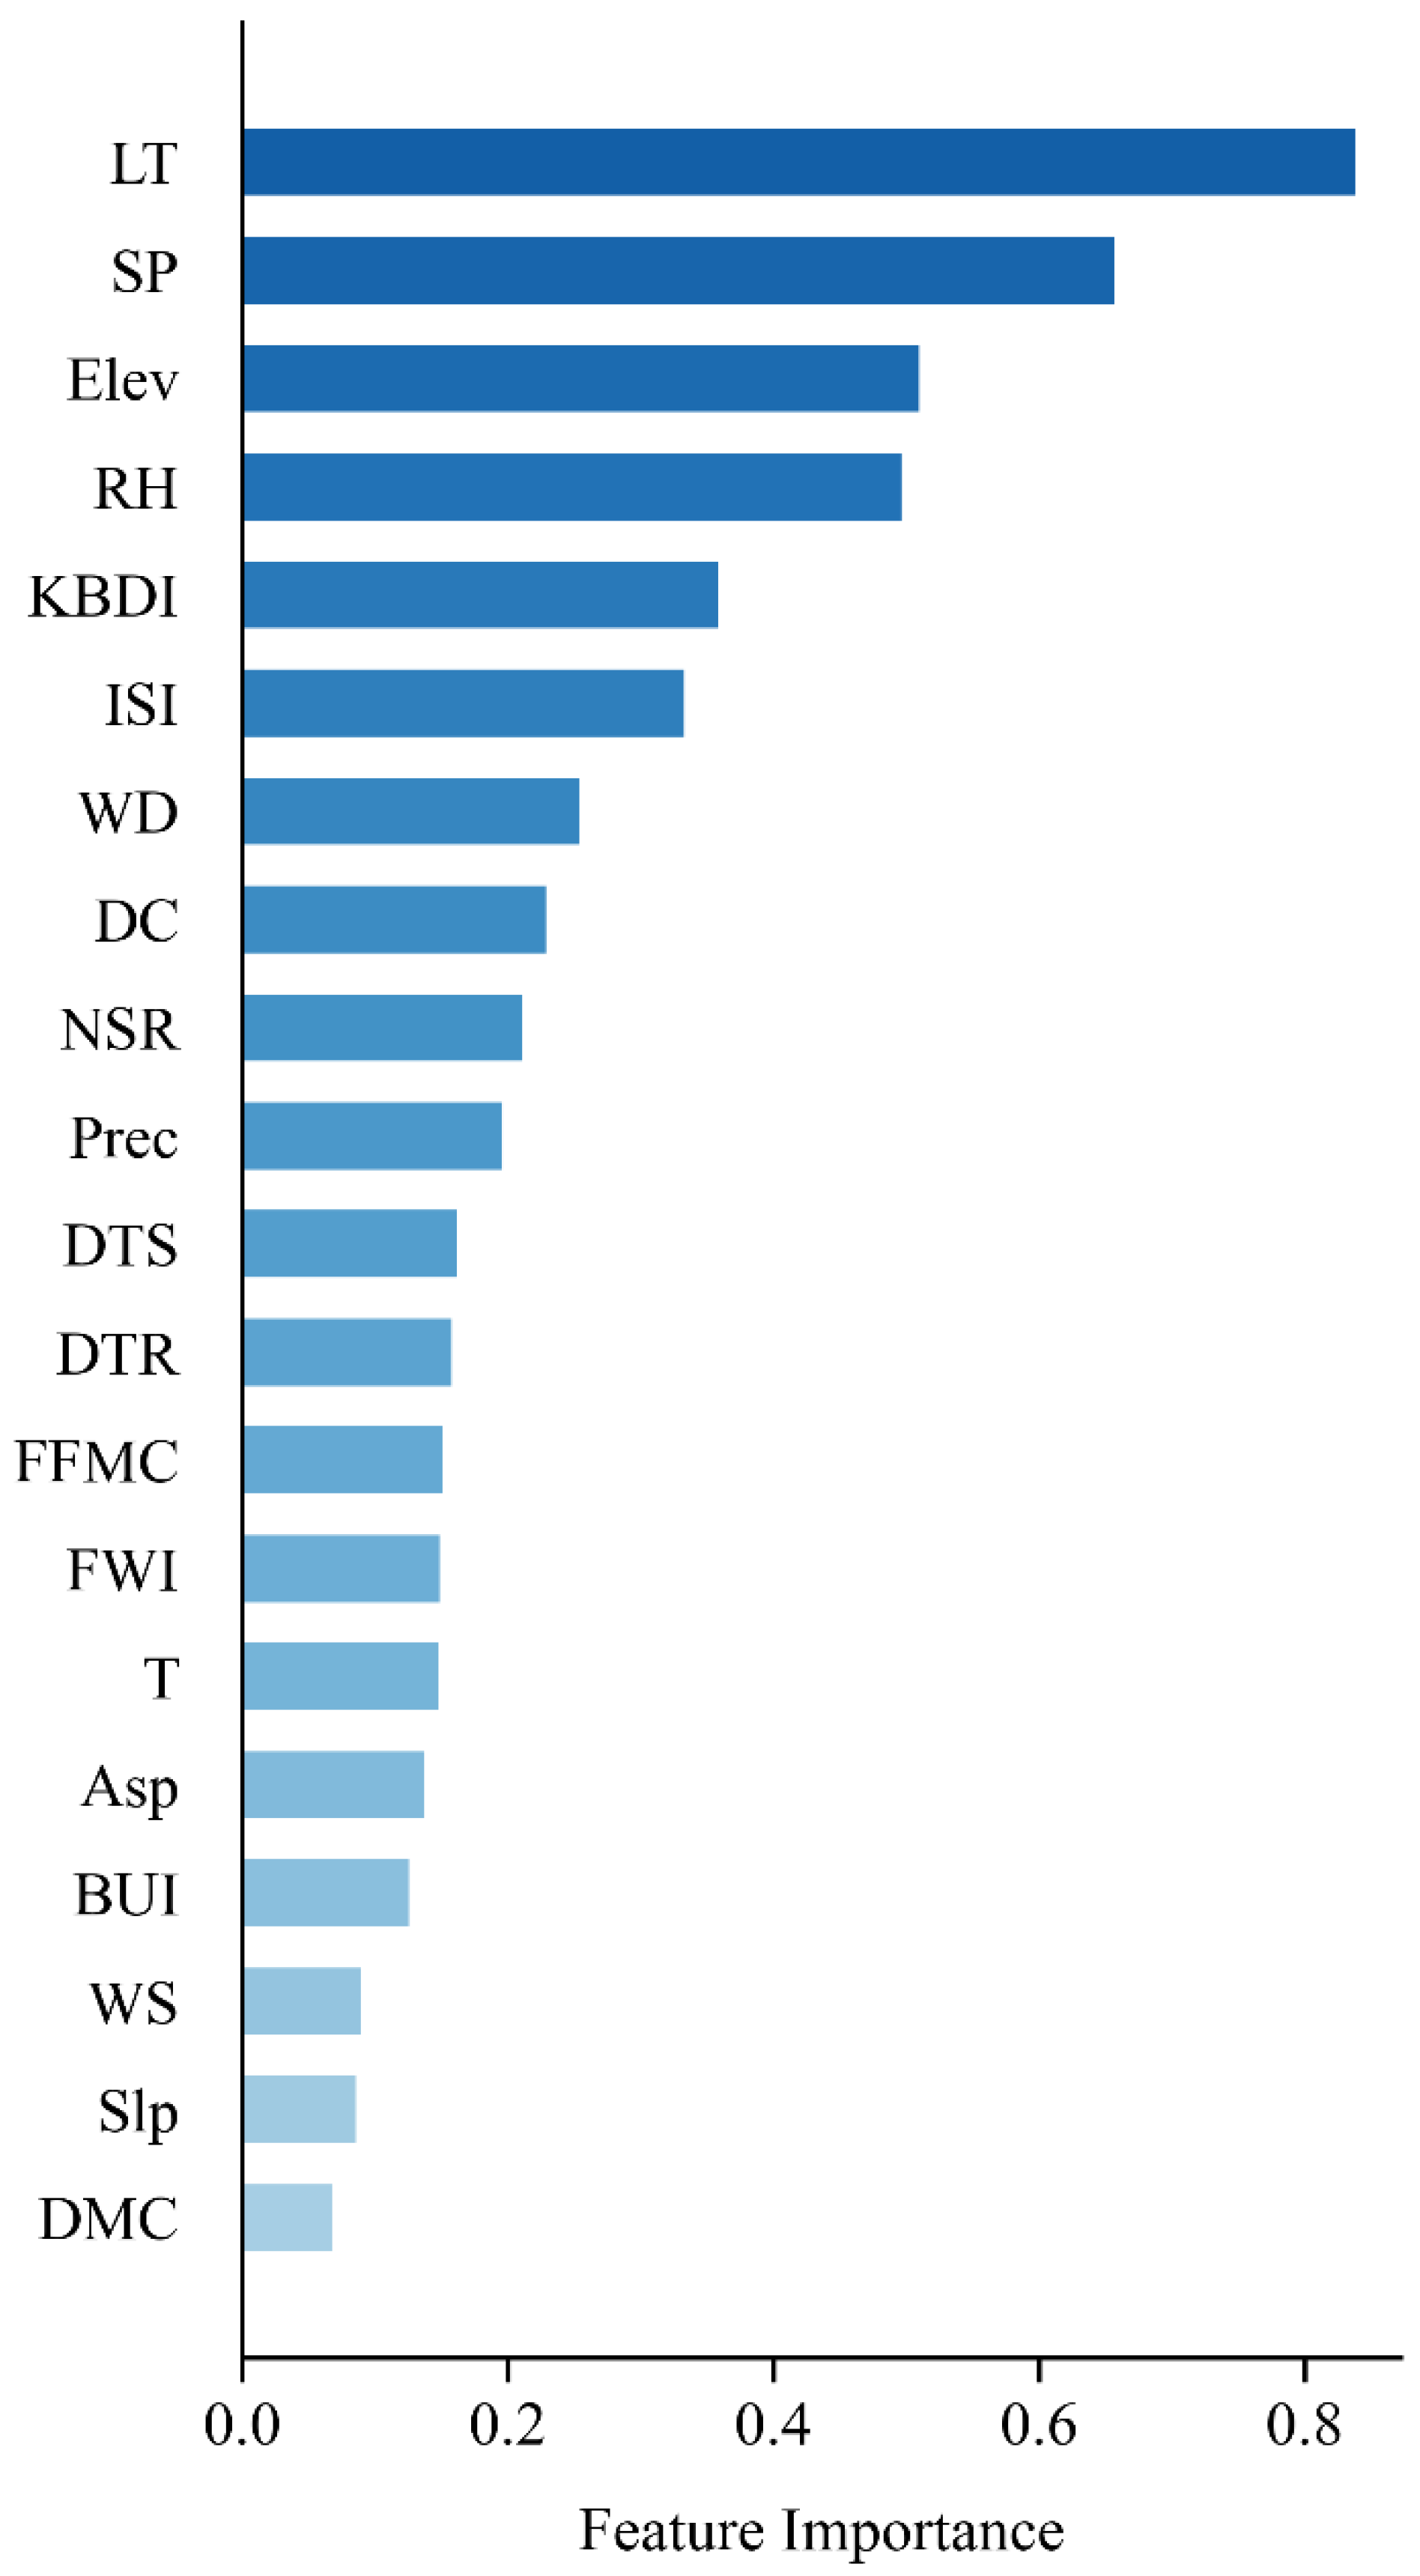
Based on the SHAP explanation results of the best model (Figure 2 and Figure 3), the driving mechanism can be summarized into two layers: the first layer is determined by land type, which dictates the fundamental prerequisite of fuel availability; the second layer is the variation in fire probability with meteorological and drought conditions, further influenced by topography and human activity, once fuel conditions are met. This hierarchical structure facilitates process interpretation, where fuel conditions define the possible range of fire occurrence, while environmental and human factors determine the risk intensity and its spatiotemporal variations.
Firstly, LandType ranks first in global importance, with its mean absolute SHAP value significantly higher than other variables, indicating that fuel type is the primary constraint in characterizing fire occurrence probability. From the SHAP distribution, LandType shows clear categorical differences: when a pixel belongs to “other,” the SHAP values are generally negative and large in magnitude, as the model identifies such surfaces as having insufficient fuel load and lacking fire conditions by significantly suppressing the predicted probability. In contrast, the SHAP values for combustible land types like forest/shrub/grass are closer to zero or fluctuate within a certain range, suggesting that only when the fuel prerequisite is basically met does the model rely more on meteorological and drought factors to differentiate risk. Therefore, land type plays a foundational restrictive role in model decision-making; it shapes the operational space of other variables by defining fuel conditions rather than simply increasing or decreasing risk in a single direction.
Secondly, under the prerequisite of combustible land types, the fire occurrence probability is mainly determined by near-surface meteorological conditions, cumulative fuel drought status, and fire danger indices. The overall pattern consistently shows “dry, hot, and enhanced fire danger” corresponding to positive SHAP values (increased fire probability), while “moist and unfavorable for combustion” corresponds to negative SHAP values (decreased fire probability). The role of relative humidity is clear: when humidity is low, the SHAP value is positive, promoting fire occurrence. Cumulative drought indicators like KBDI and DC show obvious positive aggregation at high values, indicating a significant rise in risk when fuels are sufficiently dried. Fire danger indices such as ISI, FFMC, and FWI are also among the top in importance, with high values typically corresponding to more positive SHAP distributions, reflecting their comprehensive characterization of fire occurrence. Temperature’s overall contribution is positive, with high temperatures promoting fire, whereas the marginal contribution of precipitation is relatively weak and more concentrated. This suggests that its impact might be partially substituted by humidity and drought indices, or is difficult to reflect in instantaneous features due to lag effects. SurfacePressure and WindDirection both rank high, likely reflecting the atmospheric circulation background and its coupling with near-surface meteorological elements. In terms of SHAP performance, the contribution of WindDirection exhibits both positive and negative values across different wind direction intervals, with some intervals dominated by negative contributions and others showing both. These differences in wind direction correspond to varied moisture transport, subsidence warming, or foehn effects, which can combine with topographic channeling to alter local dryness and fire danger conditions. Thus, wind direction in SHAP often manifests as differing positive/negative contributions to prediction probability across wind directions rather than a simple linear increase or decrease with numerical value. Regarding topography, Elevation shows more pronounced non-linearity and spatial differences (lower elevations are more likely to be positive, higher elevations more negative), while the contributions of Slope and Aspect are smaller and more concentrated, potentially manifesting more through interactions with meteorology and vegetation. Human activity variables, Distance To Settlement and Distance To Road, have moderate importance and consistent directions: closer proximity is more likely to result in positive SHAP values, indicating that within combustible land types, anthropogenic ignition source exposure and accessibility remain key triggers.
Overall, the SHAP results support an explanatory framework where “land type first defines the combustible range, followed by meteorology-drought conditions and human exposure shaping the risk gradient,” providing insights for zonation management: first identifying key assessment areas by fuel type, and then conducting refined early warning and control based on drought/fire danger status and human activity intensity.

4.3. Practical Application and Verification

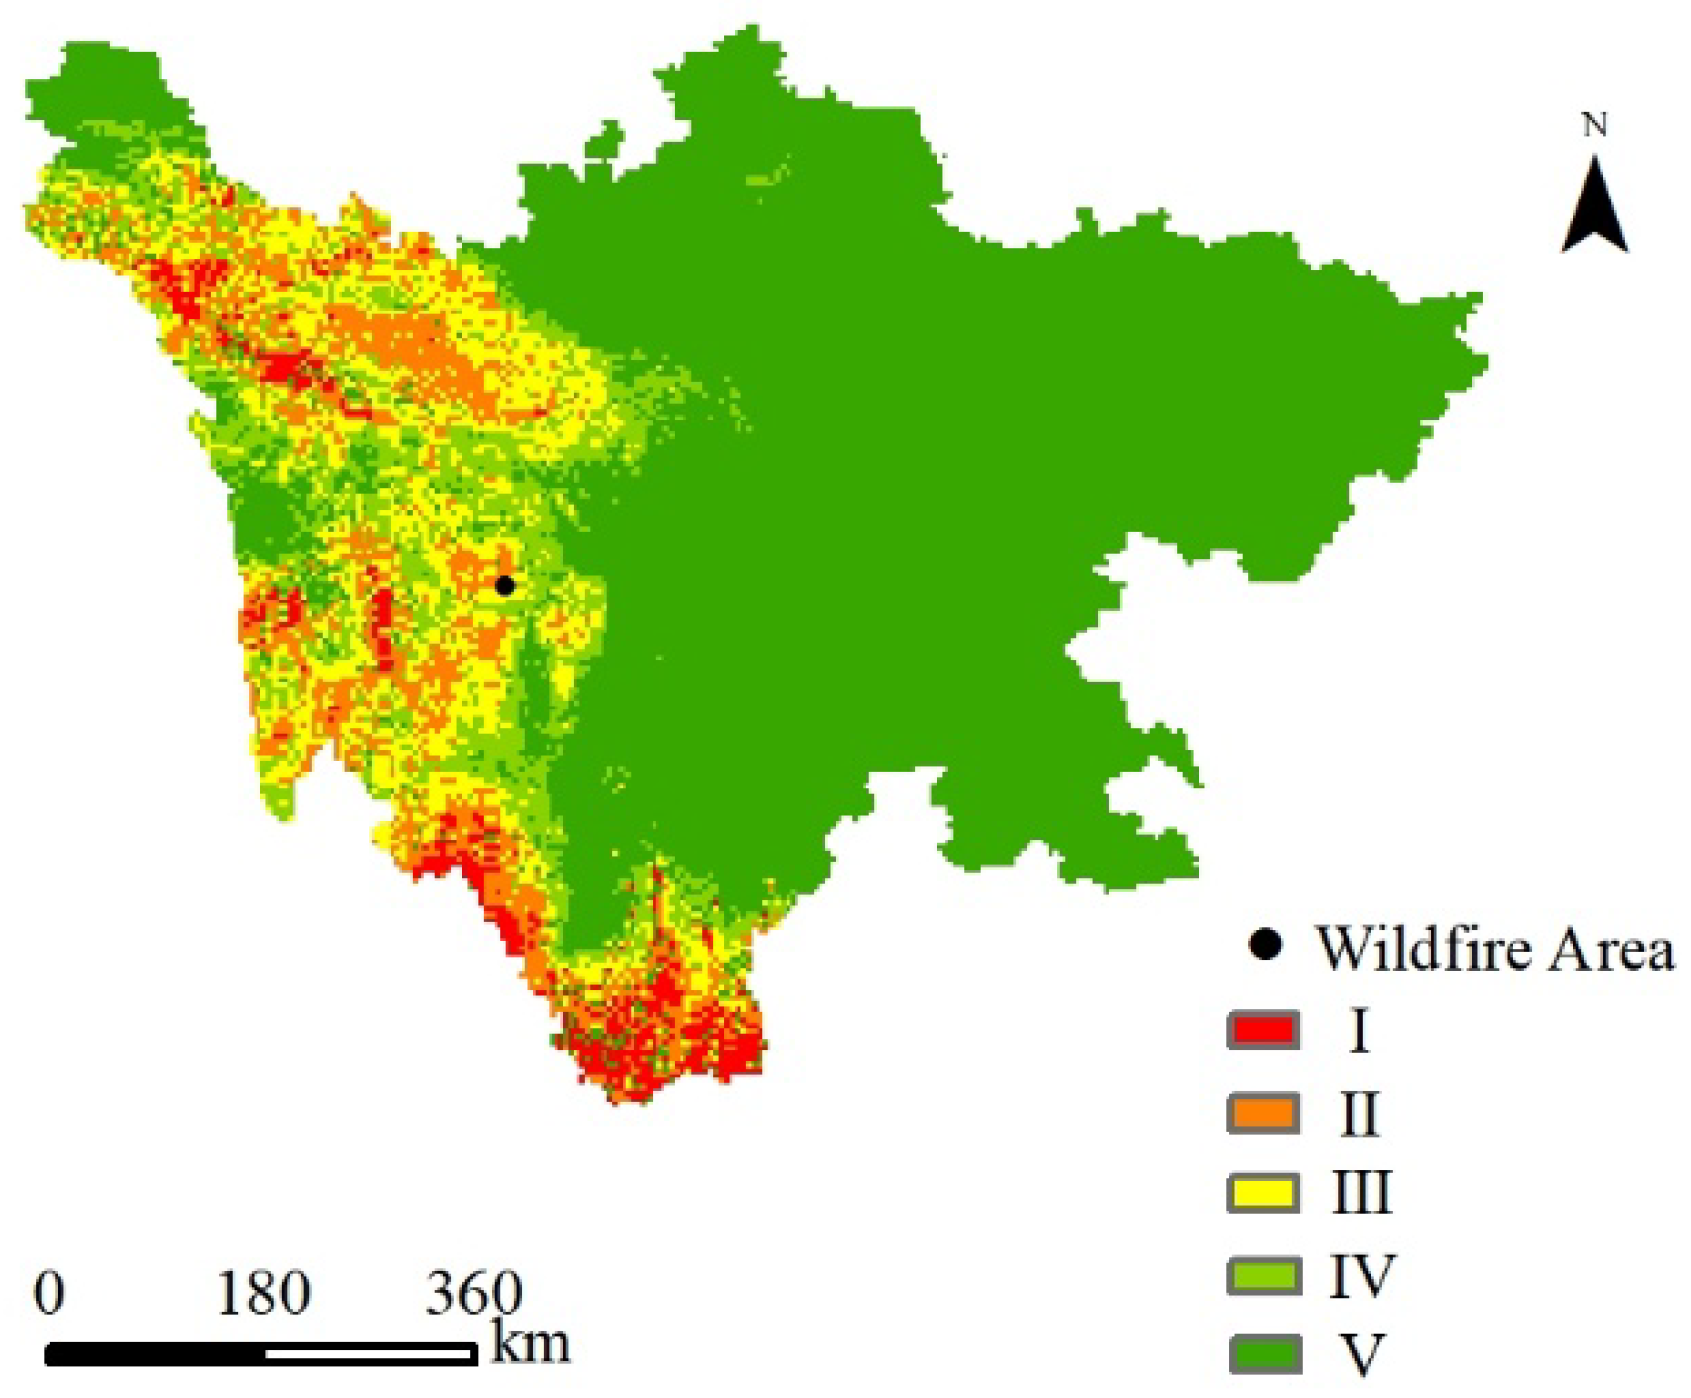
Based on the optimal model, fire occurrence predictions were made for each grid on 9 December 2024, and a daily distribution map of forest and grassland fire danger in Sichuan Province was plotted (Figure 4). In this study, forest and grassland fire danger in Sichuan Province is divided into five levels: Class I—Extremely High; Class II—High; Class III—Moderate; Class IV—Low; Class V—Extremely Low. The results indicate significant spatial heterogeneity in fire occurrence risk across the study area. The fire risk levels output by the model show a spatial gradient increasing from the central and eastern regions toward the west and south. Class IV–V low-risk areas are mainly distributed in the central and eastern parts of Sichuan Province, covering a wide range with strong overall connectivity. Class III moderate-risk areas are mostly located in transition zones between low and high risk, showing patch-like and belt-like distributions. Class I–II high and extremely high-risk areas are primarily concentrated in local parts of western and southern Sichuan, with clear spatial clustering characteristics.
When comparing the model prediction results with the actual distribution of fire points on that day, it was found that there were three fire points on 9 December 2024. Two fire points were in the same grid and located in a moderate-risk area with a probability > 0.5; the other was located at a real fire site, specifically within the administrative area of Chengxiang Village, Hekou Town, Yajiang County, Garzê Prefecture, where the corresponding grid was a high-risk area. Overall, the optimal model accurately characterized the spatial distribution pattern of forest and grassland fire risk in Sichuan Province under independent sample conditions. The predicted high-risk areas were spatially consistent with the actual distribution of fire points, intuitively verifying the model’s effectiveness in spatiotemporal extrapolation as discussed earlier, and providing a scientific basis for fire risk warning and regional prevention and control.

4.4. Transmission Line Scenario Application

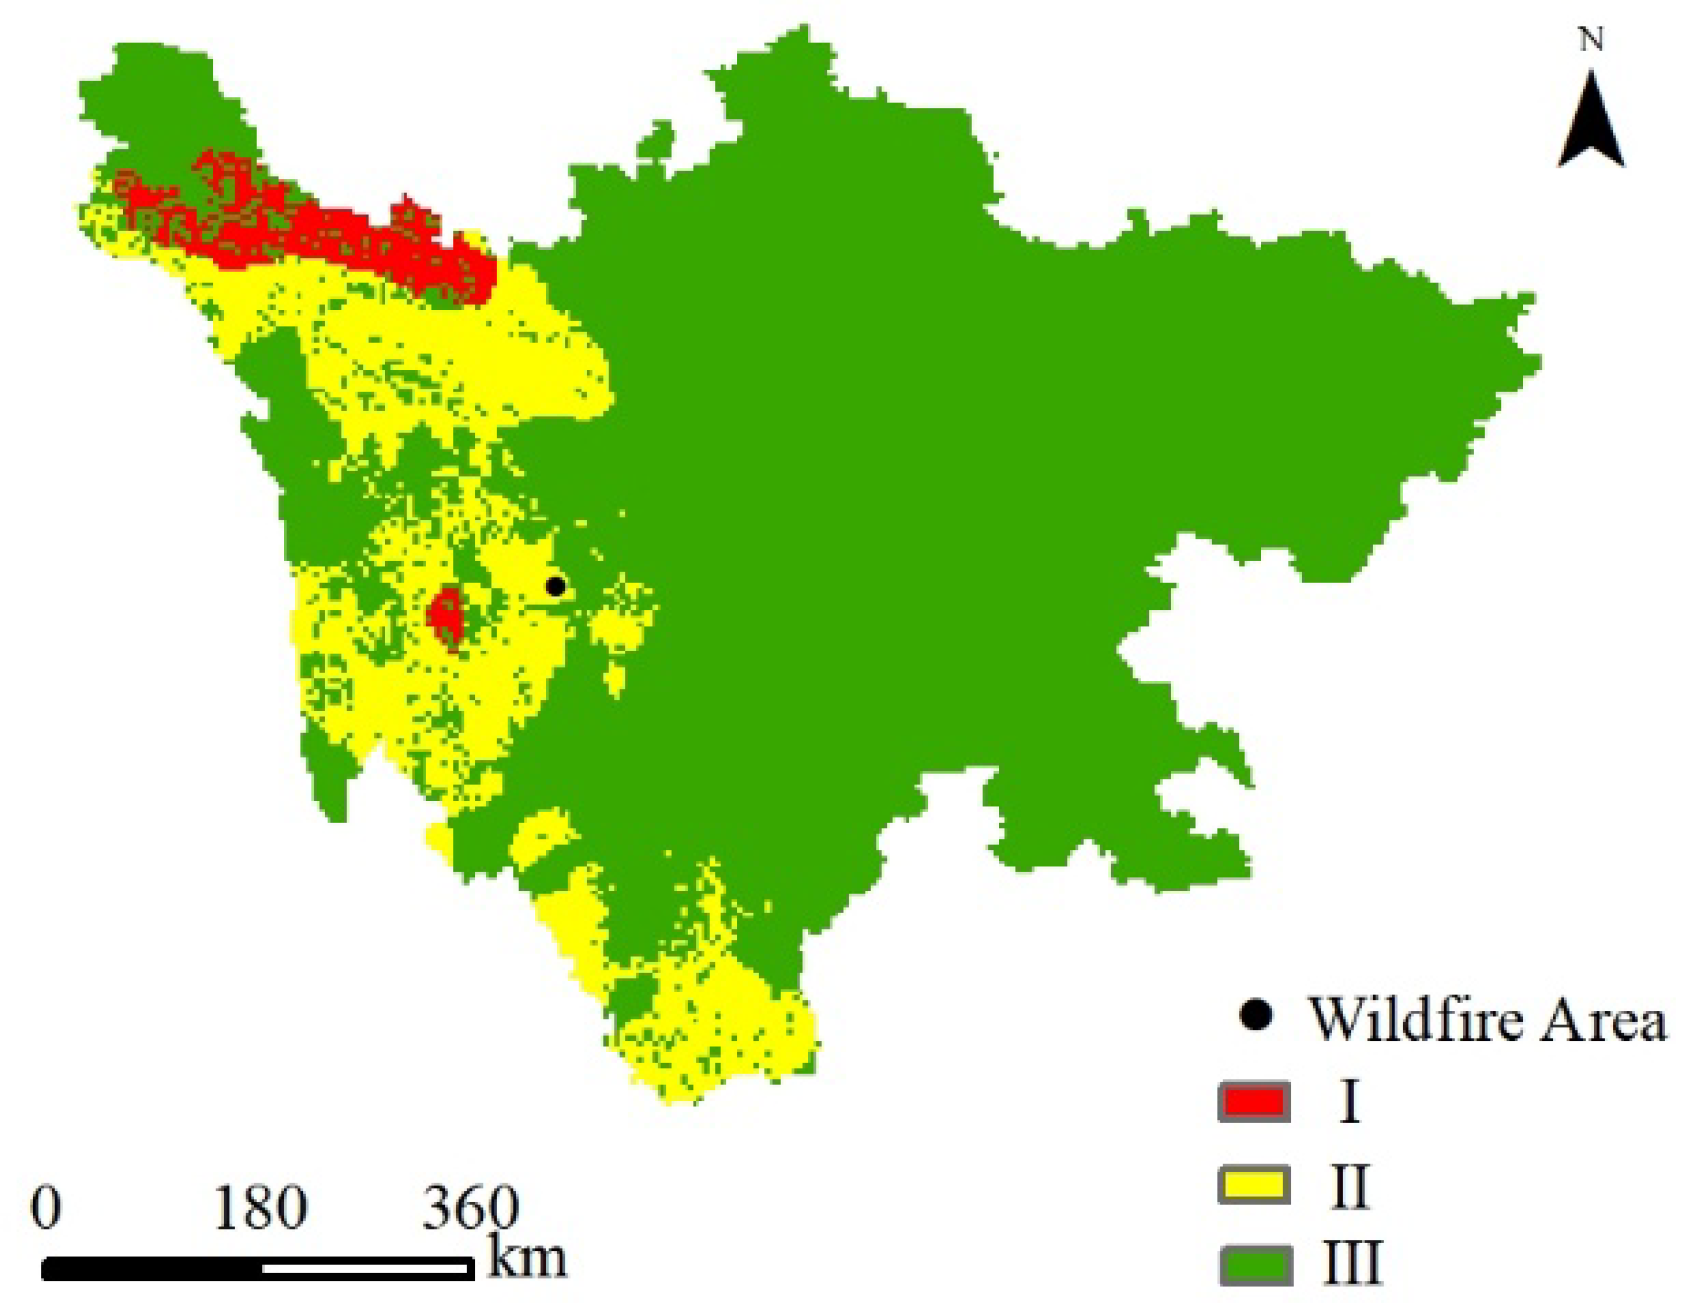
The fire risk spatial distribution grid data output from the model verification phase continued to be used as fire danger values, with the fire risk threshold set to Class III, as the combustion probability for grids below this level is too low. A transmission line forest and grassland fire risk distribution map was drawn based on the daily maximum wind speed grid and the daily fire risk spatial distribution grid (Figure 5). In this study, areas reaching both the fire risk threshold and the 8.0 m/s wind speed threshold were designated as Class I (High Risk); areas reaching the fire risk threshold and reaching 3.4 m/s but not 8.0 m/s wind speed were designated as Class II (Moderate Risk); all others were designated as Class III (Low Risk). The results show that Class II moderate-risk areas exhibit clear patch-like and belt-like clustering in space, with a relatively concentrated distribution mainly in the western-southwestern part of the study area, forming continuous clusters in local regions. Class I high-risk areas cover a relatively small area, concentrated primarily on the northwestern edges of the study area in local clusters. In contrast, low-risk areas account for the largest proportion, covering the central and eastern regions as a continuous background pattern. Comparing the risk distribution results with actual fire points monitored by remote sensing on that day showed that the fire points fell within the Class II moderate-risk zone. This result indicates that the risk zones classified based on the combination of comprehensive fire danger and wind speed conditions show a degree of spatial consistency with actual fire occurrence locations.

5. Discussion

5.1. Comparison of Model Performance and the Superiority of LightGBM

Under unified evaluation conditions, different models exhibited clear differences in performance focus. Tree-based ensemble models (RF, LightGBM, XGBoost) generally showed stable performance, while DNN was more prominent in the Recall dimension. This result structure aligns with the driving mechanisms of the research problem: the probability of forest and grassland fire occurrence is jointly influenced by multi-source factors, where significant non-linear relationships, interaction effects, and threshold responses may exist between variables. Tree models possess structural advantages in characterizing non-linearity and feature interactions while remaining robust to noise and outliers, making them often superior in fire probability modeling tasks driven by multi-source environmental variables. This is consistent with the model comparison conclusions reached by Choi et al. [33] when using tree models and DNN for forest fire prediction across South Korea. Under the same process, the AUC gap between the three types of tree models was generally small (LightGBM and XGBoost were close, while RF was slightly lower), suggesting that when data preprocessing and evaluation frameworks are rigorous and the models possess sufficient expressive capacity, the marginal gains from different ensemble strategies may be limited. At this stage, the more critical factor is whether the model can stably extract and express effective predictive signals from the data.
At the same time, LightGBM performed better in terms of threshold-independent ROC-AUC, Accuracy, and cross-fold stability. Therefore, under the dual criteria of “discriminative power–stability,” it is more suitable as the final model. From an engineering application perspective, its advantage is also reflected in temporal extrapolation consistency: after fixing LightGBM as the comprehensive optimal model from the nested cross-validation, it achieved a higher ROC-AUC on the independent 2021–2024 samples, and the external AUC fell within the consistency interval of the cross-validation AUC. This indicates that the model has good real-world extrapolation capability and cross-year transferability. For the objectives of this study—macro-scale risk mapping and scenario-based applications—this reliability and generalization capability are particularly crucial. In summary, under the constraints of a unified data pipeline, a fair evaluation framework, and independent temporal extrapolation testing, LightGBM performed best in discriminative power, stability, and transferability, and was thus confirmed as the final model for subsequent spatial reasoning and risk mapping.

5.2. Key Driving Factors of Fire Risk and Model Interpretability

SHAP explanation results confirmed that LandType is the primary restrictive factor for model prediction, reflecting the physical logic that fuel carrying capacity is a prerequisite for fire occurrence. The model logic clearly shows that only after the fundamental prerequisite of a combustible underlying surface is met can dynamic factors such as meteorology and drought further take effect and drive the differentiation of risk gradients. This decision hierarchy effectively prevents the model from generating false high-risk predictions in non-vegetated areas, significantly enhancing the scientific validity and practicality of macro-scale fire danger mapping.
Within combustible land types, meteorological-drought factors present clear risk-dominating signals, where drought and high temperatures lead to enhanced fire danger. Wang et al. [34] and others, when analyzing the spatiotemporal distribution characteristics of forest fires in Sichuan and their relationship with the climatic background, found that high-incidence seasons and regions of forest fires in Sichuan are characterized by high temperatures, low precipitation, and dryness, which validates the accuracy of this study. It also indicates that although Sichuan Province covers a large area, the environmental factor characteristics during concentrated periods and in specific locations play a representative role due to the spatiotemporal concentration of forest and grassland fire occurrences. In the beeswarm distribution plot, it can be observed that the SHAP value for WindDirection is positive at the second-highest importance level, promoting fire occurrence. It is roughly inferred that this wind direction is a southwesterly wind, suggesting that high-incidence seasons and regions of Sichuan forest fires may be influenced by southwesterly winds. The high-incidence seasons and regions for forest fires in Sichuan are winter and spring in Garzê Prefecture, Liangshan Prefecture, and Panzhihua City [35,36]. This region is prone to foehn winds [37]. Combined with the Hengduan Mountains in the west of this region, it can be inferred that southwesterly winds form foehn winds after crossing the Hengduan Mountains, leading to drought and high-temperature characteristics in these regions and seasons. Large-scale, long-term wind directions are determined by air pressure and the circulation under its control, which is an important reason why Surface Pressure and Wind Direction rank relatively high in importance. This inference provides an interpretable basis for the subsequent design of “wind direction scenarios” or the introduction of circulation background classification for operational early warning.
Regarding human activity-related factors, the importance of Distance To Settlement and Distance To Road is at a moderate level, but the contribution directions are relatively consistent. Proximity to settlements and roads tends to generate positive SHAP values, indicating that within areas where fuel conditions are met, anthropogenic ignition source exposure and accessibility remain non-negligible trigger links. This further emphasizes the synergistic effect of natural flammability and human triggers in the formation of fire risk.

5.3. Model Application Validation and Transmission Line Scenario Application

The validation design of this study includes two types of complementary evidence: first, external temporal testing from 2021 to 2024 to test cross-year transferability at the statistical metric level; second, independent daily spatial validation based on a 5 km × 5 km grid. Overall, the spatial placement of fire points within moderate-to-high risk level areas is relatively consistent with the model prediction results, thereby supporting the spatial validity of the optimal model under independent sample conditions.
Given the scarcity of transmission line fire databases and the difficulty of directly training a “dedicated model,” this paper adopts a path of “comprehensive fire risk value + wind speed threshold” to construct the transmission line forest and grassland fire risk distribution map. In implementation, based on the grid fire danger values output by the model, a fire danger value threshold is first set; then, wind speed classification conditions are introduced, using the daily maximum wind speed to characterize the possibility of instantaneous strong winds triggering transmission line short-circuit risks. Comparing with the remote sensing fire points of the day, it was found that the fire points fell within the Class II moderate-risk zone. Although the model did not classify them as extremely high risk, it successfully distinguished them from the large-scale low-risk background. This suggests that the “comprehensive fire danger + wind speed threshold” method has the potential to screen for transmission line fire hazard areas at a macro scale, providing a reference for narrowing the scope of key inspections.

5.4. Limitations and Future Directions

The sample design, to some extent, strengthened the model’s ability to identify fuel accessibility, which is of practical significance in macro-scale risk mapping and operational early warning scenarios. However, it might also reduce the relative weight of finer-grained driving differences in scenarios “limited to the interior of forest and grassland and where fuel conditions are known.” Future research could further construct a control sample set containing only forest and grassland on this basis, or introduce a multi-task learning framework to jointly model “combustibility discrimination” and “internal forest and grassland risk assessment” as two interrelated but different target subtasks, systematically evaluating the impact of sample construction strategies on model generalization characteristics.
In addition to the sample construction issue discussed above, the representation of wind direction as an input feature also introduces a potential limitation for model comparison. In this study, wind direction was retained in its original angular form to preserve direct physical interpretability and to facilitate SHAP-based explanation of wind-direction sectors. However, wind direction is an intrinsically periodic variable, and using raw degree values introduces an artificial discontinuity at the 0°/360° bound-ary. For example, 359° and 1° are physically adjacent but numerically distant in the original representation. This issue may have affected different model structures une-qually. Tree-based models, such as RF, LightGBM, and XGBoost, can partially accom-modate such discontinuities through multiple threshold splits, whereas the DNN relies more strongly on continuous numerical representations and gradient-based optimiza-tion. Therefore, the original angular encoding may have mathematically disadvantaged the DNN to some extent, and the performance gap observed in Table 3 may be partially attributable to this preprocessing choice rather than solely to intrinsic differences in model capability.
Finally, regarding the application in transmission line scenarios, this study adopted a secondary screening strategy of “comprehensive fire risk + wind speed threshold,” which received consistent preliminary confirmation in the case of 9 December 2024. It must be pointed out that, limited by the scarcity of historical samples of forest and grassland fires triggered by transmission lines and the incompleteness of event records, it is currently difficult to construct an independent sample set that meets statistical testing requirements for large-scale retrospective validation. Therefore, this study positions this part of the work as an exploratory technical framework demonstration. Furthermore, facility-side variables such as vegetation clearing status in line corridors, the condition of conductors and insulators, topographic exposure of towers, corridor fuel load, and management measures have not yet been included; thus, the characterization of the “transmission line fault–ignition” chain remains limited. In the future, the gradual introduction of variables related to power grid facilities and corridor operation and maintenance will drive more precise risk identification.

6. Conclusions

This study constructed a machine learning-based daily scale prediction framework for forest and grassland fires in Sichuan Province, leading to the following primary conclusions: (1) Through the comparison of four models—RF, LightGBM, XGBoost, and DNN—LightGBM was determined to be the comprehensive optimal model. It demonstrated superior predictive capability and cross-year generalization performance in both nested cross-validation (ROC-AUC = 0.9193) and independent temporal testing (ROC-AUC = 0.9411). (2) SHAP interpretability analysis revealed a hierarchical structure of the driving mechanisms for forest and grassland fires: land type constitutes the a priori physical constraint for fire occurrence, meteorological and drought indicators dominate the gradient differentiation of risk intensity, while topography and human activities act as modulating factors that further differentiate risk spatially. (3) In the independent sample inference test on 9 December 2024, the overall fire danger levels in Sichuan Province exhibited a gradient pattern increasing gradually from the central and eastern regions toward the west and south. The high-risk grids showed good consistency with the actual distribution of fire points, indicating that the model possesses significant potential for risk identification in practical applications. (4) For transmission line application scenarios, a joint screening strategy using comprehensive fire risk values and wind speed thresholds was employed to construct a transmission line forest and grassland fire risk distribution map. Case analysis showed that actual fire points fell within the moderate-risk zone, suggesting that in the absence of specialized historical samples, this method provides a feasible rule-based screening approach and serves as a useful reference for the preliminary assessment and hierarchical control of transmission line fire risks.

Author Contributions

J.W., M.W. and L.S. (Lifu Shu) conceptualized the study; J.W. drafted the manuscript; J.W. and J.J. analyzed the data; J.J. and F.Z. collected the data; L.S. (Liqing Si) and W.L. analytical method; J.H., K.Y. and J.N. participated in the revision of the manuscript. All authors have read and agreed to the published version of the manuscript.

Funding

This research was supported by Sichuan Science and Technology Program (Research on Precise Identification of Forest Fire Risks for Distribution Lines of 35 kV and Below Crossing Forest Areas) and the National Key Research and Development Program of China (2023YFD2202005, 2023YFD2202001).

Institutional Review Board Statement

Not applicable.

Informed Consent Statement

Not applicable.

Data Availability Statement

Data can be made available by contacting the first author and corresponding author.

Conflicts of Interest

The authors declare no conflicts of interest.

References

  1. Hardy, C.C. Wildland Fire Hazard and Risk: Problems, Definitions, and Context. For. Ecol. Manag. 2005, 211, 73–82. [Google Scholar] [CrossRef]
  2. Wang, Z.; Dong, H.; Zhao, Y.; He, S.; Yuan, Y.; Zhang, L. Prediction of Fire Risk in Yunnan, Guizhou and Sichuan Using Machine Learning Model. J. Northeast For. Univ. 2023, 51, 113–119. [Google Scholar] [CrossRef]
  3. Wang, J.; Li, J.; Feng, X.; Zhu, L.; Li, P.; Hao, L.; Song, Z.; Wang, M.; Shu, L.; Si, L.; et al. Research Progress on the Prediction of Forest Fire Occurrence Based on Artificial Intelligence. J. Terr. Ecosyst. Conserv. 2025, 5, 81–89. [Google Scholar] [CrossRef]
  4. Liu, H.; Shu, L.; Liu, X.; Cheng, P.; Wang, M.; Huang, Y. Advancements in Artificial Intelligence Applications for Forest Fire Prediction. Forests 2025, 16, 704. [Google Scholar] [CrossRef]
  5. Zhao, Y.; Si, L.; Du, J.; Tian, Y.; Zheng, C.; Zhao, F. Prediction Model for Lightning-Ignited Fire Occurrence Across Different Vegetation Types. Forests 2026, 17, 315. [Google Scholar] [CrossRef]
  6. Eagleston, H.; Bester, M.; Yusuf, J.; Damodaran, A.; Reno, M.J. Systemic Drivers of Electric-Grid-Caused Catastrophic Wildfires: Implications for Resilience in the United States. Challenges 2025, 16, 13. [Google Scholar] [CrossRef]
  7. Arab, A.; Khodaei, A.; Eskandarpour, R.; Thompson, M.P.; Wei, Y. Three Lines of Defense for Wildfire Risk Management in Electric Power Grids: A Review. IEEE Access 2021, 9, 61577–61593. [Google Scholar] [CrossRef]
  8. Zuniga Vazquez, D.A.; Qiu, F.; Fan, N.; Sharp, K. Wildfire Mitigation Plans in Power Systems: A Literature Review. IEEE Trans. Power Syst. 2022, 37, 3540–3551. [Google Scholar] [CrossRef]
  9. Li, N.; Wang, T.; Zhou, K.; Zou, C.; Pan, L.; Li, Y.; Cao, L.; Yan, G. Temporal and Spatial Characteristics of Forest Fires and Fire Source in Sichuan Province in the Past 20 Years. J. Wildland Fire Sci. 2025, 43, 15–20. [Google Scholar] [CrossRef]
  10. Wu, Y.; Shu, L.; Wang, M. A Review of Forest Fires Worldwide in Recent Years. J. Temp. For. Res. 2024, 7, 42–46. [Google Scholar] [CrossRef]
  11. Peng, W.; Wei, Y.; Chen, G.; Lu, G.; Ye, Q.; Ding, R.; Hu, P.; Cheng, Z. Analysis of Wildfire Danger Level Using Logistic Regression Model in Sichuan Province, China. Forests 2023, 14, 2352. [Google Scholar] [CrossRef]
  12. Zhang, Y. Forest Fire Risk Prediction in Sichuan Province Based on Ecological Niche Modelling. Master’s Thesis, Nanjing Forestry University, Nanjing, China, 2024. [Google Scholar] [CrossRef]
  13. Wang, H.; Chen, H.; Sheng, H.; Chen, K.; Dong, C.; Min, Z. Fuel Load Models for Different Tree Vegetation Types in Sichuan Province Based on Machine Learning. Forests 2024, 16, 42. [Google Scholar] [CrossRef]
  14. Peng, Y.; Su, H.; Sun, M.; Li, M. Reconstructing Historical Forest Fire Risk in the Non-Satellite Era Using the Improved Forest Fire Danger Index and Long Short-Term Memory Deep Learning: A Case Study in Sichuan Province, Southwestern China. For. Ecosyst. 2024, 11, 100170. [Google Scholar] [CrossRef]
  15. Li, N.; Wang, T.; Zhou, K.; Yan, G.; Zou, C.; Pan, L.; Gui, L.; Liu, Y. Spatiotemporal Characteristics of Forest Types in Sichuan Forest Fires during 2003–2022. Cent. South For. Inventory Plan. 2025, 44, 36–43. [Google Scholar] [CrossRef]
  16. He, R.; Lu, H.; Jin, Z.; Qin, Y.; Yang, H.; Liu, Z.; Yang, G.; Xu, J.; Gong, X.; Zhao, Q. Construction of Forest Fire Prediction Model and Driving Factors Analysis Based on Random Forest Algorithm in Southwest China. Acta Ecol. Sin. 2023, 43, 9356–9370. [Google Scholar] [CrossRef]
  17. Mhawej, M.; Faour, G.; Adjizian-Gerard, J. Wildfire Likelihood’s Elements: A Literature Review. Challenges 2015, 6, 282–293. [Google Scholar] [CrossRef]
  18. Bajocco, S.; Ricotta, C. Evidence of Selective Burning in Sardinia (Italy): Which Land-Cover Classes Do Wildfires Prefer? Landsc. Ecol. 2008, 23, 241–248. [Google Scholar] [CrossRef]
  19. Toy-Opazo, O.; Fuentes-Ramírez, A.; Blackhall, M.; Fernández, V.; Ganteaume, A.; Altamirano, A.; González-Flores, Á. Conceptual Clarity in Fire Science: A Systematic Review Linking Climatic Factors to Wildfire Occurrence and Spread. Fire 2025, 9, 23. [Google Scholar] [CrossRef]
  20. Holsinger, L.; Parks, S.A.; Miller, C. Weather, Fuels, and Topography Impede Wildland Fire Spread in Western US Landscapes. For. Ecol. Manag. 2016, 380, 59–69. [Google Scholar] [CrossRef]
  21. Viedma, O.; Urbieta, I.R.; Moreno, J.M. Wildfires and the Role of Their Drivers Are Changing over Time in a Large Rural Area of West-Central Spain. Sci. Rep. 2018, 8, 17797. [Google Scholar] [CrossRef]
  22. Breiman, L. Random Forests. Mach. Learn. 2001, 45, 5–32. [Google Scholar] [CrossRef]
  23. Ke, G.; Meng, Q.; Finley, T.; Wang, T.; Chen, W.; Ma, W.; Ye, Q.; Liu, T.Y. LightGBM: A Highly Efficient Gradient Boosting Decision Tree. Adv. Neural Inf. Process. Syst. 2017, 30, 3146–3154. [Google Scholar]
  24. Chen, T.; Guestrin, C. XGBoost: A Scalable Tree Boosting System. In Proceedings of the 22nd ACM SIGKDD International Conference on Knowledge Discovery and Data Mining; ACM: New York, NY, USA, 2016; pp. 785–794. [Google Scholar] [CrossRef]
  25. LeCun, Y.; Bengio, Y.; Hinton, G. Deep Learning. Nature 2015, 521, 436–444. [Google Scholar] [CrossRef]
  26. Na, R.; Gantumur, B.; Du, W.; Bayarsaikhan, S.; Shan, Y.; Mu, Q.; Bao, Y.; Tegshjargal, N.; Vandansambuu, B. Daily-Scale Fire Risk Assessment for Eastern Mongolian Grasslands by Integrating Multi-Source Remote Sensing and Machine Learning. Fire 2025, 8, 273. [Google Scholar] [CrossRef]
  27. Sokolova, M.; Lapalme, G. A Systematic Analysis of Performance Measures for Classification Tasks. Inf. Process. Manag. 2009, 45, 427–437. [Google Scholar] [CrossRef]
  28. Fawcett, T. An Introduction to ROC Analysis. Pattern Recognit. Lett. 2006, 27, 861–874. [Google Scholar] [CrossRef]
  29. Varma, S.; Simon, R. Bias in Error Estimation When Using Cross-Validation for Model Selection. BMC Bioinform. 2006, 7, 91. [Google Scholar] [CrossRef] [PubMed]
  30. Akiba, T.; Sano, S.; Yanase, T.; Ohta, T.; Koyama, M. Optuna: A Next-Generation Hyperparameter Optimization Framework. In Proceedings of the 25th ACM SIGKDD International Conference on Knowledge Discovery & Data Mining; ACM: New York, NY, USA, 2019; pp. 2623–2631. [Google Scholar] [CrossRef]
  31. Lundberg, S.M.; Lee, S.-I. A Unified Approach to Interpreting Model Predictions. In Advances in Neural Information Processing Systems 30; Curran Associates, Inc.: Red Hook, NY, USA, 2017; pp. 4765–4774. [Google Scholar]
  32. GB/T 28591-2012; Wind Scale. Standards Press of China: Beijing, China, 2012.
  33. Choi, J.; Yun, Y.; Chae, H. Forest Fire Risk Prediction in South Korea Using Google Earth Engine: Comparison of Machine Learning Models. Land 2025, 14, 1155. [Google Scholar] [CrossRef]
  34. Wang, X.; Wang, R. Temporal and Spatial Characteristics of Forest Fire in Sichuan and Its Climate Background. Chin. Agric. Sci. Bull. 2014, 30, 155–160. [Google Scholar] [CrossRef]
  35. Liu, Q.; Qin, X.; Li, X.; Hou, Y. A Study of Spatiotemporal Characteristics of Forest Fires in Sichuan Province Based on Point Pattern’s Method. J. Sichuan For. Sci. Technol. 2019, 40, 6–12+18. [Google Scholar] [CrossRef]
  36. Zhou, Y.; Li, M. Temporal and Spatial Dynamic Analysis of Forest Fire in Sichuan Province Based on GIS. Highlights Sci. Pap. Online 2022, 15, 379–388. [Google Scholar]
  37. Bai, Y.; Wang, B.; Wu, Y.; Liu, B. Fire Environment of Forest Fire Formation in Liangshan Prefecture. For. Resour. Manag. 2020, 5, 116–122+130. [Google Scholar] [CrossRef]
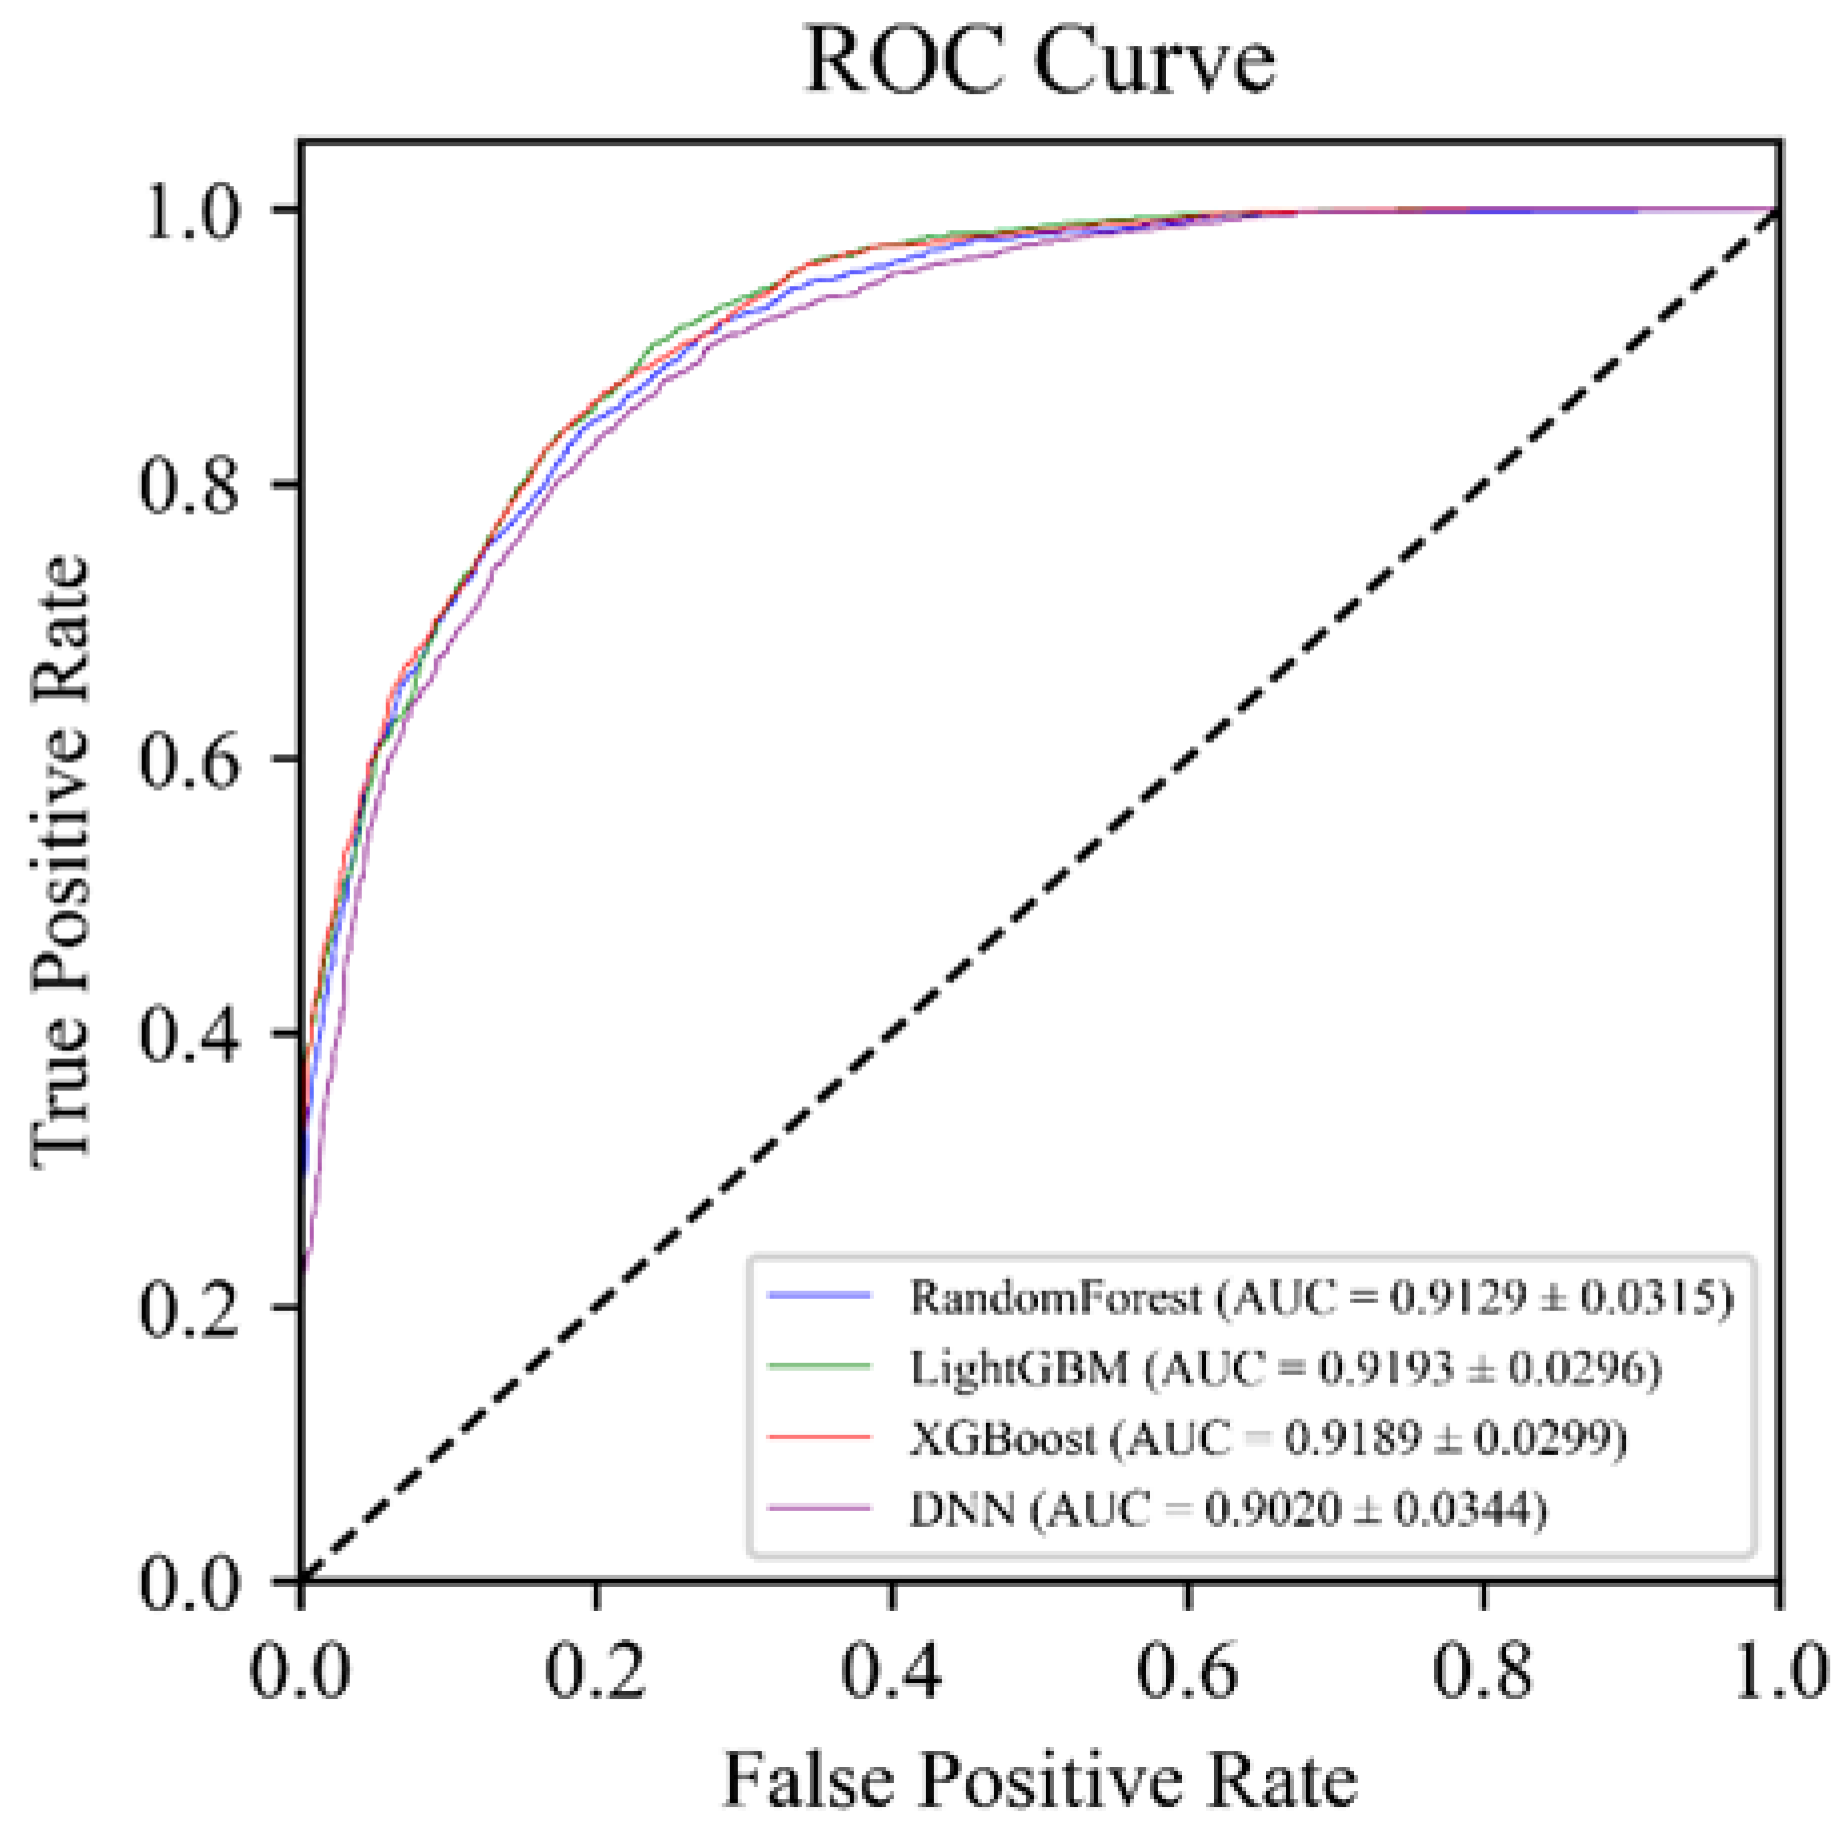
Figure 1. ROC curves and AUC values of the four machine learning models. The curves represent the average performance of each model obtained from the outer loop of the nested cross-validation, and the standard deviations reflect the model stability across different years.
Fire 09 00222 g001
Figure 2. SHAP feature importance plot. The plot ranks features according to their overall importance in the model. Abbreviations are defined in Table 1.
Fire 09 00222 g002
Figure 3. SHAP summary beeswarm plot. The figure shows the distribution of SHAP values for each feature across different samples. Each point represents one sample, the horizontal axis indicates the marginal contribution of that feature to the model output. For continuous variables, the color represents the relative magnitude of the feature value. For the nominal categorical variable LandType, the colors correspond only to visualization codes assigned to different land-type categories and should not be interpreted as an ordinal or continuous high–low gradient. Abbreviations are defined in Table 1.
Fire 09 00222 g003
Figure 4. Forest and Grassland Fire Danger Distribution in Sichuan Province on 9 December 2024.
Fire 09 00222 g004
Figure 5. Forest and Grassland Fire Risk Distribution along Transmission Lines in Sichuan Province on 9 December 2024.
Fire 09 00222 g005
Table 1. Drivers of fire occurrence.
CategoryVariableFrequencyAbbreviationUnit
MeteorologyMean wind speeddailyWSm/s
Wind directiondailyWD°
Mean precipitationdailyPrecmm
Mean temperaturedailyT°C
Mean relative humiditydailyRH%
Mean surface pressuredailySPPa
Mean net surface solar radiationdailyNSRJ/m2
Fire danger indexFine Fuel Moisture CodedailyFFMC
Duff Moisture CodedailyDMC
Drought CodedailyDC
Initial Spread IndexdailyISI
Buildup IndexdailyBUI
Fire Weather IndexdailyFWI
Keetch–Byram Drought IndexdailyKBDI
Anthropogenic activitiesDistance To SettlementDTSm
Distance To RoadDTRm
VegetationLand TypeLT
TopographyAspectAsp°
SlopeSlp°
ElevationElevm
Table 2. Optimal hyperparameter.
ModelHyperparameter NameOptimal Value
RandomForestn_estimators426
max_depth15
min_samples_split9
min_samples_leaf2
LightGBMn_estimators283
learning_rate0.04920302295080238
max_depth15
num_leaves19
subsample0.9861227913662487
XGBoostn_estimators471
learning_rate0.011356574148153331
max_depth12
subsample0.6801198397508553
colsample_bytree0.6520254801199639
DNNhidden_layer_sizes[64, 128]
dropout_rate0.10239887318232696
learning_rate0.004318558954489876
batch_size32
Table 3. Evaluation metrics for models.
ModelAccuracyPrecisionRecallF1ROC AUC
LightGBM82.45%84.07%79.98%0.81770.9193 ± 0.0296
XGBoost81.81%85.40%76.55%0.80600.9189 ± 0.0299
RandomForest81.10%85.53%74.71%0.79630.9129 ± 0.0315
DNN82.12%78.17%89.29%0.83320.9020 ± 0.0344
Bold values indicate the optimal values.
Disclaimer/Publisher’s Note: The statements, opinions and data contained in all publications are solely those of the individual author(s) and contributor(s) and not of MDPI and/or the editor(s). MDPI and/or the editor(s) disclaim responsibility for any injury to people or property resulting from any ideas, methods, instructions or products referred to in the content.