1. Introduction
Fires are recognized as causing severe harm to city, the economy, the environment, and personal safety [
1,
2,
3]. According to statistics from the International Association of Fire and Rescue Services, an average of 248,000 fires were reported annually between 2018 and 2022 across 57 cities [
4]. Timely, accurate, and comprehensive fire services are considered a powerful means of reducing fire-related losses [
5,
6]. Due to the high costs associated with the construction and operation of fire stations, it has been difficult for China to significantly increase the number of fire stations and firefighters on a large scale [
7,
8]. Against the backdrop of limited and scarce resources, a precise understanding of fire service accessibility in a region and the rational planning of response zones for fire stations within the region are regarded as crucial for improving fire rescue efficiency and equity [
9]. These efforts are seen as providing an important basis for the scientific and efficient allocation and dispatch of firefighting resources.
The calculation methods and optimization of fire service coverage have been researched in many studies to efficiently allocate and dispatch firefighting resources. Many studies have utilized the P-Median Location Problem [
10,
11], Location Set Covering Problem [
12,
13], Maximal Covering Location Problem [
14,
15,
16], and multi-objective models [
17,
18,
19] for fire station site selection and optimization. Parallel to location optimization models, the two-step floating catchment area (2SFCA) method and its variants have been widely applied to measure spatial accessibility of public services, including fire stations [
20]. Mao proposed a fixed-coverage-based 2SFCA (FC2SFCA) method for Nanjing, China, which uses historical fire incident locations and dispatched fire engines as demand, rather than population centroids [
21]. Their work highlights the importance of using actual incident data to reflect real-world fire service demand and accessibility patterns. However, traditional models are mostly based on static approaches and largely neglect dynamic traffic conditions. Geographic Information System (GIS) technology, which takes into account geographic environments and transportation networks [
22,
23], is capable of providing more accurate spatial analysis and visualization, thereby assisting decision-makers in identifying optimal locations [
24,
25,
26]. Nevertheless, in previous GIS-based studies on fire station location, real-time traffic conditions have rarely been considered, and the road network data in GIS are often outdated. As a result, traditional GIS methods are limited in accurately capturing changes in fire service coverage. With the continuous development of big data [
27,
28], online map positioning and navigation functions [
29,
30,
31], real-time traffic data obtained through online map Application Programming Interfaces (API) and the calculation of travel distances between any two locations have provided opportunities for improving traditional site selection and optimization methods ([
32]), significantly enhancing the precision of fire service coverage estimation [
33,
34,
35]. Although the use of online maps to understand fire service coverage is already comprehensive [
36,
37], it can be observed that most current studies focus on either relocating fire stations or merely evaluating their performance. However, the relocation of fire stations is often hindered by practical constraints including land and infrastructure limitations. As a result, existing methods that rely on the relocation of fire stations may be less applicable. There is an urgent need for response strategies that can enhance firefighting effectiveness without altering the locations of the existing fire stations.
In the United States, fire stations are typically assigned a “First-Due Response Zone,” [
38] which is determined based on the geographic area within which the station can arrive at the scene in the shortest possible time. At the planning stage of the city, a fire station’s firefighting response zone is generally determined by theoretically drawing circles around the station. In the delineation of firefighting response zones, it is typically defined based on administrative divisions and street boundaries. In China, each fire station is assigned a clearly defined response zone. These zones are established by local governments in accordance with fire safety technical standards and practical needs. The Code for Urban Fire Protection Planning explicitly states that the jurisdictional layout of fire stations must be based on their administrative coverage [
39]. This ensures that each fire station can effectively cover its designated response zone. Unlike the “First-Due Response Zone” in the United States, which focuses on optimizing geographic location and response time, China’s fire response approach emphasizes administrative jurisdiction and area coverage. As a result, the vast majority of fire incidents are handled by a single fire station within its designated response zone [
40]. According to China’s national standard “Code for Urban Fire Protection Planning” [
39], the service area of a single fire station is typically delineated by drawing a circular region centered on the fire station. This method simplistically assumes that fire rescue routes are “straight lines” and does not consider the impact of real-time traffic conditions on route selection and travel time. However, due to the influence of road network morphology and terrain, service areas cannot be directly divided based on circular regions. In practice, fire rescue dispatching in China primarily follows the principles of “proximity dispatching, hierarchical dispatching, and plan priority” as stipulated in the “119 Emergency Dispatching Work Regulations” [
41]. Fire departments tend to prefer block-based divisions within their administrative jurisdiction, using road boundaries to define fire service response zones. This method of delineation has not adequately accounted for accessibility, as it is based solely on distance. Given the dynamic nature of urban traffic conditions, such an approach is widely regarded as unreasonable.
This has led to the delineation of fire station response zones becoming a critical focus for improving the level of regional fire services [
42]. Currently, many scholars use traditional algorithms such as grids [
43,
44], isochrones [
45,
46,
47], boundary search algorithms [
34], Dijkstra [
48], and GIS-based Network Analyst [
24,
49] to determine fire service coverage. Boundary search algorithms have been used to define the boundaries of fire station service areas and develop corresponding systems [
50]. In GIS, the network analyst algorithm has been applied to calculate fire service coverage [
25], and the analytic hierarchy process has been used for appropriate fire station selection [
49,
51]. However, these methods and algorithms are rarely adopted by fire departments and urban planning authorities because they often fail to fully consider practical factors such as road network morphology and terrain. This has resulted in insufficiently scientific delineation of fire service response zones, limiting the efficiency and equity of firefighting resource utilization in China.
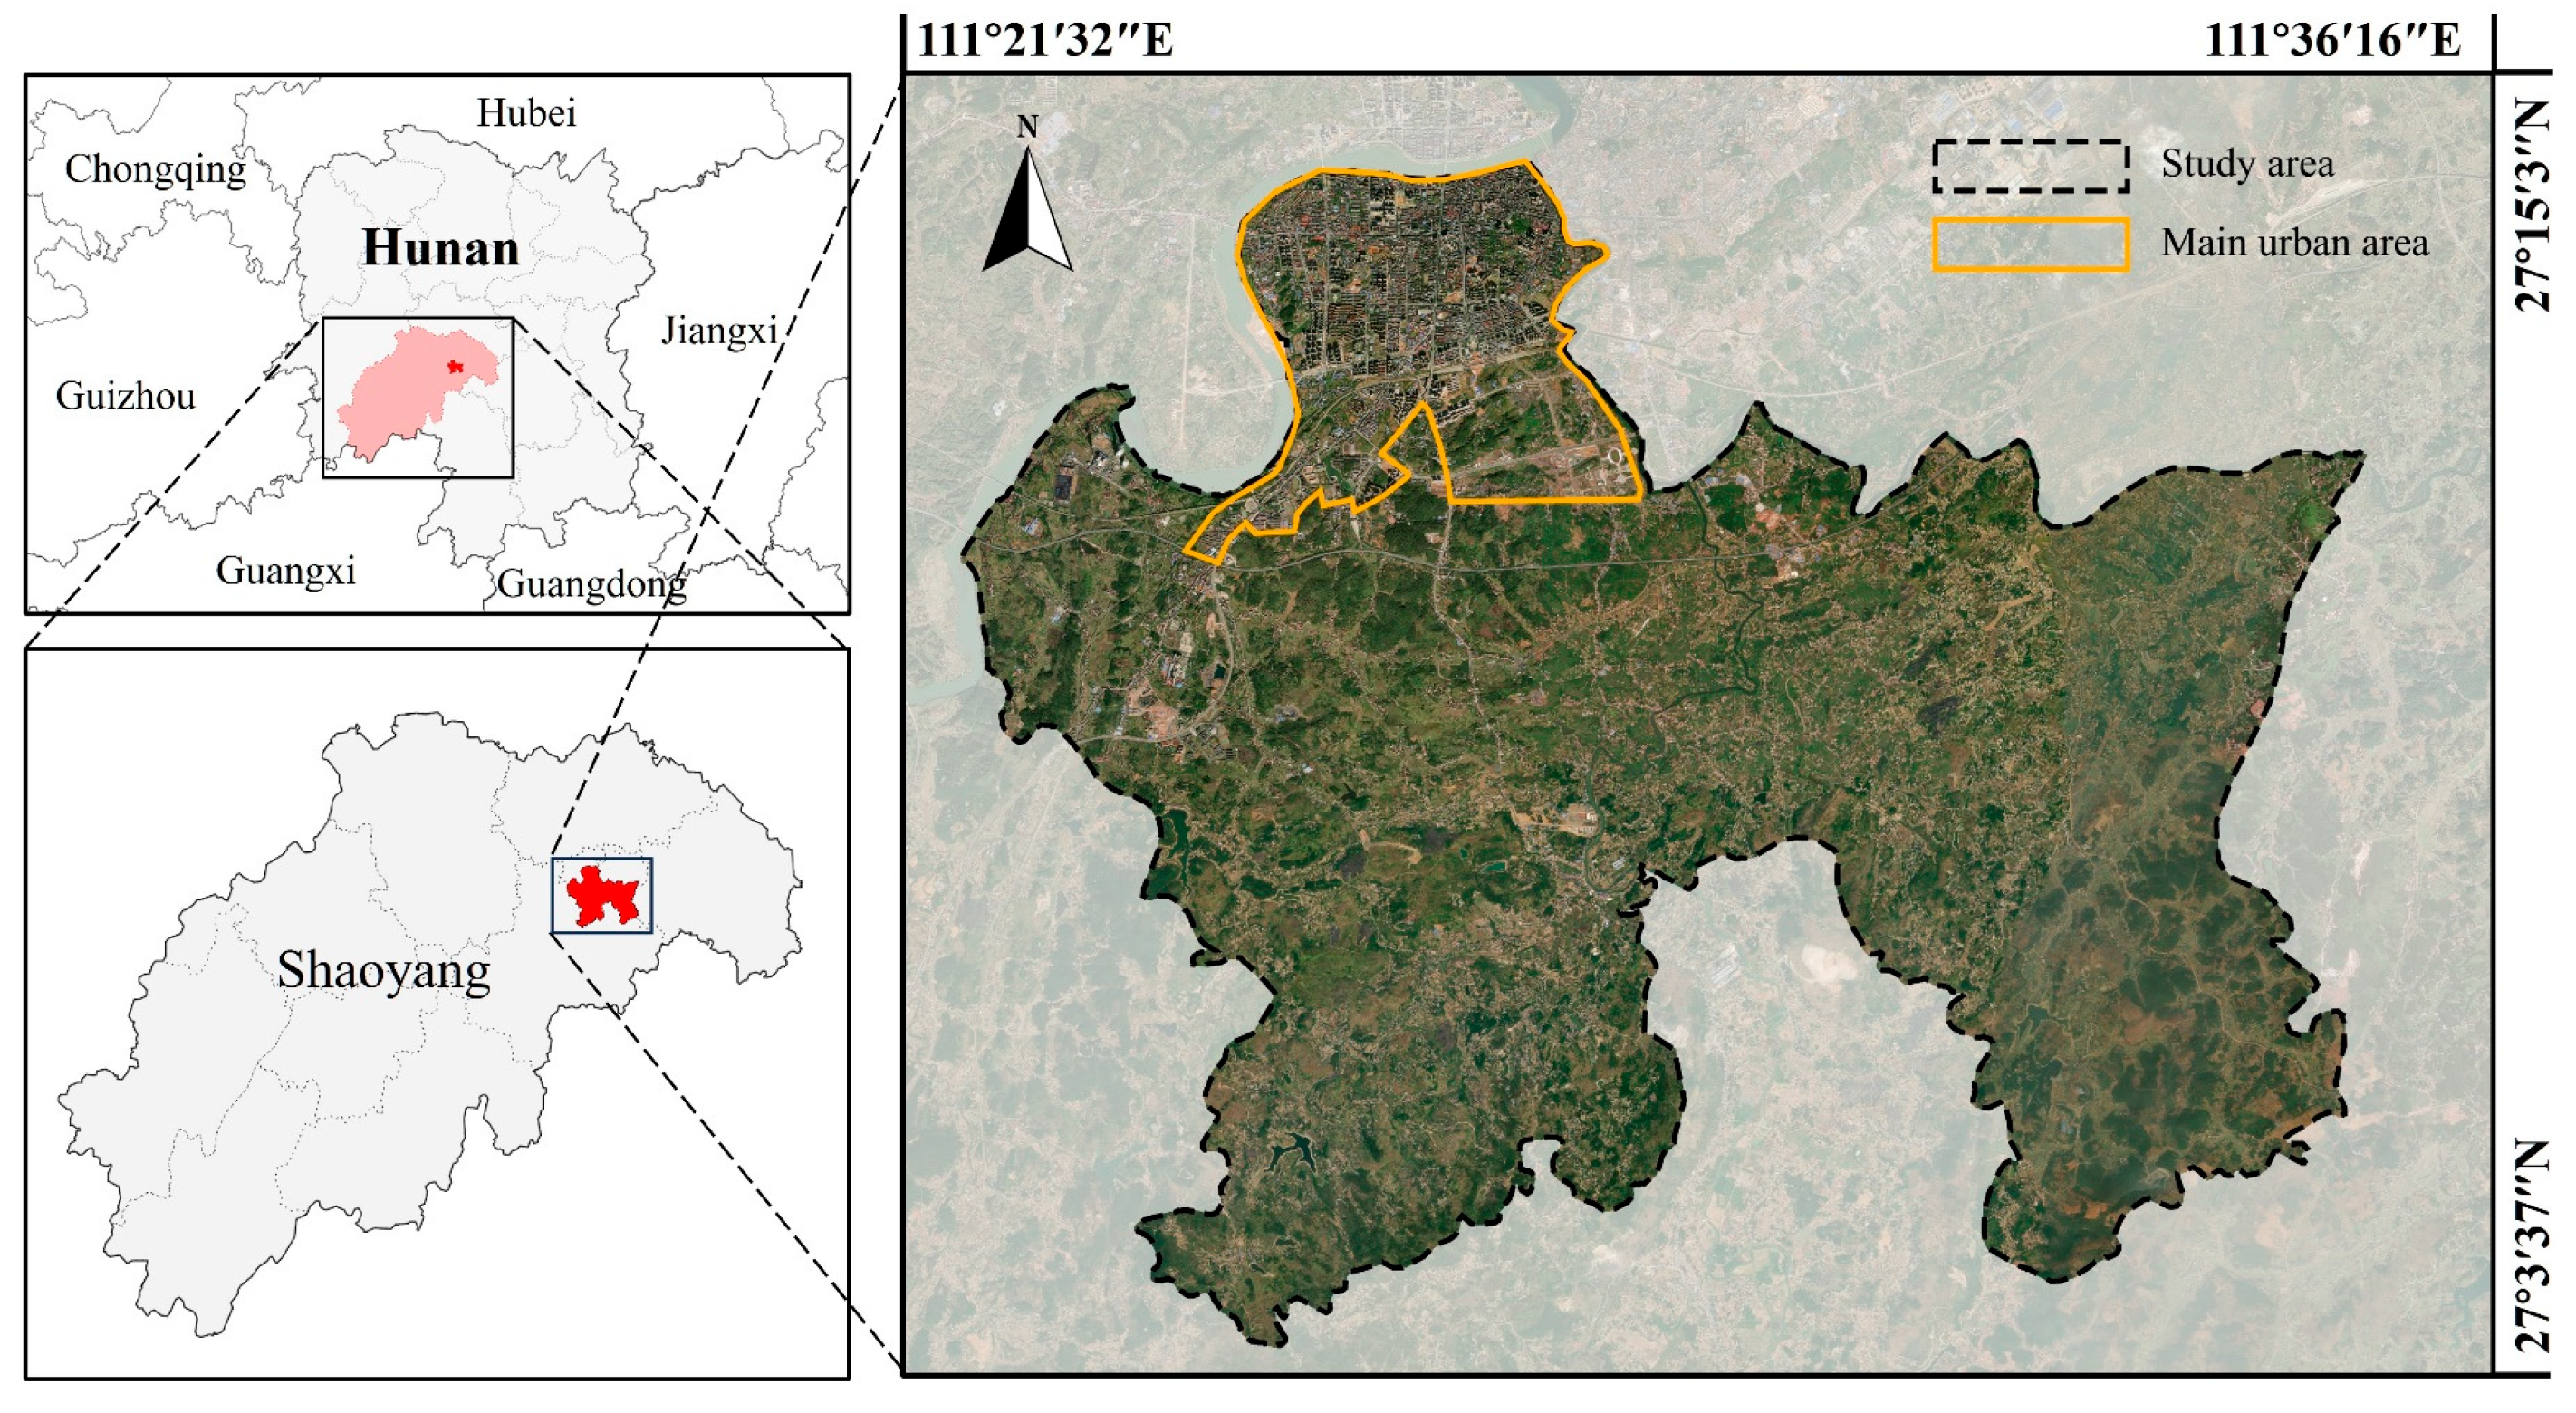
Fire service accessibility under real-time road conditions was rarely considered in previous studies. To address these limitations, a dynamic block-unit-based method is proposed in this study, where real-time traffic data are integrated with advanced spatial analysis techniques. The primary novelty of this study is the development of a block-unit-based dynamic zoning method that integrates real-time traffic data and image-derived road networks, enabling a more scientific and adaptive delineation of fire station response zones compared to traditional static approaches. The methodological effectiveness was empirically validated through application in Daxiang District, China.
2. Methods
2.1. Method Framework
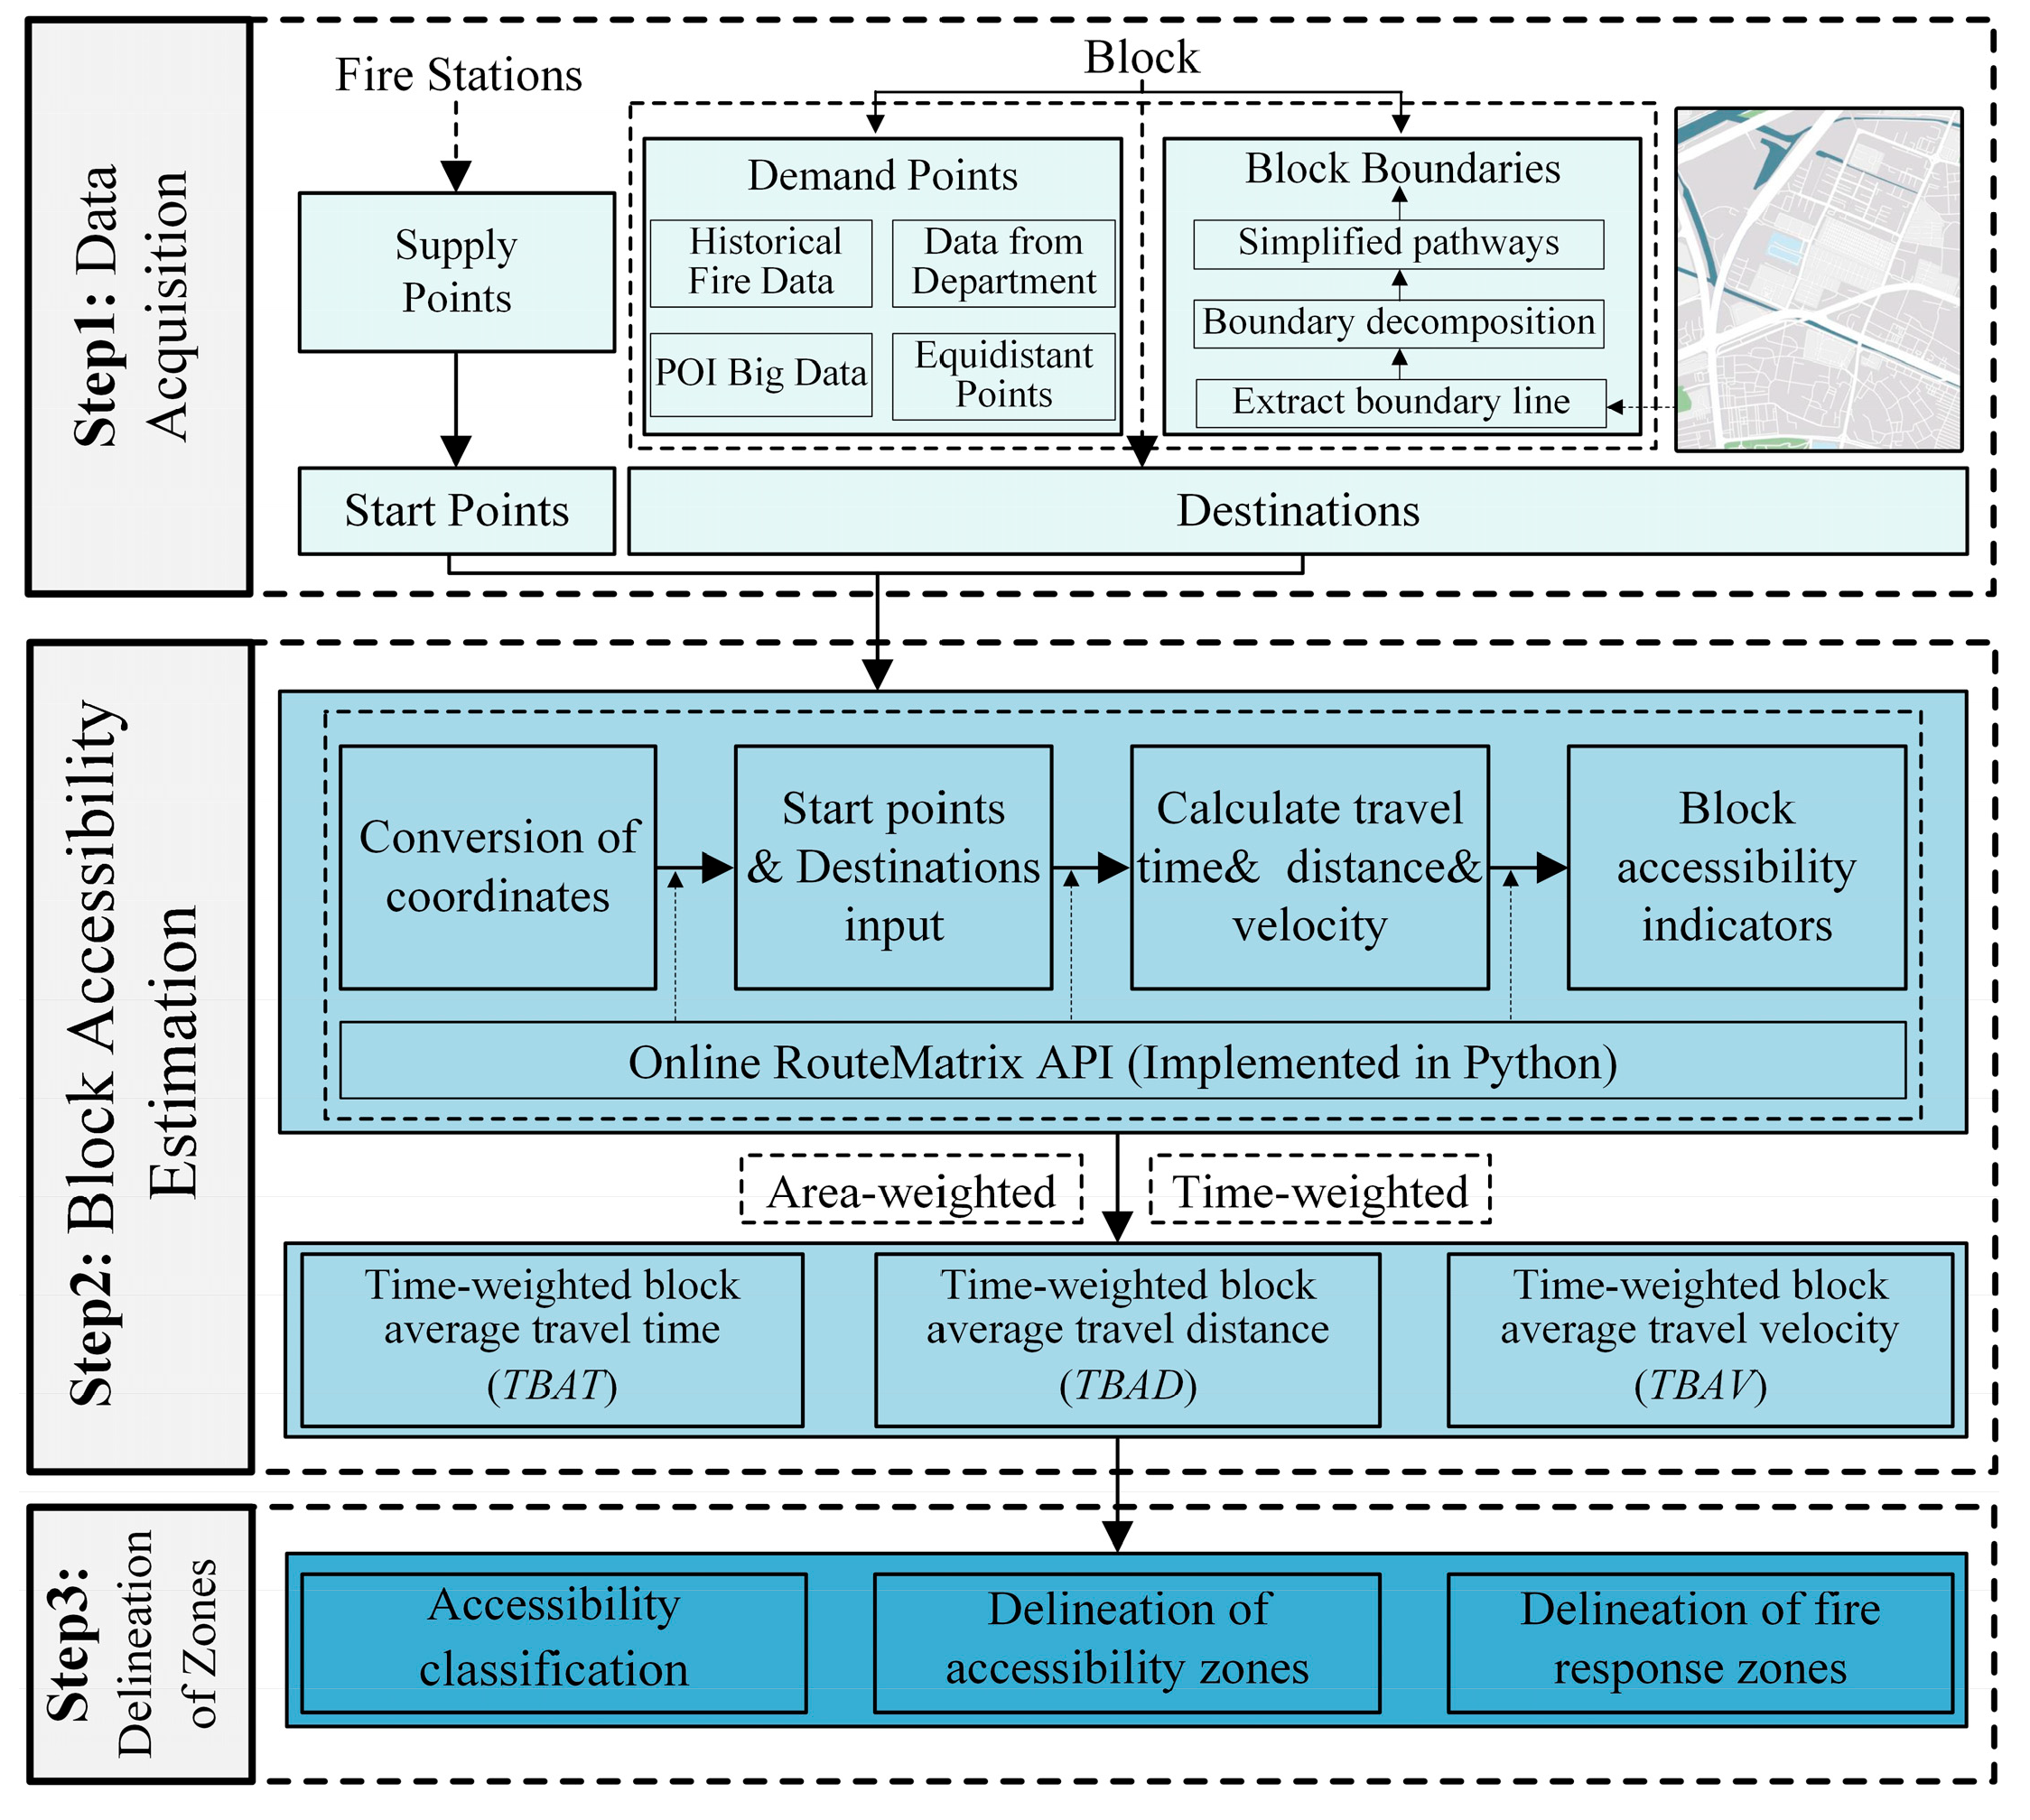
To achieve a more realistic delineation of fire station response zones, this study proposes an algorithm for calculating the coverage range of fire stations based on block units. The algorithm incorporates path simplification techniques from image recognition and innovatively uses block units as the basis for delineation [
52]. The proposed algorithm is divided into three main steps (see
Figure 1).
Step 1 involves data acquisition. Block boundaries are extracted through image binarization and contour tracing using the Douglas-Peucker algorithm. Simultaneously, supply points (fire stations) are identified via field surveys, and demand points are derived from POI data, historical fire records, and grid-based supplementary points.
Step 2 focuses on block accessibility estimation. The travel time, distance, and velocity from each fire station to every block unit are calculated by calling online map APIs. After time-weighted aggregation, block-level accessibility indicators are obtained. Subsequently, after area-weighted aggregation, the overall regional accessibility indicators are derived.
Step 3 concerns zone delineation. Based on the calculated accessibility times, block units are classified into seven accessibility levels according to predefined thresholds. Each block unit is then assigned to the fire station with the shortest average travel time, forming the final response zones for all fire stations in the study area.
2.2. Block Unit Boundary Extraction Algorithm
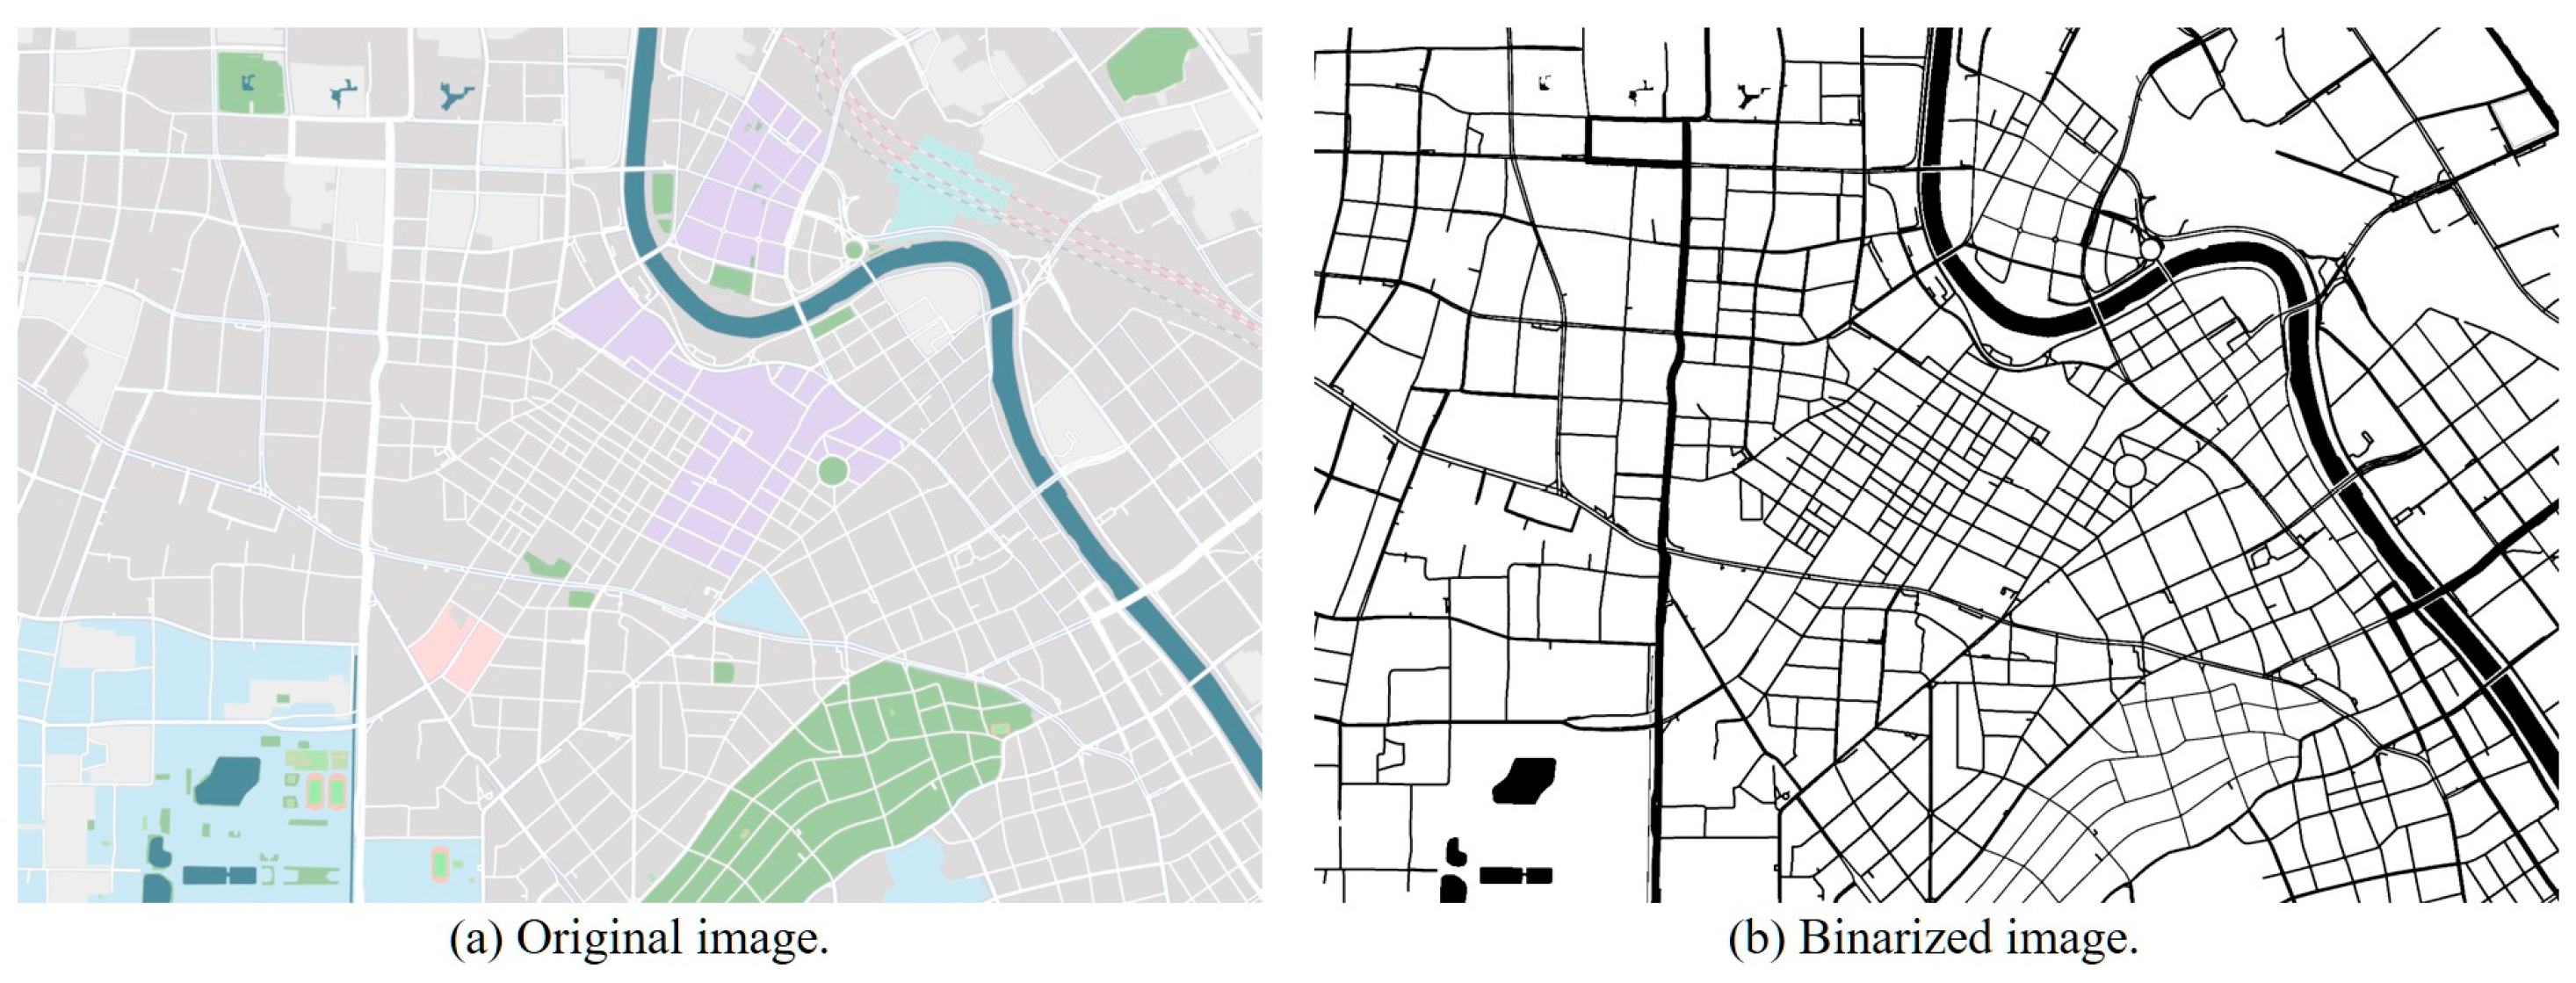
To accurately delineate the response zones of fire stations based on block units, the boundaries of each street unit within the region must first be extracted. Since precise latitude and longitude coordinates of each road cannot be directly obtained in bulk, an image recognition method is adopted in this study to indirectly acquire the boundaries of each block. Images covering the entire study area are obtained through API service of an online map. The images are then binarized, with roads and water bodies assigned the color black and other areas assigned the color white, as shown in
Figure 2.
Subsequently, boundary tracking is performed within the image range. The four neighboring pixels around the starting point are checked, and if the colors of the four neighboring pixels are not identical, the point is defined as an internal region boundary point
, as shown in
Figure 3. Contour tracing is then conducted along the boundary by moving in four directions: up, down, left, and right, ultimately determining all black pixel boundaries.
After all paths are obtained, each path is simplified. Partition points should correspond to parts of the image contour where shape mutations occur, i.e., contour turning points. For a path α(
P0→
P1→
P2→
P3→…→
Ph−1→
P0), where each contour turning point is denoted as
Pg, the Euclidean distance
dg between all adjacent contour turning points
Pg and
Pg−1 is calculated as shown in Equation (1) (where
d0 represents the distance between
P0 and
Ph−1).
After a partition point
is determined, the point with the maximum
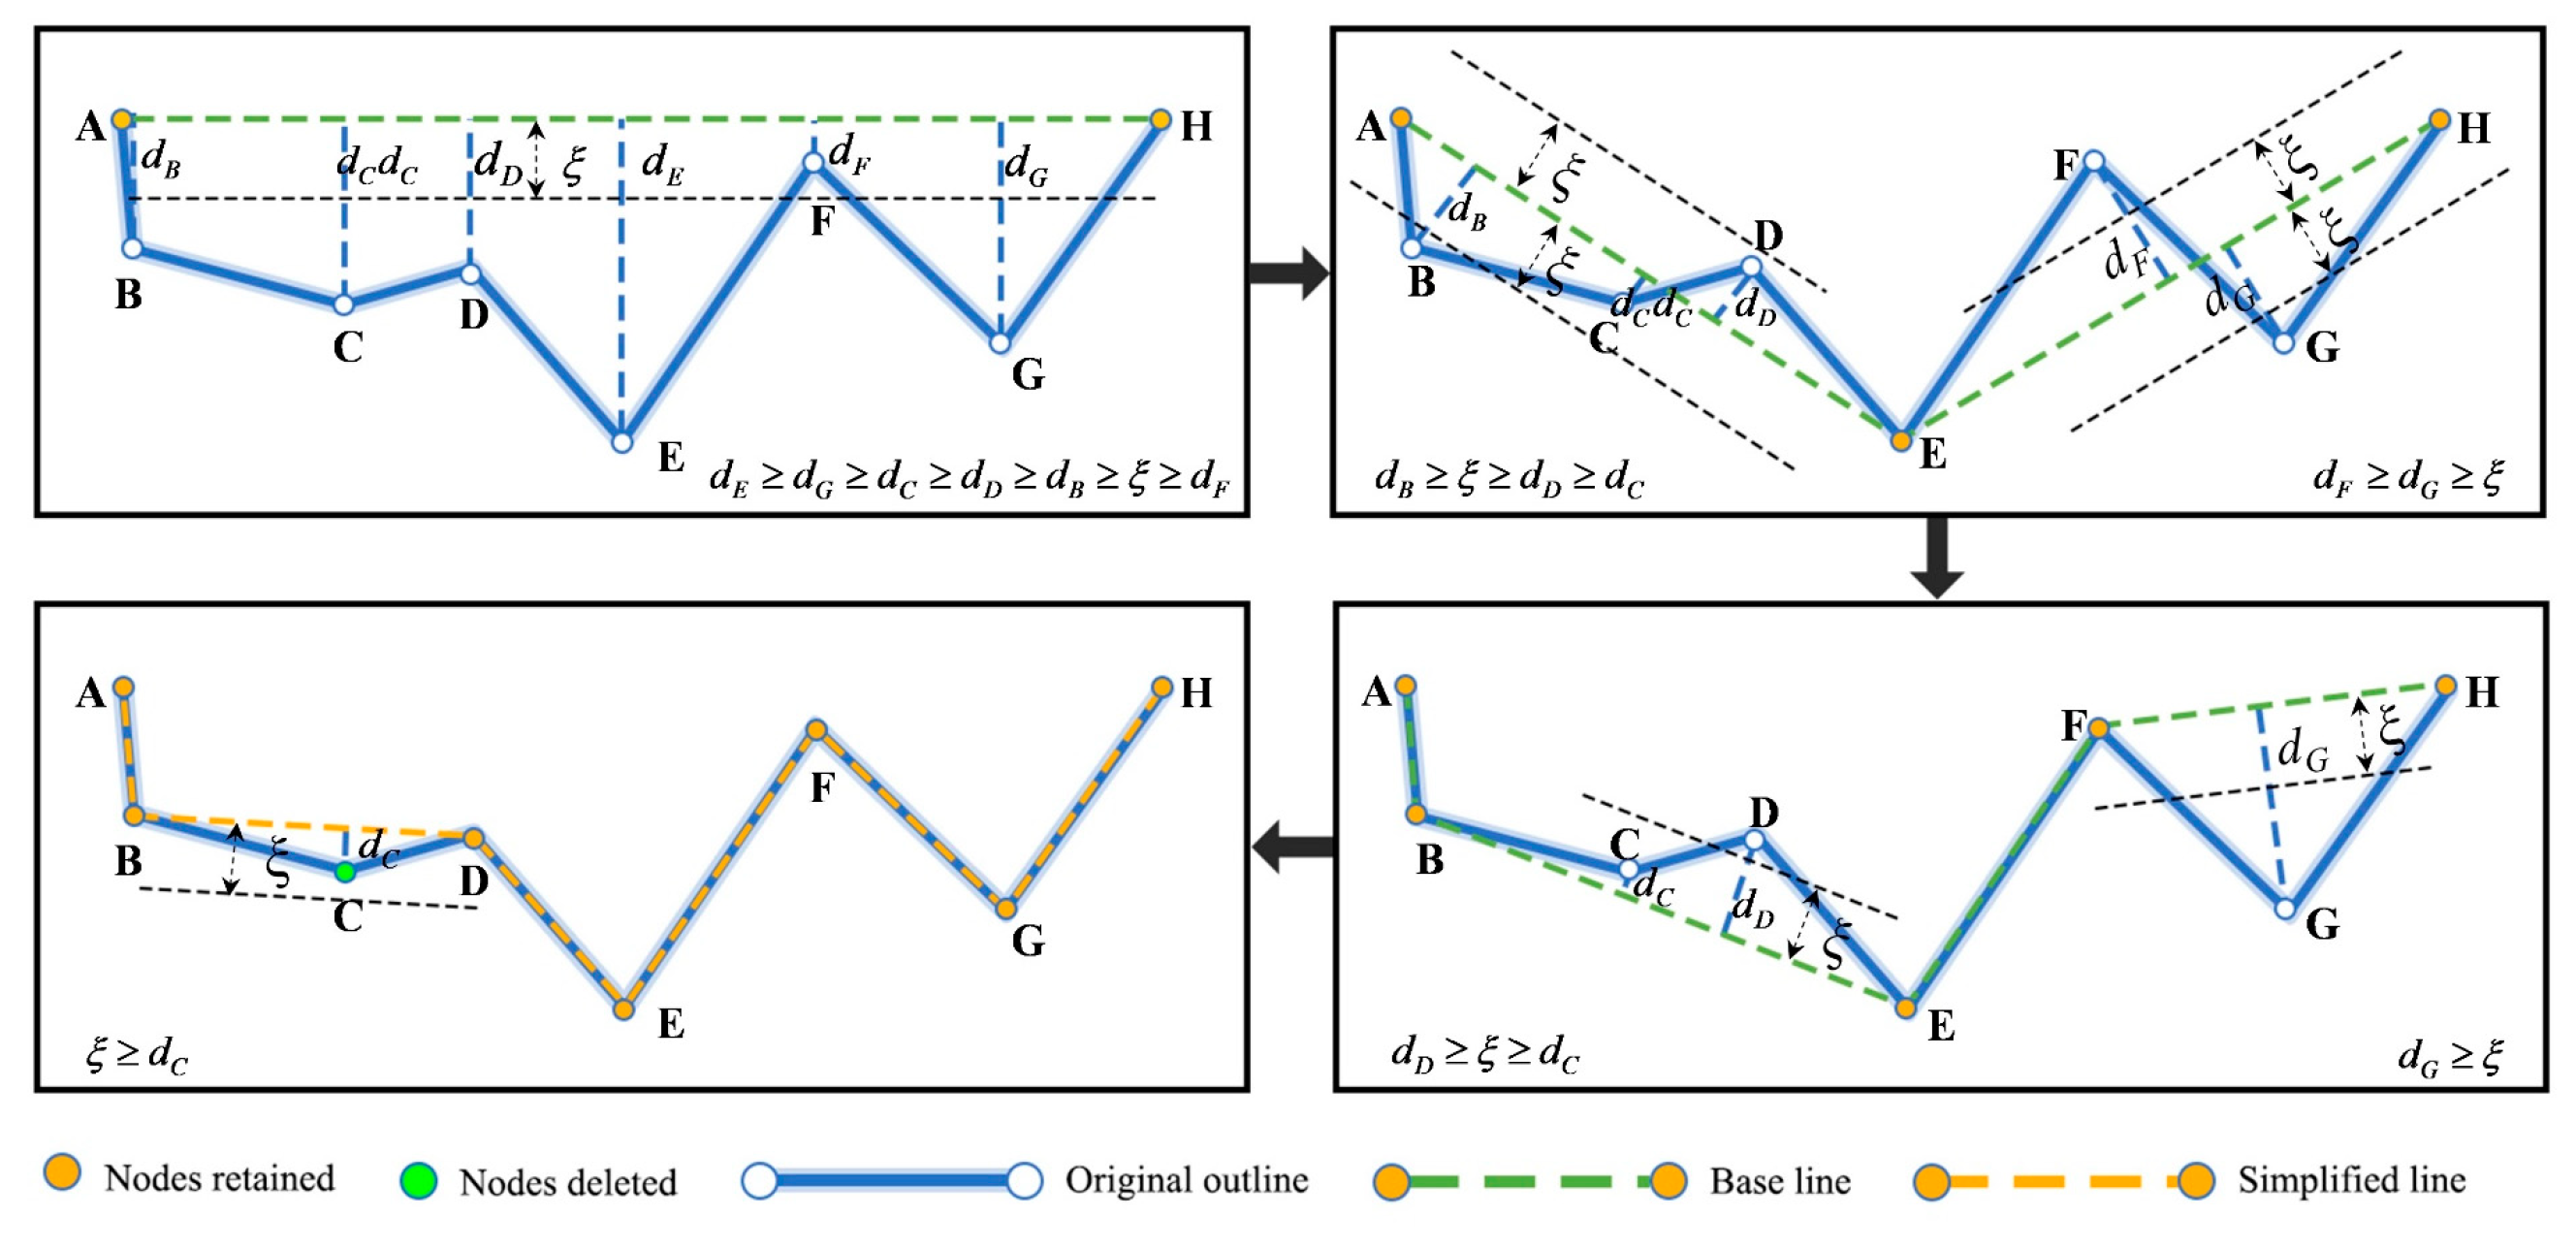
dg must be identified for path decomposition. The Douglas–Peuker algorithm is capable of identifying nodes whose distance from the baseline exceeds a specified threshold z as key points, effectively preserving the geometric contour of the shape. The Douglas–Peuker algorithm (as shown in
Figure 4) is employed to determine the simplified contour of roads within the region, and the observation nodes are classified as breakpoints based on the simplified contour points. The breakpoints are recorded, and the true latitude and longitude of the boundaries of each block unit are obtained by matching the latitude and longitude of the image boundaries with the breakpoints determined by the Douglas–Peuker algorithm.
The proposed boundary extraction algorithm achieves accurate road feature identification through image binarization and contour tracing techniques, effectively distinguishing roads from other geographic features. Compared to the timeliness limitations of traditional municipal maps and open-source platform data, this algorithm significantly improves the temporal validity of road network information by incorporating real-time navigation data.
2.3. Supply Points and Fire Risk Demand Points
According to the relevant regulations of the “standards for urban fire station construction,” future fire protection planning should gradually transition to the “response time determination method.” In response to this policy direction and to rationally optimize the allocation of firefighting resources, this study adopts response time as a core indicator and proposes an algorithm for calculating fire service accessibility based on block units. Based on this core indicator, the precise positioning of fire risk demand points and supply points is considered the foundation for calculating fire service accessibility. Demand points represent areas requiring fire services, while supply points are the sources of firefighting resources, i.e., fire stations. A rational layout of demand points and supply points can ensure that firefighting resources quickly cover all demand points in the event of a fire, guaranteeing comprehensive service coverage and timely response. Therefore, the scientific layout of demand points and supply points is regarded as crucial for accessibility analysis and resource optimization.
The distribution of fire stations directly affects the accessibility and response velocity of regional fire services. Therefore, ensuring the accuracy and timeliness of supply point data is considered crucial for subsequent analysis. In determining the supply points, precision is required, and accurate data on the location and number of fire stations within the region can be obtained through on-site field surveys or by acquiring data from fire departments.
In fire service planning, demand points can be determined either through quantitative allocation models involving weighted data or by manually defining spatial locations that represent potential fire risks. In the present study, demand points were manually defined. Demand points are primarily derived from historical fire data, point of interest (POI) big data, and data from planning and construction industry departments within the study area. Historical fire data, POI big data and data from department objectively reflect population density and built environment characteristics through the spatial aggregation of commercial facilities and public service points, representing the socioeconomic dimensions of fire risk. These demand points are mostly located in urban areas, with sparse distribution in rural regions. Currently, rural areas account for a significant proportion of China’s total land area. However, the demand points obtained through the aforementioned data sources are less distributed in rural areas. This distribution does not align with the actual situation in China. Meanwhile, in China, fire stations are mandated to serve not only densely populated areas but also to comprehensively address diverse fire risks, including forest fires, wildfires, and other emergencies in sparsely populated regions. To address this gap, relying solely on existing data would lead to incomplete research conclusions. It is necessary to scientifically add regular demand points through defined rules and methods to simulate the actual rescue needs in these regions. These demand points are distributed based on assumed rules, ensuring more comprehensive research outcomes and preventing the neglect of fire service accessibility in rural areas. To resolve this issue, artificially assumed demand points are evenly distributed in rural areas beyond natural geographical barriers such as rivers. The study area is divided into square grids, and demand points are assumed at the vertices of these grids to ensure comprehensive coverage of the region and avoid omitting high-risk areas. These points achieve complete urban–rural coverage, preventing oversight of potential fire risks in remote areas.
2.4. Accessibility Time for Block Unit
The ultimate development of a fire and the extent of damage to people and property are most critically determined by time. The assignment of a block unit to a response zone is closely related to the shortest actual travel time of fire trucks from various fire stations to that block unit. To accurately reflect the fire service accessibility of each fire station to each block, the travel time for each block unit needs to be calculated by measuring the travel times to demand points within the block unit. The overall accessibility of the block unit is assessed by calculating the average travel time of fire trucks from each fire station to these demand points. Based on these average travel times, the response capabilities of different fire stations to the block are compared, and the shortest travel time is selected as the final accessibility time for the block.
In this study, the accessibility between multiple fire stations and multiple block units within the study area is first considered. It is assumed that there are k fire stations and z block units extracted through the block unit boundary extraction algorithm. Each block unit u contains nu demand points, and each time point j corresponds to a specific moment Tj, where j∈[1,m]. To measure the accessibility of fire trucks, the actual travel time from each fire station to all demand points within each block unit needs to be calculated in detail.
This study obtains the travel time by calling the Baidu Maps Web Service API to extract it from Baidu Maps. It is assumed that the travel time
T′
j,ri is calculated by considering factors such as traffic flow and road conditions, representing the preliminary time for a fire truck to travel from fire station
r to demand point
i. Fire trucks are granted priority access during emergency tasks and require preparation time
Tpre before departure. The response time from fire station
r to demand point
at a certain time of
tj (
Tj,ri) needs to incorporate a reduction factor
β and the preparation time
Tpre, as shown in Equation (2).
To calculate the accessibility of block unit
u at time
j, the travel time of fire trucks from each fire station
r to block
u must be determined. Assuming there are
nu demand points within block
u, the average response time from fire station
r to block
u at a certain time of
tj (
Tj,r(
u)) can be calculated as Equation (3), which averages all
Tj,ri within block
u.
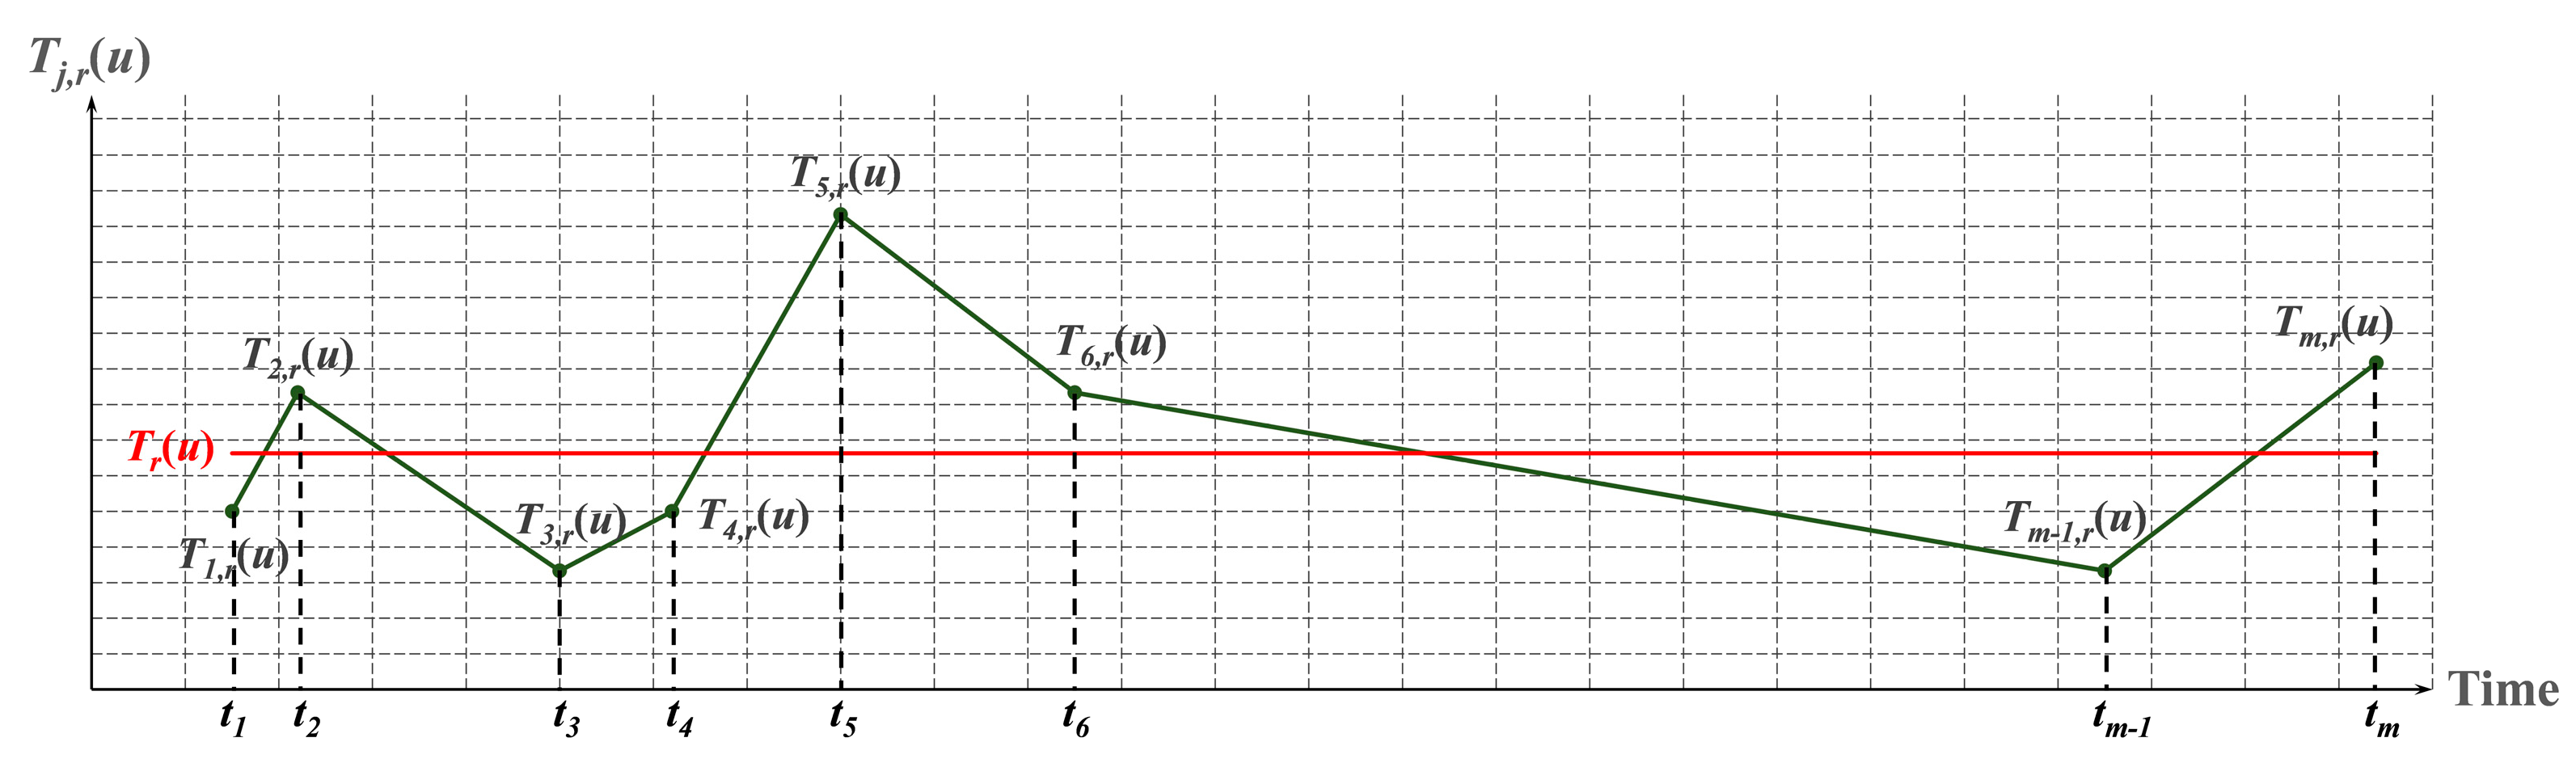
However, since traffic conditions vary over time, the travel time at a single moment is insufficient to fully reflect the actual accessibility of fire trucks, especially when facing complex urban traffic and different time periods. The travel time at different time points is influenced by factors such as traffic flow and road conditions, making it difficult to fully capture the efficiency of emergency response from each fire station to the block unit based solely on a single moment. To overcome this limitation, the concept of time weighting is introduced in this study (as shown in
Figure 5). As urban traffic volume changes periodically,
m scenarios are consecutively established within a period of time, with the certain time of
tj for the
j-th scenario. By weighting
Tj,r(
u) at different time points, time-weighted block response time from fire station
r to block
u (
Tr(
u)) can be calculated as Equation (4). The smaller the temporal interval between
tj and
tj+1 is, the higher the computational accuracy becomes.
The minimum in
Tr(
u) is used as the minimum time-weighted response time for block
u (
TBAT(
u)),
TBAT(
u) can be calculated as Equation (5). If
R is the fire station corresponding to
TBAT(
u), then block unit
u is assigned to
R. The corresponding minimum time-weighted response distance (
TBAD(
u)) and velocity (
TBAV(
u)) can be calculated as auxiliary parameters using Equations (6) and (7), respectively. The
TBAD(
u) and
TBAV(
u) are employed as auxiliary variables to enhance the observation of data variation patterns and to provide comparative evidence highlighting the limitations of the proximity-based zoning criteria in the current Chinese standard [
39].
At a certain time of tj, the minimum block response time (BATj(u)), distance (BADj(u)) and velocity (BAVj(u)) for block u are obtained by calculating the average time, distance, and speed of multiple demand points within block unit u corresponding to fire station R at each certain time of tj.
2.5. Accessibility Time for Study Area
After the weighted calculation of accessibility for a single block unit is completed, this study is further extended to the entire study area
U To obtain the comprehensive accessibility of the entire region, an area-weighted method is adopted. Specifically, the proportion of each block unit
u relative to the total area of the study region determines its weight in the overall accessibility calculation. The regional response time for area
U at a certain time of
tj (
BATj(
U)), distance (
BADj(
U)) and velocity (
BAVj(
U)) can be calculated as Equations (8), (9) and (10), respectively.
To obtain the comprehensive accessibility of the entire study area, the weighted results across all time points are integrated. Specifically, the time-weighted calculations for
BATj(
U),
BADj(
U) and
BAVj(
U) at all time points are performed, and the regional time-weighted response time of area
U (
TBAT(
U)), distance (
TBAD(
U)) and velocity (
TBAV(
U)) can be calculated as Equation (11), (12), and (13), respectively.
2.6. Accessibility Type Classification
In the event of a fire, the time taken for fire trucks to reach the fire location is considered to have a decisive impact on reducing casualties and property damage. In previous studies, a response time of 5 min is typically set as an objective indicator of coverage. In China, the fire service response time is defined as 5 min [
53]. Studies have shown that when the response time falls within the range of 3 to 13 min, every additional minute increases fire-related losses by approximately
$3000 [
54]. Therefore, based on the
BAT(
u) of each block unit, the block units are classified into accessibility levels, as shown in
Table 1.
If there are
zw type
w accessibility zones in the region, the area of Type
w blocks (
BASw) can be calculated as Equation (14).
The coverage rate of Type
w blocks (
Pw) can be calculated as Equation (15).
2.7. Delineation of Firefighting Response Zones
The traditional “area-based method” for delineating fire station response zones limits the efficiency of firefighting resource utilization. Only by accurately identifying the accessibility time of each block unit can fire rescue efficiency be improved, and major fires be prevented. To effectively reflect the true fire service accessibility of each fire station to each block, after obtaining the average accessibility time of all fire stations to block unit u, the average rescue times of all fire stations are compared, and the fire station with the shortest average accessibility time is selected as TABT(u). The block is then assigned to the response zone of that fire station.
Assuming that fire station
r has
zr block units within its response zone, the area of its response zone (
SFR-r) can be calculated as the sum of the areas of these block units, as Equation (16).
4. Result and Discussions
4.1. Accessibility Analysis
Through the calculation and analysis of the overall data, 42,243 valid samples were obtained for each scenario, resulting in a total of 1,225,047 sample data points across 29 scenarios. The
TBAT(
U) for Daxiang District is 960.706 s. The
BASi(
i∈[1,7]) and
Pw(
w∈[1,7]) are shown in
Table 2. The results indicate that type 1 accessibility zones account for only 4.849% of the total area, while type 7 accessibility zones have the highest proportion at 68.189%. This result suggests a significant shortage of firefighting resources in the study area, highlighting the urgent need to take effective measures to optimize fire service accessibility. It is suggested that government departments increase investment in firefighting resources, consider adding new fire stations, or optimize the layout of existing resources to enhance the region’s firefighting capabilities and coverage levels.
In type 7 accessibility zones, more than 80% of the area is rural. This indicates a significant imbalance in firefighting resources between urban and rural areas. Firefighting resources are severely lacking in rural areas. To reduce the gap in fire service between urban and rural areas, and to ensure the fairness and timeliness of services, urgent action in needed. Fire resources must be better allocated in rural regions. Professional fire brigades should be established in these areas. Basic fire protection facilities need improvement. The emergency response network should be optimized. These measures will enhance the fire rescue capacity in rural areas. Fire risks will be addressed more promptly.
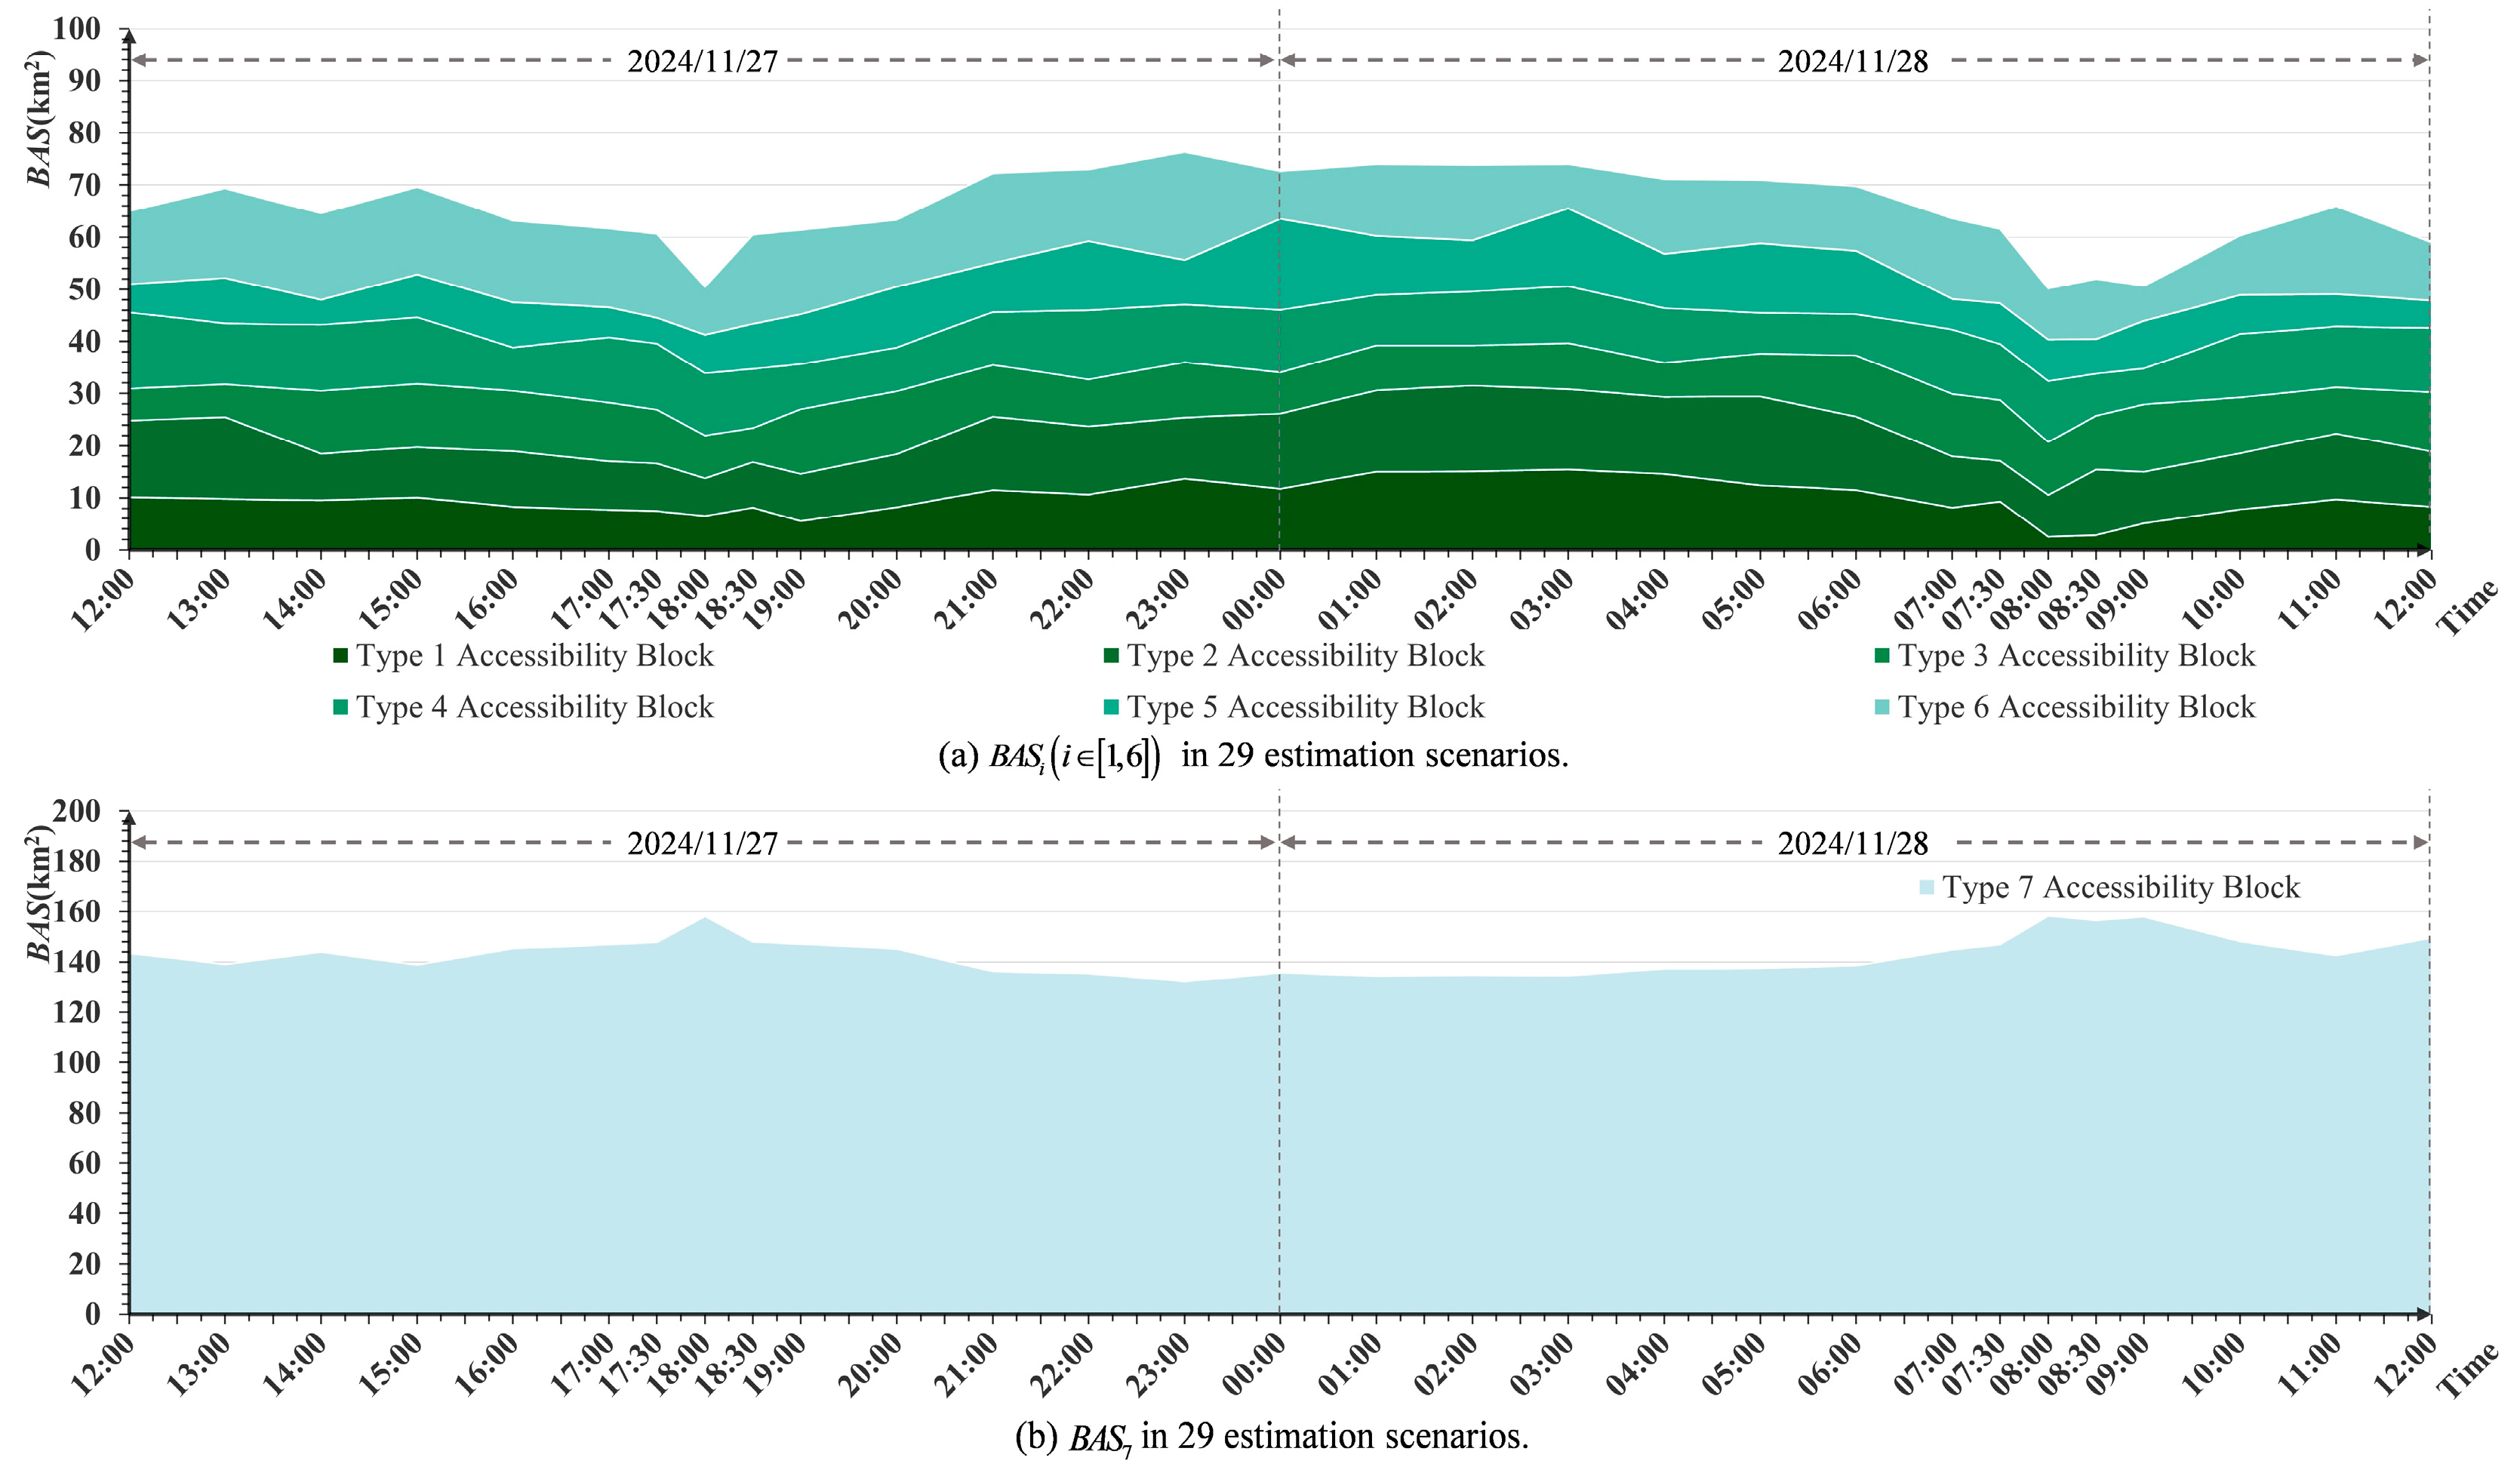
To more clearly understand the differences in the area of fire service accessibility types across different time periods, the data will now be described separately. By comparing
Figure 8a,b, it can be observed that
BAS7 is significantly larger than the sum of
BASi(
i∈[1,6]) at all times. This reflects the overall poor accessibility, indicating a significant shortage of firefighting resources. From
Figure 8a, it can be seen that the
BASi(
i∈[1,6]) during nighttime are generally higher than those during daytime. This is because traffic conditions at night are better than during the day, with fewer vehicles on the road, making congestion less likely. From
Figure 8b, it is evident that the values reach their peak during the morning and evening rush hours (18:00 and 8:00), when traffic congestion is more pronounced compared to other time periods. To mitigate the impact of traffic congestion, several measures can be taken to improve the accessibility of firefighting services. For example, encouraging residents to use public transportation more frequently, optimizing traffic signals, and recruiting volunteers to help maintain traffic order could be effective strategies.
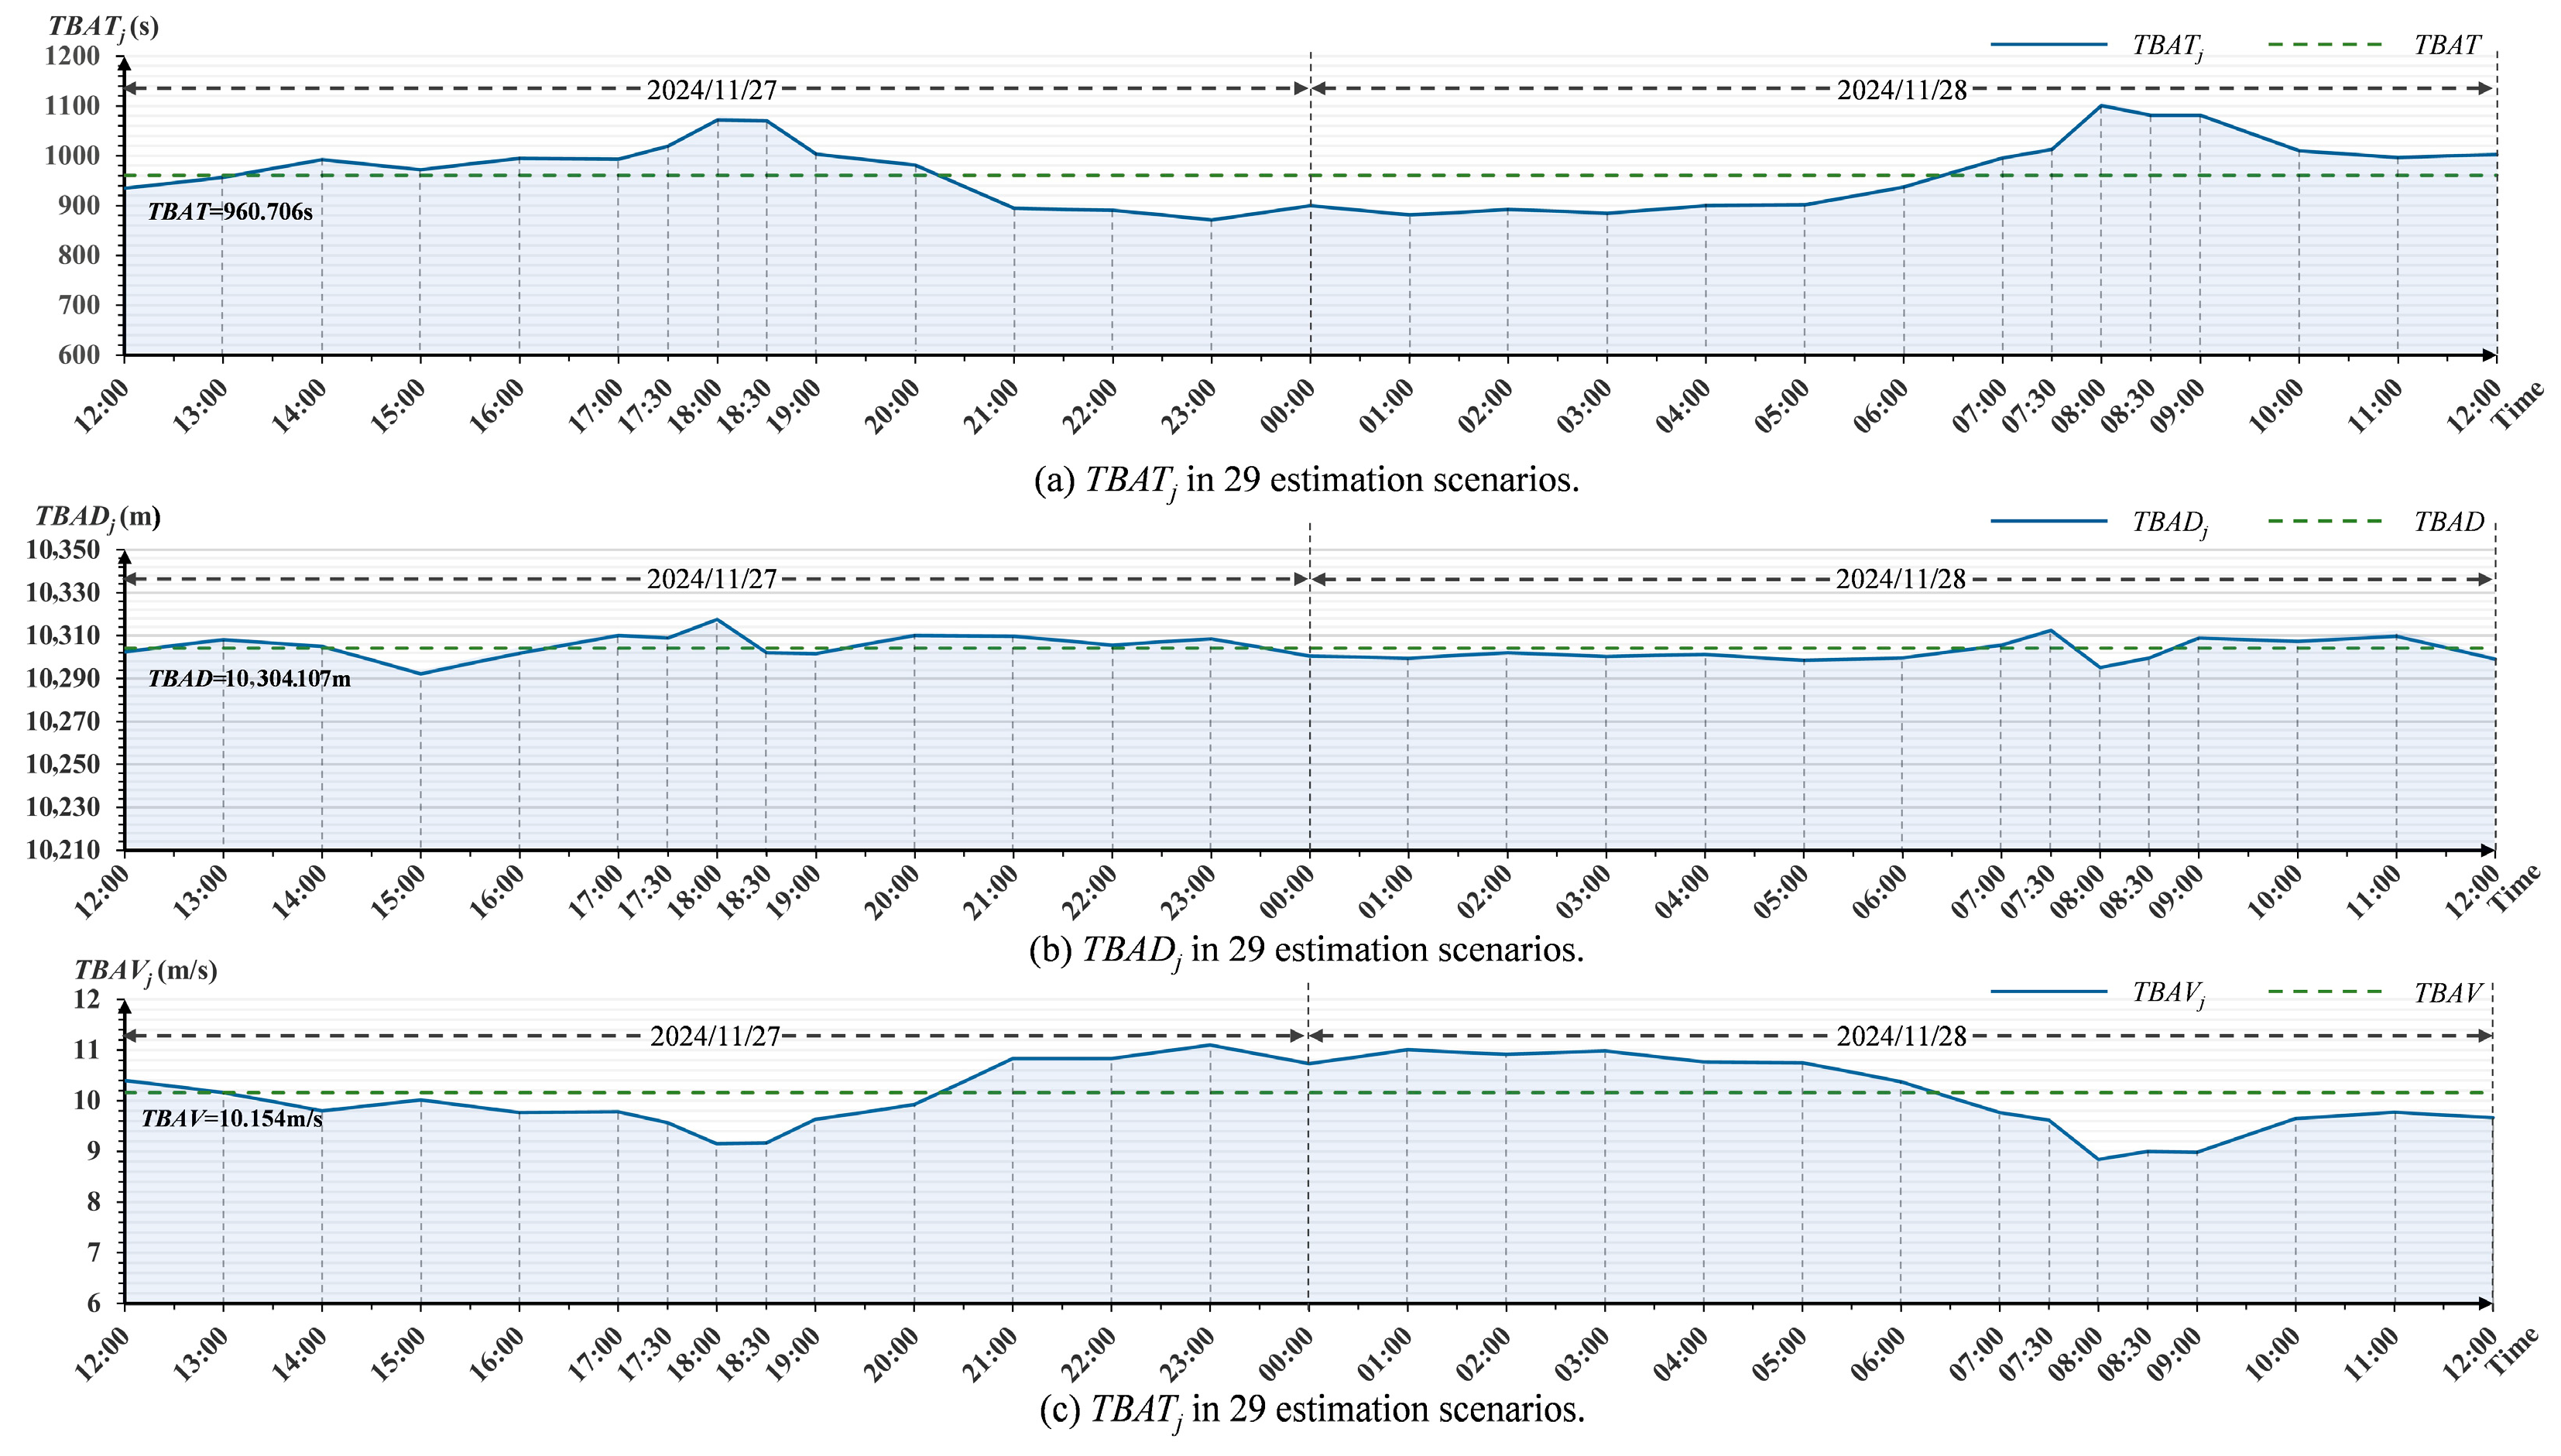
Figure 9 shows the temporal trends of
TBATj,
TBADj, and
TBAVj (detailed data are provided in
Appendix A).
TBADj remains relatively stable throughout the day. This stability is due to the simplicity of the local road network. Furthermore, the influence of traffic congestion on actual travel distance is minimal, resulting in negligible changes in traffic routes. In contrast,
TBATj and
TBAVj exhibit significant temporal fluctuations, with their trends displaying opposite directions. These variations are primarily driven by real-time traffic conditions, with
TBAVj peaking and
TBATj reaching its minimum at 23:00, while
TBAVj reaches its lowest point and
TBAVj peaks at 08:00. The increase in
TBATj reflects higher traffic volumes, leading to extended travel times, whereas the rise in
TBAVj indicates improved traffic flow during these periods, resulting in enhanced travel velocities and reduced travel times. Overall, the fluctuations in traffic flow directly influence the changes in
TBATj and
TBAVj, while the stability of
TBADj is closely associated with factors such as road infrastructure, traffic management strategies, and regional transportation planning.
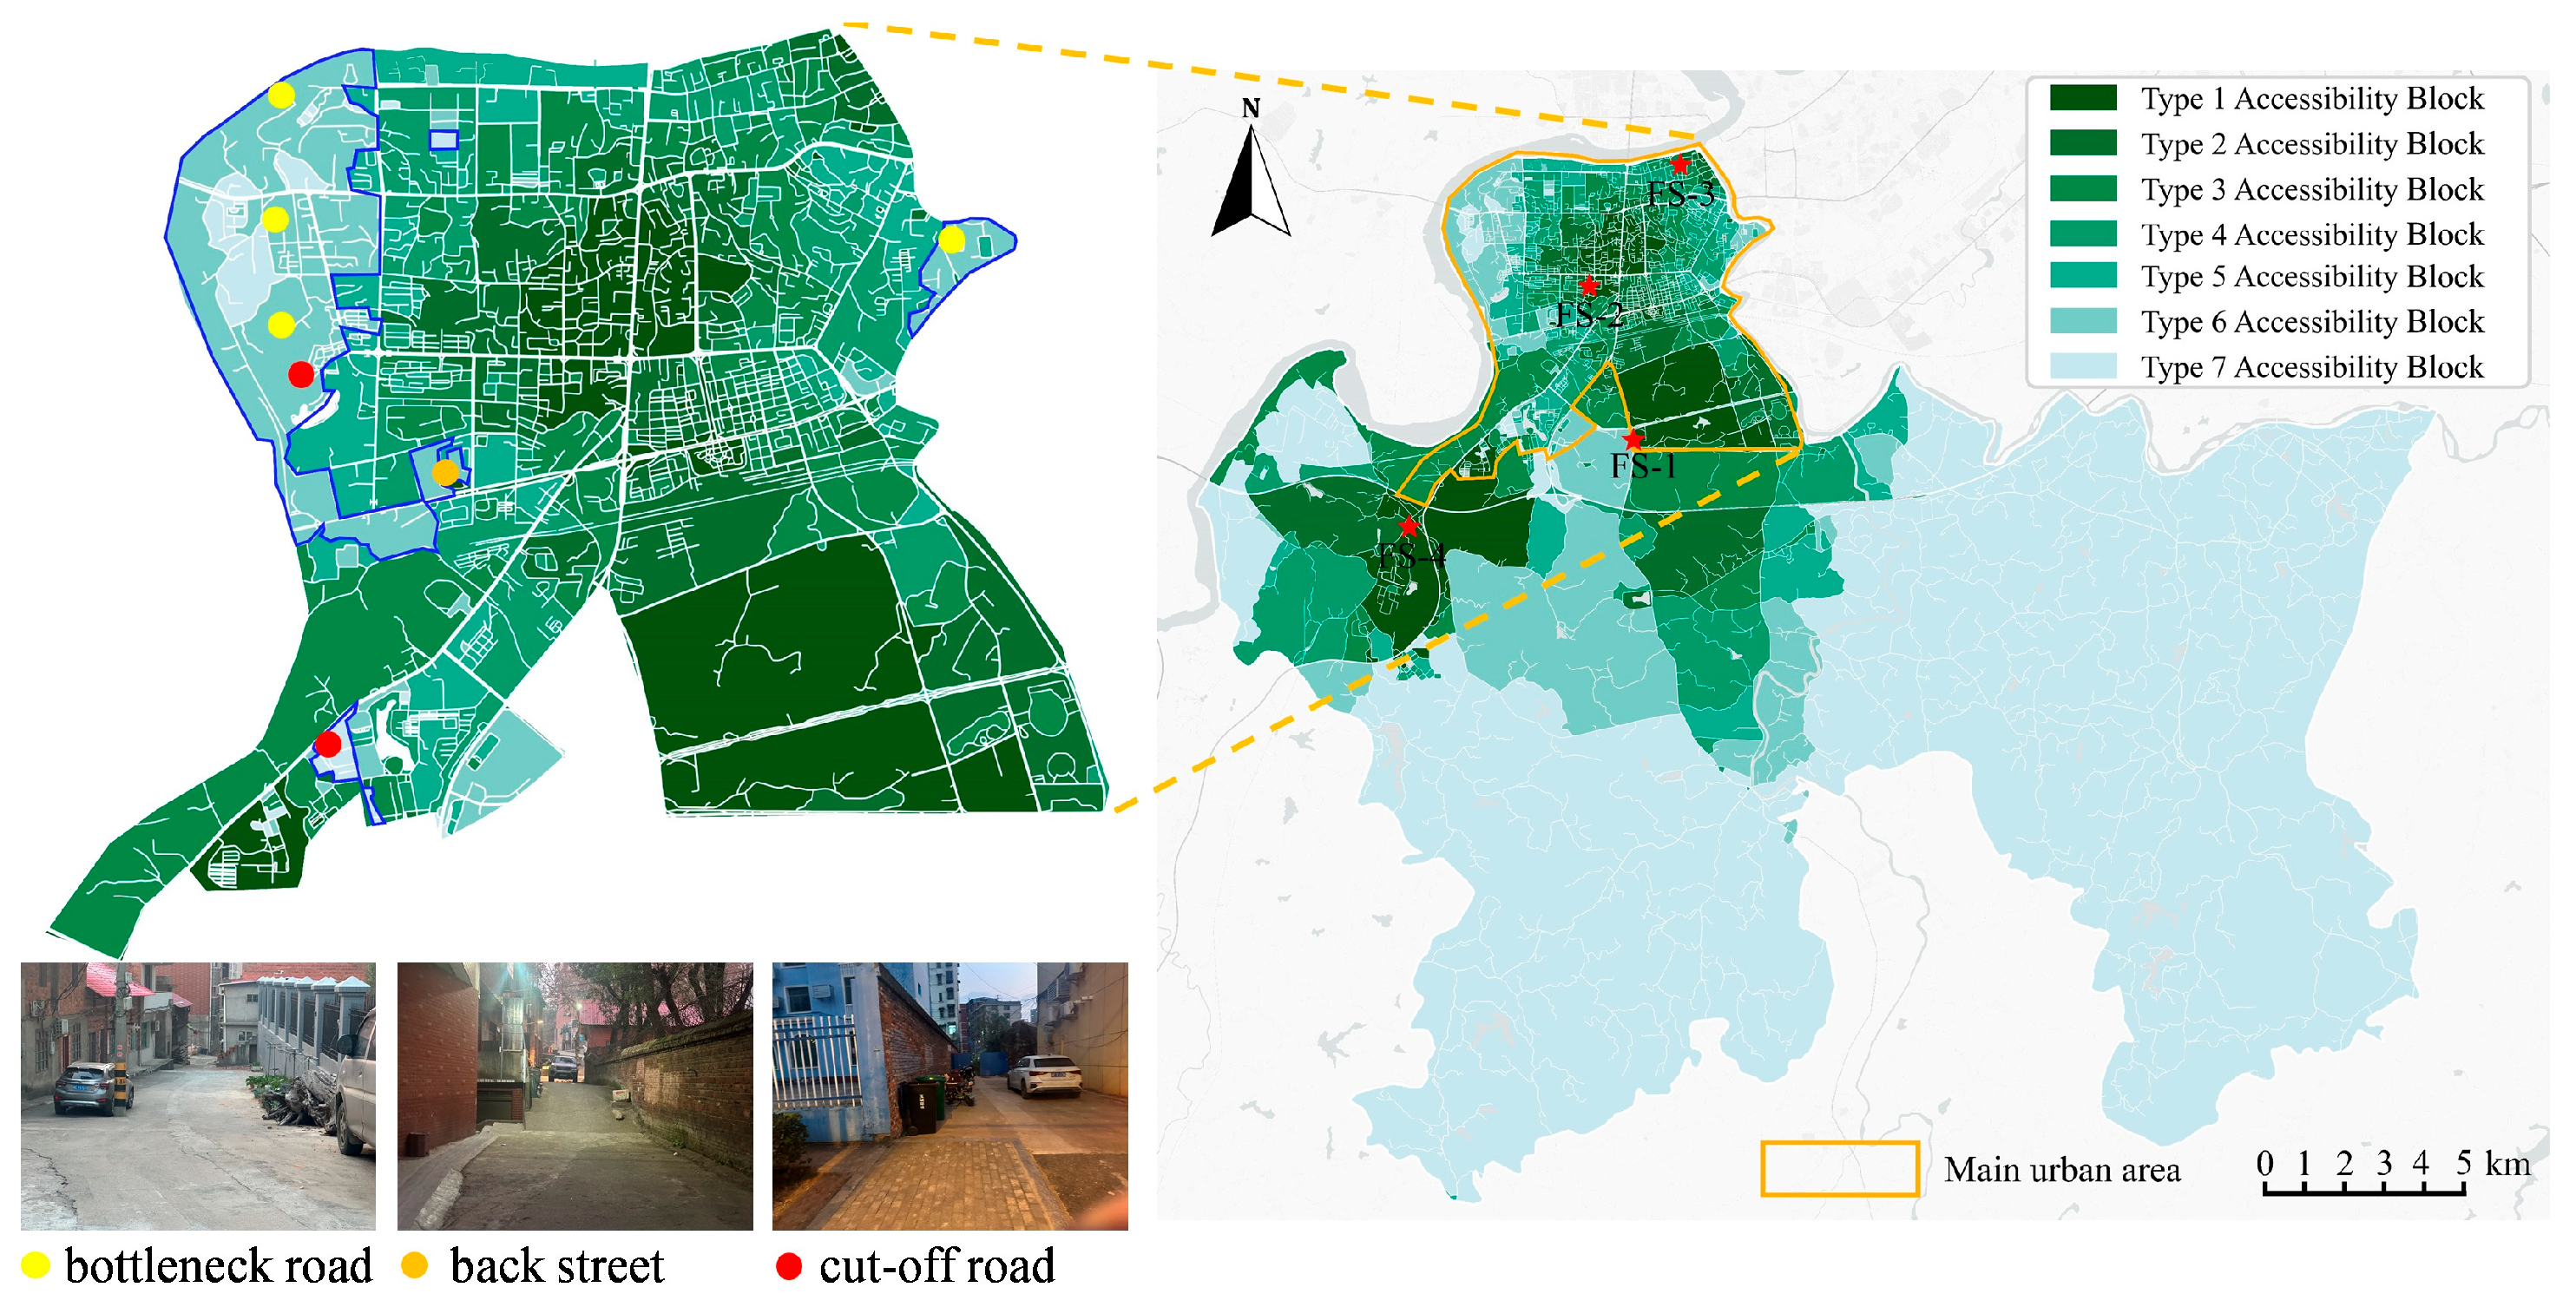
The overall accessibility of the district, along with the differences in accessibility across various blocks, is clearly illustrated in
Figure 10. It is evident that distance has a significant impact on the accessibility of blocks. By analyzing the accessibility distribution in the urban core, it is found that most hard-to-reach areas share similar characteristics, such as the prevalence of bottleneck roads, back streets, and cut-off roads, which contribute to poor traffic flow. Therefore, it is suggested to optimize the existing transportation network, particularly by adding traffic facilities at critical road sections, to alleviate congestion and eliminate traffic bottlenecks. This would effectively shorten the response time for firefighting services and enhance overall rescue efficiency. Additionally, for fire service inaccessible areas, priority should be given to allocating more firefighting resources, such as establishing temporary fire stations or increasing the patrol frequency of fire trucks, to ensure a rapid response in the event of a fire. Through such targeted allocation, the timeliness of firefighting services can be maximized, fire-related losses can be reduced, and stronger safeguards can be provided for the safety of residents’ lives.
Furthermore, as shown in
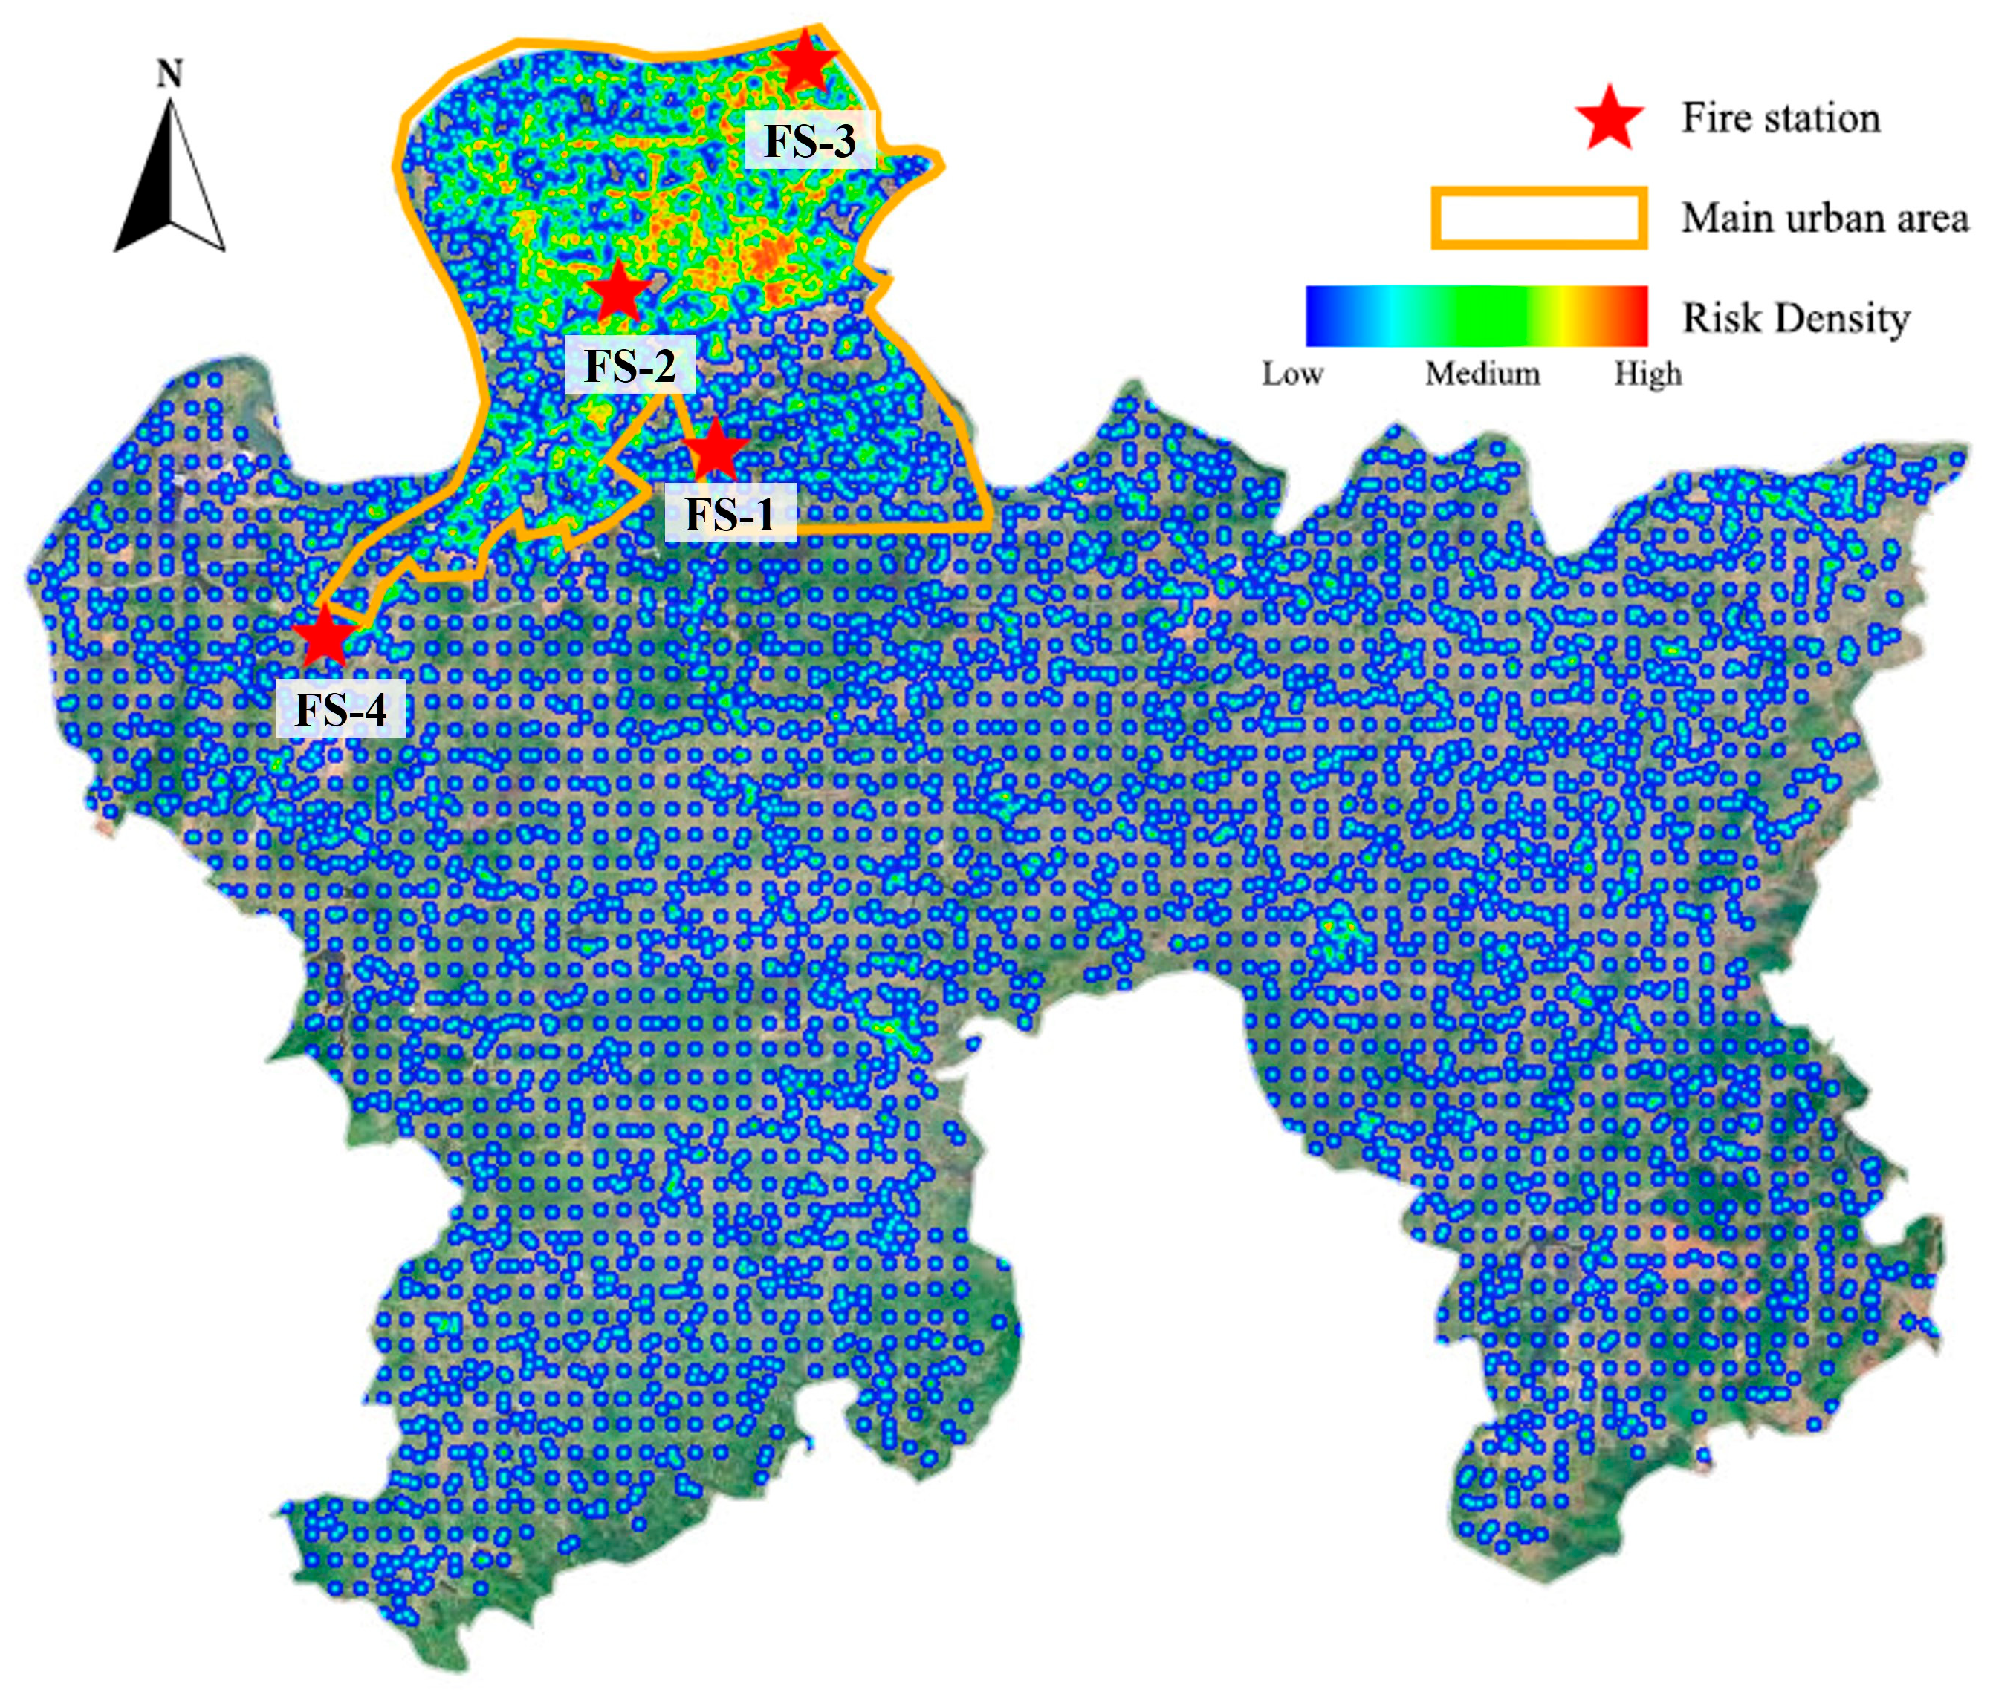
Figure 7, existing fire stations are concentrated in urban cores, whereas areas with poor accessibility are primarily rural. Although rural population density is lower, the higher building density and underdeveloped transportation infrastructure contribute to a fire frequency comparable to urban areas. Additionally, fires in rural areas can spread more rapidly due to the proximity of structures and limited firebreaks, potentially leading to more severe outcomes. However, the current concentration of firefighting resources in urban cores creates an uneven distribution, making it difficult to meet the emergency rescue needs of rural areas. This imbalance may even hinder the socio-economic development of rural regions. To ensure equitable coverage of emergency services across the entire area, further development of infrastructure in rural areas is essential. It is suggested to organize volunteer firefighting teams and conduct regular fire drills and training sessions, enabling rural residents to participate in initial fire suppression efforts. This approach can effectively reduce fire-related losses and enhance the emergency response capabilities of rural areas. Additionally, the establishment of rural fire stations in townships and rural villages should be promoted to improve the capacity for tackling initial-stage fires.
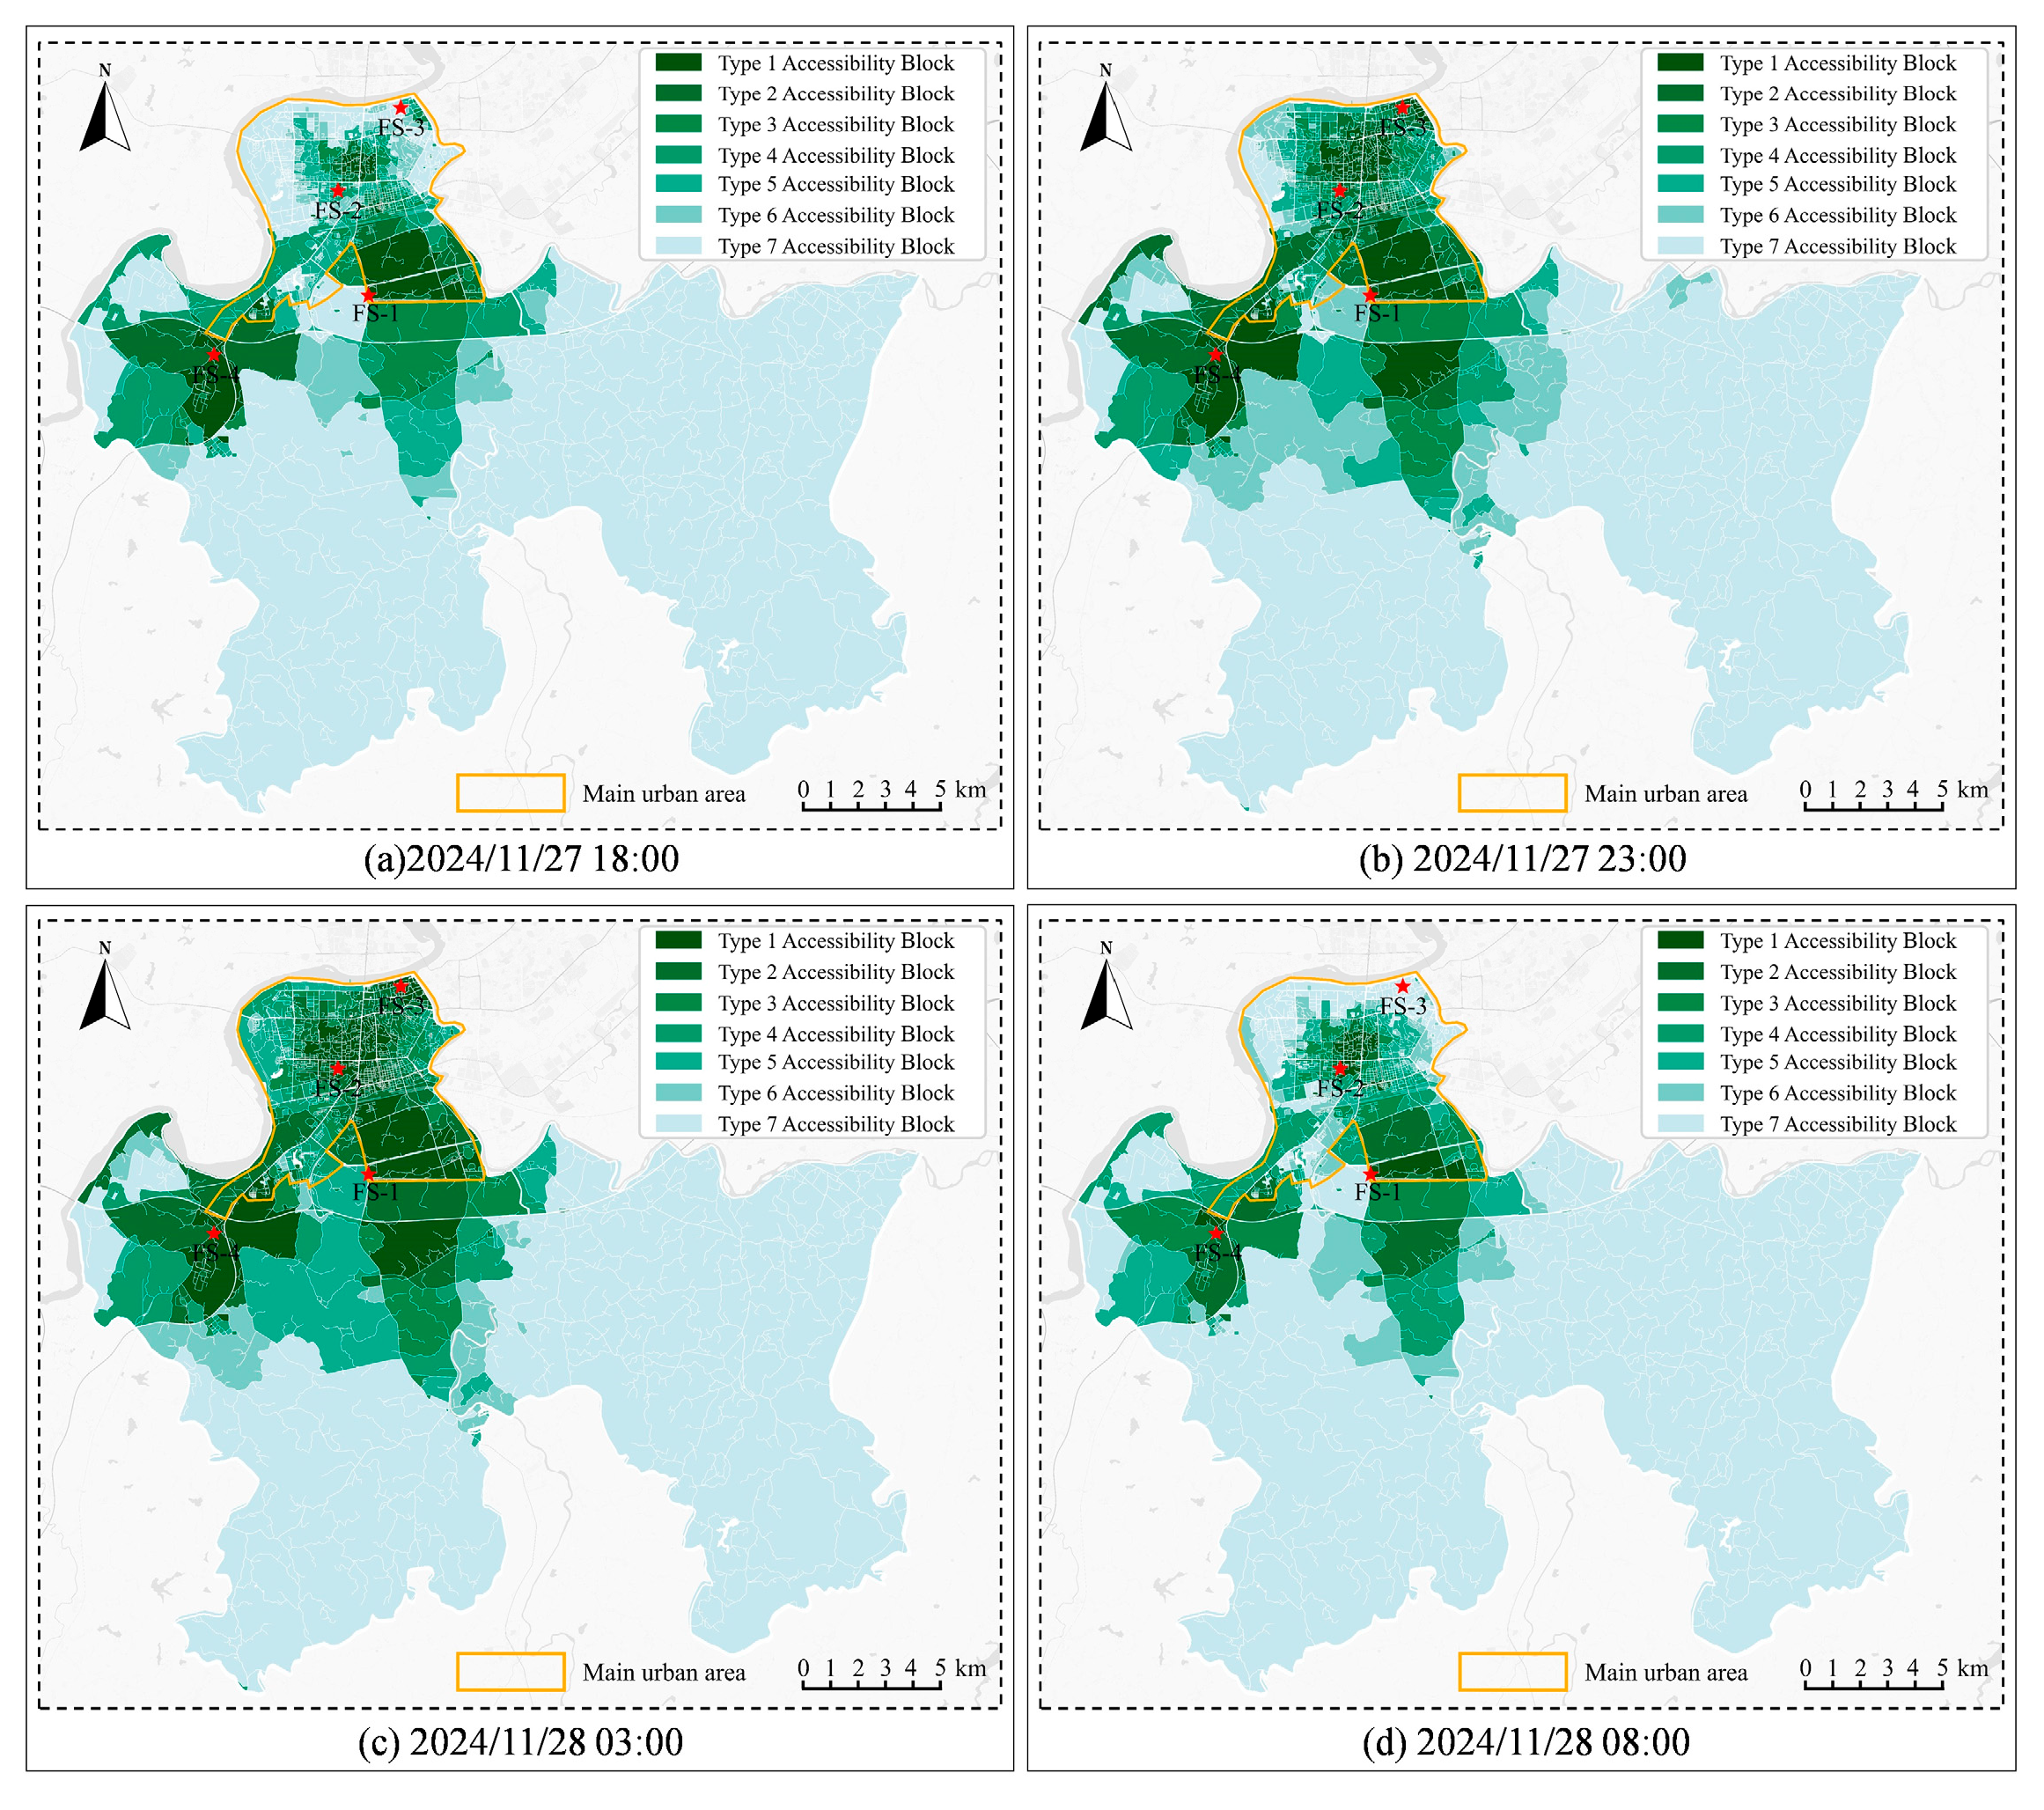
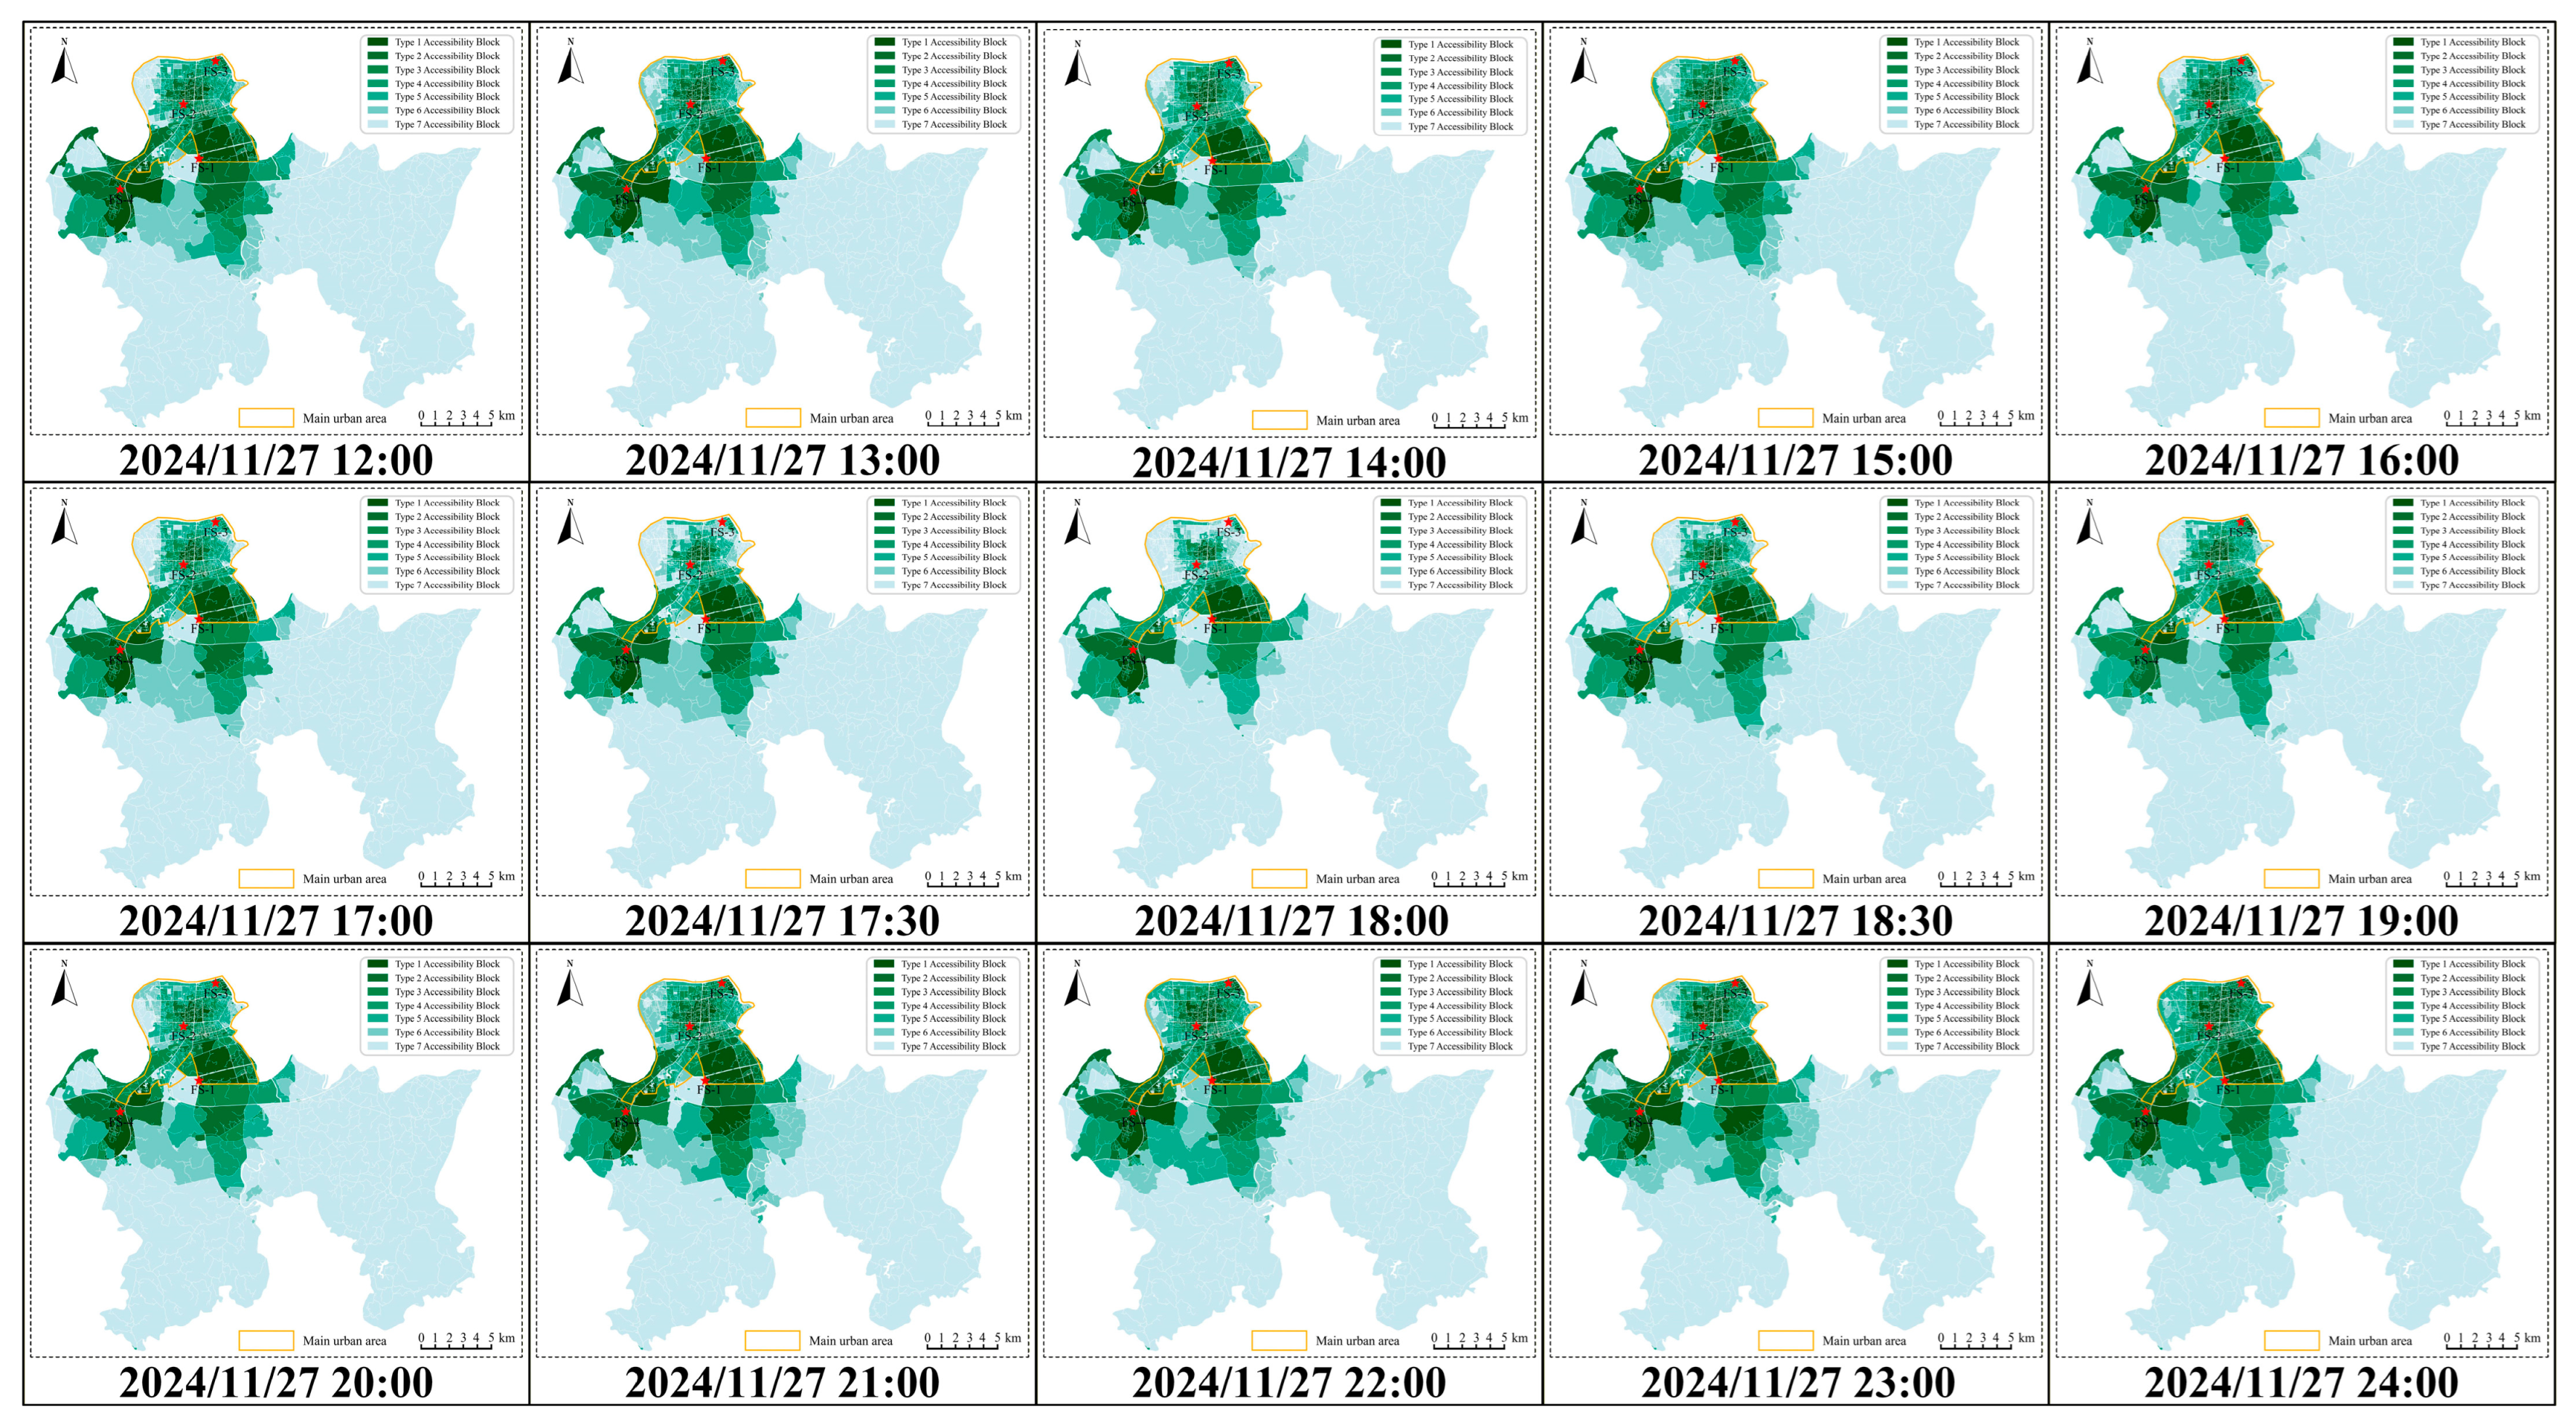
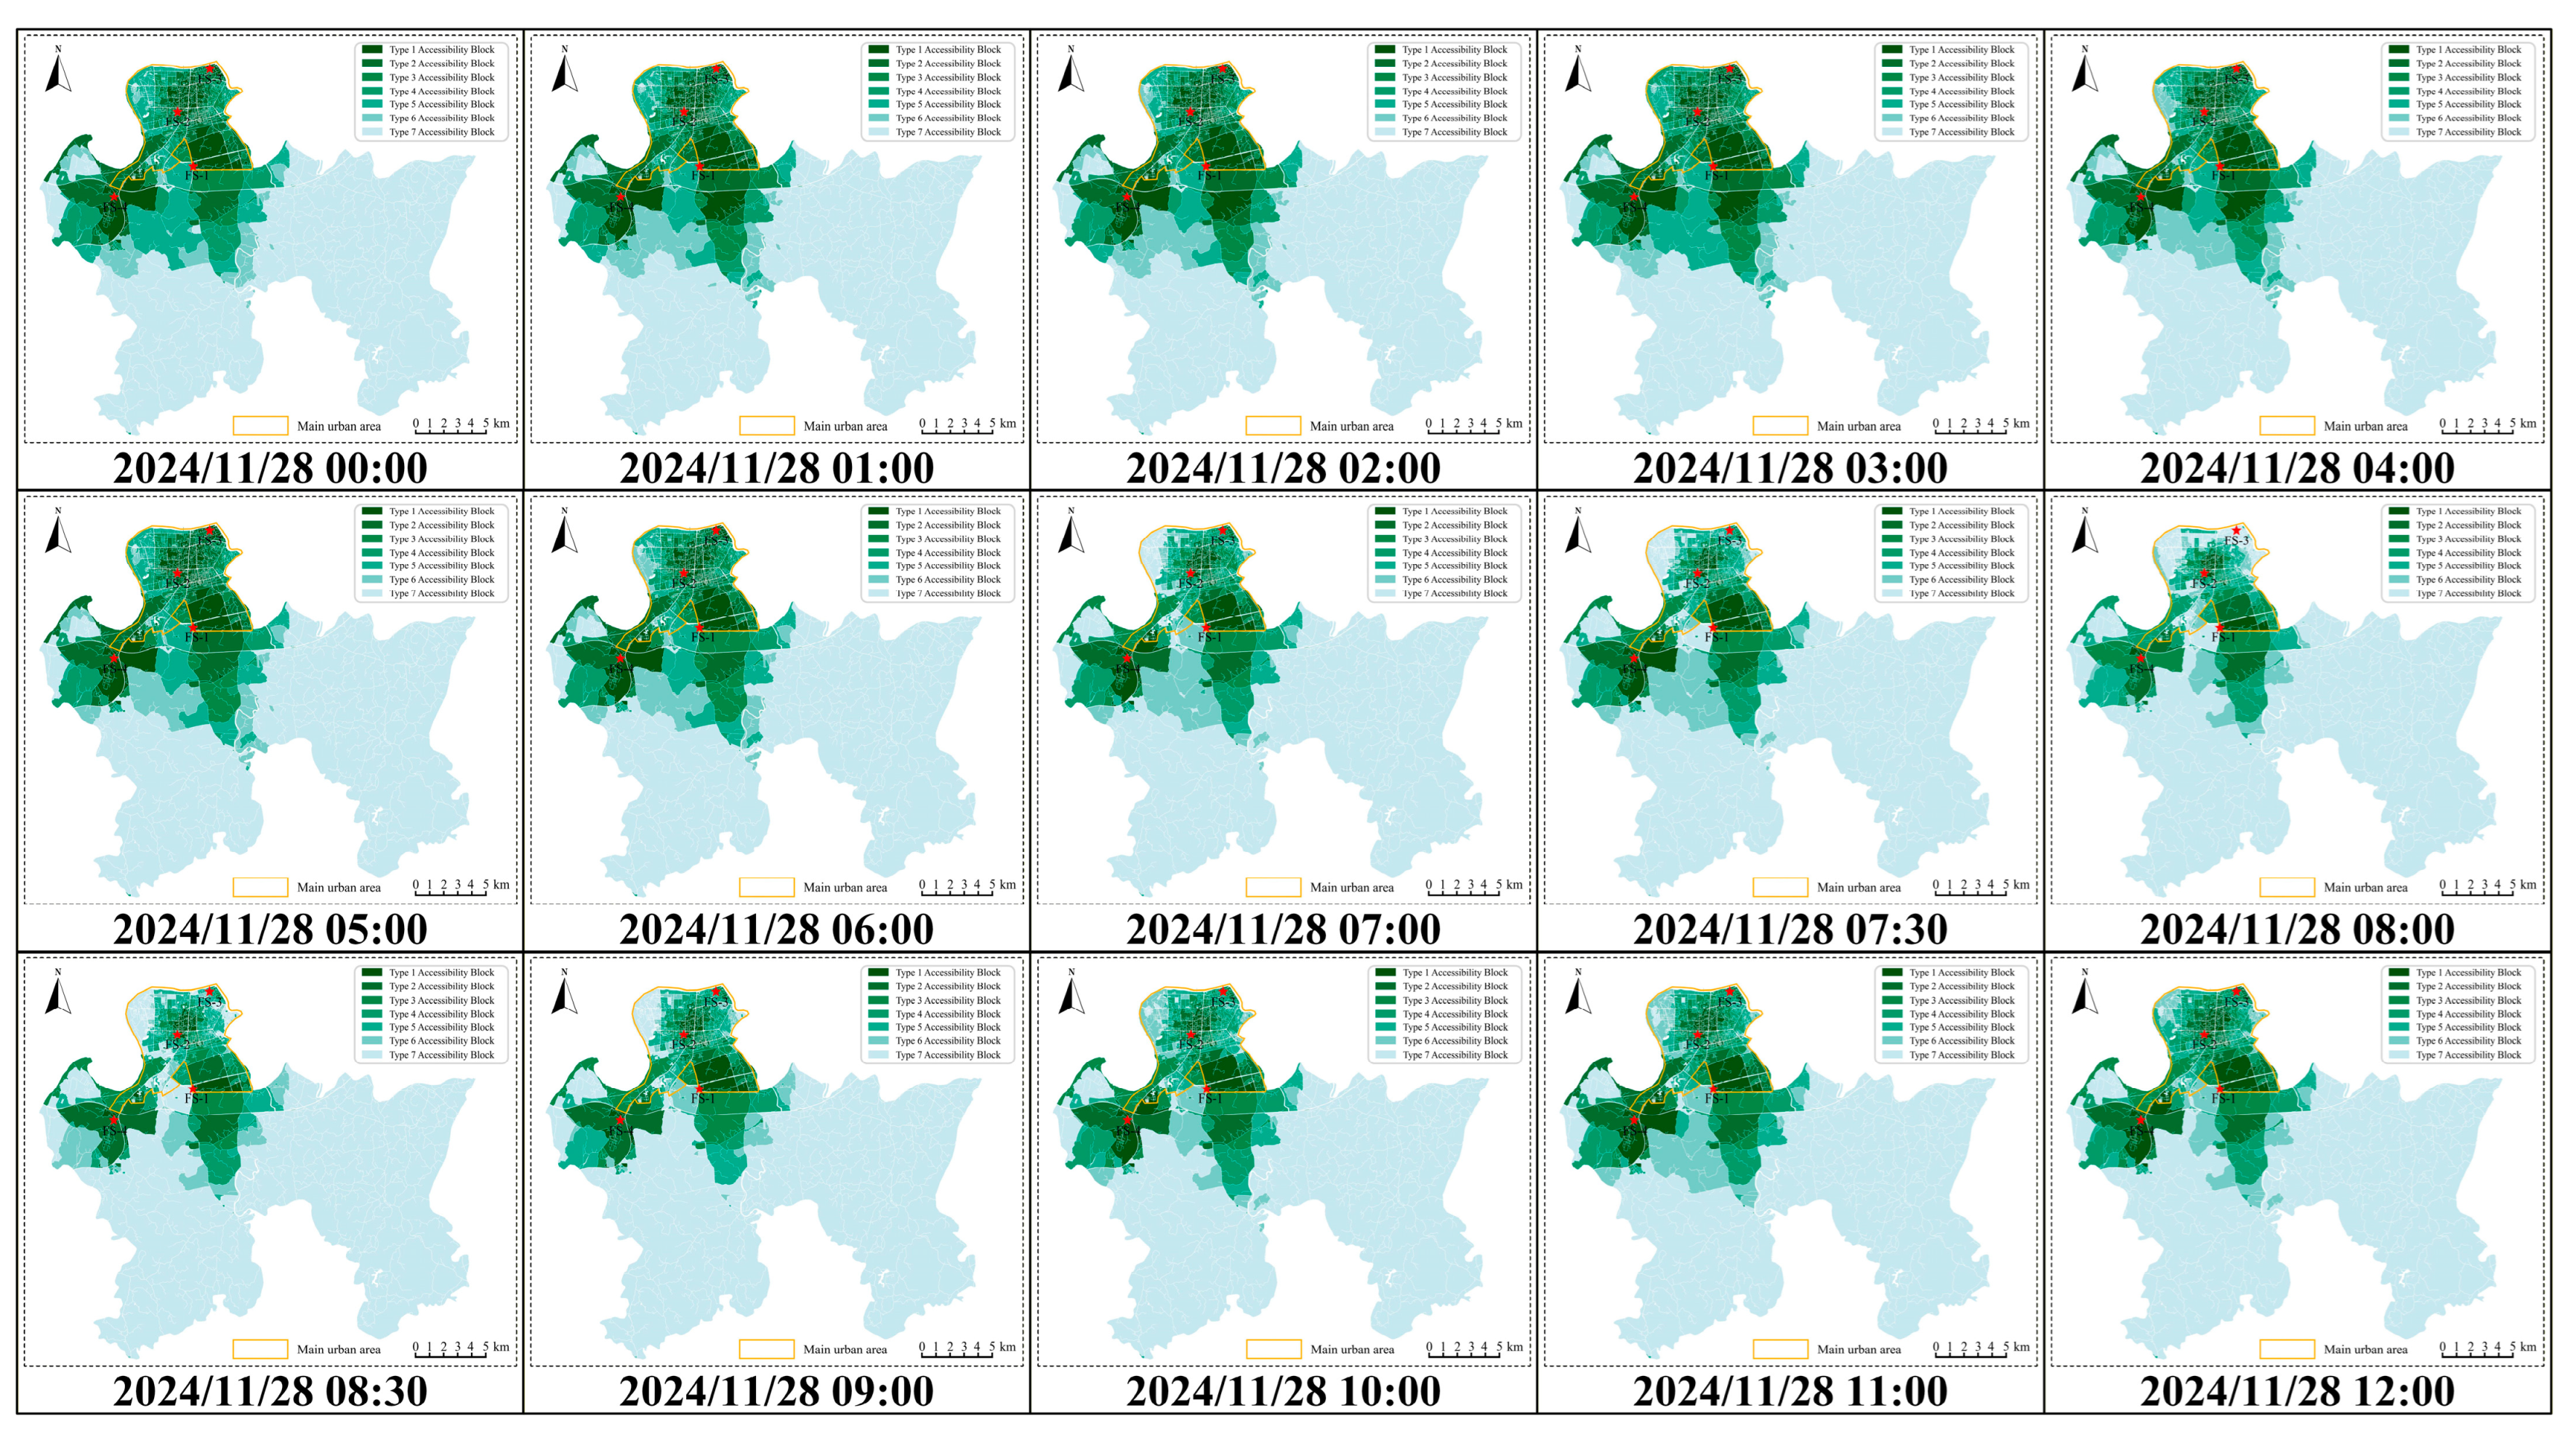
The accessibility types of the study area under four typical estimation scenarios are shown in
Figure 11 (detailed data are provided in
Appendix B and
Appendix D). During the peak commuting hours (8:00 on 28 November 2024), accessibility is at its worst, indicating that traffic congestion has a particularly significant impact on fire service accessibility. Therefore, in situations with high traffic volumes, firefighting resources should be pre-allocated to fire service inaccessible areas to improve the timeliness of firefighting services. In the scenario with the most favorable evaluation results (23:00 on 27 November 2024), the study area’s
BAS7 is 132.125
, which is smaller than that of other evaluation moments, resulting in the shortest overall rescue time of 871.391 s. However, it is important to note that despite better traffic conditions, other fixed influencing factors may still limit accessibility in certain areas. For example, some regions may require longer travel times due to complex terrain or insufficient road infrastructure.
4.2. Firefighting Response Zone Analysis
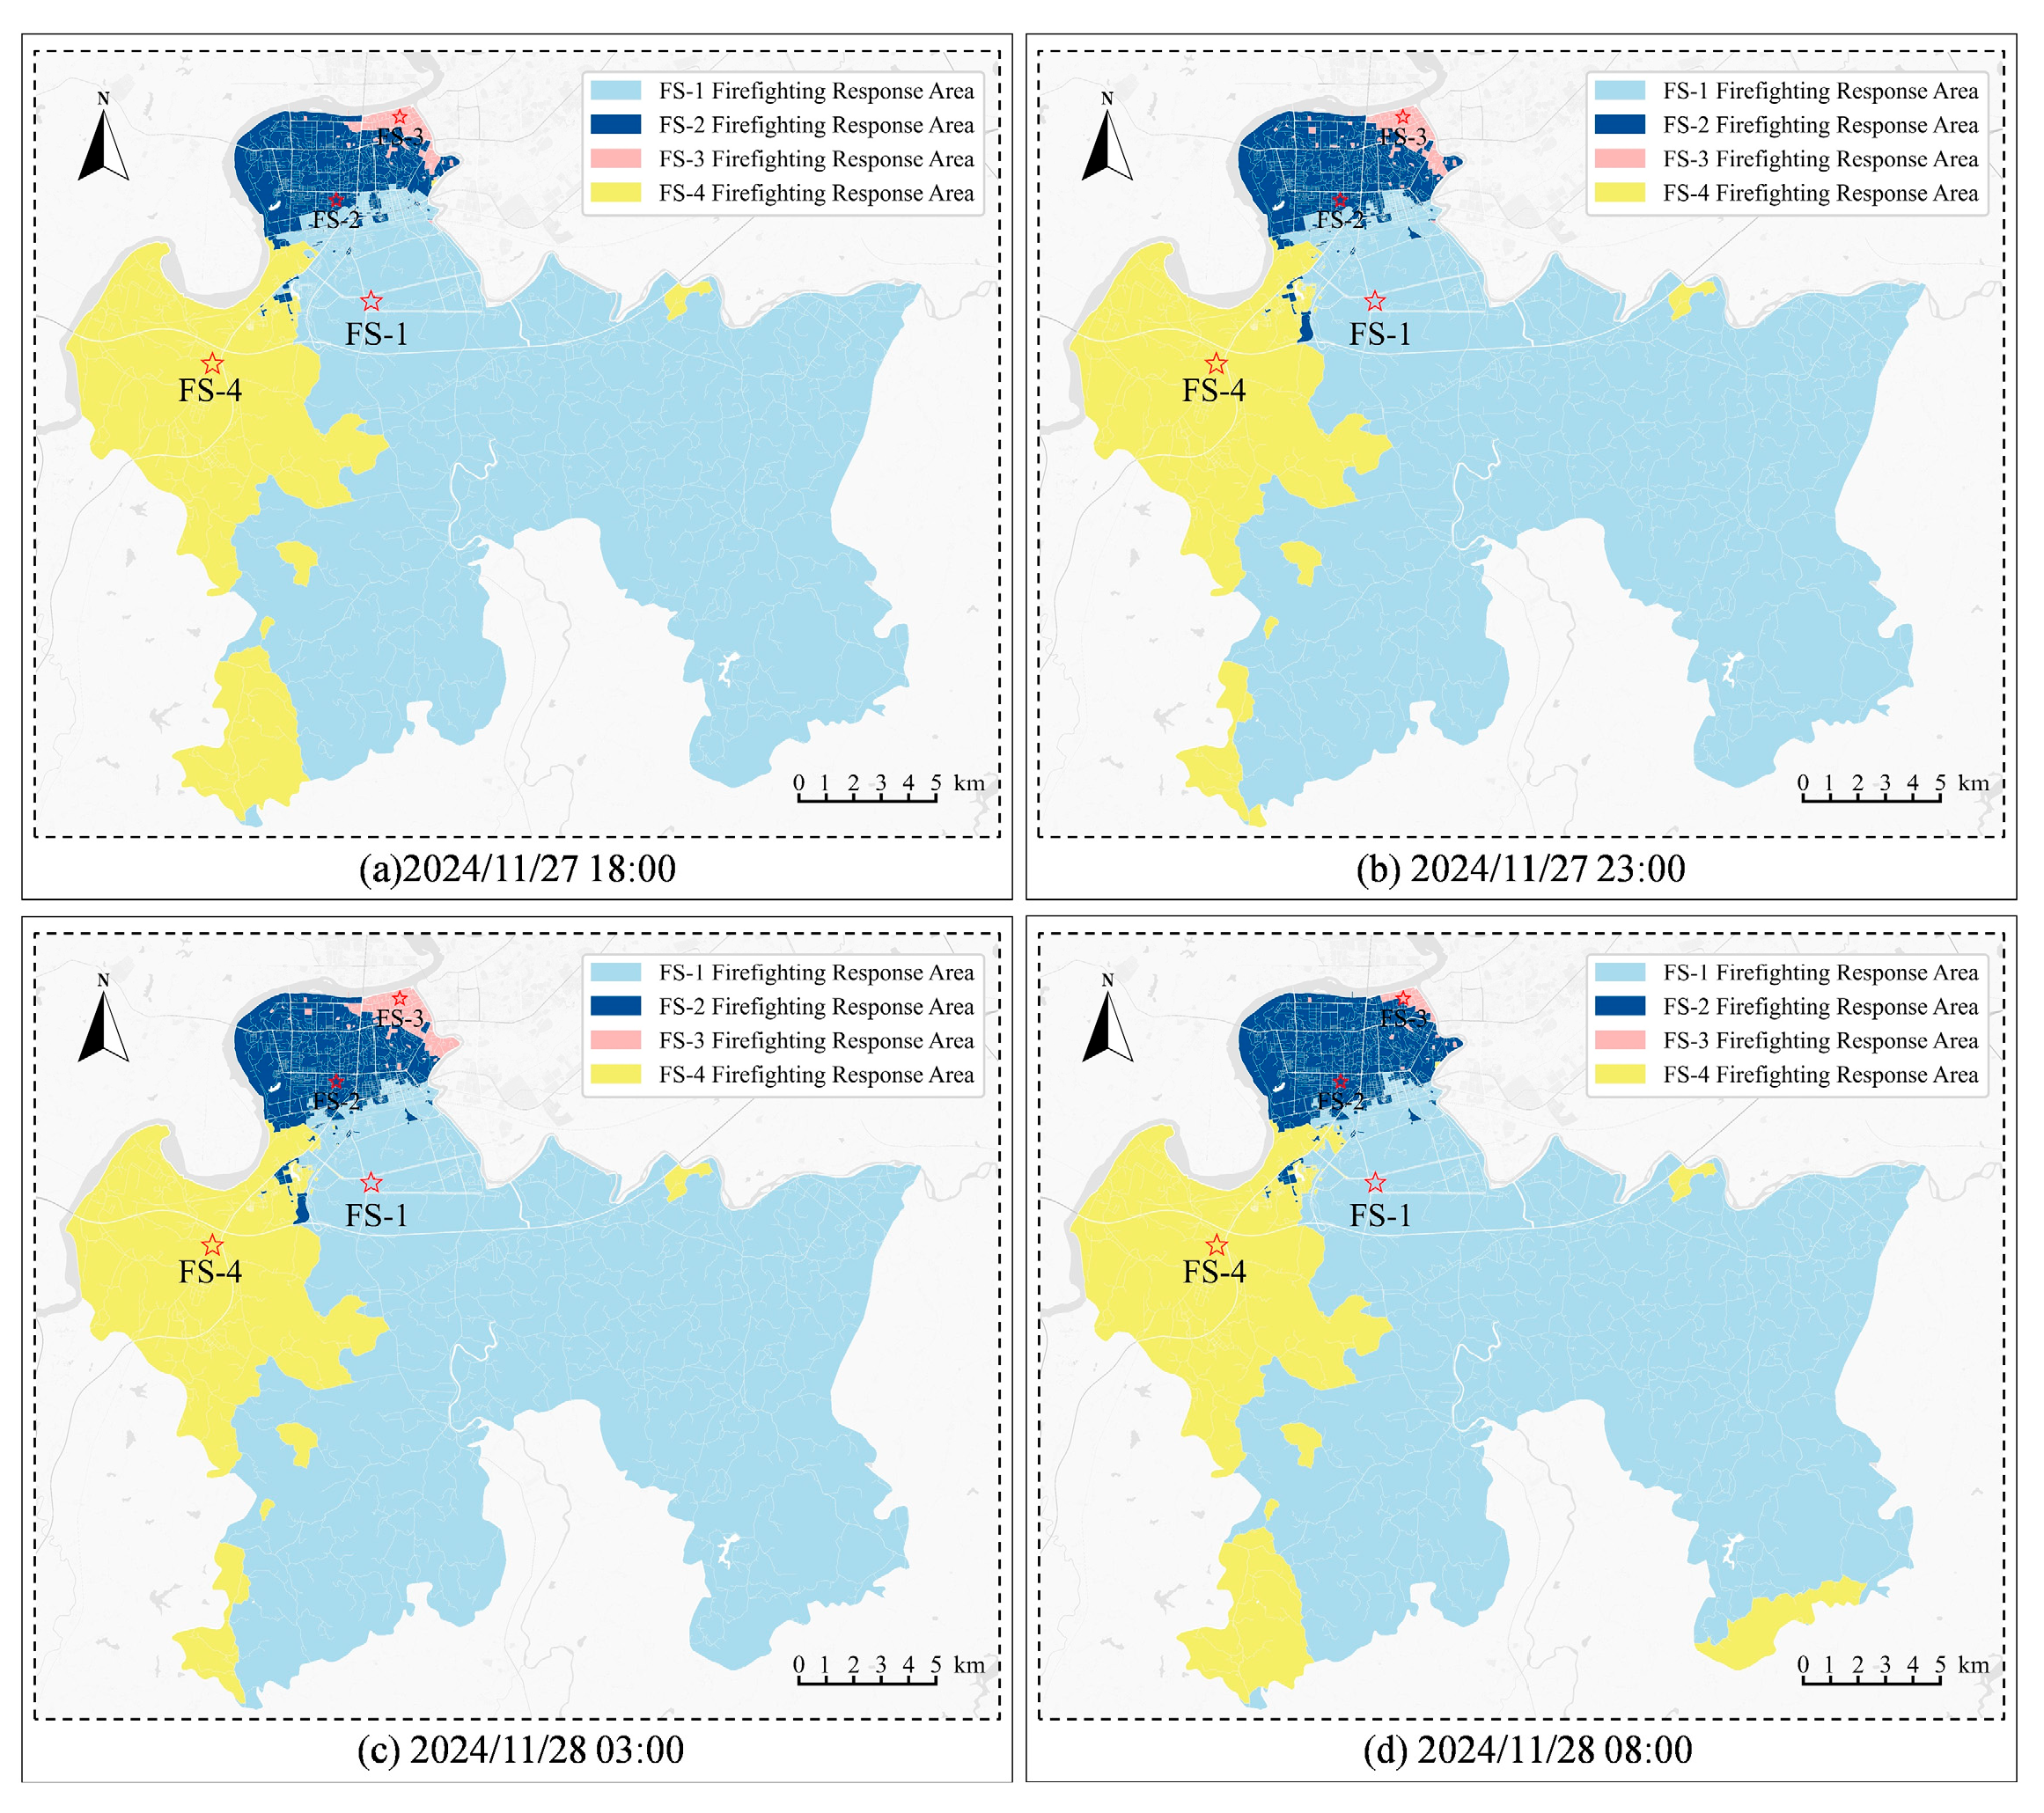
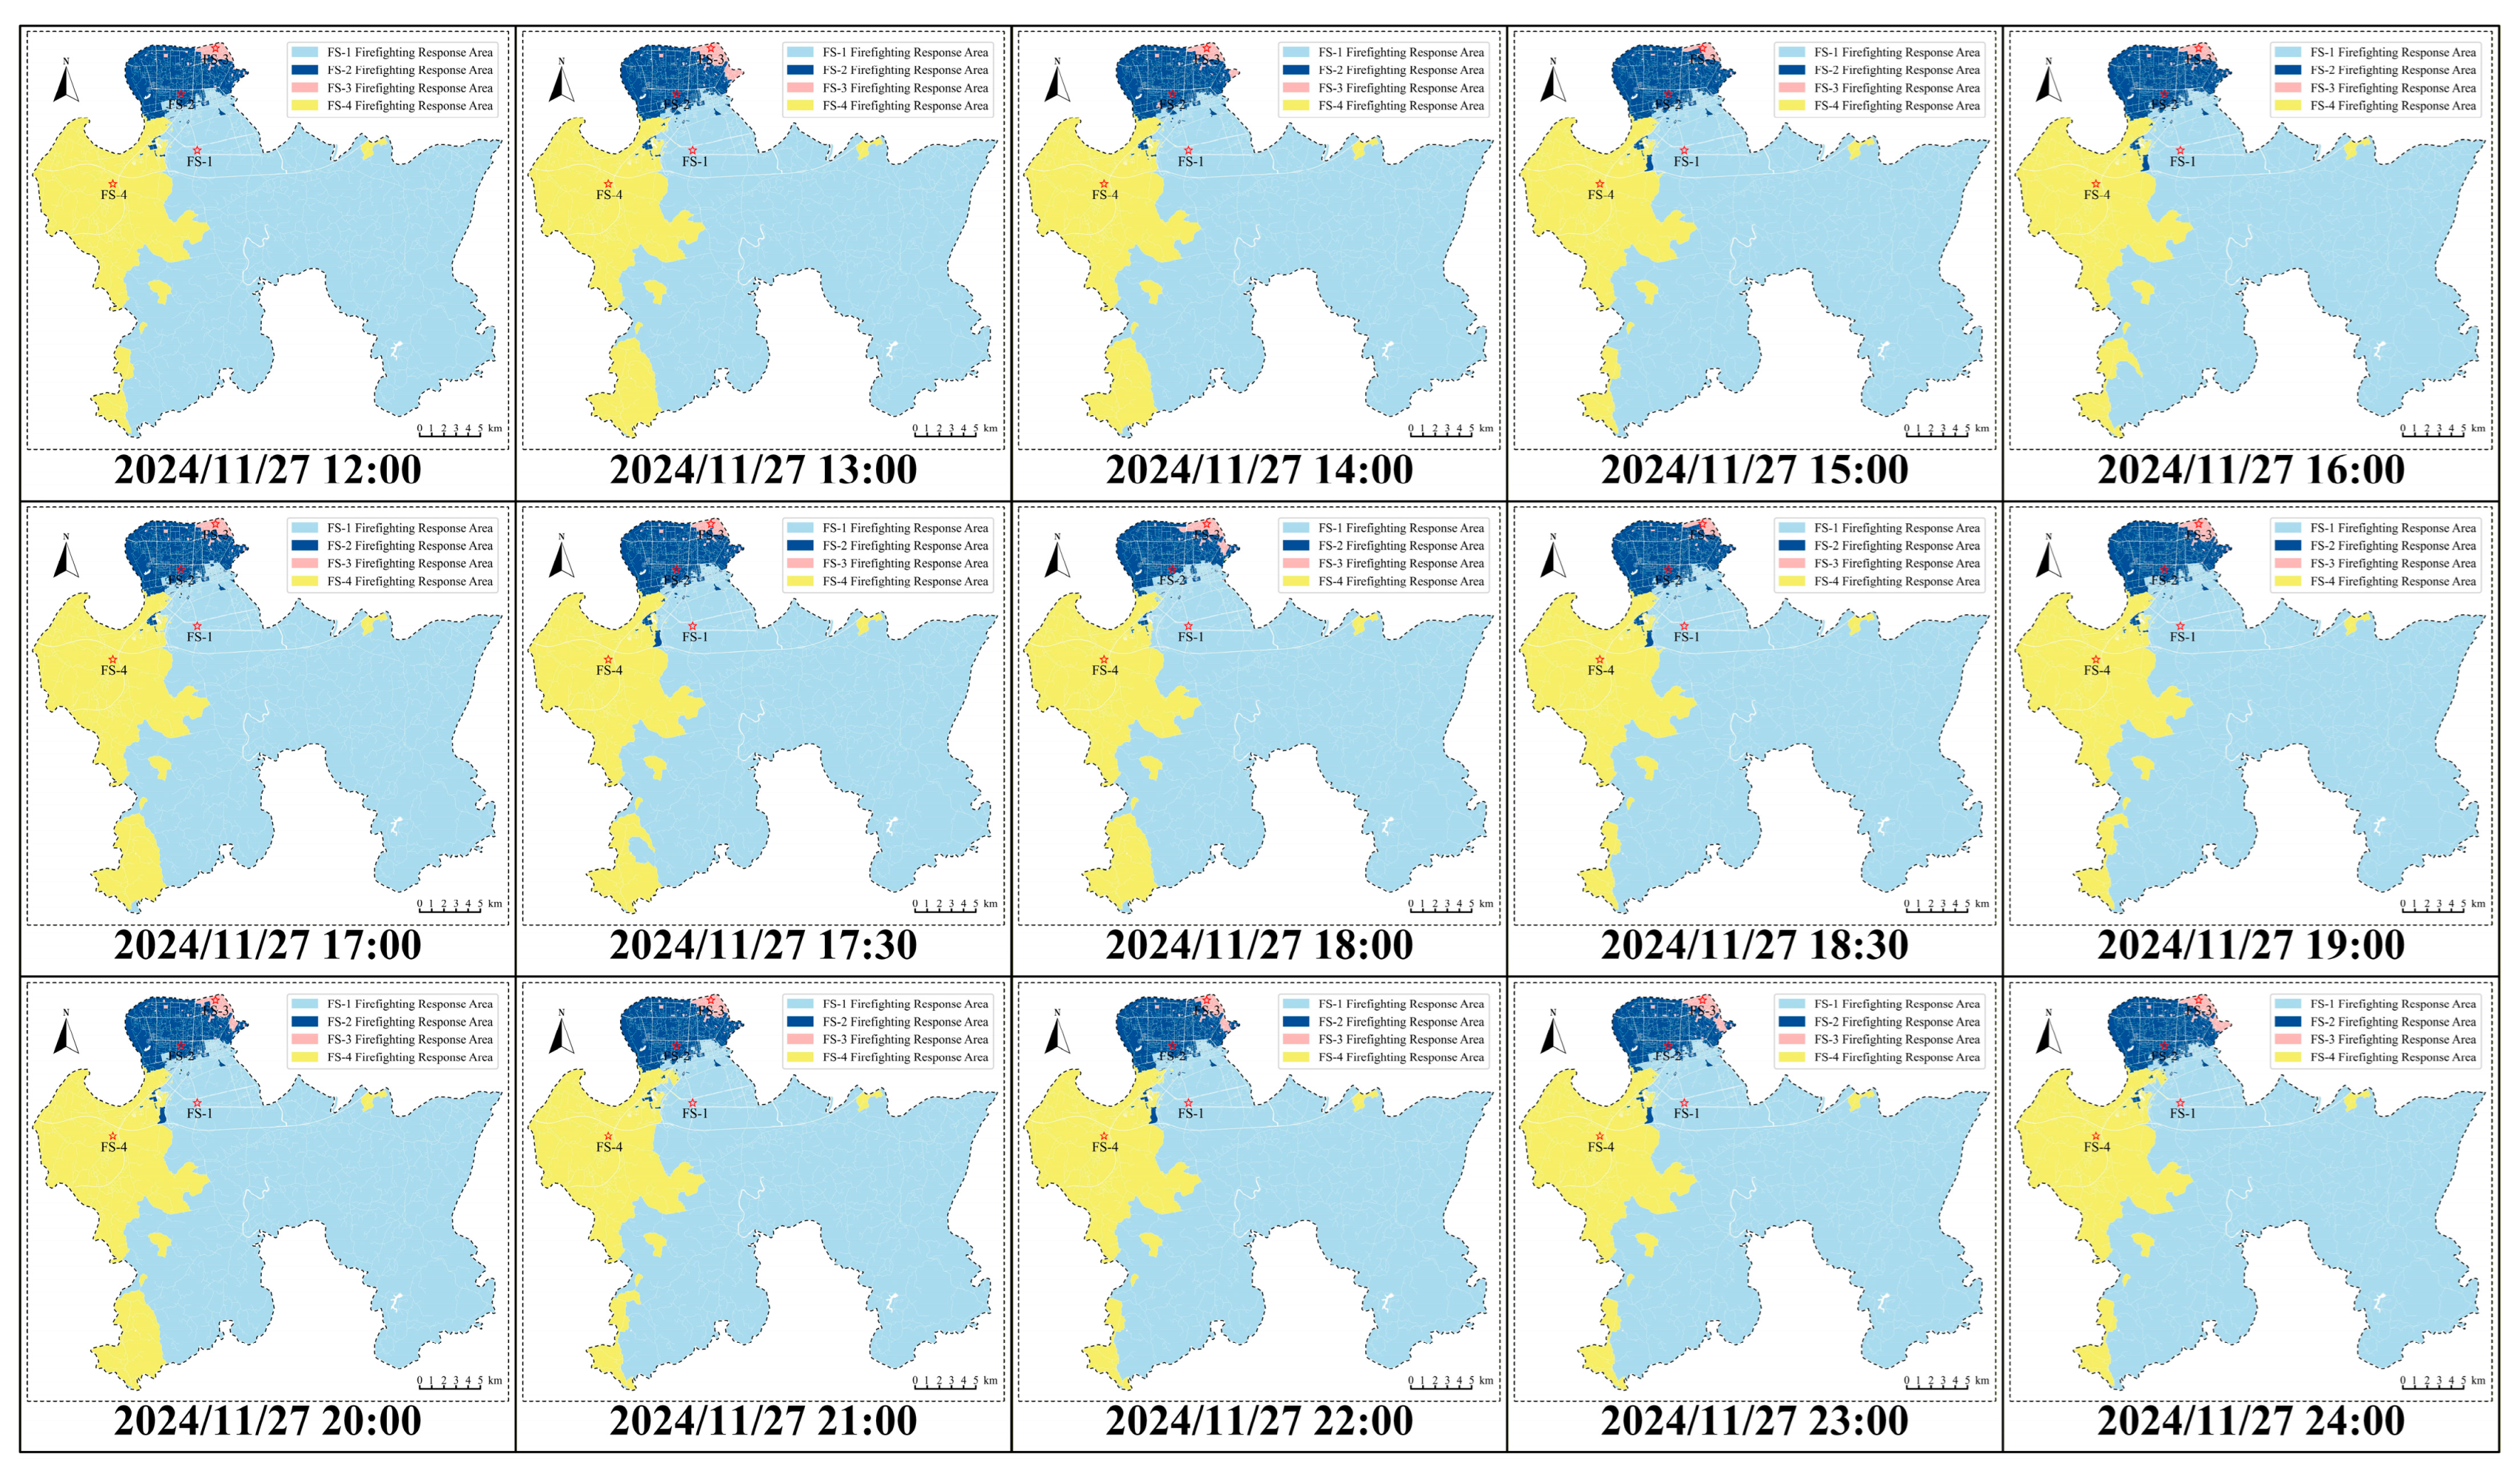
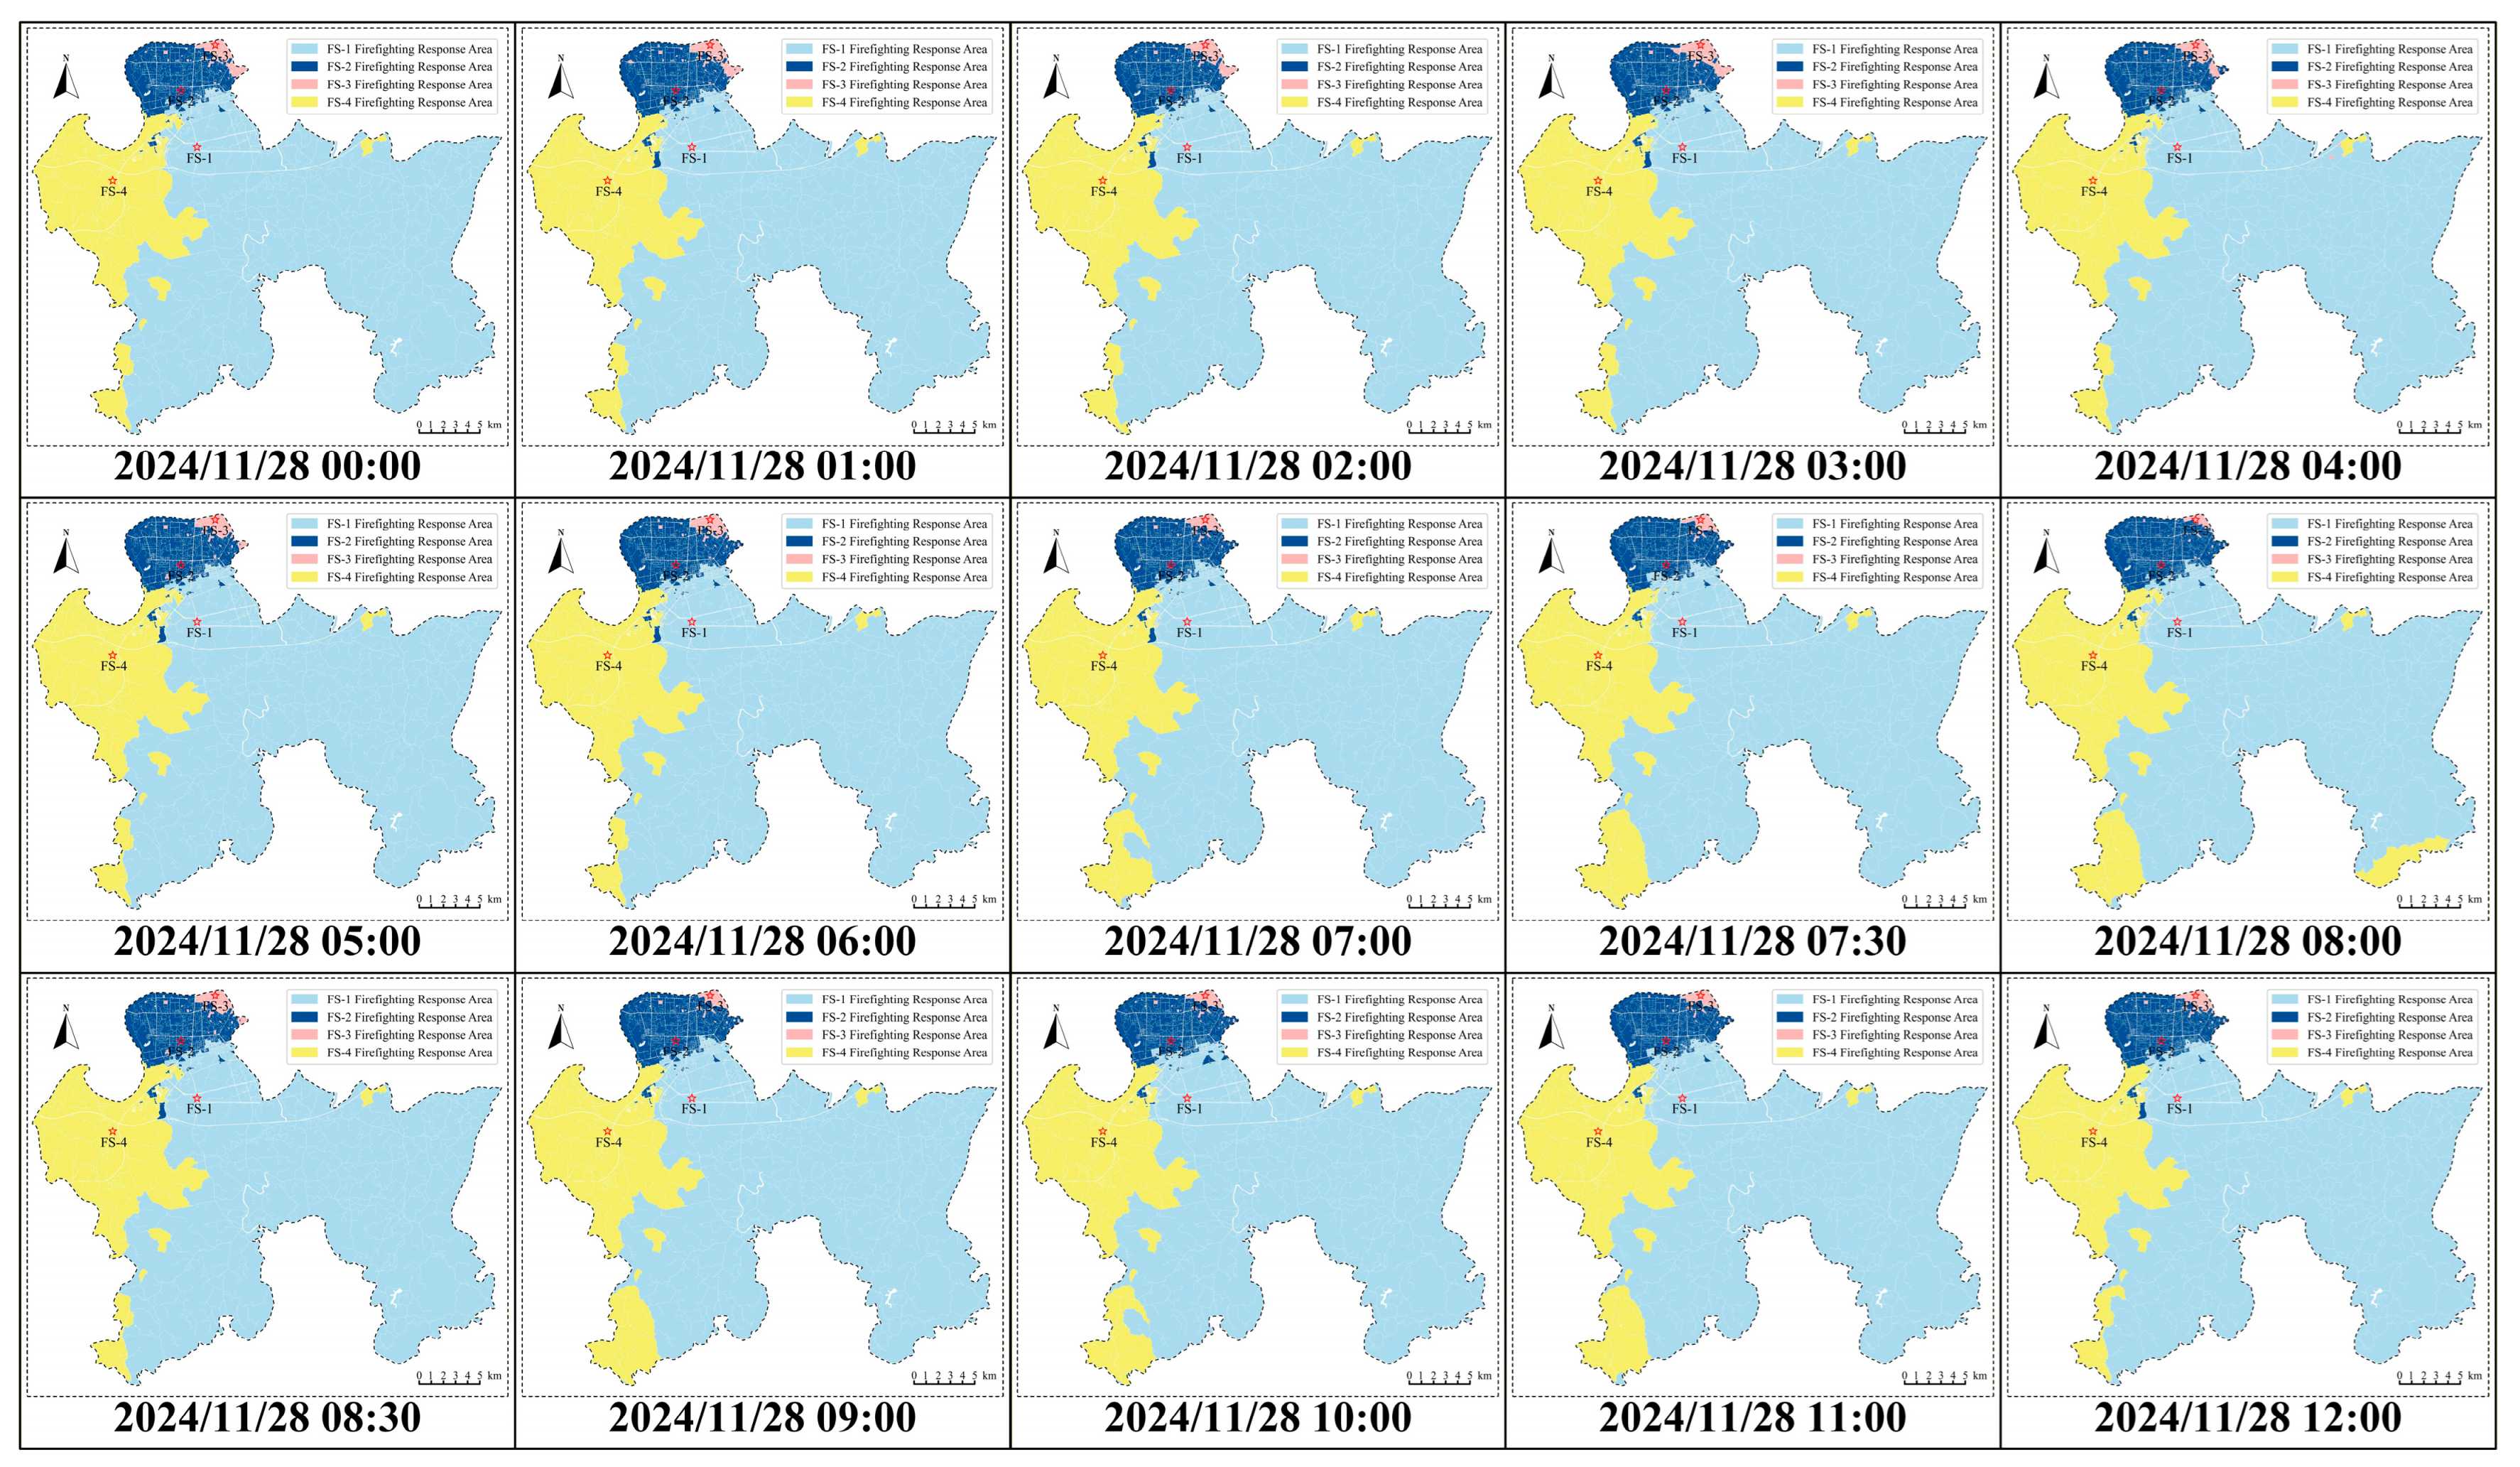
Due to variations in traffic flow and road conditions, the delineation of fire station response zones exhibits significant differences across different time periods. The delineation of firefighting response zones under typical estimation scenarios is illustrated in
Figure 12 (additional detailed data are provided in
Appendix C and
Appendix E). Some fire stations, such as FS-3, are located near major thoroughfares in the urban core and are significantly influenced by real-time traffic conditions, resulting in highly pronounced fluctuations. During nighttime, due to lower traffic volumes and relatively stable road conditions, the delineation of response zones shows minimal variation, indicating relatively stable fire service accessibility and more balanced coverage by fire stations. In contrast, during daytime, especially during peak hours, the substantial increase in traffic flow leads to congestion and reduced traffic efficiency, causing greater variability in the delineation of response zones. This variation suggests that during peak periods, the accessibility of some fire stations is constrained, potentially hindering their ability to promptly cover remote or traffic-congested areas.
During morning and evening rush hours, fire departments should focus on high-traffic areas. Temporary adjustments to response zones may be necessary. Other measures, such as setting up temporary rescue stations or optimizing traffic flow, can also improve peak-hour response efficiency. This approach enables fire departments to more accurately predict and allocate firefighting resources, providing a basis for the dynamic management of urban fire facilities. It is suggested that urban planning incorporate factors such as traffic flow and road conditions to develop a flexible firefighting network, ensuring rapid response and efficient coverage across different time periods.
TBAT(
u) denotes the time-weighted average travel time from the nearest fire station to block unit
u, representing its long-term fire service accessibility under varying real-time traffic conditions.
TBAD(
u) and
TBAV(
u) represent the corresponding travel distance and speed for block unit
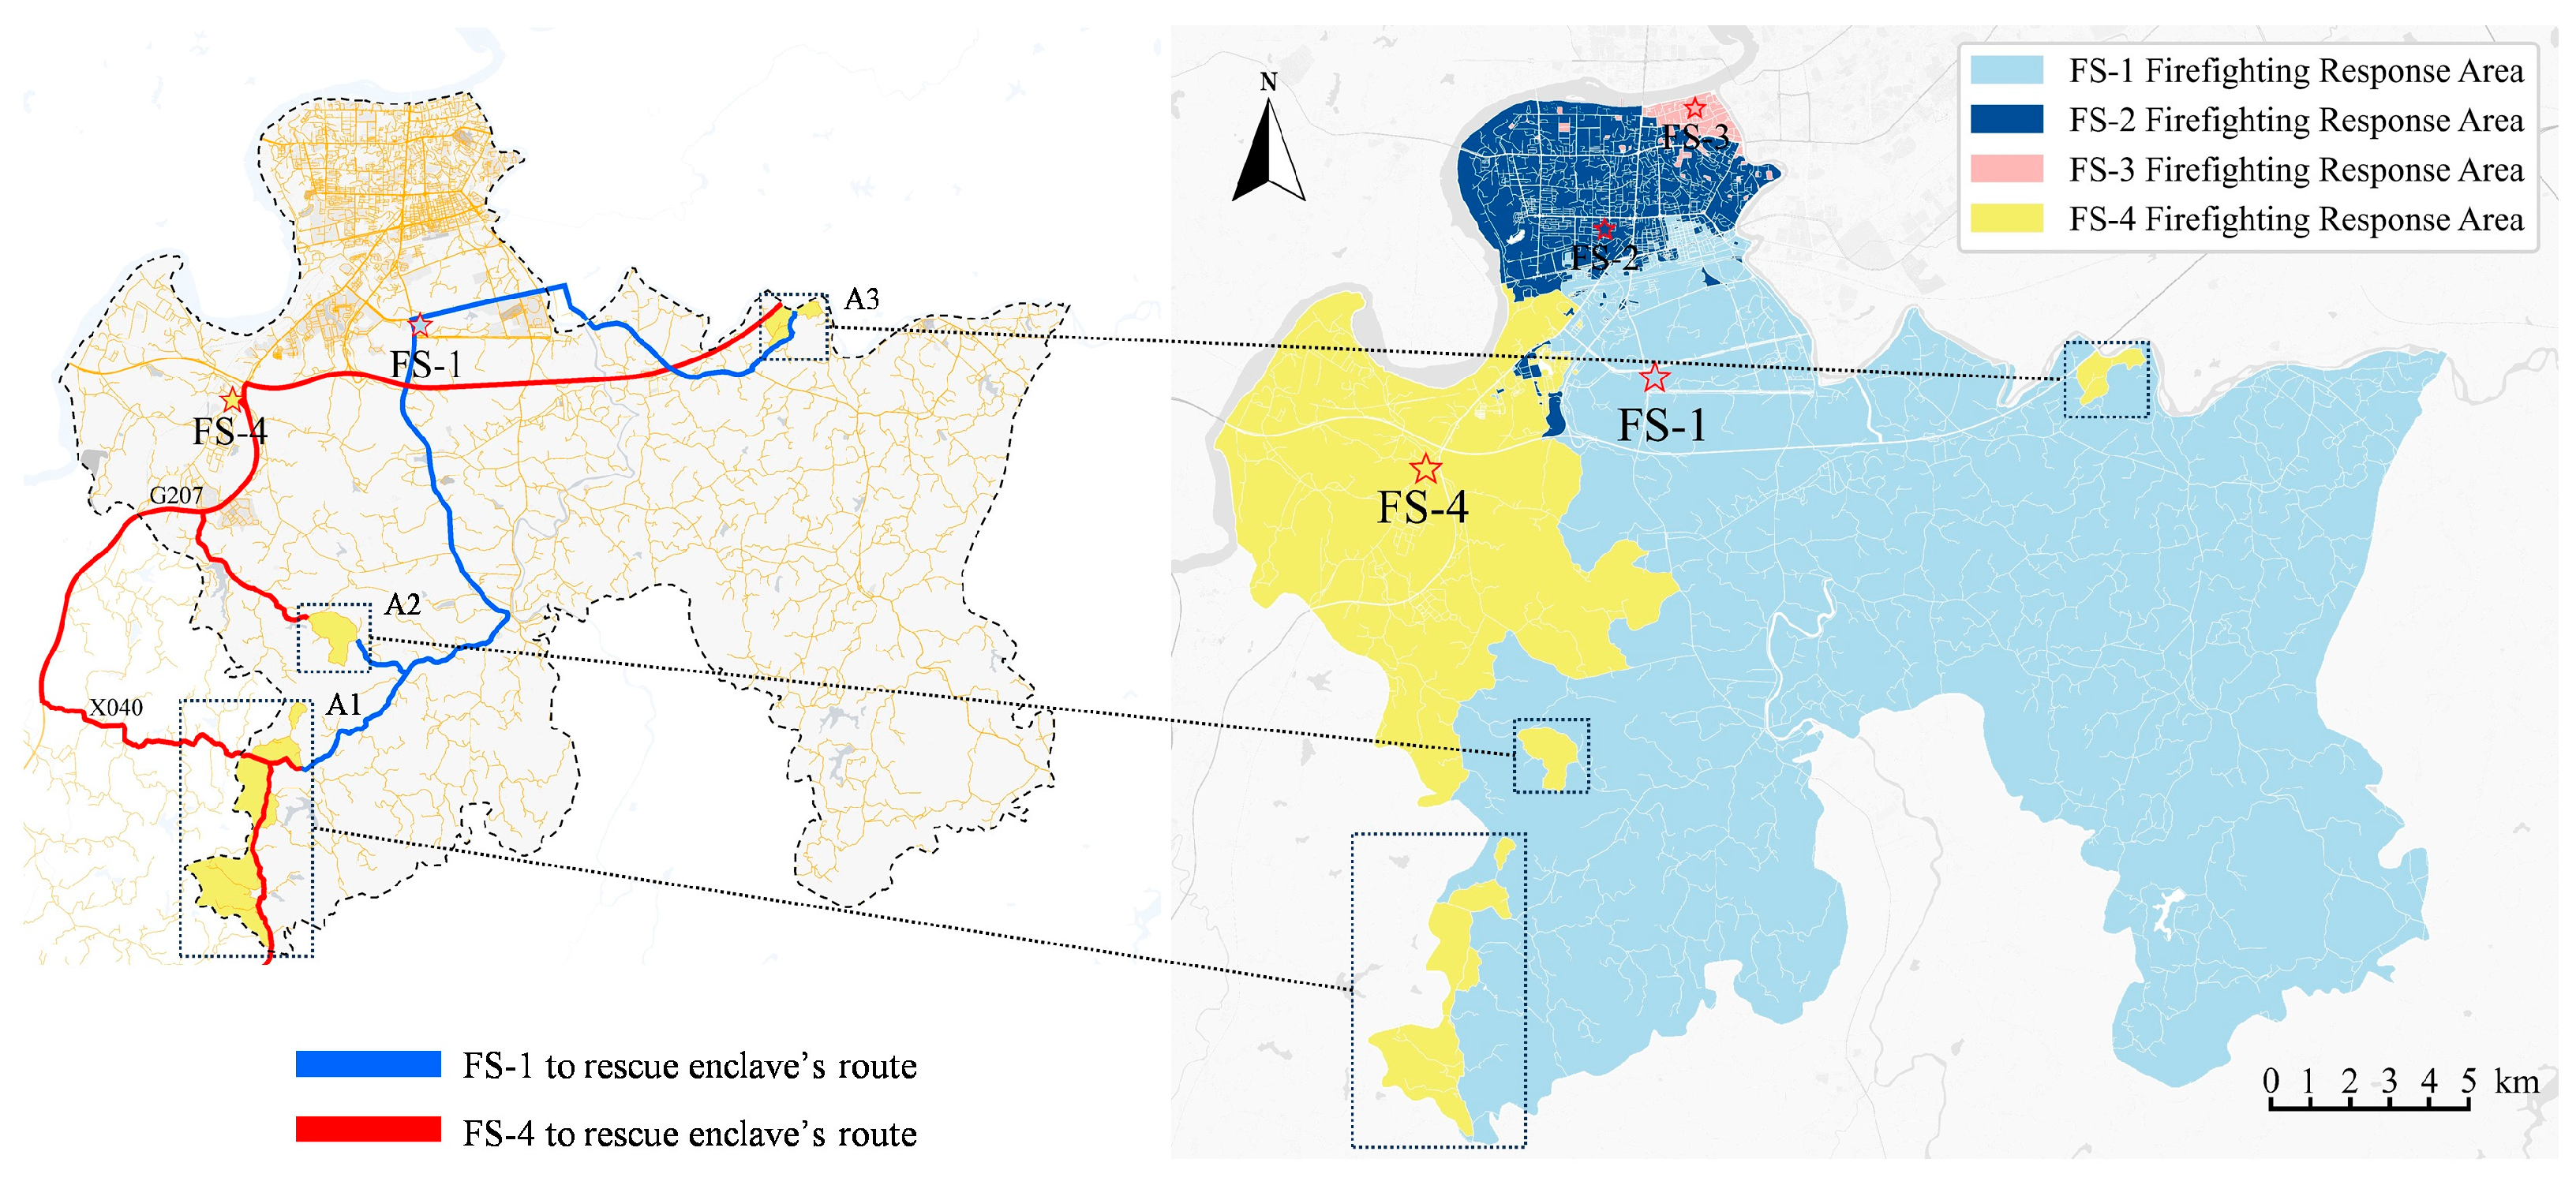
u, respectively. Response zones for each fire station are delineated based on the
TBAT of individual blocks (see
Figure 13). The delineated areas are as follows:
SFR-1 is 156.243 km
2,
SFR-2 is 11.395 km
2,
SFR-3 is 1.067 km
2, and
SFR-4 is 39.761 km
2. FS-1 has the largest response zone. This is likely due to its central location. It can reach most blocks in less time and cover a wider area. Therefore, future fire station sites should prioritize locations near transportation hubs or urban centers. This would improve coverage and service efficiency. In contrast, the smaller response zones of FS-2, FS-3, and FS-4 indicate that their accessibility is constrained by geographical or traffic-related factors. To address this, measures such as optimizing the transportation network or enhancing traffic control strategies may be necessary to improve the accessibility of these stations. The smallest response zone of FS-3 is located in the urban center, where traffic conditions are constrained, resulting in weaker accessibility compared to other fire stations. Its position at the edge of the region, coupled with its proximity to a river, further limits its coverage, making it the least effective in terms of area served.
As observed in
Figure 13, the response zones of multiple street units exhibit significant differences compared to their surrounding areas. For example, within the marked region of the study area, there are several non-contiguous, isolated block units. Through calculations, these units are assigned to the response zone of FS-4, while the surrounding blocks are all assigned to FS-1. This phenomenon is categorized as “rescue enclaves.” Rescue enclaves refer to areas that are not directly adjacent to a fire station but still fall within the effective rescue range. These areas benefit from higher traffic efficiency in certain road network structures, allowing fire trucks to reach them within the target travel time. Taking A1 as an example, the travel time from FS-4 via G207 to X040 is approximately 15 min, whereas it takes about 31 min from FS-1. The response velocity of FS-4 is twice that of FS-1. Therefore, these areas are geographically located within the response zone of FS-4, and their actual response times are significantly better than those of the surrounding blocks.
Rational resource allocation is crucial for enhancing the efficiency of regional firefighting services. The allocation of firefighting resources should be specifically tailored based on the area of each fire station’s response zone. For fire stations with larger response zones, such as FS-1 and FS-4, which are located near the central areas of the region, resource allocation should focus on strengthening equipment and personnel reserves to ensure coverage of a broader area. In contrast, for fire stations with smaller response zones, such as FS-2 and FS-3, which are situated in urban areas and significantly affected by real-time traffic conditions, resource allocation should prioritize improving accessibility, especially in areas with complex or restricted traffic. This can be achieved by adjusting personnel distribution, establishing rapid response teams, and deploying additional mobile resources during high-demand periods. Furthermore, for areas with high traffic volumes and traffic bottlenecks, firefighting resources should be dynamically adjusted based on real-time fire service accessibility to ensure timely responses in emergencies. This approach will enhance the sustainability and responsiveness of urban firefighting services.
4.3. Suggestion
Traditional GIS-based studies rely on static road network data. Such data cannot capture real-time traffic dynamics [
24]. To address this limitation, this study proposes a dynamic block-unit-based method. It integrates real-time traffic data with advanced spatial analysis. This study emphasizes the critical role that dynamic traffic conditions play in exacerbating these disparities. The analysis indicates that response times in urban areas increase by 20–30% during peak hours, while rural regions experience even greater delays due to limited road infrastructure and geographical barriers. These findings highlight the necessity of implementing dynamic resource allocation strategies that account for real-time traffic conditions.
Furthermore, fire stations situated in traffic-congested urban cores were found to have smaller effective service zones than those in peripheral areas, indicating that urban centrality does not necessarily ensure better accessibility under real-time conditions. Significant temporal fluctuations in response zones also underscore the necessity of dynamic zoning strategies, particularly for managing congestion during peak periods. This study thus reveals that fire service accessibility is shaped not only by spatial proximity but also by real-time traffic dynamics, challenging traditional assumptions about location advantage and response efficiency. In addition, the spatial layout of existing fire stations affects the delineation of response zones and overall accessibility, especially when stations are located near administrative boundaries, where their service capacity may be partially constrained.
Through the stratification of fire service accessibility in Daxiang District, it is evident that the current fire service accessibility in the area is suboptimal, with an uneven distribution of firefighting resources between urban and rural areas. Urgent measures are needed to improve the utilization of firefighting resources, reduce casualties, and minimize property losses. The following suggestions are proposed.
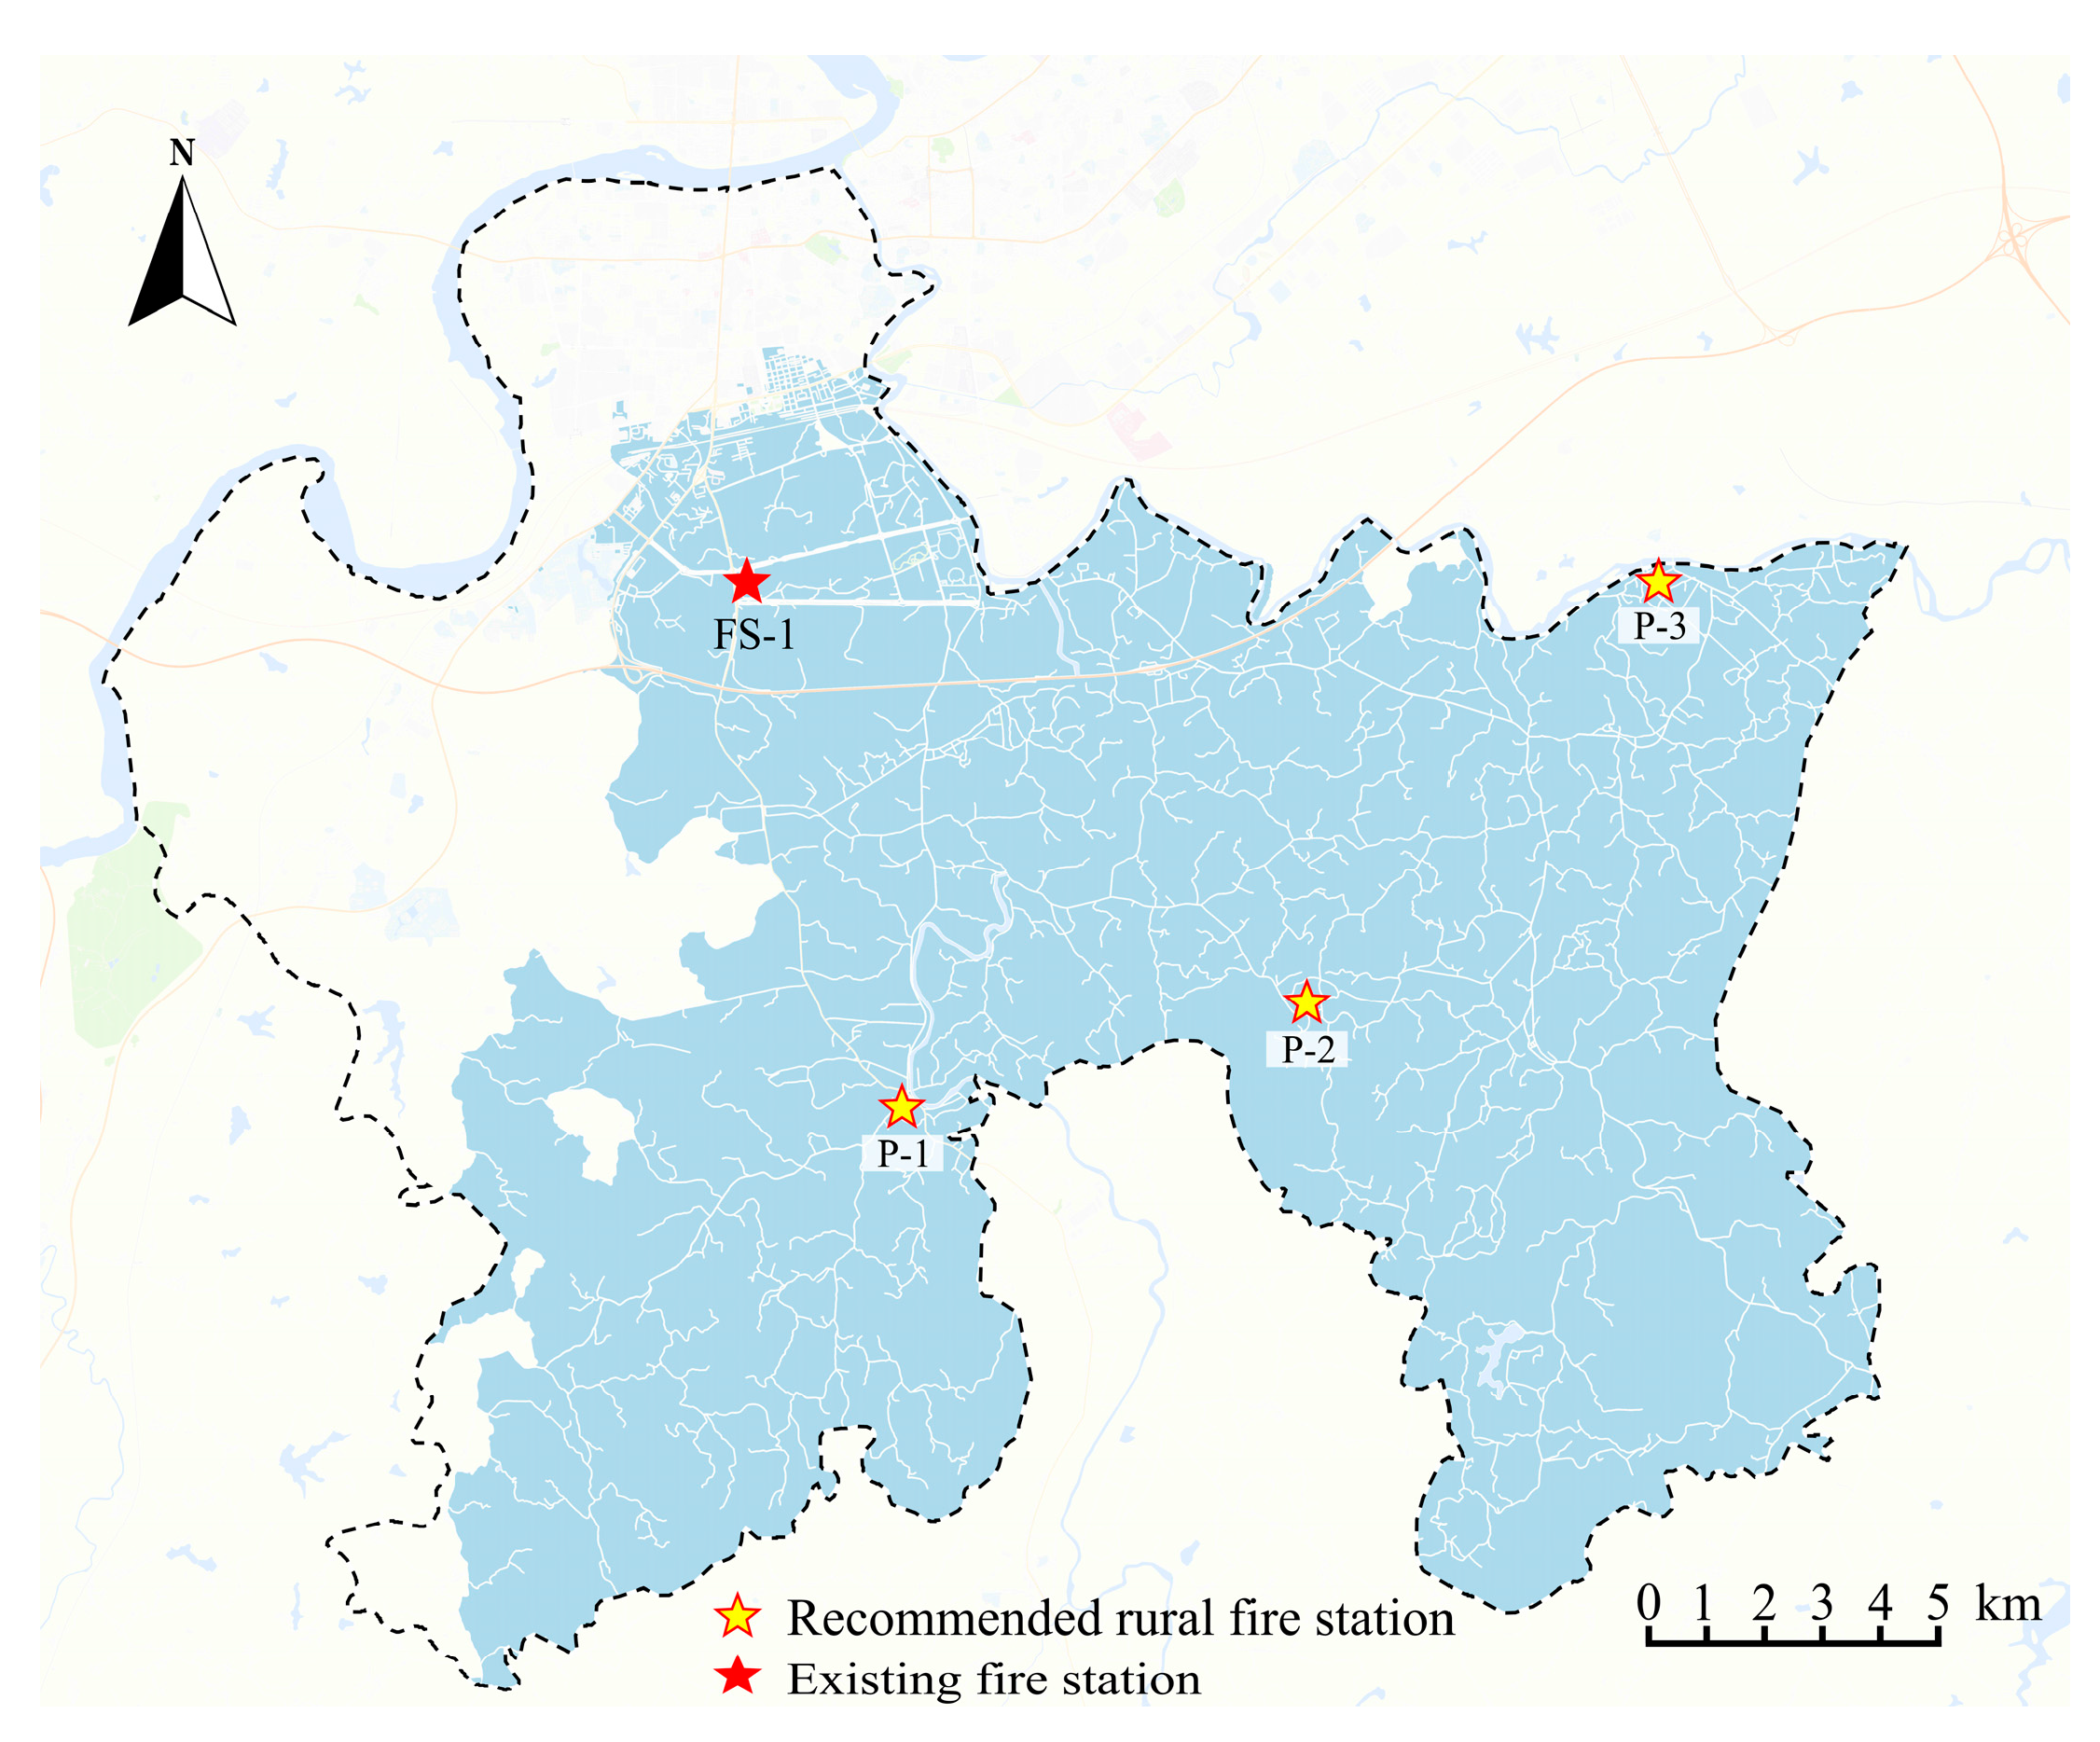
The response zone of FS-1 is the largest, significantly exceeding its originally intended coverage. First, additional fire stations should be established in well-connected location to alleviate the rescue pressure on FS-1 (see
Figure 14). Currently, FS-1’s response zone covers extensive rural areas where firefighting infrastructure is relatively weak, and fire service is inaccessible. Therefore, it is recommended that rural fire stations be established in key townships such as P-1, P-2, and P-3 to enhance emergency response capabilities in these regions. Additionally, the fire safety awareness of rural residents is generally low. Fire safety training and public awareness campaigns should be strengthened, and regular fire drills should be organized to improve residents’ ability to prevent fires and conduct self-rescue.
The majority of FS-2’s response zone is located in urban areas. However, accessibility in these areas is often hindered by typical traffic issues, such as bottleneck roads, back streets, and dead-end roads (see
Figure 10). These road sections are prone to congestion during peak hours, significantly affecting the efficiency of fire truck passage. Therefore, it is recommended that traffic optimization measures be implemented in these congested areas, such as the installation of traffic signals, road widening, or the introduction of one-way traffic systems, to improve the passage efficiency of fire trucks. Additionally, as shown in
Figure 11, the response zones of FS-2 and FS-3 are significantly influenced by real-time traffic conditions, especially during peak hours, where traffic congestion may lead to delays in emergency response. To address this, it is suggested that coordination between FS-2 and FS-3 be strengthened, and dynamic zoning management be implemented. Specifically, during peak hours, certain block units originally assigned to FS-3 could be temporarily managed by FS-2, while during off-peak hours, some blocks under FS-2’s jurisdiction could be handled by FS-3. This dynamic zoning strategy would maximize the utilization efficiency of firefighting resources, ensuring rapid response in emergencies and safeguarding lives and property.
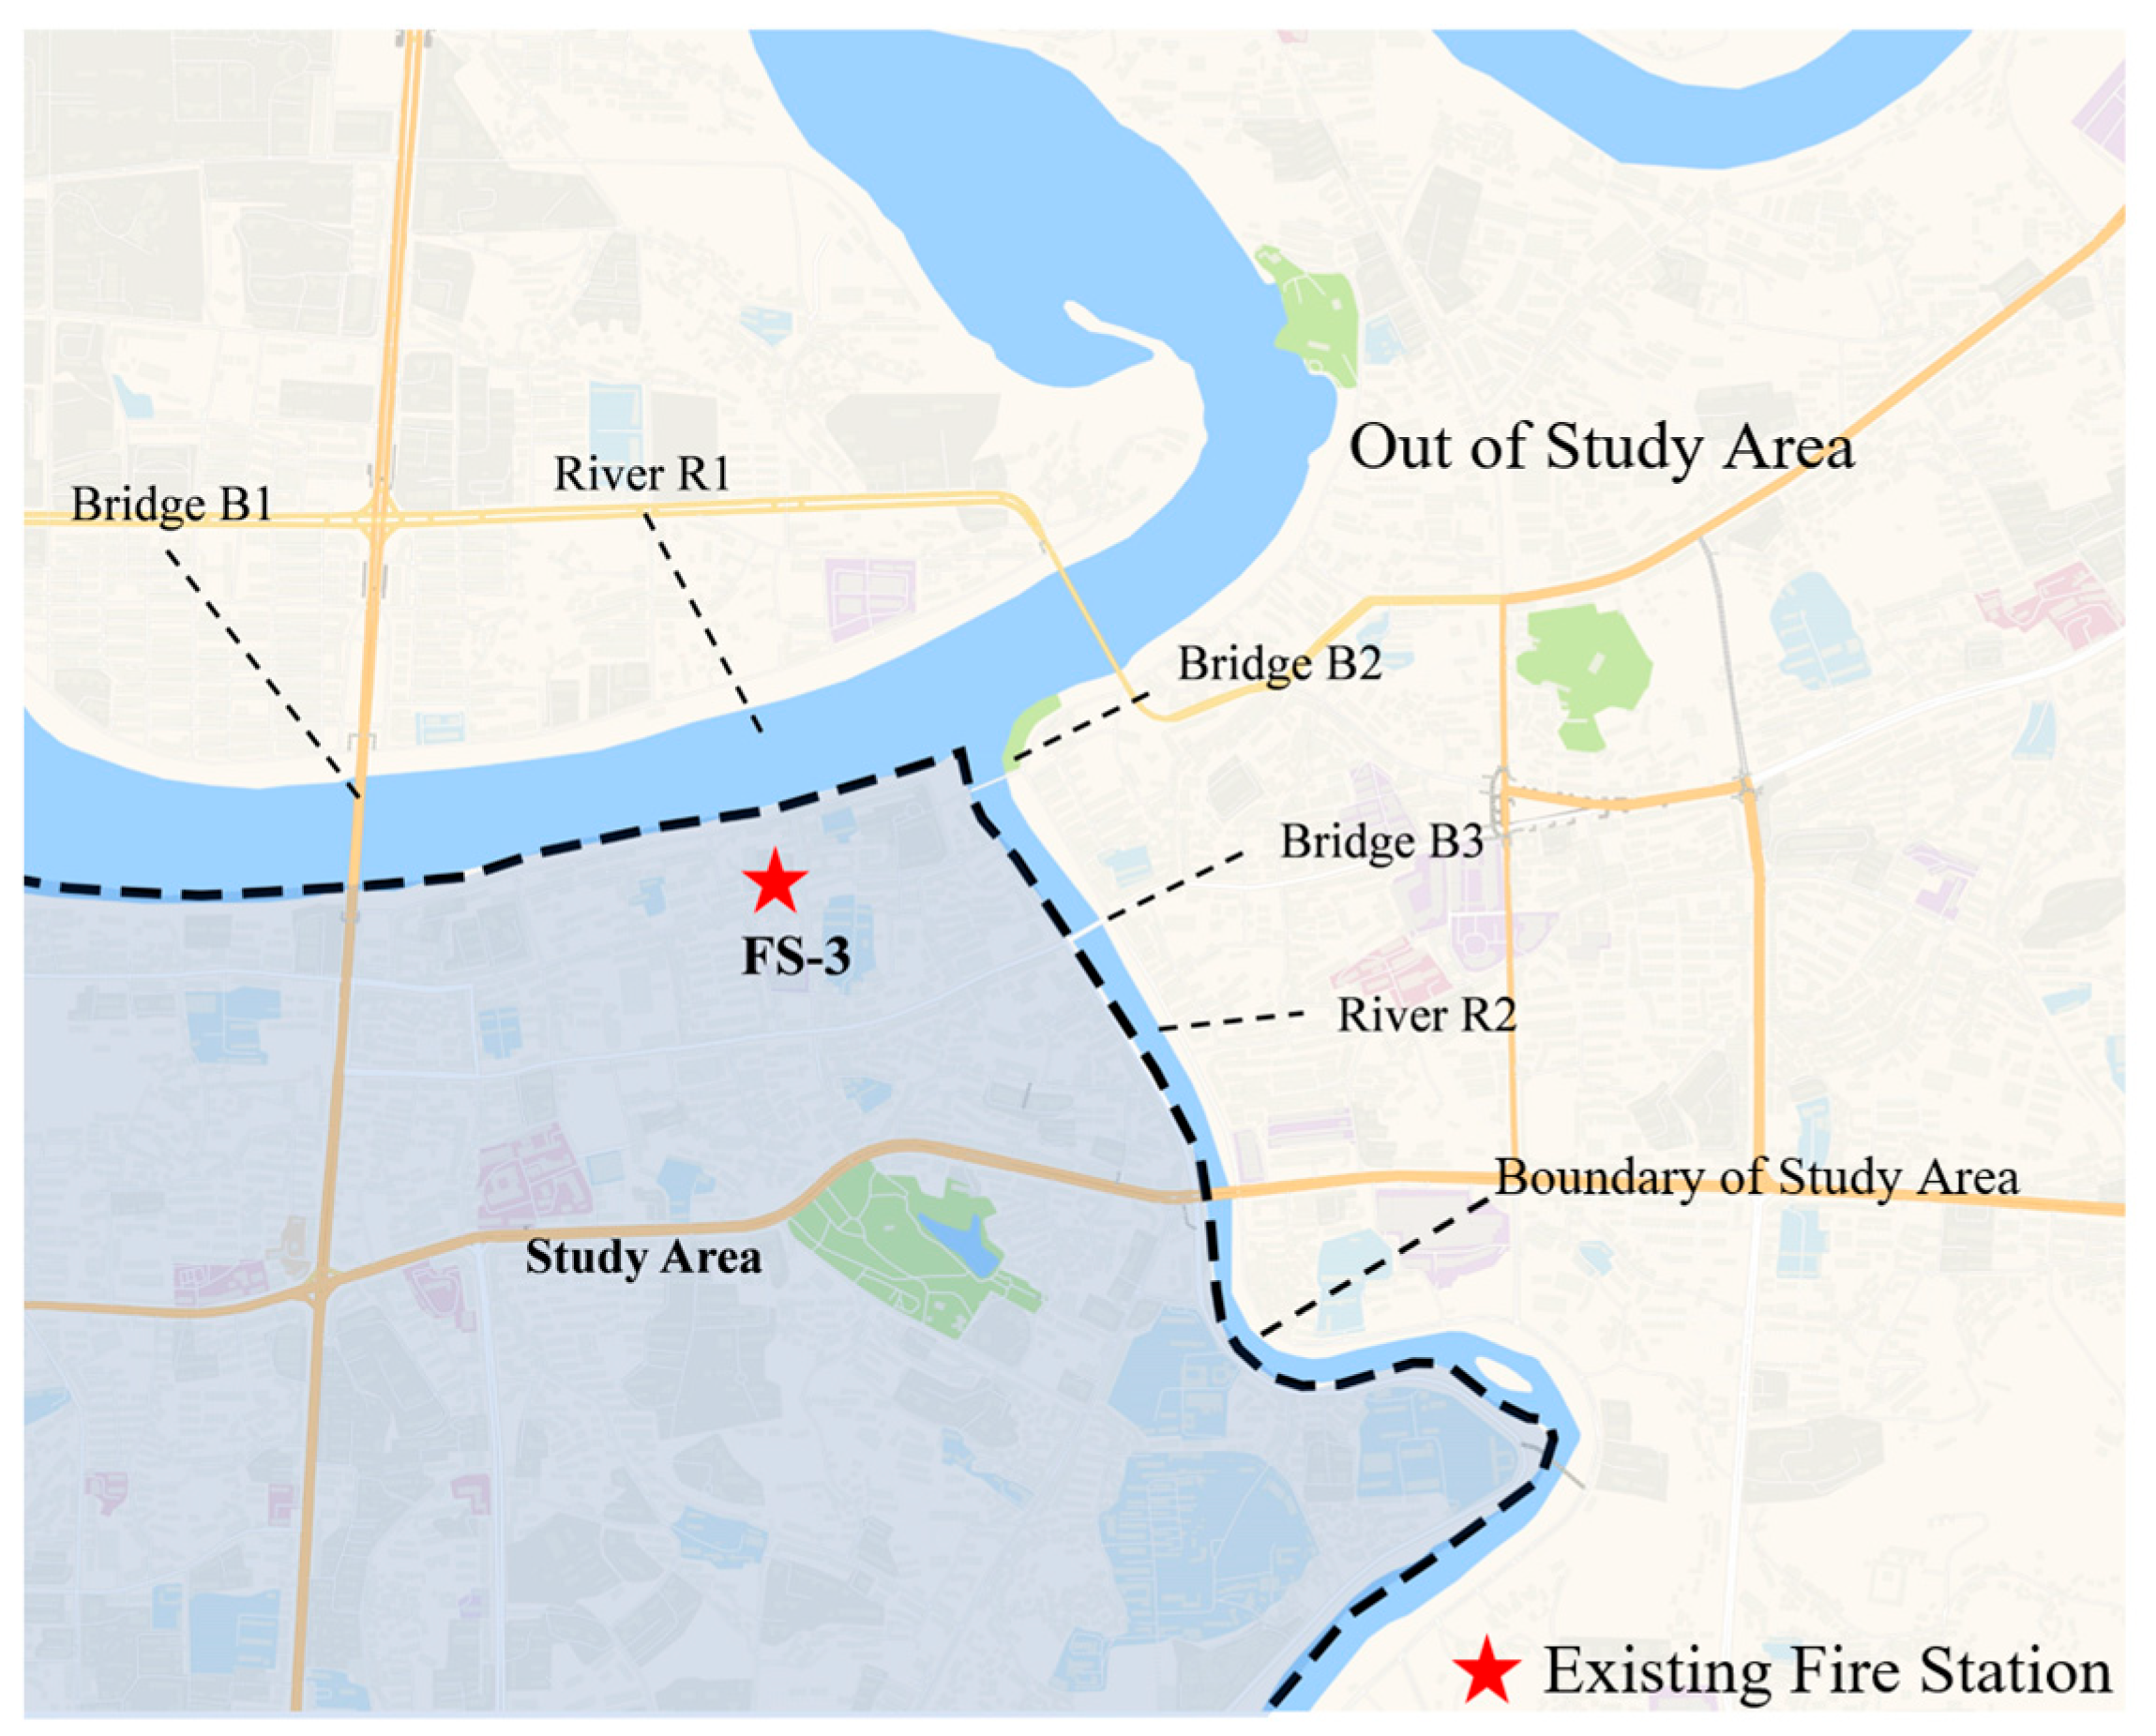
The response zone of FS-3 is relatively small, primarily due to its unique geographical location (see
Figure 15). On one hand, FS-3 is located on the edge of Daxiang District, requiring it to provide fire services to surrounding areas. On the other hand, FS-3 is situated in the urban core, where it is significantly affected by real-time traffic conditions, especially during peak hours, when traffic congestion may lead to prolonged response times. Additionally, FS-3’s proximity to a river has a notable impact on its service capabilities. Due to the river’s obstruction, the accessibility of FS-3 to areas on the opposite bank is greatly reduced [
35], as fire trucks must take longer detours or rely on limited bridge crossings, severely compromising rescue efficiency. Therefore, it is recommended that the location of FS-3 be reconsidered in future fire service planning, with relocation to a more accessible area that offers better coverage. For example, a site near major transportation arteries or a sub-cen ter of the city could be selected, while avoiding natural barriers such as rivers, to improve service efficiency. Furthermore, the resource allocation for FS-3 could be optimized by increasing the number of rapid response teams or deploying more mobile firefighting vehicles to address complex traffic conditions and emergency situations.
The response zone of FS-4 exhibits the phenomenon of rescue enclaves, where certain block units can be reached more quickly by FS-4 due to higher traffic efficiency, while surrounding areas are less accessible. To fully utilize this phenomenon, it is recommended that the roads associated with rescue enclaves be extended and optimized, for example, by widening roads, adding traffic signals, or improving traffic flow, to expand the coverage of these enclaves. Through these measures, the service coverage of FS-4 can be significantly expanded, optimizing the allocation of firefighting resources and providing more reliable responses to fire risks within the response zone.
5. Conclusions
In this study, a dynamic traffic-driven delineating response zones algorithm based on block units is proposed, using TBAT calculated from real-time traffic conditions. To validate the effectiveness of the algorithm, Daxiang District is selected as the study area. Through the block unit boundary extraction algorithm, a total of 2230 block units were identified, within which 4 fire stations and 13,097 fire service demand points are located. A total of 29 evaluation scenarios were set within a 24 h period.
Through the analysis of 1,225,047 sample data points, the following results are obtained for Daxiang District: TBAT(U) is 960.706 s, TBAD(U) is 10,304.107 m, and TBAVU) is 10.154 m/s. Detailed data and visualization results show that the areas corresponding to BAS1, BAS2, BAS3, BAS4, BAS5, BAS6, and BAS7 are 10.11 km2, 12.22 km2, 9.84 km2, 10.75 km2, 9.42 km2, 13.97 km2, and 142.15 km2, respectively. The overall service rate is relatively low. Block units with rapid accessibility are mainly concentrated in urban areas. It is suggested that firefighting infrastructure in rural regions be enhanced. Volunteer firefighting teams should be organized, and regular fire drills and training sessions should be conducted. This will enable rural residents to participate in initial fire suppression efforts, effectively reducing fire-related losses and improving emergency response capabilities in rural areas. Based on the accessibility of each fire station to the block units, the response zones are delineated as follows: 156.24 km2, 11.39 km2, 1.07 km2, and 39.76 km2. The significant variation in coverage areas is primarily due to the concentration of fire stations in urban areas, insufficient coverage of vast rural regions, and geographical constraints like rivers and regional boundaries. These findings underscore the spatial inequities in fire service provision and the need for a more balanced resource allocation strategy. During urban peak hours, the delineation of fire station response zones can be temporarily adjusted. Other measures, such as establishing temporary rescue stations and optimizing traffic flow management, can also be implemented to improve response efficiency during peak periods.
This study focuses on delineating response zones through dynamic traffic conditions. It provides a critical foundation for enhancing fire service accessibility and equity in rapidly changing urban environments. The proposed dynamic zoning method provides a scientific basis for delineating fire station response zones under real-time traffic conditions, serving as a decision support tool for operational fire service management. The proposed method is a general analytical framework applicable to any region with access to online map data, including areas outside China or with different transport infrastructure.
Furthermore, we are transforming this approach into a practical tool for fire departments to support dynamic response zone management under real-time traffic conditions. It is acknowledged that deeper insights could be uncovered by incorporating additional risk factors such as population density, building typology, and land use patterns. Future work can compare our results with real dispatch data once available and extend longer time series to capture broader temporal variations in fire service accessibility. Future research is encouraged to integrate constraints specific to fire apparatus (e.g., road width and bridge load limits) to both refine risk assessments and advance modeling from generalized travel time towards operational response. Meanwhile, the integration of dynamic traffic prediction models and machine learning algorithms may be explored in future research to further enhance the accuracy and adaptability of fire service accessibility assessments.





 ,
,