


Software Supporting the Visualization of Hazardous Substance Emission Zones During a Fire at an Industrial Enterprise


Abstract
1. Introduction
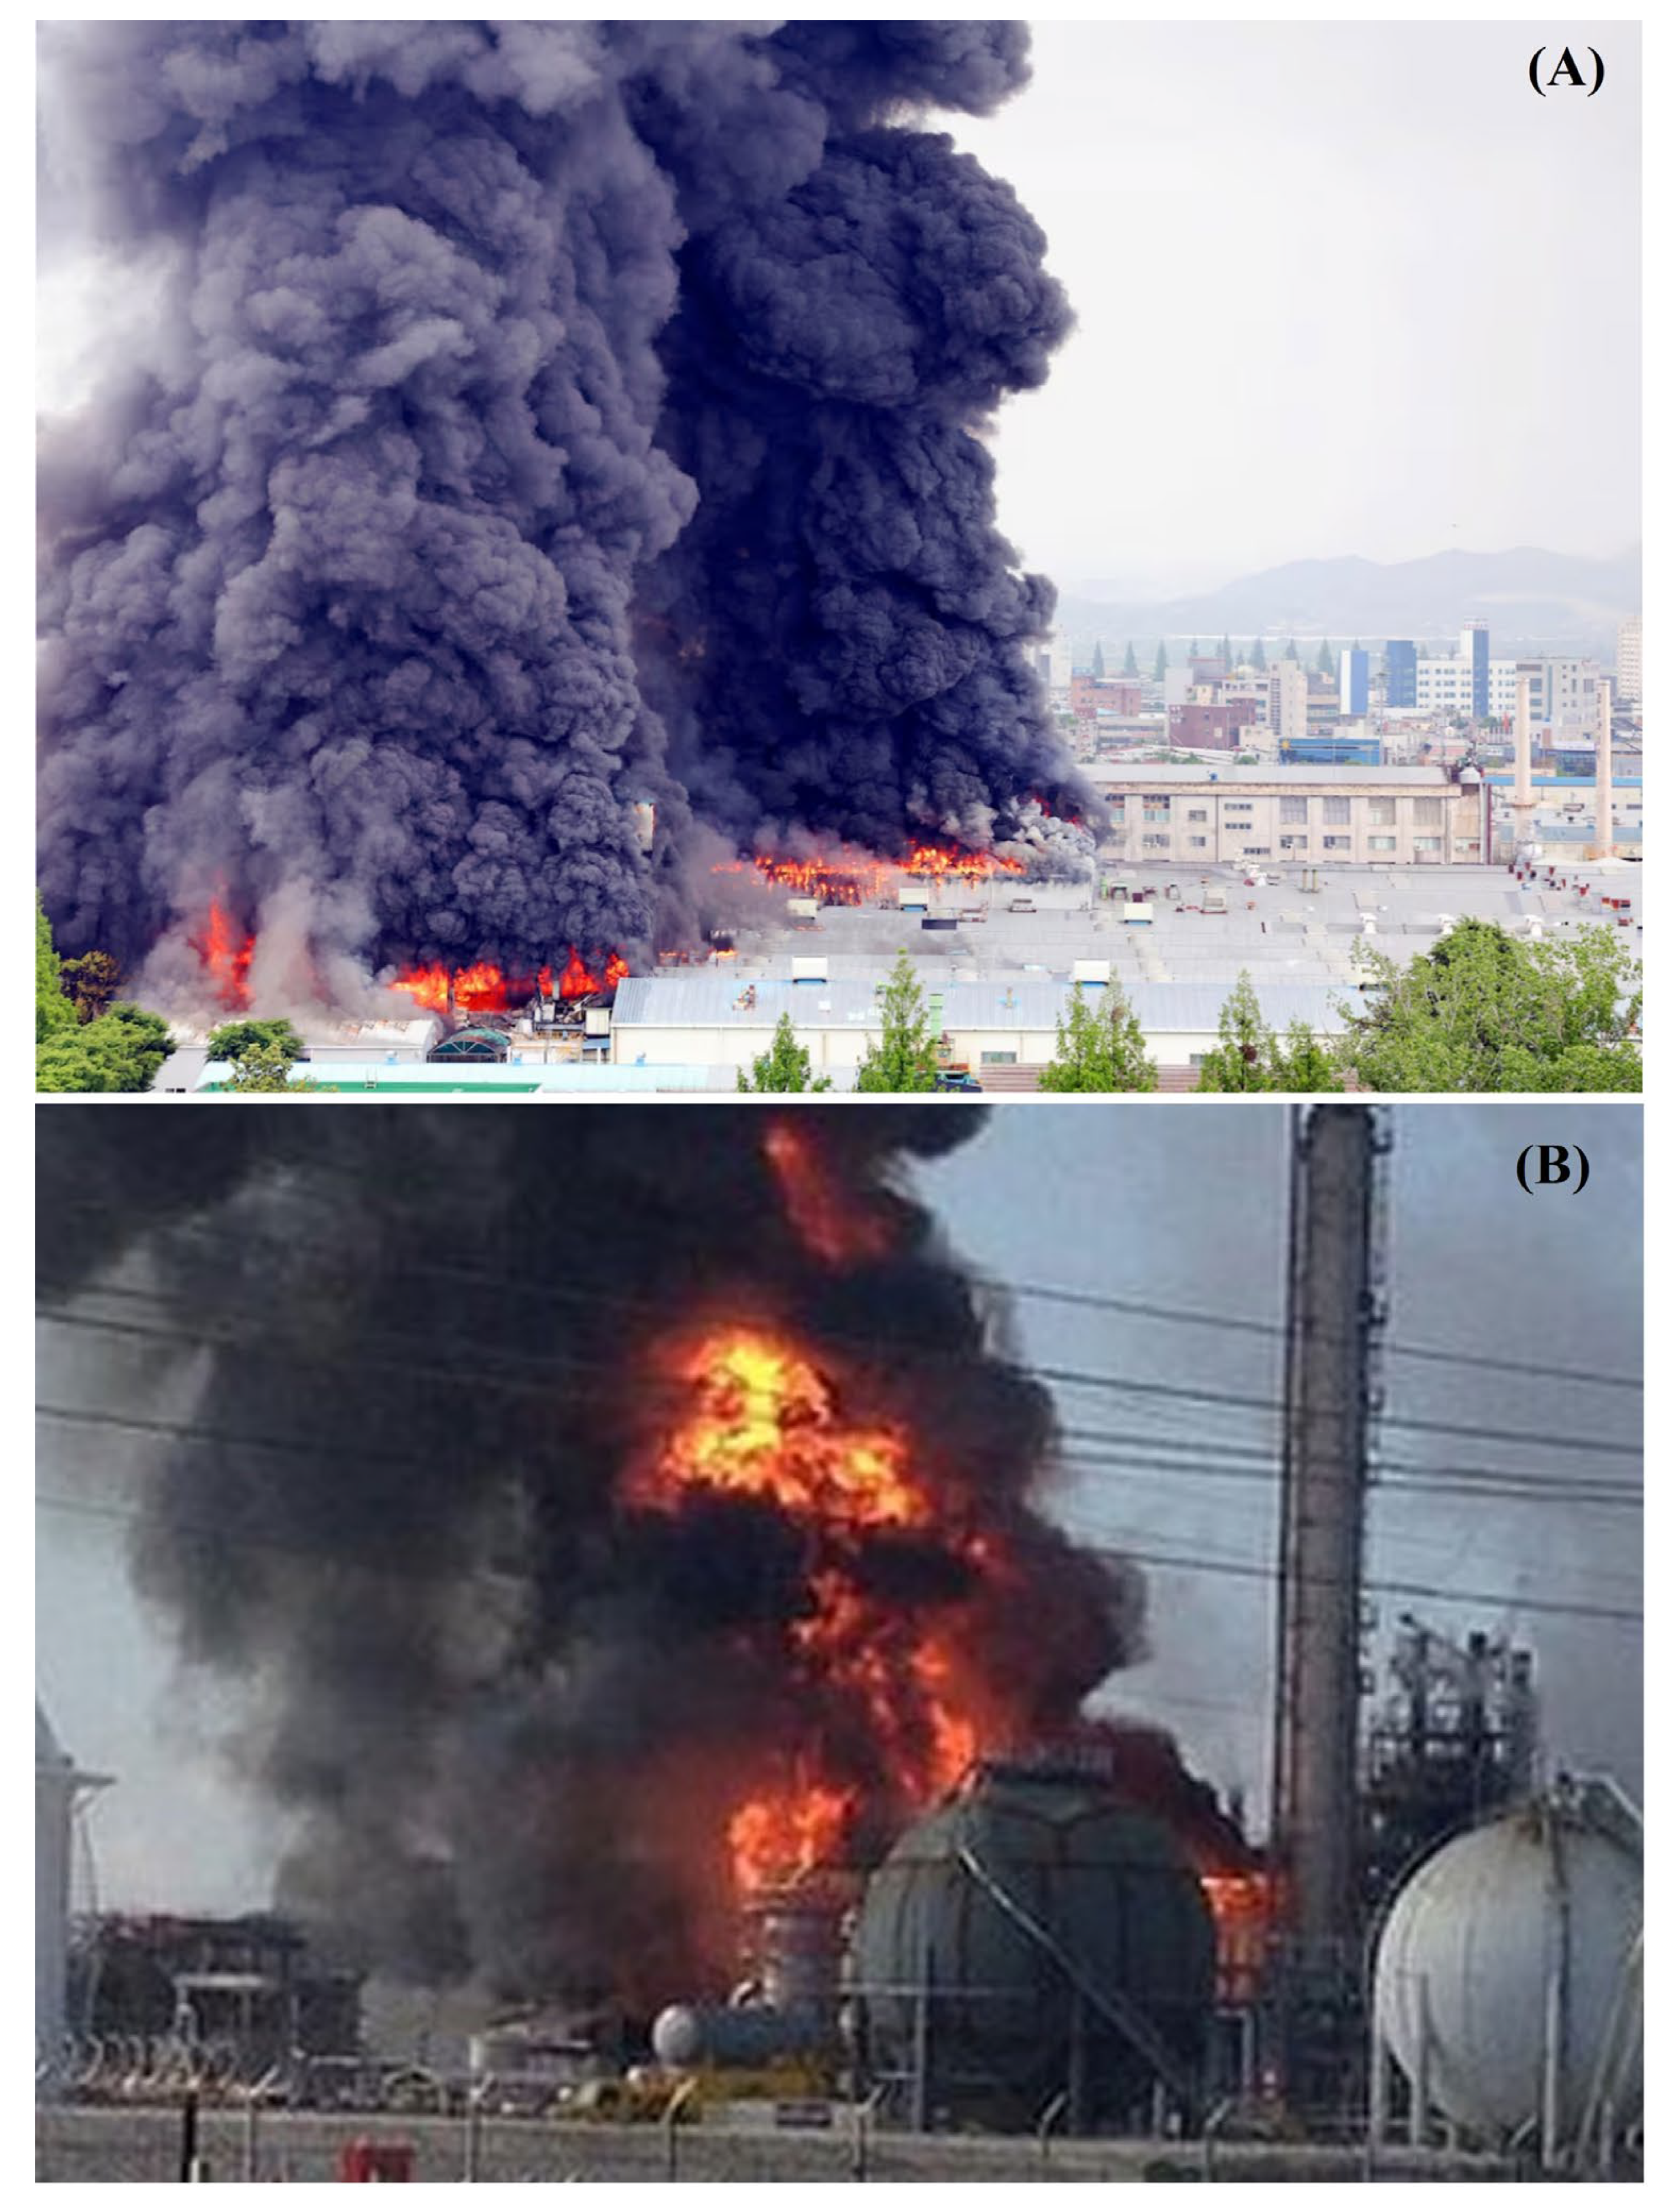
- (A)
- Conducting chemical control assessments to determine the area of contamination by hazardous concentrations of toxic substances, initiating an evacuation, determining the location of victims, and uncovering the presence and degree of danger from secondary sources;
- (B)
- Localizing the spread of the primary and secondary cloud of toxic substances; searching for victims, and providing them with medical care;
- (C)
- Special sanitary treatment and the collection and disposal of waste.
- -
- To mathematically describe the processes involved in the formation and spread of toxic combustion products in the atmosphere during an explosion and fire;
- -
- To create a geometric model of a hazardous area during a fire at an industrial enterprise;
- -
- To develop an algorithm and software for modeling a hazardous area during a fire at an industrial enterprise;
- -
- To develop a prototype of software for modeling a hazardous area.
2. Materials and Methods
2.1. State of the Art in the Field of Modeling the Spread of Toxic Substances During Fires at Industrial Facilities
2.2. Classification of Dispersion Models
2.3. The Processes of Formation of the Zone of Distribution of Toxic Substances as an Object of Management
2.4. Model of Formation and Spread of a Cloud of Toxic Substances During the Explosion of a Container Housing Them During a Fire
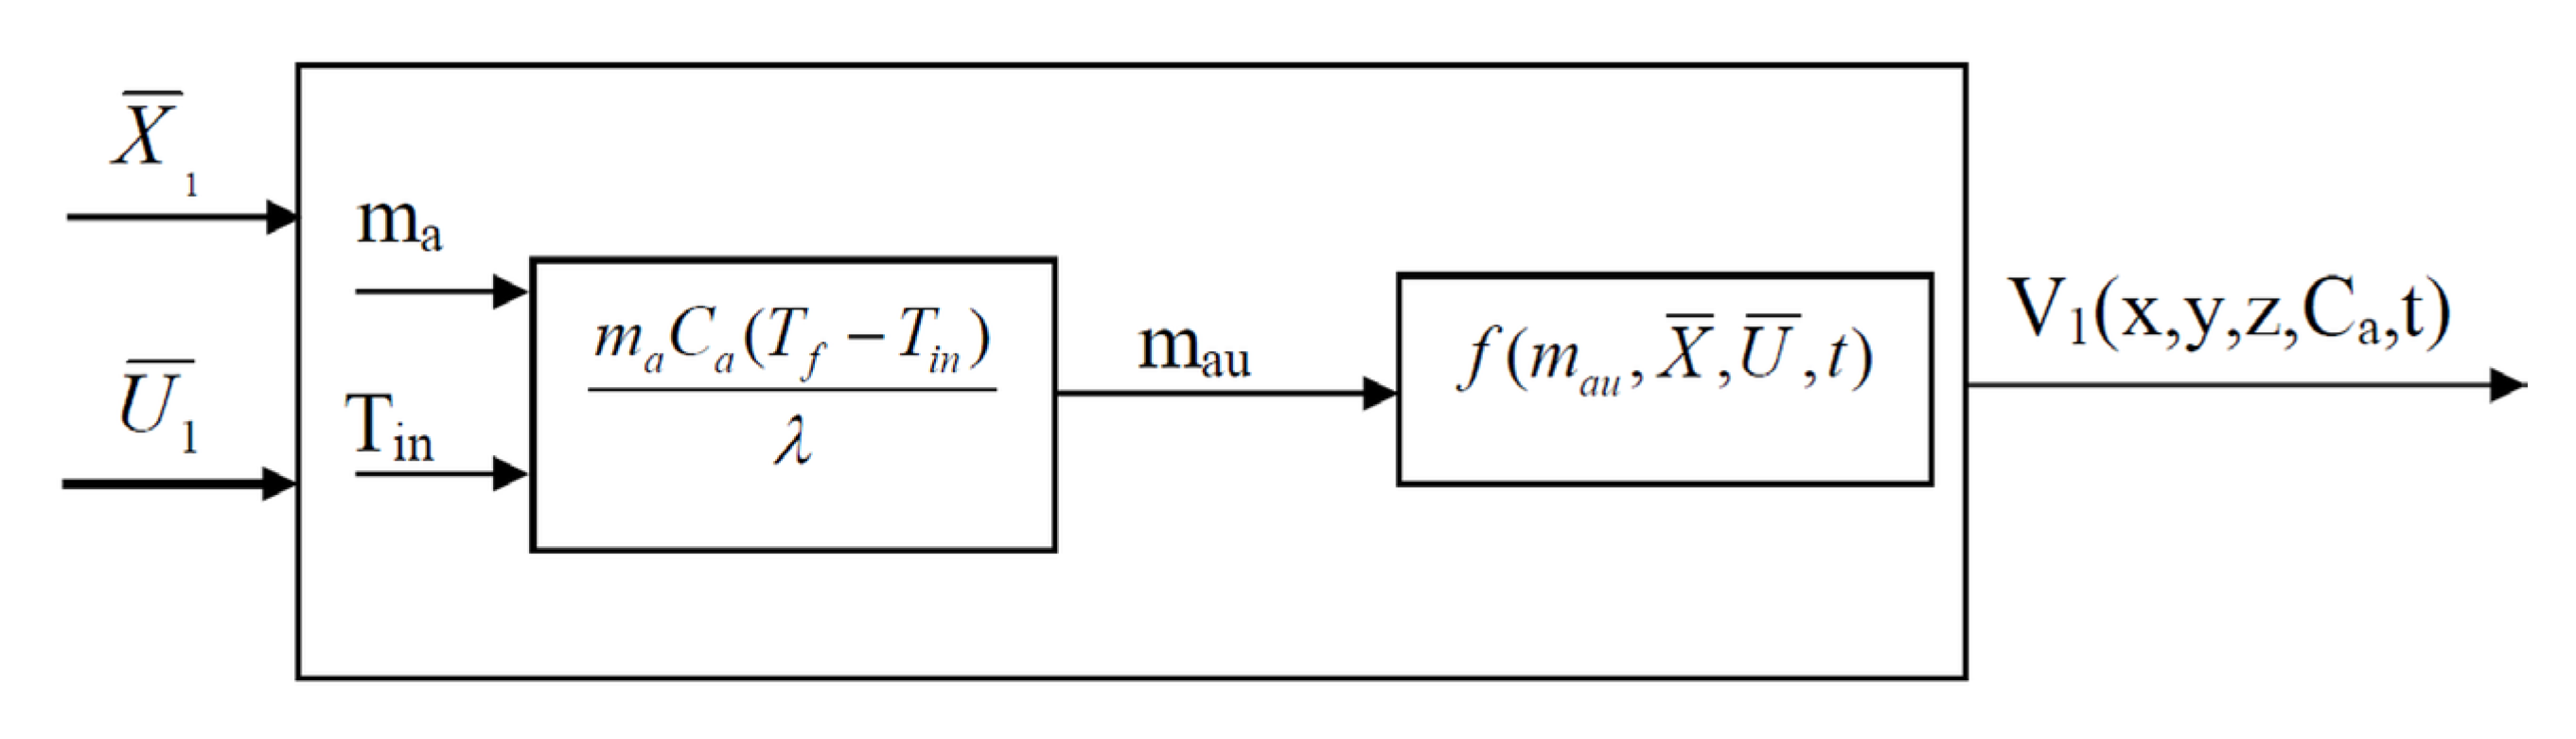
- The model of the process of primary cloud formation consists of two stages: instantaneous evaporation of the liquid passing into the primary cloud, and the formation of a spill mirror (Figure 2).
- 2.
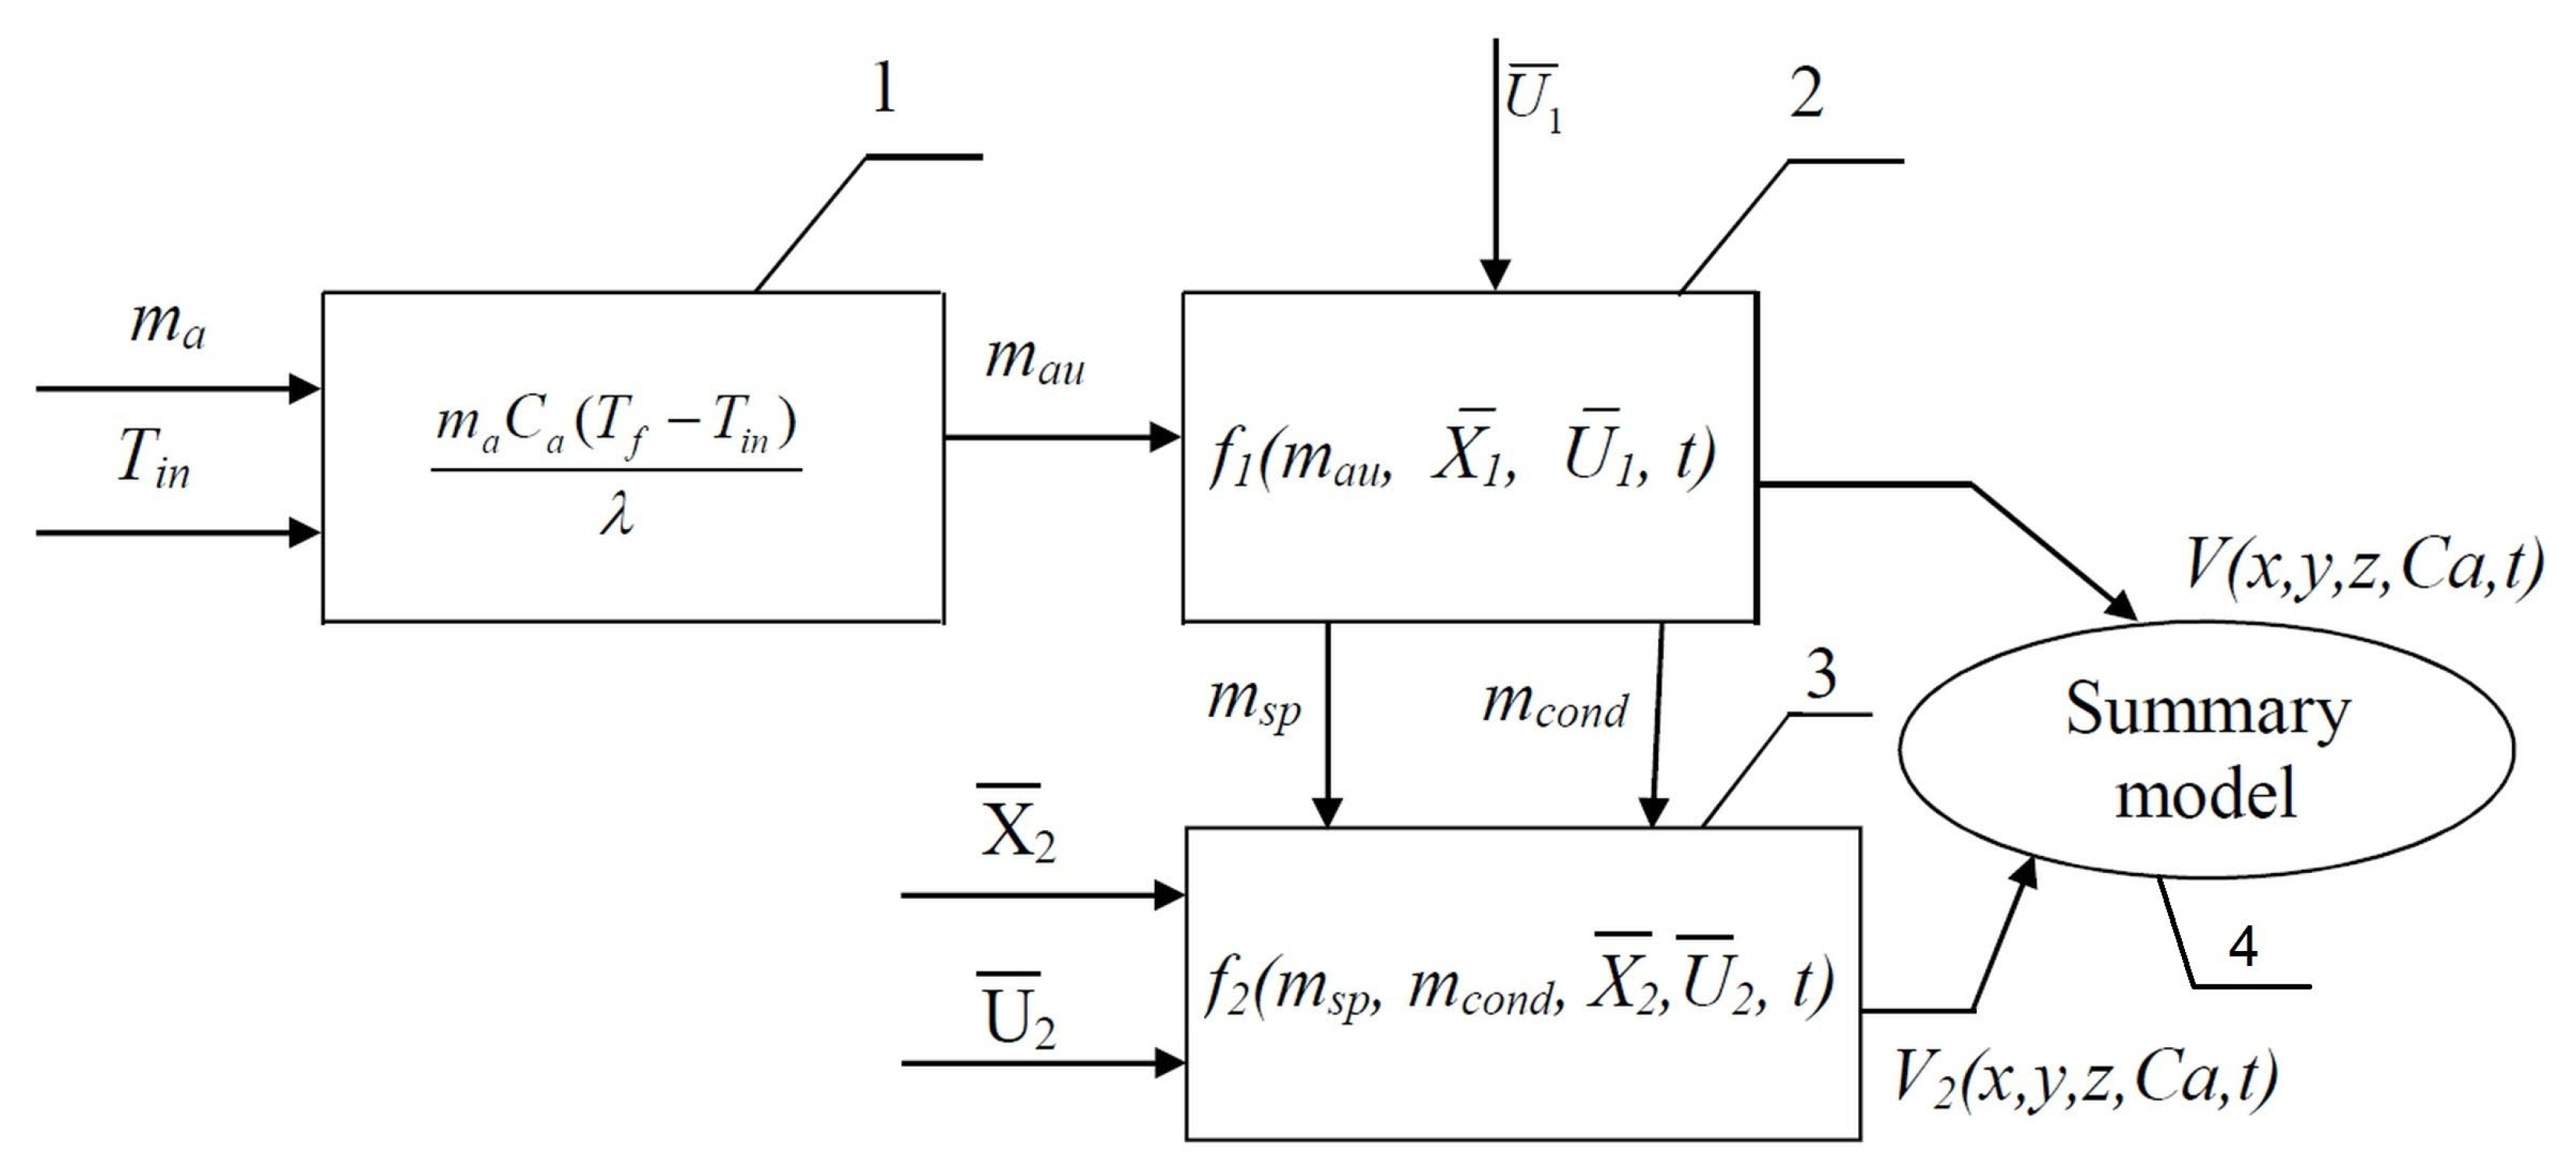
- The parameters of the primary cloud formation model include the following:
- (A)
- Input parameters : ma—the mass of a toxic substance in the explosion zone; Tin—the initial ignition temperature; Tf—the combustion temperature; Uw—wind speed in the x direction; Vw—wind speed in the y direction;Ww—wind speed in the z direction; Tl—the temperature of the underlying surface; Ta—ambient air temperature; φ—relative air humidity; β—temperature gradient (atmospheric turbulence); Pa—atmospheric pressure; mau—the mass of toxic substance evaporated during the explosion.
- (B)
- Control parameters : mc—the mass of sorbent for emergency collection of toxic substance; Qd—the consumption of degassing substances used to set up a curtain on the path of spread of the cloud of toxic substances as a result of the explosion; Qs—the consumption of degassing or other substances (for example, water) for precipitation of toxic substances spreading in the cloud.
- (C)
- Output parameters: V1(x, y, z, Ca, t)—the volume of the primary cloud limited by the MPC values at the boundaries along x, y, z axes; Ca—the actual concentration of hazardous substances, t—the time of propagation of the primary cloud.
- 3.
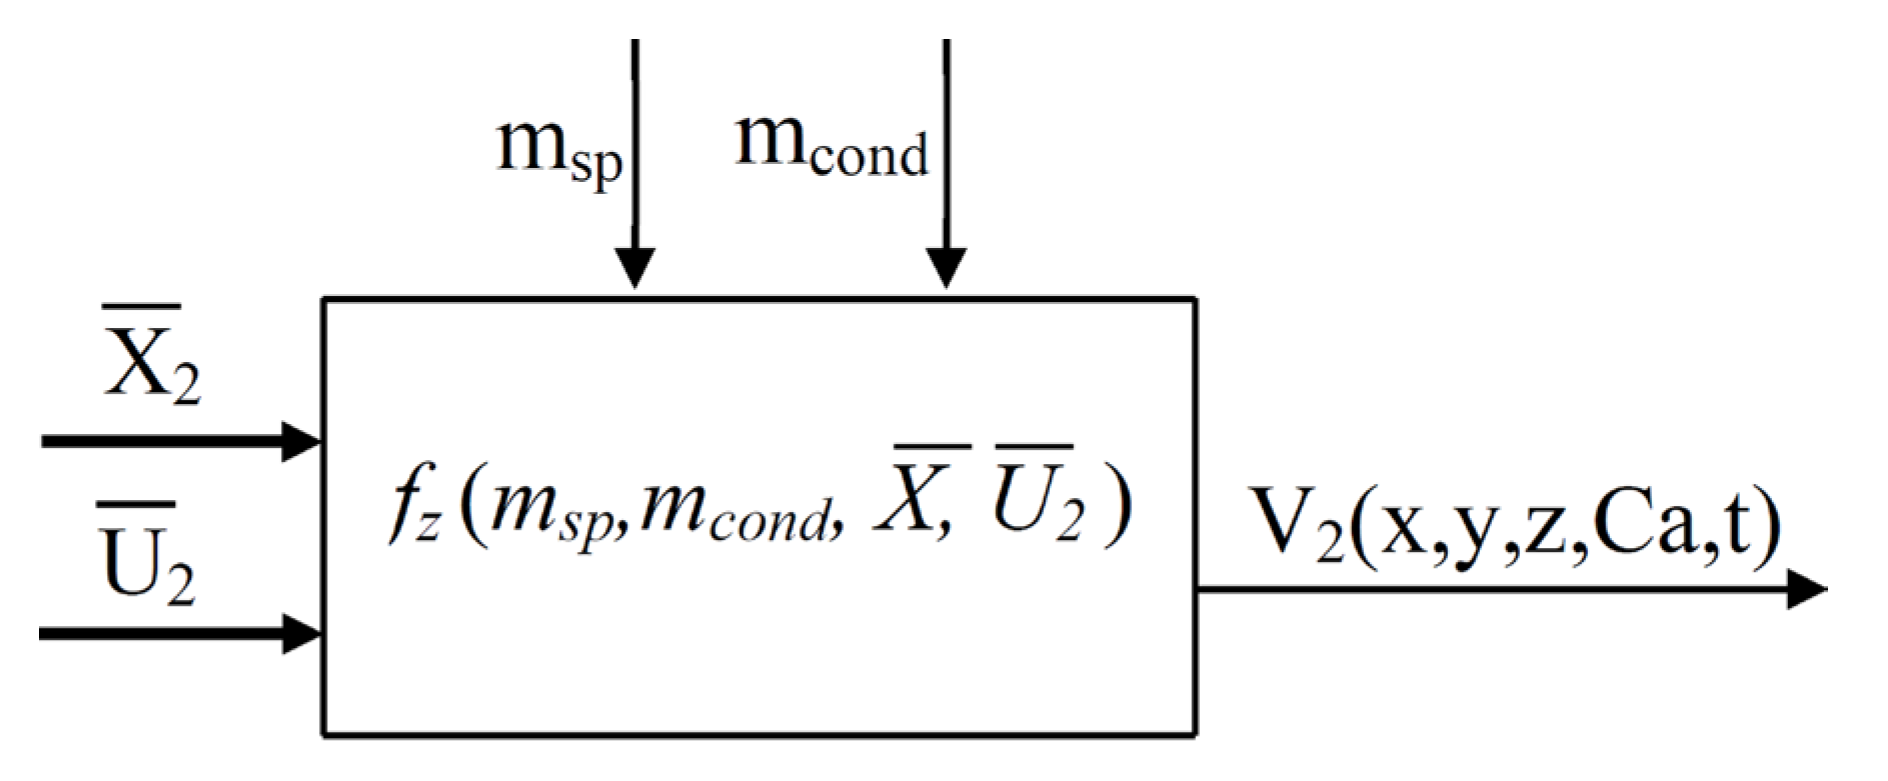
- The model of secondary cloud formation is associated with the evaporation of substances emitted into the atmosphere as an aerosol as a result of the explosion, as well as the evaporation of the spill surface under the influence of high temperatures at the source of ignition during the subsequent fire (Figure 3).
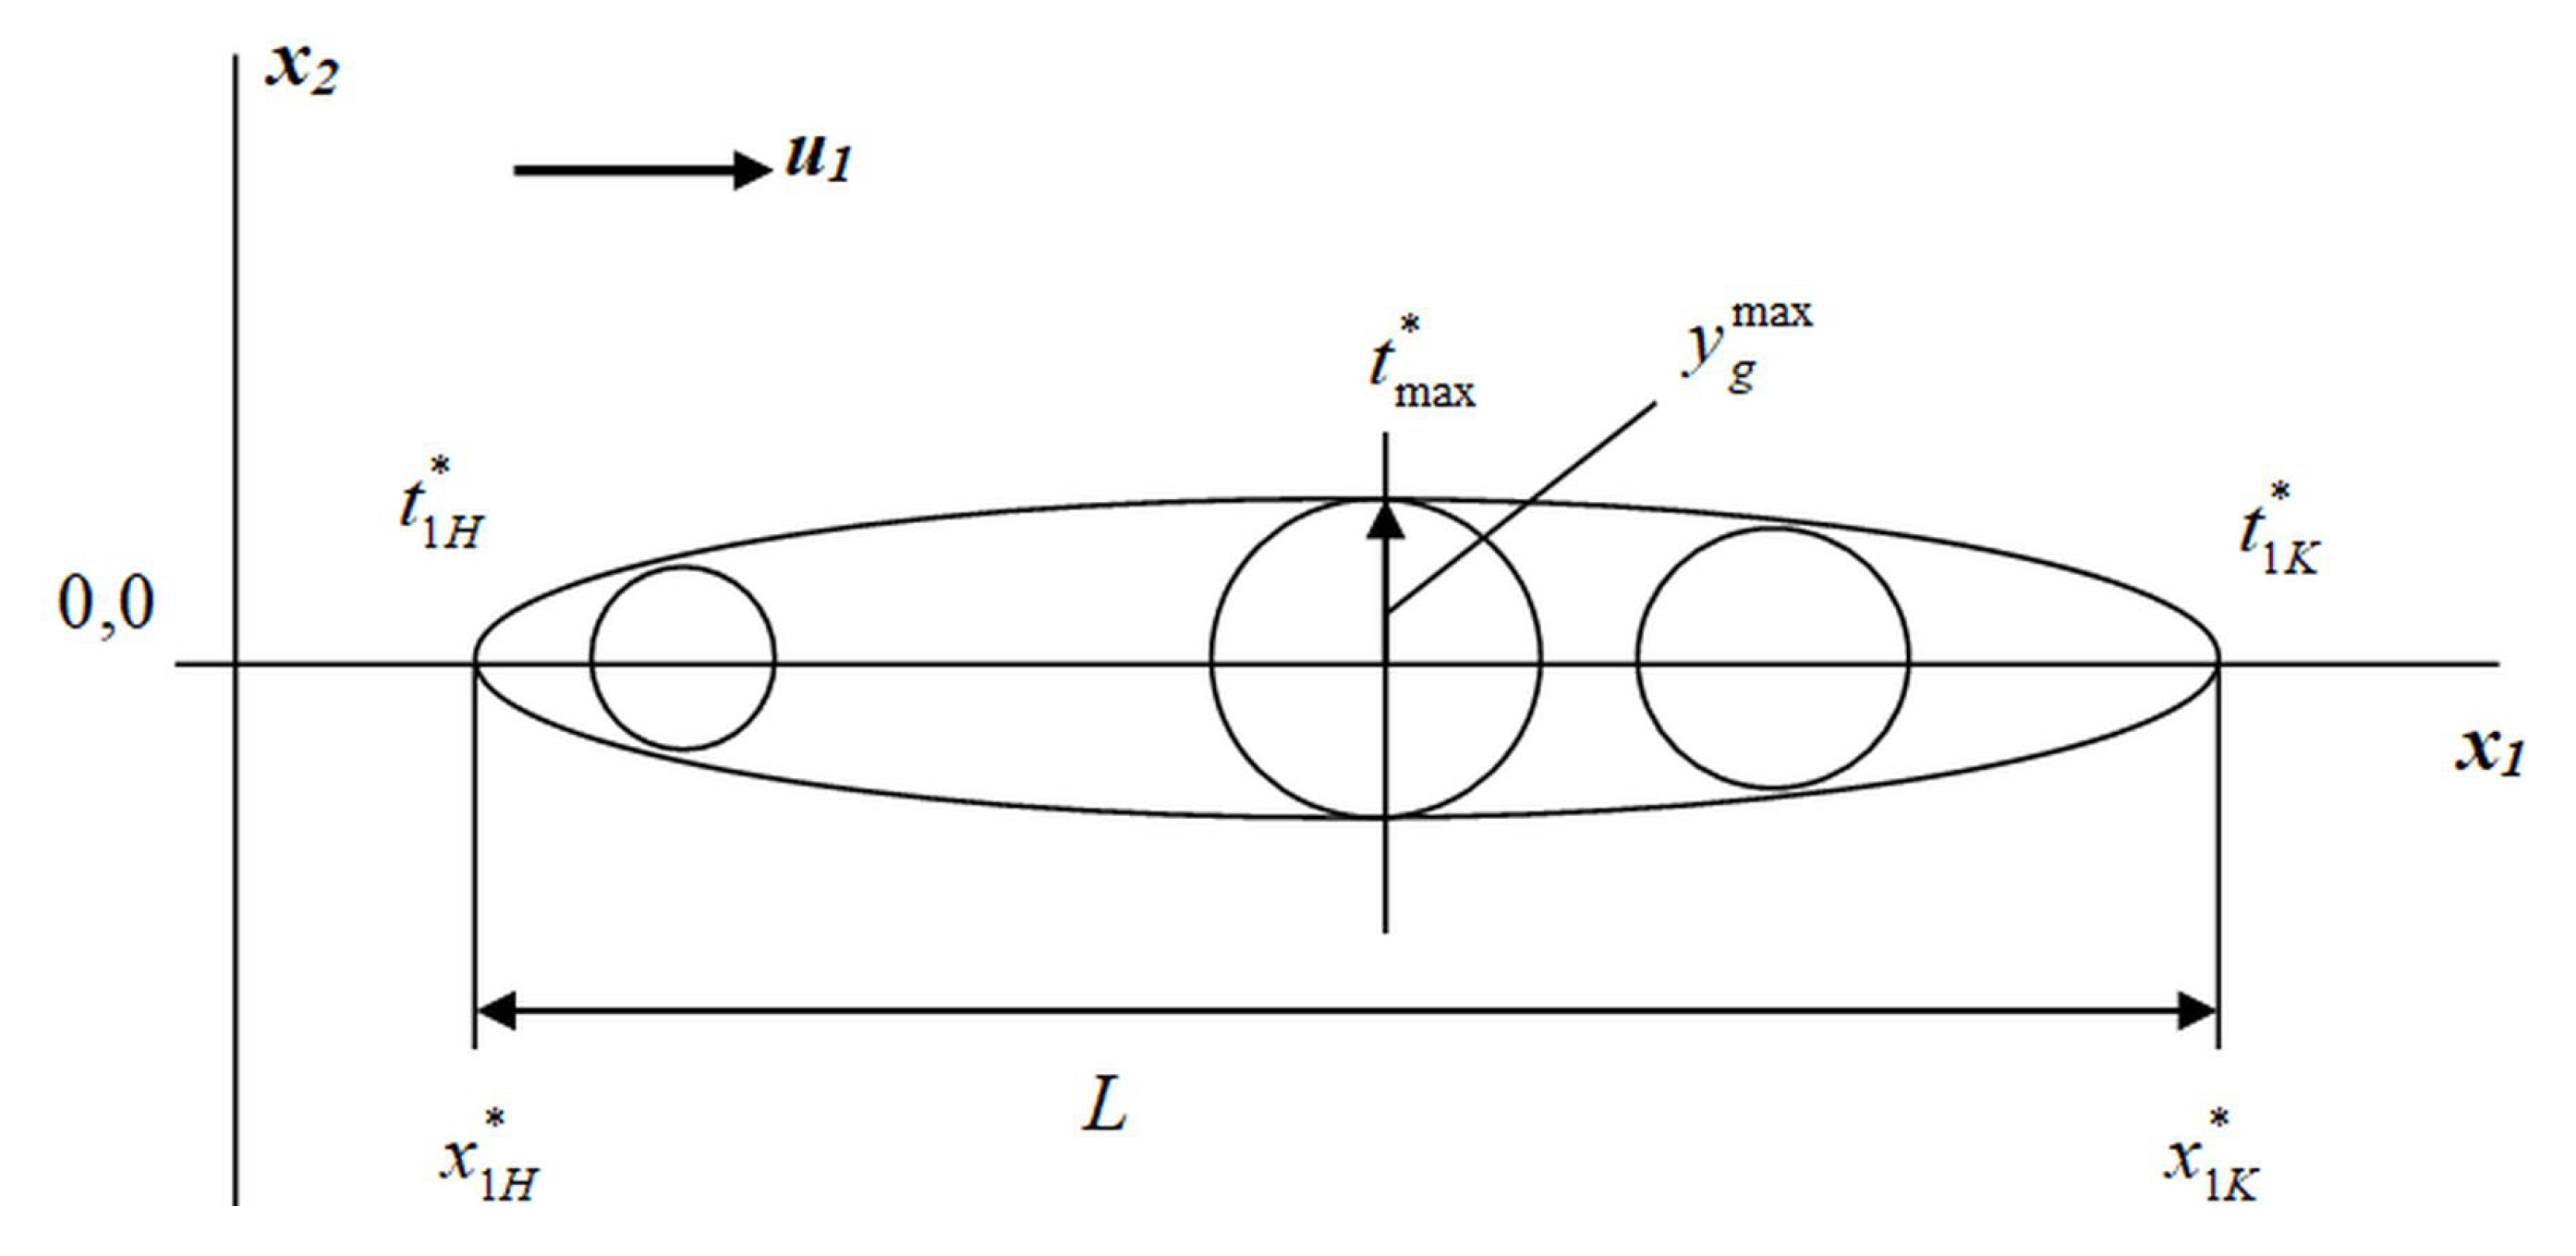
2.5. Geometric Model of the Hazardous Zone of Spread of a Toxic Cloud During a Fire at an Enterprise
3. Results
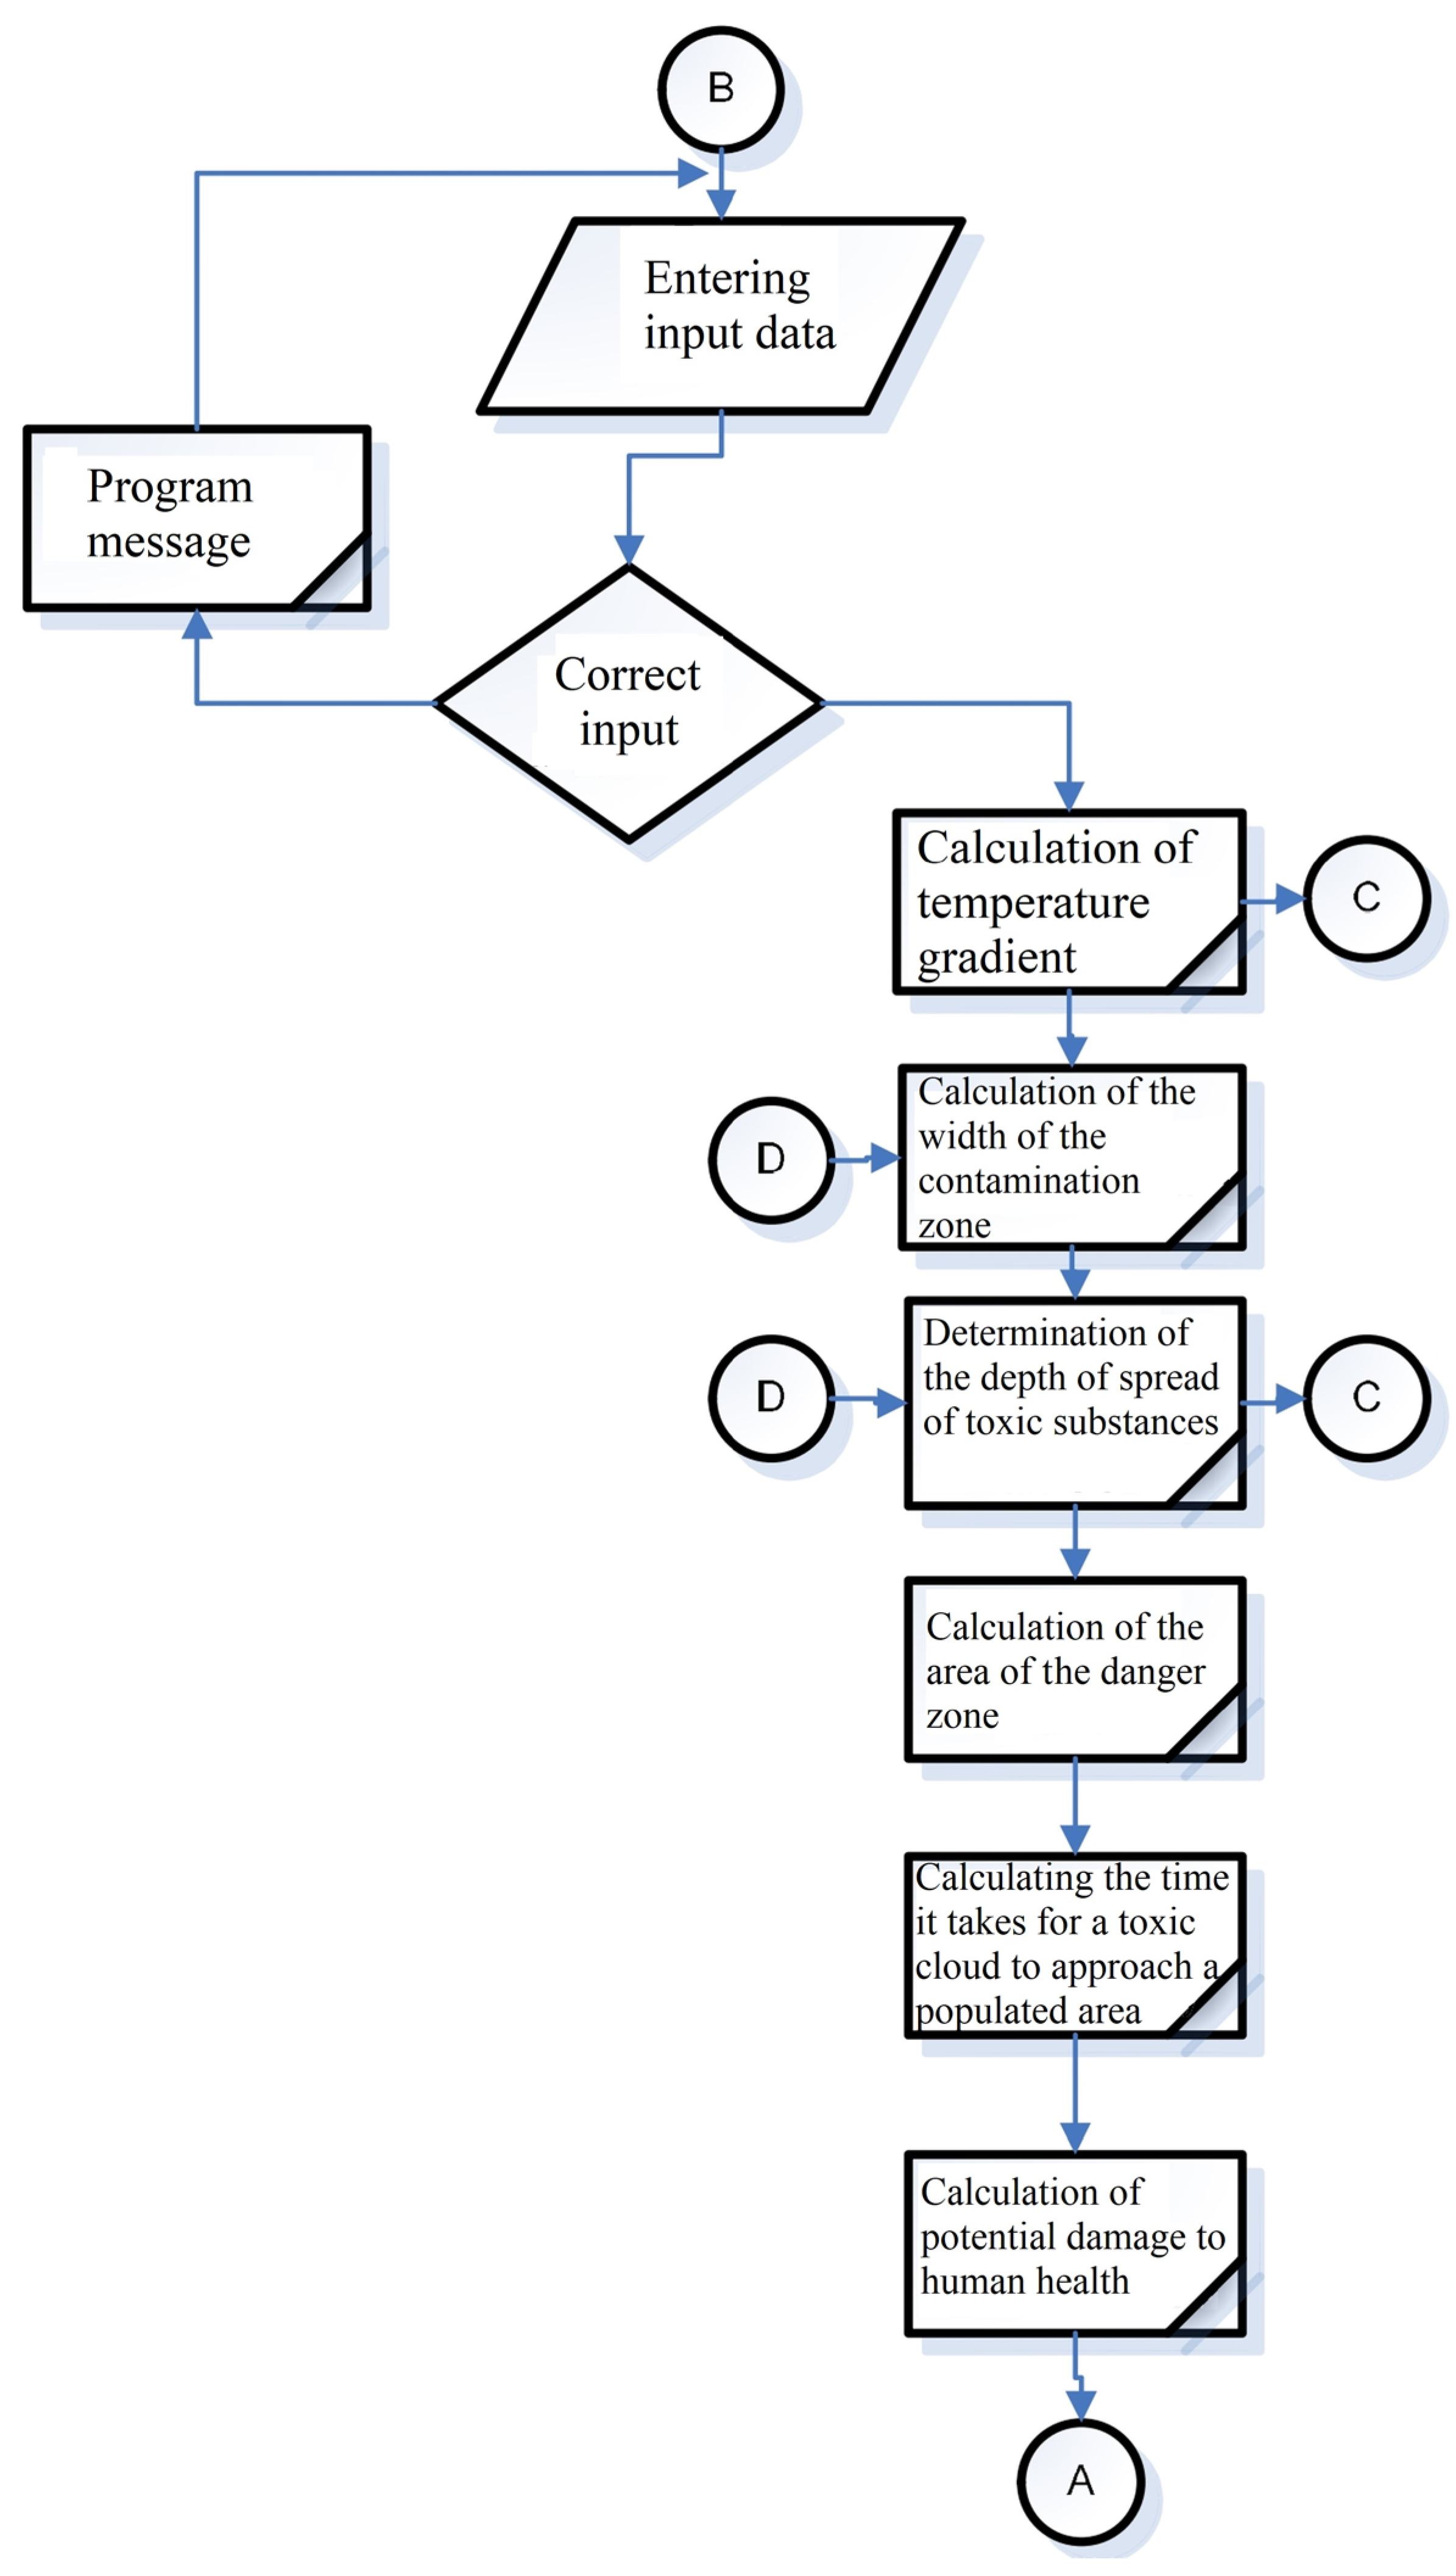
3.1. Development of an Algorithm and Software Implementation for Solving the Problem of Modeling a Hazardous Air Pollution Zone During an Accident at an Enterprise
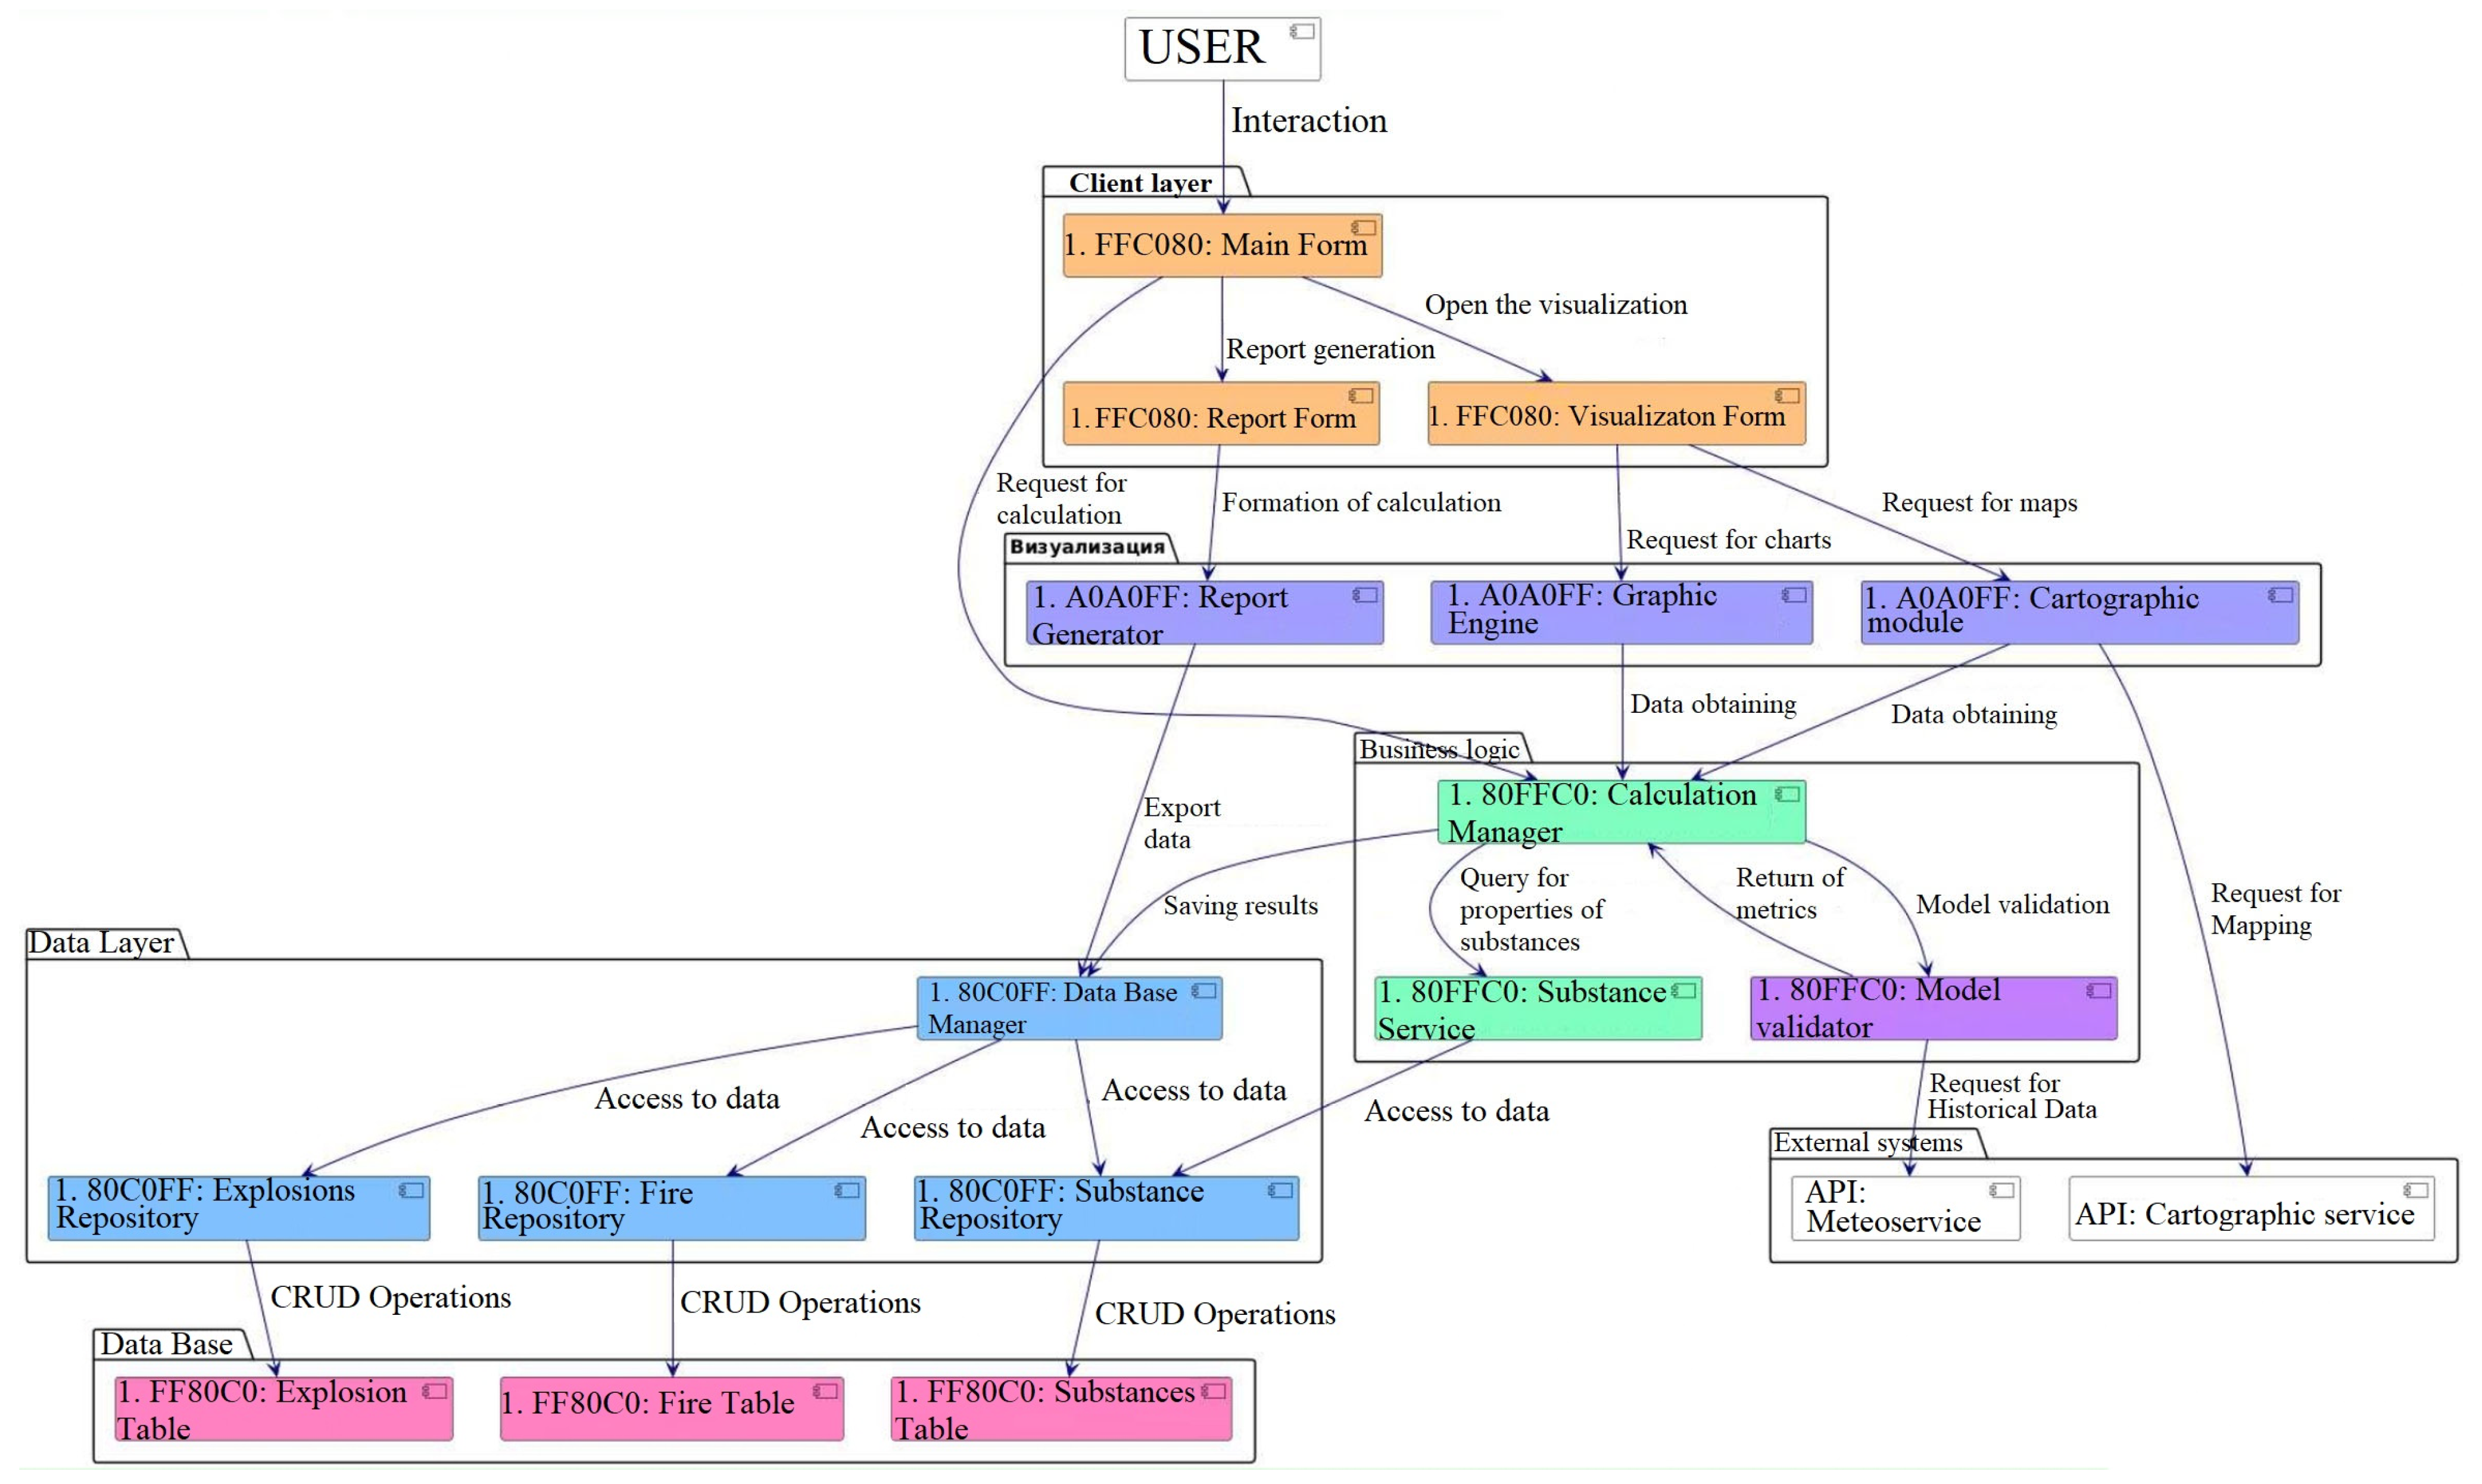
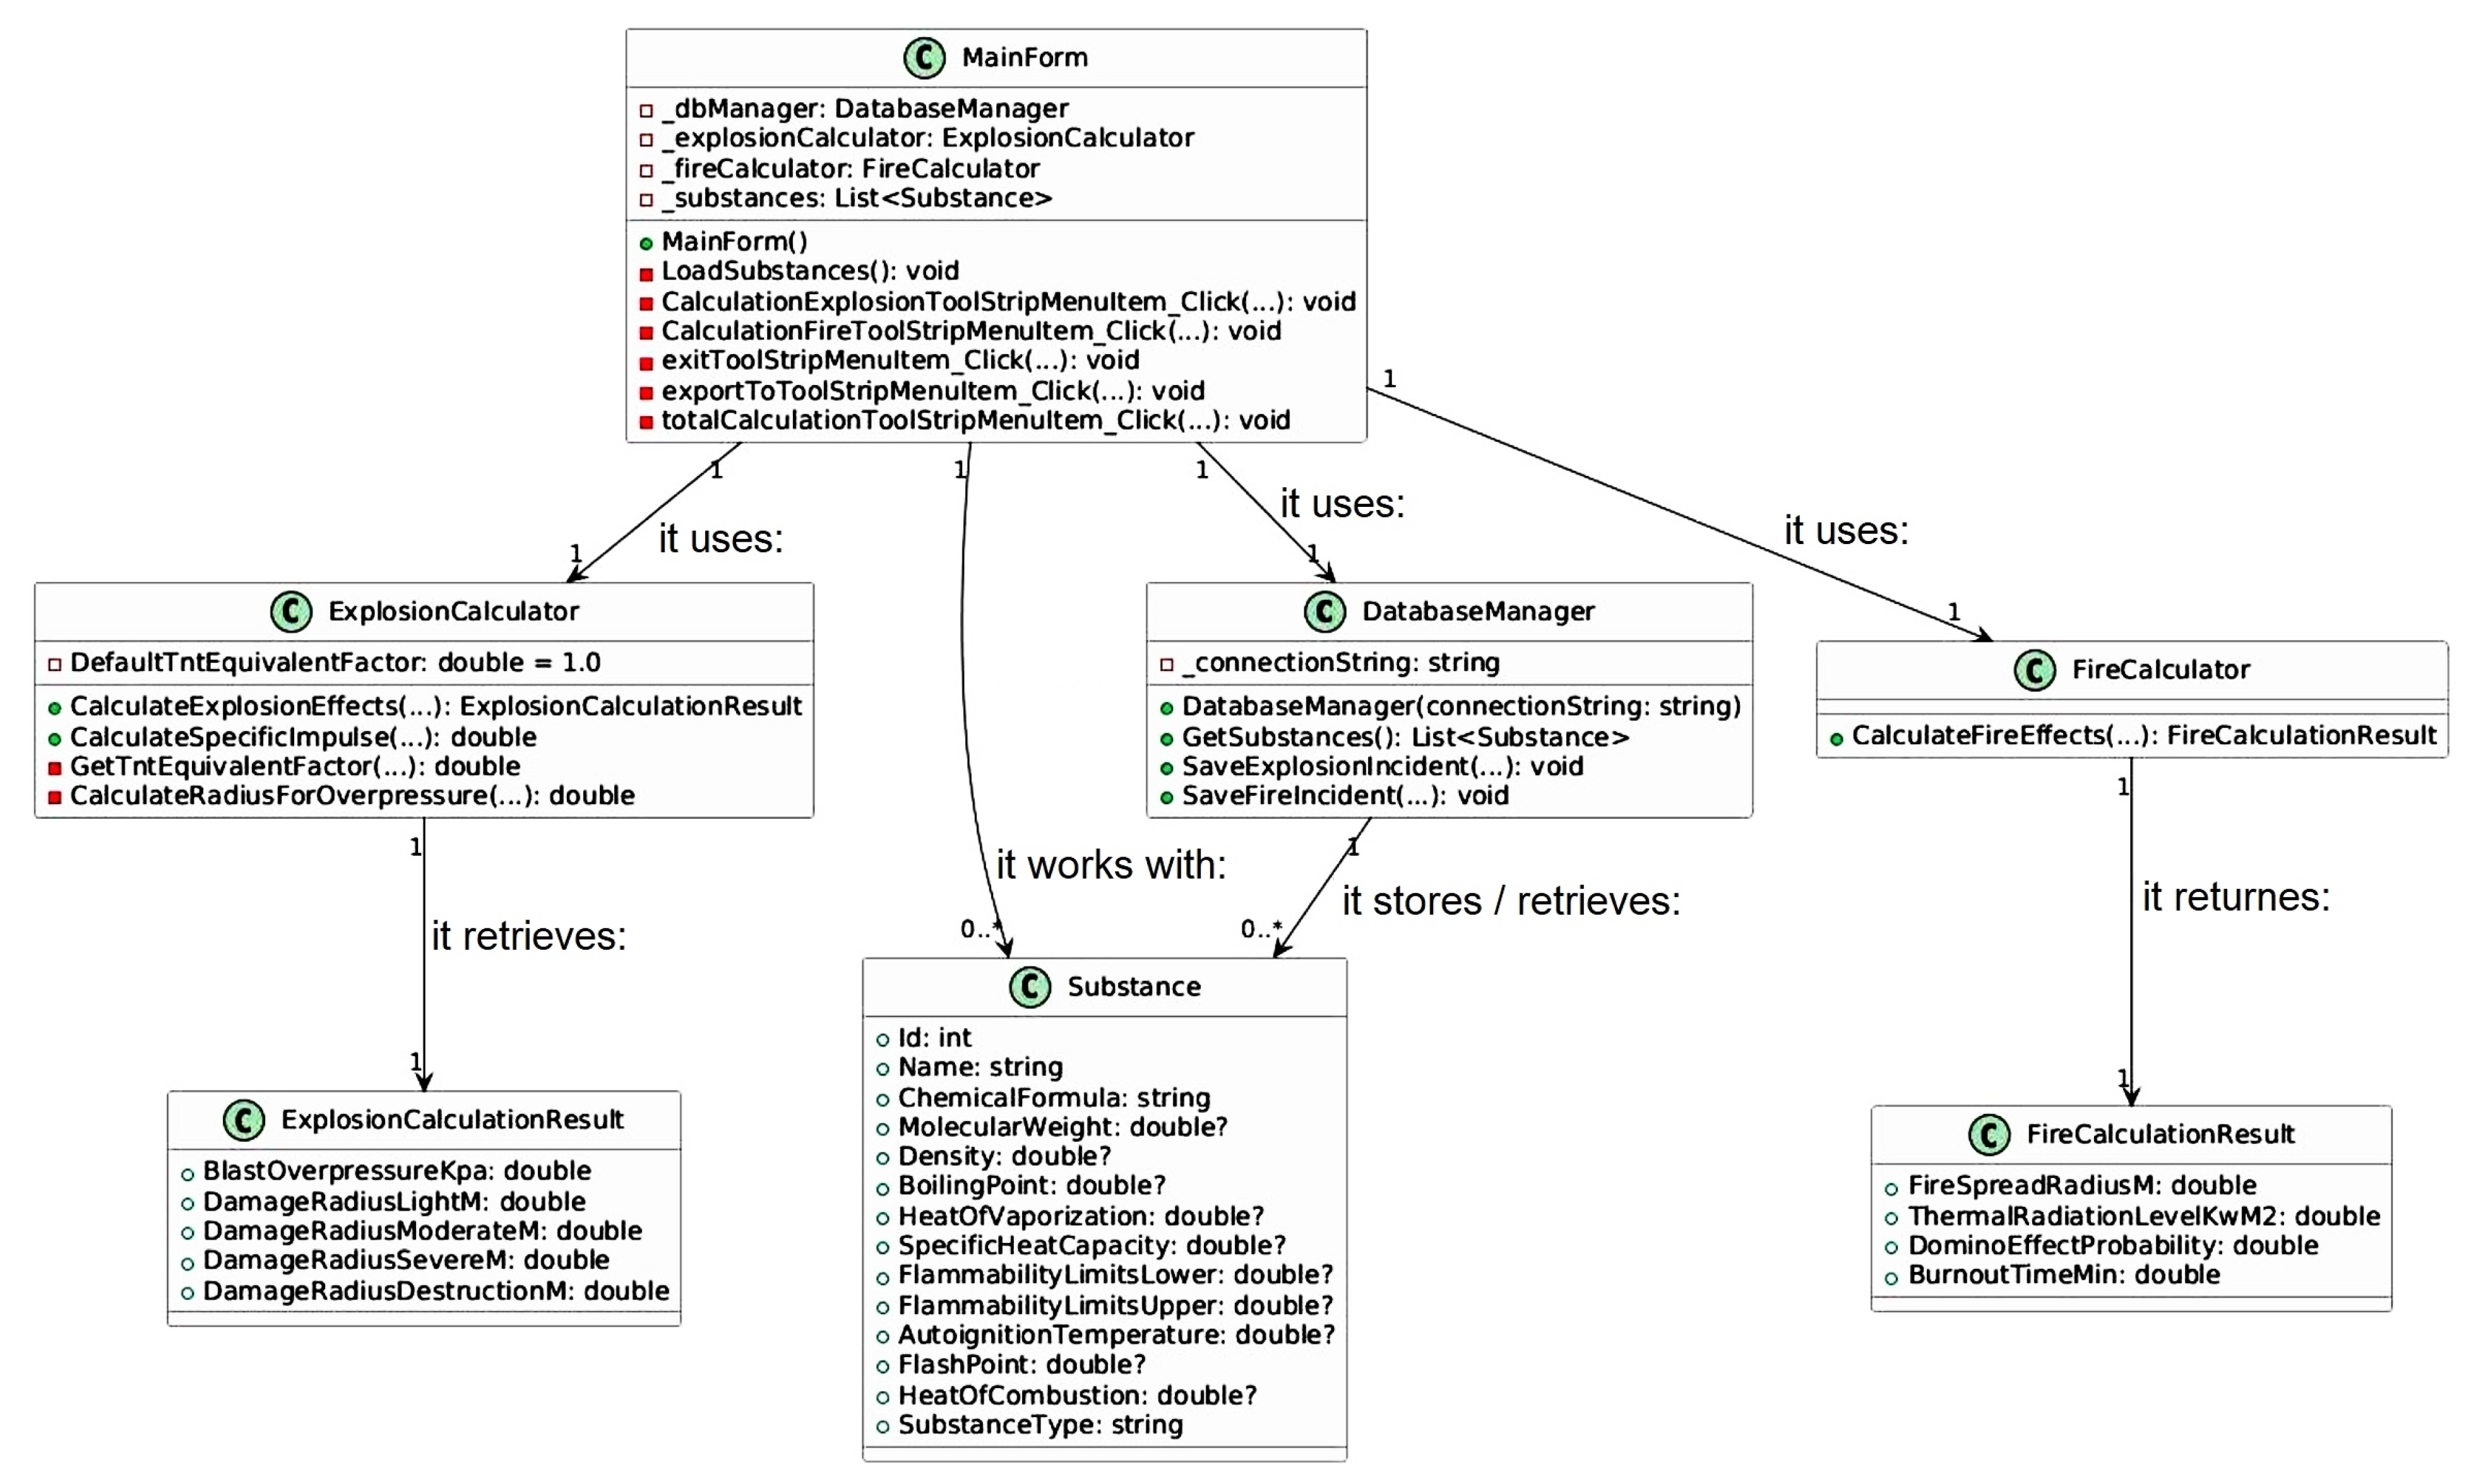
- The client layer (WinForms in C#) includes three main forms of interaction with the user. The main form serves as the central node of the system, where the input of incident parameters, selection of the calculation type, and management of the modeling process take place. The visualization form is responsible for the graphical presentation of the calculation results, converting numerical data into interactive maps of pollution zones, dynamic graphs of parameters, and emergency development scenarios. The report form specializes in generating structured PDF and Excel documents for subsequent analysis and documentation.
- The business logic represents the computing core of the system, consisting of three key components. The calculation manager coordinates the execution of mathematical models, selecting the appropriate explosion or fire algorithm based on input parameters, and manages the calculation flow. The model validator performs the critical function of comparing the results of its own calculations with traditional scientific models, calculating accuracy metrics for a quantitative assessment of the system’s advantages. The substance service ensures work with chemical characteristics, providing filtering by hazard types, normalization of physicochemical properties, and efficient access to data for calculation modules.
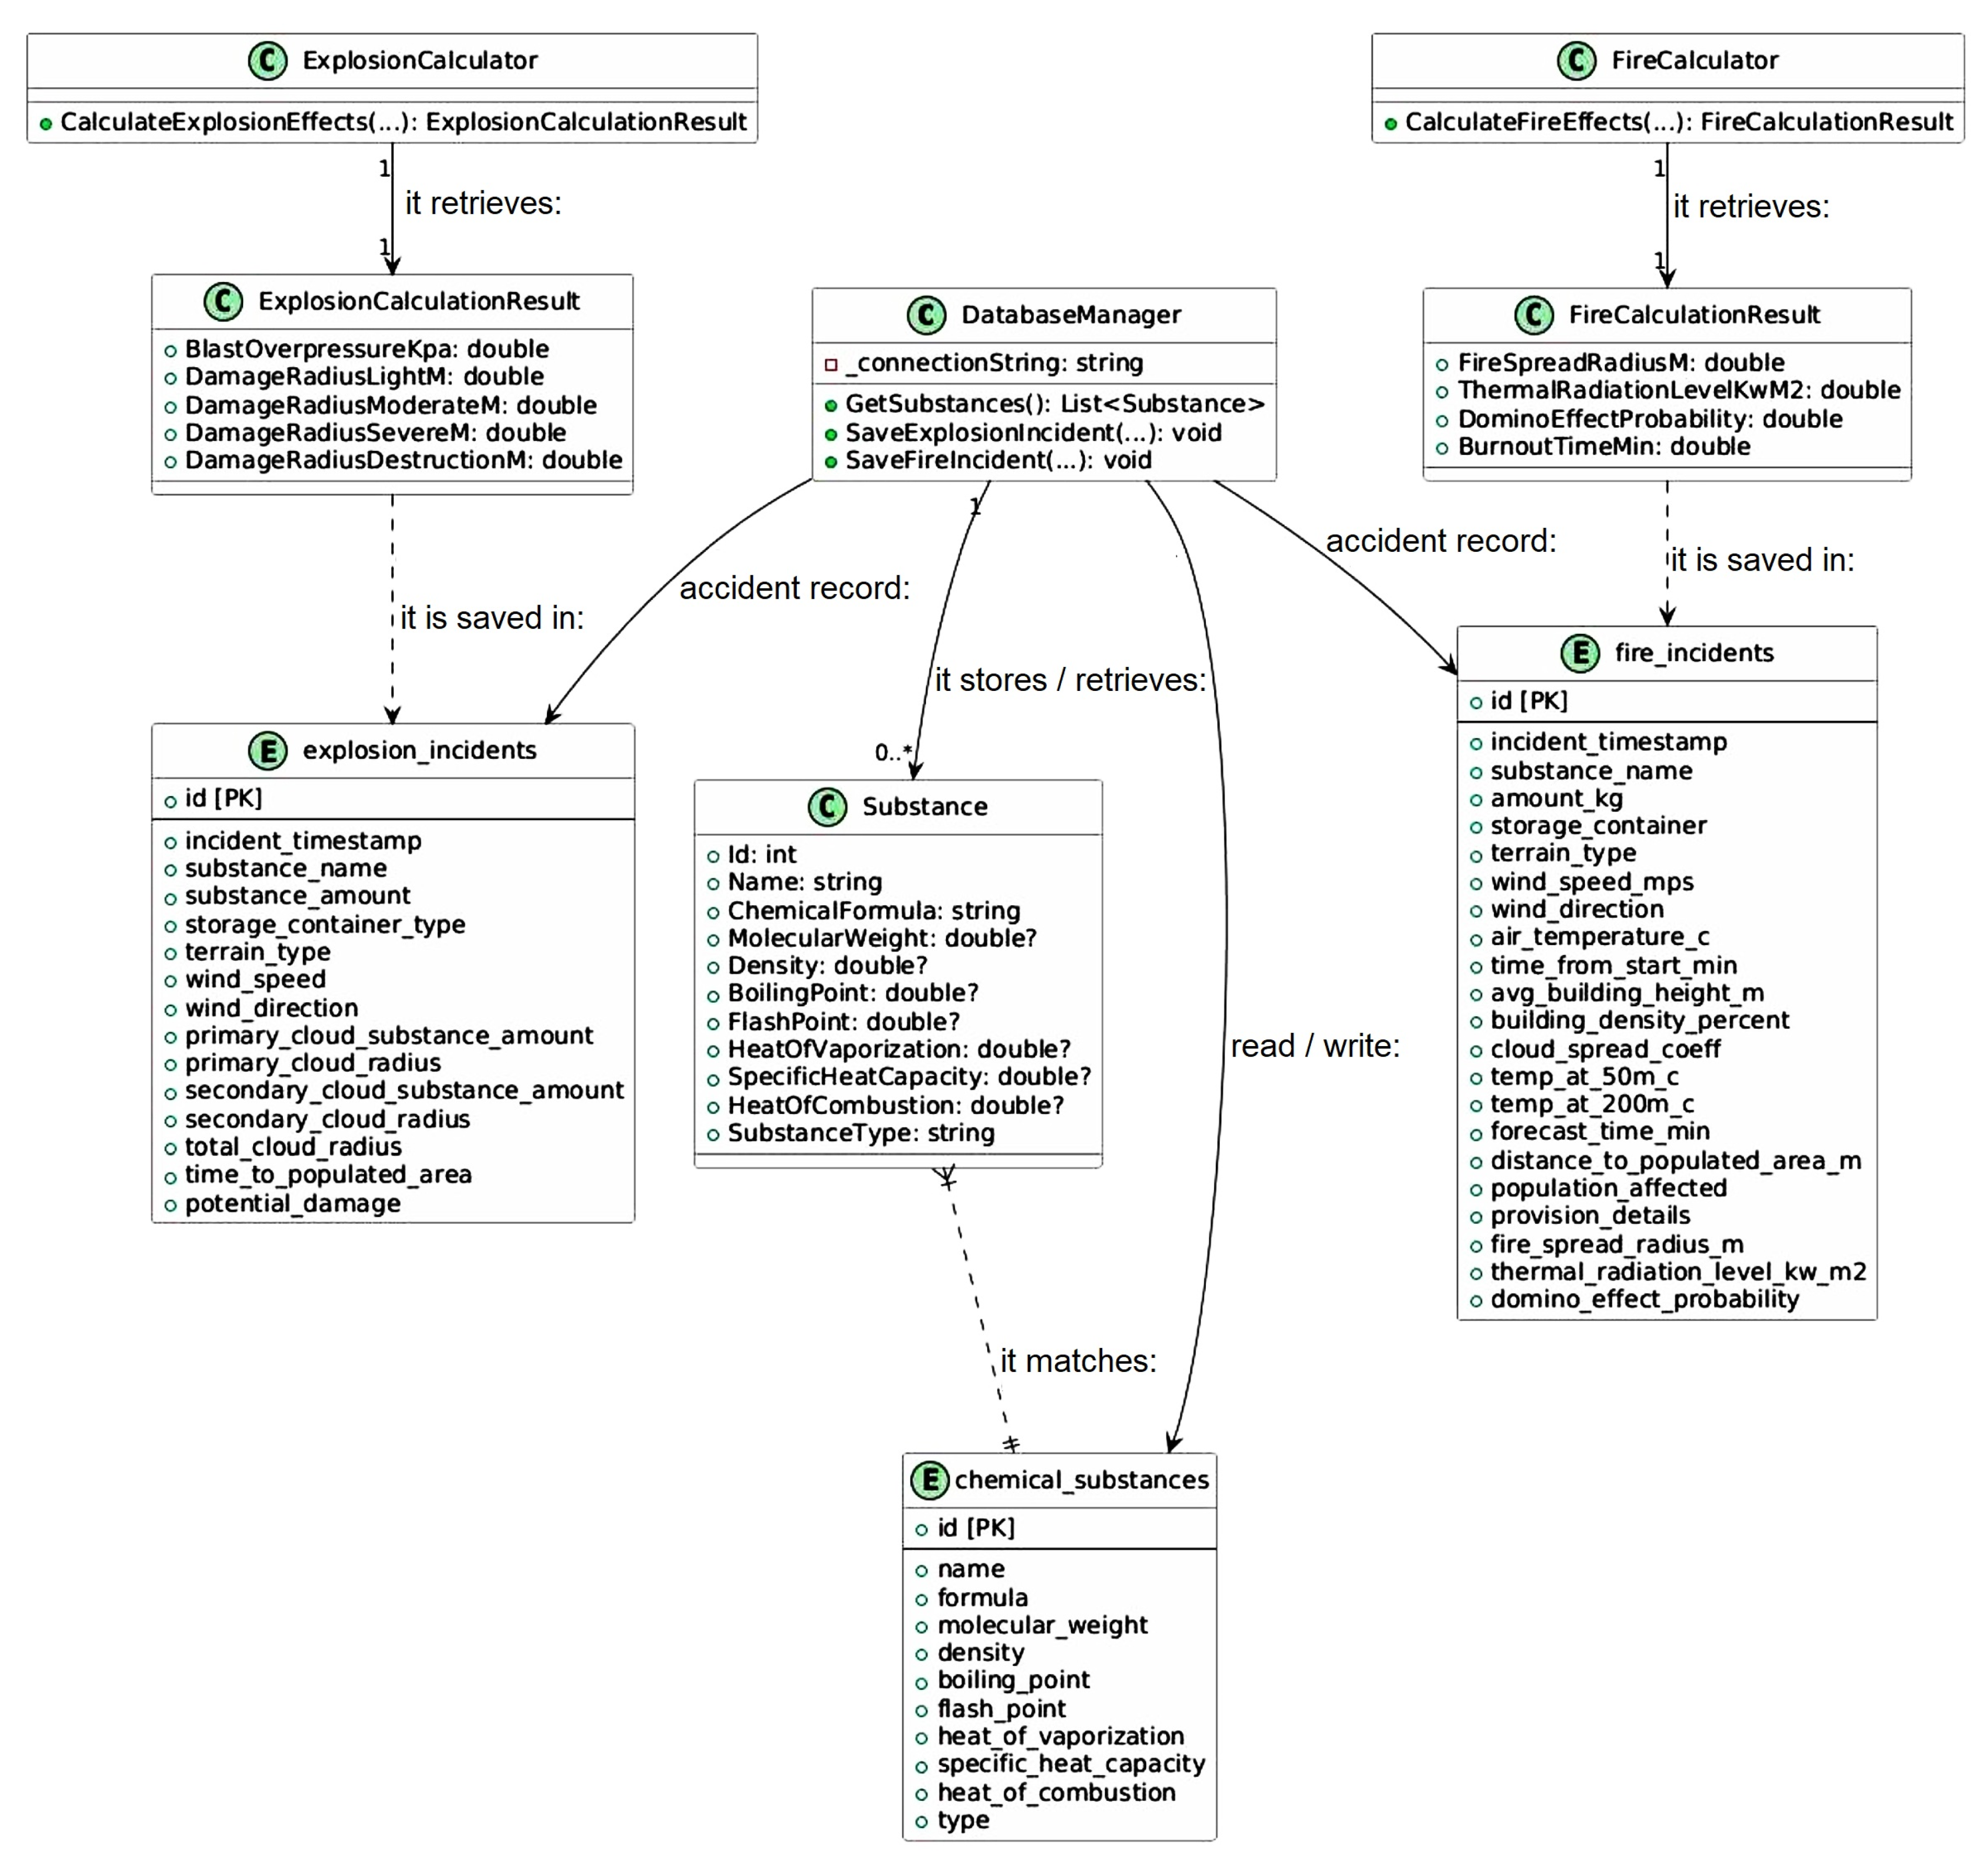
- The data layer for working with PostgreSQL organizes interaction with the information storage through specialized components. The Database Manager centrally manages connections to the database, implementing transactional query processing and ensuring the integrity of information during operations. Repositories of explosions, fires, and substances encapsulate the logic of working with the corresponding database tables, providing optimized methods for creating, reading, updating, and deleting records, which enables the isolation of business logic from the specifics of data storage. The databases include a catalog of chemical compounds, parameters, and results of modeling explosive incidents and data for hazardous fire situations.
- The visualization module converts the calculated data into graphical representations. The cartographic module integrates with geographic services to overlay the affected areas on real terrain maps, with the possibility of detailed analysis of the territories. The report generator compiles all types of visualizations and numerical data into a single document with customizable templates for different categories of users.
- External systems extend functionality through integration with specialized services. The weather service provides historical and forecast data on the weather conditions, which are critical for the accurate modeling of hazardous substances’ spread. The mapping service provides the system with detailed terrain bases, geocoding, and route calculation tools, which help link calculations to real geographic coordinates and infrastructure objects.
- The links between the components form a strict hierarchy of data and calculation management. The user interacts exclusively with the client layer, initiating operations through the main form. Calculation requests are transferred to the calculation manager, which coordinates the acquisition of substance properties and model validation. All data operations are sent through the Database Manager to specialized repositories that provide direct interaction with the database tables. Visualization and reporting forms request data directly from the calculation modules and the Database Manager, creating a closed information processing cycle. External systems are integrated pointwise: the cartographic module uses the API to obtain map bases, and the model validator accesses the weather service for historical data for comparative analysis.
- -
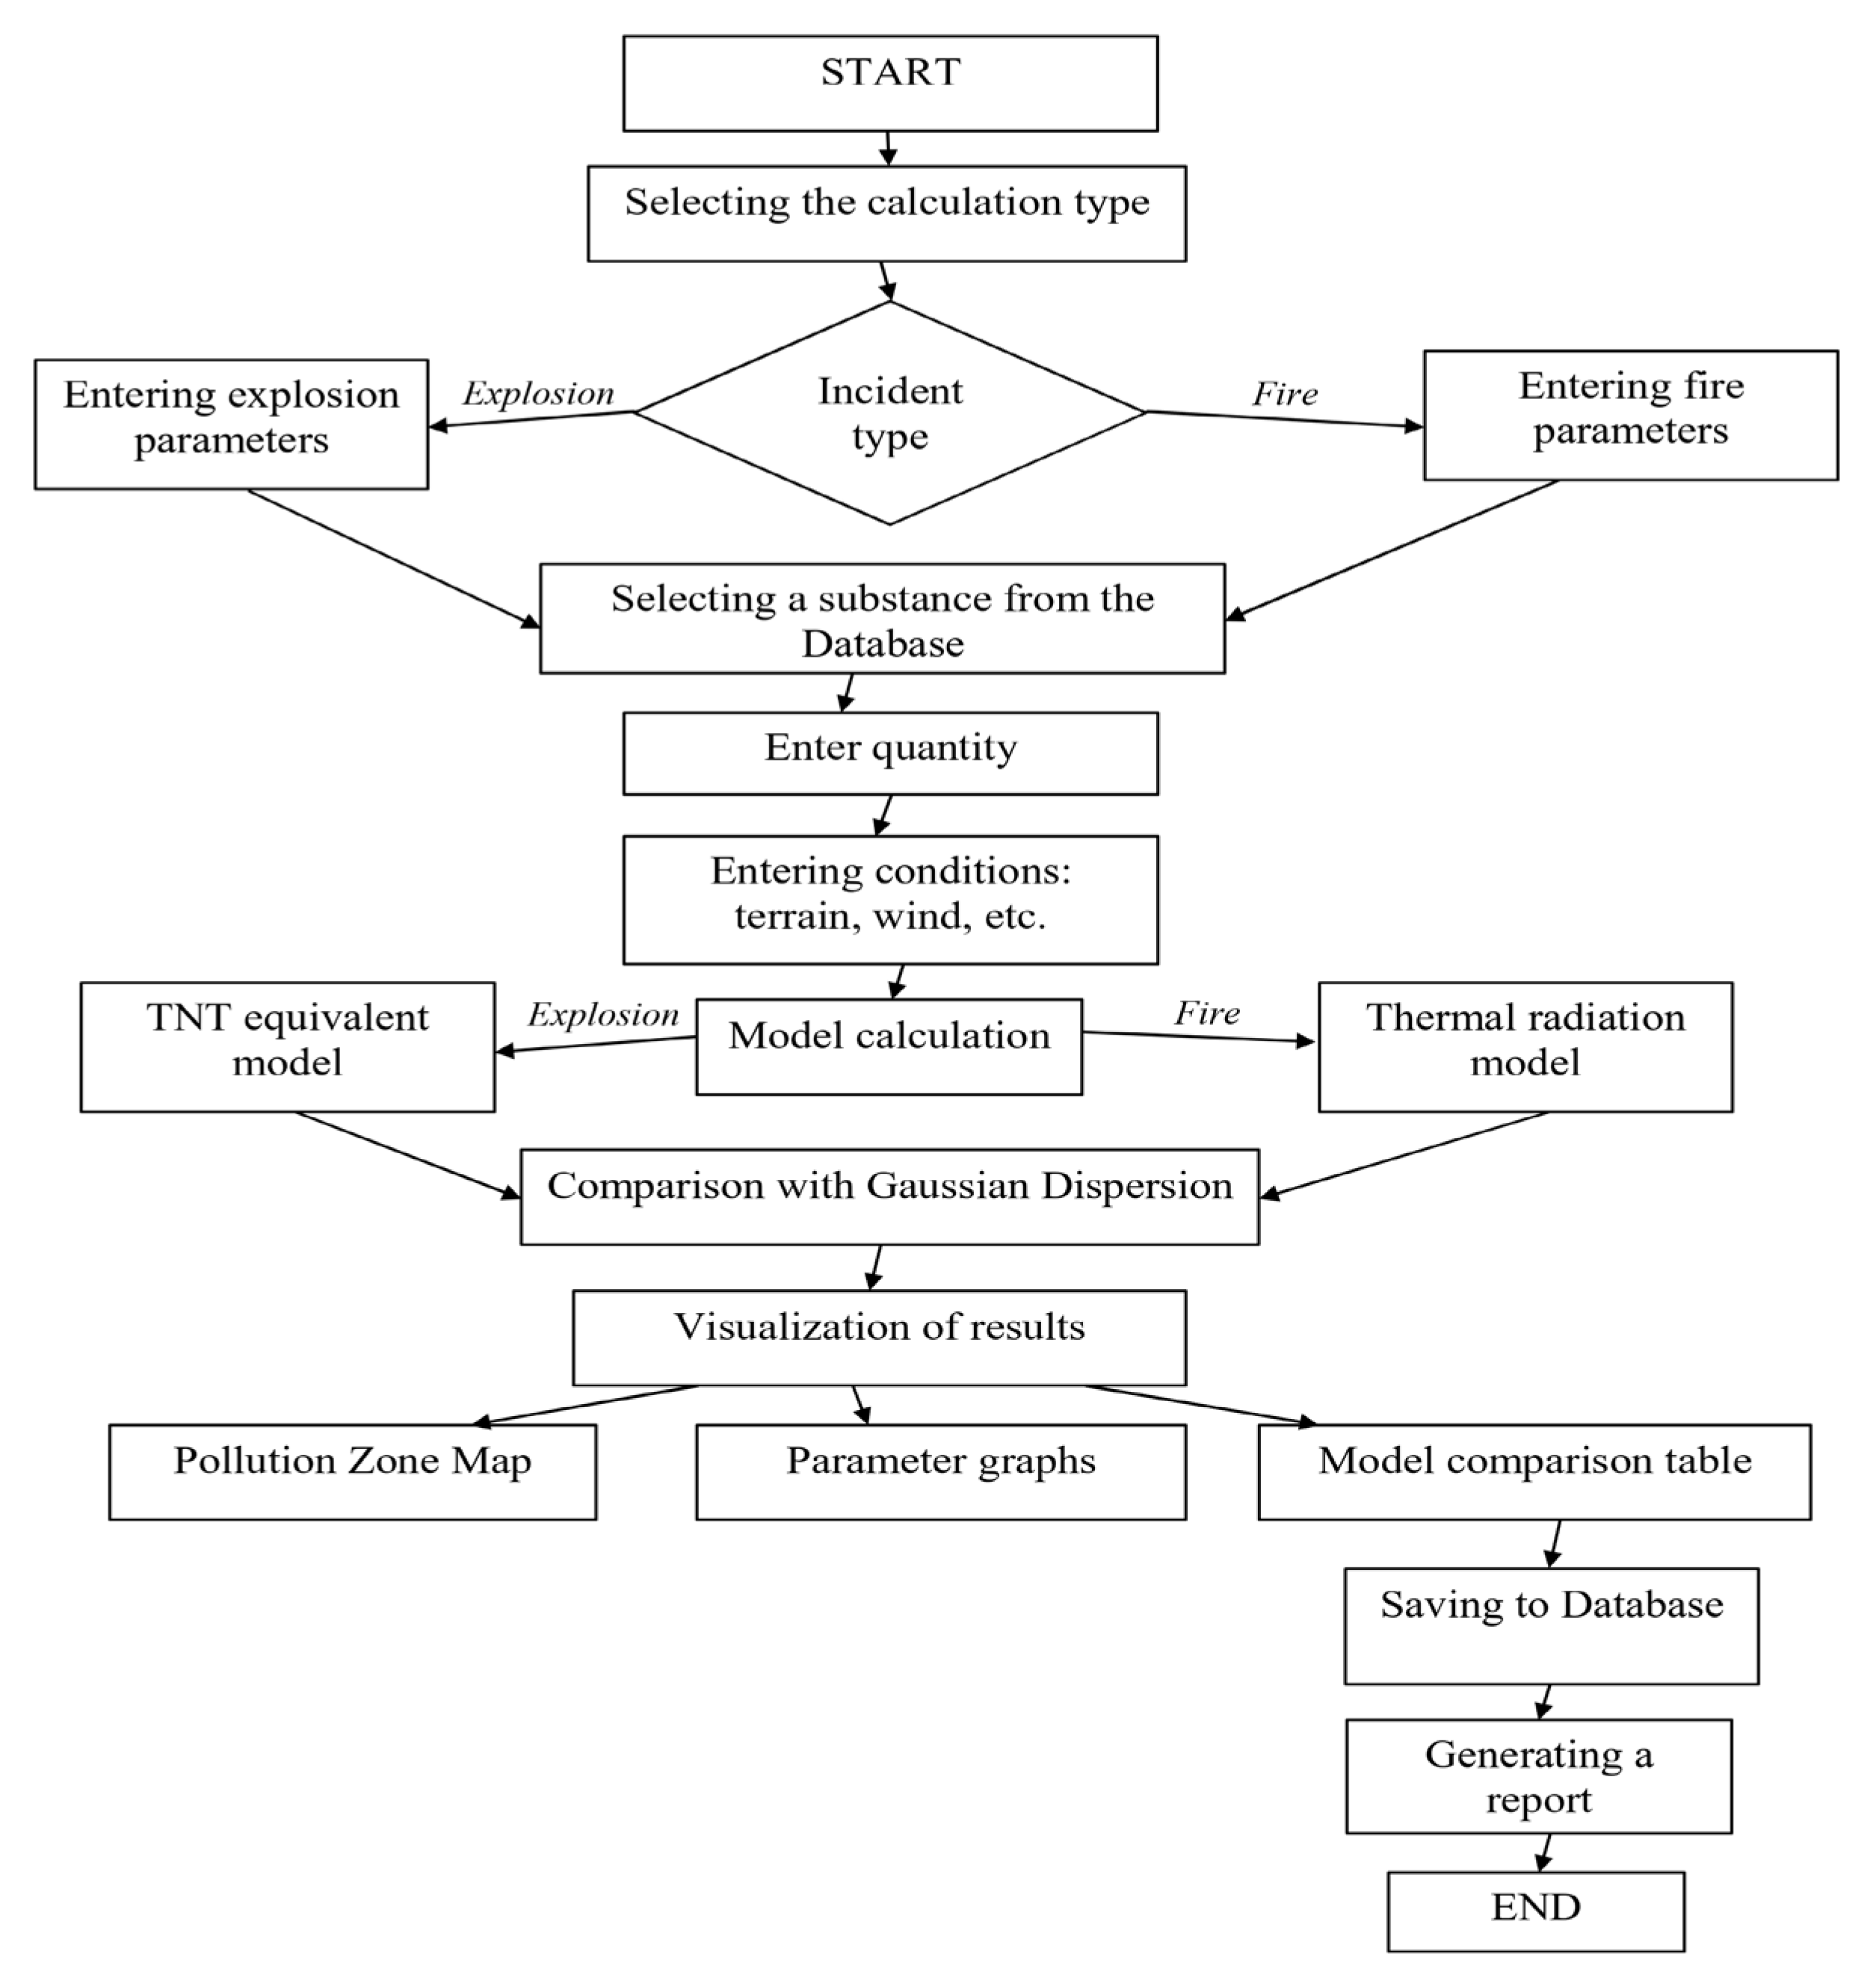
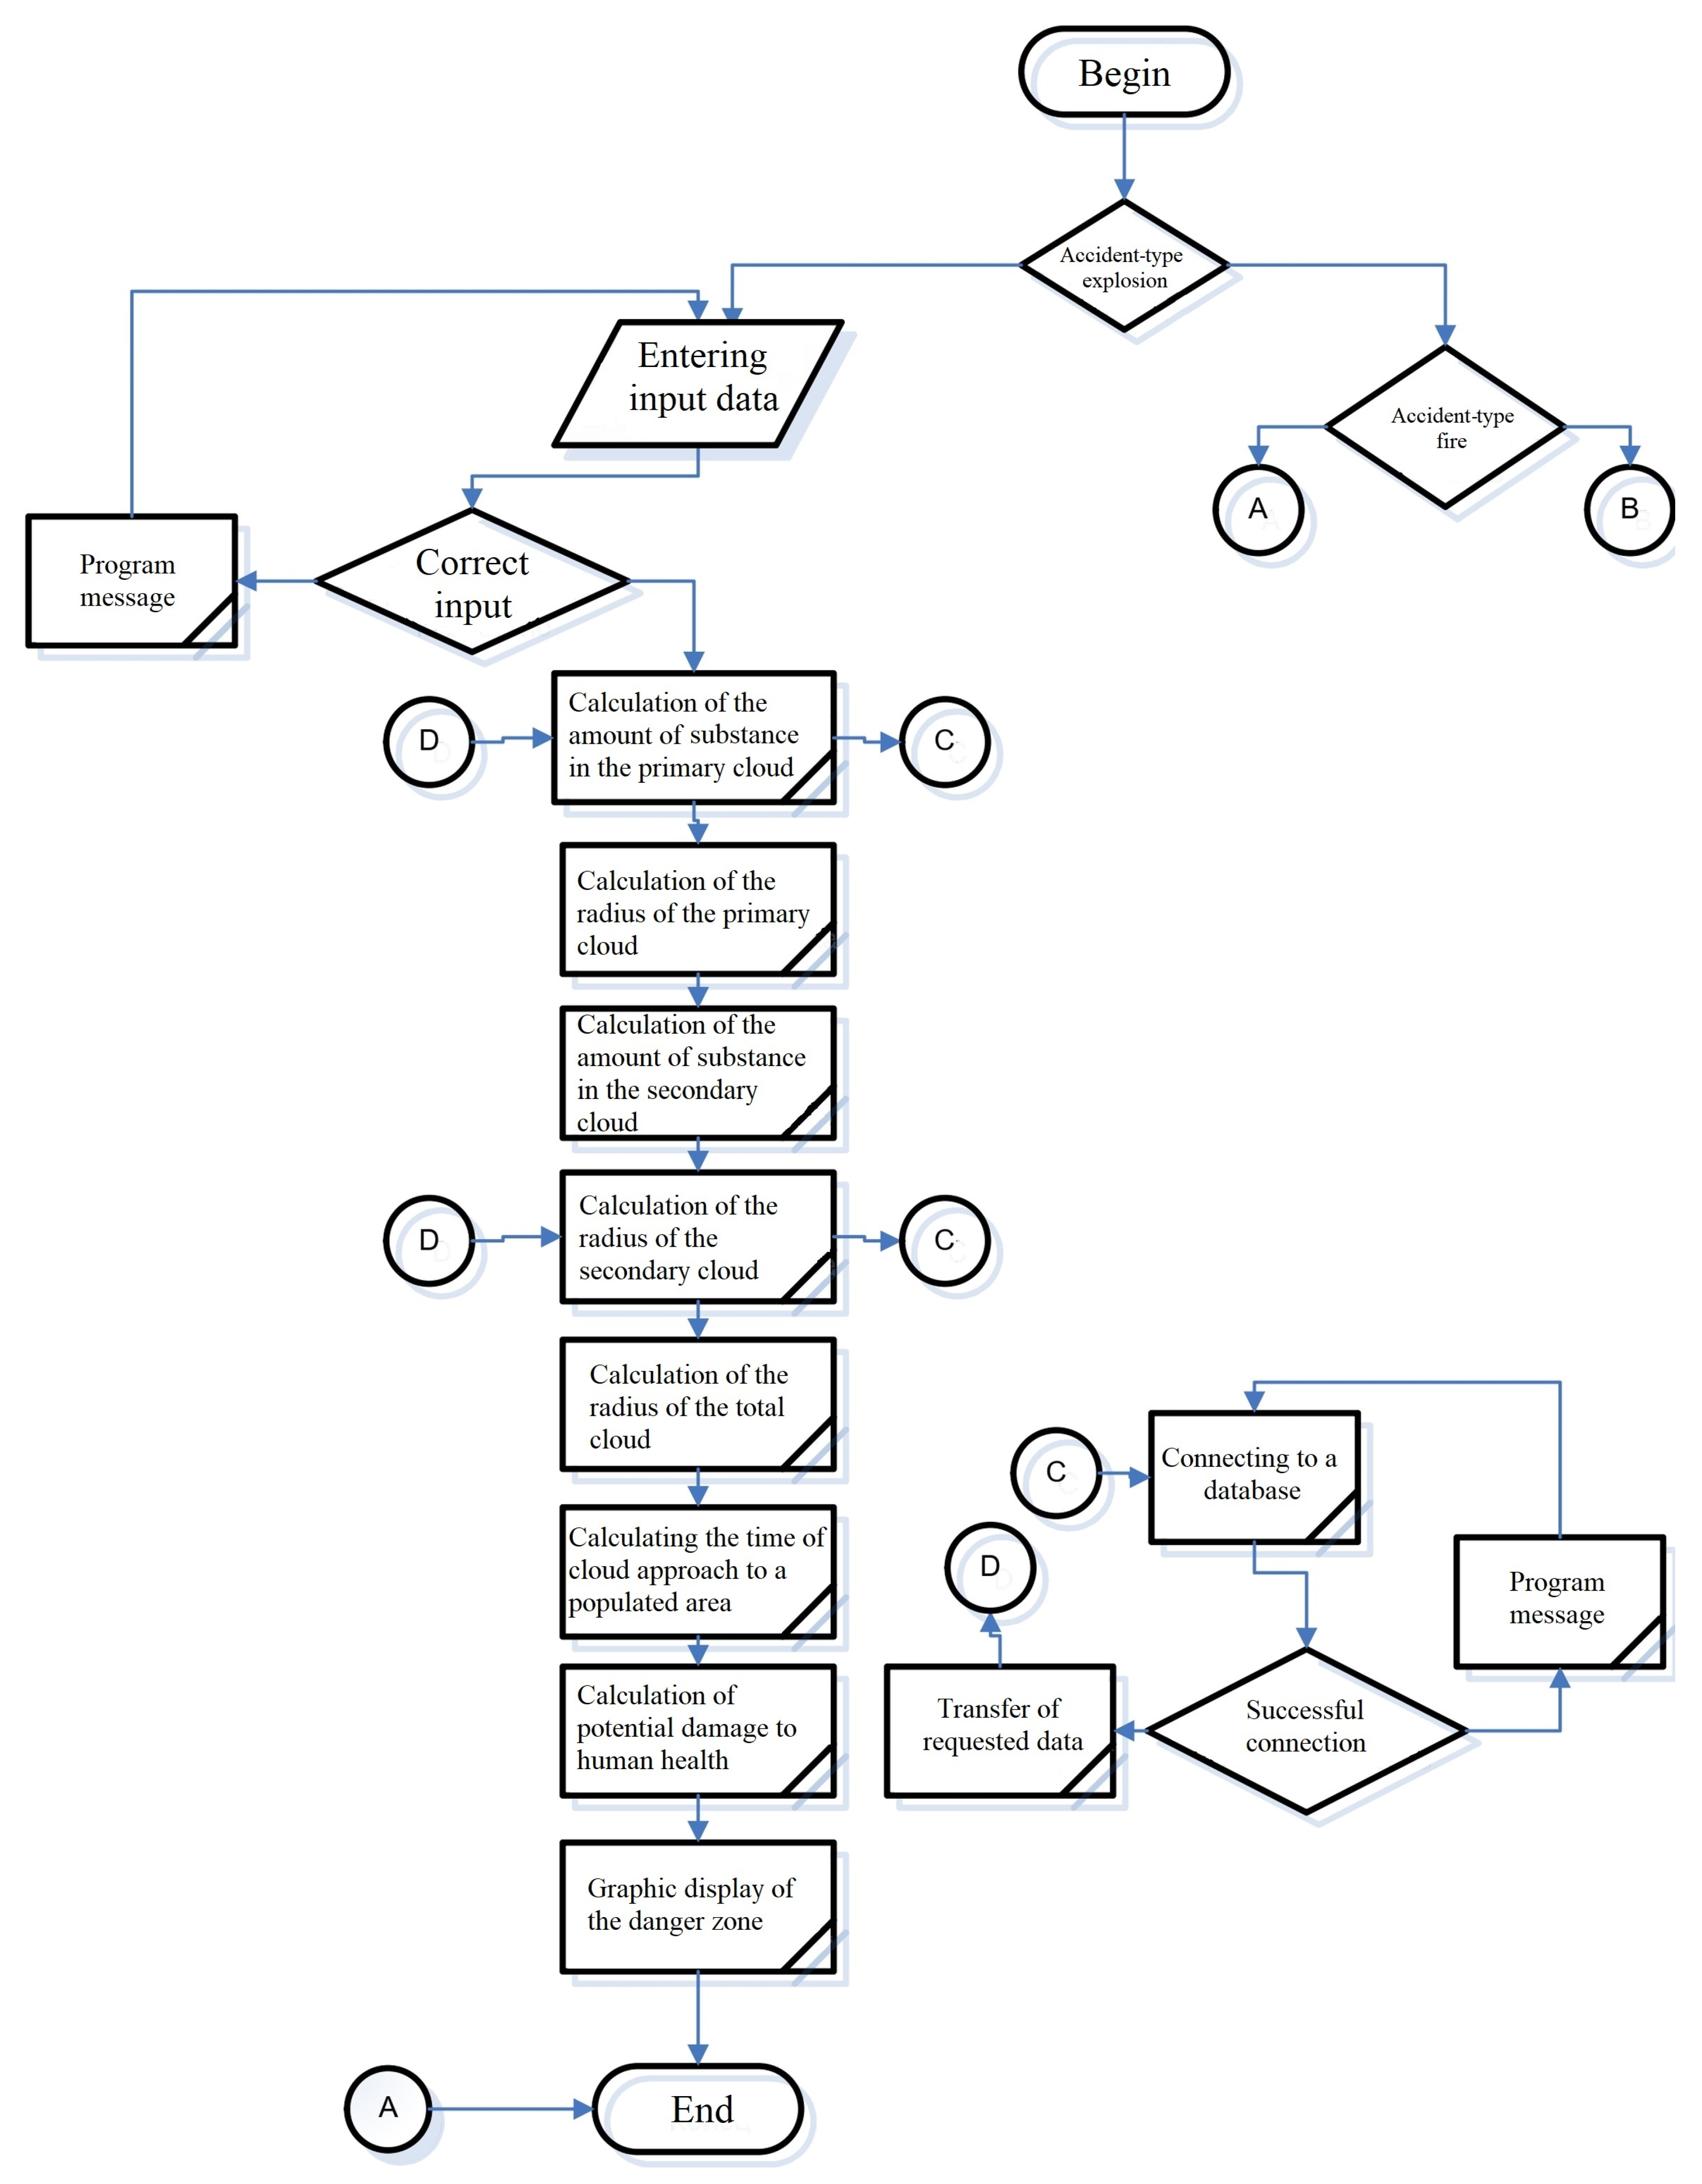
- Getting started: Selection of the modeling type (explosion/fire).
- -
- Entering parameters: Substance, quantity, and environmental conditions.
- -
- Calculating models: The simultaneous execution of the main and traditional models.
- -
- Comparing accuracy: The automatic assessment of discrepancies using RMSE metrics.
- -
- Visualization: Interactive damage maps and parameter graphs.
- -
- Saving and reporting: Export of results to the database and generation of reports.
| def calculate_metrics(actual, predicted): # Root Mean Square Error (RMSE) rmse = sqrt(mean_squared_error(actual, predicted)) # Mean absolute percentage error (MAPE)
|
| public class ModelValidator { public ValidationResult ValidateExplosion(Substance substance, double amount, double distance, double windSpeed) { // Calculating our model var firesoftResult = new ExplosionCalculator().Calculate( substance, amount, distance, "PressurizedVessel"); // Calculation of the Gaussian model var gaussian = GaussianDispersion.Calculate( substance, amount, windSpeed, distance); return new ValidationResult { FiresoftValue = firesoftResult.BlastOverpressureKpa, GaussianValue = gaussian.Overpressure, RMSE = CalculateRMSE(firesoftResult, gaussian), MAPE = CalculateMAPE(firesoftResult, gaussian) }; } private double CalculateRMSE(ExplosionResult our, GaussianResult traditional) { double sum = 0; int count = our.PressurePoints.Count; for (int i = 0; i < count; i++) { double diff = our.PressurePoints[i] - traditional.PressurePoints[i]; sum += diff * diff; } return Math.Sqrt(sum / count); } } |
| void ShowValidationResults(ValidationResult result) { txtRMSE.Text = $”RMSE: {result.RMSE:F2} кΠa”; txtImprovement.Text = $”Improving accuracy: {CalculateImprovement(result):F1}%”; chart.Series[“FireSoft”].Points.AddY(result.FiresoftValue); chart.Series[“Gaussian”].Points.AddY(result.GaussianValue); chart.Series[“Actual”].Points.AddY(result.ActualValue); } |
- A total of 67.2% lower error compared to the Gaussian model.
- Stability of results in various conditions.
- Practical applicability for predicting the consequences of emergencies.
3.2. Interface of the Software Tool Used for Modeling the Hazardous Zone of a Toxic Cloud During an Accident at an Enterprise
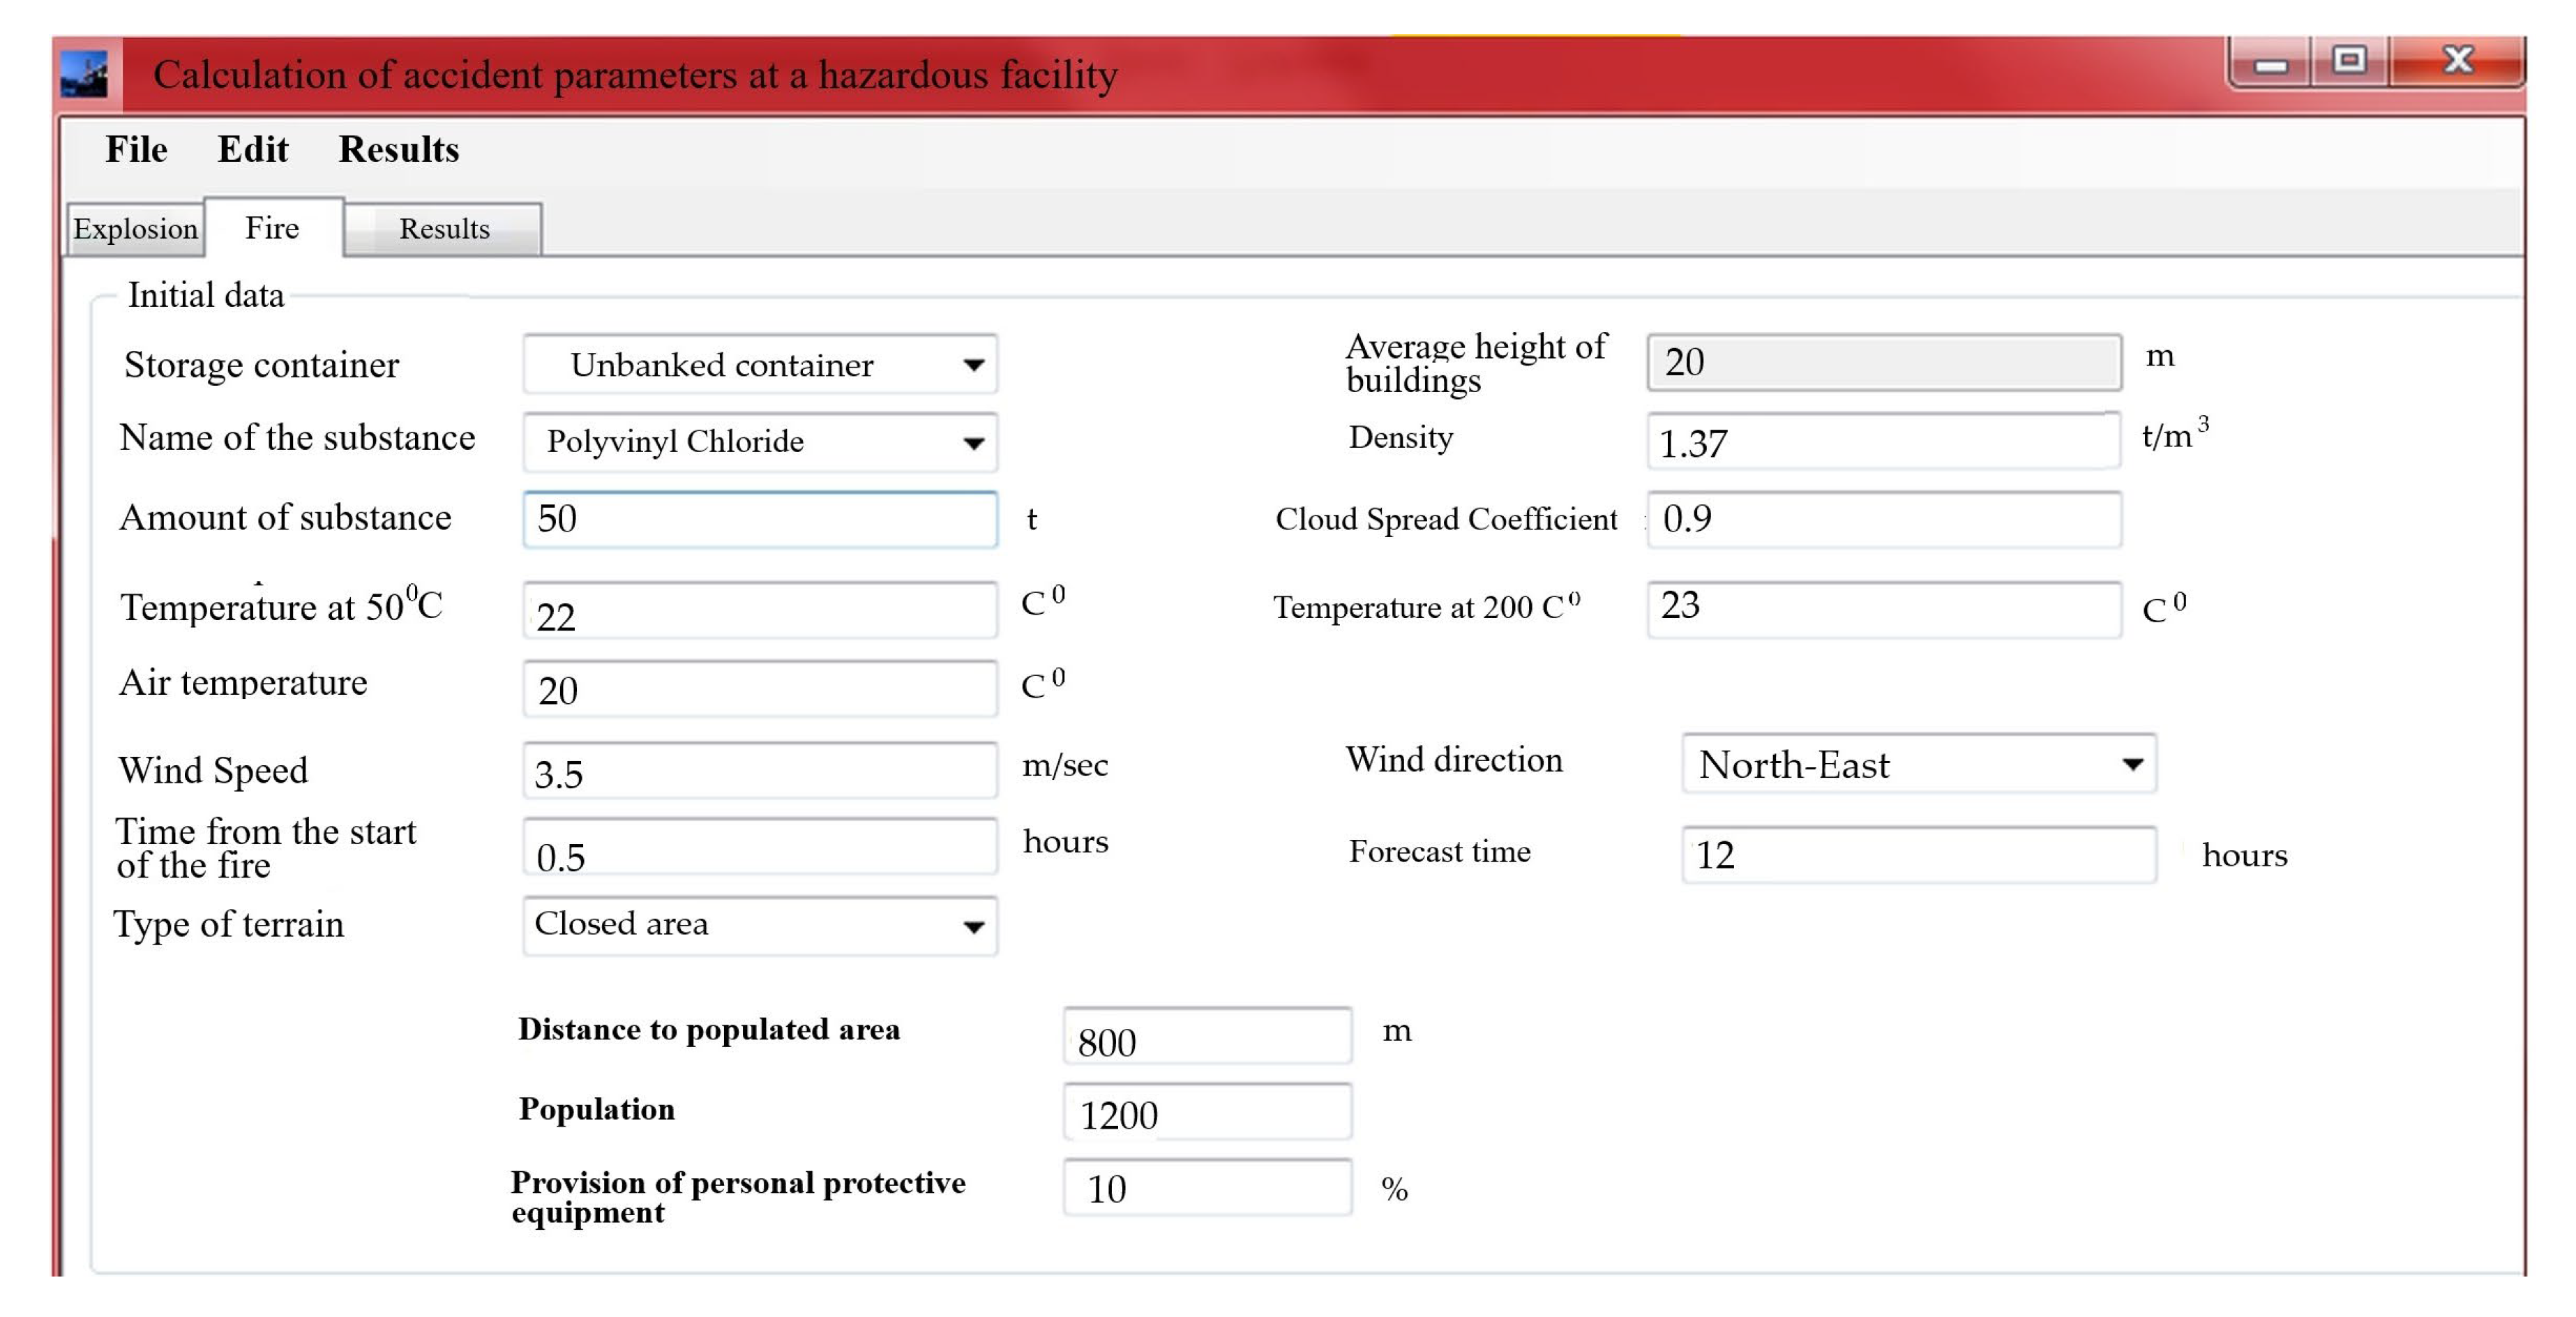
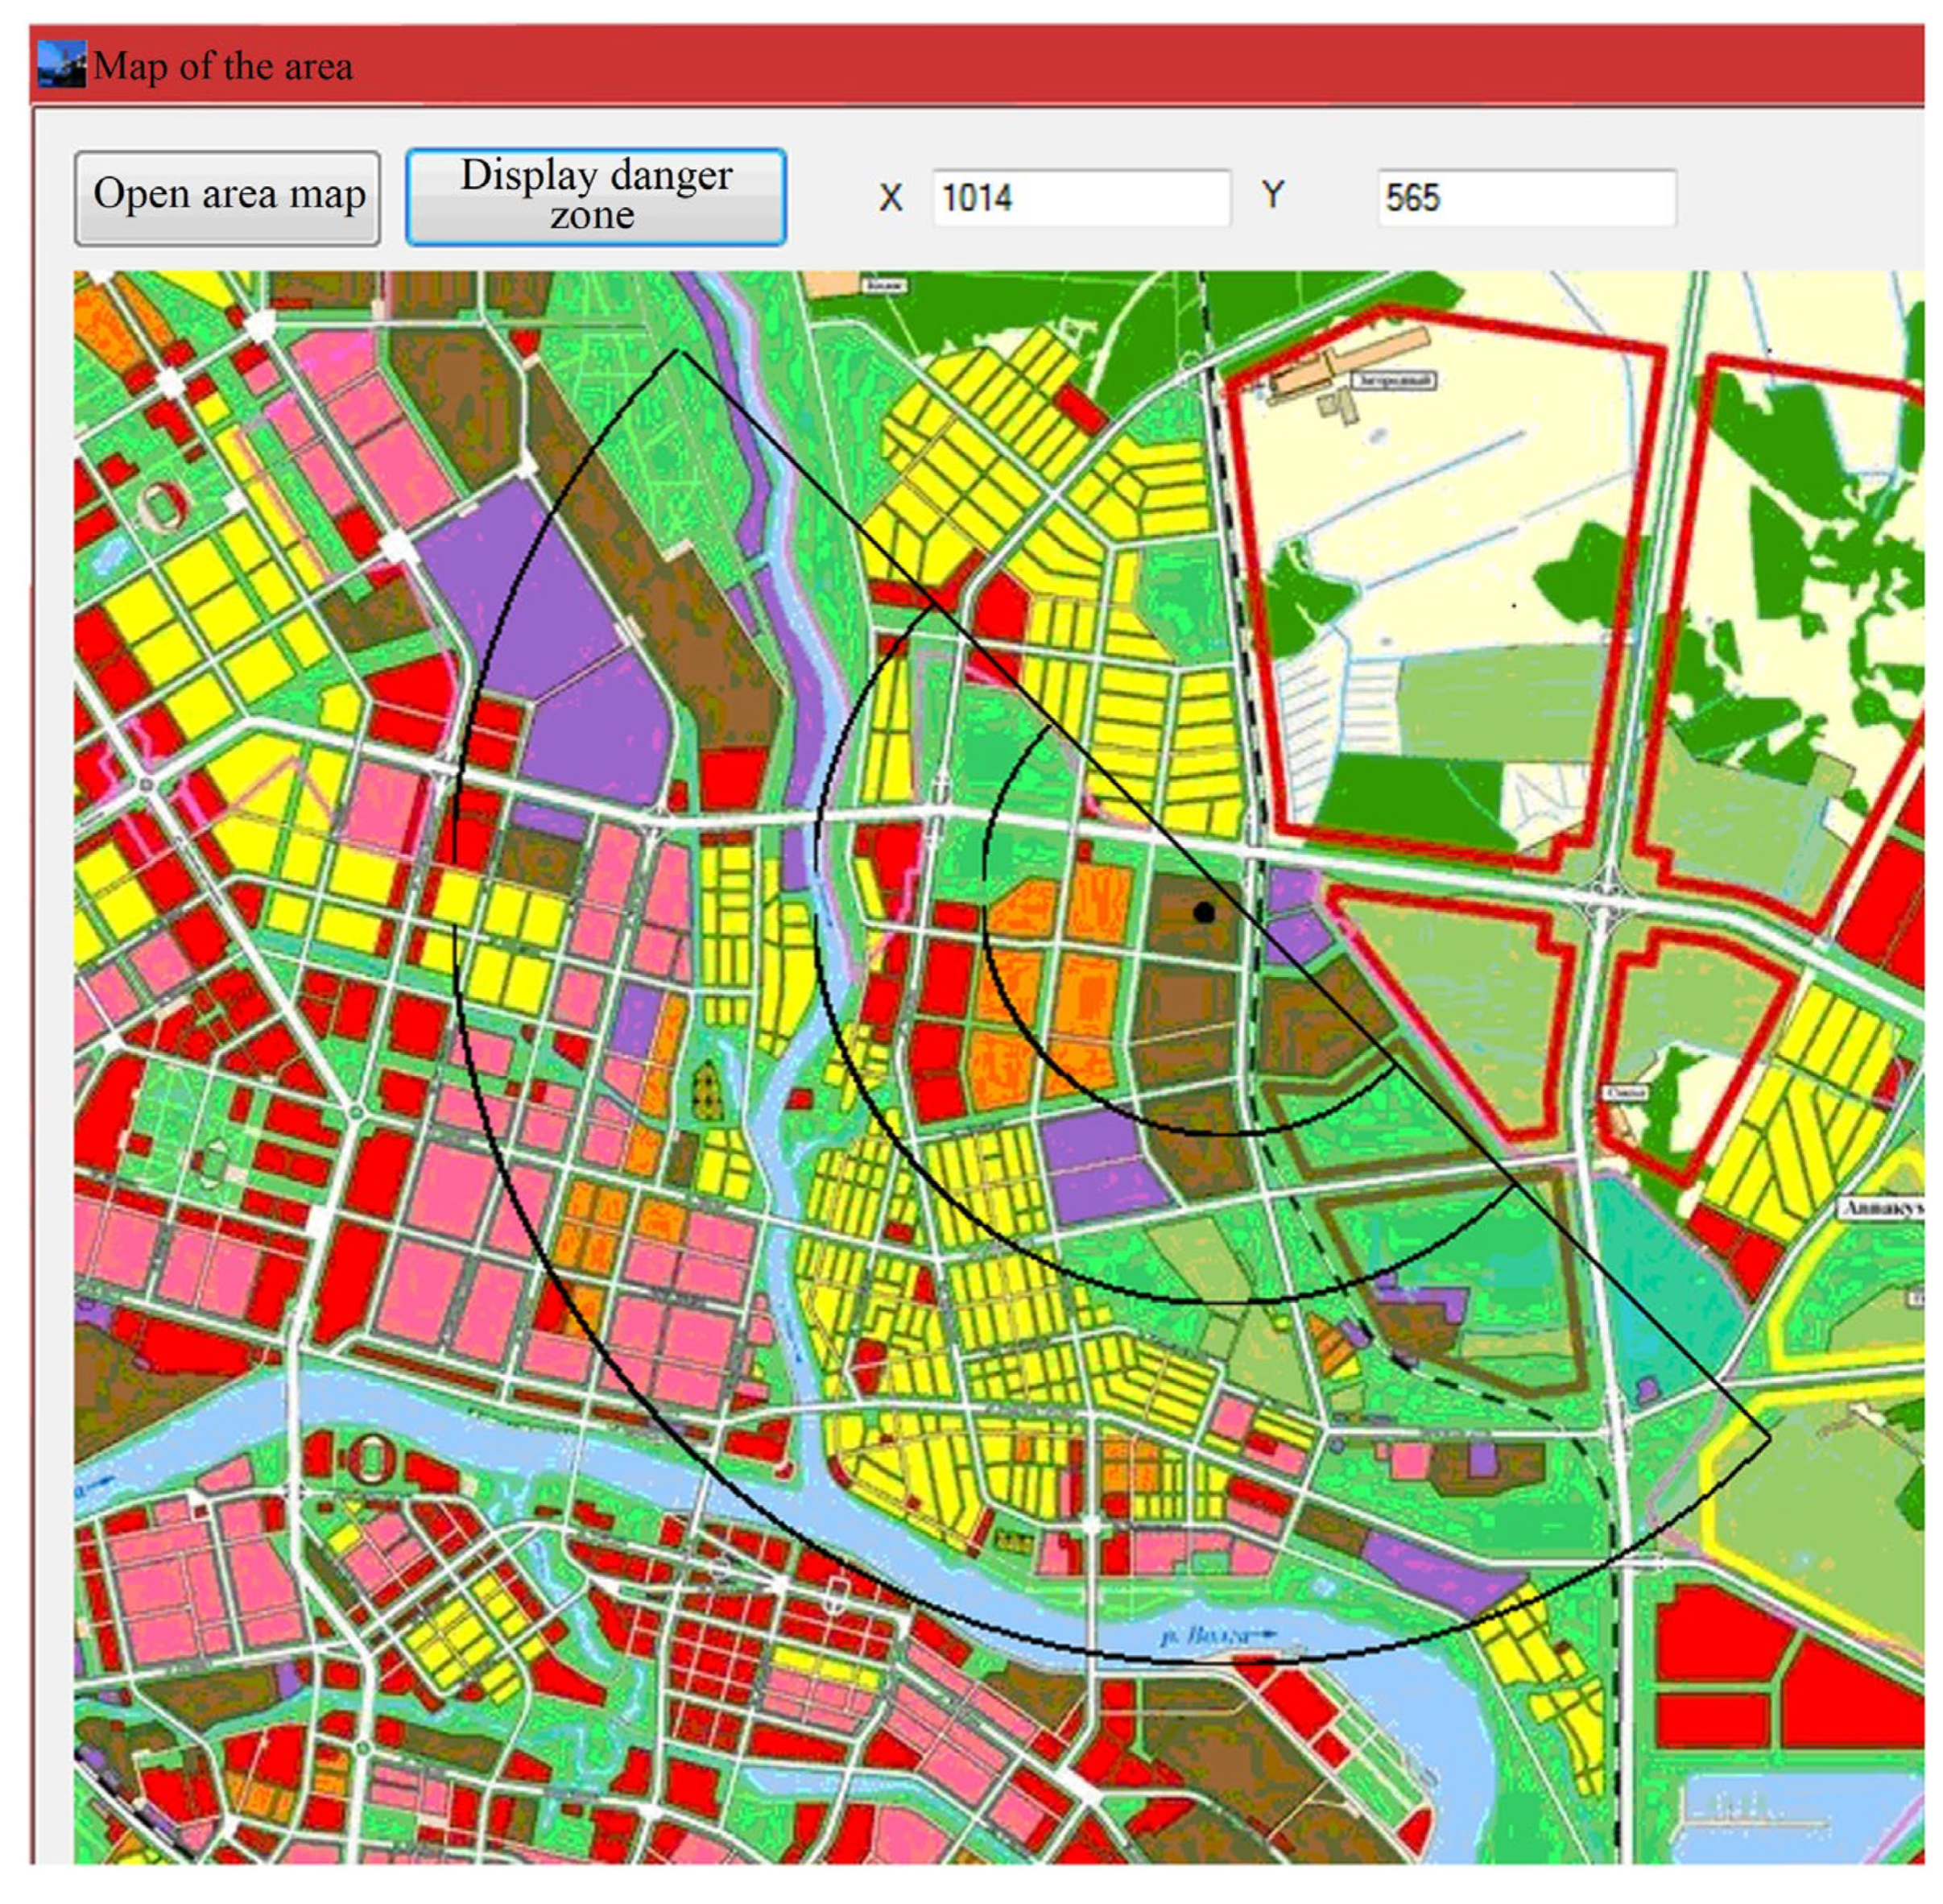
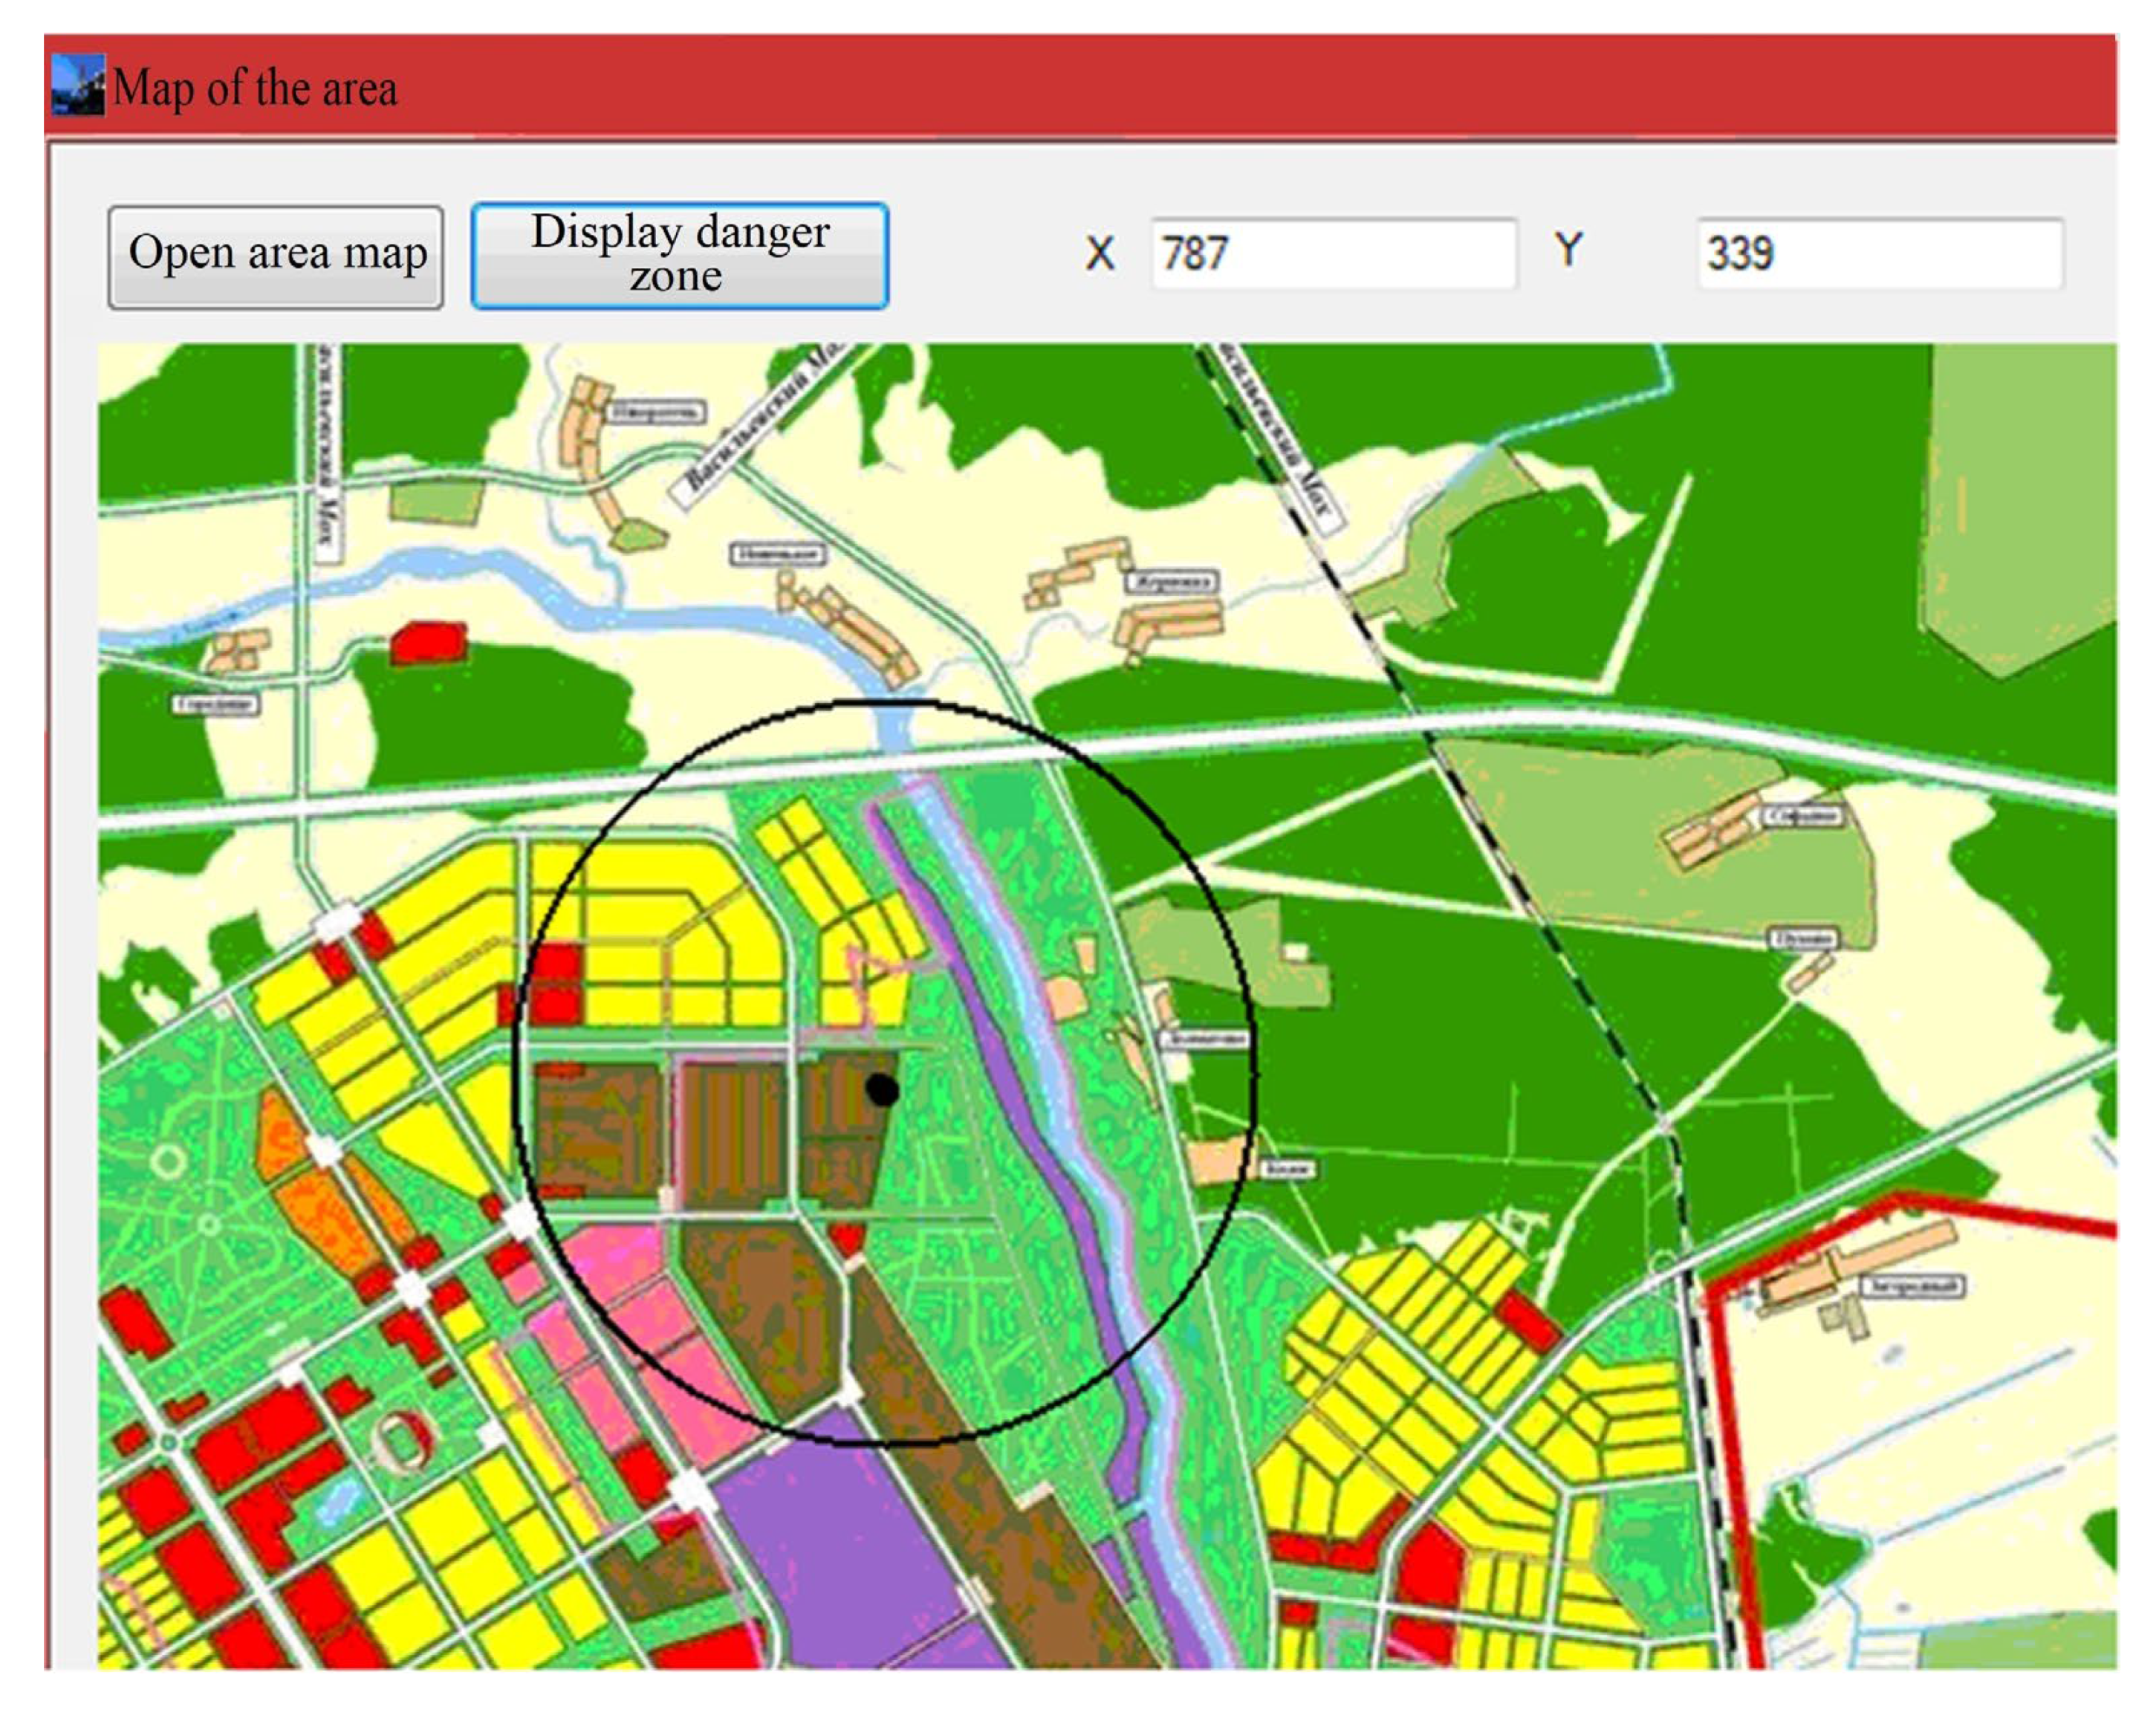
3.2.1. Interface of the Software Tool Used to Determine the Danger Zone for the “Fire” Accident Type
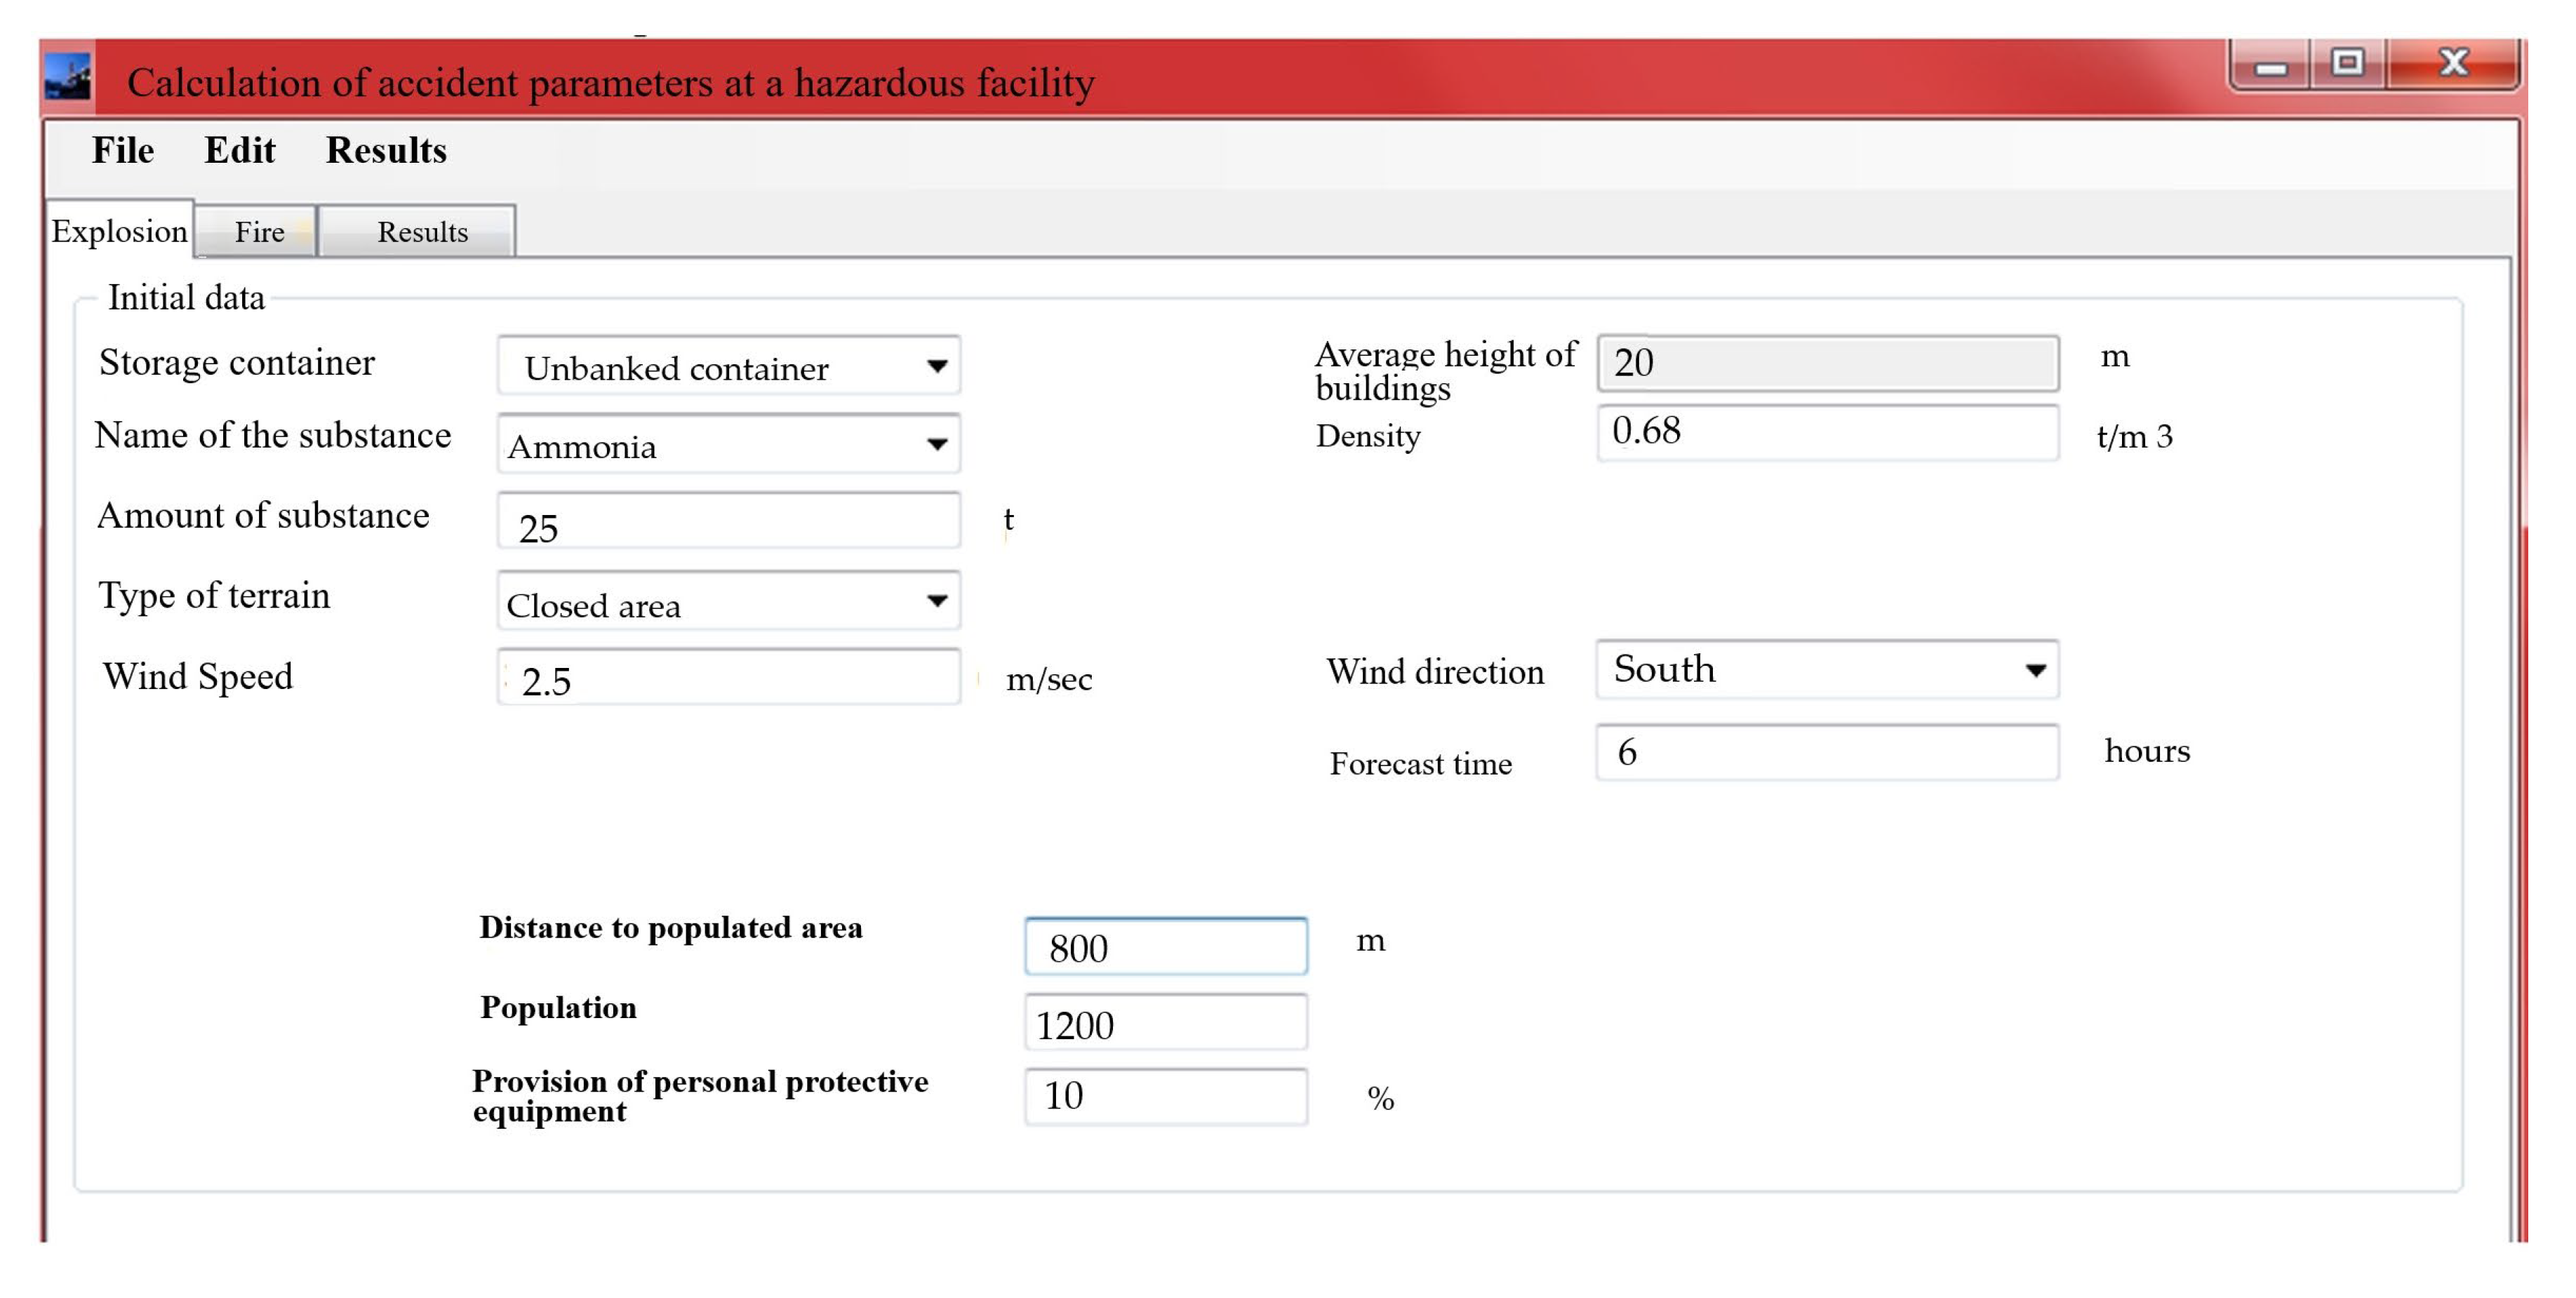
3.2.2. Interface Used for Defining a Hazardous Area for the “Explosion” Accident Type
4. Discussion
5. Conclusions
Author Contributions
Funding
Informed Consent Statement
Data Availability Statement
Conflicts of Interest
Appendix A
- (A)
- Code for Program.cs:
| namespace FireSoft { internal static class Program { /// <summary> /// The main entry point for the application. /// </summary> [STAThread] static void Main() { ApplicationConfiguration.Initialize(); Application.Run(new MainForm()); } } } |
- (B)
- Code for Form1.cs:
| using FireSoft.CoreLogic; using System; using System.Collections.Generic; using System.ComponentModel; using System.Data; using System.Drawing; using System.Linq; using System.Text; using System.Threading.Tasks; using System.Windows.Forms; namespace FireSoft { public partial class MainForm: Form { private readonly DatabaseManager _dbManager; private readonly ExplosionCalculator _explosionCalculator; private readonly FireCalculator _fireCalculator; private List<Substance> _substances; private const string ConnectionString = "Host=localhost;Username=postgres;Database=firesoft"; public MainForm() { InitializeComponent(); _dbManager = new DatabaseManager(ConnectionString); _explosionCalculator = new ExplosionCalculator(); _fireCalculator = new FireCalculator(); _substances = new List<Substance>(); ToolStripMenuItem calculationFireToolStripMenuItem = new ToolStripMenuItem(); calculationFireToolStripMenuItem.Click += new System.EventHandler(this.CalculationFireToolStripMenuItem_Click); var fileMenu = menuStrip1.Items.OfType<ToolStripMenuItem>().FirstOrDefault(item => item.Name == "fileToolStripMenuItem"); if (fileMenu != null) { ToolStripMenuItem? calcMenu = fileMenu.DropDownItems.OfType<ToolStripMenuItem>().FirstOrDefault(item => item.Text == "Calculation"); if (calcMenu == null) { calcMenu = new ToolStripMenuItem("Calculation"); fileMenu.DropDownItems.Add(calcMenu); } calcMenu.DropDownItems.Add(calculationFireToolStripMenuItem); } else { menuStrip1.Items.Add(calculationFireToolStripMenuItem); } LoadSubstances(); } private void LoadSubstances() { try { _substances = _dbManager.GetSubstances(); comboBoxSubstanceName.DataSource = null; comboBoxSubstanceName.DisplayMember = "Name"; comboBoxSubstanceName.ValueMember = "Id"; comboBoxSubstanceName.DataSource = _substances.Where(s => s.SubstanceType == "Explosive" || string.IsNullOrEmpty(s.SubstanceType)).ToList(); comboBoxSubstanceName_Fire.DataSource = null; comboBoxSubstanceName_Fire.DisplayMember = "Name"; comboBoxSubstanceName_Fire.ValueMember = "Id"; comboBoxSubstanceName_Fire.DataSource = _substances.Where(s => s.SubstanceType == "FlammableLiquid" || s.SubstanceType == "FlammableGas" || string.IsNullOrEmpty(s.SubstanceType)).ToList(); } catch (Exception ex) { MessageBox.Show($"Error loading substances: {ex.Message}", "Error", MessageBoxButtons.OK, MessageBoxIcon.Error); } } private void CalculationExplosionToolStripMenuItem_Click(object sender, EventArgs e) { try { if (comboBoxSubstanceName.SelectedItem == null) { MessageBox.Show("Please select a substance.", "Input Error", MessageBoxButtons.OK, MessageBoxIcon.Warning); return; } Substance selectedSubstance = (Substance)comboBoxSubstanceName.SelectedItem; if (!double.TryParse(textBoxSubstanceAmount.Text, out double amountKg) || amountKg <= 0) { MessageBox.Show("Please enter a valid substance amount.", "Input Error", MessageBoxButtons.OK, MessageBoxIcon.Warning); return; } string storageContainer = comboBoxStorageContainer.Text; double distanceFromObjects = 0; if (double.TryParse(textBoxDistance.Text, out double dist)) { distanceFromObjects = dist; } string terrainType = comboBoxTerrainType.Text; double windSpeed = 0; if (double.TryParse(textBoxWindSpeed.Text, out double ws)) { windSpeed = ws; } string windDirection = comboBoxWindDirection.Text; ExplosionCalculator.ExplosionCalculationResult explosionResult = _explosionCalculator.CalculateExplosionEffects( selectedSubstance, amountKg, distanceFromObjects, storageContainer ); _dbManager.SaveExplosionIncident( selectedSubstance.Name, amountKg, storageContainer, terrainType, windSpeed, windDirection, distanceFromObjects, explosionResult.BlastOverpressureKpa, explosionResult ); string resultText = $"Explosion calculation completed:\n" + $"Overpressure at {distanceFromObjects} m: {explosionResult.BlastOverpressureKpa:F2} kPa\n" + $"Light damage radius: {explosionResult.DamageRadiusLightM:F2} m\n" + $"Moderate damage radius: {explosionResult.DamageRadiusModerateM:F2} m\n" + $"Severe damage radius: {explosionResult.DamageRadiusSevereM:F2} m\n" + $"Total destruction radius: {explosionResult.DamageRadiusDestructionM:F2} m"; MessageBox.Show(resultText, "Explosion Calculation Results", MessageBoxButtons.OK, MessageBoxIcon.Information); } catch (Exception ex) { MessageBox.Show($"Error calculating explosion: {ex.Message}", "Calculation Error", MessageBoxButtons.OK, MessageBoxIcon.Error); } } private void CalculationFireToolStripMenuItem_Click(object sender, EventArgs e) { try { if (comboBoxSubstanceName_Fire.SelectedItem == null) { MessageBox.Show("Please select a substance for fire calculation.", "Input Error", MessageBoxButtons.OK, MessageBoxIcon.Warning); return; } Substance selectedSubstance = (Substance)comboBoxSubstanceName_Fire.SelectedItem; if (!double.TryParse(textBoxSubstanceAmount_Fire.Text, out double amountKg) || amountKg <= 0) { MessageBox.Show("Please enter a valid substance amount for fire.", "Input Error", MessageBoxButtons.OK, MessageBoxIcon.Warning); return; } if (!double.TryParse(textBoxWindSpeed_Fire.Text, out double windSpeedMps)) { MessageBox.Show("Please enter a valid wind speed.", "Input Error", MessageBoxButtons.OK, MessageBoxIcon.Warning); windSpeedMps = 0; } if (!double.TryParse(textBoxAirTemperature_Fire.Text, out double airTemperatureC)) { MessageBox.Show("Please enter a valid air temperature.", "Input Error", MessageBoxButtons.OK, MessageBoxIcon.Warning); airTemperatureC = 20; } string storageContainer = comboBoxStorageContainer_Fire.Text; string terrainType = comboBoxTerrainType_Fire.Text; string windDirection = comboBoxWindDirection_Fire.Text; double.TryParse(textBoxFireStartTime_Fire.Text, out double timeFromStartMin); double.TryParse(textBoxBuildingHeight_Fire.Text, out double avgBuildingHeightM); double.TryParse(textBoxDensity_Fire.Text, out double buildingDensityPercent); double.TryParse(textBoxCloudSpreadCoefficient_Fire.Text, out double cloudSpreadCoeff); double.TryParse(textBoxTemperatureAt50_Fire.Text, out double tempAt50mC); double.TryParse(textBoxTemperatureAt200_Fire.Text, out double tempAt200mC); double.TryParse(textBoxForecastTime_Fire.Text, out double forecastTimeMin); double.TryParse(textBoxDistanceToPopulatedArea_Fire.Text, out double distanceToPopulatedAreaM); int.TryParse(textBoxPopulation_Fire.Text, out int populationAffected); string provisionDetails = textBoxProvision_Fire.Text; double distanceForRadiationCalcM = 10.0; FireCalculator.FireCalculationResult fireResult = _fireCalculator.CalculateFireEffects( selectedSubstance, amountKg, windSpeedMps, terrainType, airTemperatureC, distanceForRadiationCalcM ); _dbManager.SaveFireIncident( selectedSubstance.Name, amountKg, storageContainer, terrainType, windSpeedMps, windDirection, airTemperatureC, timeFromStartMin, avgBuildingHeightM, buildingDensityPercent, cloudSpreadCoeff, tempAt50mC, tempAt200mC, forecastTimeMin, distanceToPopulatedAreaM, populationAffected, provisionDetails, fireResult ); string resultText = $"Fire calculation completed:\n" + $"Fire spread radius: {fireResult.FireSpreadRadiusM:F2} m\n" + $"Thermal radiation level at {distanceForRadiationCalcM}m: {fireResult.ThermalRadiationLevelKwM2:F2} kW/m2\n" + $"Domino effect probability: {fireResult.DominoEffectProbability:P1}\n" + $"Burnout time: {fireResult.BurnoutTimeMin:F1} min"; MessageBox.Show(resultText, "Fire Calculation Results", MessageBoxButtons.OK, MessageBoxIcon.Information); } catch (Exception ex) { MessageBox.Show($"Error calculating fire: {ex.Message}", "Calculation Error", MessageBoxButtons.OK, MessageBoxIcon.Error); } } private void exitToolStripMenuItem_Click(object sender, EventArgs e) { Application.Exit(); } private void exportToToolStripMenuItem_Click(object sender, EventArgs e) { MessageBox.Show("Export functionality not implemented yet.", "Information", MessageBoxButtons.OK, MessageBoxIcon.Information); } private void totalCalculationToolStripMenuItem_Click(object sender, EventArgs e) { MessageBox.Show("Total calculation not implemented yet.", "Information", MessageBoxButtons.OK, MessageBoxIcon.Information); } } } (C) Code for Substance.cs: namespace FireSoft.CoreLogic { public class Substance { public int Id { get; set; } public string Name { get; set; } public string? ChemicalFormula { get; set; } public double? MolecularWeight { get; set; } public double? Density { get; set; } // kg/m^3 or g/cm^3 - ensure consistency public double? BoilingPointC { get; set; } // Celsius - Renamed from BoilingPoint public double? HeatOfVaporization { get; set; } // kJ/mol or kJ/kg public double? SpecificHeatCapacity { get; set; } // J/(g*°C) or J/(mol*K) public double? FlammabilityLimitsLower { get; set; } // % in air by volume public double? FlammabilityLimitsUpper { get; set; } // % in air by volume public double? AutoignitionTemperature { get; set; } // Celsius public double? FlashPoint { get; set; } // Celsius public double? HeatOfCombustion { get; set; } // kJ/mol or MJ/kg public string? SubstanceType { get; set; } //, e.g., "Explosive", "FlammableLiquid", "ToxicGas" public double? SootinessFactor { get; set; } // Added: e.g., 0 for clean burning (methanol) to 1 for very sooty (crude oil) // Consider adding a constructor for easier initialization if needed public Substance() { // Default constructor Name = string.Empty; // Initialize string properties to avoid null issues if not set ChemicalFormula = null; SubstanceType = null; } } } |
References
- Kazarinova, E.B.; Danilov, D.R. Economic security in the conditions of transition to technological sovereignty. Econ. Innov. Manag. 2023, 1, 93–100. [Google Scholar] [CrossRef]
- Gerasimova, N.V. ESG in Russia: Corporate strategies—Problems and prospects. Econ. Innov. Manag. 2023, 2, 62–75. [Google Scholar] [CrossRef]
- Cherevko, M.A.; Lukyanenok, P.P.; Ligai, A.A. Analysis of innovative development of upstream segment enterprises in the context of global industry challenges. Econ. Innov. Manag. 2024, 3, 59–69. [Google Scholar] [CrossRef]
- Shutko, L.G.; Pomogalov, N.A. Need and possibility of construction ecological Kuznets curve as a reflection of trend inclusive development of the resource producing region. Econ. Innov. Manag. 2024, 4, 48–58. [Google Scholar] [CrossRef]
- Reuters. South Korea’s Kumho Tire Plant Production Suspended due to Fire. 17 May 2025. Available online: https://www.reuters.com/en/south-koreas-kumho-tire-plant-production-suspended-due-fire-2025-05-17/ (accessed on 30 March 2025).
- A Large Explosion and at a Chemical Plant in Geismar, Louisiana State, the USA. 13 June 2013. Available online: https://www.independent.co.uk/news/world/americas/blast-at-louisiana-chemical-plant-leaves-at-least-30-injured-8658062.html (accessed on 30 March 2025).
- Zykov, V.V.; Lagozin, A.Y.; Ilyichev, A.V.; Pivovarov, N.Y. Amendments to the methodology for determining the number of personnel and technical equipment of the enterprise’s fire service to organise and carry out fire extinguishing operation. Pozharnaia Bezop. 2023, 4, 51–58. [Google Scholar] [CrossRef]
- Gai, W.; Du, Y.; Deng, Y. Evacuation risk assessment of regional evacuation for major accidents and its application in emergency planning: A case study. Safety Science 2018, 106, 203–218. [Google Scholar] [CrossRef]
- Matveev, Y.; Abu-Abed, F.; Zhironkina, O.; Zhironkin, S. Simulation Modeling of the Process of Danger Zone Formation in Case of Fire at an Industrial Facility. Fire 2024, 7, 221. [Google Scholar] [CrossRef]
- Matveev, Y.; Abu-Abed, F.; Chernishev, L.; Zhironkin, S. Visualization of Hazardous Substance Emission Zones During a Fire at an Industrial Enterprise Using Cellular Automaton Method. Fire 2025, 8, 250. [Google Scholar] [CrossRef]
- Drozdova, T.; Sukovatikov, R. Predictive Assessment of Fire Danger Zones at Emergency Events on Oil and Gas Condensate Field. Saf. Technosphere 2019, 7, 71–77. [Google Scholar] [CrossRef]
- Beyler, C.L. Fire Hazard Calculations for Large, Open Hydrocarbon Fires. In SFPE Handbook of Fire Protection Engineering; Hurley, M.J., Ed.; Springer: New York, NY, USA, 2016; pp. 2301–2332. [Google Scholar] [CrossRef]
- Di Giuseppe, F.; Vitolo, C.; Barnard, C.; Libertá, G.; Maciel, P.; San-Miguel-Ayanz, J.; Villaume, S.; Wetterhall, F. Global seasonal prediction of fire danger. Sci. Data 2024, 11, 128. [Google Scholar] [CrossRef]
- McGrattan, K.; McDermott, R.; Vanella, M.; Mueller, E.; Hostikka, S.; Floyd, J. Fire Dynamics Simulator User’s Guide, 6th ed.; National Institute of Standards and Technology: Gaithersburg, MD, USA, 2024; p. 90. [Google Scholar]
- Huseinov, R.N. Algorithm in definition of the category of commercial activity objects on technological hazard. Theory Pract. Forensic Sci. Crim. 2017, 17, 324–331. [Google Scholar] [CrossRef]
- Sumskoy, S.I.; Kirsanova, A.M.; Sofyin, A.S.; Zainetdinov, S.K. Methods for calculating the spread of hazardous and polluting substances over the relief. Occup. Saf. Ind. 2024, 2, 16–23. [Google Scholar] [CrossRef]
- Havrys, A.; Yakovchuk, R.; Pekarska, O.; Tur, N. Visualization of Fire in Space and Time on the Basis of the Method of Spatial Location of Fire-Dangerous Areas. Ecol. Eng. Environ. Technol. 2023, 24, 28–37. [Google Scholar] [CrossRef] [PubMed]
- Wen, H.; Liu, Y.; Guo, J.; Zhang, Z.; Liu, M.; Cai, G. Study on Numerical Simulation of Fire Danger Area Division in Mine Roadway. Math. Probl. Eng. 2021, 2021, 6646632. [Google Scholar] [CrossRef]
- Bykov, A.I.; Novak, A.V. Methodology for constructing models of zone thermal damage during a fire on a gas pipeline. Fire Explos. Saf. 2018, 11, 41–50. [Google Scholar] [CrossRef]
- Chuvieco, E.; Congalton, R.G. Application of remote sensing and geographic information systems to forest fire hazard mapping. Remote Sens. Environ. 1989, 29, 147–159. [Google Scholar] [CrossRef]
- Tsvirkun, A.D.; Rezchikov, A.F.; Filimonyuk, L.Y.; Samartsev, A.A.; Ivashchenko, V.A.; Bogomolov, A.S.; Kushnikov, V.A. System of Integrated Simulation of Spread of Hazardous Factors of Fire and Evacuation of People from Indoors. Autom. Remote Control 2022, 83, 692–705. [Google Scholar] [CrossRef]
- Sirca, C.; Salis, M.; Arca, B.; Duce, P.; Spano, D. Assessing the performance of fire danger indexes in a Mediterranean area. iForest—Biogeosciences For. 2018, 11, 563–571. [Google Scholar] [CrossRef]
- Baalisampang, T.; Abbassi, R.; Garaniya, R.; Khan, F.; Dadashzadeh, M. Fire impact assessment in FLNG processing facilities using Computational Fluid Dynamics (CFD). Fire Saf. J. 2017, 92, 42–52. [Google Scholar] [CrossRef]
- Yemelyanenko, S.; Kuzyk, A.; Ivanusa, A.; Morshch, E. Improving the operational efficiency of control centers for emergency events by using GIS technologies. East.-Eur. J. Enterp. Technol. 2023, 4, 37–49. [Google Scholar] [CrossRef]
- Ahmadi, O.; Mortazavi, S.B.; Pasdarshahri, H.; Asilian Mohabadi, H. Consequence analysis of large-scale pool fire in oil storage terminal based on computational fluid dynamic (CFD). Process Saf. Environ. Prot. 2019, 123, 379–389. [Google Scholar] [CrossRef]
- Pospelov, B.; Rybka, E.; Otrosh, Y.; Maladyka, L.; Krainiukov, O.; Kurtseitov, T.; Vorovka, M.; Hryshko, S.; Pidhorodetskyi, M.; Salamatina, O. Development of a method for rapid detection of fires based on combined current sampling and dispersions of a controlled hazardous environmental parameter. Technol. Audit Prod. Reserves 2025, 2, 31–35. [Google Scholar] [CrossRef]
- Prus, M.Y.; Perikov, A.V. Simulation of fire dangerous failures of electrical equipment and assessment of fire and electric damage. Technol. Technosphere Saf. 2022, 97, 190–201. [Google Scholar] [CrossRef]
- Singh, S.K.; Rani, R. Assimilation of concentration measurements for retrieving multiple point releases in atmos-phere: A least-squares approach to inverse modelling. Atmos. Environ. 2015, 119, 402–414. [Google Scholar] [CrossRef]
- Hou, L.; Yao, B.; Hu, Y.; Yu, K.; Yuan, K. How Trust Affects Hazardous Chemicals Logistics Enterprises’ Sustainable Safety Behavior: The Moderating Role of Government Governance. Sustainability 2025, 17, 3577. [Google Scholar] [CrossRef]
- Ahmed, S.; Rahman, A.; Ravhee, S.S. An Exploratory Study on Fire Safety in High-Rise Buildings with Mixed Occupancy in Urban Areas: Case of Sylhet City, Bangladesh. Archit. Res. 2021, 11, 11–21. Available online: http://article.sapub.org/10.5923.j.arch.20211101.02.html (accessed on 30 March 2025).
- Wang, D.; Yang, G.; Han, J.; Duo, Y.; Zhou, X.; Tong, R. Quantitative Assessment of Human Error of Emergency Behavior for Hazardous Chemical Spills in Chemical Parks. Process Saf. Environ. Prot. 2024, 189, 930–949. [Google Scholar] [CrossRef]
- Jia, Y.; Hao, W.; Yin, L.; Yuan, H.; Yu, J. Occupational health risk assessment of exposure to major hazardous chemicals in copper and nickel smelting enterprises. Chin. J. Ind. Hyg. Occup. Dis. 2024, 42, 752–756. [Google Scholar] [CrossRef]
- Ferreira, T.M.; Vicente, R.; da Silva, J.A.R.M.; Varum, H.; Costa, A.; Maio, R. Urban fire risk: Evaluation and emergency planning. J. Cult. Herit. 2016, 20, 739–745. [Google Scholar] [CrossRef]
- Julià, P.B.; Ferreira, T.M. From single- to multi-hazard vulnerability and risk in Historic Urban Areas: A literature review. Nat. Hazards 2021, 108, 93–128. [Google Scholar] [CrossRef]
- Kanangkaew, S.; Jokkaw, N.; Tongthong, T. A real-time fire evacuation system based on the integration of Building Information Modeling and Augmented Reality. J. Build. Eng. 2023, 67, 105883. [Google Scholar] [CrossRef]
- Zarei, E.; Jafari, M.J.; Dormohammadi, A.; Sarsangi, V. The Role of Modeling and Consequence Evaluation in Improving Safety Level of Industrial Hazardous Installations: A Case Study: Hydrogen Production Unit. Iran Occup. Health J. 2014, 10, 52–63. [Google Scholar]
- Gvozdev, E.V. Intersystem Interaction and Relationships in the Integrated Safety System Designed to Prevent Accidents and Fires at Explosion- and Fire-Hazardous Enterprises. Occup. Saf. Ind. 2024, 12, 40–46. [Google Scholar] [CrossRef]
- Rashoyan, I. Assessment of risks for employees of industrial enterprises in the event of emergencies and fires. Probl. Risk Manag. Technosphere 2024, 4, 62–69. [Google Scholar] [CrossRef]
- Jawad, R.; Jawad, R. Design and implementation of Mobile Robot for Fire Fighting Using Photovoltaic Panel with Artificial Intelligent. Iran. J. Electr. Electron. Eng. 2024, 20, 117–126. [Google Scholar] [CrossRef]
- Li, W.; Li, P.; Feng, Z. Delineating Fire-Hazardous Areas and Fire-Induced Patterns Based on Visible Infrared Imaging Radiometer Suite (VIIRS) Active Fires in Northeast China. Remote Sens. 2022, 14, 5115. [Google Scholar] [CrossRef]
- Pratt, M. Modelling Fire Hazard. Available online: https://www.esri.com/news/arcuser/0700/files/firemodel.pdf (accessed on 30 March 2025).
- Malykhina, G.F.; Zhirakova, P.S.; Militsyn, A.V. Design of an intelligent fire protection system. Ontol. Des. 2024, 14, 217–229. [Google Scholar] [CrossRef]
- Zannetti, P. Air pollution modeling. In Theories, Computational Methods, and Available Software; Springer Science: New York, NY, USA, 1990; 444p. [Google Scholar]
- Dlamini, W.M. Application of Bayesian networks for fire risk mapping using GIS and remote sensing data. GeoJournal 2011, 76, 283–296. [Google Scholar] [CrossRef]
- Xu, Z.; Lu, X.Z.; Guan, H.; Chen, C.; Ren, A.Z. A virtual reality based fire training simulator with smoke hazard assessment capacity. Adv. Eng. Softw. 2014, 68, 1–8. [Google Scholar] [CrossRef]
- Svobodova, N.; Benysek, M.; Stefan, R. Analysis of Zone Fire Models and their Application in Structural Fire Design. Solid State Phenom. 2021, 322, 127–135. [Google Scholar] [CrossRef]
- Mavrov, D.; Bureva, V. FireGrid—Software for 2-D Fire Simulation Using the Game Method for Modelling. Int. J. Bioautomotion 2022, 26, 5–18. [Google Scholar] [CrossRef]
- Holmes, N.S.; Morawska, L. A review of dispersion modelling and its application to the dispersion of particles: An overview of different dispersion models available. Atmos. Environ. 2006, 40, 5902–5928. [Google Scholar] [CrossRef]
- Webber, D.M.; Ivings, M.J.; Santon, R.C. Ventilation Theory and Dispersion Modelling Applied to Hazardous Area Classification. J. Loss Prev. Process Ind. 2011, 24, 612–621. [Google Scholar] [CrossRef]
- Gronwald, F.; Shoou-Yuh, C. Evaluation of the Precision and Accuracy of Multiple Air Dispersion Models. J. Atmos. Pollut. 2018, 6, 1–11. Available online: https://www.sciepub.com/jap/abstract/8666 (accessed on 30 March 2025).
- Hamby, D.M. The Gaussian atmospheric transport model and its sensitivity to the joint frequency distribution and parametric variability. Health Phys. 2002, 82, 64–73. [Google Scholar] [CrossRef]
- Leelőssy, Á.; Mona, T.; Mészáros, R.; Lagzi, I.; Havasi, Á. Eulerian and Lagrangian Approaches for Modelling of Air Quality. Math. Probl. Meteorol. Model. Math. Ind. 2016, 24, 73–85. [Google Scholar] [CrossRef]
- Demchenko, P.F.; Ginzburg, A.S.; Aleksandrov, G.G.; Vereskov, A.I.; Gorchakov, G.I.; Zavalishin, N.N.; Zakharova, P.V.; Lezina, E.A.; Yudin, N.I. Statistical modeling of average daily concentration of pollutants in the atmosphere over Moscow megalopolis by the multiple regression method. Russ. Meteorol. Hydrol. 2015, 40, 658–666. [Google Scholar] [CrossRef]
- Temirbekov, N.; Temirbekov, A.; Kasenov, S.; Tamabay, D. Numerical modeling for enhanced pollutant transport prediction in industrial atmospheric air. Int. J. Des. Nat. Ecodynamics 2024, 19, 917–926. [Google Scholar] [CrossRef]
- Hanna, S.; Brown, M.J.; Camelli, F.E.; Chan, S.T. Detailed Simulations of Atmospheric Flow and Dispersion in Urban Downtown Areas by Computational Fluid Dynamics (CFD) Models—An Application of Five CFD Models to Manhattan. Bull. Am. Meteorol. Soc. 2006, 87, 1713–1726. [Google Scholar] [CrossRef]
- Flores, F.; Garreaud, R.; Muñoz, R.C. CFD simulations of turbulent buoyant atmospheric flows over complex geometry: Solver development in OpenFOAM. Comput. Fluids 2013, 82, 1–13. [Google Scholar] [CrossRef]


| Metrics | Gaussian Model | FireSoft | Improvement |
|---|---|---|---|
| RMSE (kPa) | 12.8 ± 1.2 | 4.2 ± 0.3 | 67.2% |
| MAPE (%) | 28.5 ± 3.1 | 9.7 ± 1.2 | 66.0% |
| R2 | 0.76 ± 0.05 | 0.94 ± 0.02 | 23.7% |
| Software | Description | Forecast Accuracy in Decision Making | Forecast Accuracy in Environmental Assessment | ||
|---|---|---|---|---|---|
| Calculation Time | Accuracy | Pollutant Concentration | Danger Zone Coincidence | ||
| FireSoft 1.0 | Specialization: combining explosion, fire, and secondary effects models into a single calculation circuit. Typical scenario: automatic transition: “explosion-depressurization-fire-domino effect”. Limitations: dependence on the quality of input data, forecasting errors in extreme conditions (storm, complex terrain), limited library of substances (120 + compounds vs. 500 + in ALOHA 5.4.7). Advantages: dynamic calibration of models based on real historical incidents from the database, real-time weather conditions and terrain types (city/industrial zone/open territory). | 8–15 s. | 92–95% | ±7% | 93% |
| ALOHA 5.4.7 | Specialization: modeling of atmospheric gas dispersion. Limitations: static meteorological parameters, simplified combustion models, lack of complex analysis of chain events. Typical scenario: forecast of contamination zones in case of chemical leaks. | 1–3 min. | 85–88% | ±25% | 78% |
| FDS 6.7.7 | Specialization: detailed modeling of fire dynamics. Limitations: extreme resource intensity (hours of calculations for average scenes), requirement for precise 3D geometry, no explosive models. Typical scenario: analysis of fire spread inside buildings. | 2–8 h | 98–99% | – | – |
| Input Data | Units of Measurement | Explosion | Fire |
|---|---|---|---|
| Type of toxic substance | - | Ammonia | Polyvinyl Chloride |
| Mass of toxic substance/source of toxic combustion products | t | 25 | 50 |
| Density of toxic substance | t/m3 | 0.68 | 1.37 |
| Wind speed | m/s | 2.5 | 3.5 |
| Wind direction | - | South | North-East |
| Coefficient that takes into account the speed of cloud propagation | - | 0.9 | 0.9 |
| Burning time | h | – | 12 |
| Ambient temperature | °C | 18 | 20 |
| Distance to the settlement | m | 800 | 800 |
| Average height of buildings/structures | m | 20 | 20 |
| Number of inhabitants | - | 1200 | 1200 |
| Provision of personal respiratory protective equipment | % | 10 | 10 |
Disclaimer/Publisher’s Note: The statements, opinions and data contained in all publications are solely those of the individual author(s) and contributor(s) and not of MDPI and/or the editor(s). MDPI and/or the editor(s) disclaim responsibility for any injury to people or property resulting from any ideas, methods, instructions or products referred to in the content. |
© 2025 by the authors. Licensee MDPI, Basel, Switzerland. This article is an open access article distributed under the terms and conditions of the Creative Commons Attribution (CC BY) license (https://creativecommons.org/licenses/by/4.0/).
Share and Cite
Matveev, Y.; Abu-Abed, F.; Zhironkina, O.; Zhironkin, S. Software Supporting the Visualization of Hazardous Substance Emission Zones During a Fire at an Industrial Enterprise. Fire 2025, 8, 279. https://doi.org/10.3390/fire8070279
Matveev Y, Abu-Abed F, Zhironkina O, Zhironkin S. Software Supporting the Visualization of Hazardous Substance Emission Zones During a Fire at an Industrial Enterprise. Fire. 2025; 8(7):279. https://doi.org/10.3390/fire8070279
Chicago/Turabian StyleMatveev, Yuri, Fares Abu-Abed, Olga Zhironkina, and Sergey Zhironkin. 2025. "Software Supporting the Visualization of Hazardous Substance Emission Zones During a Fire at an Industrial Enterprise" Fire 8, no. 7: 279. https://doi.org/10.3390/fire8070279
APA StyleMatveev, Y., Abu-Abed, F., Zhironkina, O., & Zhironkin, S. (2025). Software Supporting the Visualization of Hazardous Substance Emission Zones During a Fire at an Industrial Enterprise. Fire, 8(7), 279. https://doi.org/10.3390/fire8070279