Article

Frequency Spectrum Characterization of Infrared Thermal Images of Methane Diffusion Flames

1
College of Mechatronic Engineering, North University of China, Taiyuan 030051, China
2
National Key Laboratory of Scattering and Radiation, Shanghai 200438, China
*
Author to whom correspondence should be addressed.
Fire 2025, 8(7), 255; https://doi.org/10.3390/fire8070255
Submission received: 9 May 2025 / Revised: 8 June 2025 / Accepted: 26 June 2025 / Published: 28 June 2025
(This article belongs to the Special Issue Sooting Flame Diagnostics and Modeling)

Abstract

Experimental measurements of midwave infrared thermal images of methane diffusion flames at different concomitant flow velocities were obtained as snapshot data to analyze the flame scintillation effect. The spectral proper orthogonal decomposition (SPOD) method was used to extract the frequency-spectral features of the flame to characterize the effect of the co-flow on the flame scintillation characteristics. The results show that, under the effect of the Kelvin-Helmholtz instability, a rolled-up vortex structure is formed within the shear layer, which triggers periodic flickering during flame combustion. The frequency-spectral characteristics of the flickering phenomenon corresponding to unstable combustion show an octave distribution. An increase in the co-flow velocity leads to an increase in the peak flicker frequency. The peak frequency was 11.6 Hz in the case without associated flow and 16.6 Hz in the case with associated flow. The SPOD analysis results indicated that the high-frequency first-order modes dominated by the flickering phenomenon exhibited an axisymmetric distribution, whereas the second-order modes exhibited an antisymmetric distribution. In contrast, the low-frequency first-order modes exhibit an antisymmetric distribution, whereas the second-order modes exhibit an axisymmetric distribution.

1. Introduction

Diffusion jet flames are widely used in internal combustion engines and industrial combustion plants, and have become a core form of combustion owing to their high heat and mass transfer efficiencies [1]. However, diffusion flames are prone to instability during combustion, which can lead to the dynamic behavior of flame flicker and flare. Flame flickering, also known as flame pulsation, is a combustion instability phenomenon in which the flame parameters change periodically during the combustion process. The study of flame flickering is of great significance for understanding the evolution of unstable combustion and flame propagation.
Flame flickering is caused by the coupling of the chemical reaction kinetics, heat transfer, and thermoacoustics. The flame flickering mechanism originates from a combination of Kelvin-Helmholtz and Rayleigh-Taylor instabilities in the shear layer at the interface between the flame and the surrounding fluid of different densities and is significantly affected by the high-temperature buoyancy generated by the chemical reaction [2,3,4]. Under experimental conditions, scintillation frequencies of approximately 10–20 Hz are typically observed, and the scintillation frequency is influenced by the type of combustion [5], flow rate [6,7,8], and burner size [9]. Flame flickering is closely related to vortex perturbations in the flow field, and its dynamic properties often need to be extracted indirectly from measured data.
Flame stability is essential for the efficient and stable operation of combustion systems. Many scholars have investigated the combustion stability characteristics [8,10,11] of various experimental systems, including burner design, fuel type, and flow rate. For example, Manikantachari et al. [11] investigated the effects of different burner cross-sectional shapes on the pulsation characteristics of diffusion flames. Fujisawa [8] and Darabkhani [10] et al. investigated the effects of the accompanying air flow rate and fuel flow rate on the flame flickering characteristics through methane/air coaxial jet experiments, and the results showed that an increase in the co-flow rate attenuated the oscillation amplitude of the diffusion flame and increased the flame flickering frequency. Wang et al. [12] showed that the complete suppression of flickering can be achieved when the co-flow velocity is increased to the fuel velocity level. Gotoda et al. [13] investigated the instability of the flame tip during the rotation of a combustor from the perspective of nonlinear dynamics and proposed an effective method for predicting flame tip motion. This study showed that the periodic oscillation of the flame gradually shifted to chaos as the spinning Reynolds number increased. To reveal the kinetic characteristics and intrinsic mechanism of flame flickering, Fujisawa et al. [14] employed an image processing technique and the proper orthogonal decomposition (POD) method to analyze the influence of airflow on the flame flickering effect of methane diffusion; they pointed out that the flame flickering energy was dominated by the first two orders of modes. Subsequently, Fujisawa [15] characterized a diffusion flame using particle image velocimetry and POD methods. The POD mode structure showed the presence of a reverse rotating vortex in the flame, leading to flame stretching. Chatterjee et al. [16] investigated the complex nonlinearities of flame flickering using POD and dynamic mode decomposition (DMD) methods, and the reverse rotating vortex in the extracted flame proposed an order structure. The results showed that the number of vortices increased with mode order.
Previous studies have used the POD method to analyze the mode characteristics of flame combustion oscillations. However, since POD is based on the energy-optimal criterion for mode extraction, its decomposition results often mix the dynamical behaviors at different time scales, leading to difficulties in resolving the spatial mode structure at specific frequencies. A method of flow field decomposition in the frequency domain, the spectral proper orthogonal decomposition (SPOD) method, has been developed in recent years. SPOD is a modified POD method applied to flow field feature extraction in the frequency domain. The method is able to extract flow structures with single-frequency oscillations by combining Fourier analysis with mode decomposition. The superiority of the SPOD method for feature extraction has been demonstrated. Zeng et al. [17] compared the ability of different methods in extracting the main coherent structures of the flow field and showed that the POD method is based on the energy optimality criterion, which makes it difficult to correctly distinguish and interpret the dynamical behavior on all scales. DFT can extract the spatial structure at a specific frequency, but it is often corrupted by noise or by other low-energy structures at the same frequency. The SPOD method is better suited for frequency mode separation and extraction. Sieber et al. [18] state that SPOD methods can be used to achieve a trade-off between POD and DMD methods by introducing filtering operations. Currently, the SPOD method has been successfully applied to feature extraction of flow fields such as jets [19], wakes [20], and flow over airfoils [21] based on the good performance of the SPOD method.
The purpose of this study is to extract the infrared scintillation characteristics of methane/air diffusion flames using mid-wave infrared thermal image snapshots obtained using the SPOD method. The focus is on the differences in the flame frequency-spectral characteristics and spatial structure under different companion flow conditions, and the inhibition mechanism of companion flow on the infrared flickering of the diffusion flame is revealed.

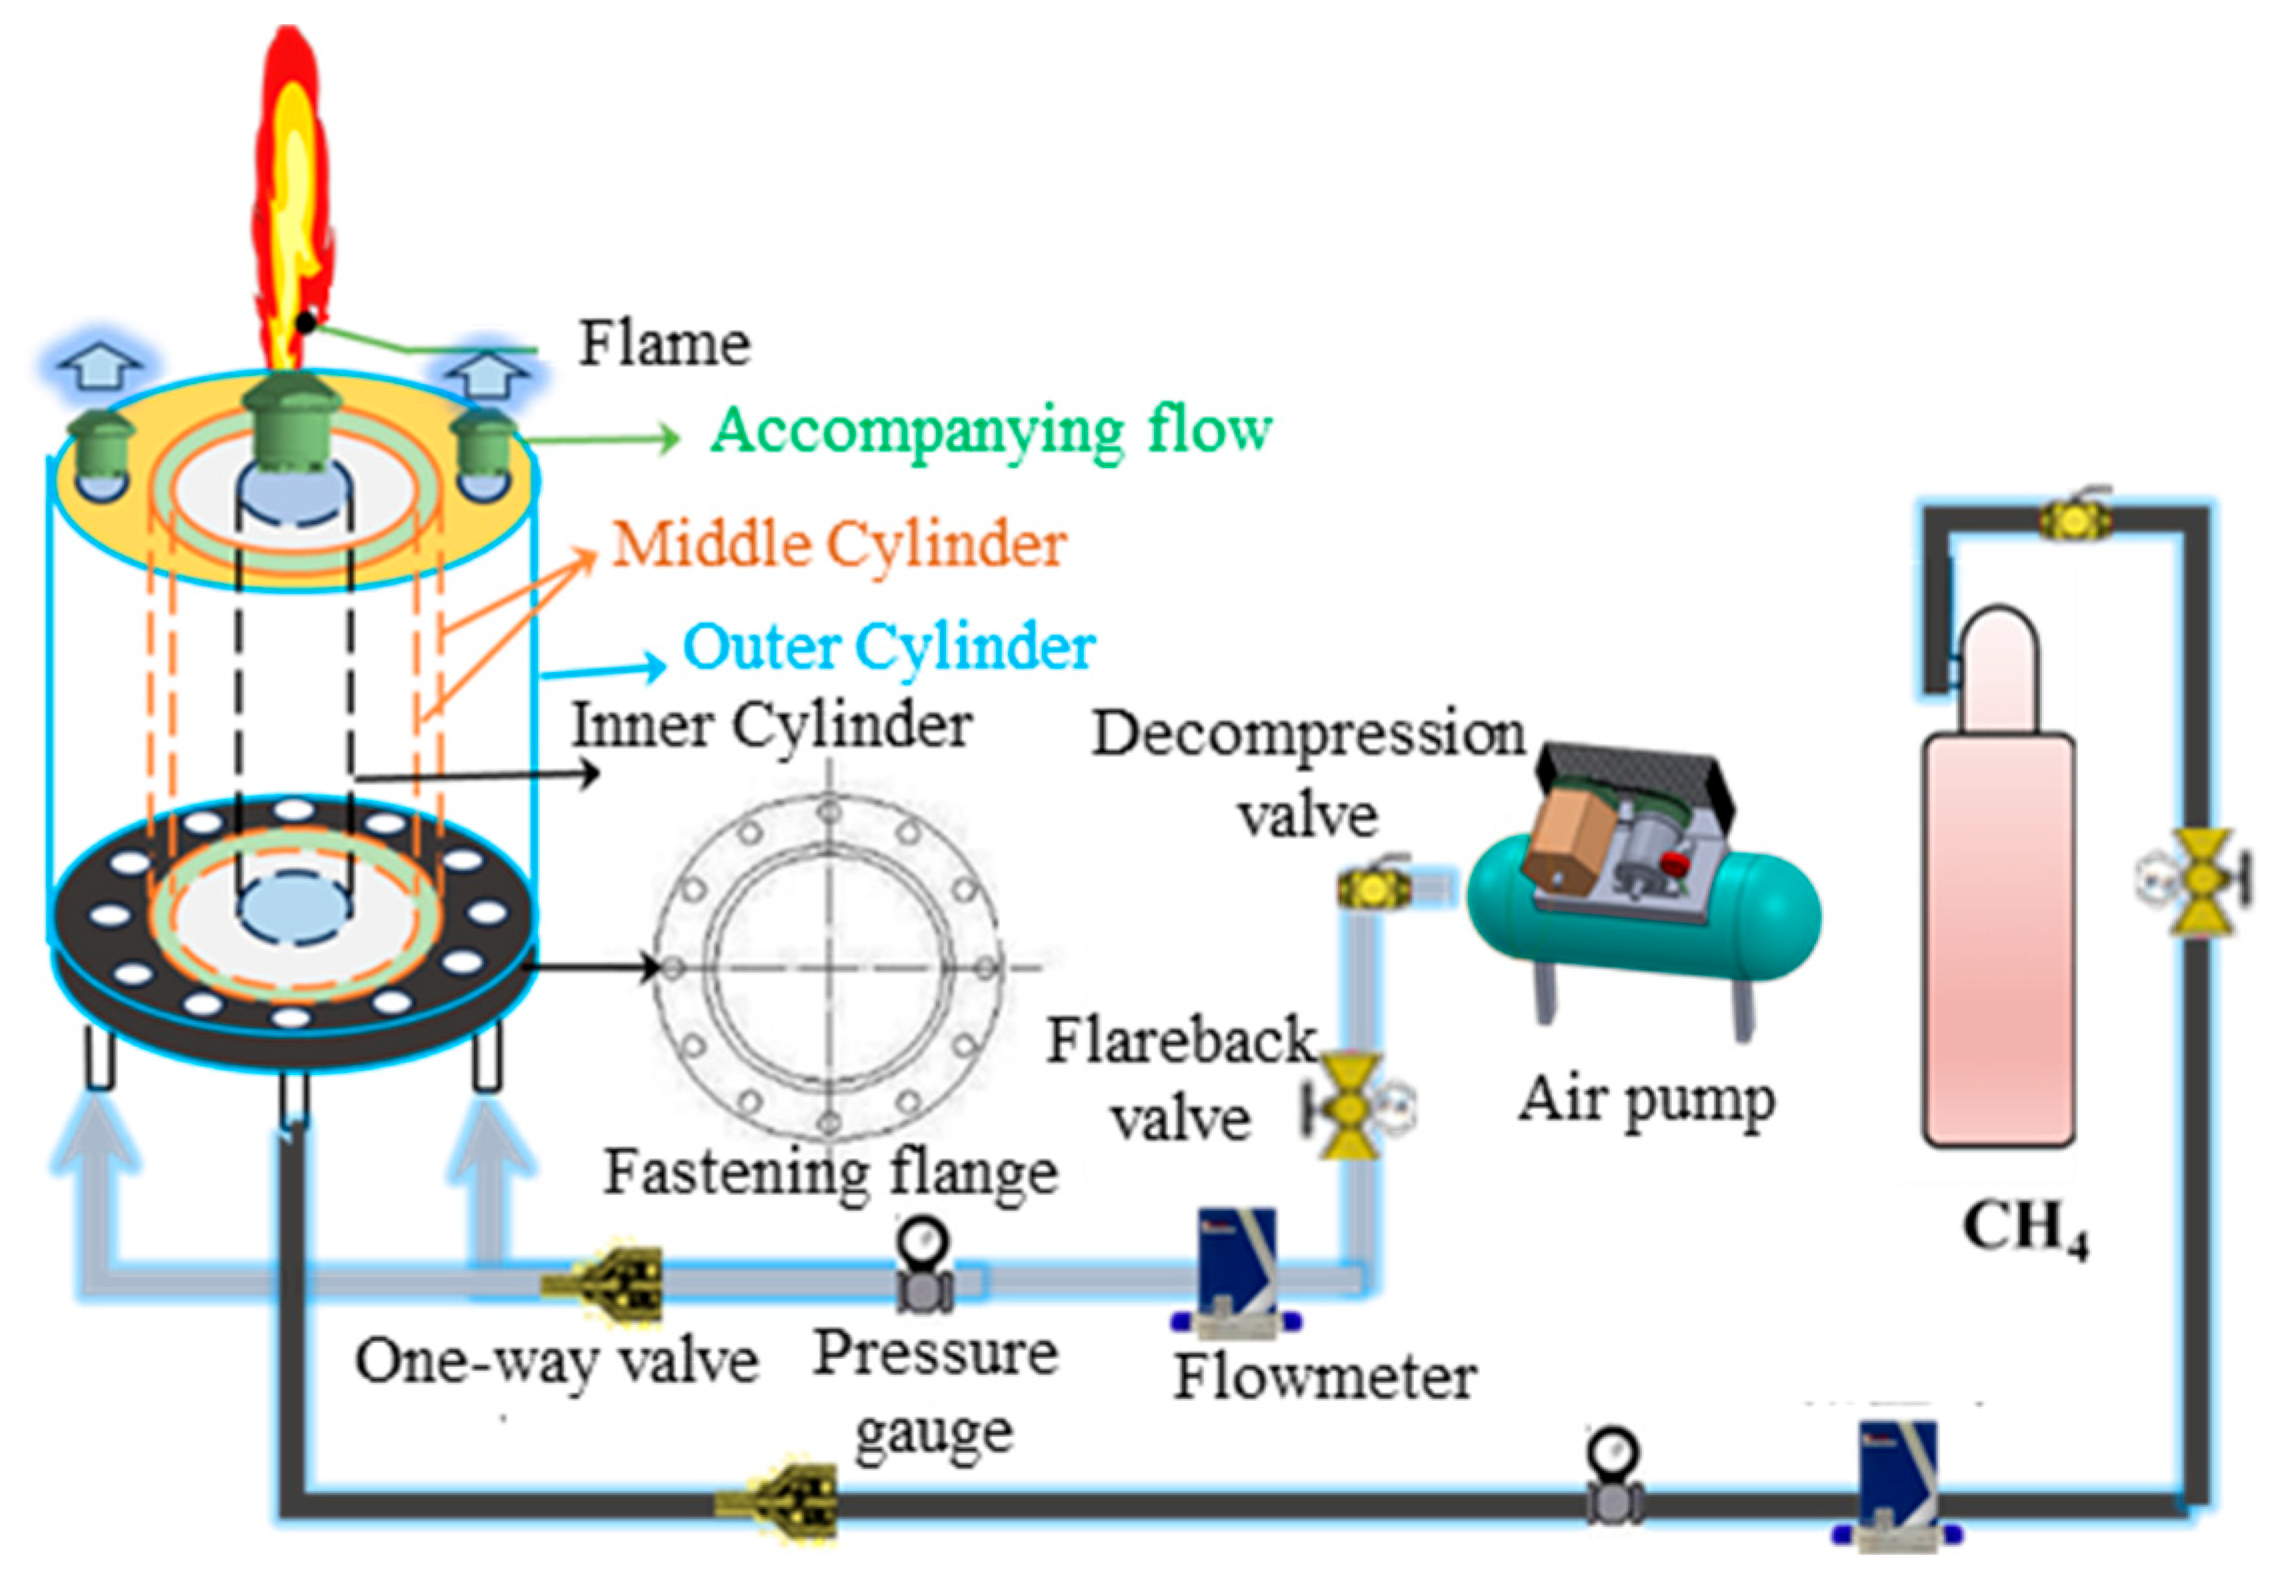
2. Measurement Tests

The experimental equipment consisted of an air system, a fuel system, an ignition system, a combustion chamber experimental piece, and a collection device. A schematic of the experimental setup is shown in Figure 1. Methane was used as the fuel, and the flow rate of methane was controlled using a mass flow meter, which was then piped into the nozzle. Air was compressed using an air pump and passed into the outer channel surrounding the nozzle after being controlled by a flow meter. The gas outlet was located at the center of the burner and had a diameter of 10 mm and a nozzle wall thickness of 1 mm. Coaxial air flow was provided by a circular tube with a diameter of 100 mm placed coaxially with the burner. The interior of the circular tube was made porous to maintain a uniform air flow rate. The outside of the burner consisted of a 60 mm high cylinder to minimize flame jitter during the mixing of methane and oxygen. Table 1 lists the conditions for the methane non-premixed jet combustion experiments.
In this experiment, we used a TELOPS FAST M200 mid-wave infrared camera (Model TEL-6153, Telops Inc., Québec City, QC, Canada) to capture images of the flame. The device acquired 512 frames of instantaneous infrared images of the flame at a frame rate of 100 Hz, with a spatial resolution of 620 × 512 pixels per image, and stored and analyzed the data on a multi-core server. The gas mass flow meter (Model CS200-A, Beijing Huacheng Electronics Co., Ltd., Beijing, China) used in the experiment had a range of 80 L/min, and the methane mass flow meter had a range of 3 L/min, with a control accuracy of ±0.35% FS and response time of 1 s.
The experiments were conducted at ambient temperature and pressure. An infrared camera was used to measure the flame at a distance of 2.86 m, with an acquisition frequency of 100 Hz and a recording time of 5 s. The infrared dynamics of methane combustion were investigated under various combustion conditions. The air flow rate was kept constant under each combustion condition, and the effect of the methane flow rate on the combustion characteristics was investigated by varying the methane flow rate. Table 2 lists the parameters of the fuel and air flow rates under different operating conditions. The velocity ratio Ur is defined as the ratio of the air flow rate Uc to the methane flow rate Uf.

3. SPOD Mathematical Model

3.1. Snapshot Matrix Construction

SPOD is a frequency-domain variant of POD. SPOD transforms the data into the frequency domain and then computes the eigenvectors of the cross-spectral density (CSD) matrix; therefore, mutually orthogonal modes sorted by the energy level for each frequency component are obtained.
For a given transient infrared snapshot thermal image, the snapshot matrix is expressed as follows:
Q = q 1 , q 2 , , q n t
where q i = q ( t i ) is transformed into a vector of length n, and n denotes the number of grid points. The instantaneous energy at each time instant or snapshot is represented by the spatial inner product.
q x 2 = q , q x = Ω q * x , t W x q x , t d x ,  
In the equation, W denotes a positive-definite Hermitian matrix that characterizes the weights of components, and Ω signifies the spatial domain.

3.2. Matrix Chunking and Windowing

For statistically stationary data, a classical approach involves transforming the eigenvalue problem of the spatiotemporal POD into the frequency domain for a solution via a Fourier transform. Specifically, it involves the construction of a two-point CSD matrix and solving its eigenmodes. The cross-spectral density tensor can be directly estimated using a discrete Fourier transform of the data matrix Vi. However, it is well established that the spectral estimates derived in this manner do not converge with an increase in the number of snapshots S. Studies [22,23] have shown that the amplitude of error in such estimations is directly proportional to the energy intensity of the corresponding frequency components. Spectral averaging over multiple independent flow processes was necessary to obtain a convergent estimate of the spectral density. When the Welch method is employed to evenly partition the matrix Q, block matrices with mutually overlapping snapshots can be obtained. The l-th block matrix X m ( l ) is expressed as follows:
Q ( l ) = q 1 ( l ) , q 2 ( l ) , , q N f f t ( l ) R N × N f f t
The k-th snapshot of the l-th block matrix is q k ( n ) = q k + ( l 1 ) ( N f f t N o v l p ) . Nfft denotes the number of snapshots per block, Novlp represents the number of overlapping snapshots between two adjacent block matrices, and Nblk denotes the total number of block matrices.
N b l k = f l o o r S N o v l p N f f t N o v l p
The j-th column in the k-th block matrix can be expressed as follows:
q j ( k ) = q j + ( k 1 ) ( N f f t N o v l p ) + 1
To achieve convergent spectral outcomes, a windowing function was employed for each block to mitigate the spectral leakage. Compared with other common window functions (e.g., rectangular and Hamming windows), the Hanning window minimizes side-lobe intensity while maintaining near-invariant main lobe width, which helps reduce spectral leakage in analysis. In this study, a periodic Hanning window was employed to minimize spectral leakage.
w i + 1 = 0.54 0.46 cos 2 π i n f f t 1 f o r i = 0 , 1 , n f f t 1
Harris et al. [24] demonstrated, through the practical application of window functions, that their use leads to a loss of information transition at boundaries. Consequently, the windowing function was applied exclusively to overlapping blocks. The weighted-time discrete Fourier transform is formulated as follows:
q ^ j k = F w j q j ( k ) ,
The generated Fourier matrices were Q ^ ω ( l ) and Q ^ ω ( l ) = [ q ^ ω 1 ( l ) , q ^ ω 2 ( l ) , , q ^ ω N f ( l ) ] . The kth discrete frequency component in the lth block is q ^ ω k ( l ) . Subsequently, the data were regrouped according to frequency. The flow ensemble for a given frequency ωk and azimuthal wavenumber (mis) is contained in the data matrix Q ^ ω k as follows:
Q ^ ω k q ^ ω 1 ( 1 ) , q ^ ω 1 ( 2 ) , , q ^ ω 1 ( N b l k ) N N × N b l k

3.3. Feature Decomposition

Construct the cross-spectral density correlation matrix at frequency M ω k as follows:
M ω k = Q ^ ω k * W Q ^ ω k
Matrix W is the coefficient matrix for numerical integration on a discrete grid. The SPOD modes were derived by solving the eigenvalue problem of the cross-spectral density correlation matrix corresponding to each frequency.
M ω k Θ ω k = Θ ω k Λ ω k
Φ ω k = Q ^ ω k Θ ω k Λ ω k 1 / 2
where Φ ω k denotes the SPOD modes, and Θ ω k and Λ ω k represent the eigenvalue matrices. The magnitude of each eigenvalue corresponds to the energy of the associated mode, and the eigenvalues are sorted in descending order of magnitude. The decomposed distinct SPOD modes are spatially orthogonal at the same frequency, and SPOD modes of the same order at different frequencies are orthogonal in the original time domain.
The infrared snapshot thermal images obtained from the experiment were processed as follows. The thermal image snapshots are uniformly divided into Nblk segments. Each individual segment represents a separate flow field dataset, and each segment contains Nfft snapshots. The repetition rate of adjacent segments is set to 50% and spectral estimation with minimized variance is used. With the specified number of IR thermal image snapshots, the size of the Nfft and Nblk values needs to be weighed. If the Nfft value is too small, the resolution of the SPOD spectrum is not sufficient. If the number of chunking matrices and SPOD modes is too small, the multiscale structure of the flow field cannot be accurately resolved. Therefore, in this study, the unsteady infrared snapshot thermal images are uniformly divided into 3 segments (Nblk = 3), and each individual segment serves as an independent realization of the flow field. Each segment contains 256 snapshots (Nfft = 256), and the repetition rate between adjacent segments is 50% to minimize the variance of spectral estimation.

4. Results and Analysis

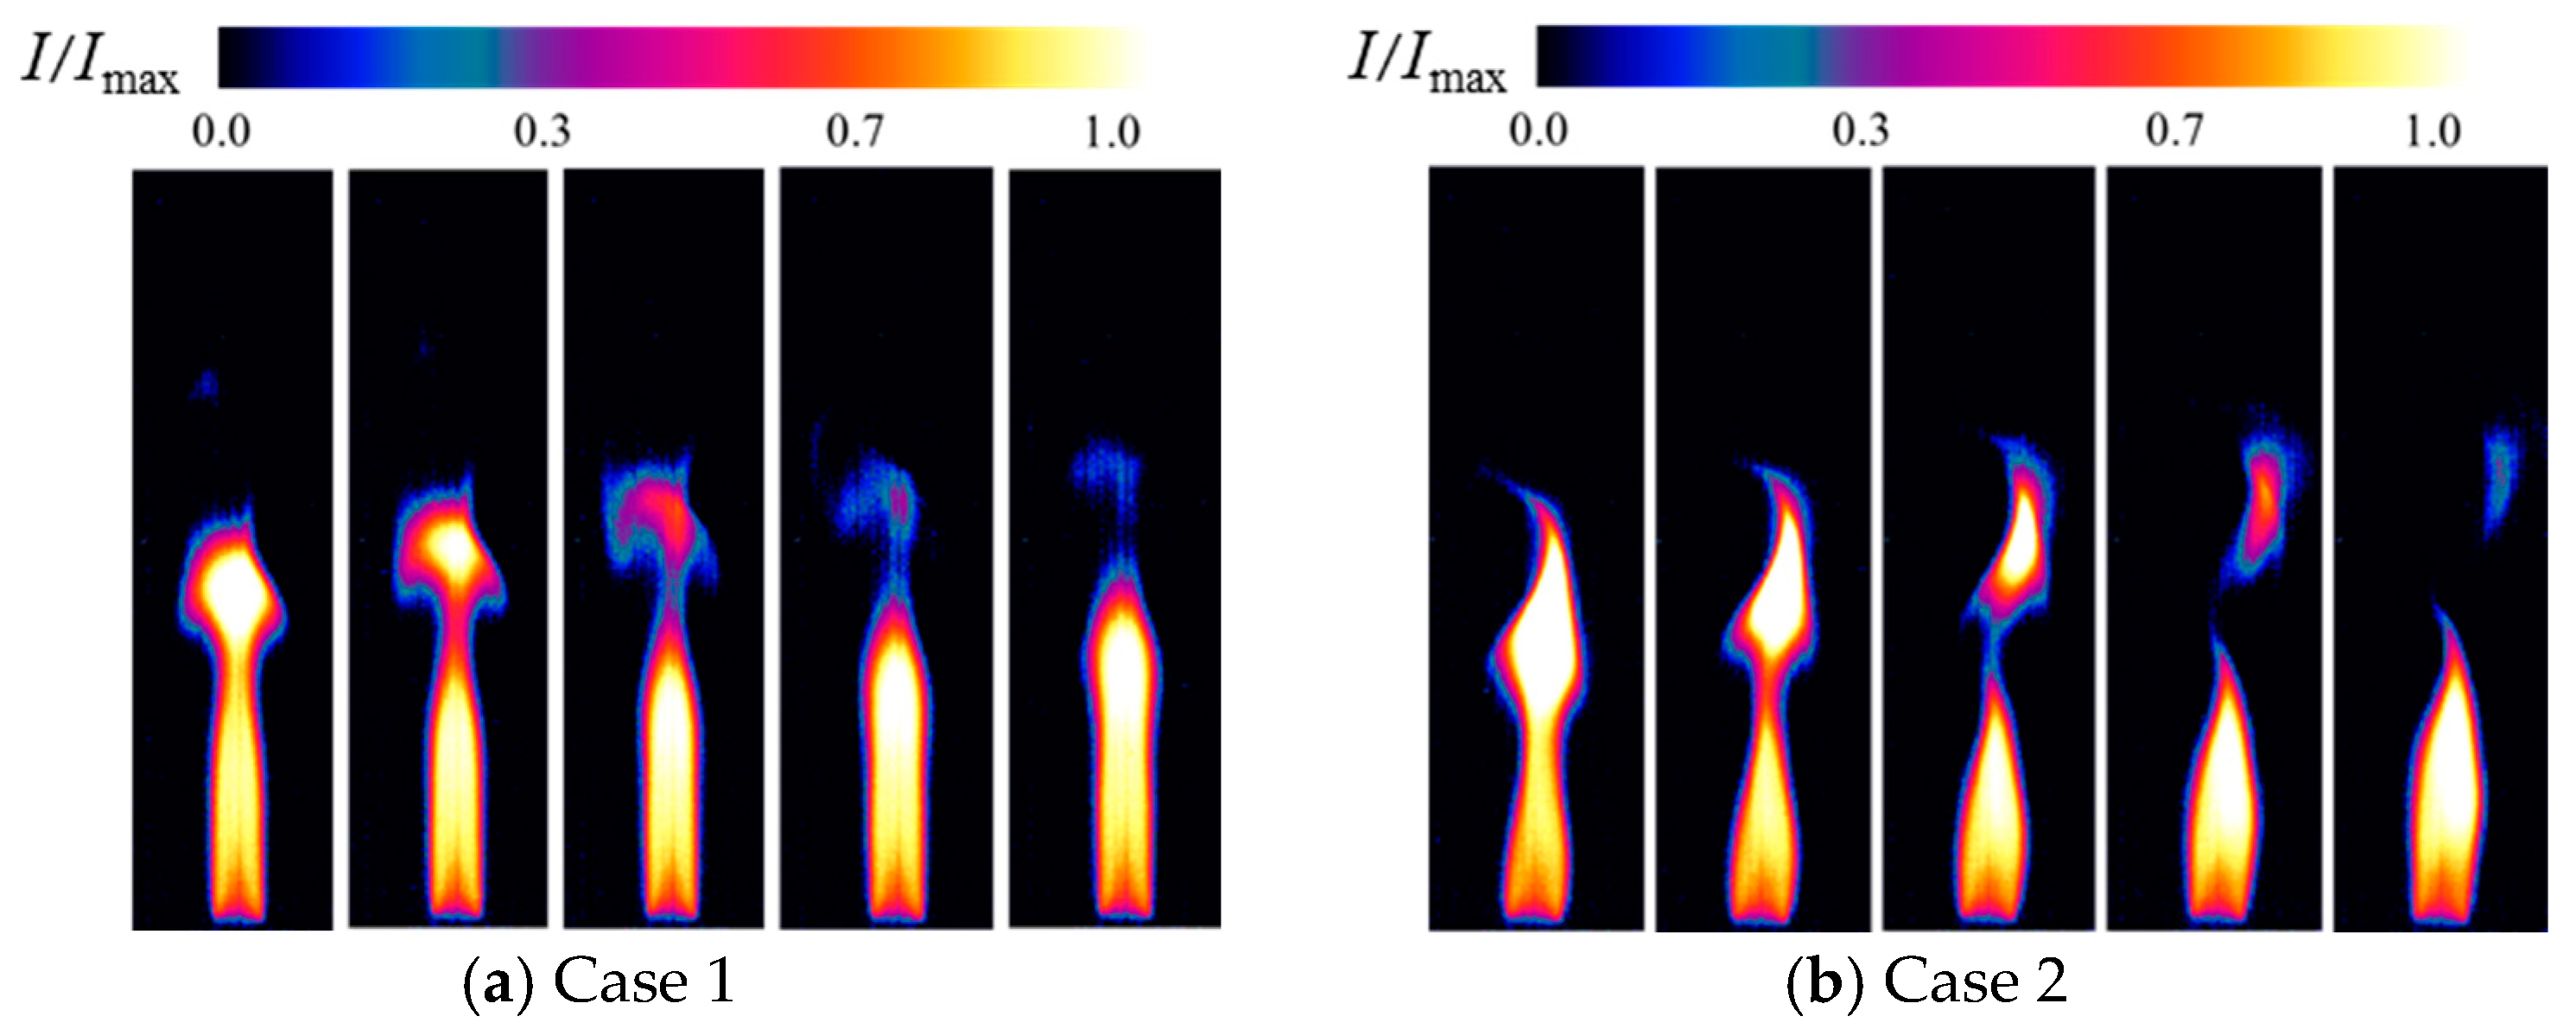
4.1. Flicker Characterization of the Flame

Figure 2 shows a transient infrared radiometric image of a methane flame at representative moments under these two conditions. The time interval between the acquisition of each image by the MWIR camera was 10 ms. In this study, only the infrared spectral characteristics of the flame were of interest; therefore, the thermal image was normalized by the maximum value of the radiation intensity. The insets show the IR transient distribution characteristics of the flame. Figure 2a,b shows infrared thermal images of the diffusion flame for velocity ratios of Ur = 1.53 and Ur = 0 operating conditions, respectively. These images encompass the entire process from the beginning of flame necking to the end of lifting, which corresponds to approximately half the period of flame flickering.
Figure 2a shows that the flame exhibits quasi-laminar flow characteristics near the nozzle exit. The flame remains in a steady state. Along the axis towards the downstream direction of the flame, the nonlinear oscillation characteristic of the periodic lifting, necking, and breaking of the flame is clearly shown. This is due to the shear effect triggered by the formation of a velocity difference between the methane ejected through the nozzle and the ambient air. This shear effect convolves air to form large-scale vertically moving vortices [25]. A flame surface bulge is formed when the axially oriented vortex stretches the flame surface, enhancing the mixing of the fuel and oxidizer in a short period of time. This effect increased the localized combustion rate, causing the gas at the top of the flame to be consumed more rapidly. The gas pressure in the top region of the flame decreases, causing the top of the flame to shrink and narrow, allowing some of the unburned gas to detach and burn out above the flame. In the Case 2 combustion environment, the velocity difference between the flame and the surrounding air was greater, and the shear effect was stronger. The gas began to destabilize closer to the nozzle, and the flame was characterized by more intense and frequent nonlinear oscillations. This strong shear effect induces earlier vortex formation and shedding near the flame root. The flame jitter amplitude was greater than that in Case 1, and the overall combustion process was more complex and unstable.

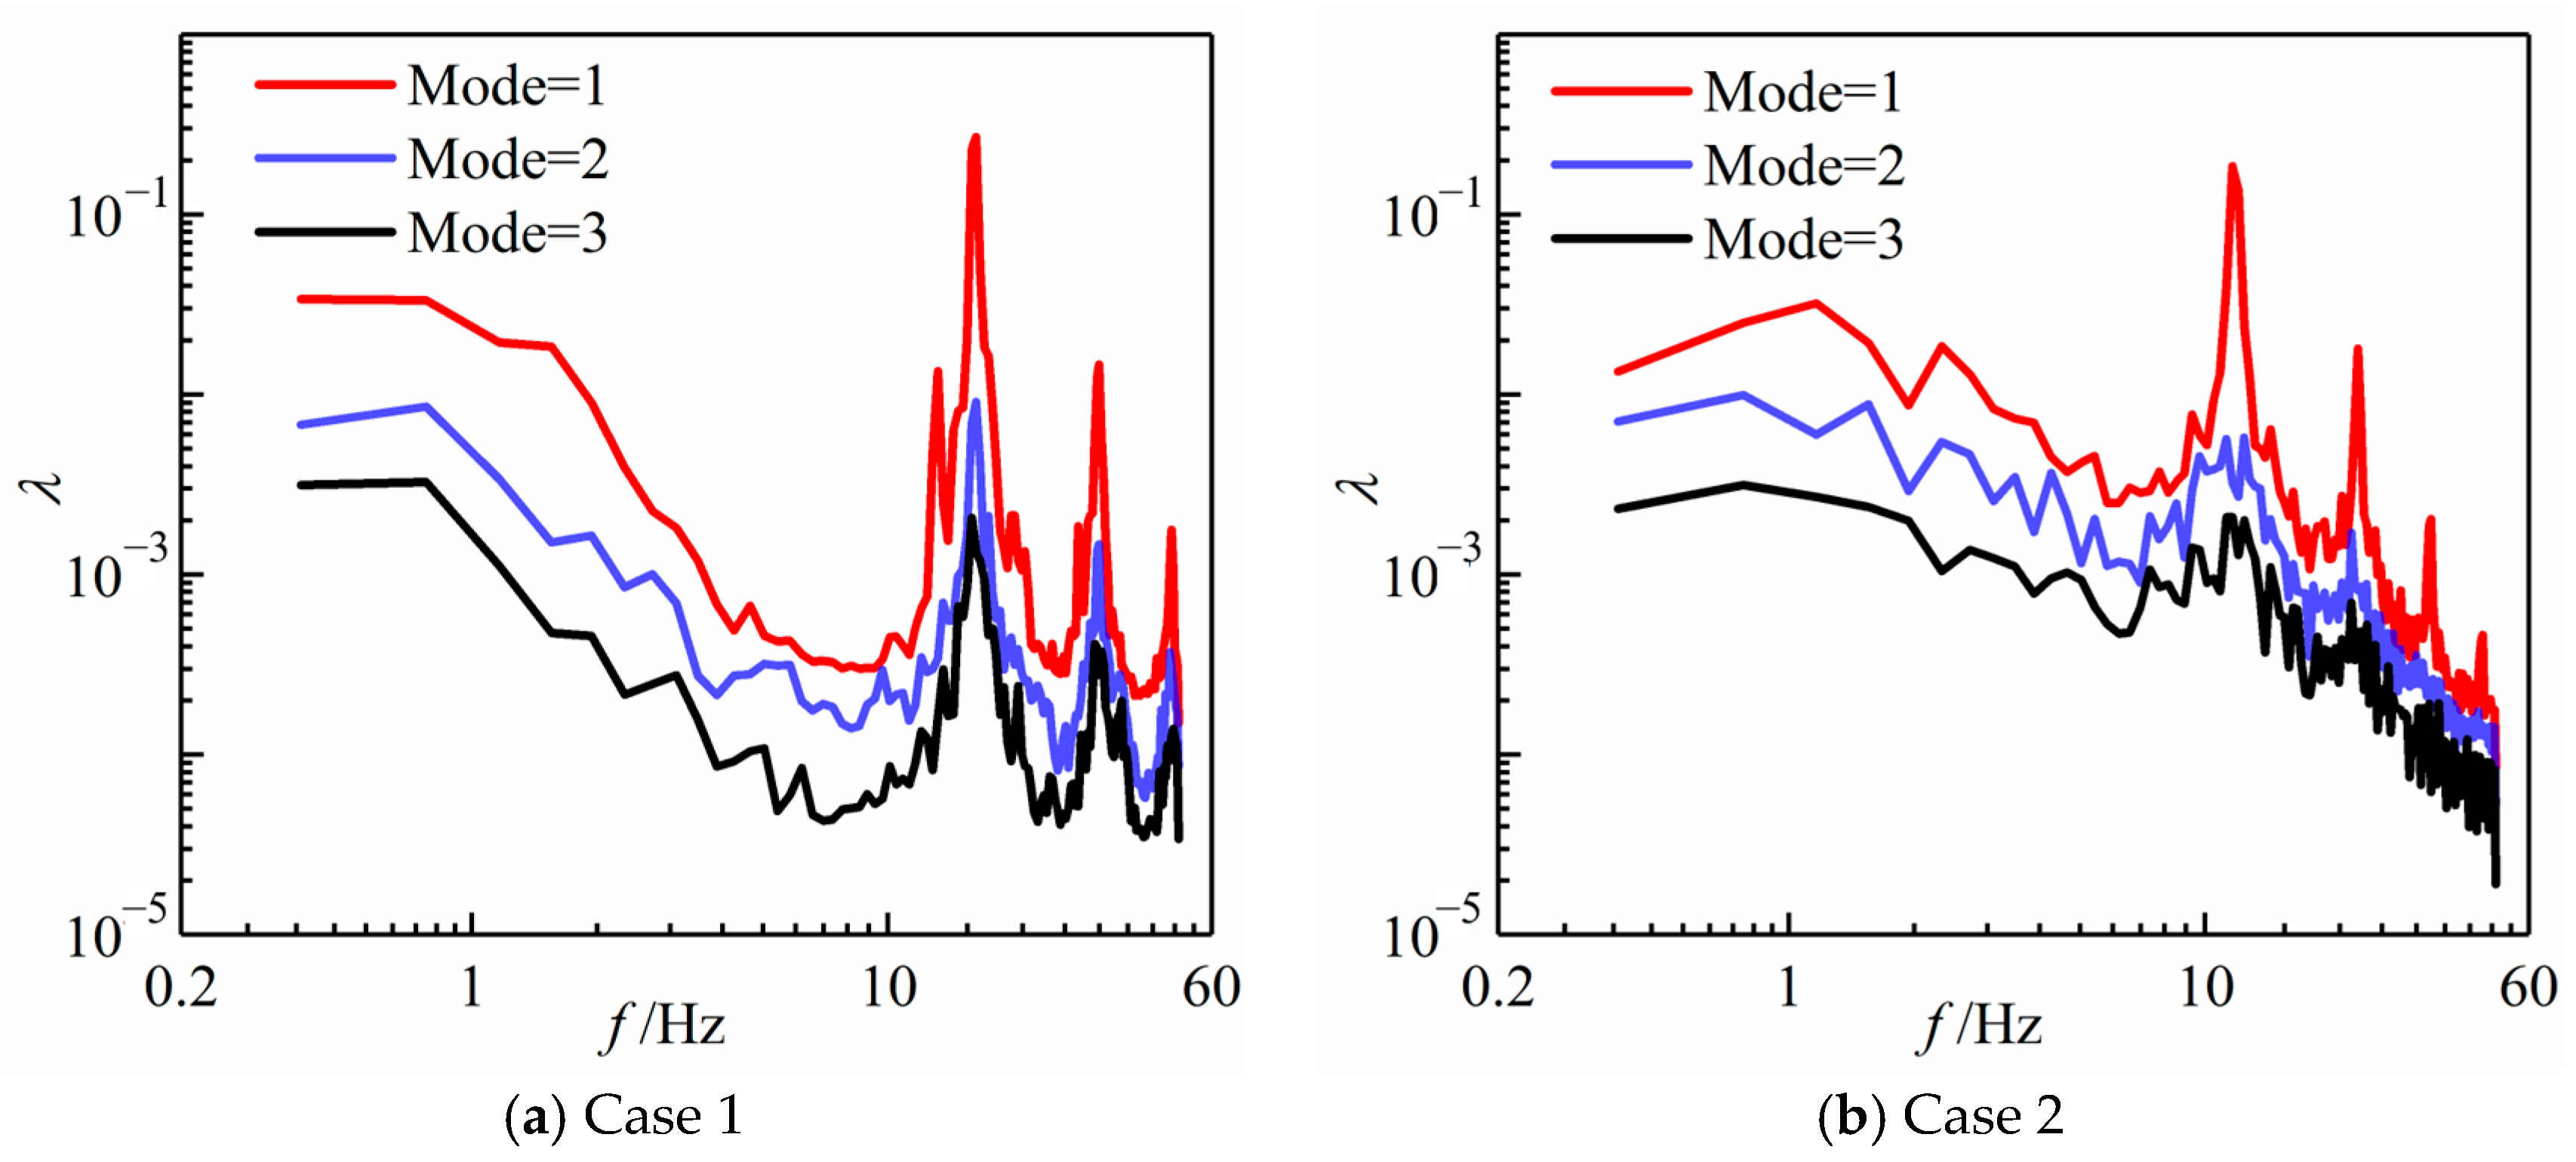
4.2. Spectral Characterization of Flame Flickering

To analyze the flame combustion instability phenomenon, the flame combustion fluctuation behavior was analyzed from a frequency-domain perspective. Infrared radiation thermal image data under the two working conditions were selected for SPOD analysis. The overlap rate of the neighboring snapshot blocks of each phase in the SPOD method was set to 50%, and the total number of snapshots was 1024. The SPOD mode energy spectra of the IR thermal images are shown in Figure 3. The horizontal axis of the graph represents the frequency, and the vertical axis represents the SPOD mode energy. The horizontal and vertical coordinates are in logarithmic coordinate form. The distribution of the curves from top to bottom represents the change in the eigenvalues with increasing mode order.
As shown in Figure 3, the first-order SPOD mode has the highest energy share, indicating that it is the dominant mode of the flow. In the case with concomitant flow (Case 1), the SPOD spectrum showed broad peaks at low frequencies and a relatively high SPOD energy. This was attributed to the formation of a non-axisymmetric mode of lateral flame motion, as shown in Figure 2a. A flickering main peak frequency of 16.6 Hz was captured in the high-frequency region. The second and third harmonics of the flame vibration are near f = 32.9 Hz and 48.8 Hz, respectively, and their amplitudes are smaller than the fundamental flicker frequency. This phenomenon is caused by the nonlinear properties of the flame vibration. For the case without co-flow (Case 2), the peak flickering frequency of the flame decreases from 16.6 Hz to 11.6 Hz, a phenomenon consistent with that observed in the experiment. The presence of 23.2 Hz, 34.8 Hz, and 46.1 Hz harmonics was also observed in the spectrum under the flame perturbation effect. A comparison of the SPOD spectra of flames with and without a co-flow revealed that flames with a co-flow have a relatively low energy content in the high-frequency region in the frequency domain, other than the peak flicker frequency. However, the flame with unaccompanied flow had a larger percentage of energy in the other high-frequency domains. This difference was mainly attributed to the shear effect between methane and air.

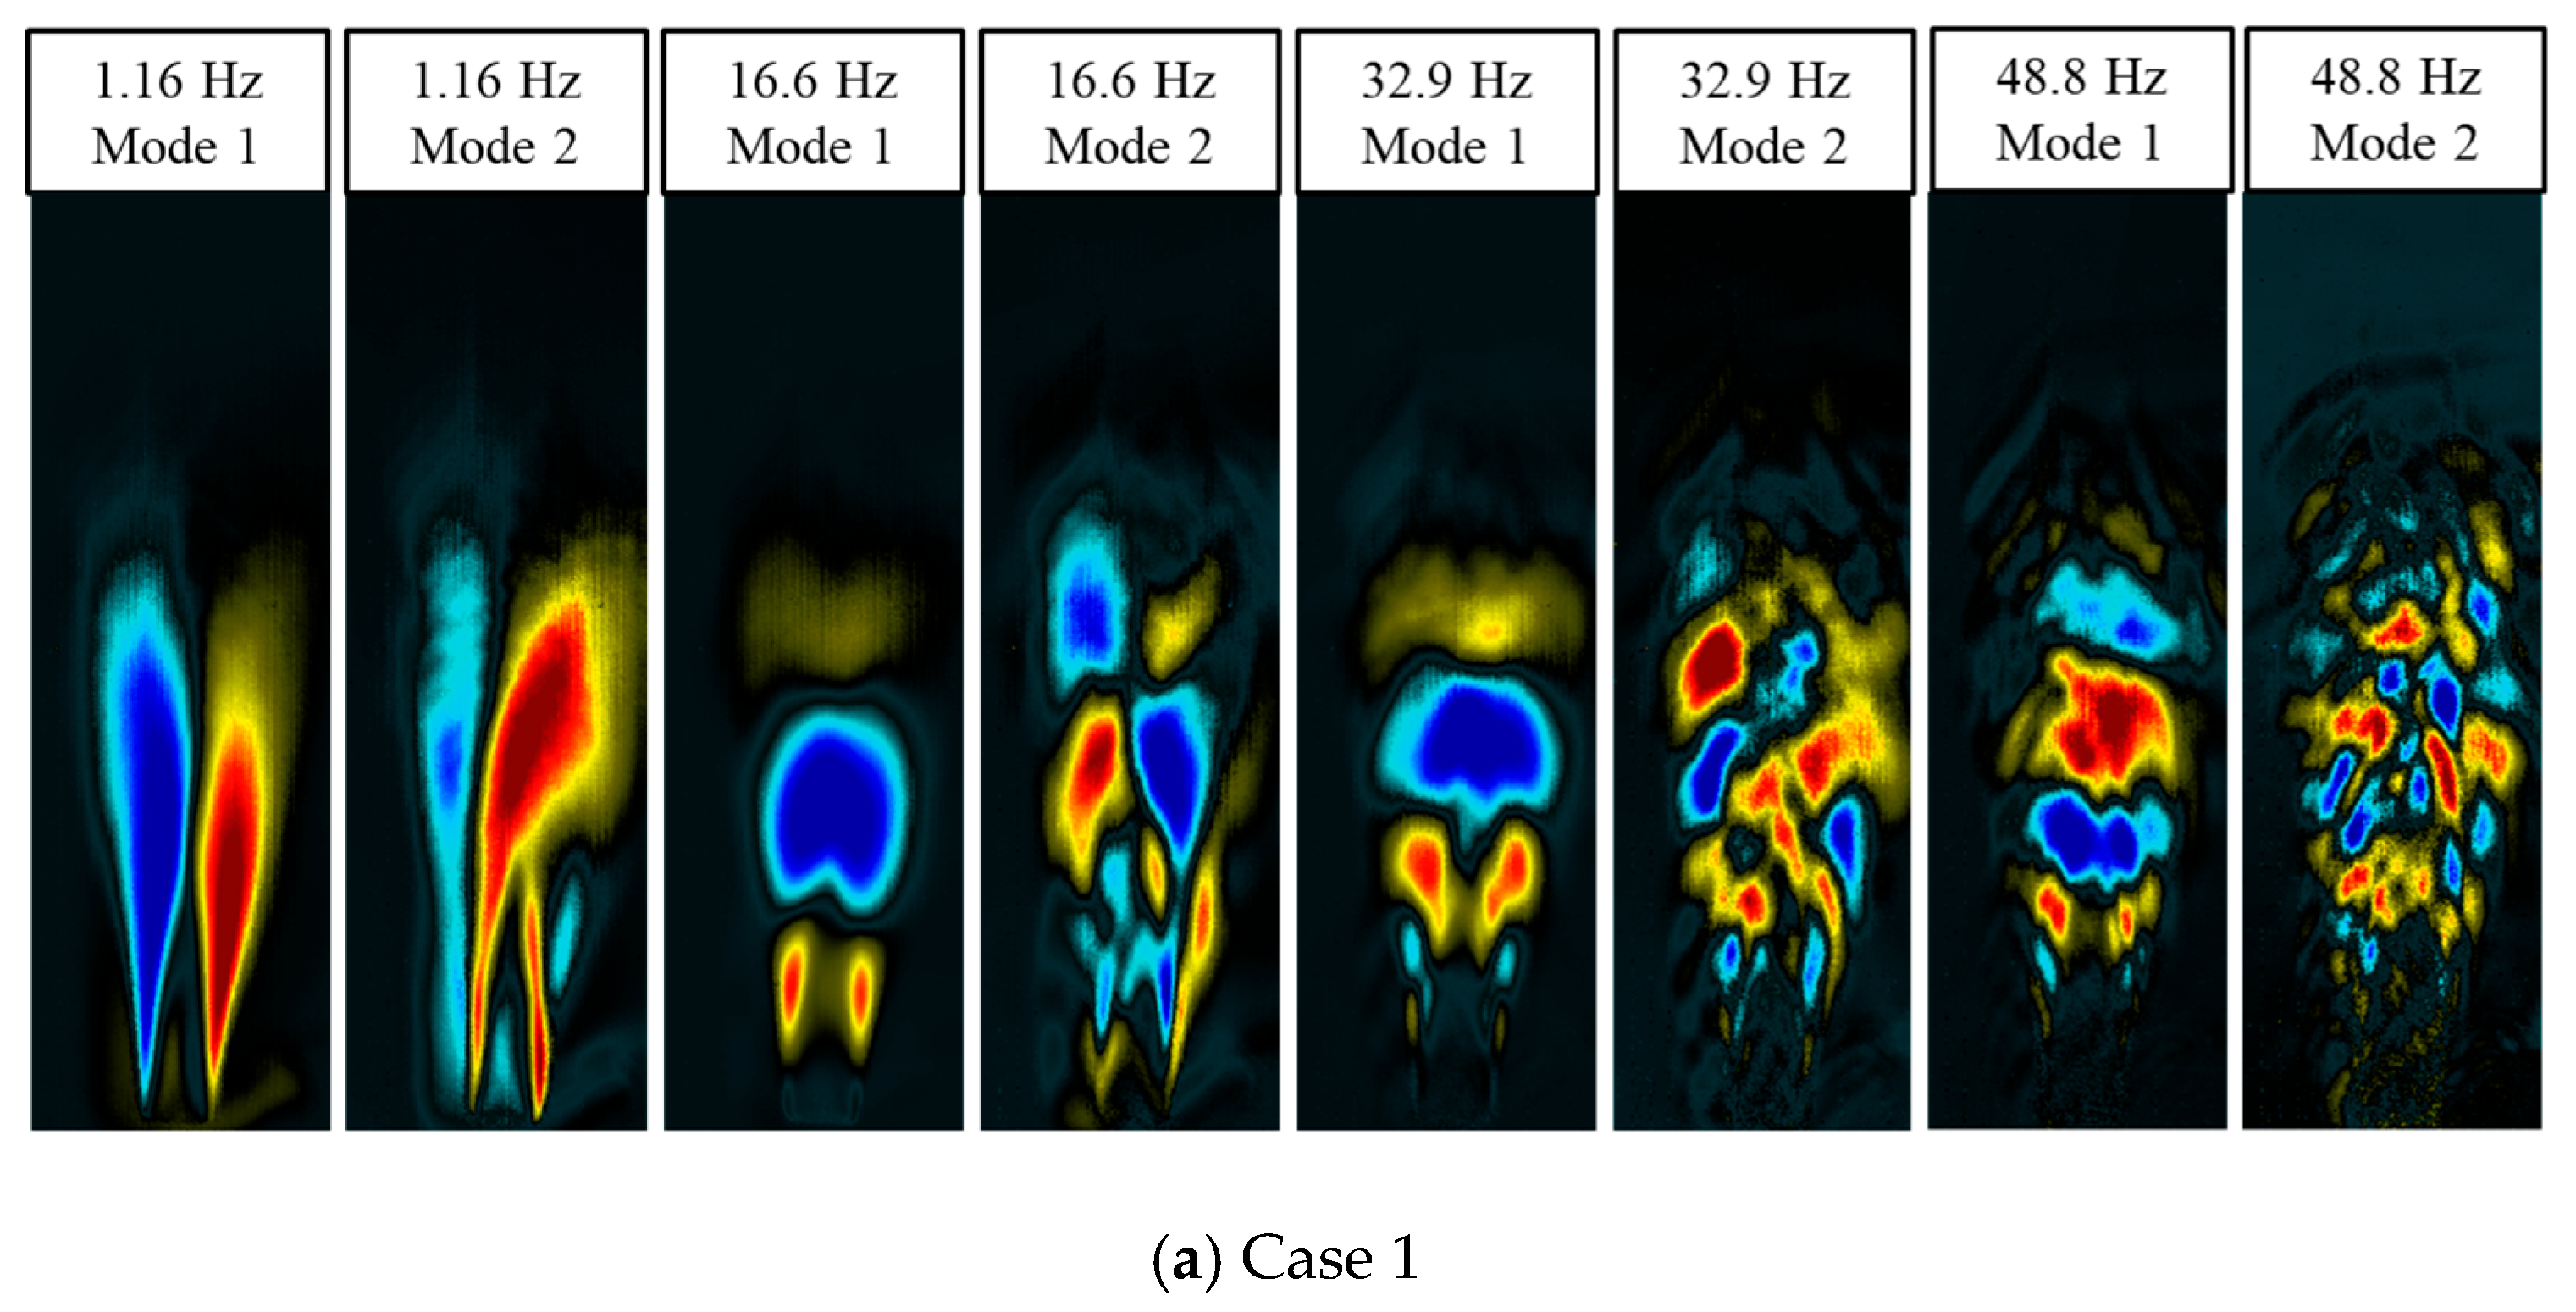
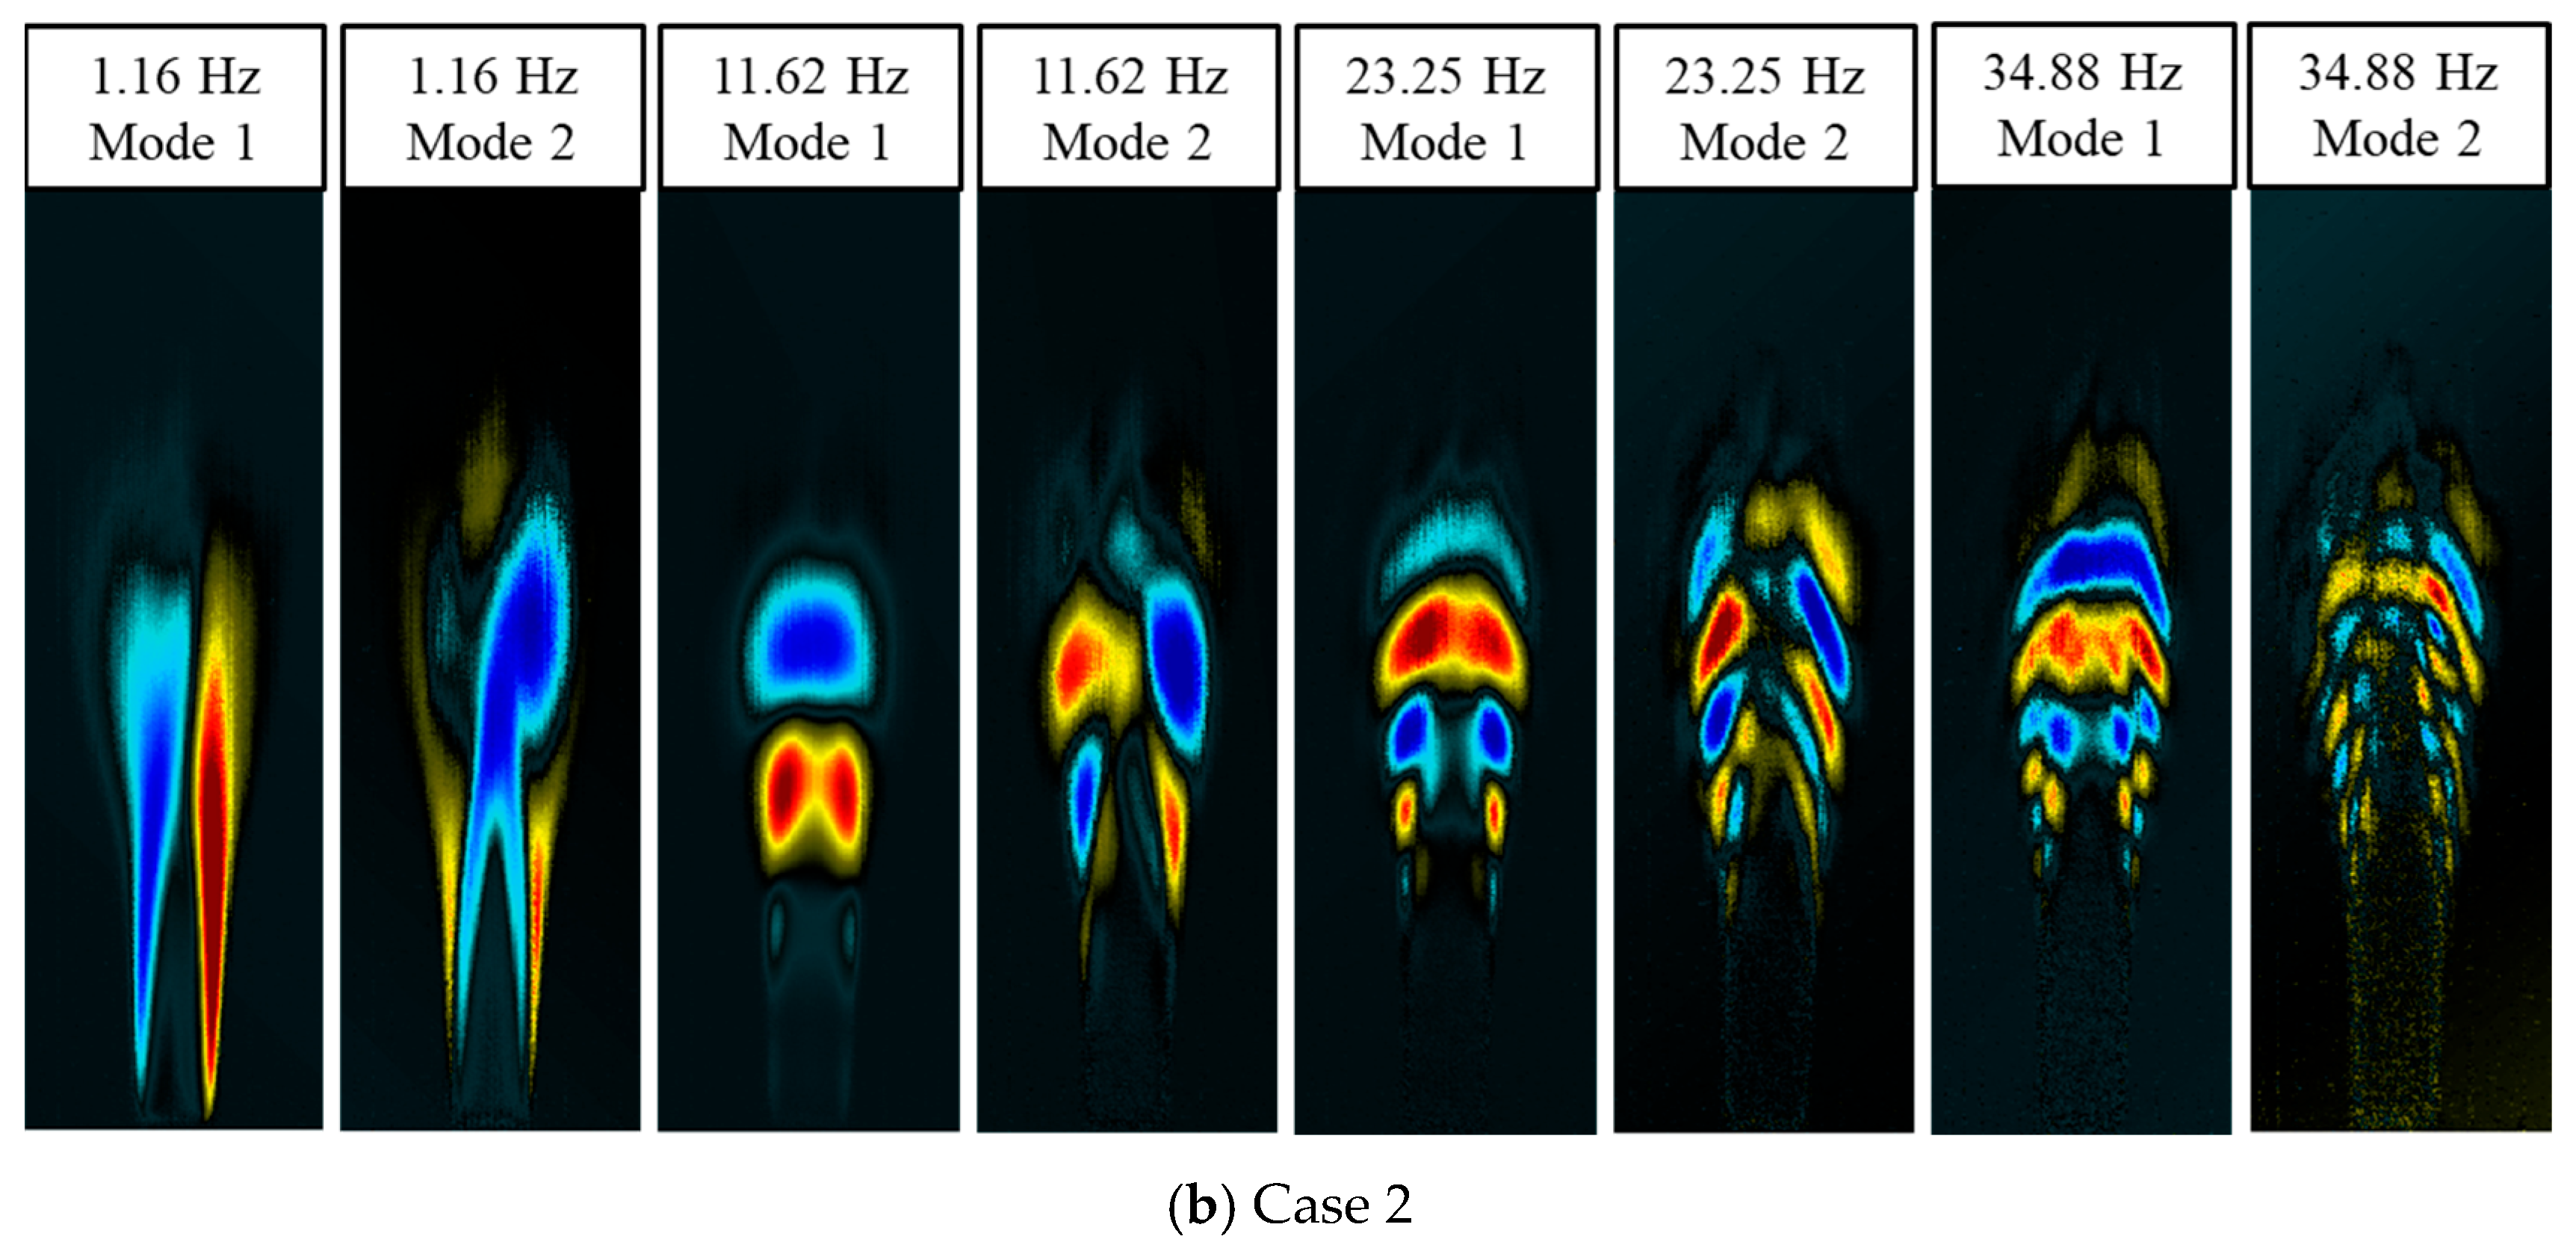
4.3. Spatial Structure of Flame Flicker Modes

Figure 4 shows the spatial distribution characteristics of coherent structures during combustion, which were obtained based on the SPOD mode analysis corresponding to the eigenfrequencies. Figure 4a,b shows the SPOD mode distributions with and without the co-flow conditions, respectively. Figure 4a shows that the 1st-order SPOD modes at low frequencies present an antisymmetric structural distribution, and the 2nd-order SPOD modes present a symmetric structural distribution. POD modes presenting symmetric distributions indicate symmetric vortex shedding modes, whereas antisymmetric distributions indicate antisymmetric vortex shedding modes. The symmetry of the dominant mode was reversed when the frequency increased to the main peak at 16.6 Hz. The 1st order mode shifts to a symmetric structure, and the coherent structure migrates to the flame-dissipation region, implying that the flame dynamics in the high-frequency band are dominated by symmetric vortex shedding. The structural features of the SPOD mode distribution for the second and third harmonics were similar to those of the main peak mode distribution. However, the SPOD mode energies of the second and third harmonics gradually decrease with increasing frequency, and their mode symmetry gradually weakens. Additionally, the spatial distribution of the modes gradually evolved downstream of the flame as the frequency increased. The SPOD mode distribution characteristics shown in Figure 4b for the unaccompanied flow condition are similar to those for the co-flow condition, indicating that the intrinsic mechanism of combustion is the same under the two conditions.

5. Conclusions

In this study, the flicker characteristics were analyzed using mid-wave infrared test images of methane/air diffusion flames. The dynamic characteristics of the flame with and without the co-flow were comparatively analyzed, including the transient characteristics, frequency-spectrum characteristics, and spatial mode distributions. The conclusions are as follows:
(1)
The flame was dominated by the K-H instability during combustion. The shear effect sucks in the surrounding air for unstable combustion, and the flame exhibits nonlinear oscillation characteristics of periodic lifting, necking and breaking.
(2)
The flame SPOD spectrum shows an octave distribution law. With an increase in the velocity ratio of the co-flow, the peak frequency increased gradually. The dominant flickering frequency of the flame without the co-flow was slightly lower than that of the flame with the co-flow.
(3)
The spatial distribution characteristics of the SPOD modes revealed the dominant mode of combustion oscillation. As the frequency increased, the spatial distribution of the modes gradually moved downstream from the flame. With an increase in the mode order, the spatial structure scale of the modes gradually decreases, and the symmetry of the modes is weakened.

Author Contributions

Conceptualization, Q.N.; Validation, Q.N. and X.M.; Formal analysis, Z.Z.; Investigation, Q.N., Z.Z. and P.Z.; Resources, Q.N.; Data curation, A.S.; Writing—original draft, Q.N.; Writing—review & editing, Q.N. All authors have read and agreed to the published version of the manuscript.

Funding

This research was funded by National Natural Science Foundation of China (52006203, U22B2045), Fundamental Research Program of Shanxi Province (202403021211078).

Institutional Review Board Statement

Not applicable.

Informed Consent Statement

Not applicable.

Data Availability Statement

The data presented in this study are available on request from the corresponding author due to privacy.

Conflicts of Interest

The authors declare no conflict of interest.

References

  1. Cheng, T.S.; Chen, C.P.; Chen, C.S.; Li, H.Y.; Wu, C.Y.; Chao, Y.C. Characteristics of microjet methane diffusion flames. Combust. Theory Model. 2006, 10, 861–881. [Google Scholar] [CrossRef]
  2. Hammis, A.; Yang, J.C.; Kashiwagi, T. An experimental investigation of the pulsation frequency of flames. Symp. Combust. 1992, 24, 1695–1702. [Google Scholar] [CrossRef]
  3. Katta, V.R.; Goss, L.P.; Roquemore, W.M. Effect of nonunity Lewis number and finite-rate chemistry on the dynamics of a hydrogen-air jet diffusion flame. Combust. Flame 1994, 96, 60–74. [Google Scholar] [CrossRef]
  4. Katta, V.; Roquemore, W. Role of inner and outer structures in transitional jet diffusion flame. Combust. Flame 1993, 92, 274–282. [Google Scholar] [CrossRef]
  5. Li, J.; Zhang, Y. Fuel variability effect on flickering frequency of diffusion flames. Front. Energy Power Eng. China 2009, 3, 134–140. [Google Scholar] [CrossRef]
  6. Cao, S.; Bennett, B.A.V.; Ma, B.; Giassi, D.; Stocker, D.P.; Takahashi, F.; Smooke, M.D. A computational and experimental study of coflow laminar methane/air diffusion flames: Effects of fuel dilution, inlet velocity, and gravity. Proc. Combust. Inst. 2015, 35, 897–903. [Google Scholar] [CrossRef]
  7. Darabkhani, H.; Zhang, Y. Stabilisation Mechanism of a Flickering Methane Diffusion Flame with Co-flow of Air. Eng. Lett. 2010, 18, 369–375. [Google Scholar]
  8. Fujisawa, N.; Okuda, T. Effects of co-flow and equivalence ratio on flickering in partially premixed flame. Int. J. Heat Mass Transf. 2018, 121, 1089–1098. [Google Scholar] [CrossRef]
  9. Sahu, K.; Kundu, A.; Ganguly, R.; Datta, A. Effects of fuel type and equivalence ratios on the flickering of triple flames. Combust. Flame 2009, 156, 484–493. [Google Scholar] [CrossRef]
  10. Darabkhani, H.G.; Wang, Q.; Chen, L.; Zhang, Y. Impact of co-flow air on buoyant diffusion flames flicker. Energy Convers. Manag. 2011, 52, 2996–3003. [Google Scholar] [CrossRef]
  11. Manikantachari, K.R.V.; Raghavan, V.; Srinivasan, K. Natural flickering of methane diffusion flames. Int. J. Mech. Aerosp. Ind. Mechatron. Manuf. Eng. 2011, 5, 2423–2428. [Google Scholar]
  12. Wang, Q.; Darabkhani, H.G.; Chen, L.; Zhang, Y. Vortex dynamics and structures of methane/air jet diffusion flames with air coflow. Exp. Therm. Fluid Sci. 2012, 37, 84–90. [Google Scholar] [CrossRef]
  13. Gotoda, H.; Asano, Y.; Chuah, K.H.; Kushida, G. Nonlinear analysis on dynamic behavior of buoyancy-induced flame oscillation under swirling flow. Int. J. Heat Mass Transf. 2009, 52, 5423–5432. [Google Scholar] [CrossRef]
  14. Fujisawa, N.; Matsumoto, Y.; Yamagata, T. Influence of Co-flow on Flickering Diffusion Flame. Flow Turbul. Combust. 2016, 97, 931–950. [Google Scholar] [CrossRef]
  15. Fujisawa, N.; Sakai, K.; Yamagata, T. Observation of large-scale structure in flickering diffusion flame by time-resolved particle image velocimetry and shadowgraph imaging. Exp. Therm. Fluid Sci. 2018, 92, 286–294. [Google Scholar] [CrossRef]
  16. Chatterjee, S.; Mukhopadhyay, A.; Sen, S. Stability Study of Laminar Flame Using Proper Orthogonal Decompostion and Dynamic Mode Decomposition. In Proceedings of the N3l-Int’l Summer School and Workshop on Non-Normal and Nonlinear Effects in Aero-And Thermoacoustics, Munich, Germany, 18–21 June 2013; N3l: Cornwall, UK, 2013. [Google Scholar]
  17. Zeng, X.; Zhang, Y.; He, C.; Liu, Y. Time- and frequency-domain spectral proper orthogonal decomposition of a swirling jet by tomographic particle image velocimetry. Exp. Fluids 2022, 64, 1–27. [Google Scholar] [CrossRef]
  18. Sieber, M.; Paschereit, C.O.; Oberleithner, K. Spectral proper orthogonal decomposition. J. Fluid Mech. 2016, 792, 798–828. [Google Scholar] [CrossRef]
  19. Schmidt, O.; Towne, A.; Colonius, T.; Cavalieri, A.V.G.; Jordan, P.; Brès, G.A. Wavepackets and trapped acoustic modes in a turbulent jet: Coherent structure eduction and global stability. J. Fluid Mech. 2017, 825, 1153–1181. [Google Scholar] [CrossRef]
  20. Ataya, D.; Colonius, T.; Dabiri, J. Transition to bluff-body dynamics in the wake of vertical-axis wind turbines. J. Fluid Mech. 2017, 813, 346–381. [Google Scholar]
  21. Abreu, L.; Cavalieri, A.; Wolf, W. Coherent Hydrodynamic Waves and Trailing-Edge Noise. In Proceedings of the 23rd AIAA/CEAS Aeroacoustics Conference, Denver, CO, USA, 5–9 June 2017; ARC: Columbus, OH, USA, 2017; p. 3173. [Google Scholar]
  22. Julius, S.B.; Allan, G.P. Random Data Analysis and Measurement Procedures; John Wiley and Sons Incorporated: Hoboken, NJ, USA, 2000. [Google Scholar]
  23. Kovasznay, L.S.; Favre, A.; Buchhave, P.; Hansen, B.W. Proceedings of the Dynamic Flow Conference 1978 on Dynamic Measurements in Unsteady Flows; Springer Science & Business Media: Berlin/Heidelberg, Germany, 2012. [Google Scholar]
  24. Harris, F.J. On the use of windows for harmonic analysis with the discrete Fourier transform. Proc. IEEE 1978, 66, 51–83. [Google Scholar] [CrossRef]
  25. Yuan, T.; Durox, D.; Villermaux, E. An analogue study for flame flickering. Exp. Fluids 1994, 17, 337–349. [Google Scholar] [CrossRef]
Figure 1. Schematic diagram of experimental system.
Fire 08 00255 g001
Figure 2. Transient infrared radiation thermal imaging of methane/air flame.
Fire 08 00255 g002
Figure 3. SPOD energy spectra in different modes.
Fire 08 00255 g003
Figure 4. SPOD mode spatial distribution.
Fire 08 00255 g004aFire 08 00255 g004b
Table 1. Conditions of methane non-premixed combustion experiments.
TypeExperimental Conditions
FuelsMethane (purity 99.99%)
Accompanying gasesAir (78.08% nitrogen + 20.94% oxygen + other gases)
EnvironmentRoom temperature 290 K
31% humidity
Atmospheric pressure (100,000 Pa)
Table 2. Parameters of fuel and air flow under different operating conditions.
MethaneAirVelocity Ratio
Case No. q ˙ (L/min)Uf (m/s) q ˙ (L/min)Uc (m/s)Ur (=Uc/Uf)
Case 10.40.085600.131.53
Case 20.40.085000
Disclaimer/Publisher’s Note: The statements, opinions and data contained in all publications are solely those of the individual author(s) and contributor(s) and not of MDPI and/or the editor(s). MDPI and/or the editor(s) disclaim responsibility for any injury to people or property resulting from any ideas, methods, instructions or products referred to in the content.

