Article

Quantifying the Influence of Parameters on Heat Release Rate in Electrical Cabinet Fires

1
Department of Mechanical Engineering, Virginia Polytechnic Institute and State University, Blackburg, VA 24061, USA
2
Department of Nuclear Engineering, University of Wisconsin, Madison, WI 53706, USA
*
Authors to whom correspondence should be addressed.
Fire 2025, 8(7), 256; https://doi.org/10.3390/fire8070256
Submission received: 17 May 2025 / Revised: 18 June 2025 / Accepted: 25 June 2025 / Published: 30 June 2025

Abstract

Electrical cabinet fire scenarios constitute a significant risk within nuclear facilities, emphasizing the need to mitigate uncertainties in risk evaluations. Owing to the disparate nature of electrical cabinet parameters, only a few factors have been experimentally explored and statistically analyzed to assess their impact on peak HRR. In this study, we conducted both a cabinet parameter study and a combustible configuration study to systematically evaluate their influence on peak HRR and time-to-peak HRR. A series of 51 simulation matrices were created using statistical experiment design (SED) and ANOVA to quantify the influence of cabinet volume, combustible surface area, vent area, ignition characteristics, and burning behavior (e.g., HRRPUA and duration). A computational fluid dynamics (CFD) model, specifically a Fire Dynamics Simulator (FDS), was used to model the ignition source and flame spread inside of the electrical cabinet that influence peak HRR. The most impactful parameters influencing peak HRR and time-to-peak HRR were identified. The findings revealed that the configuration of combustibles and the placement of the ignition source play a pivotal role in determining the peak HRR. A partition screening analysis was conducted to identify the conditions under which the ventilation area becomes a more significant parameter. Additionally, a comparison between experimental results and numerical simulations demonstrated good agreement, further validating the predictive capability of the model.

1. Introduction

Electrical cabinet fires represent a significant hazard, often originating from electrical components in nuclear power plants (NPPs), chemical industries, telecommunication buildings, and other thermal power plants. A large part of electrical fire hazards is attributed to electrical cabinets, as well as safety equipment exposed to a fire environment. These fires can occur in rooms that harbor electrical components, including switchgear, control panels, main control boards, and distribution panels with electrical cabinets being cited as the reason for the vast majority of electrical fires. Based on a statistical analysis conducted on 2111 fire events [1], about 540 fire events were labeled as challenging, with the fires initiated within an electrical cabinet representing a majority of 40.7%. This number is especially high considering electrical cabinets are equipped with combustible electrical components and have natural or mechanical ventilation. There is a significant variation in the size and arrangement of combustible components (e.g., cables and computer boards) within electrical cabinets, which can have an impact on a fire’s overall peak HRR. For most fire model applications, the HRR of the fire is the most important parameter to specify. Evaluating both the peak HRR and overall fire propagation behavior is critical for conducting fire risk assessments. A few experiments conducted previously investigated the influence of cabinet factors on fire conditions and sought to understand their relationship to response variables, such as peak HRR and time-to-peak HRR. Two studies [2,3] used full-scale electrical cabinets with specific dimensions and varied ventilation areas. Closed cabinet layouts with defined sizes were examined, where ventilation conditions ranged from fully open equipment racks to fully enclosed racks. The tests demonstrated that ventilation into the cabinet has a major impact on peak HRR.
A study [4] found that ventilation area significantly influences cabinet HRR. Additional electrical cabinet fire experiments have been carried out using simplified, well-defined combustible fuels and configurations. In a series of 25 tests conducted under a hood calorimeter, the effects of various parameters on outcomes such as peak HRR, steady-state HRR, and time to flashover were evaluated. In these experiments, the percentage volume occupied by fuels, such as polymethyl methacrylate (PMMA), polyvinyl chloride (PVC), and polyethylene (PE), were monitored on the cabinet HRR while the total mass occupied by the fuels remained constant at 10 kg. Electrical cabinets of definite size (undivided and shelved) with ventilation openings ranging from 0 to 0.0091 m2 were used to determine whether fires emanating from an ignition source can be sustained inside a cabinet. It was noted that when cabinet volume was halved by accommodating a shelf, a 50 kW propane fire was sustained with significantly lower vent openings [5]. Prior studies provide a wealth of insight into electrical cabinet fires; however, limited experiments have been conducted in this area to determine the influence of combustible fuel arrangement on the overall HRR of cabinet fires. These experiments usually place combustible fuel in the center of the cabinet or along the side walls and ignite the combustibles with an ignition source. The tests [6] varied the combustible arrangements by adjusting the number of cables, circuit boards and connectors, and wiring. The results showed that the fire behavior is affected by the combustible fuels and their arrangement inside the cabinet. However, the complexity of the arrangements and lack of detail on the combustible surface area made it difficult to understand what parameters were the most impactful in these fires. Understanding these parameters would shed light on the critical parameters that influence fire growth and intensity, and improve the design of electrical cabinets, where these fires pose significant risks.
Electrical cabinets with large and medium volumes [7] can be further subdivided according to combustible load, cable materials, and ventilation area so that the expected peak HRR values can be estimated using visual inspection only. However, in operating plants, visually inspecting the interior of an electrical cabinet is often impractical. Thus, developing a simple method to estimate the maximum possible peak HRR for a closed door (with ventilation), without the need to open it, would be beneficial [3,8]. The effect of combustible configuration was also investigated during the experiments; however, the results did not fully capture the impact of different material properties, such as ignition temperature, burning duration, surface area, and HRRPUA. CFD modeling has also been used to explore the impact of different variables on the cabinet fire HRR. FDS was used [9] to predict the effects of combustible-fuel details, including surface area, HRRPUA, burning duration, ignition temperature, and combustible configuration. While the experiments provided valuable insights into the role of combustible configuration, they lacked the ability to quantify the influence of material properties, which is where computational modeling becomes essential.

Significance and Objectives

The goal of the current research is to conduct a computational study to quantify the importance of parameters impacting electrical cabinet fire HRR. However, past electrical cabinet fire experiments did not methodically examine the effects of combustible arrangement and the ignition source location (bottom, corner, and top) on peak HRR [10]. To address this, a 51-simulation matrix was developed using statistical experiment design (SED) to evaluate how variations in parameters affect peak HRR. In addition, 12 simulations were conducted to investigate the influence of combustible configurations on both peak HRR and time-to-peak HRR. ANOVA was applied to examine the main effects and two-way interactions of parameters on the peak HRR and time-to-peak HRR. Partition screening is used on experimental fire data [6] to analyze the specific conditions where the ventilation area becomes important with the combustible surface area, providing an interpretable insight into these relationships within the context of this research.

2. Methodology

Statistical analysis and simulation matrices were developed for the systematic examination of how various parameters affect both the peak HRR and time-to-peak HRR on fire behavior within the cabinet. 
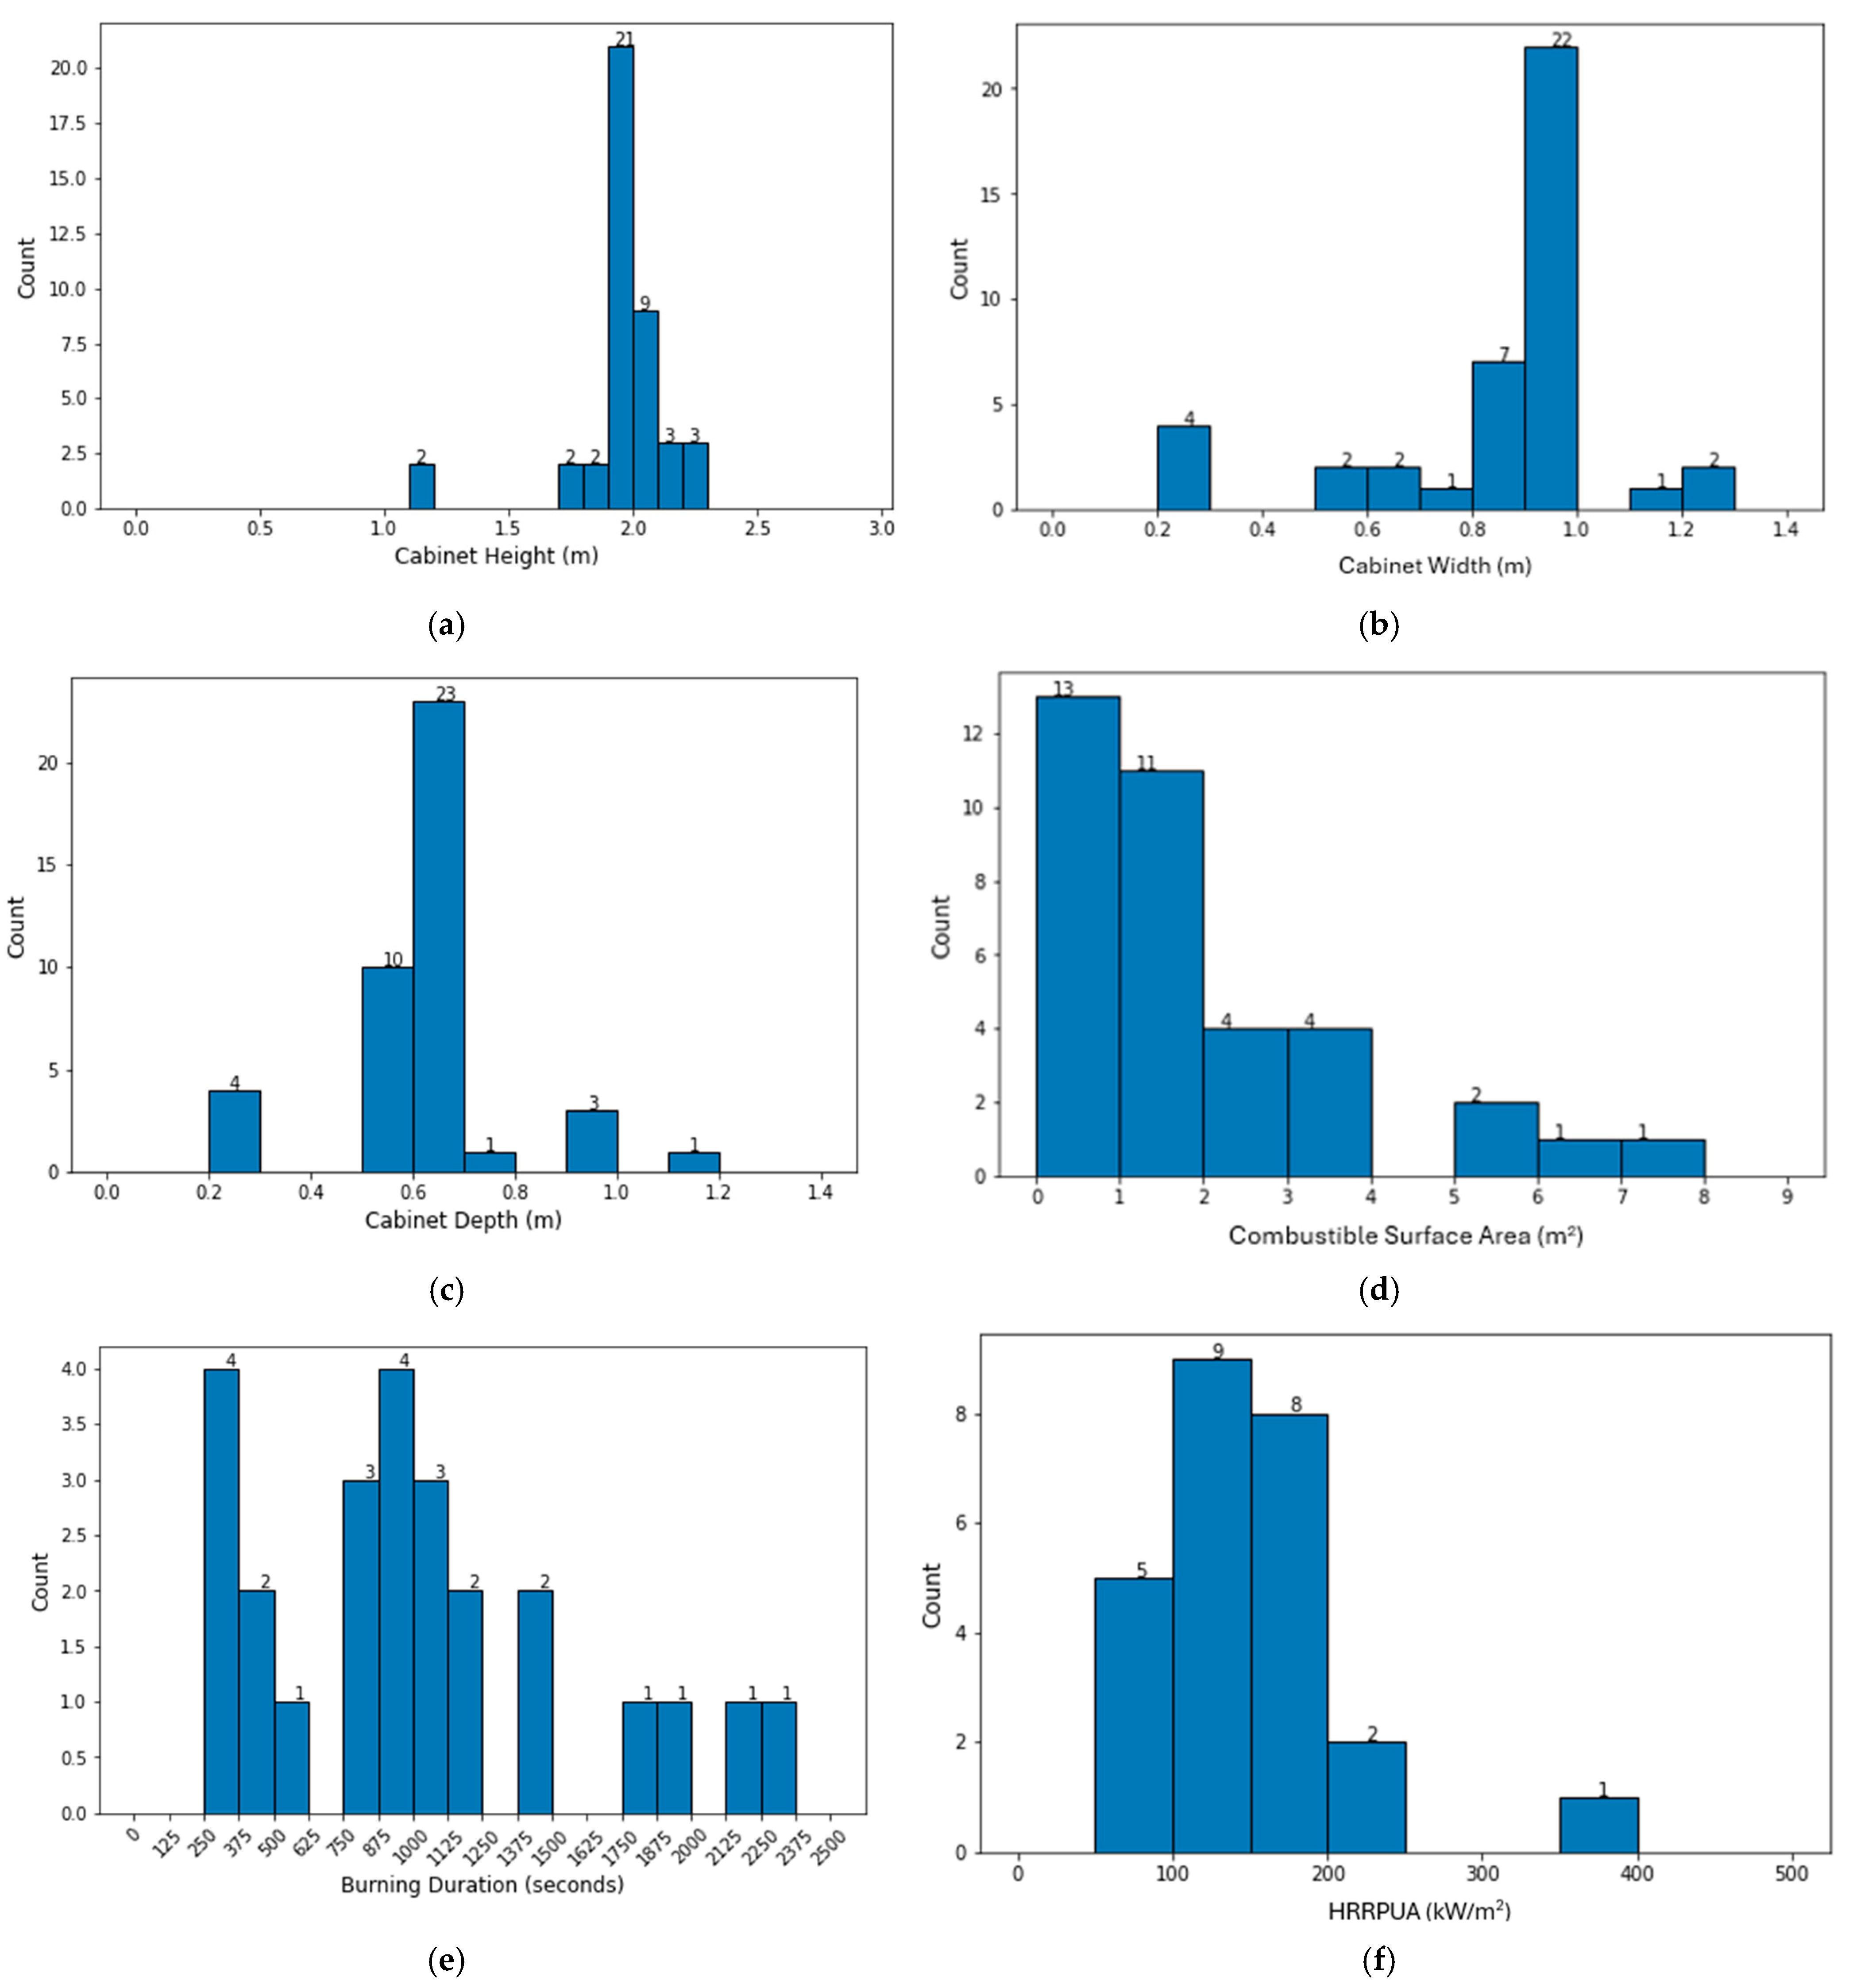
Figure 1a–f present histograms of key cabinet parameters, providing an overview of the dataset used for subsequent simulations, and analysis lies in their ability to provide critical input parameters for fire behavior simulations, ensuring realistic modeling. Datapoint distributions for cabinet volume (height, width, and depth) based on cabinet width, ventilation area, HRRPUA, burning duration, ignition source, and ignition source elevation were developed using data from [1,2,4,10,11,12]. The HRRPUA and burning duration of the combustible materials were quantified using reported cone calorimeter test data [11,13,14,15]. The geometric details of the cabinets were derived from experimental studies [2,6,11], including the height, width, depth, and total ventilation area of the cabinets, along with their combustible surface area. A series of 41 experimental tests were identified, each featuring unique geometric characteristics in Figure 1a–c, which also illustrate the distribution of cabinet heights, widths, and depths, respectively. The average depth and width of the cabinets used in the fire experiments were 0.6 m and 0.8 m, respectively. The height of the electrical cabinets ranged from 1.2 m to 2.4 m, and this variation was utilized to adjust the cabinet volume in the simulations. Using this information, the cabinet volume in the simulations will be fixed and vary between 0.72 and 1.25 m3. For variable and fixed configurations, the width will change from 0.6 to 0.9 m, and the height will be set at 2 m for the simulations. The ventilation area considered includes both the bottom and top vents of the cabinet. In some cases, the total ventilation area also accounts for doors open, doors closed, and holes in the cabinet’s ceiling [6,16] ranging from 0.05 to 0.25 m2. Based on the data in Figure 1a–c, the ventilation areas considered ranged from 0.04 to 0.16 m2. The combustible surface area was determined from the surface area of the cables and computer board located inside the cabinet during the experiments. The combustible surface area data were determined from 36 experiments, with the distribution shown in Figure 1d. The range in the total combustible surface area was taken as 0.6–1.8 m2, which represented 64% of the data.
Data from electrical cabinet fire experiments [6,11] were combined to obtain detailed combustible burning information. These experiments provided data on heat release rate per unit area (HRRPUA), burning duration, heat flux, and ignition time. A total of 56 unique experiments were recorded. A majority of the cone calorimeter tests were conducted at a heat flux of 50 kW/m2, whereas some were performed at 25, 35, 75, and 100 kW/m2. Using these data, parameter levels for HRRPUA and burning duration were established from the 50 kW/m2 experiments. Figure 1e,f display the distributions of burning duration and HRRPUA. For the 10th to 90th percentile range, HRRPUA levels ranged from 90 to 200 kW/m2, while burning duration ranged from 300 to 1800 s. Most cabinet fire experiments in the literature used an ignition source in the form of the initial HRR, ranging from 10 to 50 kW, which was used in this research.

2.1. Justification for Statistical Experiment Design (SED)

SED captures interactions between independent variables, which are often overlooked. It was selected over conventional single-factor testing for its efficiency, robustness, and capability of analyzing complex parameter interactions. By minimizing the number of required experiments while preserving statistical relisability, SED improves prediction accuracy and enables more precise modeling of nonlinear phenomena of fire behavior under diverse conditions. The SED approach was employed, facilitated by JMP Pro 17 software (JMP Statistical Discovery, a SAS company, Cary, NC, USA), to develop 51 unique configurations that incorporate eight varying parameters, as shown in Table 1. The peak HRR and the time-to-peak HRR vary based on eight electrical cabinet parameters, as analyzed across 51 different electrical cabinet configurations, and the results are shown in Section 3.1. A typical cabinet layout and design is illustrated in Figure 2, providing a reference for the general specifications considered in the study.

2.2. Cabinet Parameter Study

The cabinet parameter study used a comprehensive approach that allows for a systematic investigation of how these variables affect fire dynamics. The cabinet volume was modified by altering its width, using three distinct values: 0.6, 0.75, and 0.9 m. The overall height of the cabinet remained constant throughout the simulations. The ANOVA method utilized in this research offers a more effective way to determine the significance of parameters impacting on peak HRR. The peak HRR and time-to-peak HRR are affected in cabinets by varying parameters, such as cabinet width, surface area of combustibles (wall and ceiling), ignition source, HRRPUA, ignition source elevation, ventilation area, and combustible burning duration. A random forest ML model was used to analyze past electrical cabinet fire experiments relevant to nuclear power plants [17]. The developed model identified the most critical fire parameters and provided a computationally efficient framework to support probabilistic risk assessments. Unlike traditional methods that rely on Monte Carlo simulations [18], the predictive approach directly quantifies the influence of key parameters on HRR, leading to a reduction in uncertainty during fire risk evaluations. Compared to traditional methods [19], the ML approach better captured complex parameter interactions. Advancements in ML-based regression techniques [20] allow for a better way to address intricate nonlinear behaviors, including fire dynamics, by capturing complex relationships and enabling more accurate predictions.

2.3. Combustible Configuration Study

In the configuration study, we set constant parameter values. While our study may resemble a cabinet parameter study, only the location of combustibles and the ignition source are varied to assess their impact on peak HRR, as shown in Table 2.
Previous experimental studies have demonstrated that the configuration of combustible materials and the placement of the ignition source within the cabinet influence the HRR. However, past electrical cabinet fire experiments did not methodically examine the effects of combustible arrangement and the ignition-source location (bottom, corner, and top) on HRR [2,6]. The corresponding models are shown in Figure 3, Figure 4, Figure 5 and Figure 6, and the results of the combustible configuration study are summarized in Section 3.2. To address this, a series of twelve distinct electrical cabinet configurations were carried out by varying the position of combustibles, as outlined in Table 3. In fire experiments [6], one common combustible setup involves loosely bundled cables running along the side walls of the electrical cabinet, spanning the entire length of the cabinet and igniting at either one end or both ends, terminating inside a burner.
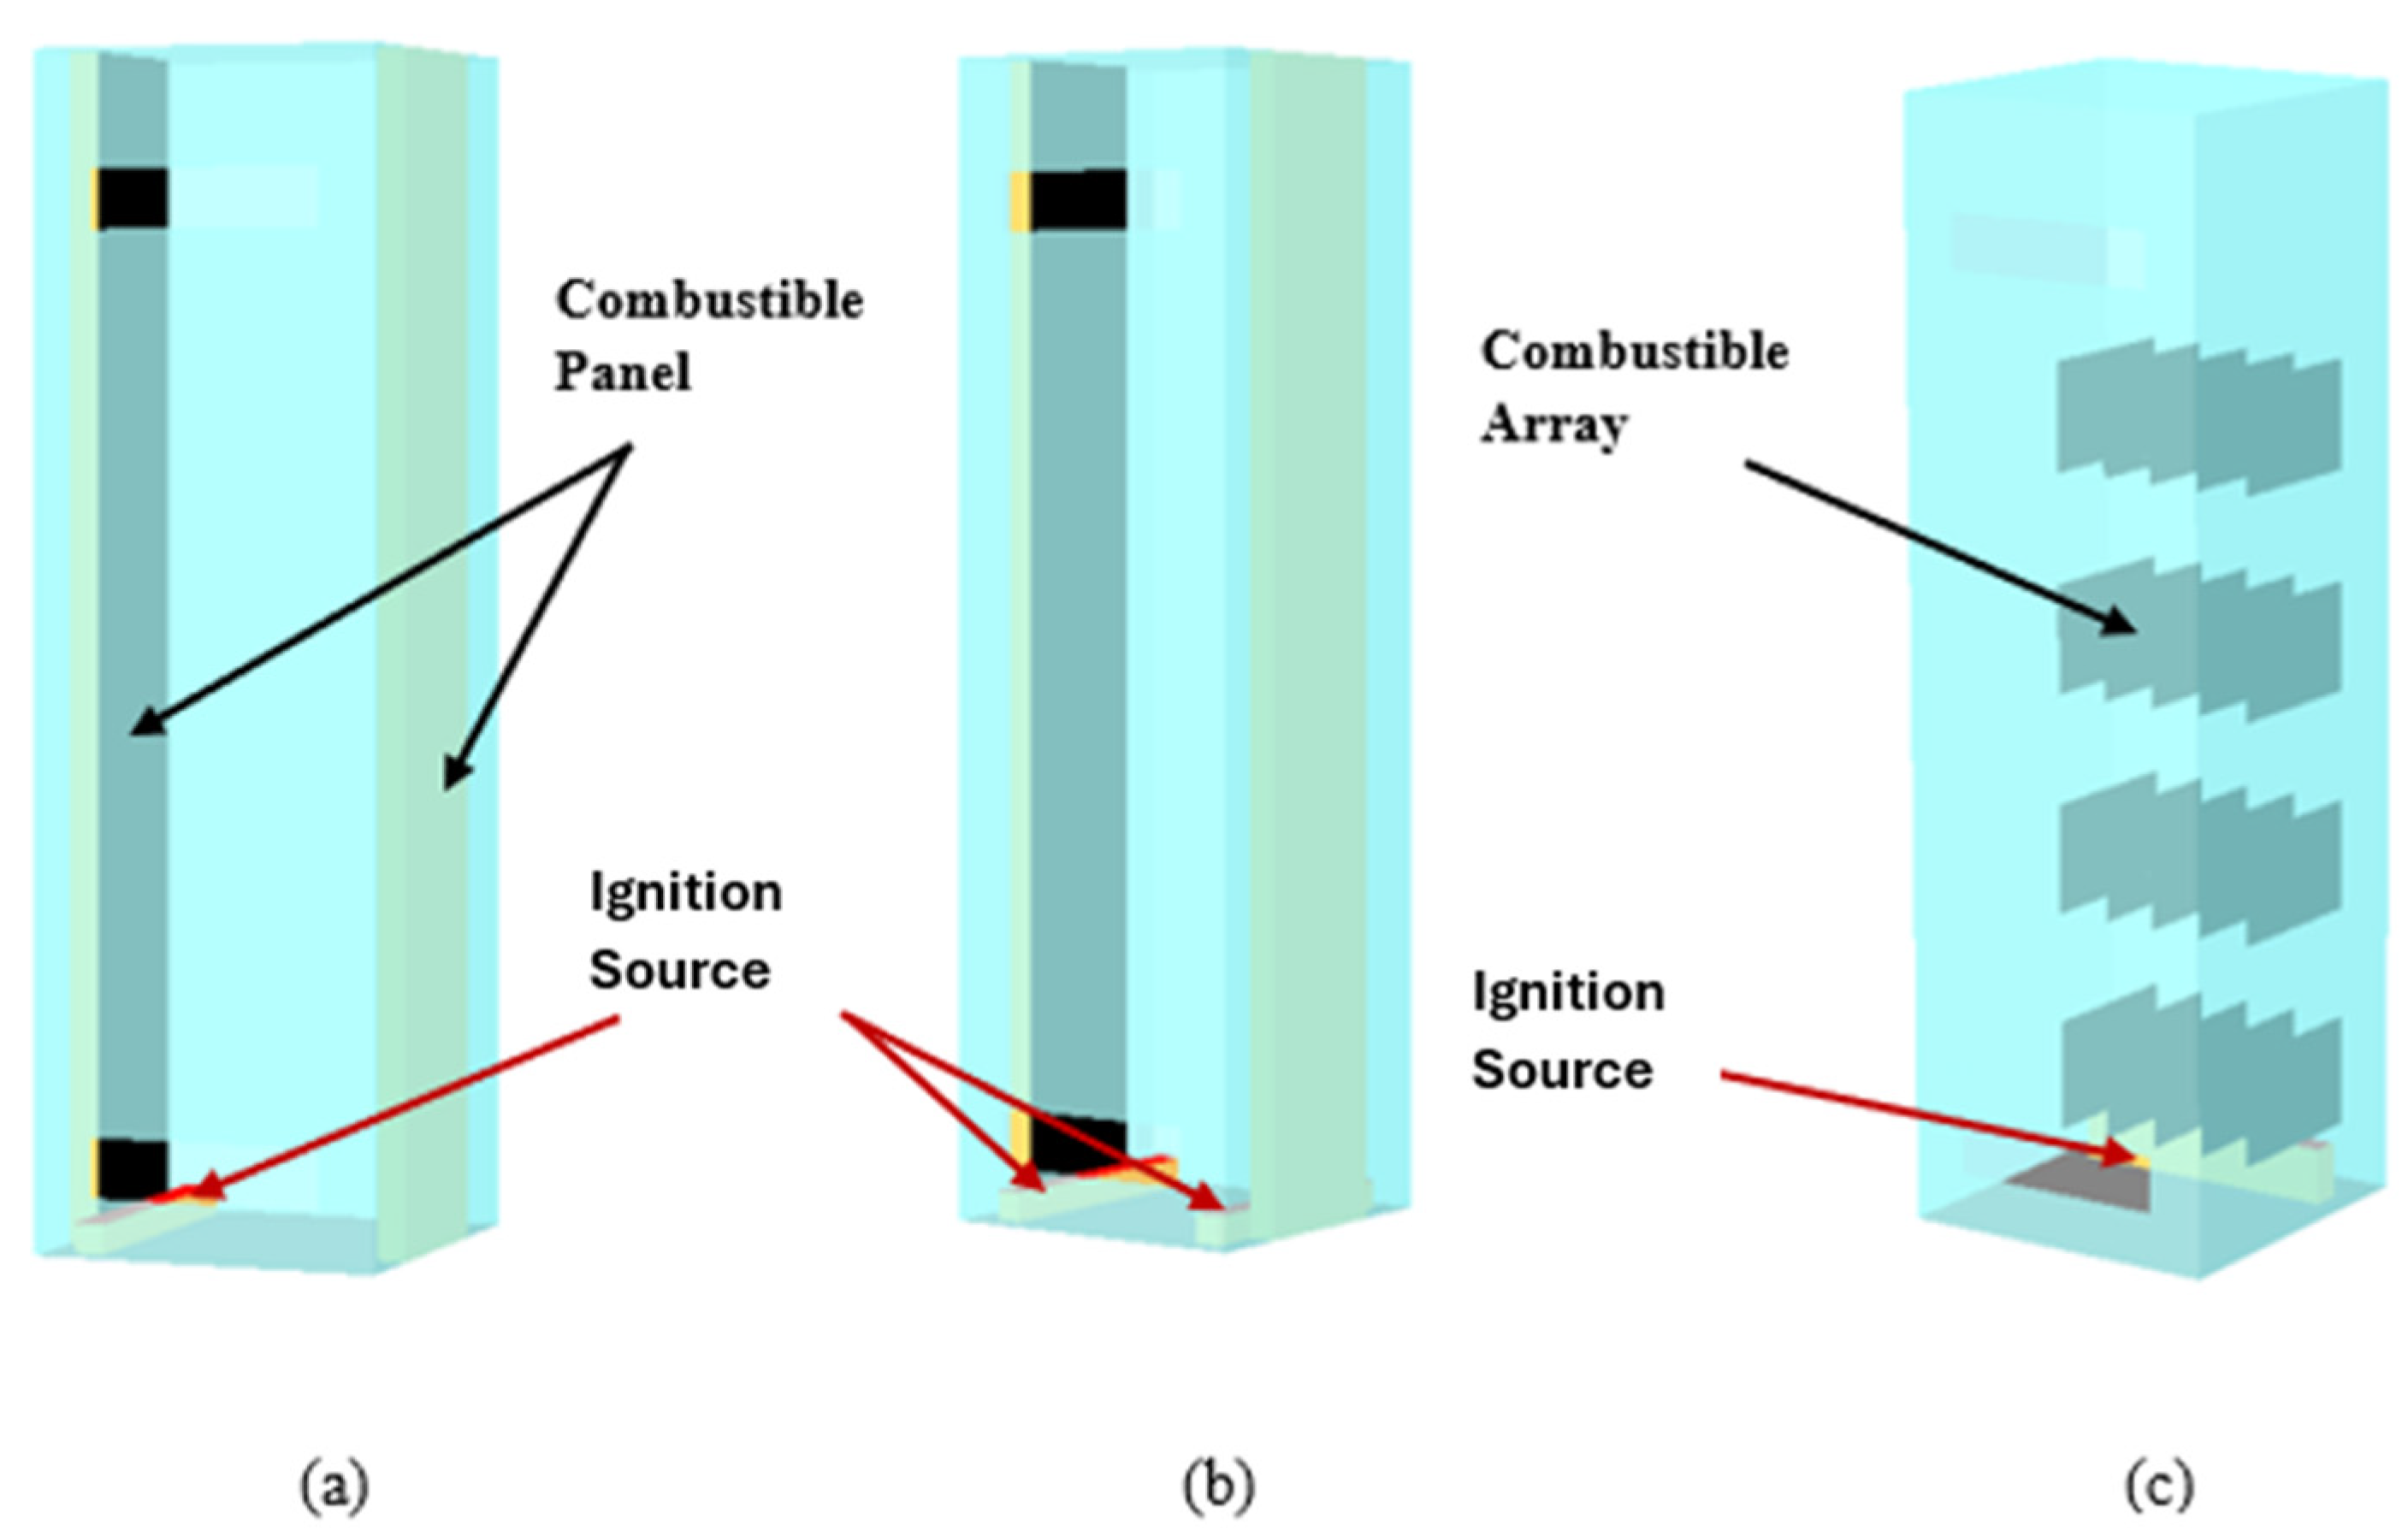
In Configuration 1 (Figure 3a), combustible panels are situated along the lateral walls, with the ignition source positioned at the bottom of the wall. In Configuration 2 (Figure 3b), the ignition source is positioned at the bottom of both combustible panels to ensure it directly impacts the panels from the lowest point, influencing the fire’s spread. Configuration 3 (Figure 3c) was designed to study an upward flame spread on the circuit boards. The circuit boards are mounted vertically on the back wall of the cabinet, and the ignition source is placed directly below them [11]. This setup exposes one side of the combustible to fire, providing insight into how flames and combustion products may interact with critical electrical components.
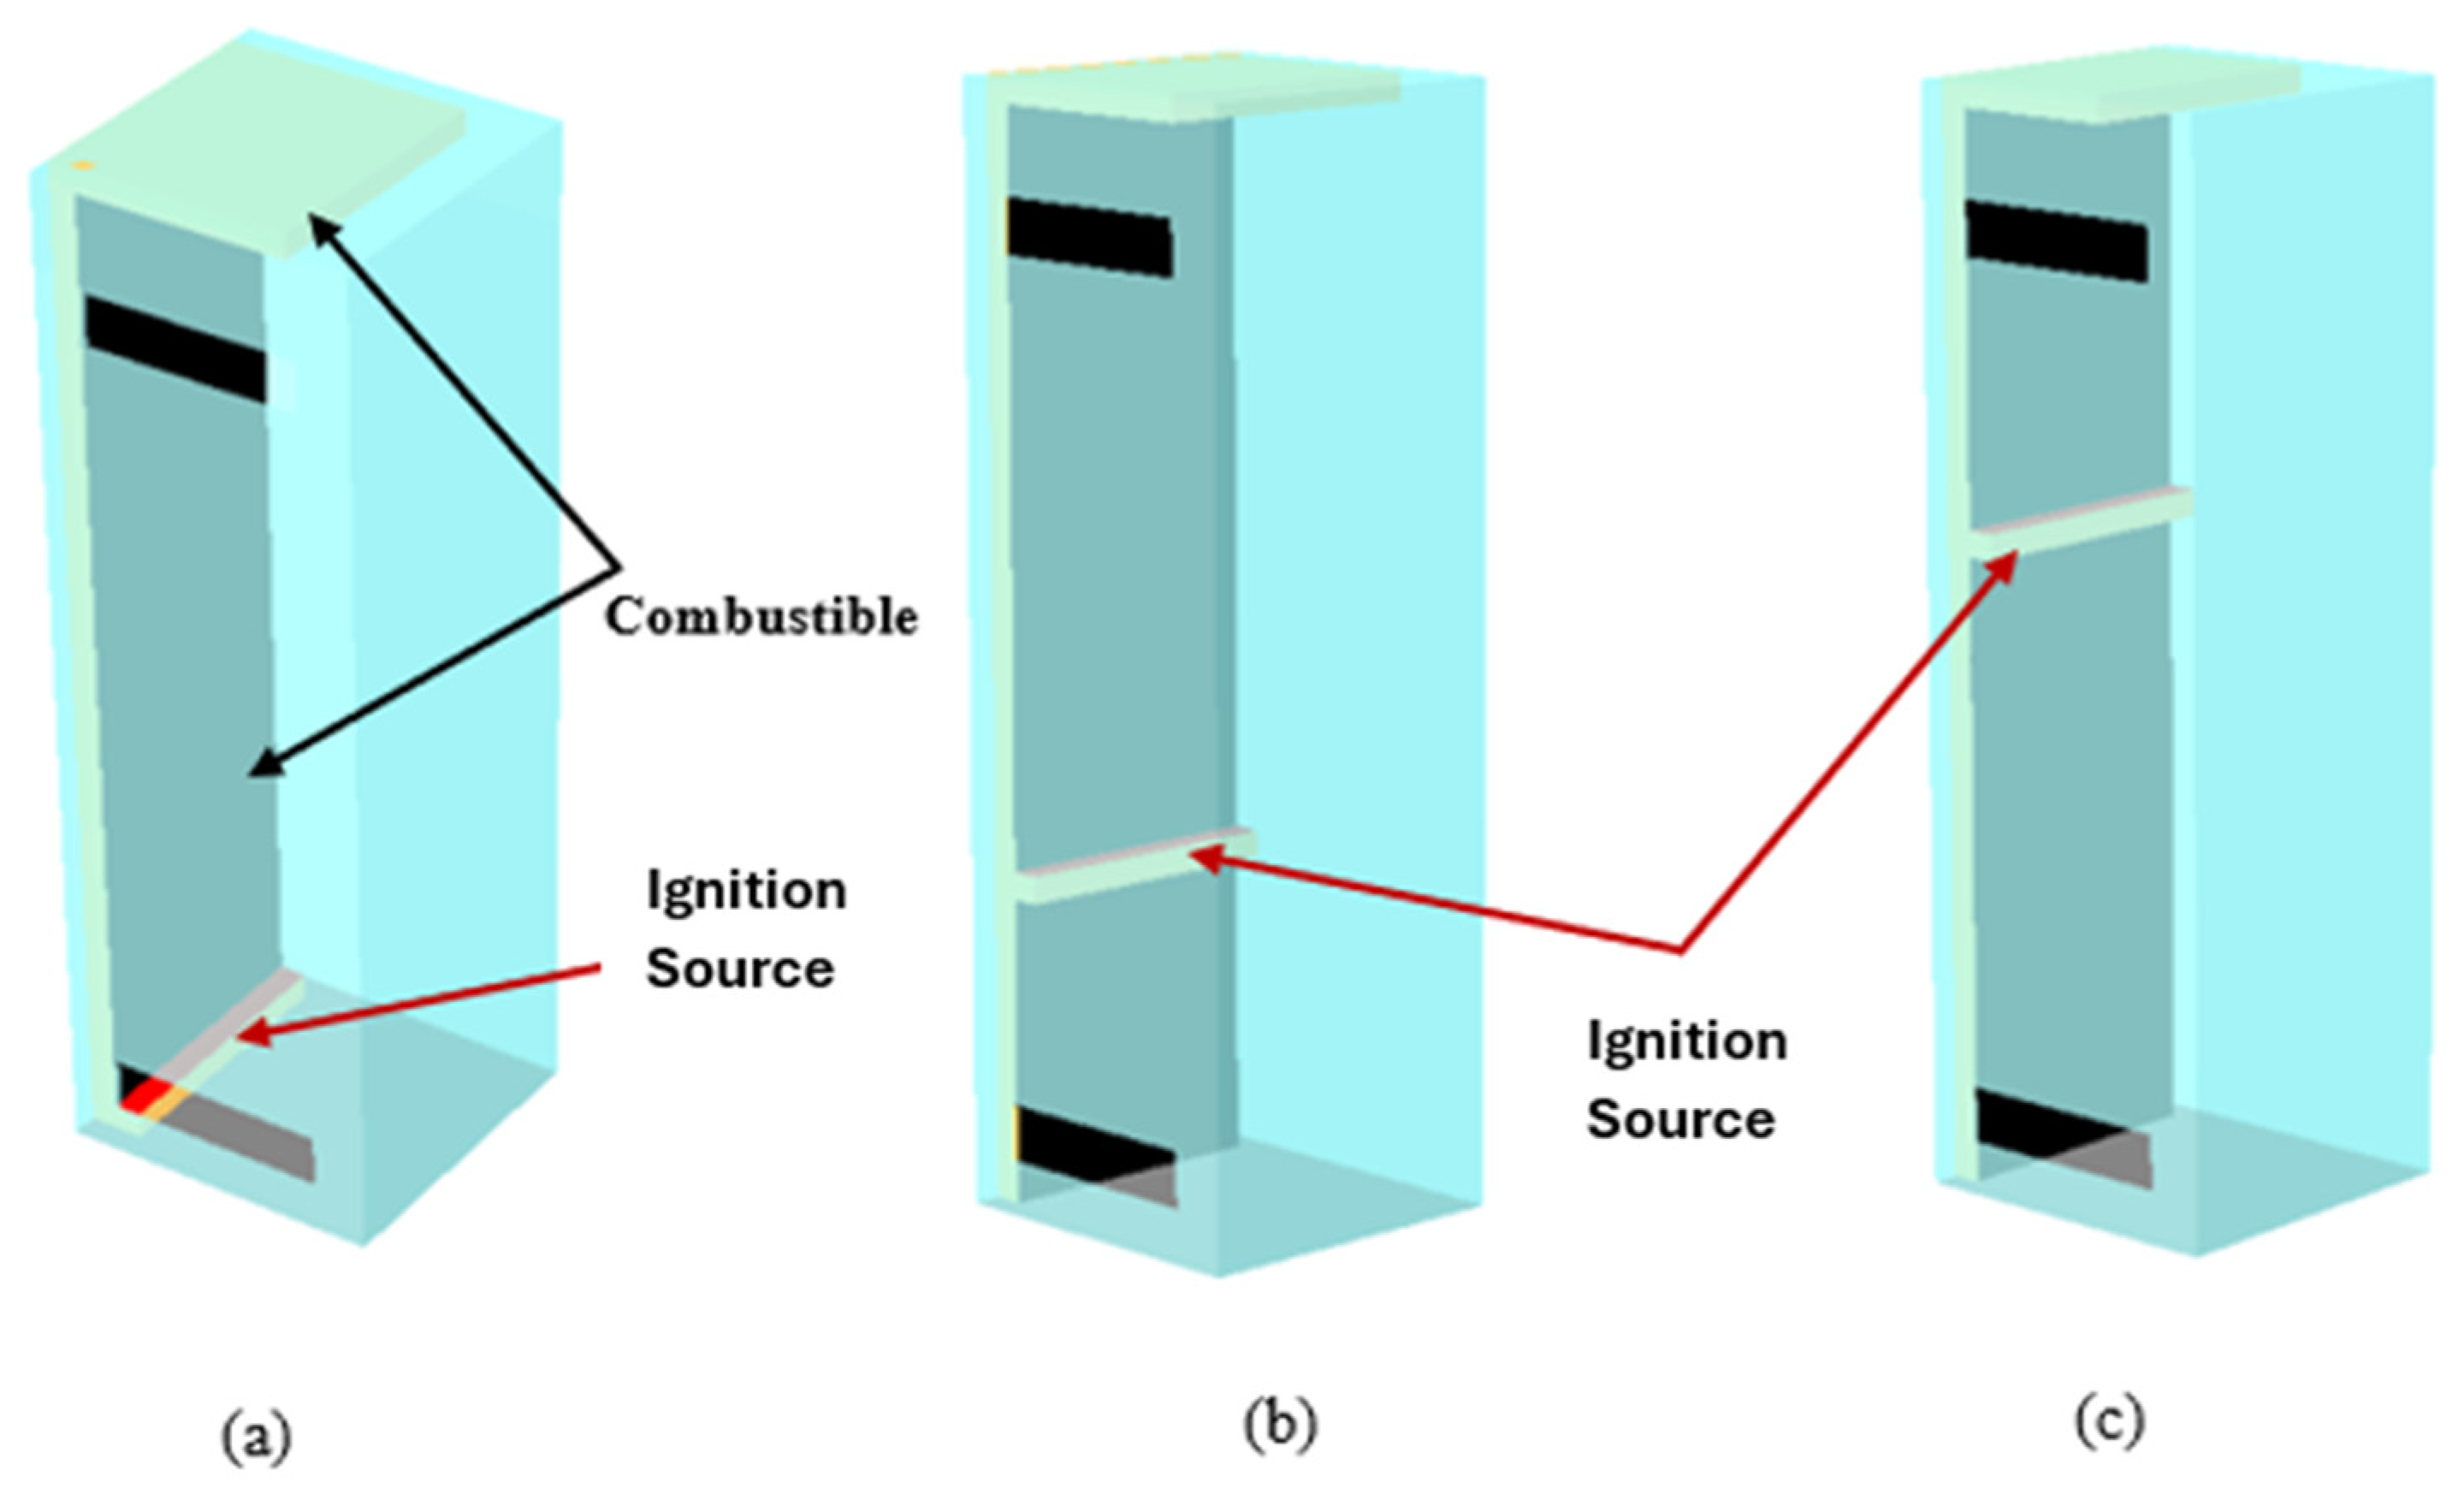
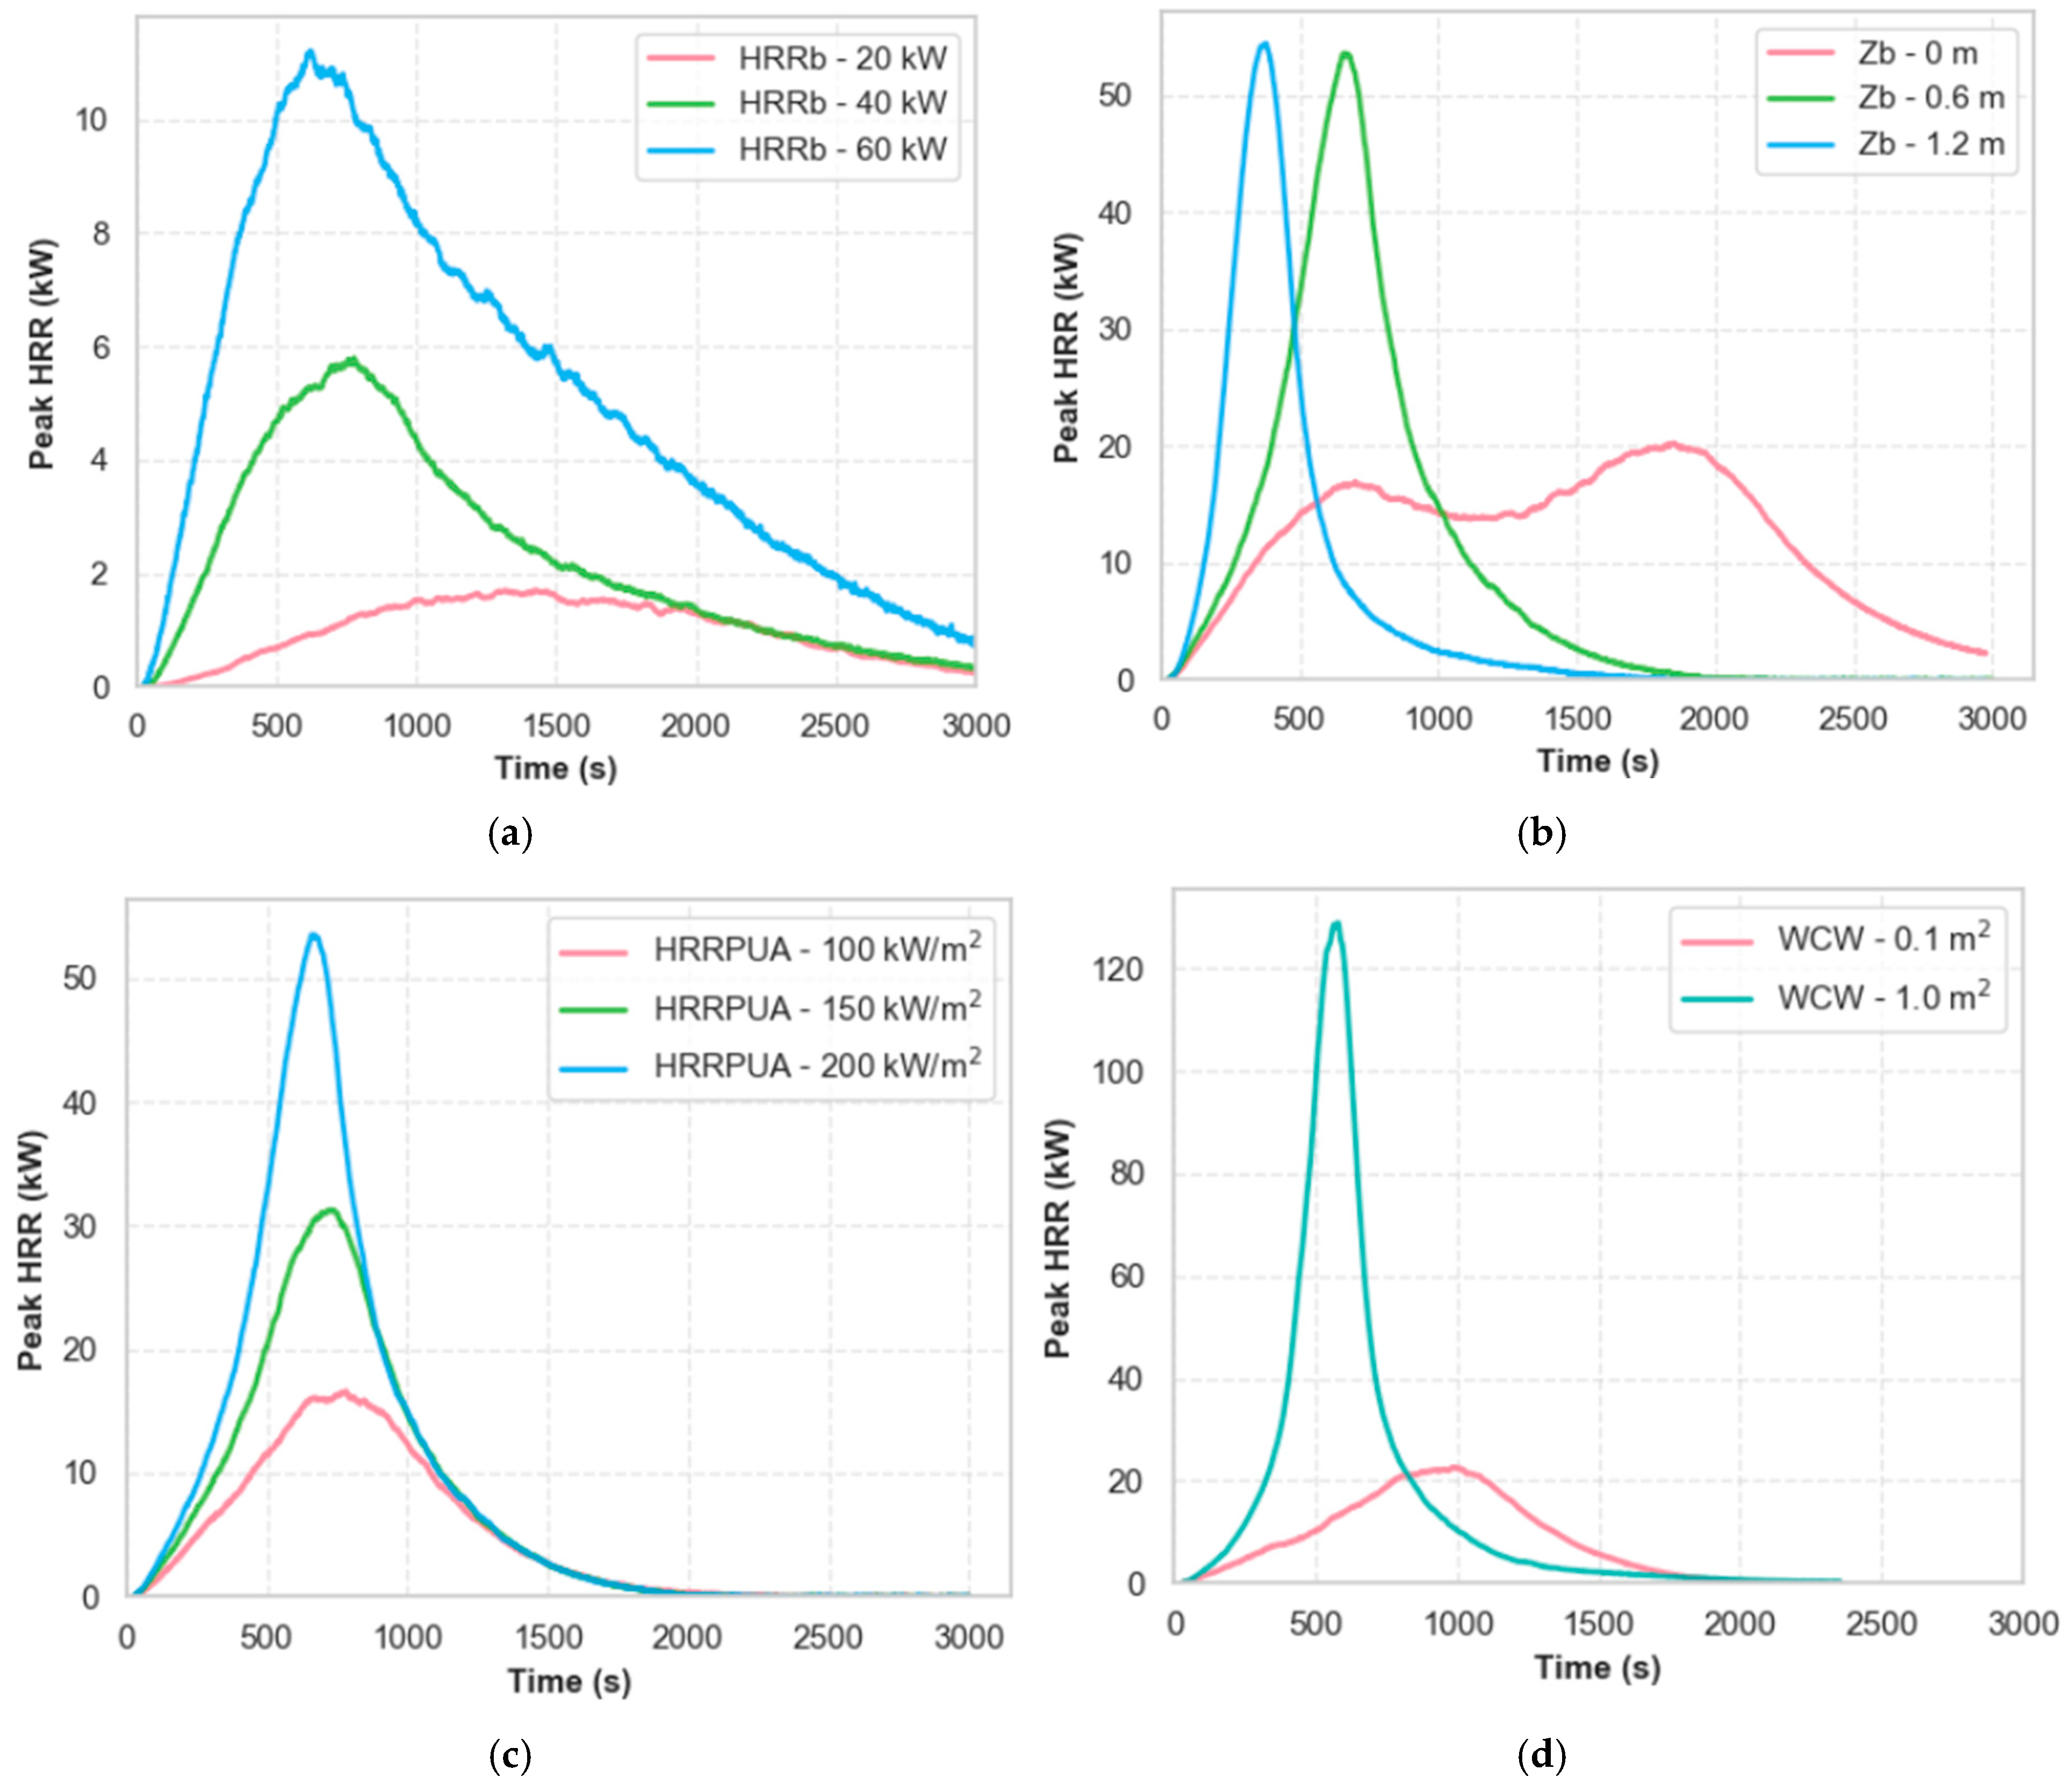
In Configuration 4 (Figure 4a), combustibles are positioned on the side wall and ceiling, along with the ignition source, which is placed at the bottom. In Configuration 5 (Figure 4b), the ignition source is at mid-height (0.6 m), and in Configuration 6 (Figure 4c), the ignition source is at the top (1.2 m) from the bottom. This setup is considered one of the conservative configurations. This variation in burner placement was intended to evaluate how the elevation of ignition source influences both the peak HRR and time-to-peak HRR, shedding light on the sensitivity of fire growth to ignition location within electrical cabinets.
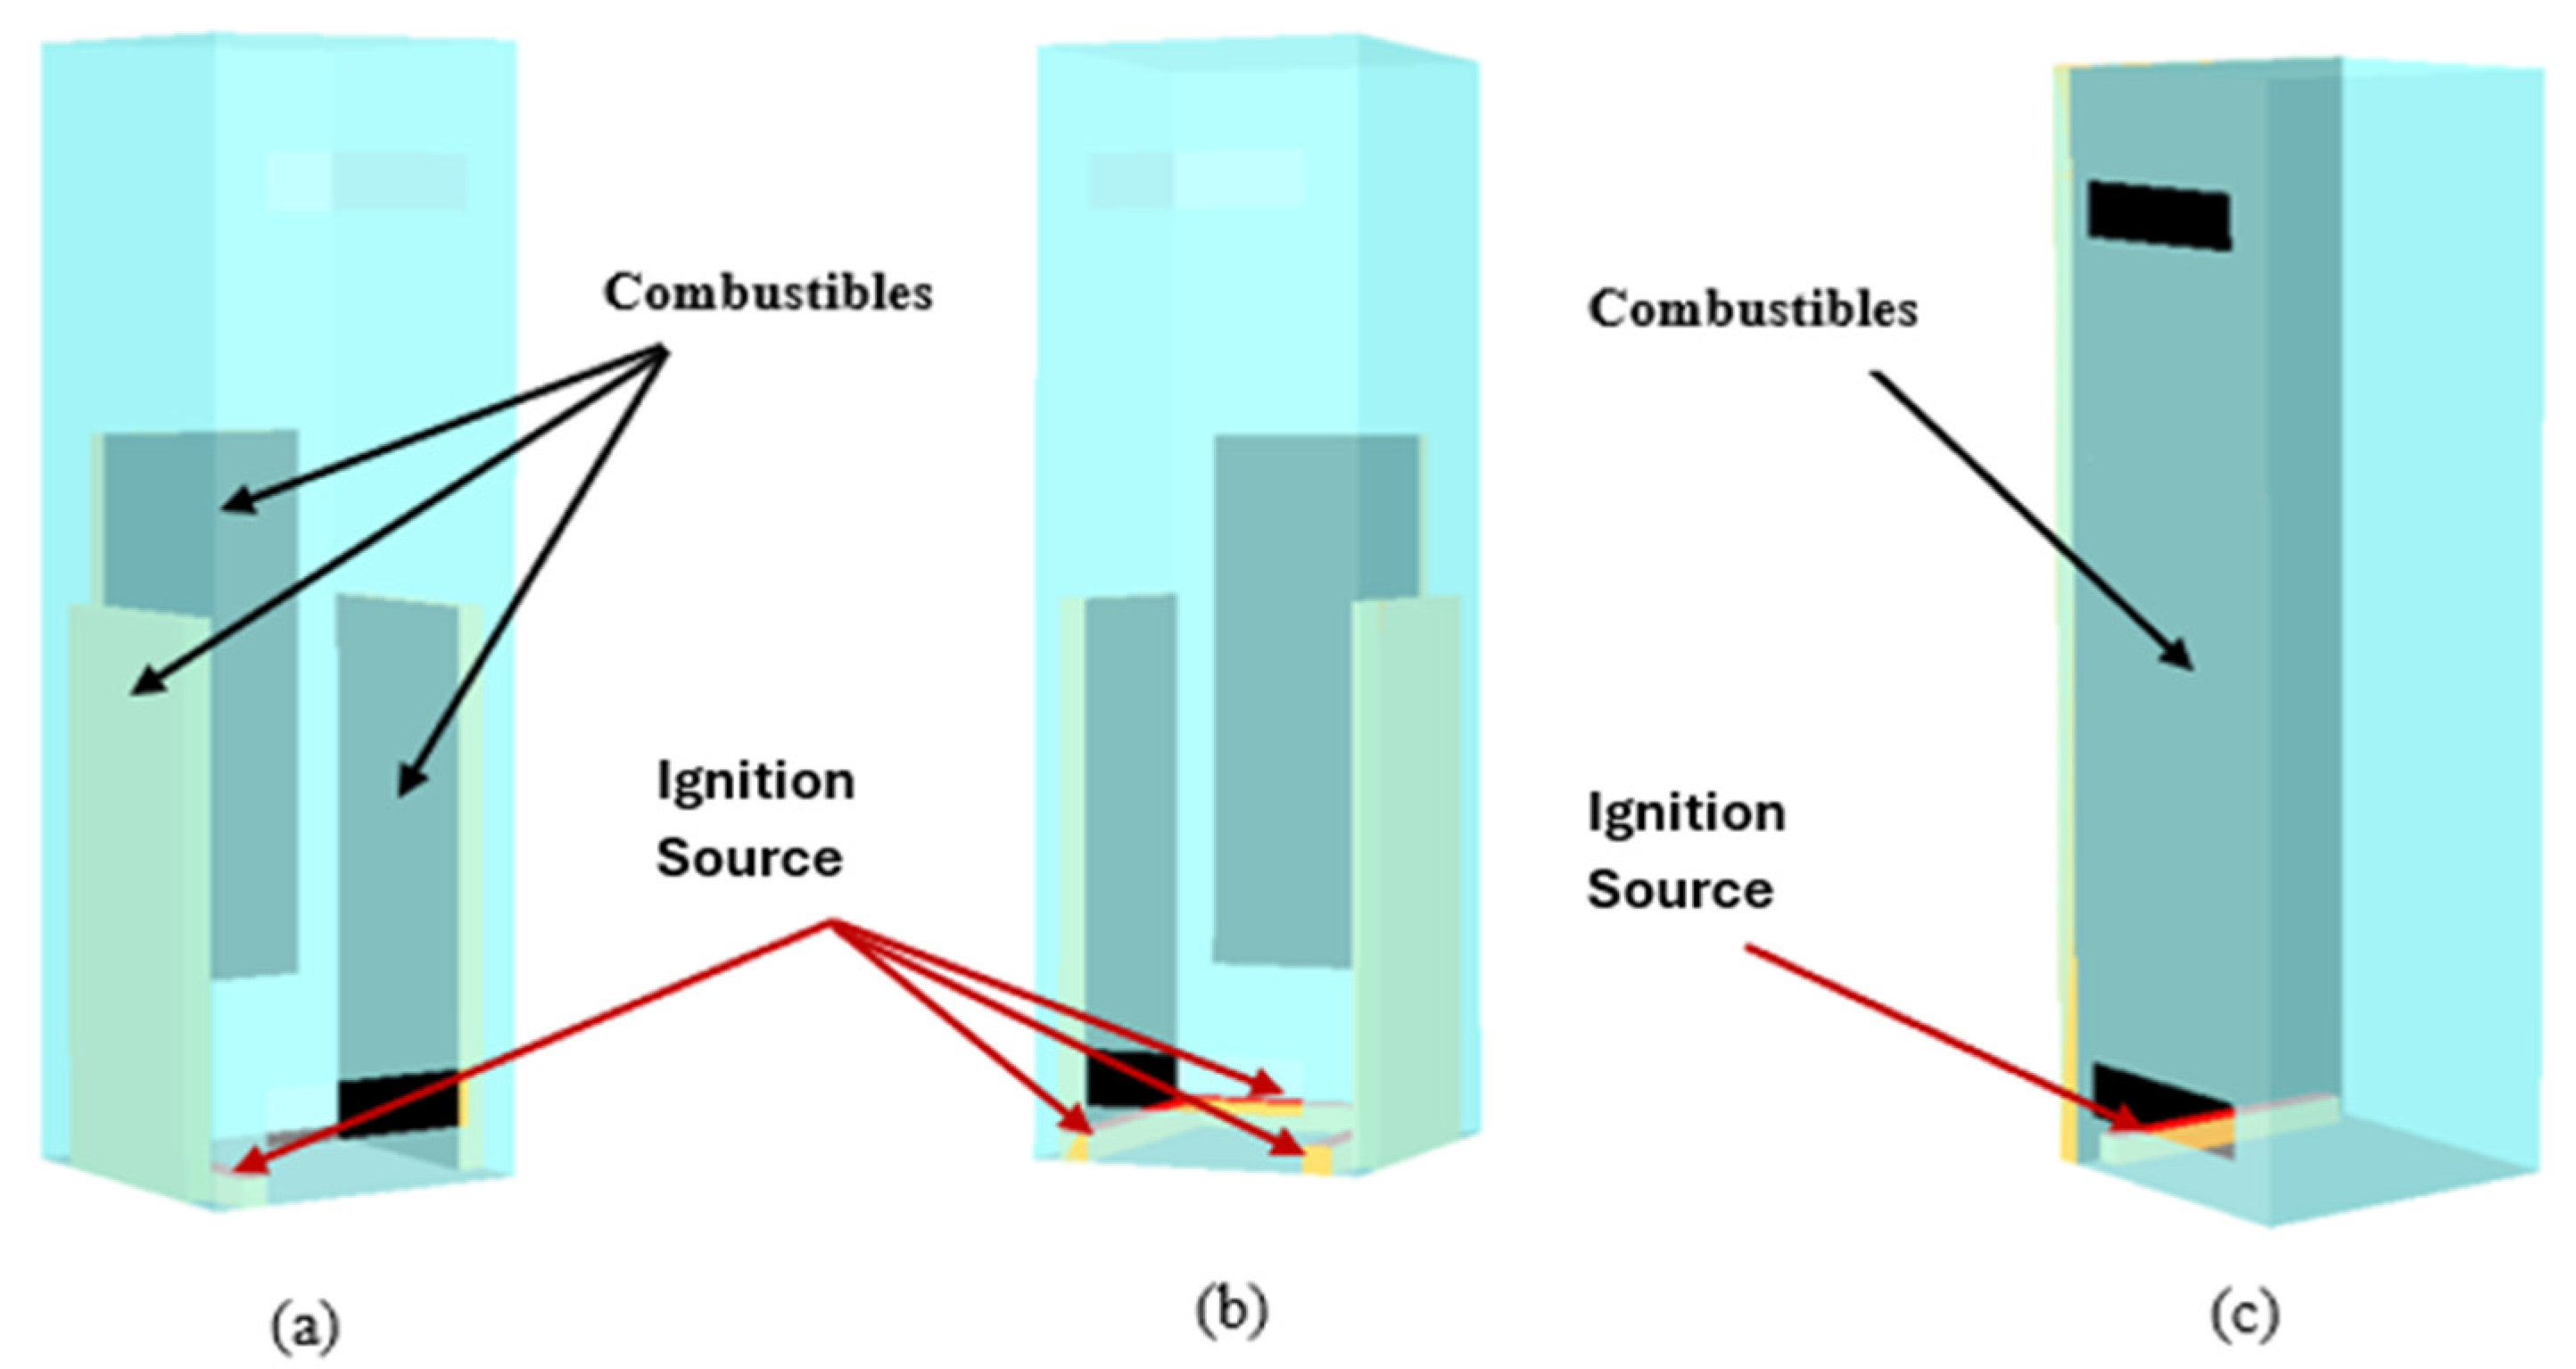
In Configuration 7 (Figure 5a), combustible panels are arranged along both lateral walls and the posterior wall, with a single ignition source placed at the bottom of the wall. In Configuration 8 (Figure 5b), combustibles with three ignition sources are located at the base of the walls. In Configuration 9 (Figure 5c), the combustibles are along one lateral wall, and the ignition source is at the base.
In Configuration 10 (Figure 6a), combustible materials are placed along the rear wall, with the ignition source placed at the base. The results indicate a significant increase in peak HRR for this configuration, highlighting the critical role of material arrangement in cabinet fires. In Configuration 11 (Figure 6b), combustibles are positioned parallel to the lateral wall. This arrangement allows air to circulate around the combustibles both vertically and horizontally, while also allowing the upward movement of air through the upper vent. Configuration 12 (Figure 6c) is a mirror image of Configuration 3, with combustibles on both sides.

2.4. Fire Dynamic Simulator (FDS)

FDS-6.9.1 was used to model fire-driven fluid flow, smoke, and heat transfer resulting from an electrical cabinet fire. It simulates key fire aspects, such as turbulent combustion and thermal radiation transport, through a set of governing equations that cover species mass concentration, mass conservation, momentum, energy, and the ideal gas law. To solve these equations, FDS uses Large Eddy Simulation (LES), applying a low-pass filter to the transport equations for mass, momentum, and energy to enable a detailed analysis of fire behavior within a defined area. Additional information on FDS is available in [9].

2.4.1. Physical Dimensions

The FDS parameters for the electrical cabinet consist of the volume and vent area (top and bottom), as well as the location of the combustible fuel (PVCWC), ignition source elevation (zb), and ignition source (HRRb). The combustible fuel characteristics include the surface area (wall and ceiling), HRRPUA, and burning duration (tc). This is described in detail in Section 2.4.2. Geometrical parameters are critical in defining the physical structure and layout of the electrical cabinet within an FDS. The electrical cabinet analyzed in this research is constructed from steel with a thickness of 0.0028 m. The steel has specified properties, including a thermal conductivity of 54.0 W/m·K, a specific heat capacity of 0.47 kJ/kg·K, and a density of 7833 kg/m3. The cabinet’s height (2 m) remained constant during simulations, and the front door featured ventilation openings at both the top and bottom sections.

2.4.2. Characteristics of Combustibles

Material ignition in FDS is predicted using the IGNITION TEMPERATURE and CONE_HEAT_FLUX features. The IGNITION TEMPERATURE feature determines material ignition when the surface temperature surpasses a user-defined ignition point for the material based on the input thermo-physical properties. The CONE_HEAT_FLUX feature is to predict the burning behavior of the material based on scaling laws and data from the cone calorimeter. The MATL_ID and SURF_ID features in FDS were used to incorporate the material thermo-physical properties (specific heat, thermal conductivity, density, and thickness). This function requires an HRRPUA curve with time using the RAMP_Q feature, as well as the exposure heat flux during the sample burning. The exposure heat flux during burning is the heat flux from the heater plus the flame heat flux and excluding the convective losses based on the average of the ignition temperature and steady-state temperature [9]. In this research, HRRPUA data were taken from tests at 40 kW/m2 and a flame heat flux of 25 kW/m2. After accounting for the convective loss term, a CONE_HEAT_FLUX of 65 kW/m2 entered FDS. With this input, the HRRPUA curve is scaled by FDS based on the exposure heat flux. For example, if the heat flux is higher than the CONE_HEAT_FLUX, the HRRPUA magnitude increases, but the burning duration decreases to conserve energy. The FDS inputs were derived from an analysis of experimental data on PVC [21], a widely used cable type in electrical cabinets at NPP facilities.
According to the ignition temperature data [22], the ignition temperature was established at 325 °C and was kept consistent across all simulations. In this research, the thermal properties (specific heat and thermal conductivity) were optimized in FDS to ensure that the predicted ignition times closely matched the experimentally measured ignition times for PVC [23,24] under heat flux exposures of 20, 40, and 70 kW/m2 in a cone calorimeter, staying within the experimental error range. The PVC was specified to have a thermal conductivity of 0.10 W/m·K, specific heat capacity of 1.5 kJ/kg·K, and density of 1605 kg/m3. To define the combustible material input burning rate during FDS simulations, the average HRRPUA of 100, 150, and 200 kW/m2 is stylized over a burning duration of 300, 600, and 900 s.

2.4.3. Convergence Study

To establish an optimal spatial resolution that balances computational efficiency with simulation accuracy, a convergence analysis was performed by dividing the FDS domain into three distinct grid sizes. The grid size for the FDS simulations was selected based on the characteristic fire diameter shown in Equation (1).
D = Q ˙ p c p T g 2 5
where D is the characteristic fire diameter, Q ˙ is the expected HRR of the fire, ρ is the air density, cp is the specific heat capacity of the air, and T is the ambient air temperature. The target mesh size is typically a D /dx of approximately 10, while also having several grid cells across the source fire to adequately predict the mixing and combustion across the flames. Figure 7 shows the convergence analysis, which was evaluated based on the HRR calculated from 10 percent to 90 percent of the total heat released, peak HRR versus time curve. The simulations were determined to adequately converge with a grid spacing of 0.05 m, which was selected for all the FDS simulations. This choice was made after observing the difference in peak HRR between grid spacings of 0.05 m, 0.025 m, and 0.01 m. Additionally, the computational time required for the 0.05 m grid was significantly less compared to the 0.025 m and 0.01 m grid, making the 0.05 m spacing the more efficient. The results of the grid convergence study are provided in Table 4.

3. Results

3.1. Cabinet Parameter Simulations

A structured series of simulations were conducted based on the SED framework to generate 51 unique configurations, as presented in Table 1. The peak HRR was calculated by subtracting the ignition source from the maximum predicted HRR from the electrical cabinet. The resulting peak HRR showed substantial variation across the different configurations, ranging from 1.5 kW to 83.3 kW. This variation is attributed to changes in the parameters listed in Table 1, with the corresponding results presented in Figure 8.
Additionally, the analysis indicated that parameters such as cabinet volume, ventilation area, HRRPUA, burning duration, surface area of combustibles, and ignition source and its elevation significantly influence both the peak HRR and the time to reach peak HRR. These factors collectively affect the fire growth dynamics by altering the availability of oxygen, heat feedback to adjacent surfaces, and the rate at which combustibles are consumed. For instance, larger cabinet volumes may delay heat buildup. Similarly, a higher HRRPUA and larger combustible surface area contribute to more intense burning, whereas the elevation of the ignition source can impact the direction of flame spread and thermal stratification within the cabinet. Understanding the interplay between these parameters is crucial for accurately predicting fire behavior and designing effective electrical cabinets.
The analysis result of 51 SED configurations, summarized in Table 5, highlights the key parameters that significantly influence the peak HRR. The statistical significance of the main effects and their two-way interactions was assessed by comparing its t-ratio to the critical threshold corresponding to a 95% confidence level. Table 5 presents the outcome of this statistical analysis, with a blue dashed line indicating the threshold for statistical significance. The analysis reveals that these parameters exceed the threshold, highlighting their critical role in influencing the overall outcome of the research.
Time-to-peak HRR provides valuable insights into fire dynamics, representing the duration it takes for the peak HRR to reach its maximum value during a fire event. Analyzing the time-to-peak HRR allows researchers to better predict fire behavior, optimize safety measures, and design materials with slower ignition and growth rates. The statistical results are presented in Table 6. The analysis revealed that, when examining the time-to-peak HRR, the ignition source and combustible burning duration were found to be statistically significant parameters. However, the analysis also indicated that there were no significant two-way interactions between these parameters, suggesting that their impact on the time-to-peak HRR operates independently. The time-to-peak HRR varied significantly across 51 configurations, ranging from 300 to 3426 s, as shown in Figure 9.

3.2. Combustible Configuration Simulations

The arrangement of combustibles and the elevation of the ignition source revealed significant variations in fire behavior, particularly in terms of peak HRR and time-to-peak HRR, highlighting the critical role that combustible positioning plays in electrical cabinet fires. These differences are driven by how flames spread pathways, the specific location of combustibles, and the ignition source and its elevation. For example, ignition sources located higher in the cabinet can lead to faster involvement of fire, resulting in a higher peak HRR and a shorter time-to-peak HRR. Configurations that result in low peak HRR values often do so due to incomplete combustion, limited flame spread, or poor involvement of the combustible materials with flame. This may occur when combustibles are not fully exposed to the ignition source or are positioned in a way that restricts airflow, leading to inefficient burning.
The highest peak HRR was observed in the configuration where two parallel combustible surfaces were placed along opposite walls. This arrangement likely intensified fire growth due to the narrow channel, which enhances vertical flame spread and radiative heat feedback between the facing surfaces. The combustible configuration study underscores the critical importance of how materials are arranged within electrical cabinets. These arrangements—such as positioning combustibles on side walls, ceilings, or in parallel arrays—significantly affect peak HRR by influencing flame spread. Notably, the role of combustible placement and its impact on peak HRR and flame spread are not addressed in [6], highlighting the importance of this study in advancing fire safety understanding. Proper placement is essential to ensure that combustibles are adequately controlled or shielded to prevent conditions leading to high peak HRR, thereby improving fire safety and reducing fire growth potential.
The configurations that are illustrated in Figure 3, Figure 4, Figure 5 and Figure 6, providing visual insight into how different combustible layouts and ignition source elevation influence fire development within the electrical cabinets, are shown in Table 7. The corresponding simulation results are presented in Figure 10.
Among the twelve configurations analyzed, four of them show the highest predicted peak HRR, as highlighted in Table 8, which provides detailed measurements, including gas temperature at the vent (1.8 m) and heat flux (at 2.0 m). These configurations exhibited distinct combinations of combustible arrangement and ignition source placement that contributed to intensified fire behavior compared to the others. Figure 11 illustrates the profiles for these configurations, allowing for a clearer comparison and analysis of how these factors significantly evolve over time.

4. Discussion

The statistical analysis highlighted the most influential parameters, revealing how individual parameters have the greatest impact on the peak HRR in electrical cabinets. The statistical analysis of the simulations in this research indicated that the ventilation area in electrical cabinets was found to be unimportant; however, the ventilation area was expected to be important based on the fire dynamics of enclosure fires. To determine the impact of the ventilation area, an additional analysis of experimental data [6] was carried out using partition screening, which identified specific conditions under which the ventilation area becomes significant. A comparison between experimental data and numerical simulations was also conducted to support this evaluation.

4.1. Impact of Individual Parameters

Understanding the parameters that influence the peak HRR is crucial for accurately modeling and mitigating fire hazards in electrical cabinets. The peak HRR of an electrical cabinet can be influenced by a single parameter, while keeping the other parameters at fixed values. The parameters deemed to have the most significant effect on peak HRR, as shown in Table 5, include (a) ignition source (HRRb), (b) ignition source elevation (zb), (c) HRRPUA, and (d) area of combustible wall (ACW). A notable effect on peak HRR is illustrated in Figure 12.

4.2. Ventilation Effects Based on Experimental Data

Partition screening analysis was conducted on the fire dataset [6] to examine the effects of ventilation area that influence peak HRR in electrical cabinet fire scenarios. Partition screening analysis was performed using JMP Pro 17 software, which relies on splitting criteria within the dataset to assess the significance of the ventilation area (VA). Results of this analysis are shown in Figure 13, plotted against combustible surface area (SA). In this plot, cabinet experiments with a lower surface area (<1.5 m2) did not have a wide variation in the peak heat release rate (1–50 kW), while experiments with a higher surface area had a large range (1–260 kW).
To further highlight the results shown in Figure 13, experiments performed in similar sized electronic cabinets were selected to explore the influence of the ventilation area on the peak heat release rate. A summary of the cabinet conditions for the select experiments is provided in Table 9, along with the corresponding peak heat release rates. As seen in this table, experiments with a combustible surface area < 1.5 m2 (Tests 32, 36, and 110) did not result in a large difference in peak heat release rates when the ventilation area was changed (1.5–5.4 kW increase). However, in experiments with a combustible surface area > 1.5 m2 (Test 82 and 111), the peak heat release rate increased significantly with an increase in ventilation area (62–219 kW increase). This is consistent with the results shown in Figure 13, where cabinets with higher combustible surface areas (>1.5 m2) had a large variation in the peak heat release rate, which was in part due to changing the ventilation area. The simulations performed as part of the SED had lower surface areas (<1.5 m2), resulting in a less significant impact of the ventilation area on the predicted peak heat release rates, a result which is consistent with experimental results in Figure 13 and Table 9. This analysis indicates that ventilation area is a statistically significant parameter in cases where there is a higher combustible surface area.

4.3. Experimental vs. Numerical Comparison

A comparison between experimental data [6] and numerical results, as shown in Table 10, predicted peak HRR for closed-door position with combustible surface areas below 1.2 m2. Ignition-source HRR and HRRPUA were excluded from the figure due to their high variability, which would require scaling adjustments and could reduce the clarity of the plot. Although the ventilation area (VA) shows considerable variation, the predicted HRR still aligns well with the numerical results, as shown in Figure 14. It also further supports the idea that VA significantly influences peak HRR, particularly when the combustible surface area exceeds 1.2 m2.

4.4. Limitations

The accuracy of numerical predictions depends heavily on the quality of data input against experimental results. While numerical analysis is a powerful tool, it cannot yet fully replace full-scale fire testing. Full-scale experiments remain essential for validating numerical models and capturing phenomena that are difficult to simulate accurately. However, numerical analysis can serve as a surrogate for preliminary assessments, especially in cases where experimental data are limited or unavailable. To improve the prediction of peak HRR under high fuel loading conditions, this study can be enhanced by applying machine learning (ML) methods demonstrated in [17,25], where ML techniques were used to support traditional compartment fire modeling.

5. Conclusions

The peak HRR in electrical cabinet fires was computed using FDS, which accounts for the enclosure’s geometry and aims to assess the significance of electrical cabinet parameters and the combustible configurations. Due to the varied nature of the combustible configurations, two separate analyses were performed: (a) cabinet parameters study and (b) configuration study. In the cabinet parameter study, 51 models were generated using a SED-based statistical framework to identify the significant parameters affecting the peak HRR. Through analysis of the simulation results, the most significant parameters were found to be the ignition source, ignition source elevation, combustible HRRPUA, and combustible surface area. The ventilation area was not found to be important in the simulations. The partition screening of the data revealed that the ventilation area will impact the peak HRR when the combustible surface area is larger than approximately 1.5 m2. In configuration study, a series of 12 simulations, each with a different combustible distribution inside the electrical cabinet, were conducted to explore the effects of how varying the combustibles influences the peak HRR. These findings are crucial for safety considerations, as they help determine which combustible configurations minimize peak HRR, thereby offering safer design strategies for electrical cabinets in nuclear facilities.

Author Contributions

Methodology, U.S. (Umang Selokar); Software, U.S. (Umang Selokar); Formal analysis, E.S. and M.A.A.; Resources, B.Y.L.; Data curation, U.S. (Urvin Salvi); Writing—original draft, U.S. (Umang Selokar); Writing—review & editing, B.Y.L. and J.P.D.; Supervision, B.Y.L. All authors have read and agreed to the published version of the manuscript.

Funding

This research was funded through the U.S. Department of Energy, Office of Nuclear Energy through Award No. DE-NE0008981.

Institutional Review Board Statement

Not applicable.

Informed Consent Statement

Not applicable.

Data Availability Statement

The raw data supporting the conclusions of this article will be made available by the authors on request.

Acknowledgments

This report was prepared as an account of work sponsored by an agency of the United States Government. Neither the United States Government nor any agency thereof, nor any of their employees, makes any warranty, expressed or implied, or assumes any legal liability or responsibility for the accuracy, completeness, or usefulness of any information, apparatus, product, or process disclosed, or represents that its use would not infringe on privately owned rights.

Conflicts of Interest

The authors declare no conflict of interest.

References

  1. Najafi, B.; Nowlen, S.P.; Joglar, F.; Funk, D.; Hannaman, G.; Anoba, R.; Kazarians, M.; Wyant, F.; Kolaczkowski, A.; Forester, J. EPRI/NRC-RES Fire PRA Methodology for Nuclear Power Facilities: Detailed Methodology; EPRI TR-1011989, NUREG/CR-6850; Electric Power Research Institute (EPRI): Palo Alto, CA, USA; U.S. Nuclear Regulatory Commission, Office of Nuclear Regulatory Research (RES): Rockville, MD, USA, 2005; Volume 2.
  2. Mangs, J.; Keski-Rahkonen, O. Full Scale Fire Experiments on Electronic Cabinets II; Technical Research Centre of Finland, VTT Publications 269: Espoo, Finland, 1996. [Google Scholar]
  3. Chavez, J.M. An Experimental Investigation of Internally Ignited Fires in Nuclear Power Plant Control Cabinets: Part 1: Cabinet Effects Tests; Sandia National Labs: Albuquerque, NM, USA; Nuclear Regulatory Commission: Washington, DC, USA, 1987. Available online: https://www.osti.gov/biblio/6330689 (accessed on 16 May 2025).
  4. Plumecocq, W.; Coutin, M.; Melis, S.; Rigollet, L. Characterization of Closed-Doors Electronic Cabinet Fires in Compartments. Fire Saf. J. 2011, 46, 243–253. [Google Scholar] [CrossRef]
  5. Avidor, E.; Joglar-Billoch, F.J.; Mowrer, F.W.; Modarres, M. Hazard Assessment of Fire in Cabinets. Nucl. Technol. 2003, 144, 337–357. [Google Scholar] [CrossRef]
  6. McGrattan, K.B.; Bareham, S.D. Heat Release Rates of Electronic Cabinet Fires (HELEN-FIRE); National Institute of Standards and Technology Engineering Laboratory, Fire Research Division Gaithersburg: Gaithersburg, MD, USA, 2016.
  7. Lindeman, A.; Salley, M.H. Refining and Characterizing Heat Release Rates from Electronic Cabinets During Fire (RACHELLE-FIRE): Peak Heat Release Rates and Effect of Obstructed Plume; NUREG-2178; United States Nuclear Regulatory Commission: Washington, DC, USA, 2016; Volume 1.
  8. Keski-Rahkonen, O.; Mangs, J. Electronic ignition sources in nuclear power plants: Statistical, modelling and experimental studies. Nucl. Eng. Des. 2002, 213, 209–221. [Google Scholar] [CrossRef]
  9. McGrattan, K.; Hostikka, S.; McDermott, R.; Floyd, J.; Weinschenk, C.; Overholt, K. Fire Dynamics Simulator User’s Guide; NIST Special Publication: Gaithersburg, MD, USA, 2013; Volume 1019, pp. 1–339. [Google Scholar]
  10. Mangs, J.; Paananen, J.; Keski-Rahkonen, O. Calorimetric fire experiments on electronic cabinets. Fire Saf. J. 2003, 38, 165–186. [Google Scholar] [CrossRef]
  11. McGrattan, K.B.; Lock, A.J.; Marsh, N.D.; Nyden, M.R.; Bareham, S.; Price, M. Cable Heat Release, Ignition, and Spread in Tray Installations During Fire (CHRISTIFIRE): Phase 1-Horizontal Trays; National Institute of Standards and Technology Building and Fire Research Laboratory Gaithersburg: Gaithersburg, MD, USA, 2012.
  12. Coutin, M.; Guillou, P. Phenomenological Description of Actual Electronic Cabinet Fires in a Free Atmosphere; Interflam, University of London, Royal Holloway College: Surrey, UK, 2007; pp. 3–7. [Google Scholar]
  13. Matala, A.; Hostikka, S. Pyrolysis Modelling of PVC Cable Materials; Fire Safety Science: La Rochelle, France, 2011; Volume 10, pp. 917–930. [Google Scholar]
  14. Rao, B.N.; Arunjothi, R. Assessing Smoke and Heat Release During Combustion of Electric Cables Using Cone Calorimeter. In Proceedings of the 9th International Conference on Insulated cables—JICABLE, Versailles, France, 21–25 June 2015. [Google Scholar]
  15. Rao, B.N.; Jothi, R.A.; Srinivasan, A.; Sudhindra, A. Heat Release Measurements on FRLS Cables Using Cone Calorimeter; Central Power Research Institute: Bangalore, India, 2007. [Google Scholar]
  16. McGrattan, K.; Leventon, I. Oxygen-Limited Fires Inside Under-Ventilated Cabinets (OLIVE-FIRE); National Institute of Standards and Technology: Gaithersburg, MD, USA, 2022. [CrossRef]
  17. Sahin, E.; Lattimer, B.Y.; Duarte, J.P. Development of HRR distribution Electrical Enclosure Fire Scenario Through Machine Learning. Fire Technol 2025, 1–22. [Google Scholar] [CrossRef]
  18. Sobol, I.M. On sensitivity estimation for nonlinear mathematical models. Mater. Model 1990, 2, 112–118. [Google Scholar]
  19. Hurley, M.J.; Gottuk, D.T.; Hall, J.R., Jr.; Harada, K.; Kuligowski, E.D.; Puchovsky, M.; Torero, J.L.; Watts, J.M., Jr.; Wieczorek, C.J. SFPE Handbook of Fire Protection Engineering; Springer: New York, NY, USA, 2015. [Google Scholar]
  20. Brandyberry, M.; Apostolakis, G. Response surface approximation of a fire risk analysis computer code. Reliab. Eng. Syst. Saf. 1990, 29, 153–184. [Google Scholar] [CrossRef]
  21. Drysdale, D. Steady Burning of Liquids and Solids. In An Introduction to Fire Dynamics, 3rd ed.; Wiley, University of Edinburgh: Edinburgh, Scotland, 2011; pp. 199–209. [Google Scholar]
  22. Nowlen, S. Cabinet Environment Characterization Testing for the Base Line Validation of Computer Fire Simulation Codes; NUREG/CR-4681 SAND86-1296; Sandia National Laboratories: Albuquerque, NM, USA; Sandia Corporation for the U.S. Department of Energy Prepared for Electrical Engineering Branch Office of Nuclear Regulatory Research U.S. Nuclear Regulatory Commission: Washington, DC, USA, 1987.
  23. Brebu, M.; Vasile, C.; Antonie, S.R.; Chiriac, M.; Precup, M.; Yang, J.; Roy, C. Study of the Natural Ageing of PVC in Salution for Electrical Cables. Polym. Degrad. Stab. 2000, 67, 209–221. [Google Scholar] [CrossRef]
  24. Keski-Rahkonen, O.; Mangs, J.; Turtola, A. Ignition of and Fire Spread on Cables and Electronic Components; Technical Research Centre of Finland: Espoo, Finland, 1999. [Google Scholar]
  25. Jin, Y.; Bajorek, S.M.; Cheung, F.B. Validation and Uncertainty Quantification of Transient Reflood Models Using COBRA-TF and Machine Learning Techniques Based on the NRC/PSU RBHT Benchmark. Nucl. Sci. Eng. 2003, 197, 967–986. [Google Scholar] [CrossRef]
Figure 1. Parameter distribution obtained from historically conducted experiments varied cabinet input values: (a) Height, (b) Width, (c) Depth, (d) Combustible Surface Area, (e) Burning Duration, and (f) HRRPUA.
Fire 08 00256 g001
Figure 2. Electrical cabinet with detailed dimensional specifications.
Fire 08 00256 g002
Figure 3. (a) Configuration 1: Ignition source at bottom. (b) Configuration 2: Two ignition sources at the bottom. (c) Configuration 3: Ignition source is below the combustible array. Colors represent different components: red—ignition source, black—combustible material (panels), cyan—electrical cabinet.
Fire 08 00256 g003
Figure 4. (a) Configuration 4: Ignition source located at bottom. (b) Configuration 5: Ignition source. located at mid-height. (c) Configuration 6: Ignition source located at the top of the side wall.
Fire 08 00256 g004
Figure 5. (a) Configuration 7: Ignition source placed at the bottom of both side walls. (b) Configuration 8: Three ignition sources placed at the bottom of both side and back walls. (c) Configuration 9: Ignition source placed at the bottom of both side walls.
Fire 08 00256 g005
Figure 6. (a) Configuration 10: Combustible arranged on the back wall. (b) Configuration 11: Combustibles arranged parallel along the side wall with single ignition source. (c) Configuration 12: Vertical array placed on the back wall with combustibles on both sides.
Fire 08 00256 g006
Figure 7. (a) Schematic representation of the computational mesh used in the cabinet fire simulation, illustrating the cabinet geometry and mesh structure. (b) Peak HRR values obtained from the mesh convergence study for different grid sizes. Colors in (a): Cyan represents the electrical cabinet, and wireframe indicates the computational mesh. Fine mesh is used inside, while coarse mesh is applied outside.
Fire 08 00256 g007
Figure 8. Range of peak HRR observed across 51 electrical cabinet configurations, categorized into low, medium, and high levels.
Fire 08 00256 g008
Figure 9. Range of time-to-peak HRR observed across 51 electrical cabinet configurations, categorized into slow, moderate, and fast response time.
Fire 08 00256 g009
Figure 10. (a) Low peak HRR and (b) High peak HRR, resulting from Table 7.
Fire 08 00256 g010
Figure 11. (a) Gas temperature and (b) Heat flux for configurations that show high peak HRR.
Fire 08 00256 g011
Figure 12. Impact on peak HRR due to most significant parameters: (a) HRR of ignition source, (b) Ignition source elevation, (c) HRRPUA of combustibles, and (d) Area of combustibles on the side wall and ceiling.
Fire 08 00256 g012
Figure 13. Peak heat release rate effects due to combustible surface area (SA) and ventilation area—(VA).
Fire 08 00256 g013
Figure 14. Peak heat release rate effects due to combustible surface area, cabinet volume, and ventilation area: comparison of (a) Test 32 and (b) Test 110.
Fire 08 00256 g014
Table 1. Range of parameters used in cabinet parameter study.
Parameters Symbol Parameter Levels
Least MedianMaximum
Volume (m3) V0.72 1.171.62
Ventilation area (m2) Av0.040.10.16
HRRPUA (kW/m2) HRRPUA100150 200
Combustible burning duration (s) tc300 600900
Combustible wall width (m)Wcw0.30.40.5
Combustible ceiling width (m) Wcc0.30.40.5
Ignition source (kW) HRRb204060
Ignition source elevation (m)zb0.00.61.2
Table 2. Parameters used in combustible configuration study.
Parameters Symbol Max
Volume (m3)V0.72
Ventilation area (m2)Av0.08
HRRPUA (kW/m2)HRRPUA150
Combustible burning duration (s)tc300
Combustible wall width (m)Wcw0.5
Combustible ceiling width (m)Wcc0.5
Ignition source (kW)HRRb40
Ignition source elevation (m)zb1.2
Table 3. Configurations with varying combustible positions.
ConfigurationsCombustible PositionIgnition Source Elevation
1Both side wallsBottom-1
2Both side wallsBottom-2
3Back wall arrayBottom-1
4Side wall and ceilingBottom-1
5Side wall and ceilingMid-1
6Side wall and ceilingTop-1
7Three wallsBottom-1
8Three wallsBottom-3
9Side wallBottom-1
10Back wallBottom-1
11Two parallelBottom-1
12Back wall array with both sides being combustibleBottom-1
Table 4. Grid cell size for the electrical cabinet simulations.
Grid Size (m)Peak HRR (kW)Time-to-Peak HRR (s)Spatial Resolution (D×/dx)Simulation Time (h)
0.0551.1390189
0.02545.33423722
0.0138.32956339
Table 5. Influence of key parameters and two-way interactions on peak HRR based on statistical analysis.
SourceLogworth p-Value
HRRb (20, 60)4.771Fire 08 00256 i0010.00002
Zb (0, 1.2)4.338Fire 08 00256 i0020.00005
HRRPUA (100, 200)3.882Fire 08 00256 i0030.00013
Wcw (0.3, 0.5)2.904Fire 08 00256 i0040.00125
HRRb × zb2.799Fire 08 00256 i0050.00159
Wcc × zb2.627Fire 08 00256 i0060.00236
Wcc (0.3, 0.5)2.302Fire 08 00256 i0070.00499
HRRPUA × zb2.280Fire 08 00256 i0080.00525
W × W1.948Fire 08 00256 i0090.01128
Tc (300, 900)1.870Fire 08 00256 i0100.01350
Wcw × HRRb1.740Fire 08 00256 i0110.01818
HRRPUA × HRRb1.732Fire 08 00256 i0120.01853
Hv × tc1.647Fire 08 00256 i0130.02255
W (0.6, 0.9)1.582Fire 08 00256 i0140.02620
Wcc × HRRb1.329Fire 08 00256 i0150.04689
HRRPUA × Wcc1.239Fire 08 00256 i0160.05762
zb × zb1.235Fire 08 00256 i0170.05819
Table 6. Influence of key parameters and two-way interactions on time-to-peak HRR based on statistical analysis.
SourceLogworth p-Value
HRRb (20, 60)3.357Fire 08 00256 i0180.00044
Tc (300, 900)2.940Fire 08 00256 i0190.00115
W × zb1.342Fire 08 00256 i0200.04548
Tc × HRRb1.127Fire 08 00256 i0210.07463
Hv × tc0.986Fire 08 00256 i0220.10330
Table 7. Impact on peak HRR due to combustible configuration and ignition source elevation.
ConfigurationsCombustible PositionIgnition Source ElevationPeak HRRTime to Peak HRR
1Both side wallsBottom-15.91578
2Both side wallsBottom-210.52406
3Back wall arrayBottom-14.11350
4Side wall and ceilingBottom-111.51558
5Side wall and ceilingMid-136.41910
6Side wall and ceilingTop-135.2952
7Three wallsBottom-17.61650
8Three wallsBottom-312.33110
9Side wallBottom-115.01110
10Back wallBottom-18.1690
11Two parallelBottom-147.61310
12Back-wall array with both sides combustibleBottom-113.2970
Table 8. Measured values for gas temperature and heat flux inside the cabinet.
ConfigurationsGas Temperature (°C)Heat Flux (W/m2)
3277.93.7
5612.628.9
6836.047.8
11615.816.7
Table 9. Electrical cabinet fire measure in actual experiments.
Test HELENIHRRHRRPUABDCVSAVAPeak HRRDoor Position
325.5143.6962.950.760.830.645.6Closed
5.5143.6962.950.760.831.7711Open
364145.91289.180.790.790.102.5Closed
4145.91289.180.790.791.084Open
821.6111.6771.50.792.330.101Closed
1.6111.6771.50.792.331.0863Open
1105.5111.6771.50.760.570.647Closed
5.5111.6771.50.760.571.7711Open
1115.5143.6962.90.761.770.6449Closed
5.5143.6962.90.761.771.77268Open
Table 10. Electrical cabinet fire data compared with numerical simulations.
ParameterExperimental Data
(Test 32)
Numerical SimulationExperimental Data
(Test 110)
Numerical Simulation
CV (m3)0.760.750.760.76
SA (m2)0.831.20.571.2
VA(m2)0.640.080.640.08
Peak HRR (kW)5.6677.8
Disclaimer/Publisher’s Note: The statements, opinions and data contained in all publications are solely those of the individual author(s) and contributor(s) and not of MDPI and/or the editor(s). MDPI and/or the editor(s) disclaim responsibility for any injury to people or property resulting from any ideas, methods, instructions or products referred to in the content.

