1. Introduction
There is a growing interest in the study of large, destructive wildfires, often termed “mega-fires”. Although rare, these events are responsible for the majority of burned areas and fire suppression costs and are characterized by spread rates far exceeding those of conventional wildfires, making them particularly challenging to control [
1]. In addition to their devastating impact on ecosystems and human infrastructure, these fires generate large amounts of pollutants—through the incomplete combustion of biomass—that can be carried by wind-blown fire plumes and blanket urban and rural areas in thick layers of smoke [
2]. This dispersion of smoke in these regions can create immediate hazards, such as poor visibility on roads or dangerous air quality levels for nearby communities [
3].
Studying the movement of smoke in the near-fire region—the area directly influenced by a fire’s heat and emissions—is thus of paramount importance. An increased understanding of the turbulent interactions between heat, smoke, and the local atmosphere in the near-fire zone—which directly influences the fire’s behaviour (intensity and spread)—is crucial for developing accurate fire–atmosphere coupled models, which can enhance the predictability of both fire behaviour and smoke dispersal. Current coupled atmospheric–fire models such as WFDS [
4] and WRF-Fire [
5] provide essential tools to simulate the interactions between fire, smoke, and the atmosphere, but these models rely heavily on accurate representations of smoke dynamics in the near-fire region [
6,
7]. A deeper understanding of these dynamics can improve emergency response strategies, which present pressing importance, particularly due to climate change, with rising temperatures and prolonged droughts that are expected to increase the occurrence of these mega-fires.
In fact, the erratic dynamics of these mega-fires can be related to turbulent mixing within the plume, in which the behaviour of several instantaneous coherent flow structures plays an important role [
8]. Even though several types of these structures have already been visually identified in large thermal plumes from wildland fires [
9,
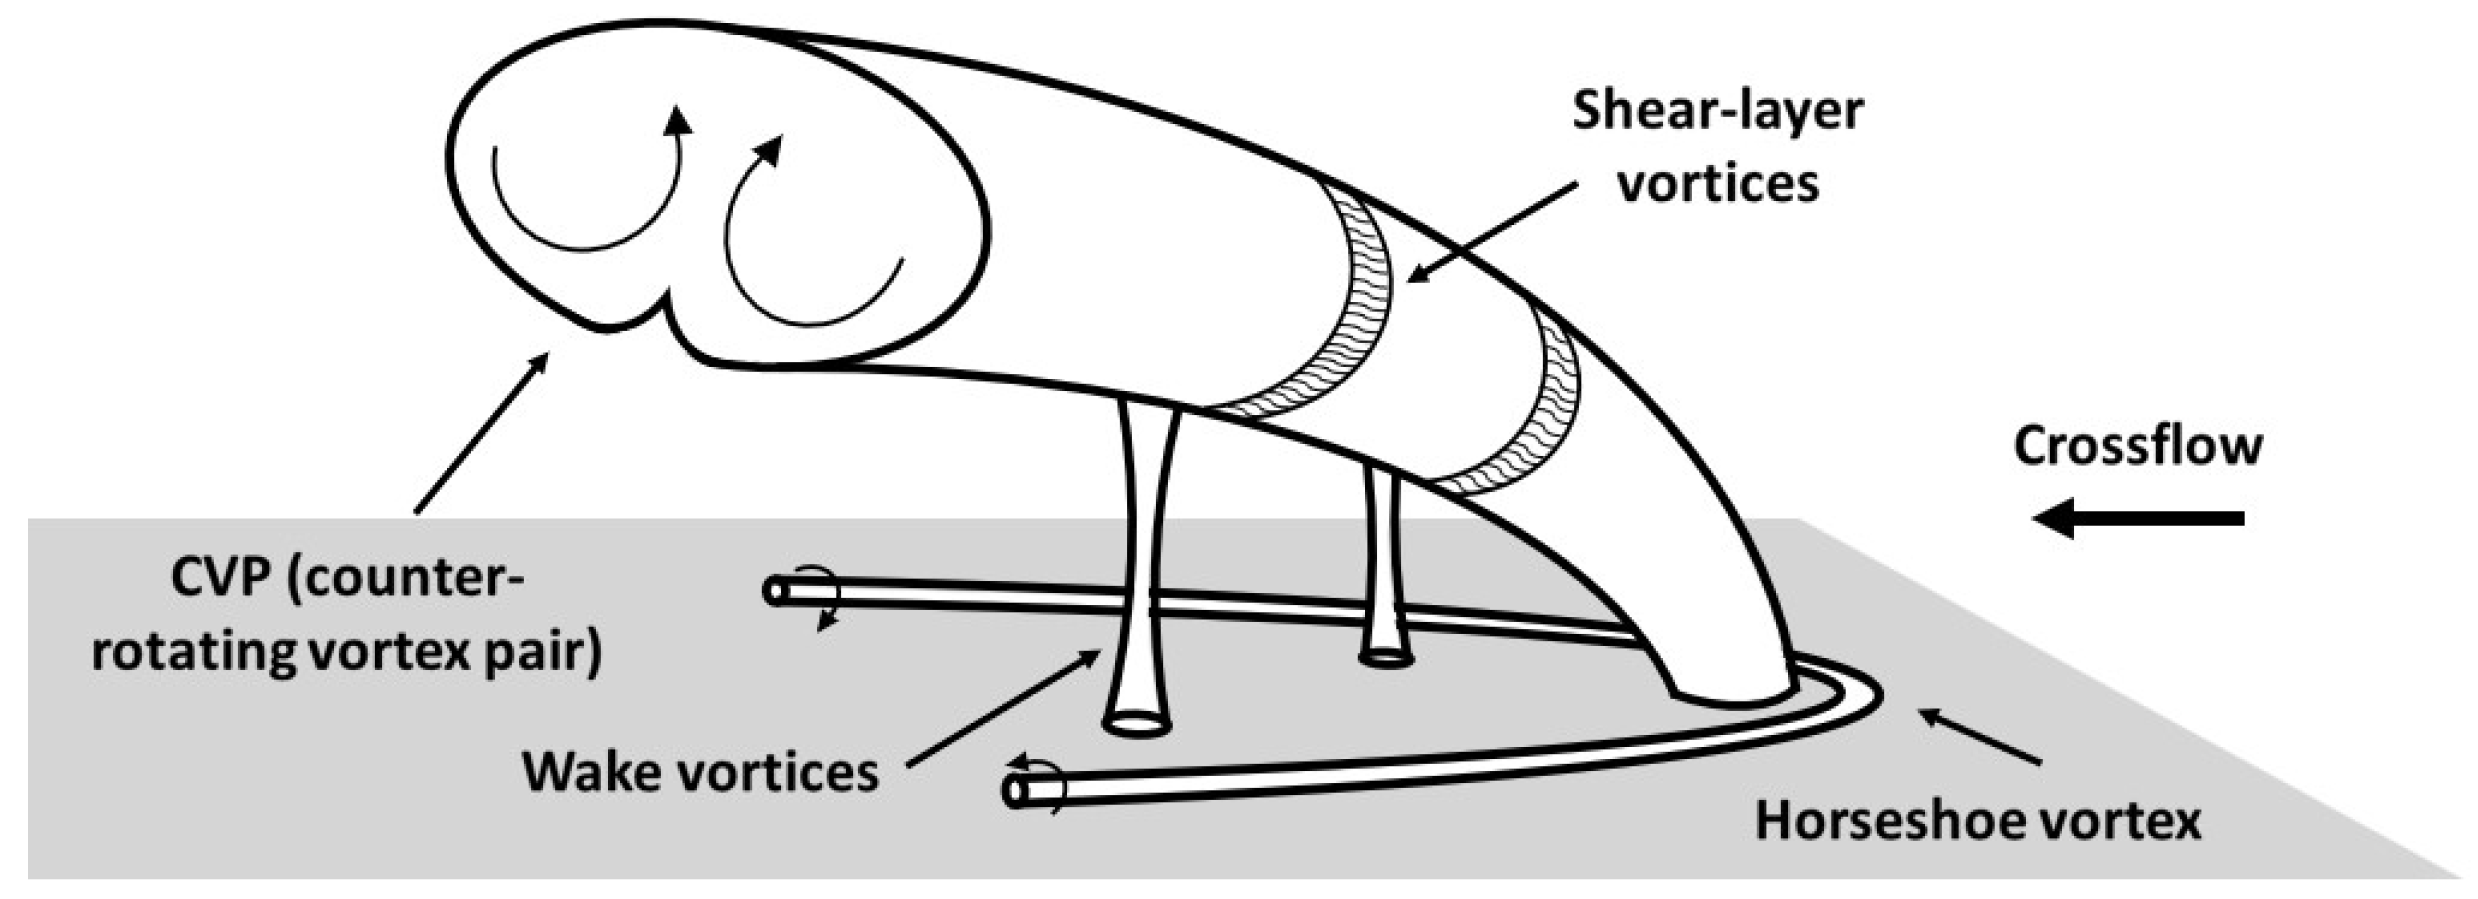
10], to fully understand their dynamics, it is important to consider the simplified geometries of these complex phenomena. Fire plumes in crosswind can theoretically be modelled by the fundamental setup of a flow injecting perpendicularly into a crossflow, which has been widely studied in the literature due to its large number of engineering applications. Some of the most important vortical structures that appear in this type of flow are schematically presented in
Figure 1 (see [
11]). Their behaviour and characteristics are strongly influenced by factors such as the nozzle cross-section, jet-to-crossflow velocity ratio, and Reynolds number [
12].
Briefly, the Kelvin–Helmholtz instabilities in the jet’s shear layer give rise to shear-layer vortices that propagate downstream, enhancing fluid mixing. As these vortices interact with the crossflow, by tilting and folding [
13,
14], they give rise to a counter-rotating vortex pair (CVP). This structure forms downstream of the jet exit, influenced by the ratio between the jet momentum and the crossflow, producing two counter-rotating streamwise vortices that extend far downstream from the jet. While the time-averaged CVP appears symmetric, its instantaneous behaviour is asymmetric and unsteady [
15]. Near the jet’s upstream side, a horseshoe-shaped vortex forms as a result of the crossflow boundary layer separating due to a local adverse pressure gradient. It wraps around the jet and persists downstream [
16,
17]. Furthermore, wake vortices, resembling upright tornado-like structures, are found downstream of the jet, linking its leeward side to the wall [
11]. However, these structures are still the most unknown and are particularly relevant for wildland fires since they can lead to ember transport, spotting, fire-induced winds, firebrand lofting, and, in an extreme case, fire whirls.
Fire whirls represent a distinctive and intense form of flame behaviour, characterized by a rapidly rotating vertical column of hot gases, smoke, and fire. Since fire whirls are characterized by intense heat, high rotational wind speeds, and the ability to spread fire over long distances through spotting, they can be particularly destructive [
18,
19]. Fire whirls are generally categorized into on-source and off-source types. In on-source fire whirls, the rotating vortex forms directly over the fuel source and remains anchored to the fire itself. Several formation mechanisms have been identified, including fire whirls generated by vorticity formation from an L-shaped heat source [
20], inducing rotational flow and subsequent updraft by intense heat, as well as by the lower section of the plume’s CVP [
21]. In contrast, off-source fire whirls occur downstream of the primary fire. These fire whirls are periodically shed downwind from the burning area, but their formation mechanisms remain less well understood, making them an area of ongoing research. This type of fire whirl is directly related to the vertical vortices verified in fire plumes subject to crosswind and is potentially more destructive as it is more prone to spread fire to new areas.
Due to this, understanding the mechanisms of formation of these vertical structures is vital to develop effective fire safety measures and perform precise risk assessments. Four distinct mechanisms responsible for the formation of vertical vortices downstream of a flame in a crossflow were experimentally identified by Shinohara and Matsushima [
22]. One of the mechanisms is similar to the wake vortex formation suggested by Fric and Roshko [
11] where, unlike the vortex shedding observed behind bluff bodies, these wake vortices arise from the separation of the crossflow boundary layer along the sides of the jet induced by the adverse pressure gradient. Another mechanism involves air entrainment into the flame, where the reverse flow interacts with the crossflow passing along the sides of the flame, leading to the formation of vertical vortices. Additionally, these vortices may also develop from the interaction between the crossflow and the V-shaped flame rim or from interactions with the wall vortex pair. However, these different mechanisms have not been numerically identified, as far as the authors are aware, and there is not a clear understanding of what conditions are necessary for each one of these mechanisms to occur. In fact, as pointed out by Ghodrat et al. in their review paper [
23], numerical simulation methods have the potential to provide a better understanding of the fundamental mechanisms of fire whirl initiation and stability by considering a large range of temporal and spatial scales of turbulence; however, currently, the literature is scarce in this area.
As can be concluded from the presented literature, one feature that is of extreme importance in this process of the formation of upright vortices is air entrainment. Two very relevant parameters when studying air entrainment are the intensity and vertical distribution of the crosswind as well as the terrain slope. Indeed, wind and topographic slope are widely recognized as key drivers of fire behaviour and continue to be active areas of research [
24]. Ambient winds in the atmosphere generate a turbulent boundary layer around the Earth’s surface, with rising average wind velocities as height increases and with considerable velocity fluctuations. The structure of the boundary layer, as well as the inherent turbulent oscillations, is strongly dependent on the landscape [
25]. The presence of these turbulent fluctuations in the atmospheric boundary layer (ABL) affects fire spread rates and fire behaviour by altering the entrainment rates and the amount of oxygen available for combustion. In fact, this wildland fire–atmosphere interaction produces complex turbulence patterns with multiple scales, which influence not only the fire spread behaviour but also the firebrand transport and smoke dispersion [
26,
27]. All of these variations across different ABLs highlight the importance of considering different vertical distributions of the incoming crosswind when studying the formation process of complex turbulent structures such as upright vortices. In fact, as pointed out by Shinohara [
28] there is a need to investigate the effects of the boundary layer thickness, i.e., the vertical distribution of the incoming crosswind, on the properties of fire whirls without flames.
On the other side, understanding fire plume behaviour when subject to different slopes as well as the structures that can emerge as a function of the different entrainment patterns is significantly relevant to better investigate complex phenomena such as fire-channelling, an efficient mechanism for spreading a fire across a landscape with an intense fire behaviour [
29]. In fact, terrain slope has already been found to significantly impact wildland fire behaviour, primarily by influencing the rate of fire spread and the fire’s intensity. When a fire occurs on an incline, it tends to spread faster uphill compared to downhill. This phenomenon is attributed to the preheating of fuels above the flame, which occurs as the heat and flames rise. The steeper the slope, the more pronounced this effect becomes, leading to a quicker rate of fire progression [
30,
31]. In addition, topographic features can affect local wind patterns, which can play a role in the formation of vortical structures and further intensify fire behaviour. In fact, recent research highlights the influence of slope on the frequency and height of fire whirls [
32].
Large Eddy Simulation (LES) is a powerful tool for resolving these turbulent fire plume dynamics, and numerous studies have examined the influence of crosswinds on plume trajectories and dispersion (e.g., [
33,
34]). Particular emphasis has been placed on the role of vertical wind structure, drawing on the work of Ong et al. [
33] to illustrate how atmospheric boundary-layer and canopy flows shape plume behaviour. The effects of slope are also detailed in the literature [
35,
36], highlighting the link between increased fire intensity, reduced plume lift-off, and their practical implications for fire management. Comparatively, one of the main gaps in research is understanding the formation of vortical structures in the near-fire region. Thus, this study specifically focuses on the near-fire region of fire plumes generated by massive fires subjected to crosswinds. Its two primary objectives are as follows: first, to examine how varying wind profiles and terrain characteristics influence the formation of coherent vortical structures, particularly moving vertical wake vortices; second, to investigate how these parameters impact smoke distribution in the near-fire region. To this end, this study numerically examines the structure of various fire plumes subjected to different wind intensities and vertical distributions as well as terrain slopes.
The paper is organized as follows:
Section 2 presents the physical model and the mathematical and numerical models for fluid flow and combustion, as well as their validation. Following, the results are presented in
Section 3, with the influence of the crosswind vertical distribution being investigated in
Section 3.1 and the influence of the slope of the terrain in
Section 3.2. The key findings of this study are presented in
Section 4.
3. Results and Discussion
The results are divided into two main subsections. Firstly, the impact of the vertical distribution of the crosswind on the fire plume structure and on the development of vertical structures is investigated, and subsequently, the impact of the terrain slope is assessed for the same parameters.
3.1. Influence of Crosswind Vertical Distribution
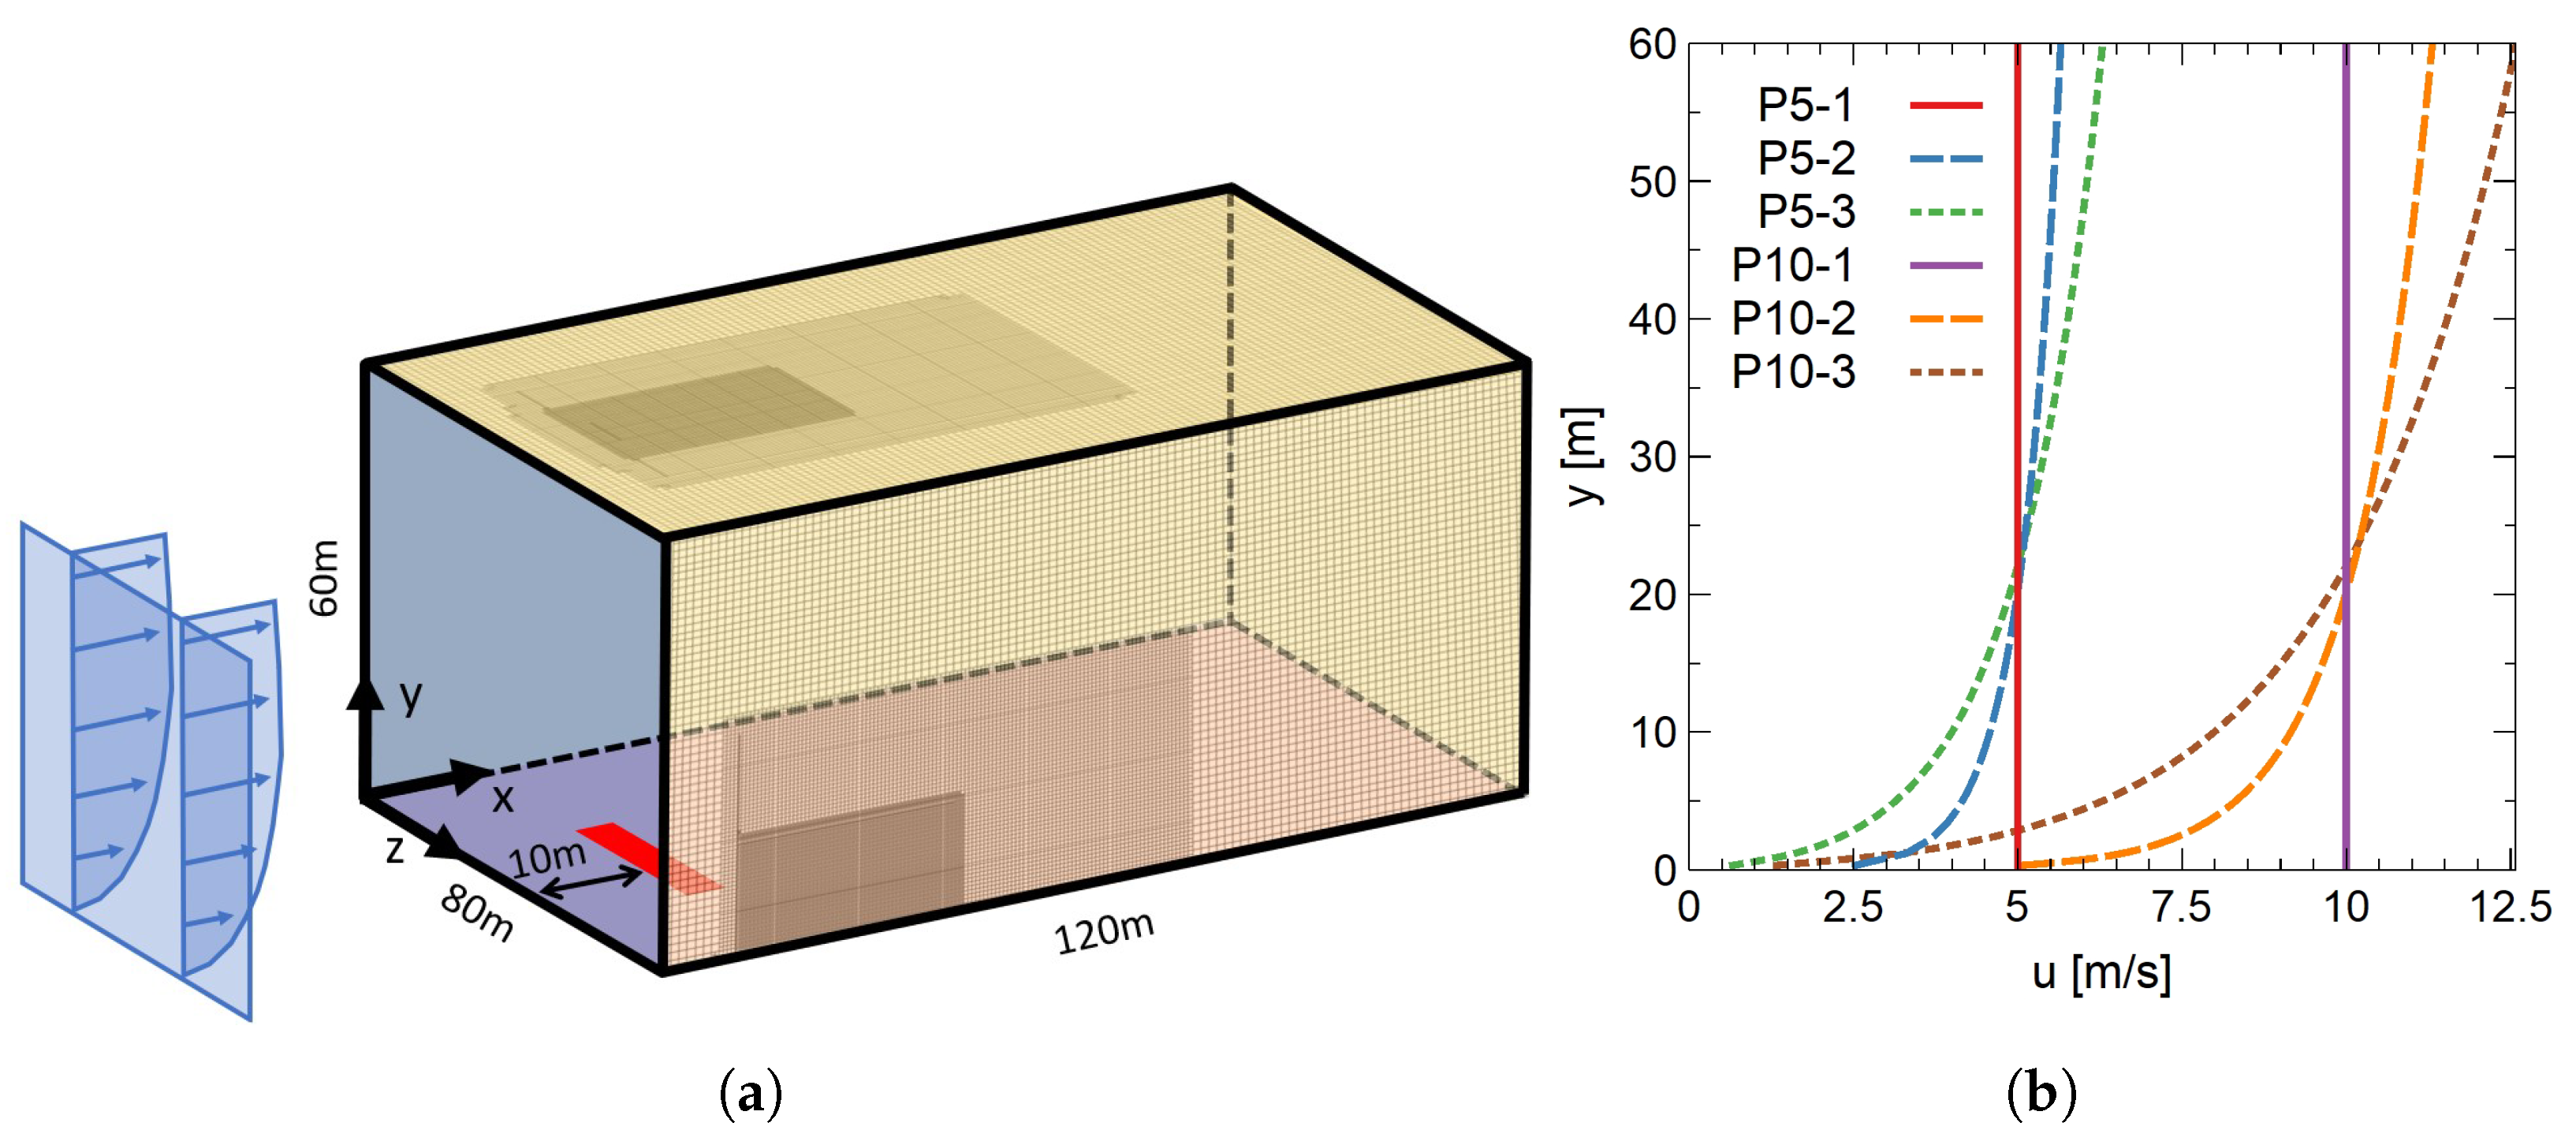
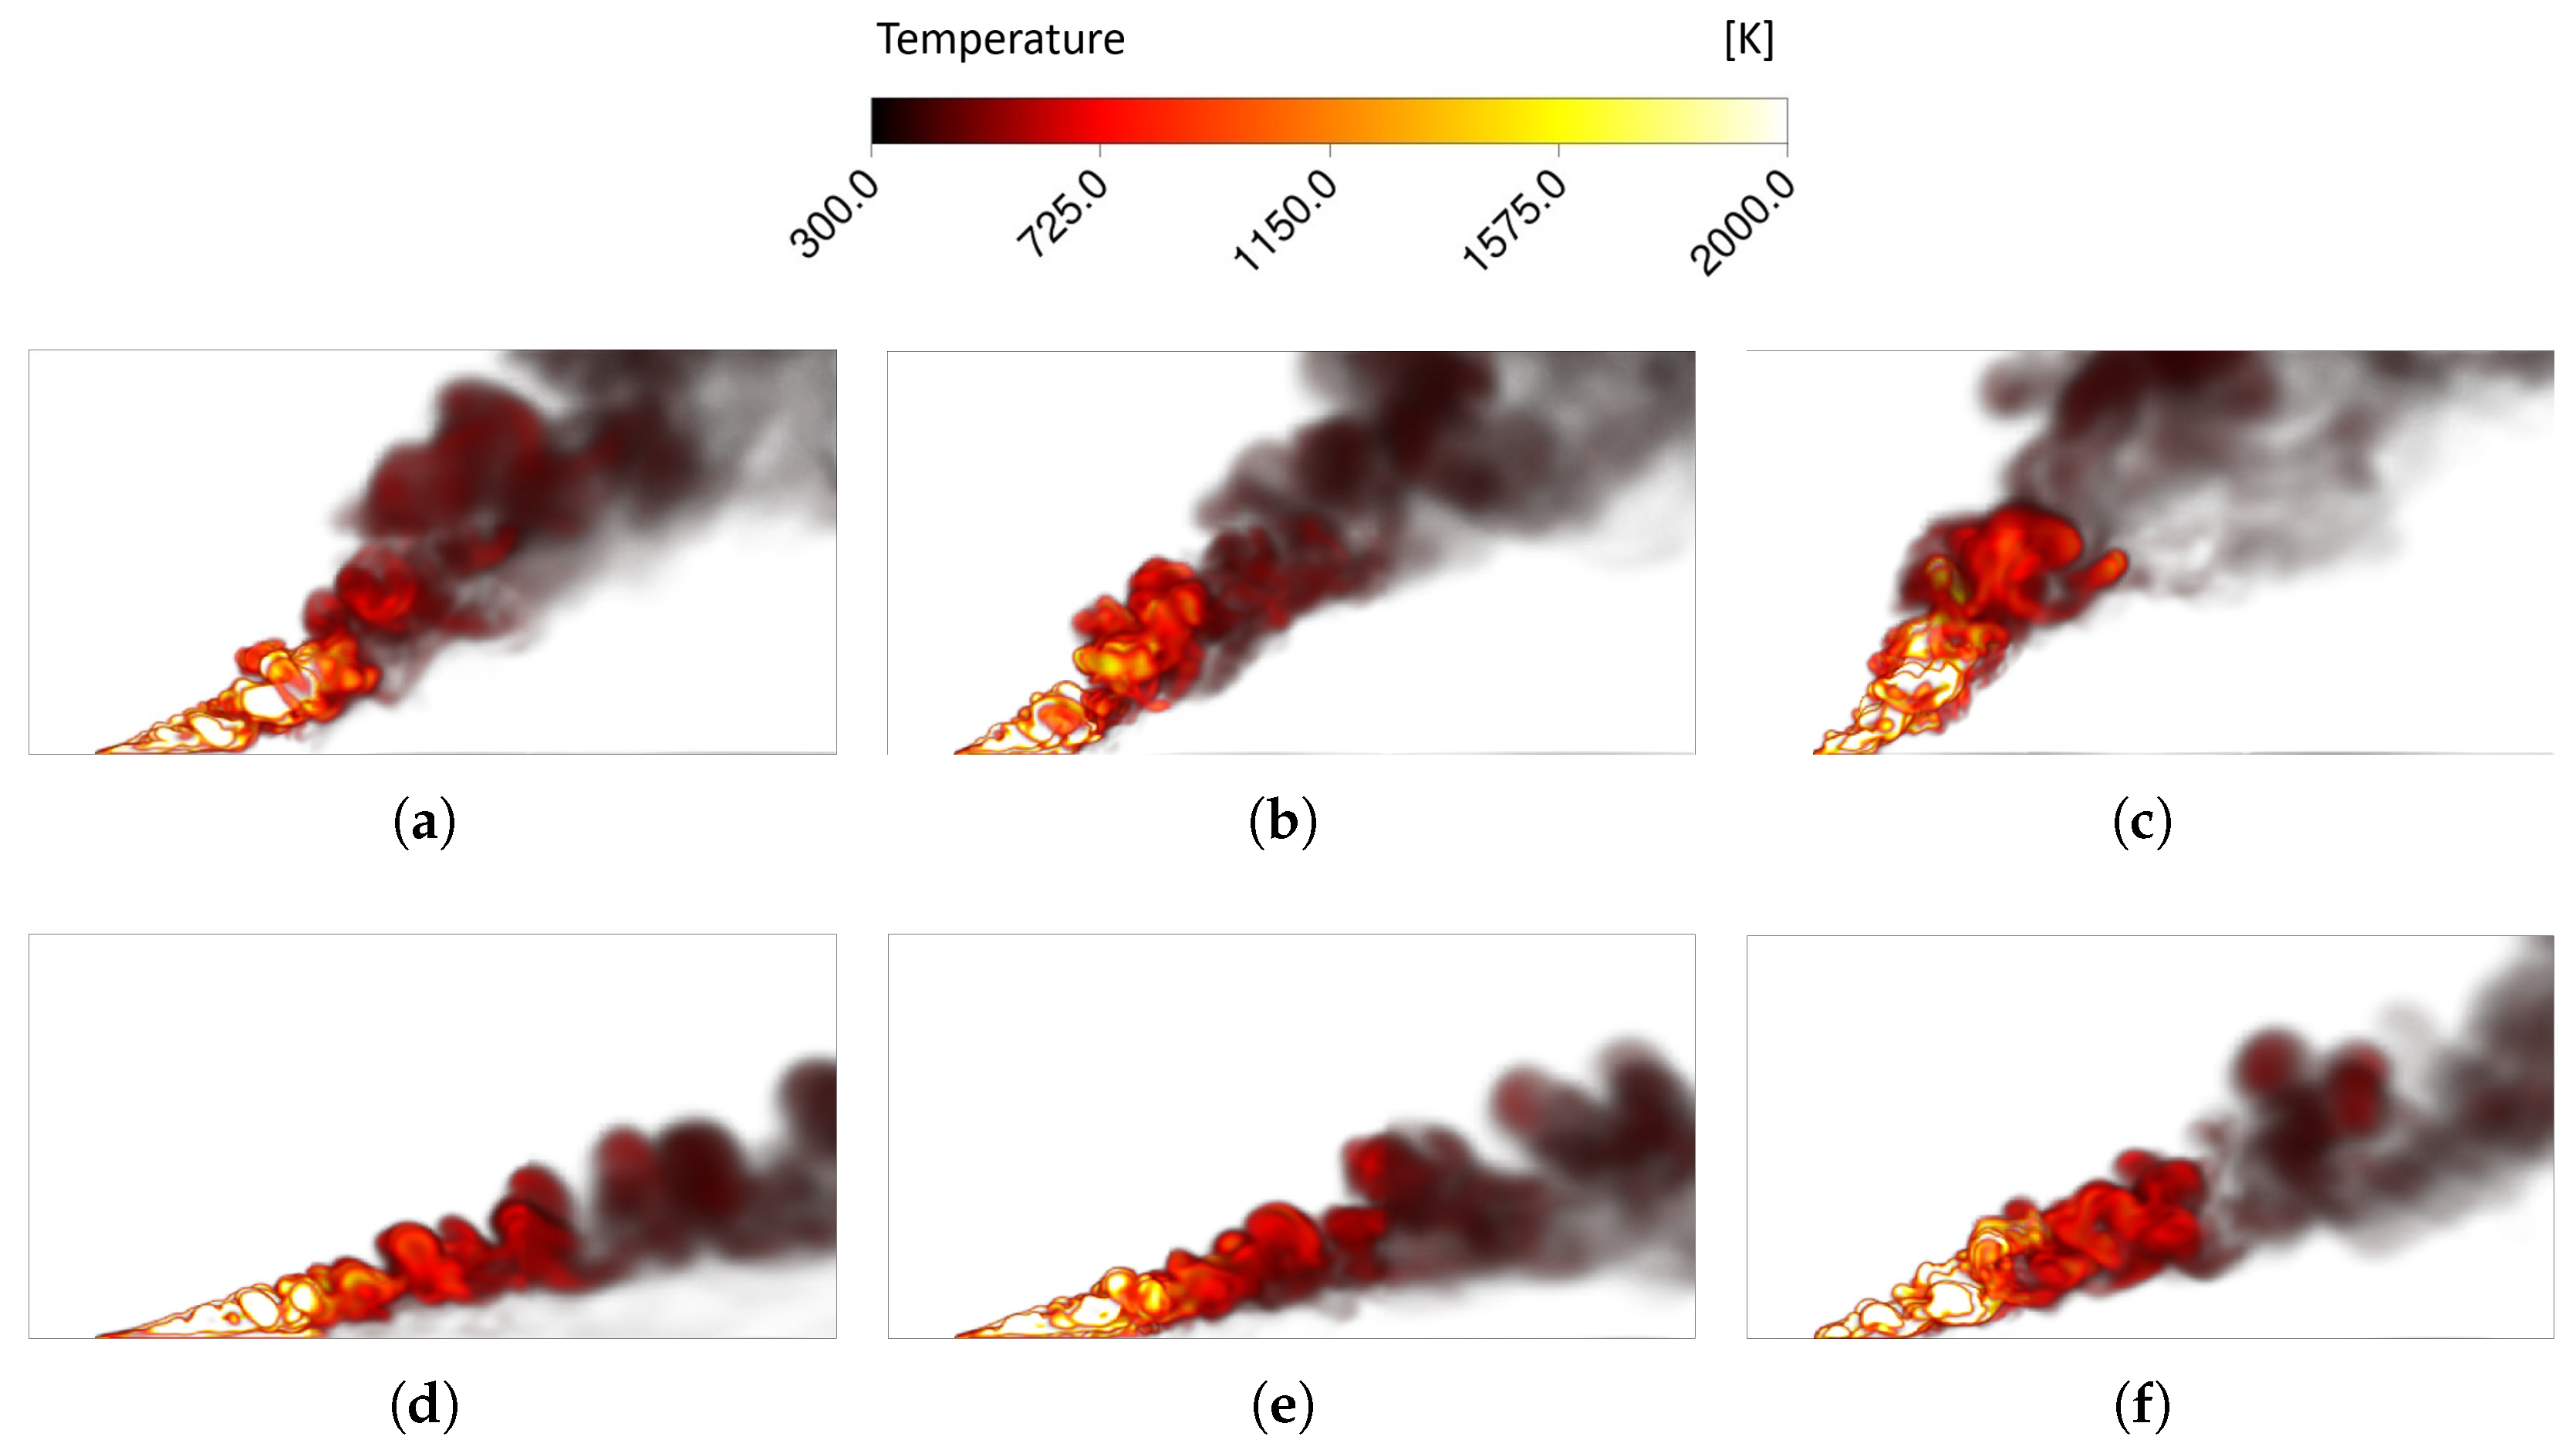
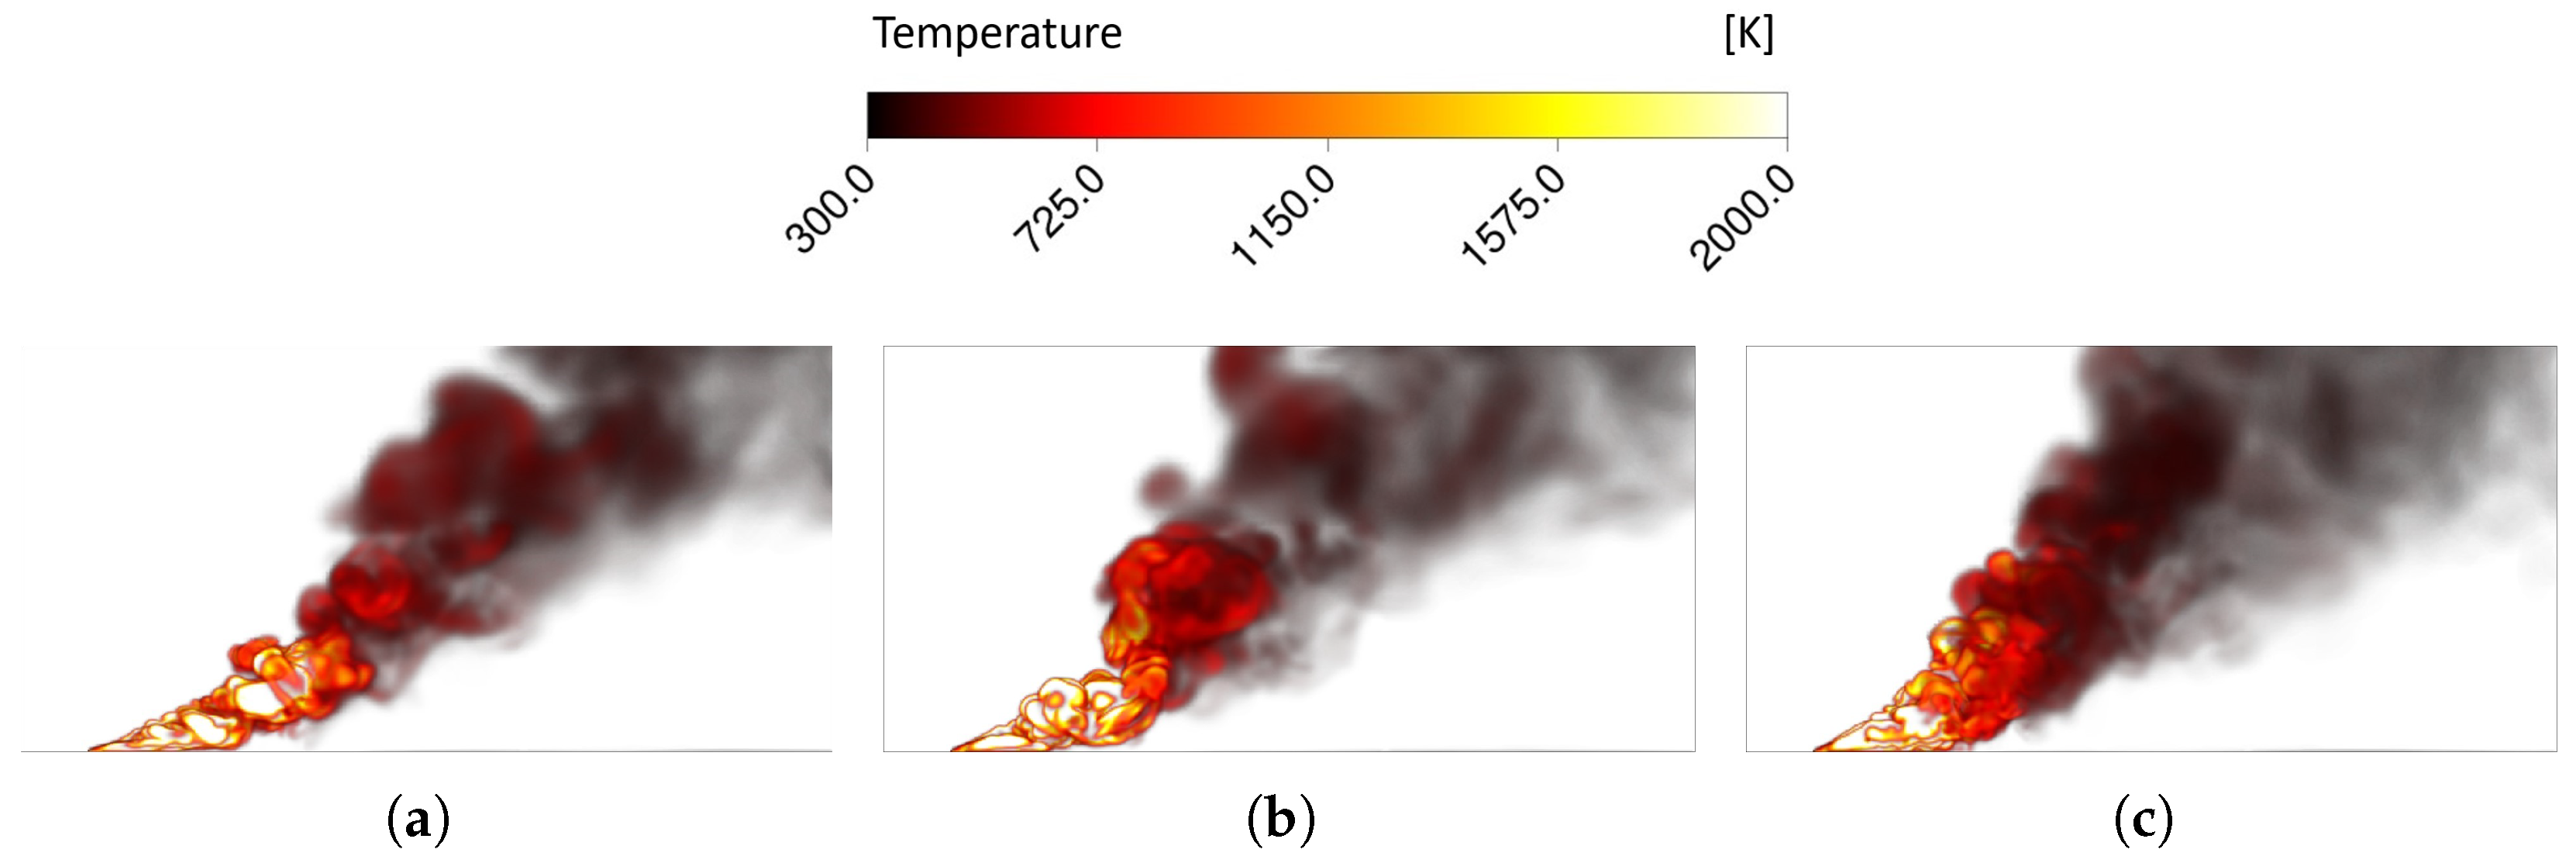
For the six velocity profiles presented in
Figure 2b,
Figure 4 presents the side views of instantaneous snapshots depicting the plume structure. More concretely,
Figure 4a–f present temperature volume rendering for the velocity profiles P5-1, P5-2, P5-3, P10-1, P10-2, and P10-3, respectively.
Firstly, it is important to note that for all the studied crosswind profiles, the fire plumes were vertically inclined and and exhibited a highly turbulent structure with significant three-dimensional large-scale motions. Additionally, as observed during the validation of the LES model, regardless of the crosswind velocity distribution and intensity, the flame had an attachment zone to the wall in the downwind region near the injection. Further downstream, the flame transitioned to a detached state. This transition occurred earlier for profiles in which the velocity close to the wall was lower. Specifically, the length of the attachment region was smaller for the profiles P5-3 and P10-3, in comparison with the profiles P5-2/1 and P10-2/1, respectively. This variation is governed by the balance between the flame and wind momentum and the combustion-induced buoyancy. In this particular case, the higher momentum in the near-wall region of the fuller profiles explained this evolution. Moreover, due to this deficit of momentum close to the floor, when the fire plume was subject to the crosswind profiles P5-3 and P5-2, in comparison with the flat profile (P5-1), this resulted in a lower fire plume inclination. More concretely, for P5-1, P5-2, and P5-3, the inclination (measured from the vertical position) of the fire plume shifted from 49° to 43° and 37°, respectively. The same trend was visible for the profiles P10-1, P10-2, and P10-3, resulting in fire plume inclinations of 79°, 72°, and 61°. As expected, the direct comparison between the profiles P5-1/2/3 with P10-1/2/3 showed an increased inclination in this near-fire plume region when the average crosswind velocity was higher.
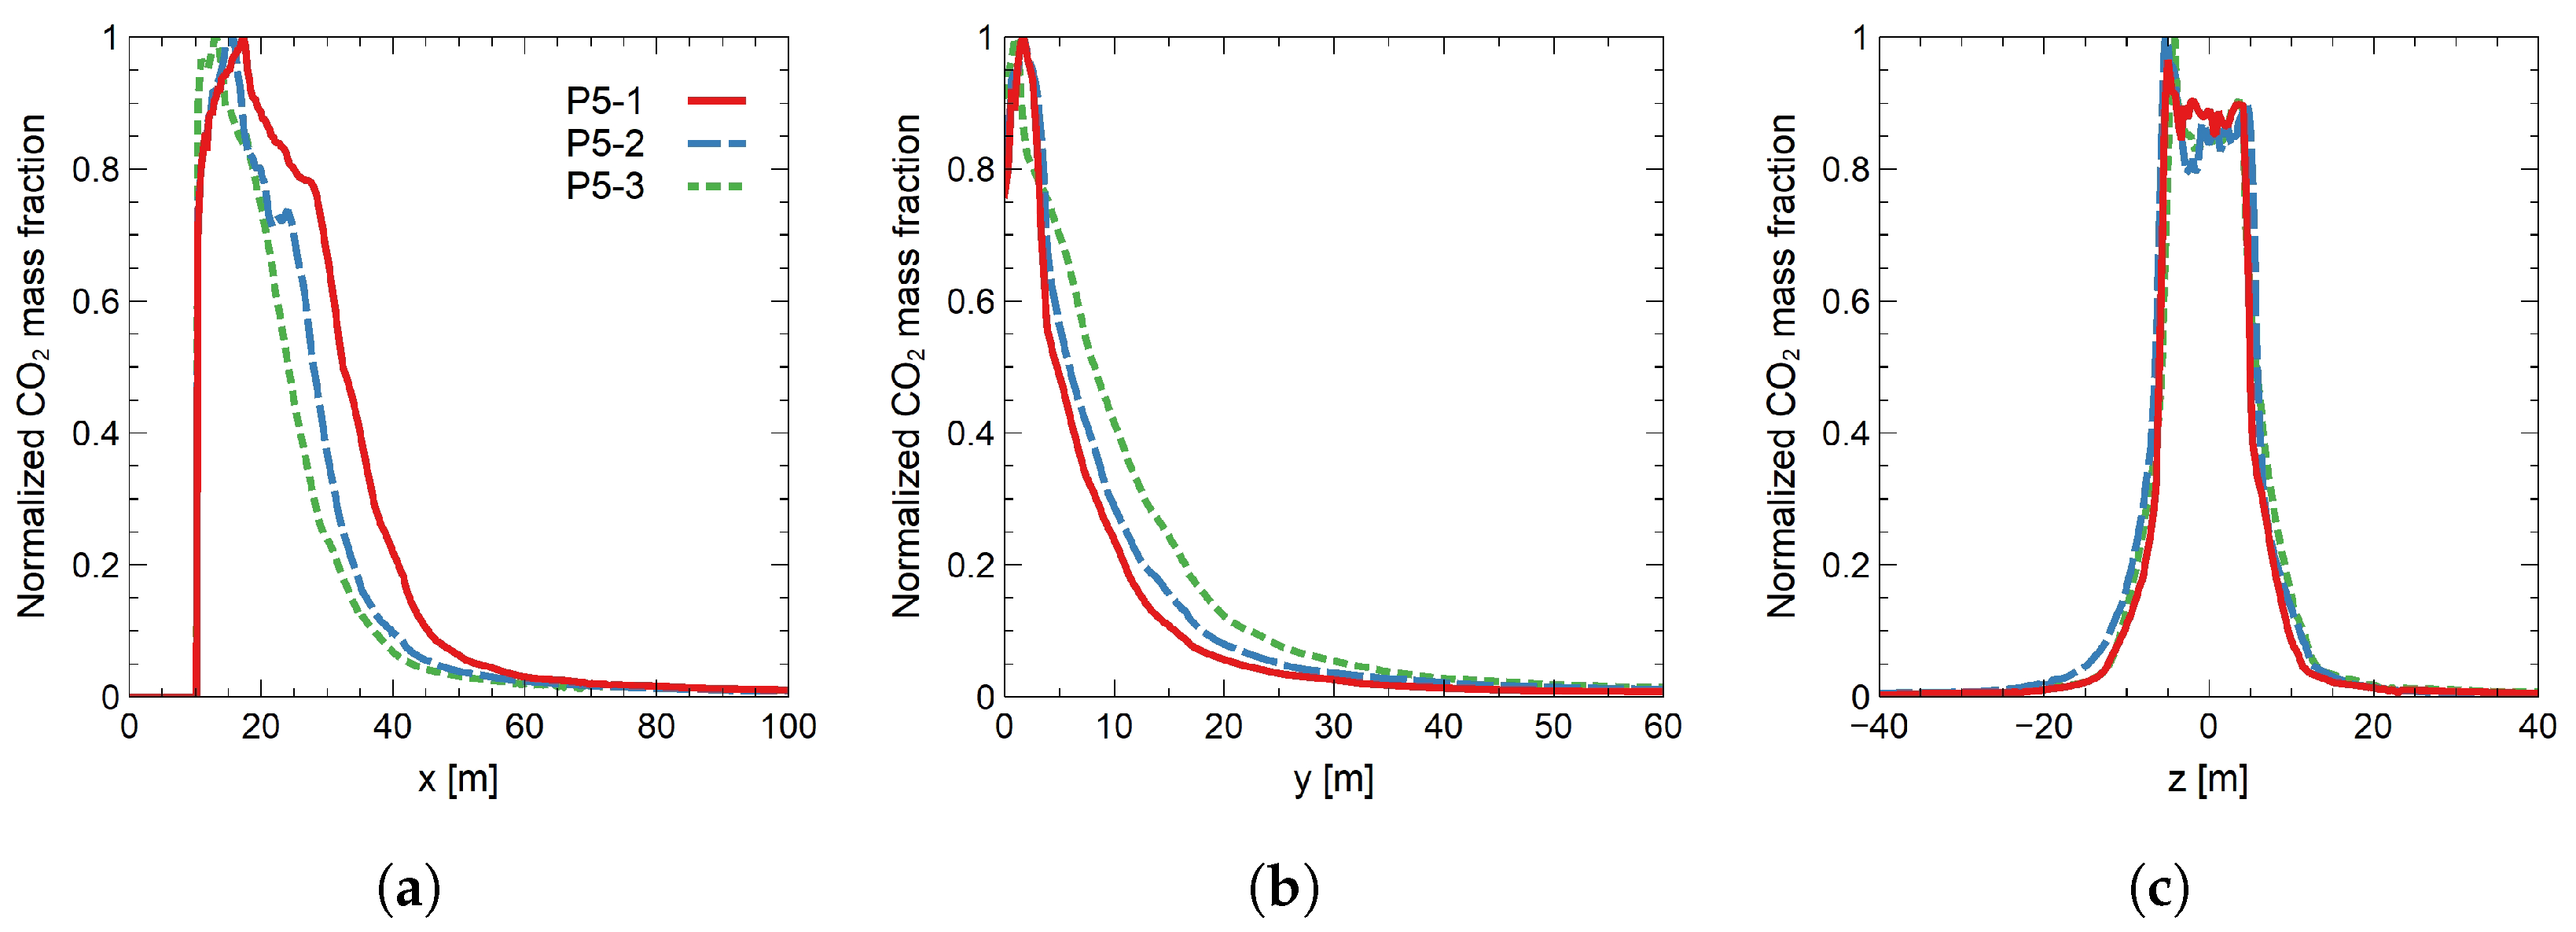
The vertical velocity distribution of the crosswind also affects the smoke propagation from the fire plume in its first metres (studied domain). To investigate this effect, the time-mean CO
2 mass fraction was considered a tracer of the evolution of the fire plume. The subfigures (a), (b), and (c) in
Figure 5 show the maximum normalized CO
2 mass fraction (relative to the maximum value within the domain) along the
x-,
y-, and
z-directions, respectively, for the velocity profiles P5-1, P5-2, and P5-3.
The vertical distribution of the velocity profile had a relatively negligible effect on the maximum CO2 mass fraction distribution in the z-direction. However, it affected the distribution of the maximum CO2 mass fraction in the y-direction, and it was very significant in the x-direction. As the velocity close to the wall increased, i.e., when moving from the profiles P5-3 to P5-1, there was a noticeable increase in the maximum extent of the concentration of CO2 in the x-direction. Once more, this is associated with the deficit in momentum close to the floor and its balance with the combustion-induced buoyancy, which is also affected by the entrainment velocity. In contrast, as the velocity close to the wall increased, the maximum extent of the CO2 concentration in the y-direction was reduced, in line with the evolution of the plume inclination. Similar trends could be observed for the P10-1, P10-2, and P10-3 profiles but with an overall increase (decrease) in the maximum smoke extent in the x-direction (y-direction).
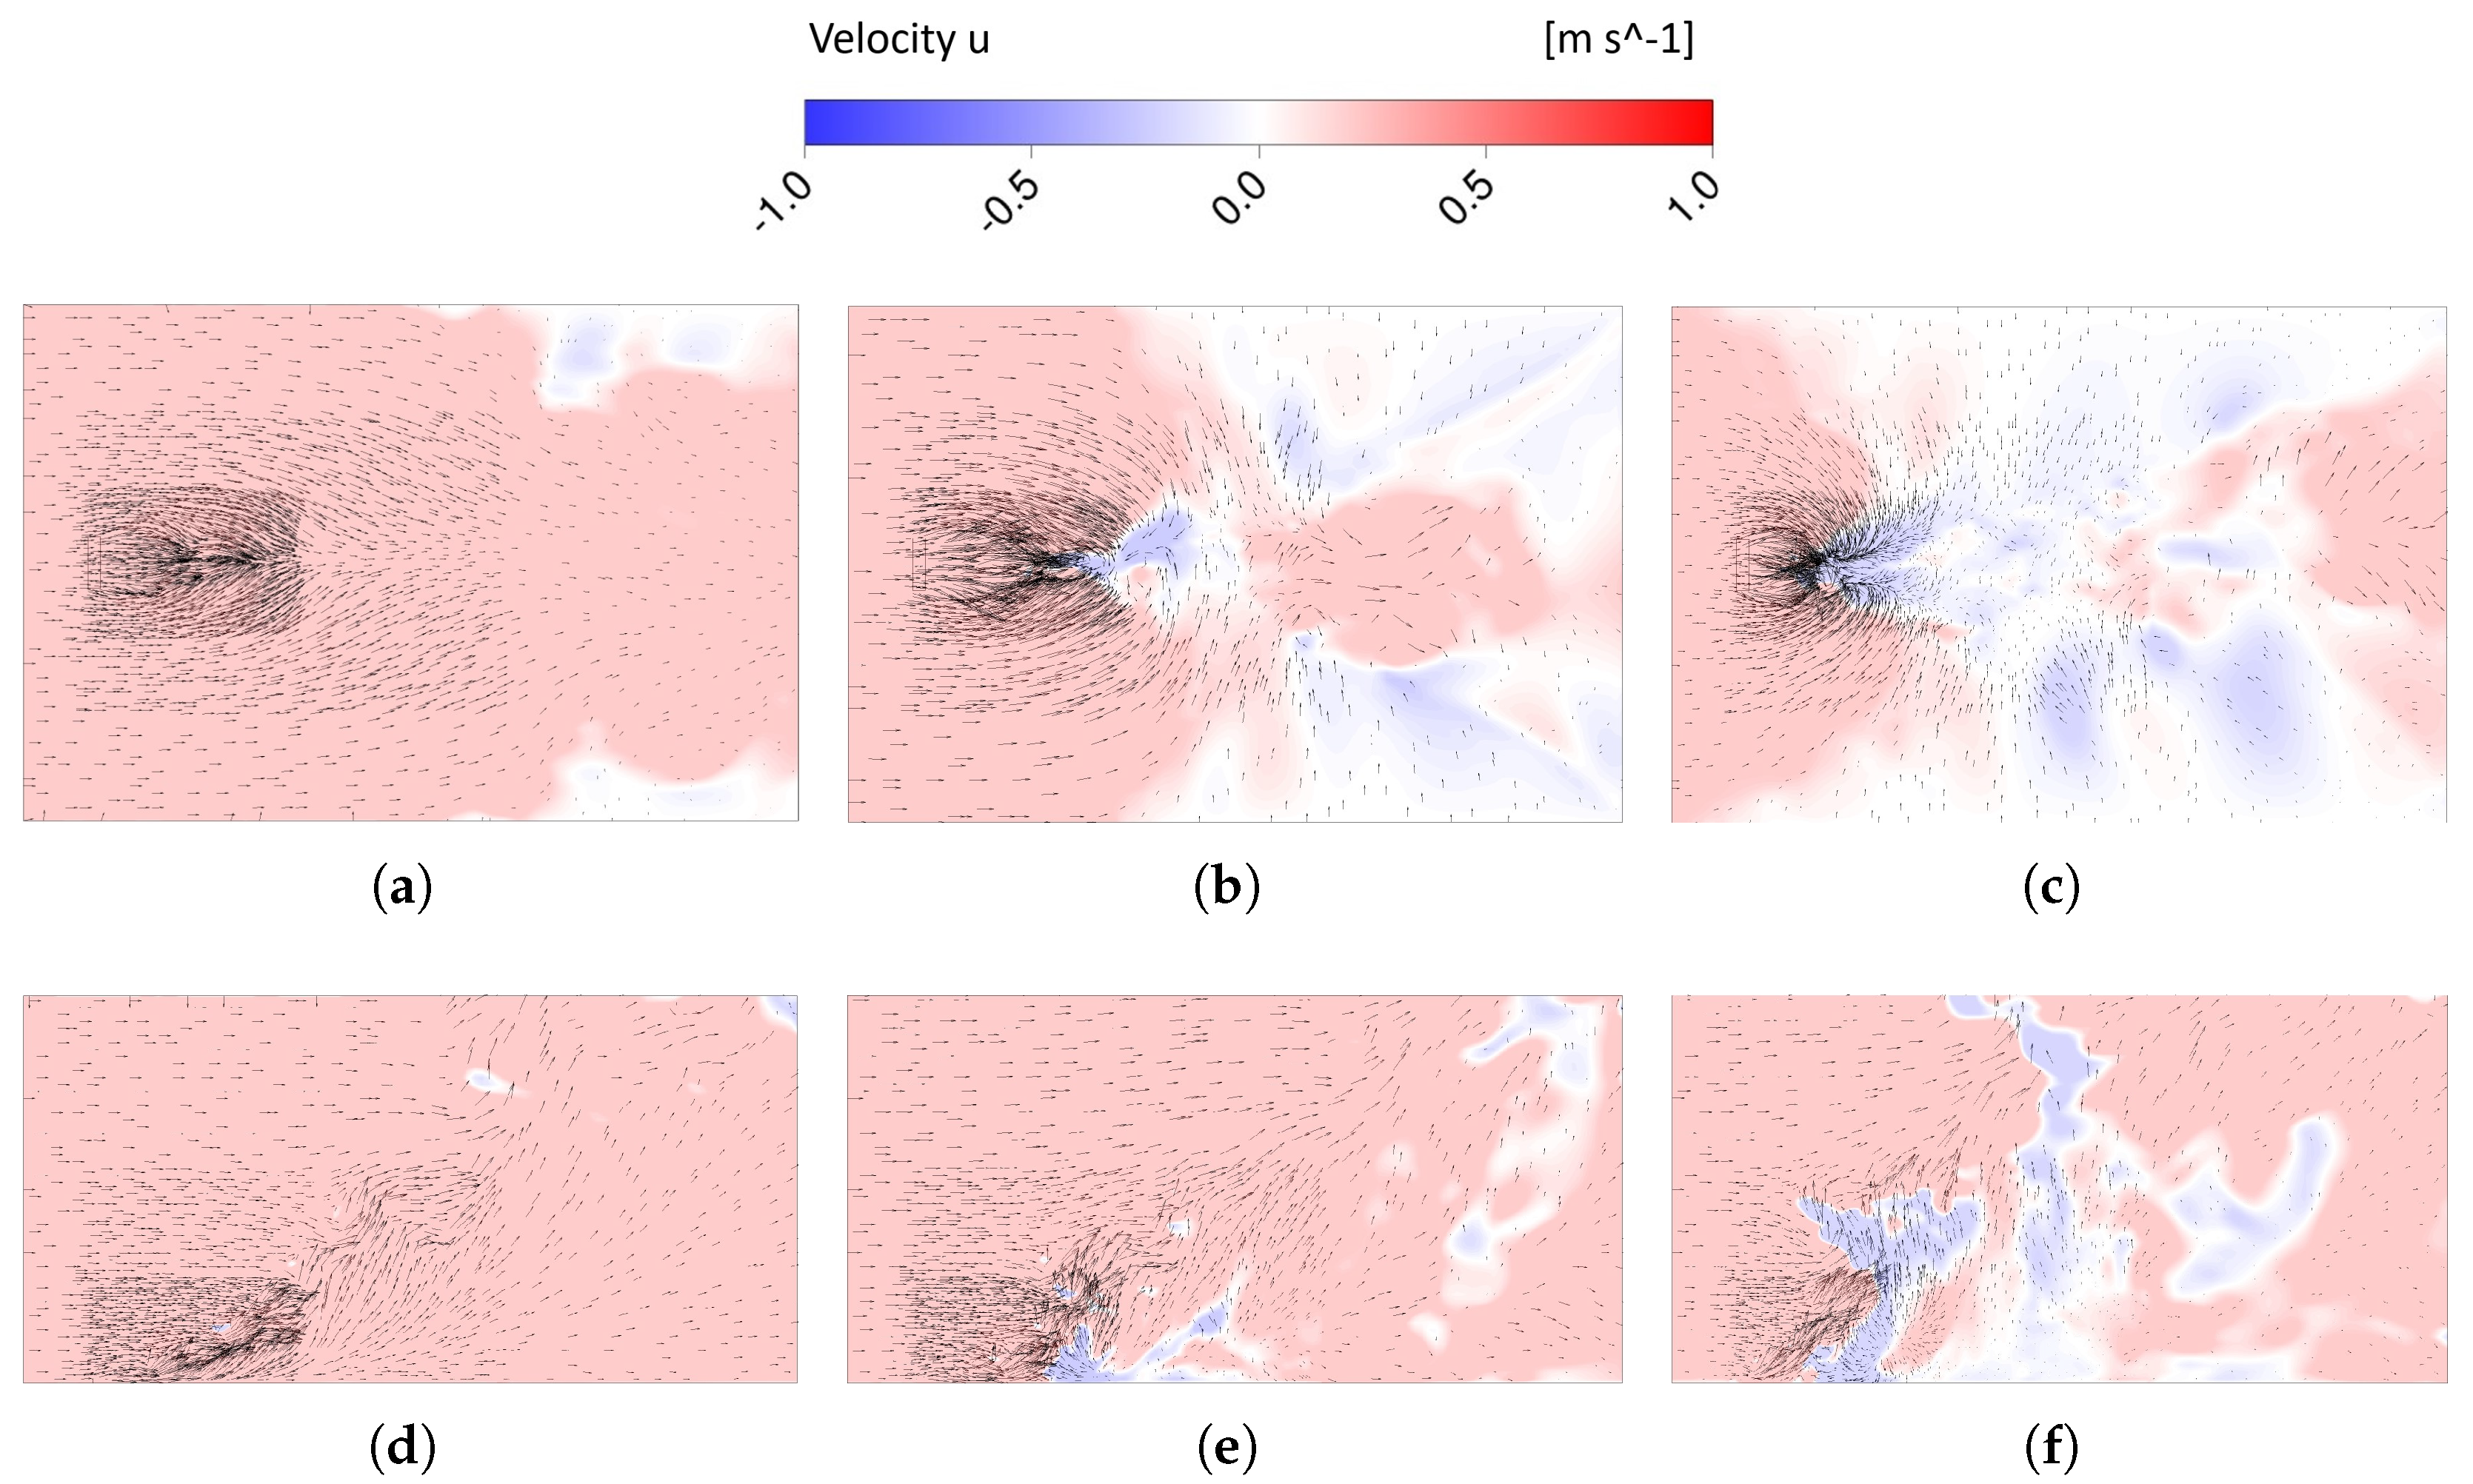
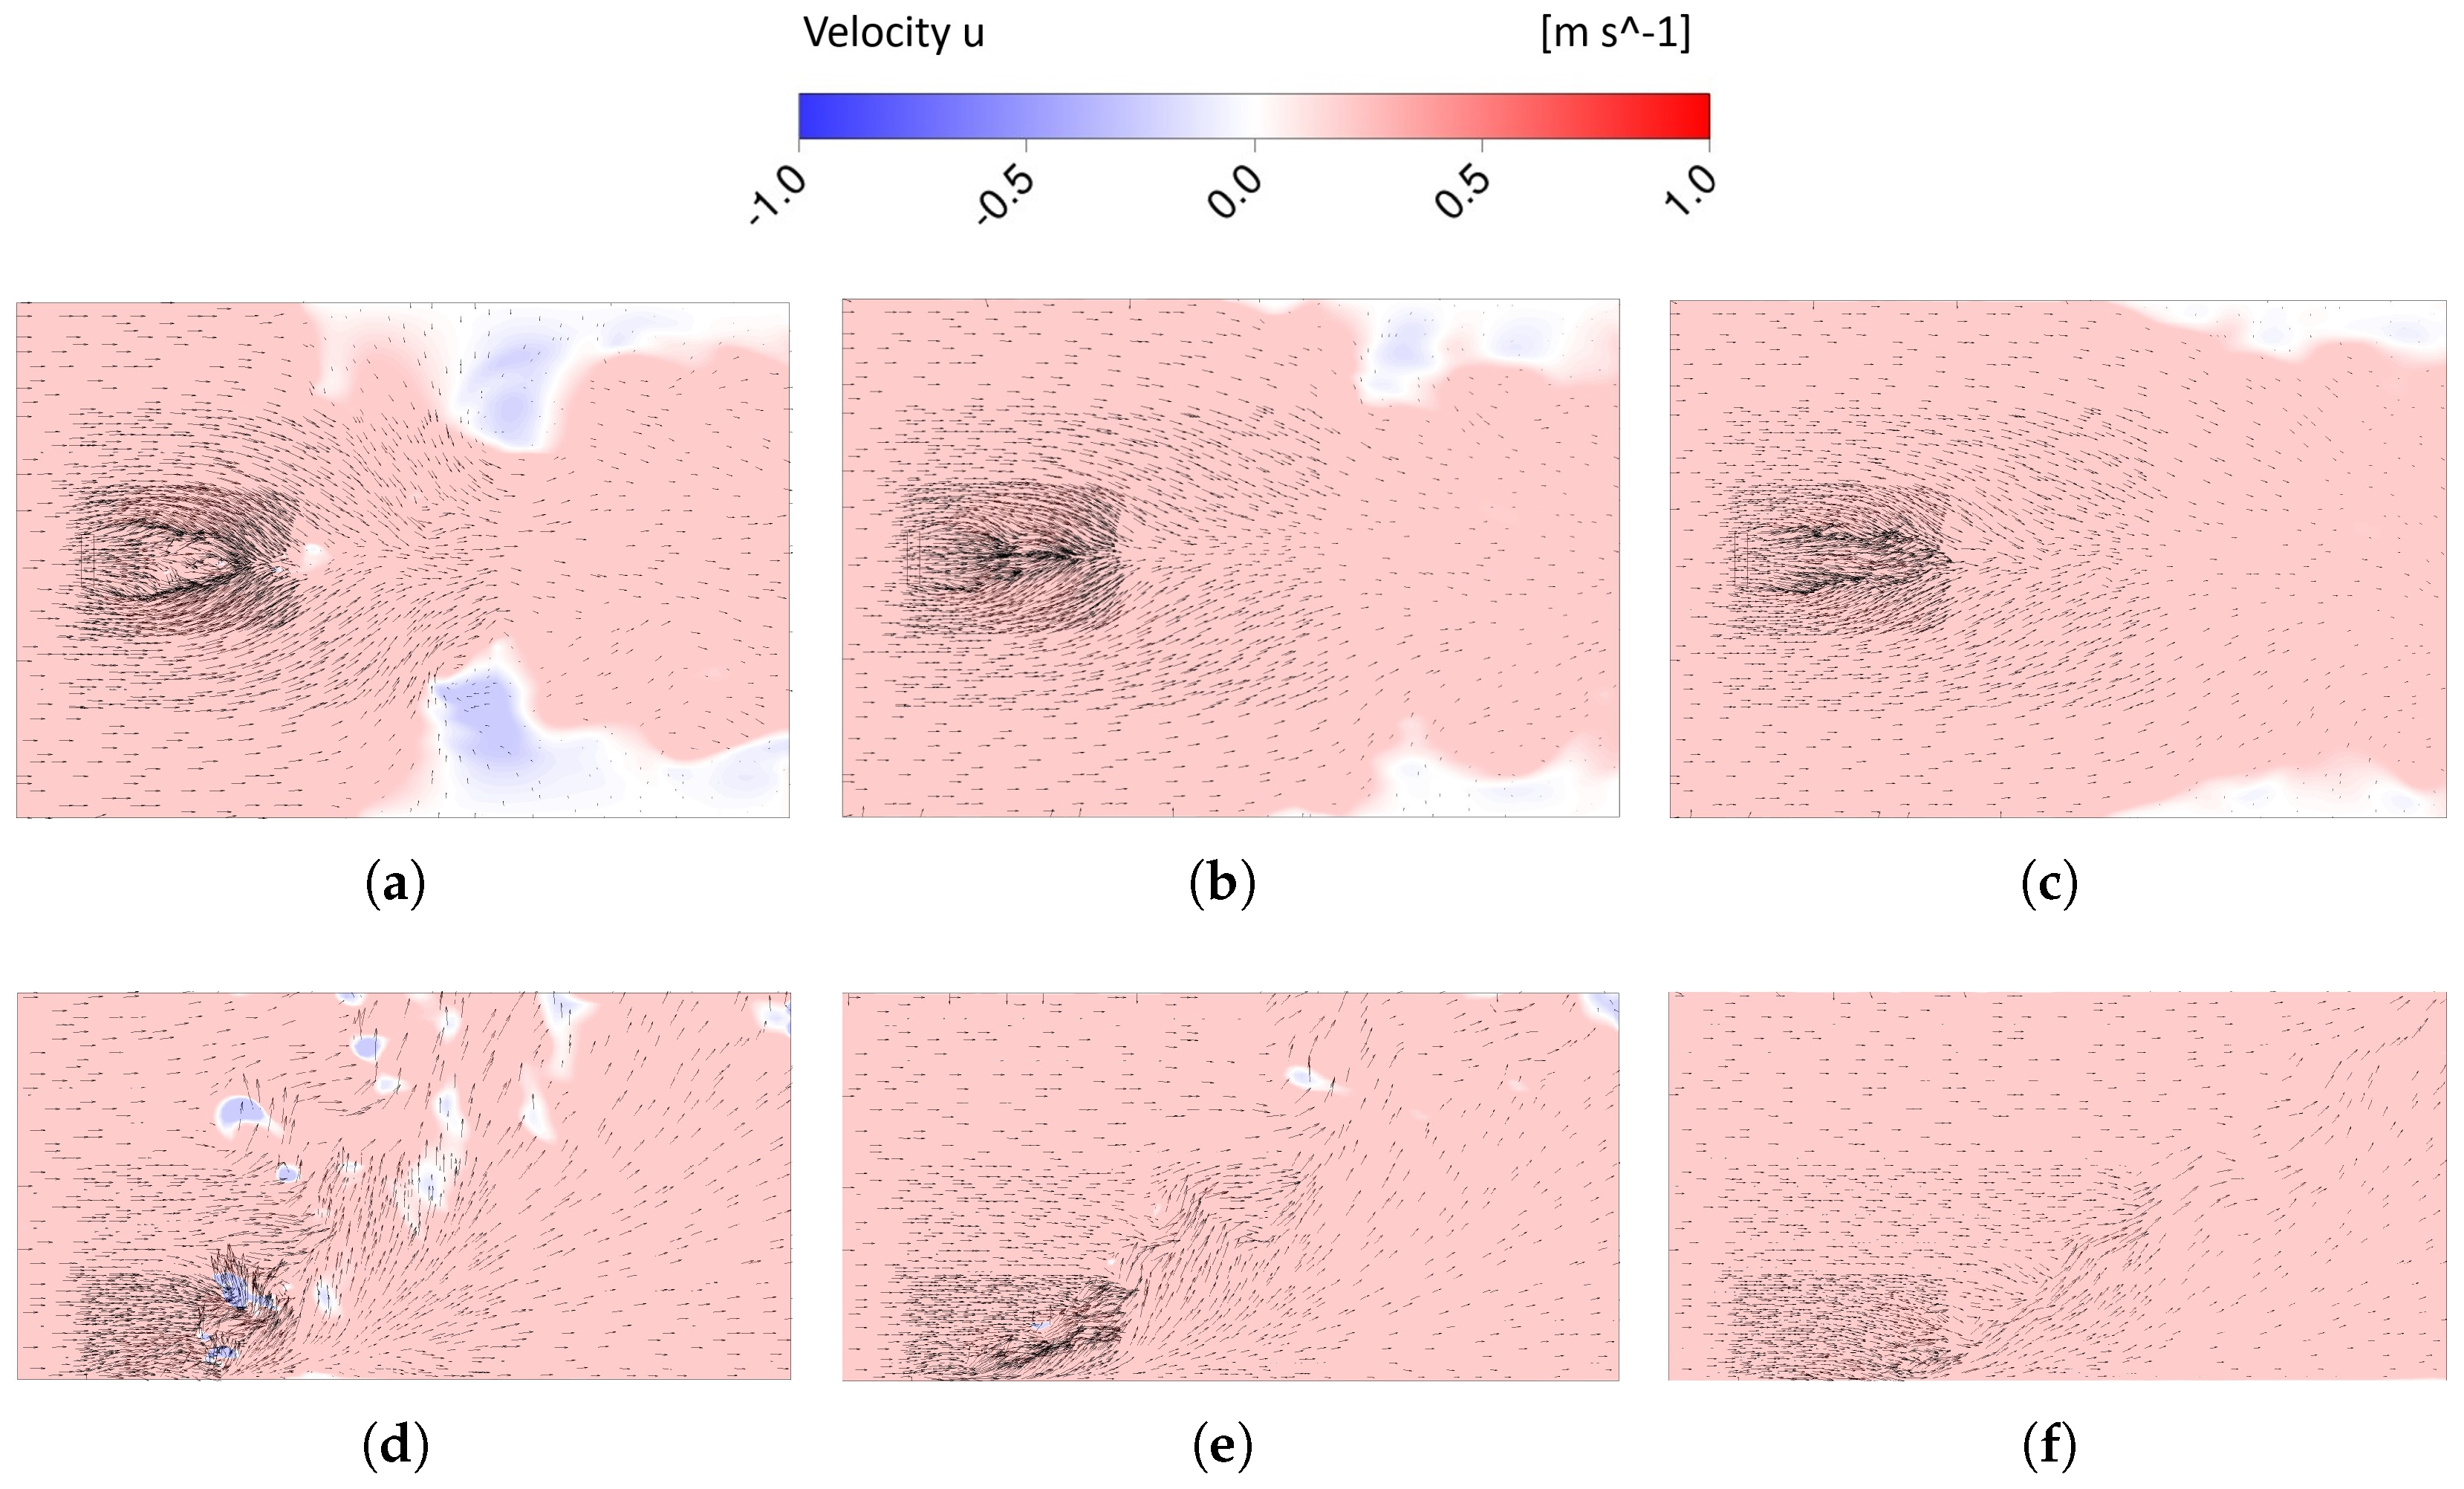
This variation in the inclination of the fire plume, caused by differences in crosswind momentum, significantly affects the entrainment process near the wall. To illustrate this,
Figure 6 and
Figure 7 present the velocity vectors and iso-contours of the velocity in the main crosswind direction, highlighting the entrainment process and possible reverse flow regions. More concretely,
Figure 6a–c are focused on the near-wall region for the crosswind profiles P5-1, P5-2, and P5-3 respectively, while
Figure 6d–f show the same profiles but in a transversal plane located in the middle of the fireline.
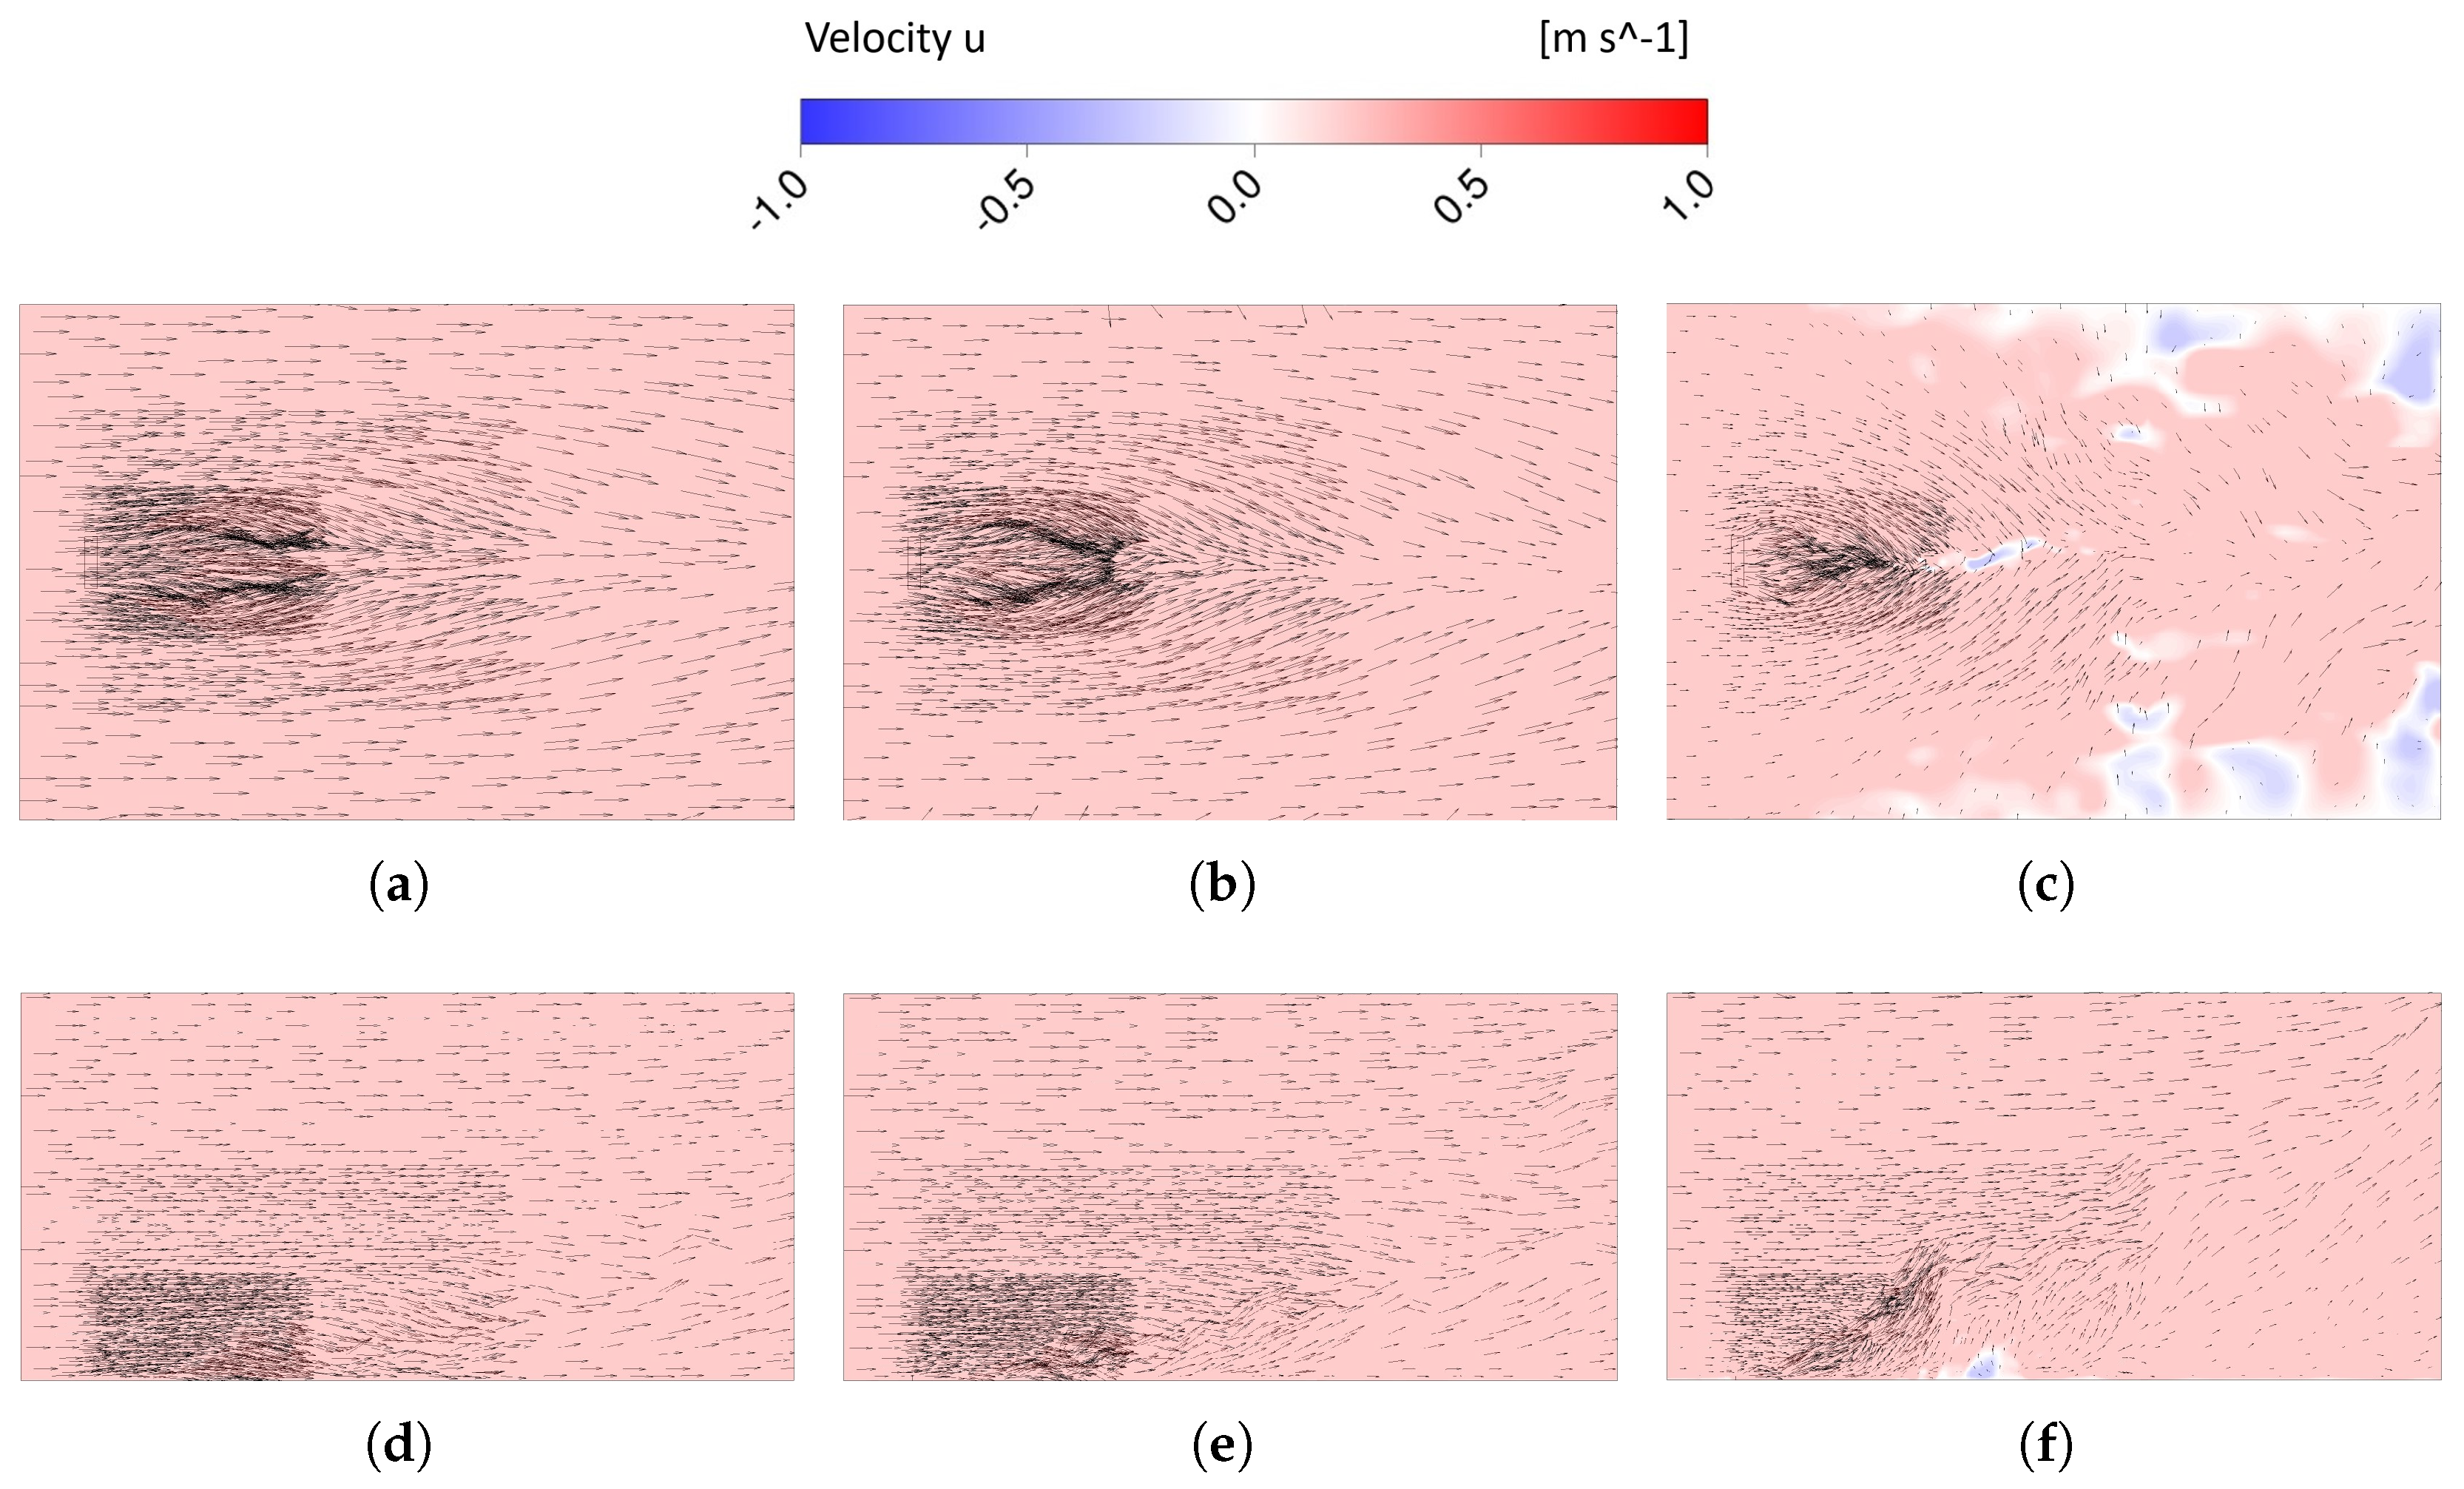
Figure 7a–f present the same quantities in the same locations mentioned above for the profiles P10-1, P10-2, and P10-3.
Focusing on
Figure 6a–c, it is noteworthy that a constant inlet velocity profile resulted in no reverse flow in the near-wall region to the flame. Instead, only a small lateral entrainment, driven by continuity, was observed near the end of the computational domain (a region characterized by negative longitudinal velocity). As the momentum in the near wall region decreased, lateral entrainment started to occur earlier and reverse flow emerged in the vicinity of the flame. This reverse flow region was not confined to the near-wall region; it extended along the initial vertical metres of the fire plume, as shown in
Figure 6d–f. The vertical extent of this region increased as the near-wall velocity decreased. Some reverse flow regions were also noteworthy in the upper extent of the fire plume for the velocity profiles studied due to its inherent turbulent motions. Turning to
Figure 7a–f, it is possible to note that when the average velocity of the crosswind increased from 5 to 10
, there was a notable decrease in the lateral entrainment rate, attributed to the Coanda effect. Only the case with the P10-3 profile exhibited some lateral entrainment. In all cases, almost no reverse flow close to the flame was verified.
Due to the highly changed flow field in the near-wall region, which included zones where the velocity in the main crosswind direction changed sign, an increased number of vortical regions was expected. This could result in the formation of vertical structures by the fire plume entrainment. In fact, depending on the prescribed inlet velocity profile, several mechanisms for the creation of these vortical structures were identified.
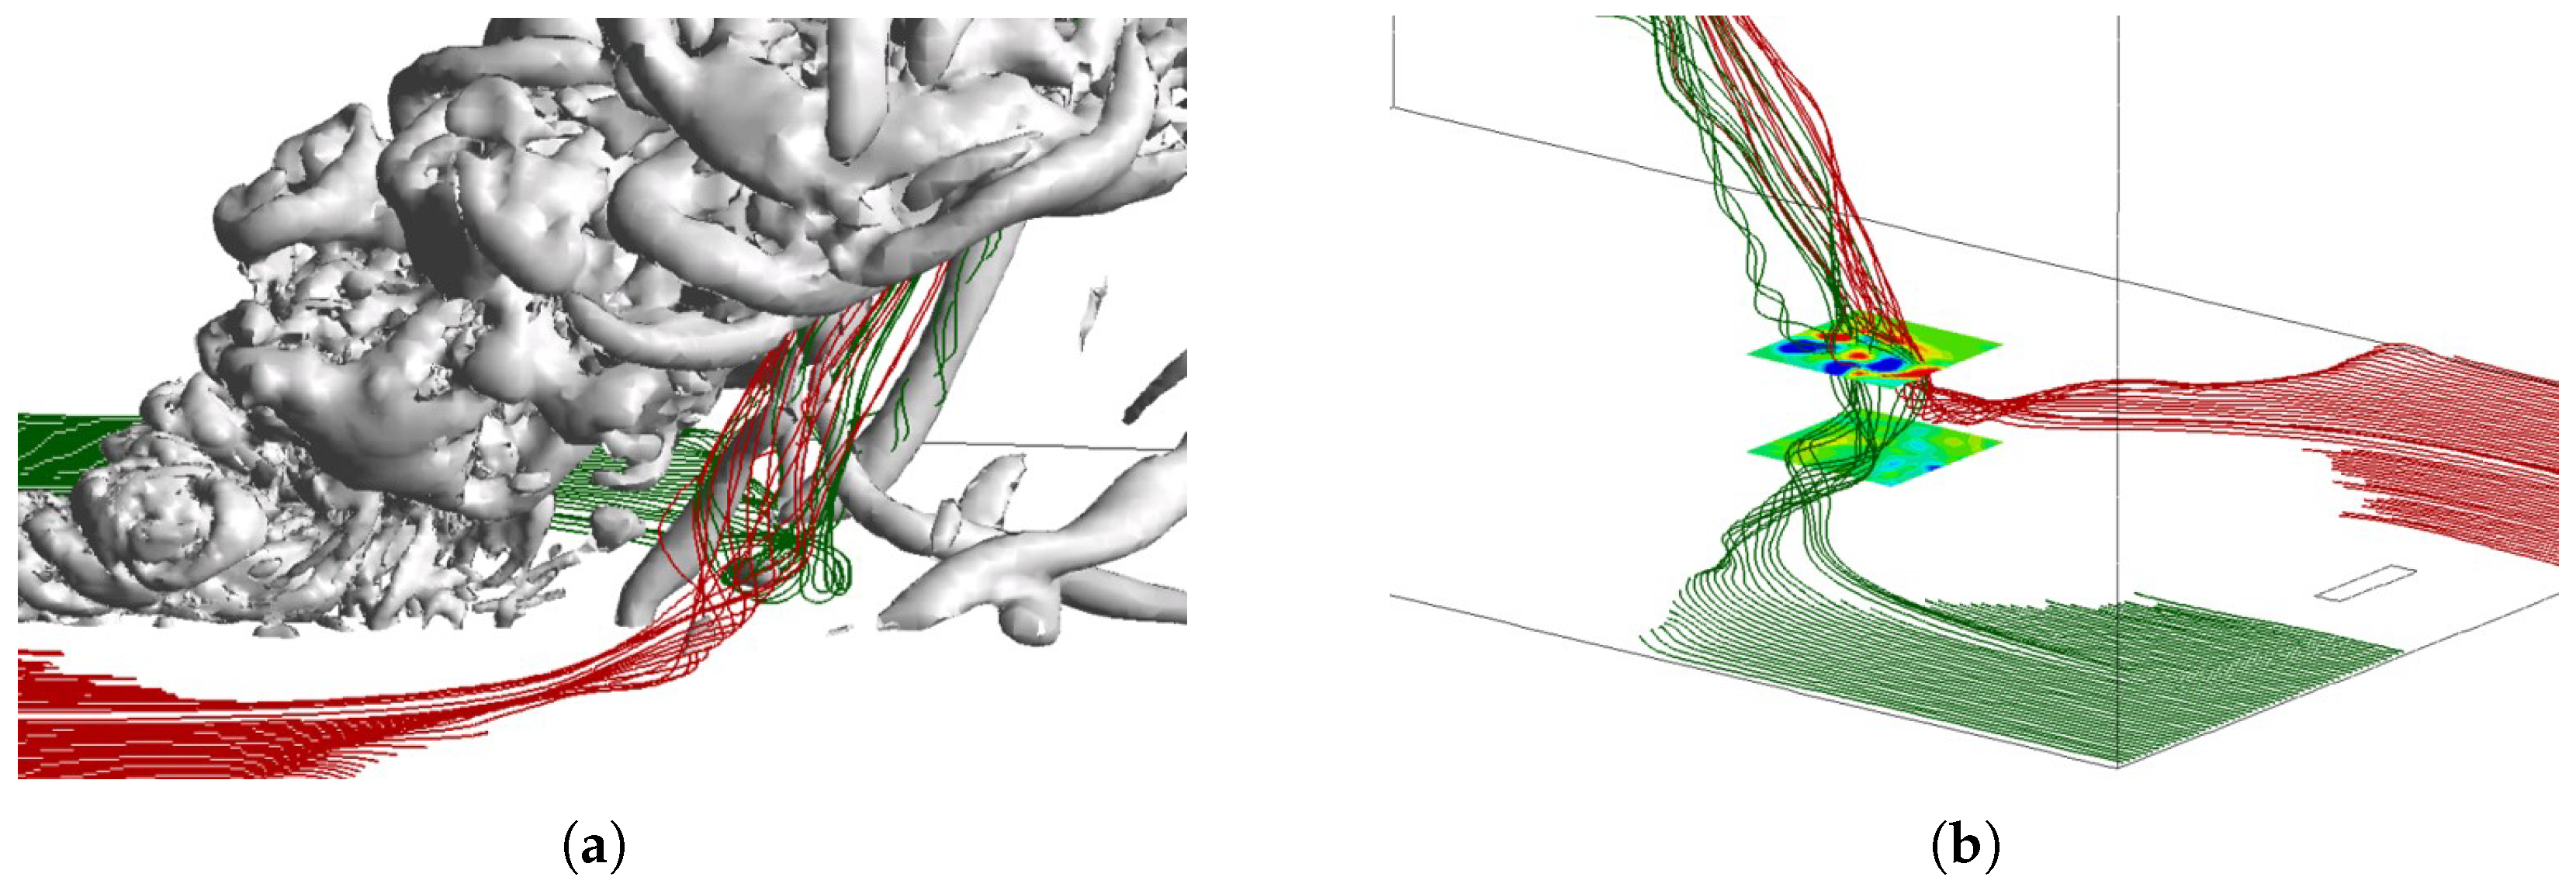
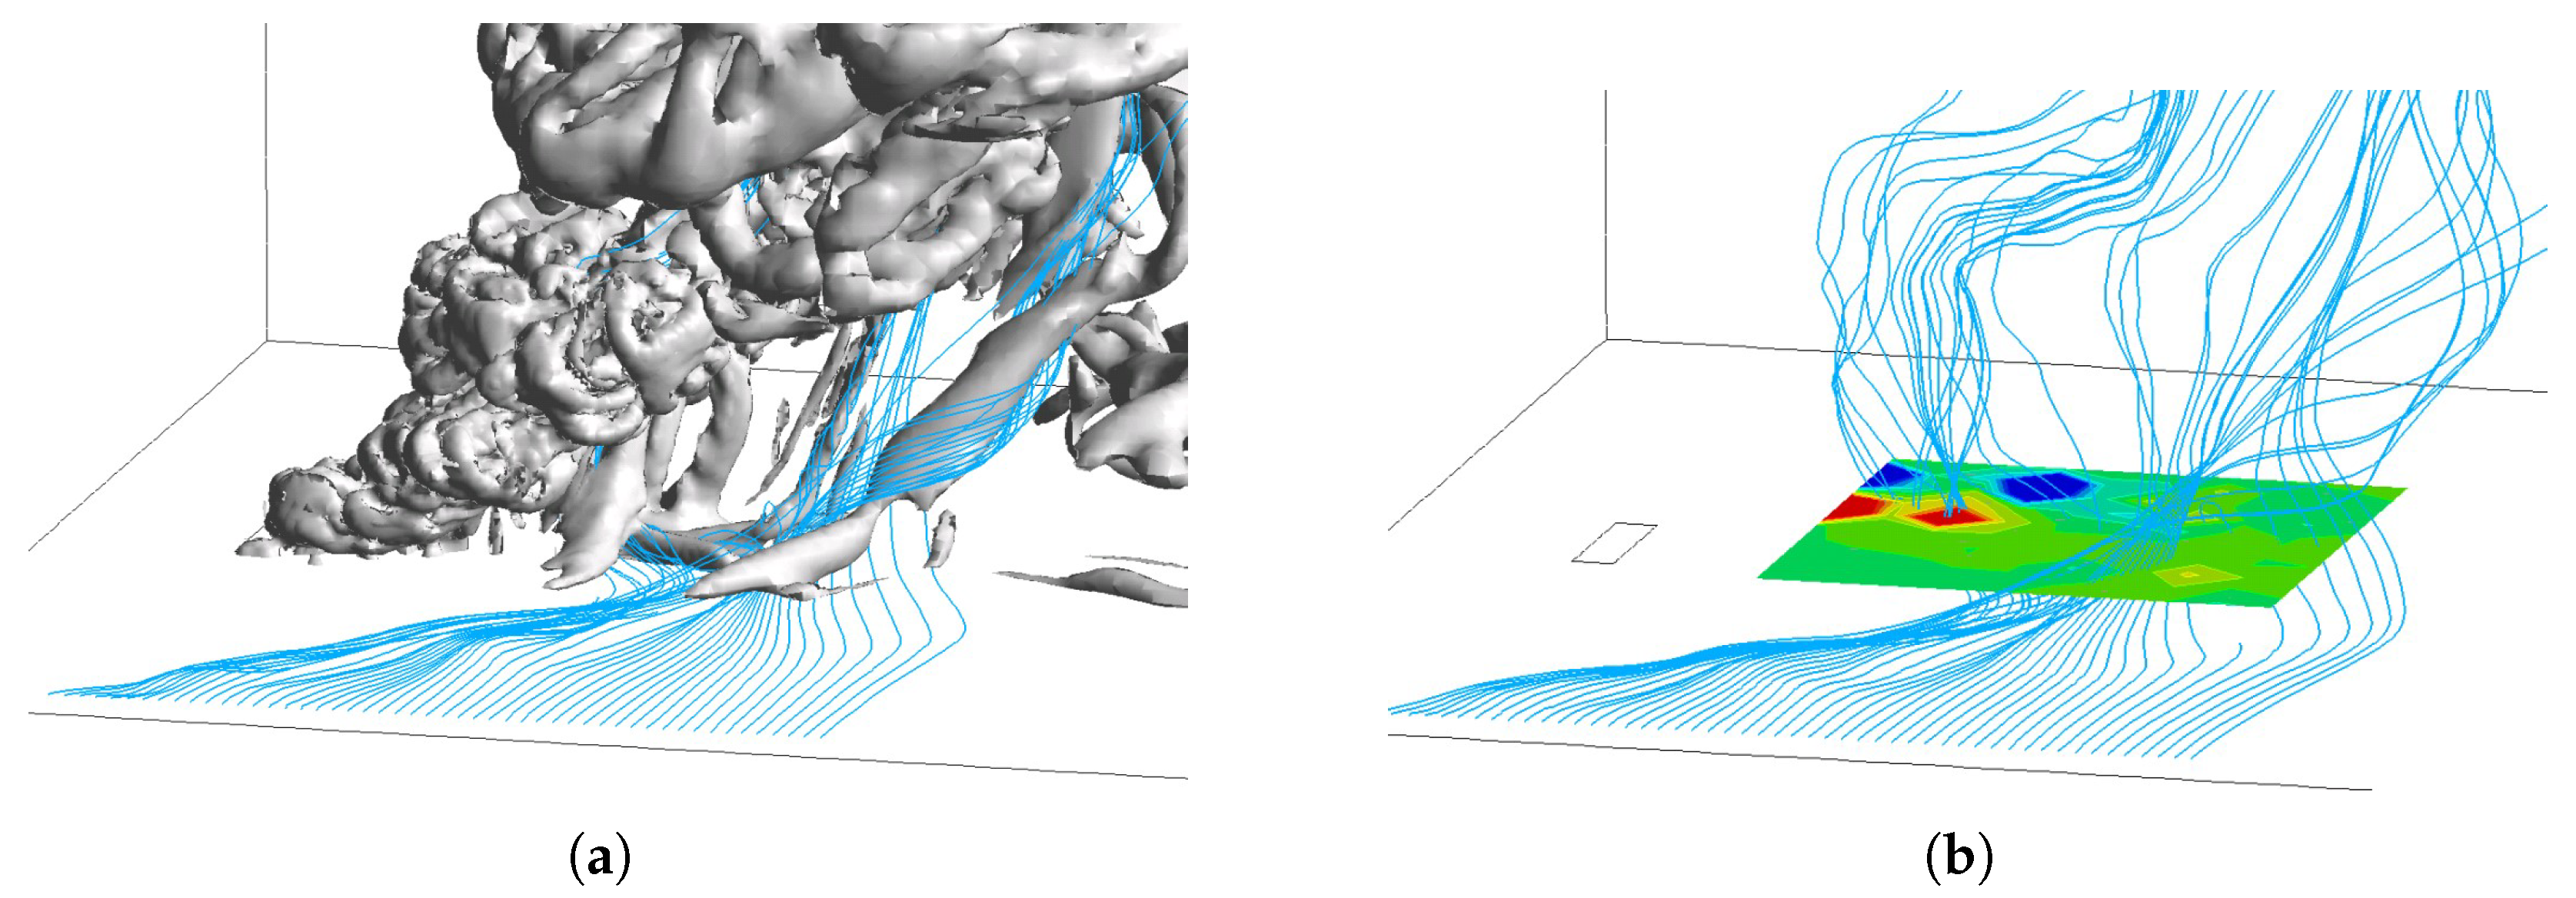
Figure 8,
Figure 9 and
Figure 10 present an instantaneous vortex core region—defined by motion patterns around local centres with a specific swirling strength—along with saturated vertical vorticity contours and 3D streamlines either from the inlet or from the lateral boundaries in the near-wall region. The iso-surface and -contours helped identify vortex regions, while the streamlines provided insight into the driving flow mechanisms and the origins of these structures. Only for the P5-2 and P5-3 profiles were vertical structures detected. For the remaining velocity profiles, there was a negligible reverse flow in the near-wall region and lateral entrainment, decreasing the rate of the formation of vortical structures near the plume. As mentioned, this happened due to the higher velocities and therefore higher momentum of the crosswind in the near-wall region and since the lateral domain size was carefully selected to avoid artificial wind gusts, which are known to generate vertical structures [
39].
Figure 8a,b depict the profile P5-2, illustrating the vortex core regions and the vorticity contours, respectively, with streamlines originating from the inlet. Notably, as the lateral entrainment started to flow to the downwind region of the plume, the crosswind coming from the inlet, due to its low momentum, started to roll, moving towards the downwind region and forming vortical structures that stretched and connected to the plume. This mechanism is similar to the process where a separated velocity boundary layer on the ground links to a pair of vertical vortices, as described by Frick and Roshko [
11] for a jet in crossflow and by Shinohara and Matsushima [
22] for a flame in crossflow. These vortex structures could either remain steady in the downwind region of the plume or be shed downstream, largely depending on erratic fire behaviour. Similar vortex formation was also observed in the P5-3 velocity profile, suggesting that it occurred under conditions of relatively low velocity and vertical distribution.
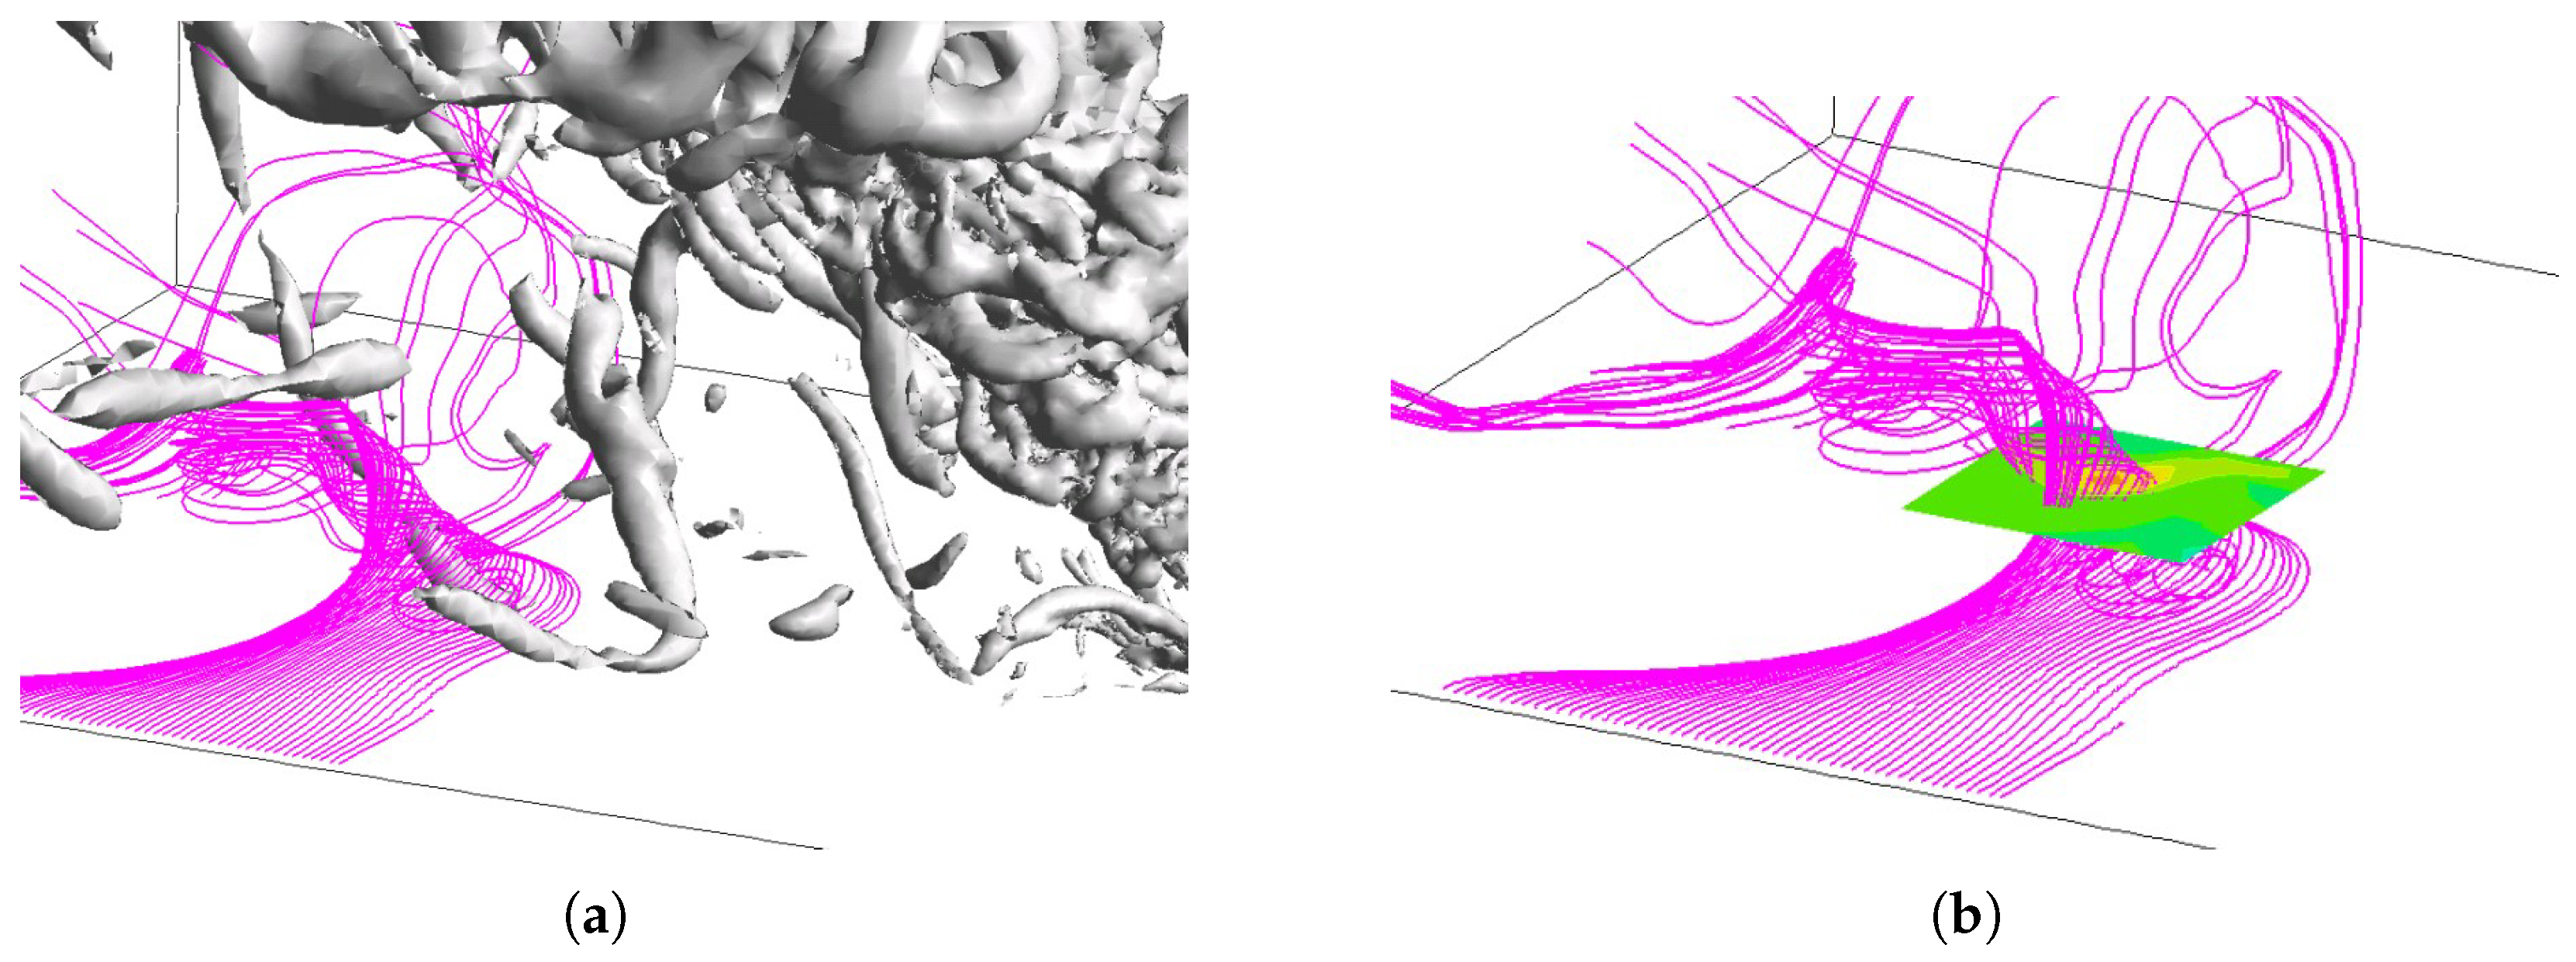
Figure 9a,b as well as
Figure 10a,b present similar data for the profile P5-3, with streamlines originating from the lateral boundaries, and reveal two distinct mechanisms of vertical structure formation for this velocity profile, the one characterized by the lowest velocity near the wall, resulting in the greatest lateral entrainment and reverse flow regions. It is important to note that these mechanisms were not observed in the profile P5-2.
In
Figure 9a,b, it can be observed that the lateral entrainment flowed toward the downwind region, very close to the plume, before reversing its direction to flow counter to the crosswind and merging with the additional reverse flow. This abrupt change in the direction of entrainment generated vortical regions that were once again stretched and connected to the lee side of the plume. The primary difference from the previously discussed mechanism lies in the source of the flow that formed the vortices and the flow characteristic responsible for their formation. In the earlier case, vortical regions emerged as the flow rolled due to interaction with the entrainment, whereas here, it was the abrupt change in the lateral flow’s direction caused by strong fire plume entrainment that led to vortex formation.
Differently,
Figure 10a,b illustrate a formation mechanism similar to that previously described, where the lateral entrainment flowed toward the downwind region of the plume and interacted with local areas of differing x-velocity, as seen in
Figure 6c. In this case, the streamlines began to roll up, generating vortical regions. However, the key difference is that this process occurred further downstream from the fire. This mechanism resembles the one presented by Shinohara and Matsushima, where vertical vortices form at the rim of the V-shaped area downwind of a flame in the absence of crossflow [
22]. The strength of these vortices was weaker than that of those formed closer to the fire and did not necessarily connect to the plume.
3.2. Influence of Terrain Slope
In this subsection, the influence of the terrain slope on the fire plume structure and on the development of vertical structures is investigated. Three different slopes (both upslope and downslope) are considered—0°, 10°, and 20°—considering the P5-1 velocity profile. Numerically, the slope was allocated by the prescription of the gravity vector.
Figure 11a–c show the side views of the instantaneous temperature volume rendering for the upslopes 0°, 10°, and 20°, respectively.
Figure 12a–c present similar results but for the downslope configuration.
An immediate impact of the terrain slope was the inclination of the fire plume. As can be seen in
Figure 11, an increase in the upslope angle of the terrain resulted in an increased fire plume tilt angle. This behaviour was primarily driven by the Coanda effect, which induced the plume to be more inclined to the floor immediately downstream of the fire source. In fact, as the terrain slope increased, a windward buoyancy force was generated, in addition to the wind force, that further amplified the Coanda effect, resulting in the plume being more closely aligned with the floor. The opposite effect is verified in
Figure 12, which shows that an increase in the downslope angle resulted in a decrease in the angle of inclination of the fire plume. More concretely, the fire plume inclination shifted from 49° to 58° and 62° when the upslope shifted from 0° to 10° and 20° and from 49° to 41° and 35° for the same variations in the downslope configuration. These results are in agreement with theory and previous investigations [
47,
48].
As before, this variation in the fire plume inclination with the slope of the terrain affected the entrainment process close to the wall. To illustrate this,
Figure 13a–c present the velocity vectors and iso-contours of the velocity in the main crosswind direction in the near-wall region for the 20° downslope, 0° (flat terrain), and 20° upslope cases, respectively.
Figure 13d–f show the same cases but in a transverse plane located in the middle of the fireline.
It should be noted that the upslope configuration decreased the lateral entrainment by continuity close to the end of the computational domain. However, as there was an increase in the downslope terrain angle, the lateral entrainment of ambient air started to occur earlier and a small reverse flow region close to the flame started to appear. As discussed before, these flow characteristics are favourable for the creation of vertical vortical structures. For the 20° downslope case, only the formation mechanism shown in
Figure 10—which generated weak structures not connected to the plume—was noticeable.
4. Conclusions
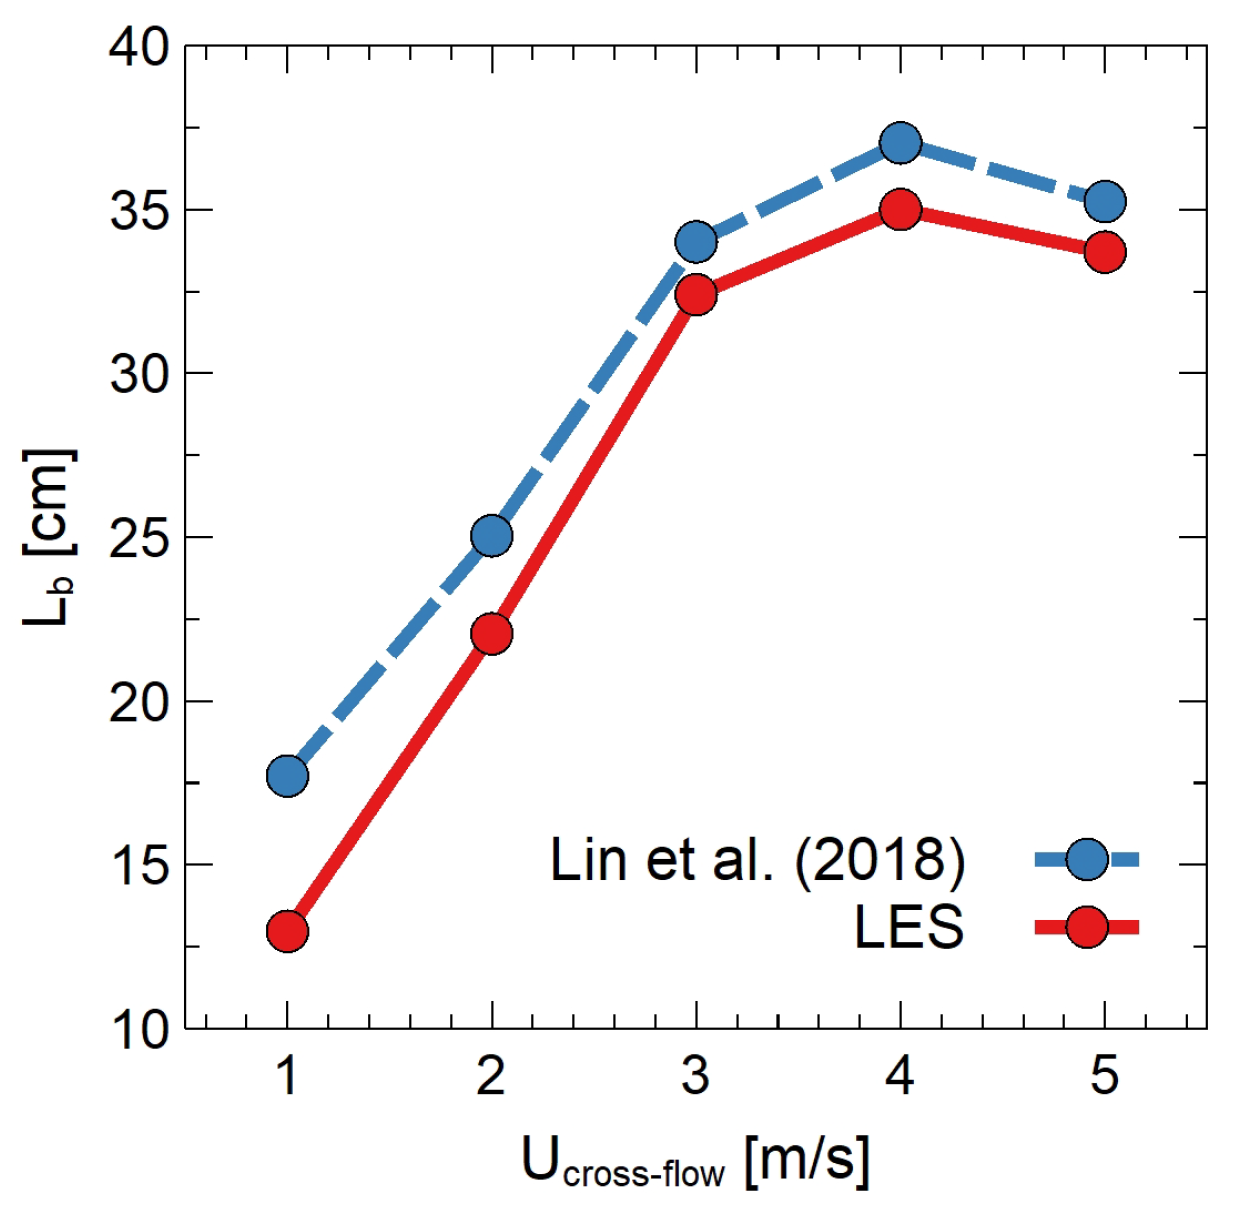
In this work, the influence of crosswind and terrain characteristics on the near-fire region of fire plumes from massive fires was studied numerically using Large Eddy Simulations (LES). The case of a purely buoyant diffusion propane flame subject to crossflows was analysed to validate the numerical model. LES effectively captured the trend of the evolution of the flame base extent with the crossflow velocity.
The behaviour of the fire plume and the formation of vortical structures were found to be significantly influenced by the wind’s intensity and vertical distribution; the friction velocity ranged from 0 to for an average velocity of and from 0 to for an average velocity of . Only at relatively low average wind velocities did significant lateral entrainment occur, promoting the development of vertical vortices. These structures were more prone to appear when the wind profiles exhibited low near-wall momentum (higher friction velocity), often observed in regions with large vegetation. In such conditions, different mechanisms for vortex formation could be verified, such as the roll-up of the crosswind coming from the inlet and the reversed direction of the lateral entrainment flow. In contrast, a higher near-wall wind momentum suppressed these entrainment processes, increasing plume inclination (up to ) and reducing the prevalence of vortical structures. Future investigation could target the impact of lower wind velocities (with low near-wall momentum) on the development of vertical vortices. Smoke dispersion patterns also varied, with low near-wall wind momentum leading to greater vertical dispersion, while higher momentum enhanced horizontal propagation.
The slope of the terrain (from to ) further modulated the dynamics of the fire plume by altering the tilt angle of the plume and the entrainment characteristics. The downslope configurations reduced the inclination of the plume (up to ) and facilitated stronger lateral entrainment, creating favourable conditions for the formation of vertical vortices. In contrast, upslope terrains amplified plume inclination (up to ) and suppressed lateral entrainment, limiting vortex formation. Future research could explore the impact of steeper downslope terrains on the vortex formation and its influence on fire spread dynamics.
In summary, this study highlights the complex relation between wind profiles, terrain slopes, and fire dynamics in shaping fire plume behaviour, near-fire turbulence, and smoke dispersion patterns. The findings highlight the critical role of topography—terrain-induced effects combined with variations in wind profiles—on plumes’ entrainment and the formation of vertical structures that generate powerful updrafts capable of lifting burning debris, thereby contributing to fire spread. These insights provide valuable implications for fire–atmosphere coupled modelling and enhance fire behaviour prediction, which is increasingly critical as the risk of wildfires continues to grow.


