3.1. Burning Duration and Self-Extinguish Phenomenon
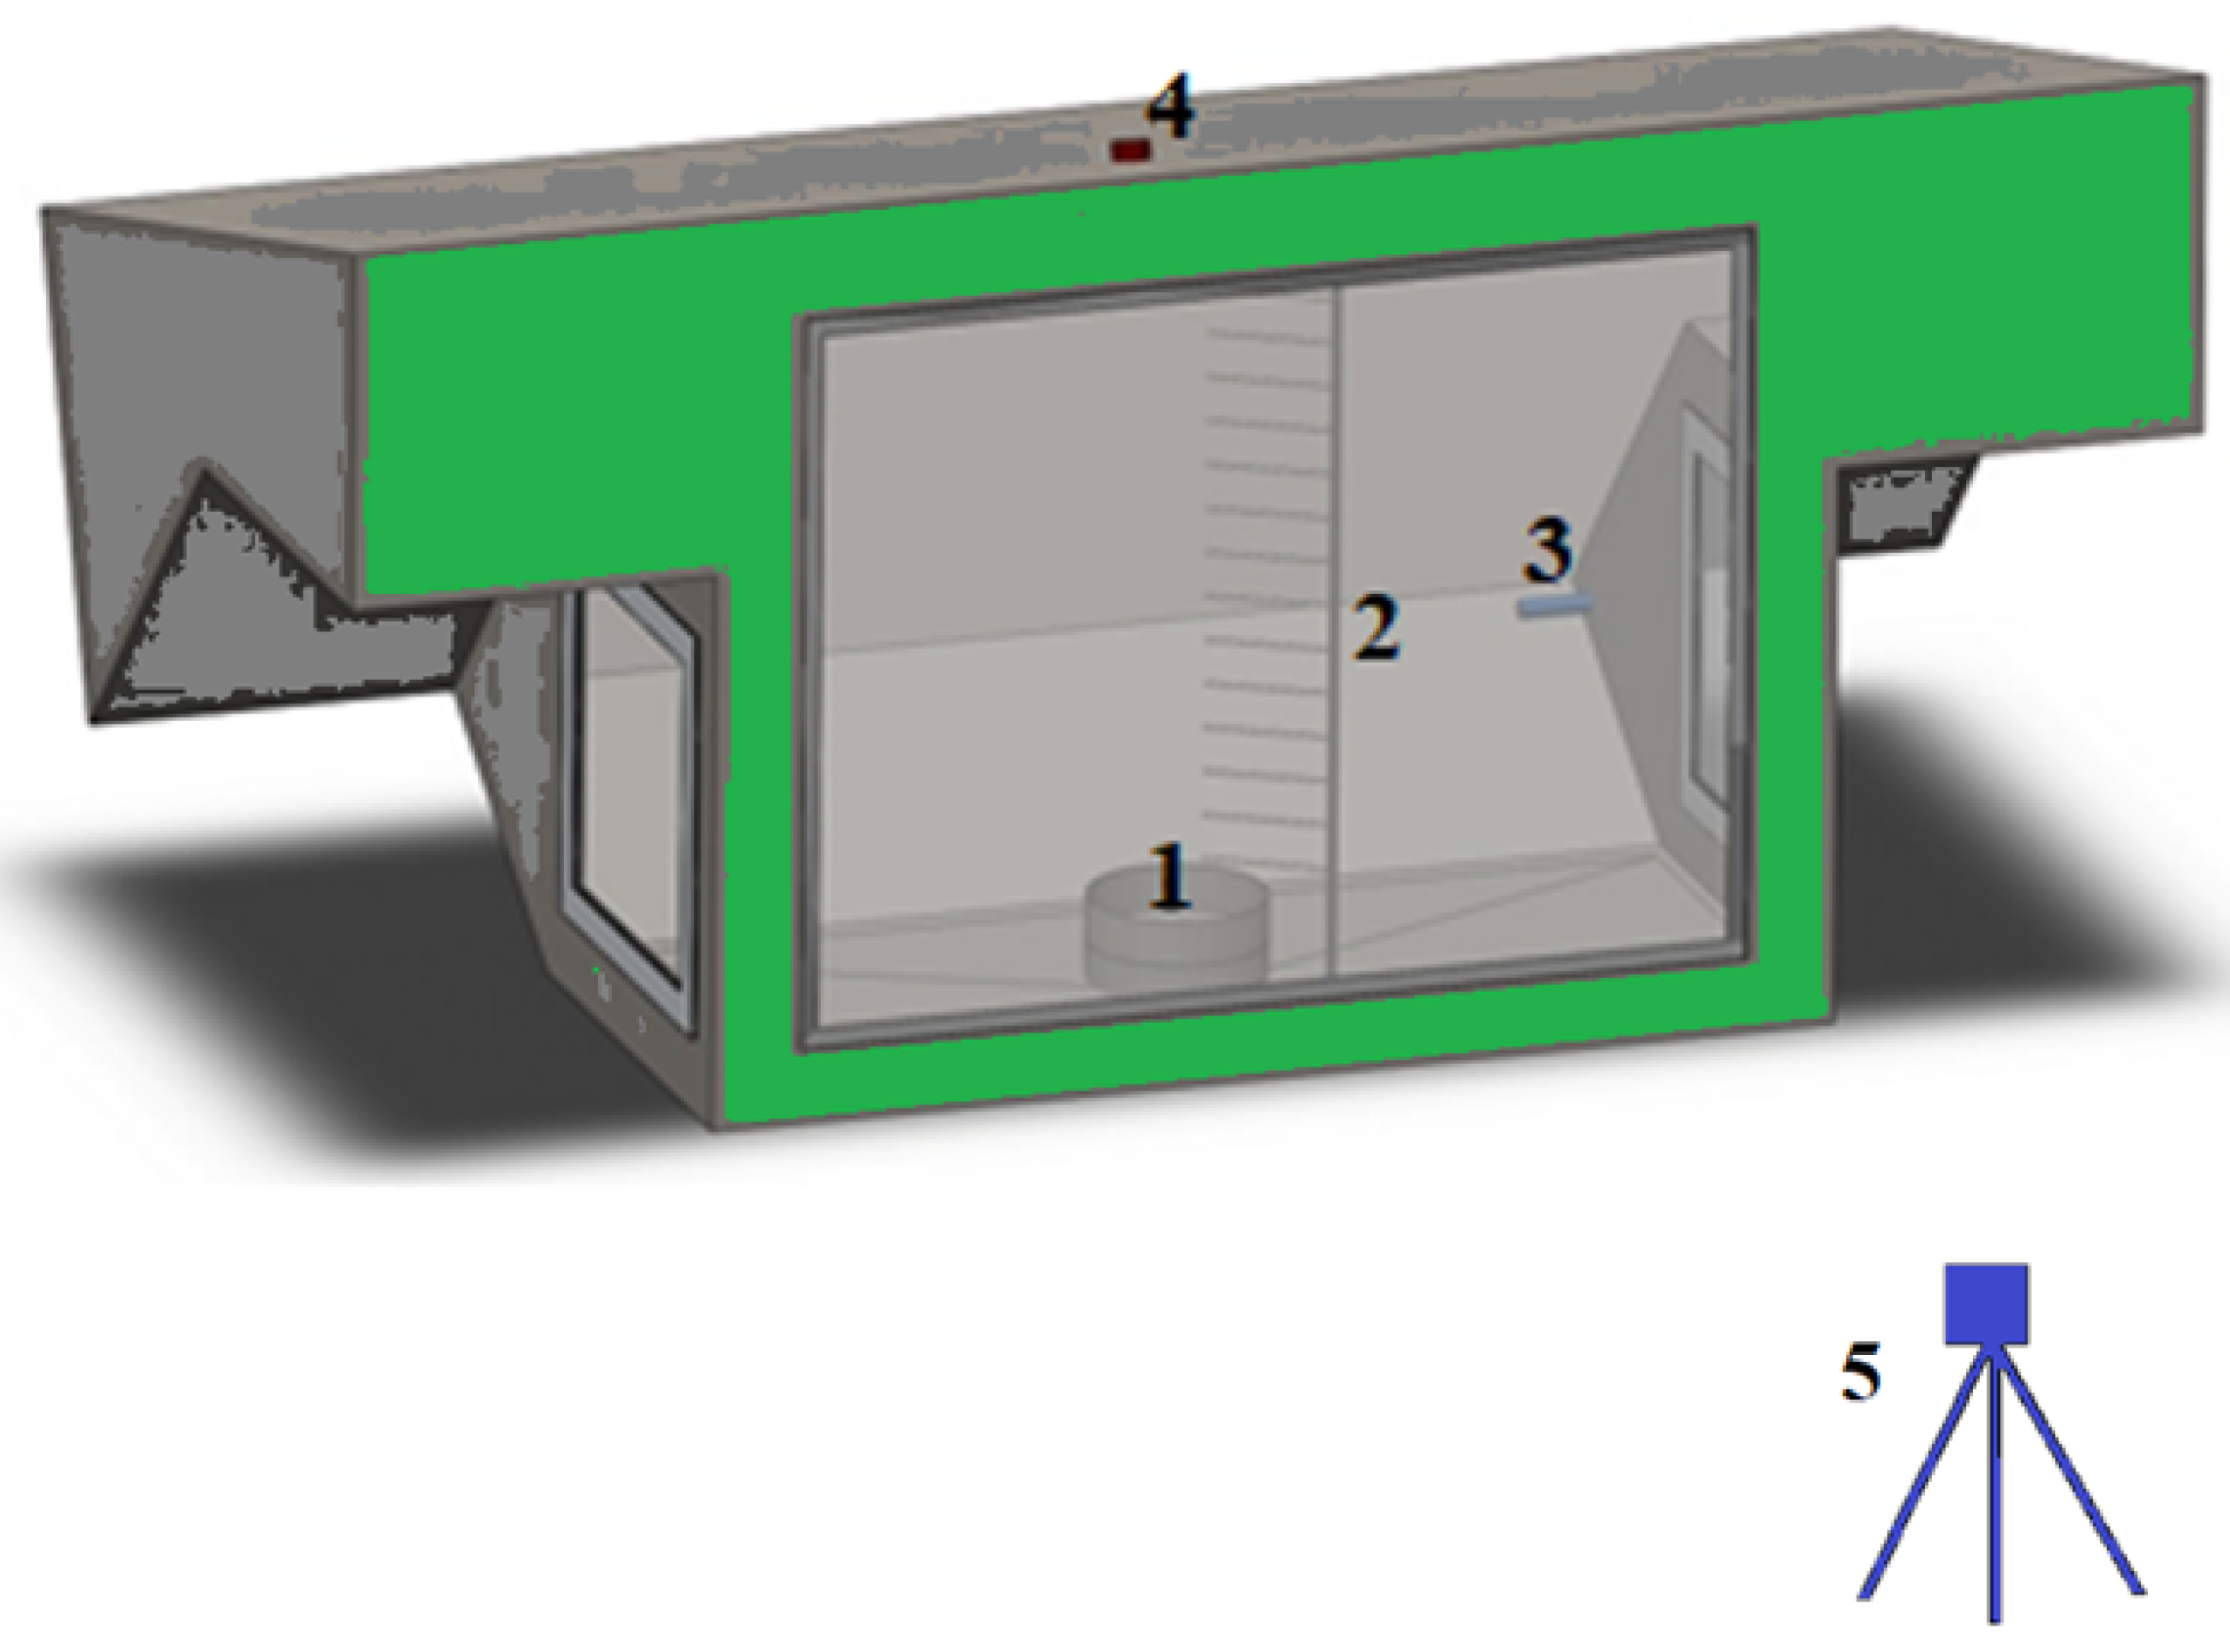
Table 1 summarizes the experimental parameters, including pan dimensions, fuel type, and measurement setup, to investigate fire size effects in a well-confined environment. We tested two scenarios for either an 8 or 16 cm diameter pan. For the 8 cm diameter pan, burning durations were 125 s (5 g initial mass) and 1336 s (57 g initial mass), with complete fuel burnout in both cases. For the 16 cm diameter pan, burning durations were 127 s (25 g initial mass) with complete fuel burnout and 310 s (150 g initial mass), leaving 84 g of unburned fuel, indicating partial consumption.
Similarly, for the 24 cm diameter pan, the initial mass was 90 g, and after the fire was extinguished, about 15 g of fuel remained. The burning duration varied between 135 and 145 s for this case. Interestingly, the self-extinguishing phenomenon occurred faster than with the 16 cm diameter pan, taking approximately 135–145 s, suggesting that the fire was extinguished more rapidly in this case. The self-extinguishing phenomenon observed in the experiment is intriguing and has potential practical applications. When properly managed, it may be utilized to prevent fire from spreading to other compartments or rooms by closing off the affected compartment. Further comparisons of self-extinguishing phenomena with broader research findings on confined fires could enhance the understanding of fire dynamics in such environments. For example, the observed self-extinguishment at oxygen concentrations of 15–16.1% aligns with general trends reported for oxygen-deprived environments but differs from extinction thresholds for other fuels or ventilation conditions, as will be discussed in more detail in the next paragraph. These variations underscore the need to contextualize the results within a wider body of knowledge, such as the general oxygen-limited behavior of pool fires across different compartment scales [
3,
31].
According to work by Beyler [
32], the extinguishment of a fire in a compartment occurs when the Limiting Oxygen Index (LOI) is reached. The LOI is a measure used to determine the minimum concentration of oxygen in the surrounding atmosphere required to sustain combustion of a material. For heptane pool fires in a closed compartment environment, as shown by Zhang et al. [
31], the LOI is typically around 10.7–15.3%. This means that for a heptane pool fire to sustain combustion, the oxygen concentration in the surrounding air must be at least 10.7–15.3%. If the oxygen concentration falls below this threshold, the fire will be starved of oxygen and will self-extinguish. In this case, we found that the minimum oxygen level when the fire experienced self-extinguishing was 15% for the 24 cm diameter pan and 16.1% for the 16 cm diameter pan. The discrepancy between the observed minimum oxygen concentrations during self-extinguishing and the typical LOI for heptane pool fires can be attributed to the position of the gas analyzer probe in our experiments. These findings suggest that oxygen distribution within a confined compartment is not uniform, with localized depletion near the flame playing a critical role in combustion behavior. This highlights the need for future studies to include multiple probe placements for more accurate oxygen profiling. Placing the gas analyzer probe on the side of the compartment adjacent to the side window likely measured the average oxygen concentration in the compartment rather than the oxygen concentration directly around the fire source. The average oxygen concentration may differ from the local oxygen concentration near the fire; this can explain why the observed self-extinguishing time occurred before reaching the typical LOI for a heptane fire.
To predict the self-extinguishing time, disregarding any leakage effects, Equation (
1) can be used. For the constant heat release rate, the equation can be simplified to become Equation (
2) [
31,
32]:
Based on Equation (
2), it can be observed that the extinction time is proportional to the ratio of volume to the heat release rate (
). Here,
D represents the pan’s diameter, the heat release rate (
) is a function of the pan size area in a pool fire, and the pan area is proportional to
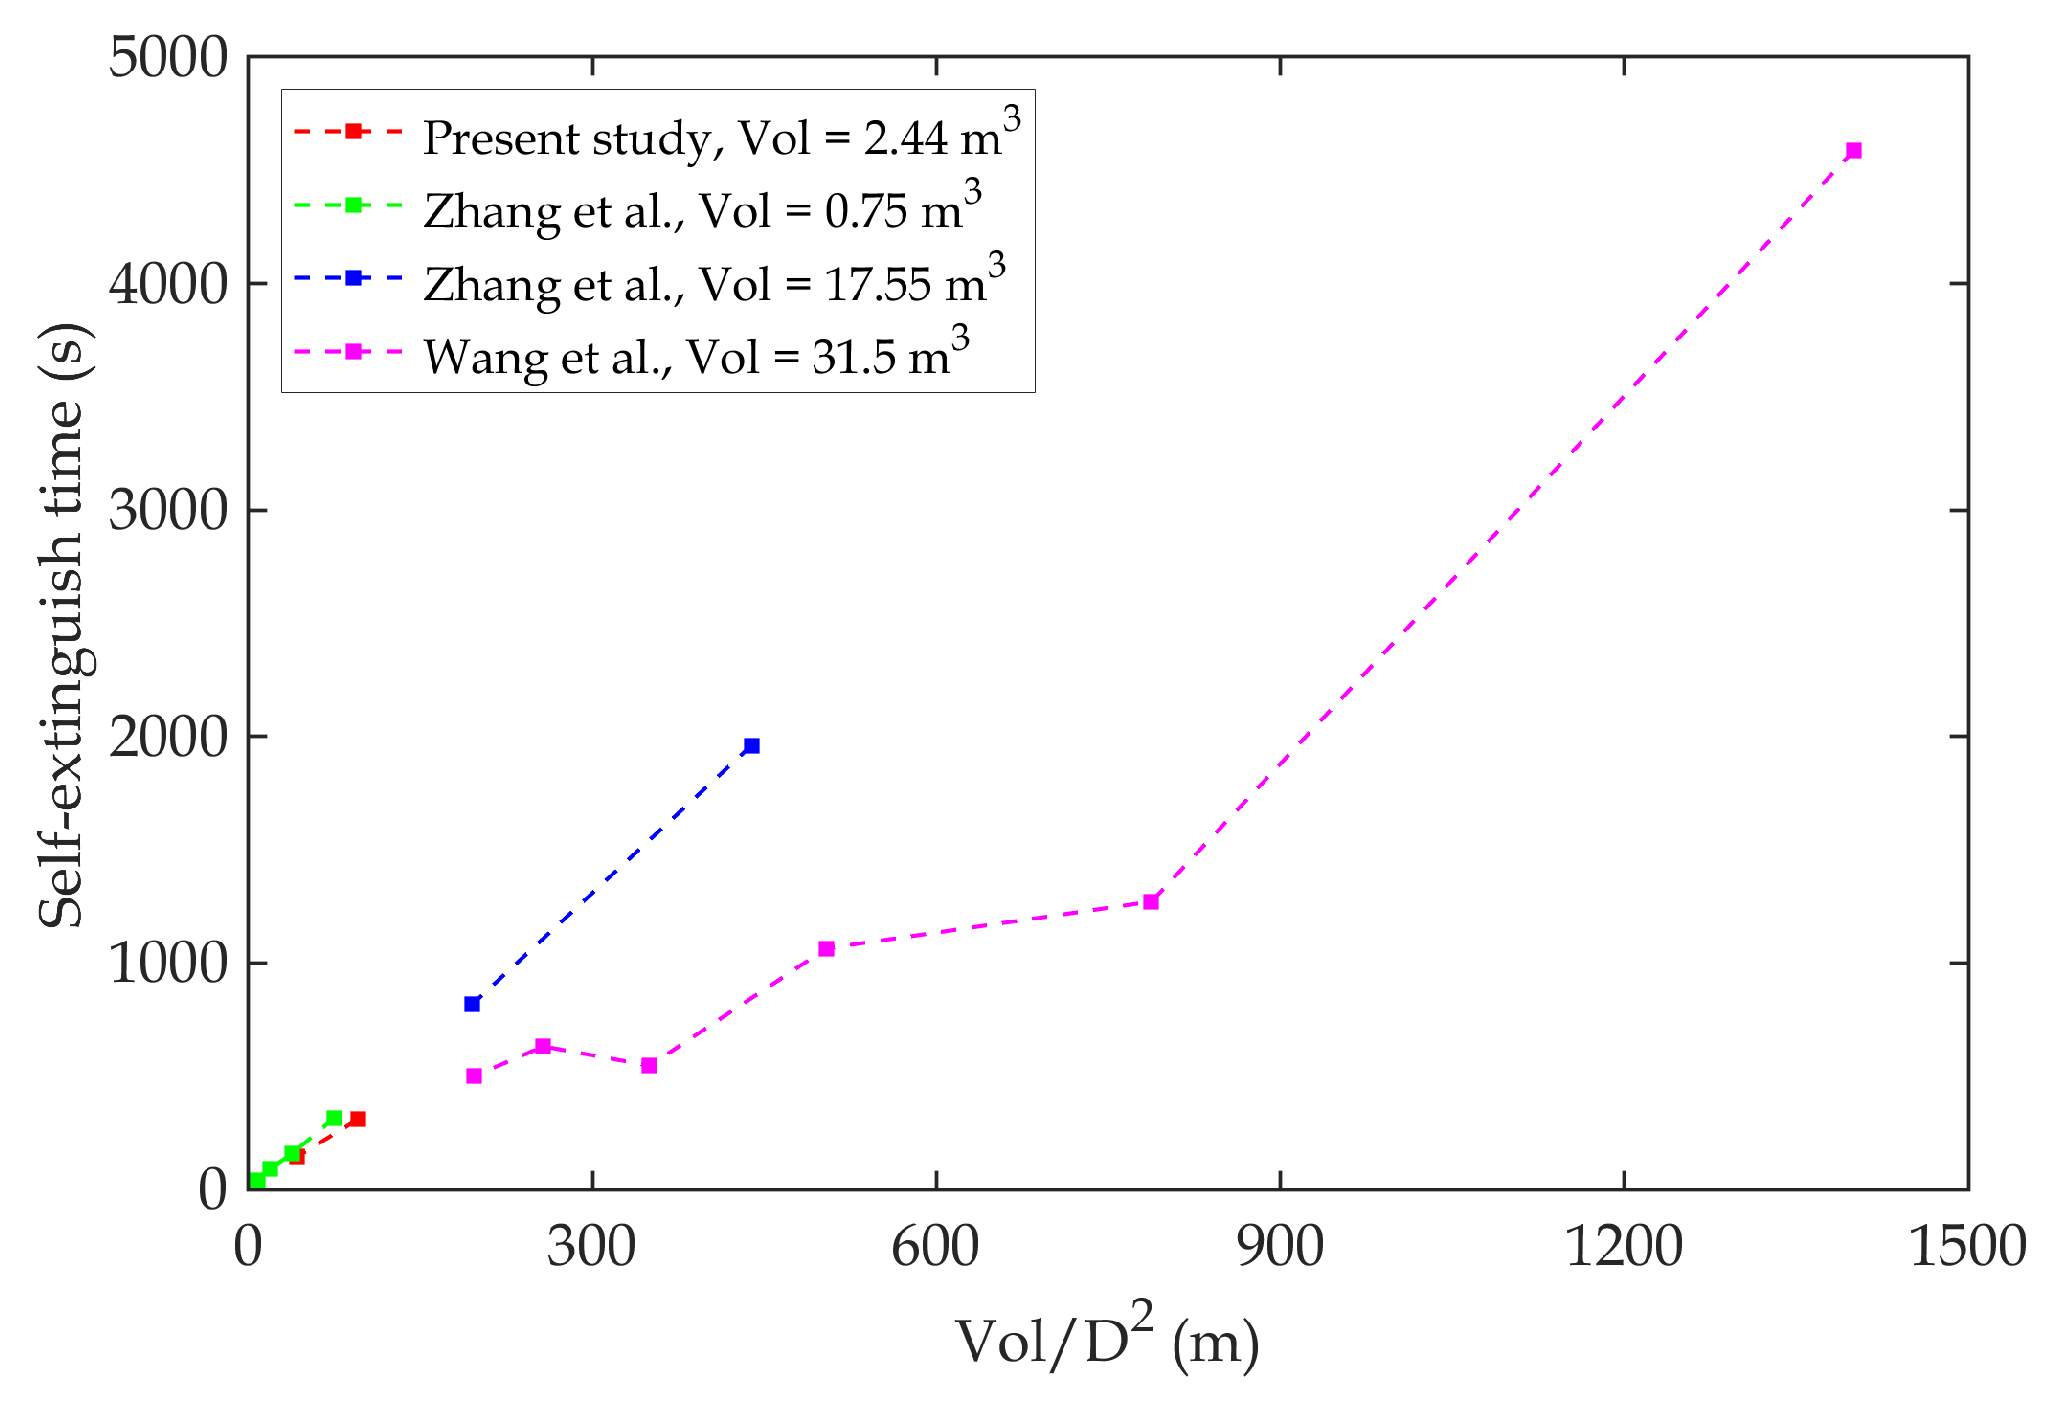
in the circular pan. Therefore, Zhang et al. [
31] employed the
ratio to derive their empirical formula for estimating the self-extinguish time. In their case, they found that
.
Figure 4 demonstrates that the present study is comparable to the study in the literature. This comparison further reinforces the validity of the empirical formula proposed by Zhang et al. for predicting self-extinguishment time. In addition to the findings of Zhang et al., the results of Wang et al. [
3] indicate faster extinguishment times for comparable compartments but with larger overall volumes. This trend is consistent with broader observations in the fire safety literature, which suggest that increased compartment sizes and ventilation conditions often accelerate oxygen depletion. Placing these results in a broader context highlights the importance of considering how varying compartment dimensions influence oxygen dynamics and fire behavior across studies.
The primary focus of this study is to evaluate the effect of fire size using pan diameters of 8 cm, 16 cm, and 24 cm. For clarity, in the next section, we will only compare the initial masses of 5 g (8 cm pan diameter), 25 g (16 cm pan diameter), and 90 g (24 cm pan diameter) of heptane, as they have nearly similar burning durations. The cases with initial masses of 57 g (for an 8 cm pan diameter) and 150 g (for a 16 cm pan diameter), with initial fuel thicknesses of about 16.5 mm and 10 mm, respectively, will only be discussed in this section as they may deepen the understanding of the self-extinguishing phenomenon. However, the effect of initial fuel thickness is not within the scope of our study.
3.2. Mass Loss and Heat Release Rates
The heat release rate (HRR) and mass loss rate (MLR) are key properties in pool fire research, with HRR reflecting the energy release rate during combustion and MLR indicating fuel consumption. In this study, varying the fire size through pan diameter showed that the HRR is directly proportional to pan area, influencing oxygen consumption and self-extinguishment time.
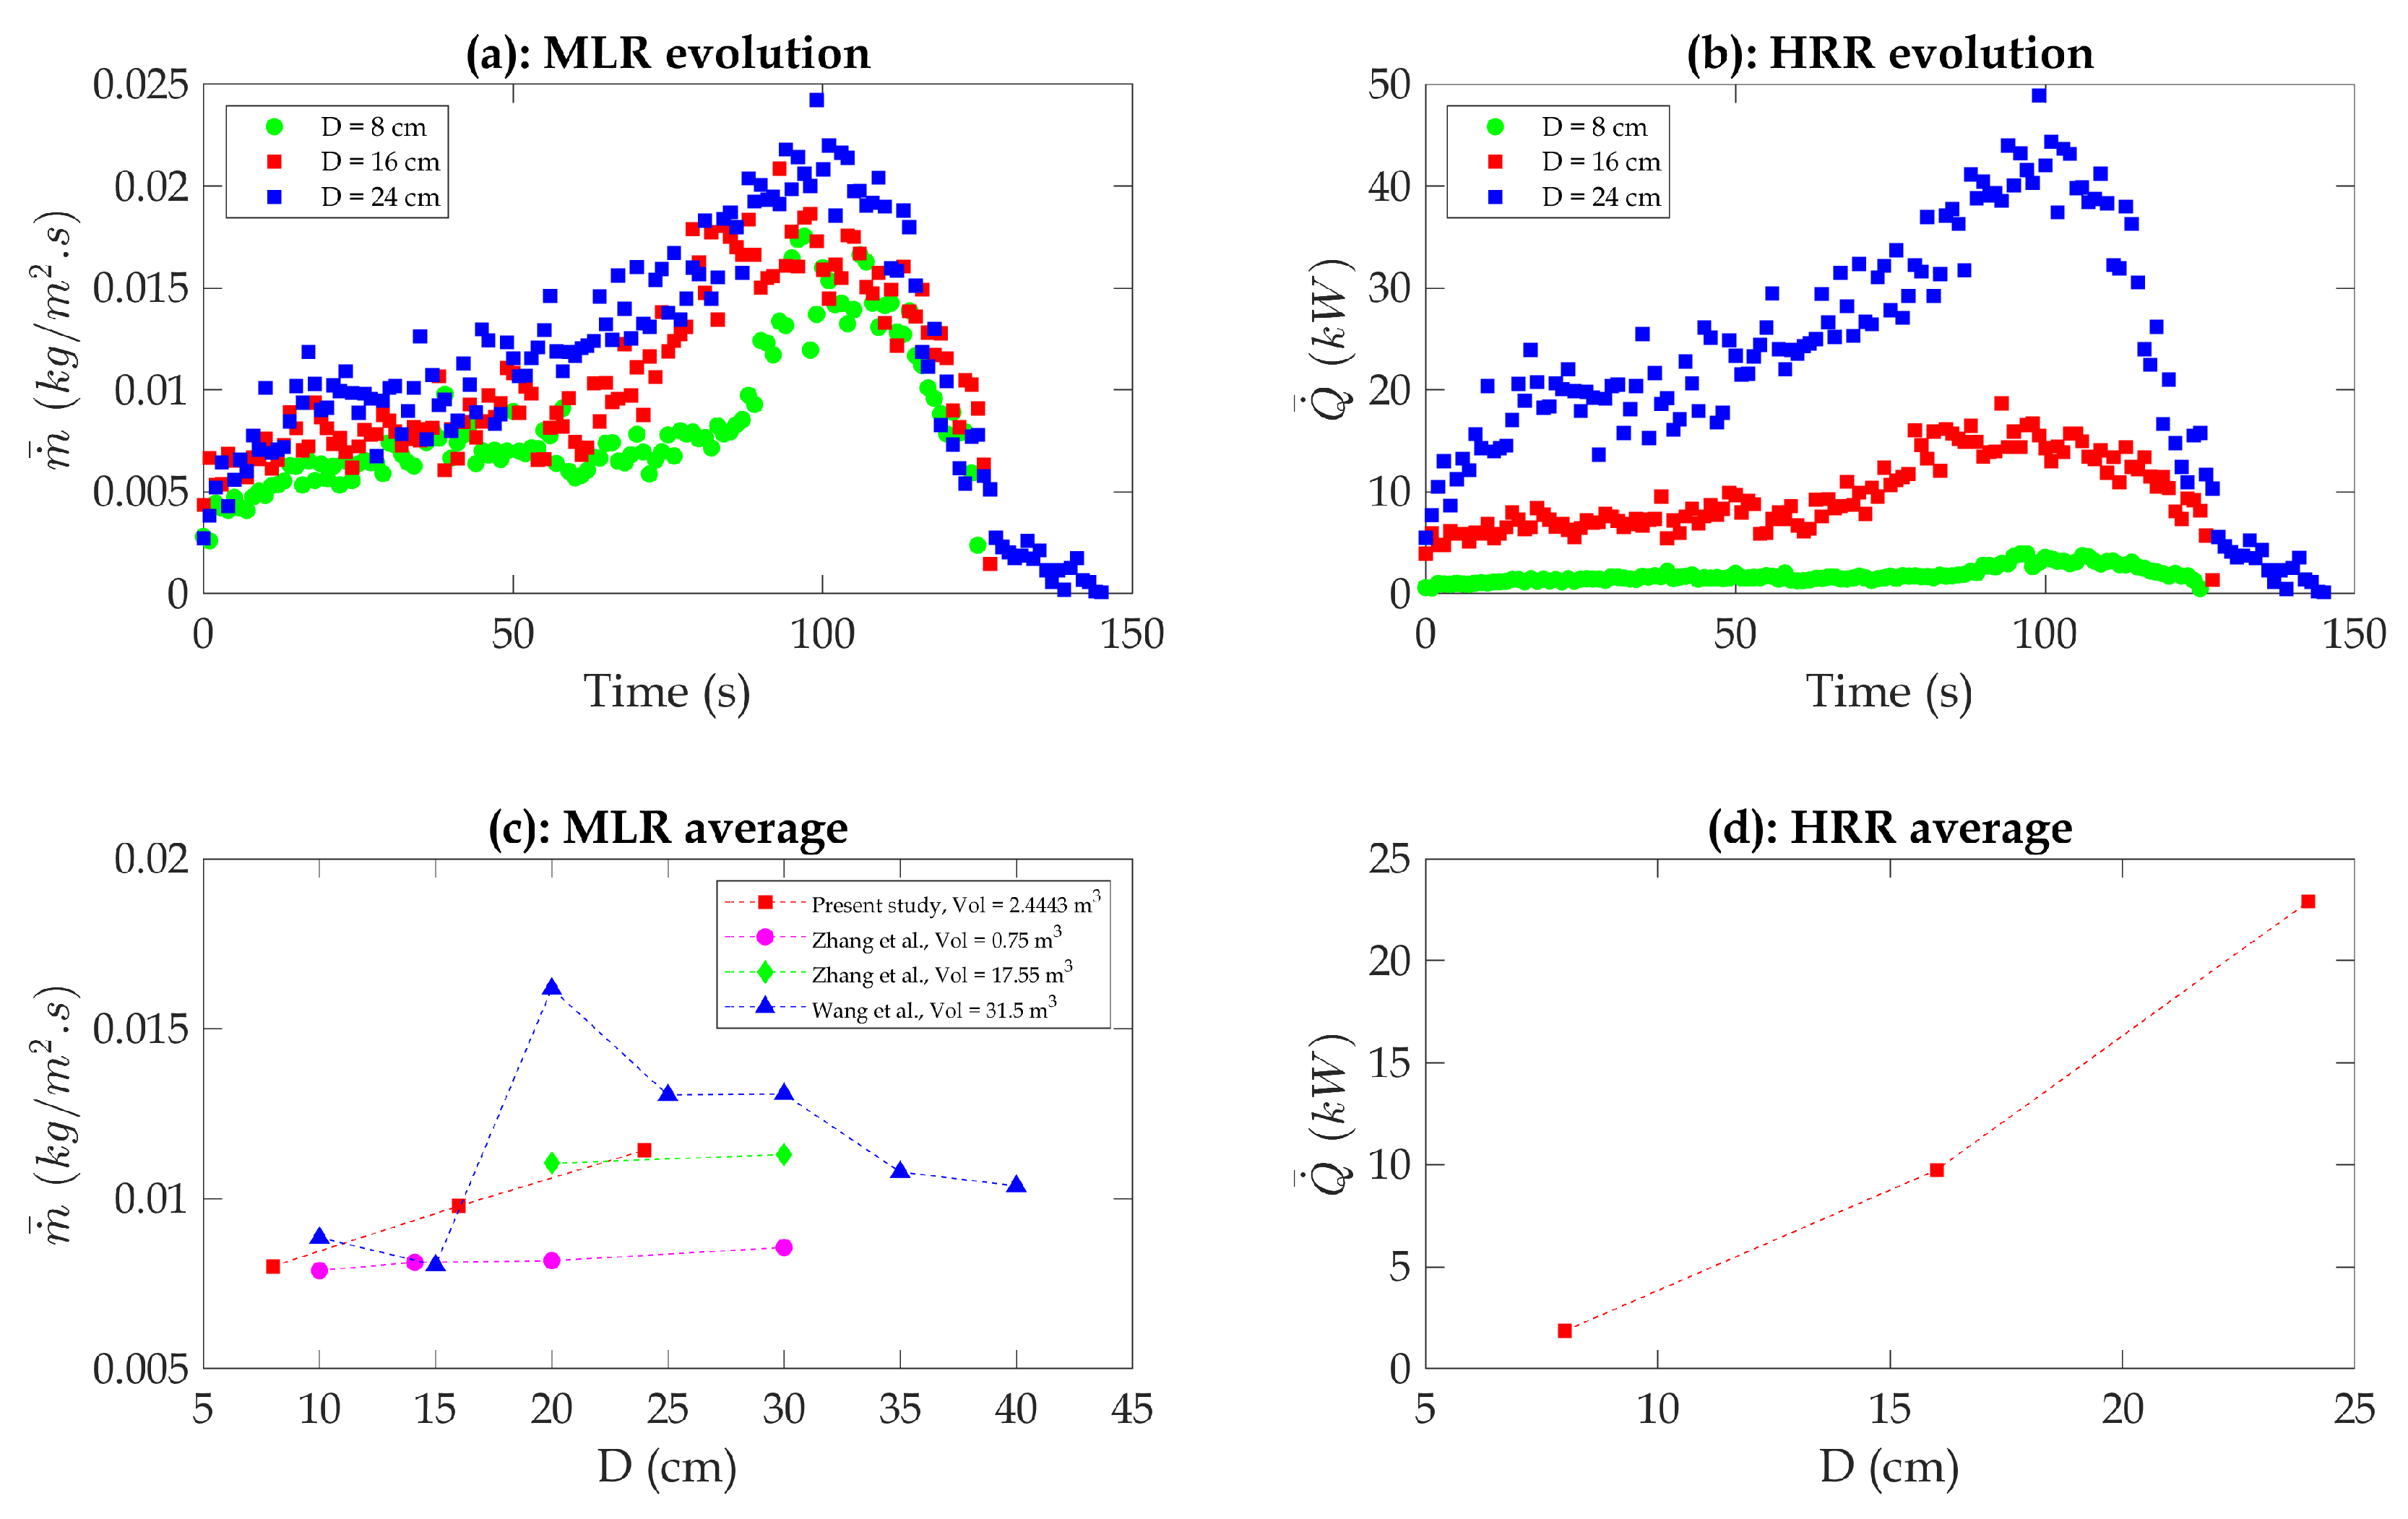
Figure 5 illustrates the increase in HRR and MLR with larger pan diameters. These observed trends can be better understood by considering the underlying mechanisms and factors that influence these phenomena. One significant factor contributing to the increase in mass loss rate with an increase in pan diameter is the larger surface area of the pan. As the diameter increases, the larger pan surface area exposes more fuel to the fire, leading to enhanced combustion and increased mass loss. Additionally, a larger pan diameter allows more oxygen to be supplied for combustion, thus facilitating a higher mass loss rate. The availability of oxygen is vital for sustaining the combustion process and, subsequently, influencing the mass loss rate [
33,
34]. Consequently, the observed increase in both heat release rate and mass loss rate with an increase in pan diameter aligns with expectations. In the well-confined enclosure examined in the present study, the results are consistent with those of Zhang et al. [
31], showing an increase in mass loss rate with an increase in pan diameter, regardless of whether the compartment volume is 0.75
or 17.55
. These findings suggest that the pan diameter notably affects the mass loss rate in a well-confined compartment, similar to what we found in an open-space fire, where the pan diameter affects the mass loss rate. Comparing the present results with those of Wang et al. [
3], the mass loss rate values are initially comparable or similar to the present study and Zhang et al. However, with a 20 cm diameter pan, Wang et al. observed a significant sudden increase in the mass loss rate. Subsequently, the mass loss rate decreased with further increases in pan diameter [
3,
31]. Several factors, including the initial conditions of combustion and the volume of the compartment, can contribute to the observed trends.
Table 2 shows that for the 8 cm pan diameter (reference diameter), the average HRR was 1.8 kW, and the mass loss rate was 0.008
. As the pan diameter increased to 16 cm, the average HRR demonstrated an increment of approximately 383%, reaching 8.7 kW (approximately a 0.05 kW/m
2 increase per 1 cm
2 increment in pan area), while the mass loss rate increased by about 23%, reaching 0.01
. Similarly, for the 24 cm pan diameter, the average HRR demonstrated an increment of approximately 1178%, reaching 23 kW (approximately a 0.05 kW/m
2 increase per 1 cm
2 increment in pan area), and the mass loss rate increased by about 44%, reaching 0.011
(approximately a 0.008
increase per 1 cm
2 increment in pan area). These findings further emphasize the influence of pan size on fire behavior and its associated heat release rate and mass loss rate.
3.3. Pressure Difference and Gas Concentration
Larger fires pose greater risks due to higher heat release rates, which increase heat flux, average compartment temperatures, and oxygen consumption, resulting in elevated pressure differences between the interior and exterior compartments [
35].
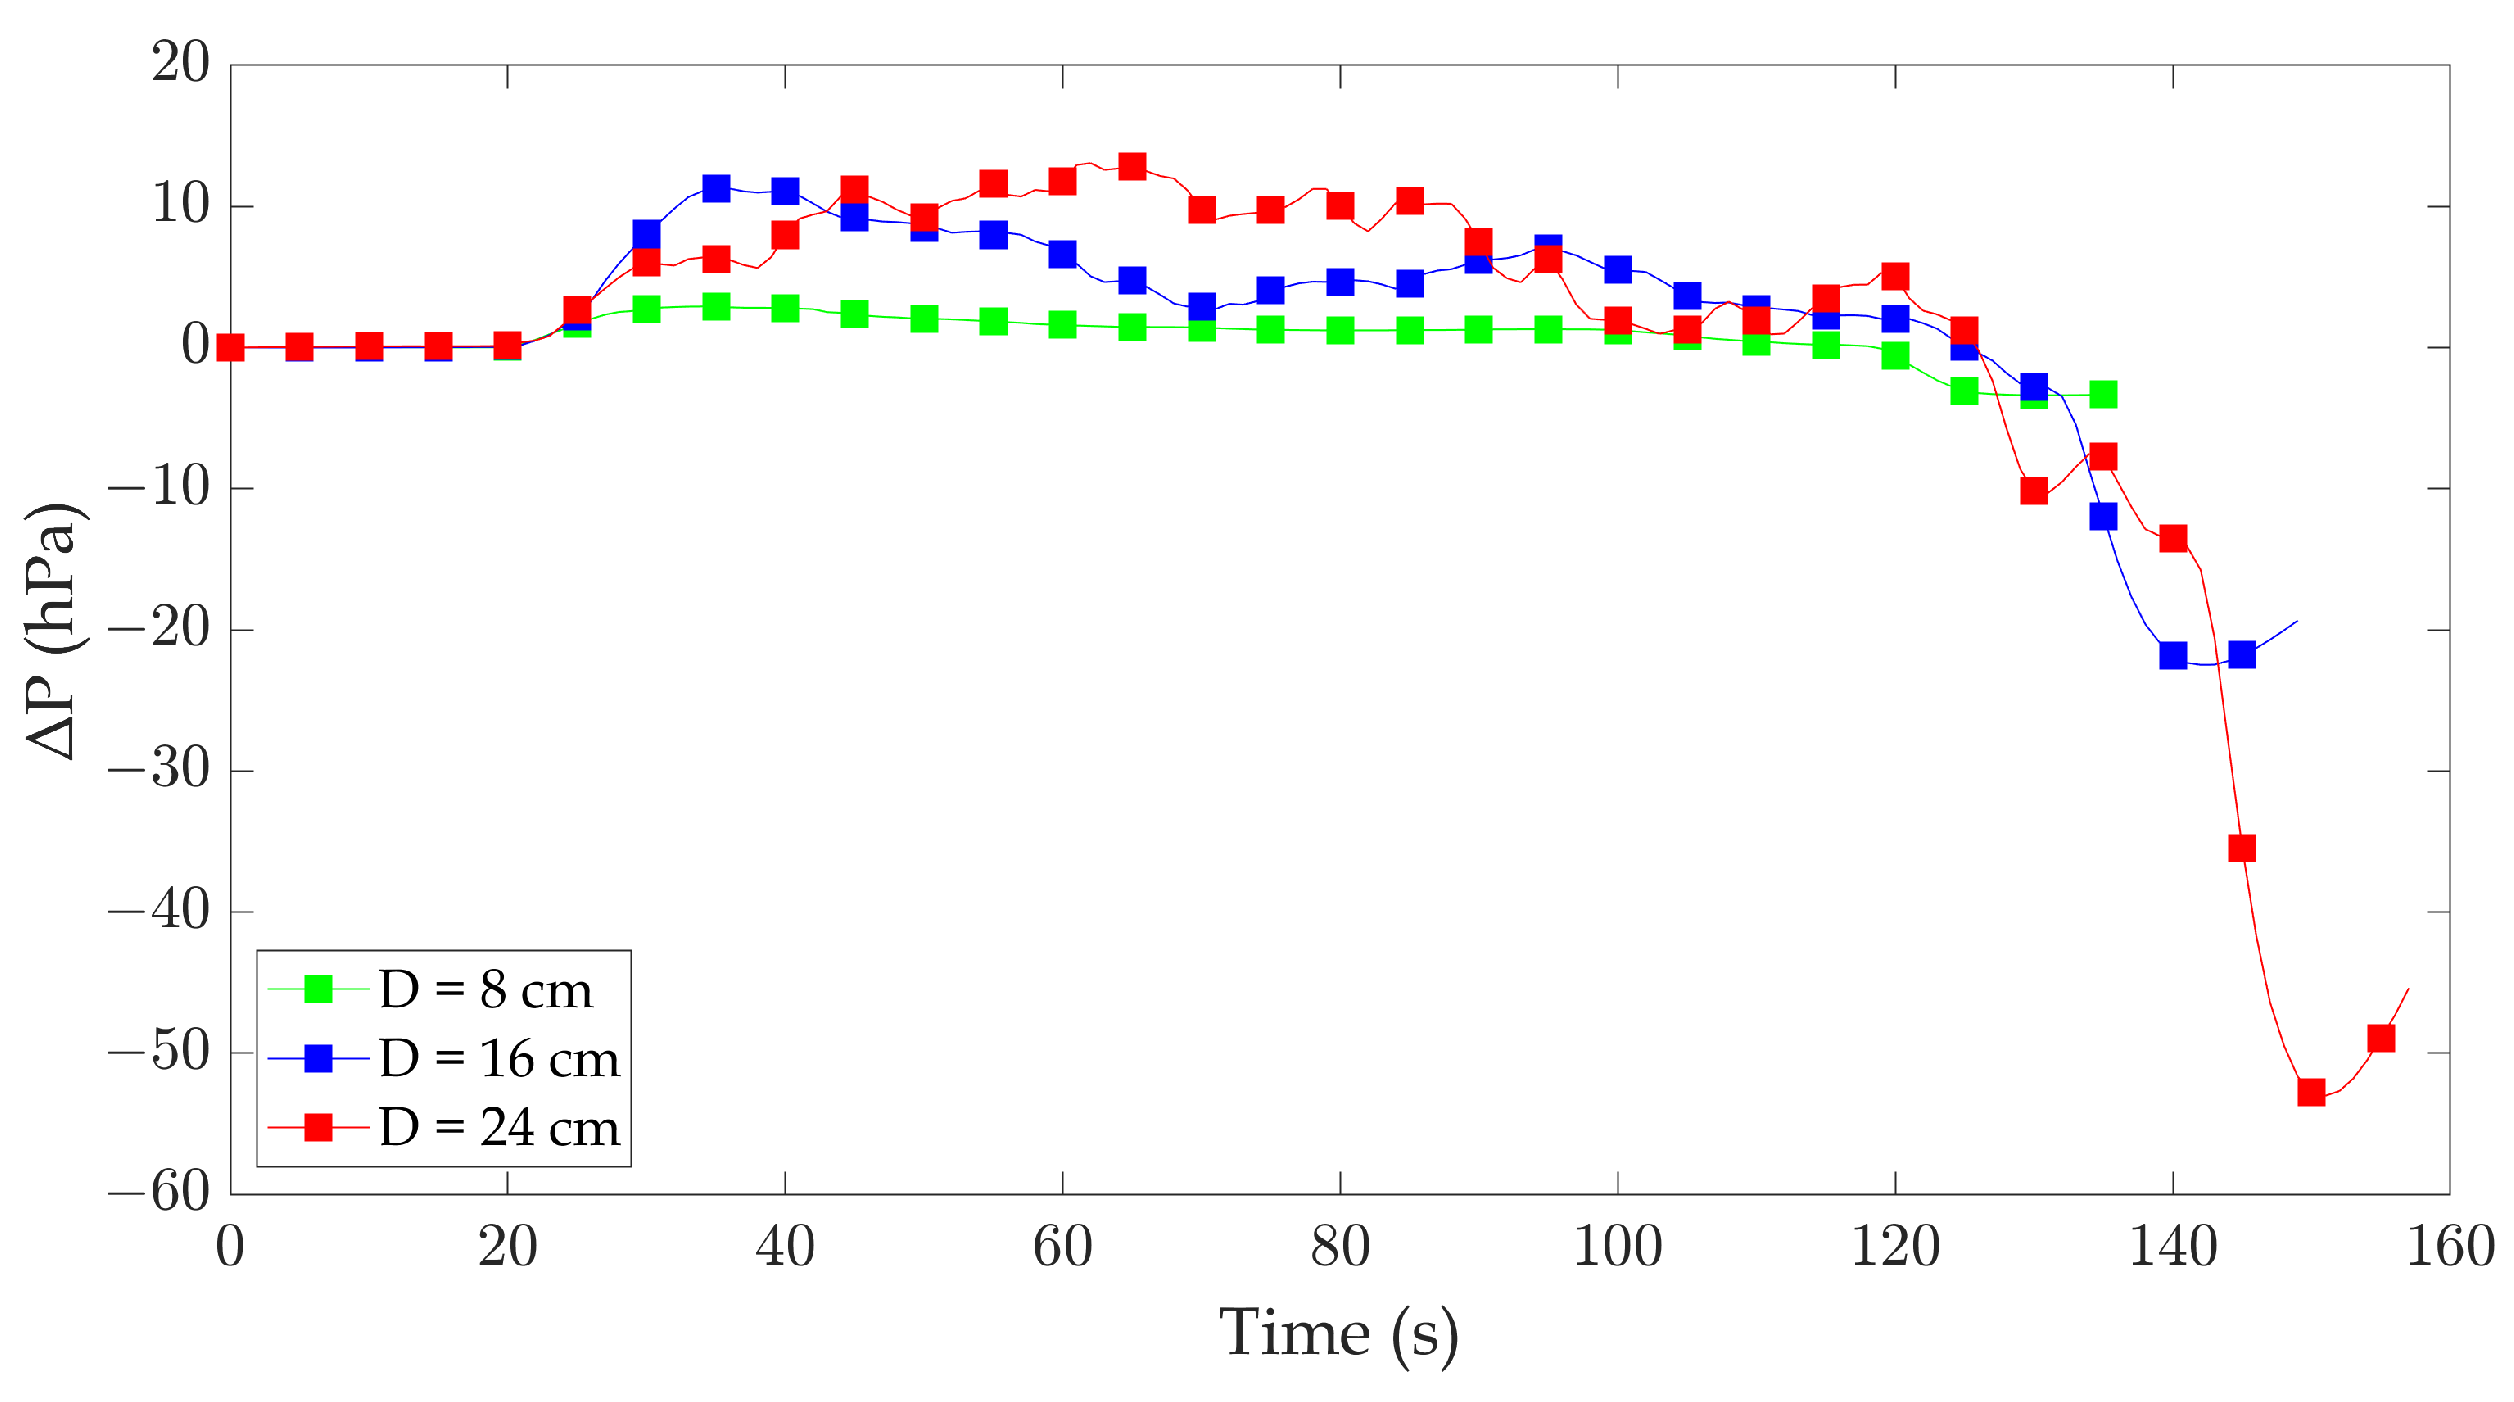
Figure 6 shows the pressure differences between the interior and exterior compartments for 8 cm, 16 cm, and 24 cm pans. Distinct patterns of pressure variations were observed for each pan diameter, revealing the compartment’s dynamic behavior during fire and extinguishment. For the 8 cm diameter pan, the pressure inside the compartment experiences a minor increase towards the outside of the compartment during the fire, approximately of about 2.9 hPa. However, upon extinguishment, the pressure drops to approximately 3.4 hPa less than the outside pressure. This indicates a relatively minimal pressure difference between the interior and exterior of the compartment after the fire has ceased.
In the case of the 16 cm diameter pan, the pressure inside the compartment increases by approximately 11.3 hPa when the fire occurs, reaching a peak pressure difference with the outside. After the fire is extinguished, the pressure drops by around 22.5 hPa, settling at a level significantly lower than the outside pressure. It suggests a more substantial pressure difference between the interior and exterior of the compartment following fire extinguishment compared to the 8 cm diameter pan. With the 24 cm diameter pan, the pressure inside the compartment increases during the fire, reaching a maximum pressure difference of approximately 13.1 hPa. Subsequently, upon fire extinguishment, the pressure experiences a significant drop of approximately 53 hPa, resulting in a notable pressure difference between the interior and exterior of the compartment.
The pressure fluctuations recorded during the experiments exceed those reported by Li et al. [
35] and Prétrel et al. [
36] for similar setups. Therefore, the phenomenon of increasing pressure during a fire followed by a decrease after fire extinguishment aligns with the thermal expansion and gas generation dynamics. When a fire occurs within a closed enclosure, the confinement restricts the airflow, leading to high expansion pressure. This pressure can surpass the pressure induced by the buoyancy of gases above the fire. Therefore, investigating pressure rises in closed enclosures during fires is critically important [
37,
38]. Pressure differences can also arise within the compartment, particularly between the top and bottom regions. Chen et al. [
39] discussed how the size of the fuel pool affects the pressure difference between the top and bottom of the compartment, with the increase in pool size resulting in a higher pressure difference. These pressure variations can potentially exert damaging forces on the compartment’s windows, particularly at higher heat release rates. In the present experiment, it is observed that the pressure difference after fire extinguishment is higher (pressure inside the compartment is much lower than outside the compartment) compared to the pressure difference during the fire (pressure inside the compartment is relatively higher than outside the compartment). It emphasizes the need for caution when approaching the test bench area after the fire has been extinguished. Overall, these findings underline the structural risks posed by larger fires in confined compartments. Designing pressure relief mechanisms or reinforced structures could mitigate these risks in practical applications.
Fire can generate various hazardous gases. Even though the engine compartment may not be occupied by any crew, personnel, or passengers, monitoring gas concentrations remains crucial as they can impact other fire properties. Therefore, including a gas analyzer is essential when investigating fires in closed enclosures. As previously mentioned, the oxygen concentration within the enclosure affects the burning duration, while the heat release rate directly influences the oxygen levels within the confined space.
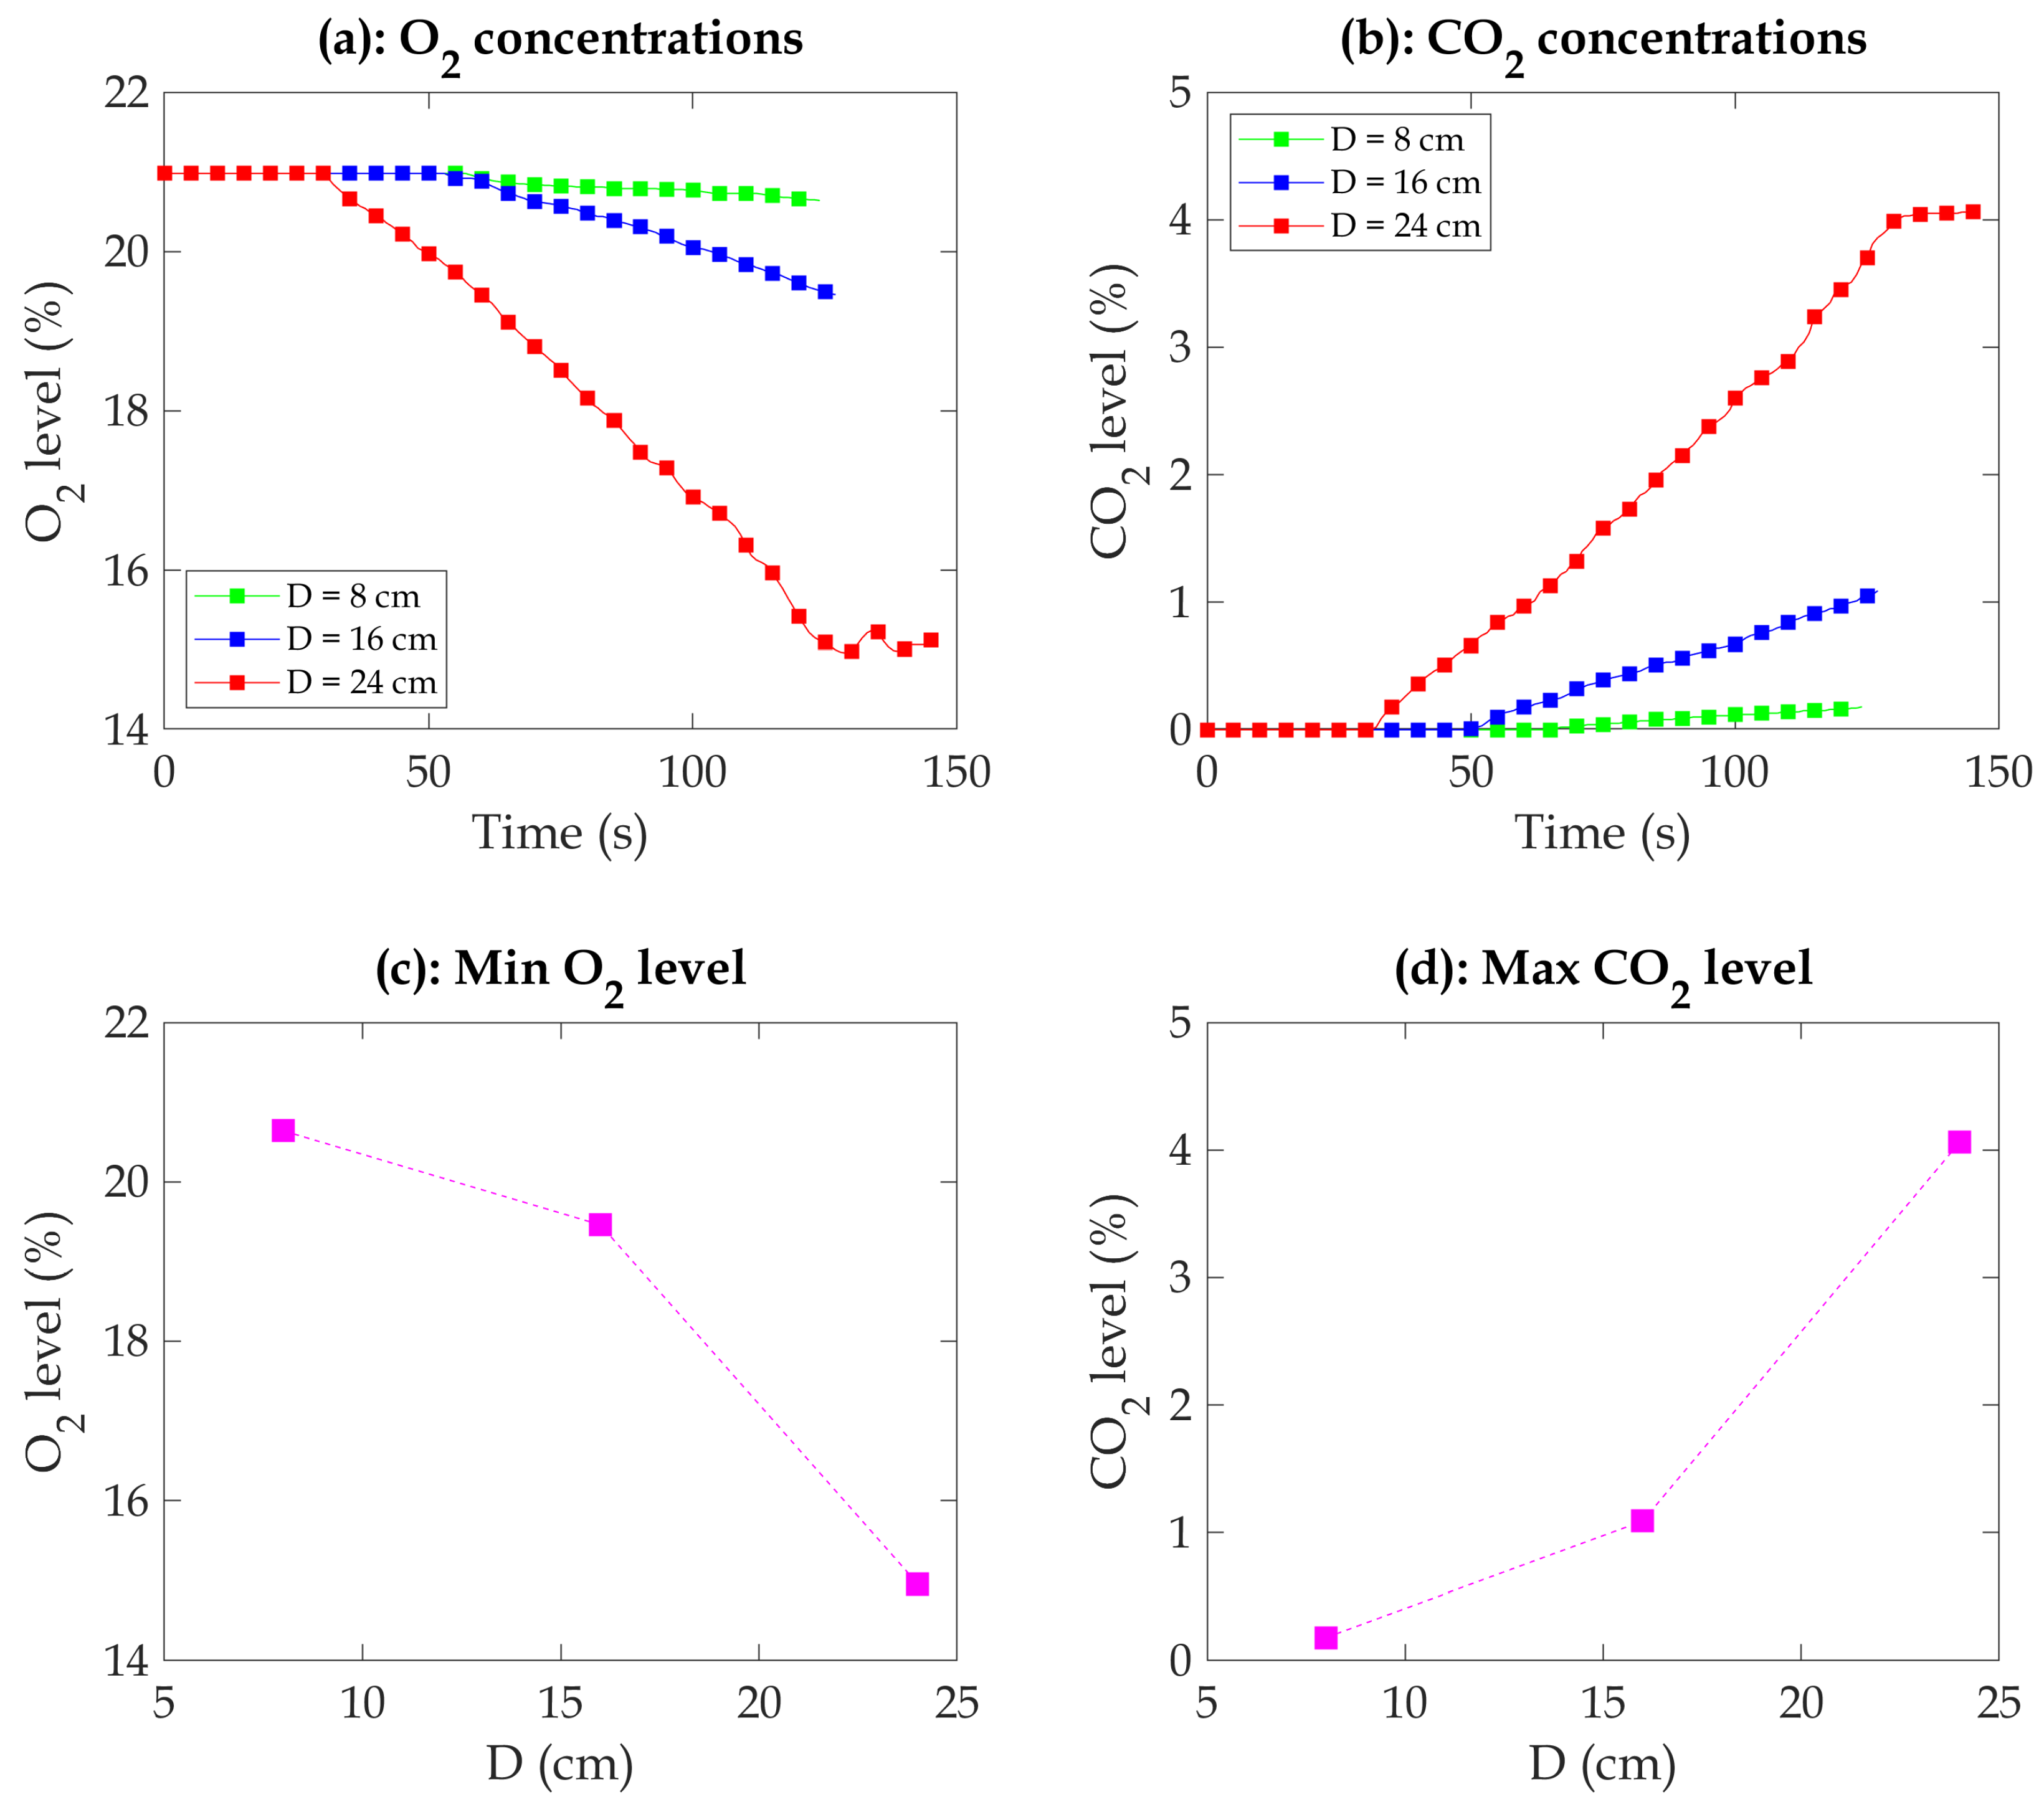
Figure 7 presents the temporal evolution of oxygen (O
2) and carbon dioxide (CO
2
) concentrations during the combustion process in a well-confined compartment. Data are shown for three different pan diameters (8 cm, 16 cm, and 24 cm), illustrating the relationship between fire size and gas concentration changes.
The relationship between fire size, oxygen consumption, and heat release rate (HRR) highlights critical dynamics in confined fires. As the burning duration increases, oxygen (
) concentration within the compartment decreases due to combustion (see
Figure 7). This effect is amplified in larger fires, where the increased fuel surface area promotes greater oxygen demand. The confined nature of the compartment further intensifies this dynamic by limiting oxygen replenishment. Larger pan diameters produce higher HRR values because their greater surface area enhances heat feedback and fuel evaporation, accelerating combustion. This creates a feedback loop, where the increasing HRR drives faster oxygen depletion. For the 24 cm diameter pan, the O
2
concentration significantly decreases after approximately 30 s of burning, eventually reaching a minimum value of around 15%. Similarly, the 16 cm diameter pan shows a notable decline in O
2 concentration starting at approximately 50 s of burning, reaching a minimum value of approximately 19.4%. In the case of the 8 cm diameter pan, a decrease in O
2 concentration becomes noticeable around 58 seconds of burning, ultimately reaching a minimum value of around 20.6%. It is worth noting that changes in
concentration were not significant for the 8 cm diameter pan. The results of Zang et al. [
31] show a lower minimum oxygen concentration. In their case, with the comparable diameter of the pan, for the case of 10 cm and 14 cm diameter pans, the minimum oxygen concentration can reach below 15%, and for a 24 cm diameter pan, it can reach below 12%. This could be because of the position of the gas analyzer probe. They positioned two probes in the lower and upper compartments, ensuring they were not too far from the fire. In the current study, we deployed a single probe, positioned relatively close to the side window.
As illustrated in
Figure 7, the CO
2 concentration increases with longer burning durations. This is because the combustion process generates CO
2 as a byproduct, and within a confined compartment without ventilation, CO
2 cannot escape easily. Additionally, the rate of CO
2 concentration increase intensifies with larger fire sizes, indicating that larger fires produce more CO
2. In
Figure 7, specific trends are identified based on different pan diameters. For the 24 cm diameter pan, a significant increase in CO
2 concentration occurs after approximately 32 s of burning, continuing until it reaches a maximum value of around 4.1%. Similarly, the 16 cm diameter pan exhibits a notable rise in CO
2 concentration starting at about 50 s of burning, reaching a maximum value of approximately 1.3%. In the case of the 8 cm diameter pan, an apparent increase in CO
2 concentration becomes noticeable around 66 s of burning, eventually reaching a maximum value of around 0.2%. Notably, the changes in CO
2 concentration were not significant for the 8 cm diameter pan.
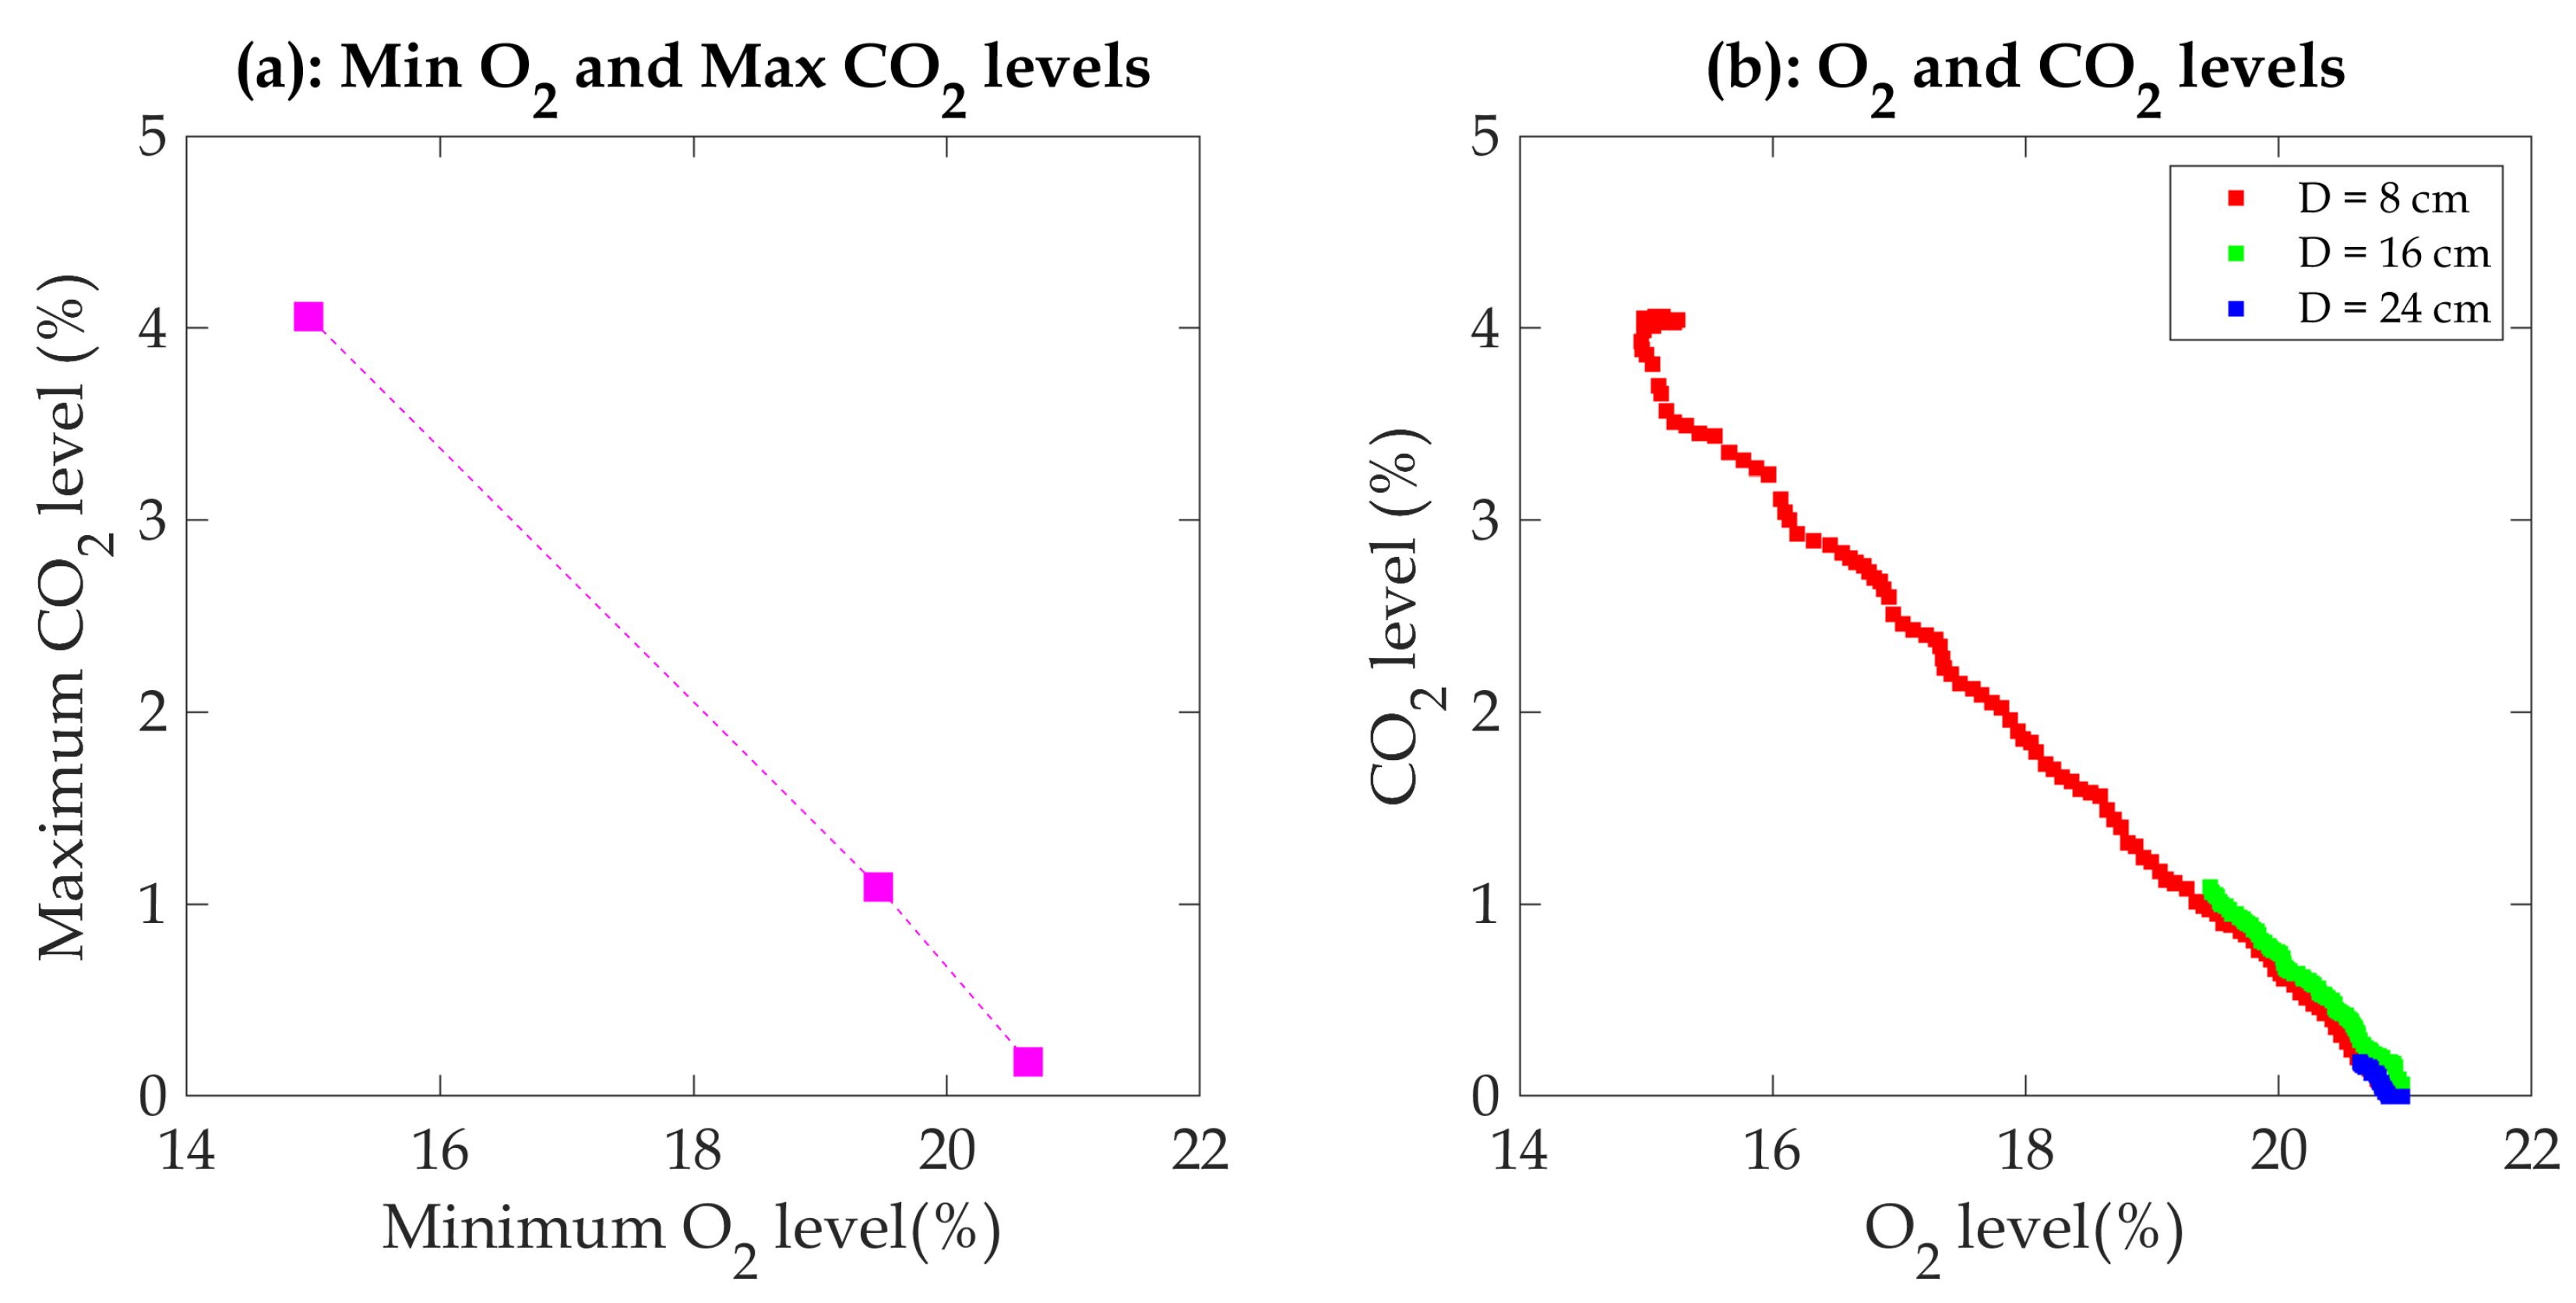
Figure 8 illustrates the potentially linear relationship between oxygen and carbon dioxide concentrations. Understanding the correlation between O
2 consumption and CO
2 production offers several advantages, particularly for future comparisons and applications. It provides an alternative approach for estimating the heat release rate in cases where some of the data are unknown, particularly when extinguishing fires using a sprinkler or water mist system.
Although CO measurements were not included in this study, it is known that CO is produced during incomplete combustion, particularly in oxygen-limited conditions. For confined fires, as observed in this study, the rapid depletion of O2 suggests that localized oxygen starvation near the flame could lead to elevated CO production. Larger fires, such as those with the 24 cm pan, are more likely to generate higher levels of CO due to their greater oxygen demand and the limited oxygen replenishment within the compartment.
3.4. Flame Morphology and Ghost Flames
To analyze changes in flame morphology during the tests, image processing was carried out. In fact, three distinct stages in the process were considered, starting with the extraction of all image frames from the video recordings, segmentation, and finally the deduction of the average flame height. The acquired flame images were converted into grayscale images using a Python OpenCV implementation based on the k-means clustering algorithm proposed by Rudz et al. [
40]. The grayscale images were converted into binary images after selection of the processing threshold. Following the procedure used by Rudz et al., the flame root width and flame height could be obtained after binarization. Subsequently, the real flame height was calculated based on the proportional relationship between the real pan width, the pan width in the binary image, and the height measured in pixels.
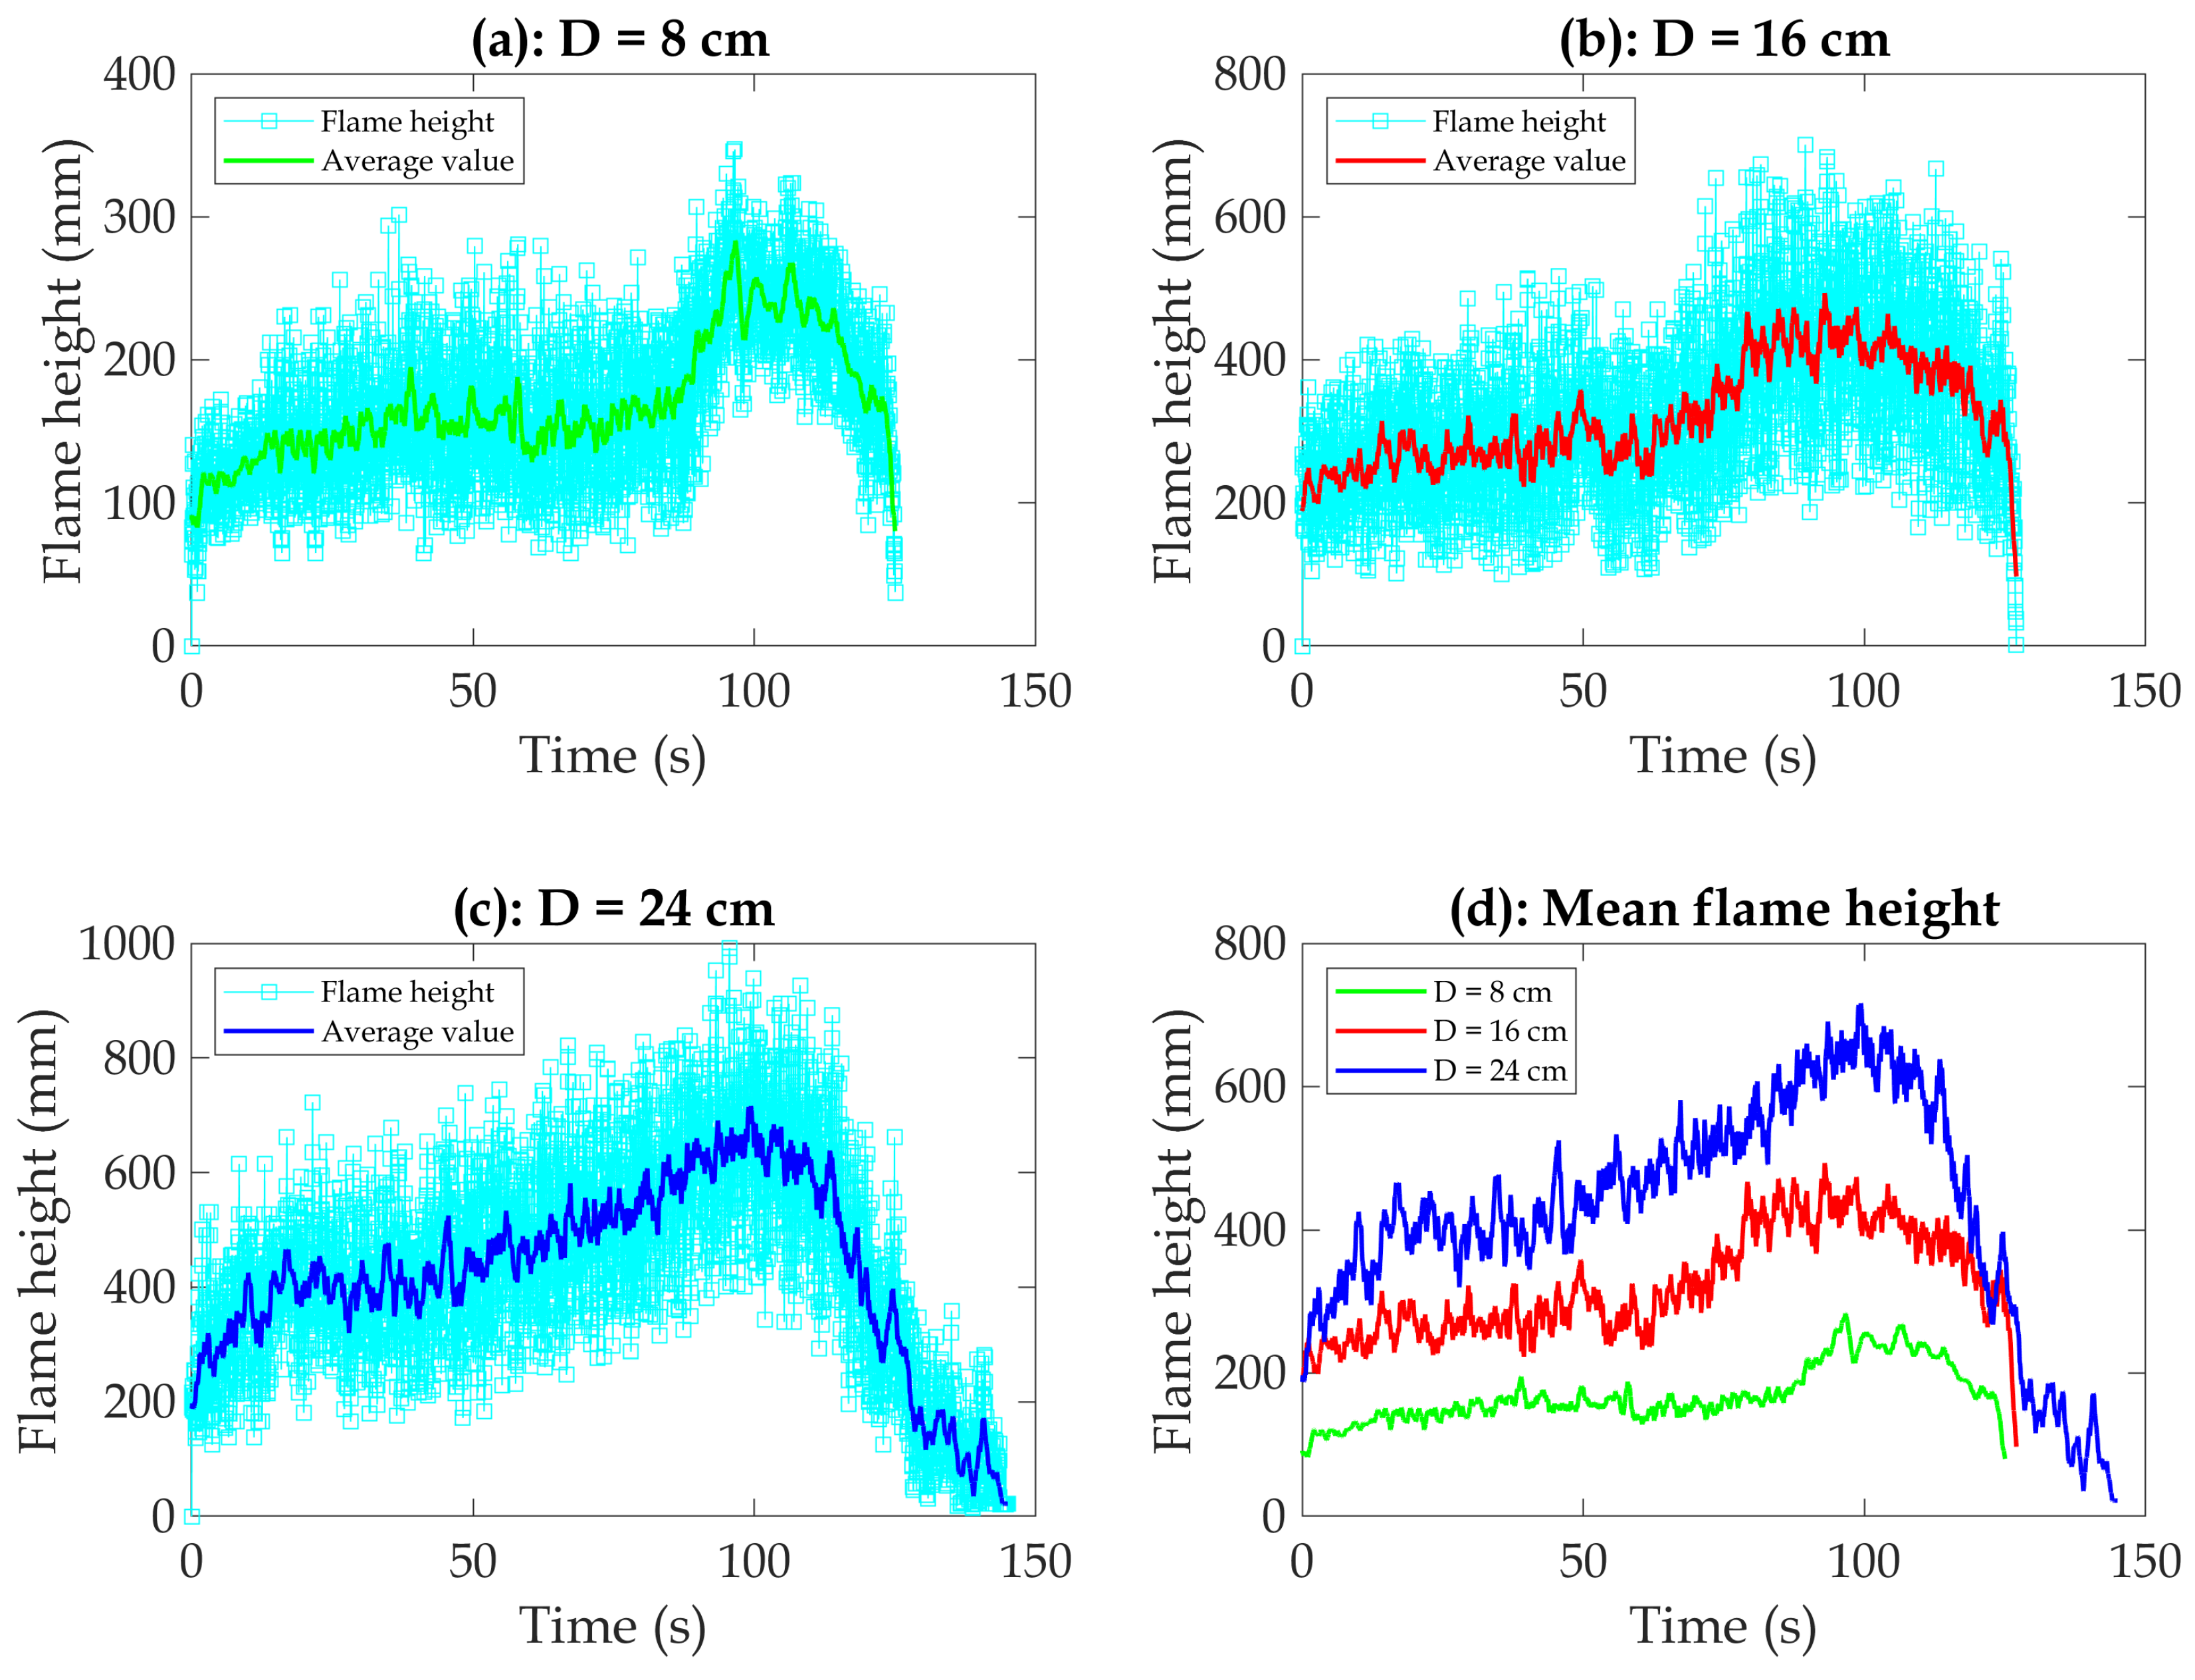
Figure 9 illustrates the impact of fire size on flame height. The results suggest that the fire size significantly influences the peak flame height, with flame heights of 27 cm, 48 cm, and 69 cm for pan diameters of 8 cm, 16 cm, and 24 cm, respectively. Generally, the behavior of the pool during the experiments can be divided into the following stages:
Growth stage: This phase occurs after ignition. The flame height gradually increases as the fuel pool heats up within the first 70 s after ignition. This means that the development of an incipient fire is largely dependent on the characteristics and configuration of the fuel involved (fuel-controlled fire).
Quasi-steady burning stage: The flame height reaches its maximum value between 70 and 110 s after ignition, as shown in
Figure 9. In fact, the fire increases in power with rising temperatures and smoke production. Combustion occurs rather swiftly owing to the availability of fuel and oxygen. At this stage, violent boiling occurs, so the fuel mass loss rate also increases rapidly. Overall, fire size significantly influences fire behavior at this stage.
Extinguishing stage: This phase occurs after 110 s of ignition. It is characterized by reduced evaporation and a weaker flame due to the fuel burnout. The flame height decreases rapidly towards zero for different fire sizes.
As the findings show, understanding flame behavior during oxygen depletion can inform the development of advanced fire suppression systems that target flame instability under low-oxygen conditions.
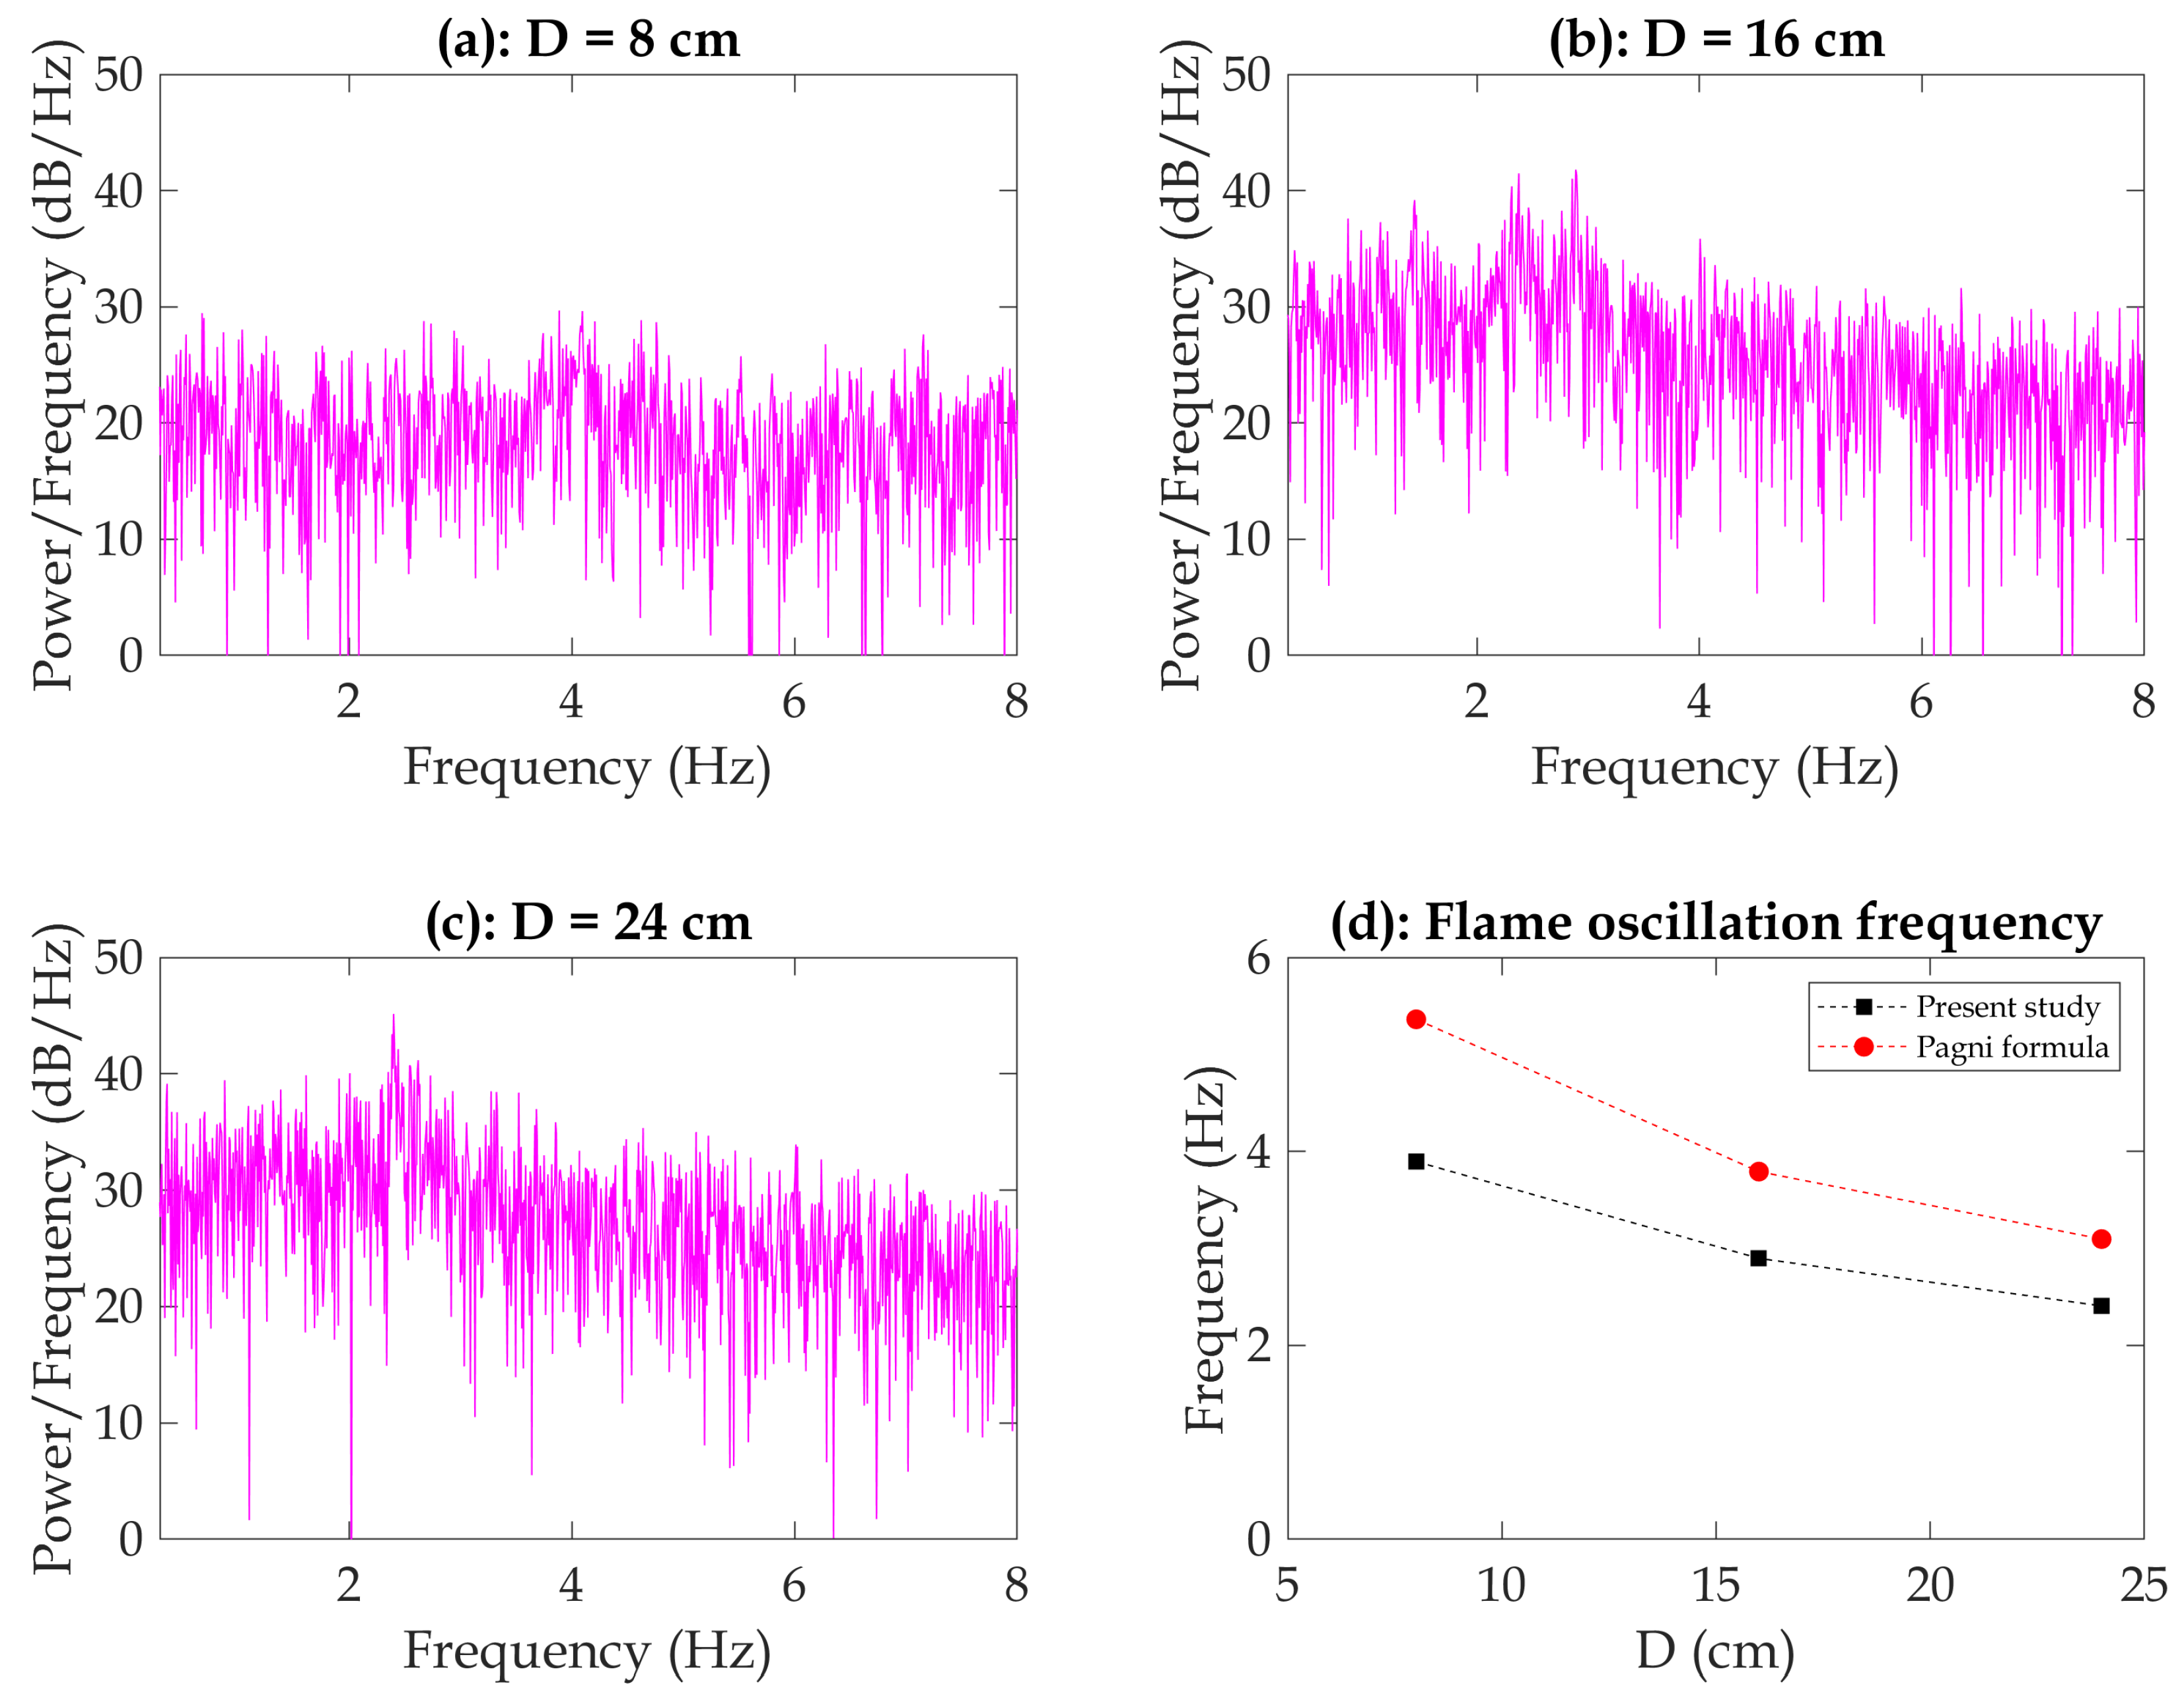
The oscillation frequency of a fire flame is a significant parameter that correlates with the fire’s temperature or heat release rate. The flame height is utilized to extract this frequency, known as the flickering frequency. One approach is to analyze the Power Spectrum Density (PSD) of the flame height, a mathematical tool used to examine signal frequency content based on the Fast Fourier Transform (FFT) algorithms. PSD analysis reveals dominant frequency components or oscillation modes in the flame by treating the flame height as a time-varying signal. The flickering frequency from the PSD analysis reveals key aspects of the fire’s dynamic behavior, linking it to the combustion process, heat release rate, and fire temperature. Higher flickering frequencies signify more intense and energetic fires, while lower frequencies suggest less vigorous flames [
41]. Correlations between flame oscillation frequency and pan diameter are observed in pool fires, where vertical flame structures align with the pan diameter. Such correlations were developed from various studies focusing on class B (hydrocarbon liquids) fuels.
As shown in
Figure 10, the results indicate that the pan diameter has a noticeable impact on the flame oscillation frequency. The mean frequency for the 8 cm pan (3.9 Hz) is higher than that for the 16 cm pan (2.9 Hz). This observation aligns with the calculation using the Pagni formula,
[
42], which suggests that flame pulsations are affected by the pan diameter. A larger pan diameter provides more space for the flame to oscillate and creates different flow patterns around it, resulting in a lower oscillation frequency.
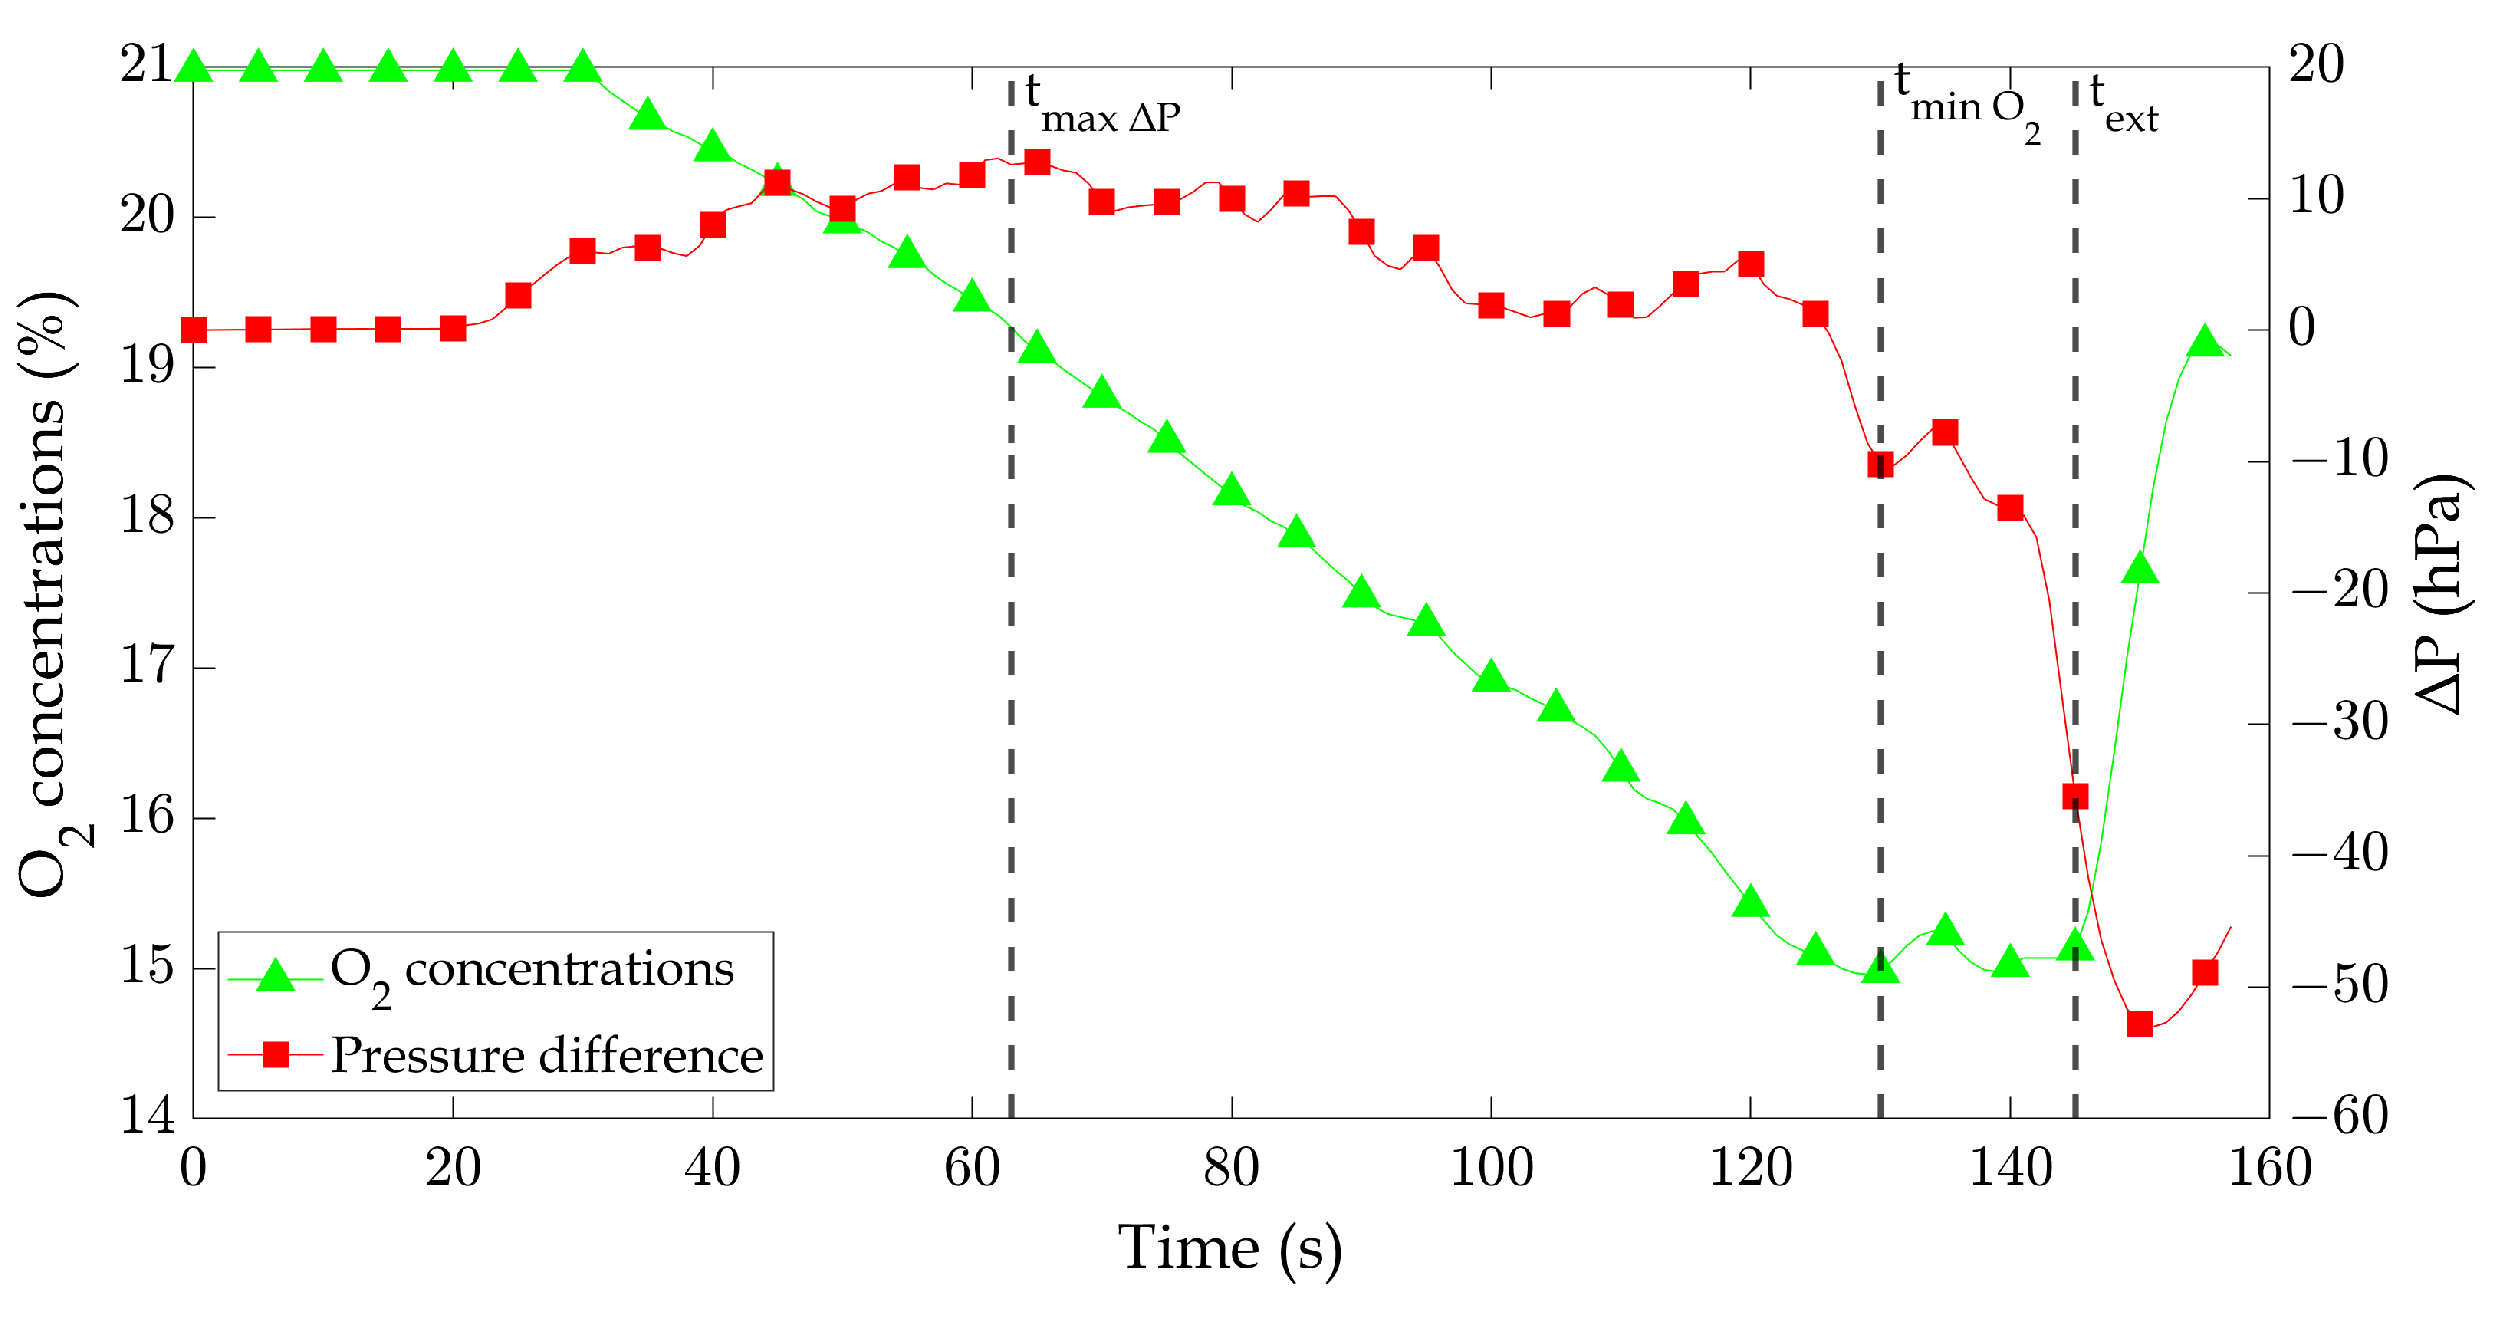
Figure 7 shows a 24 cm diameter pan’s oxygen concentration fluctuation near the extinguishing time region. This behavior of O
2 and CO
2 levels is typical for the occurrence of a phenomenon known as a ghosting flame [
43]. Building on this insight, we thoroughly analyzed the experiment’s video footage for the 24 cm diameter pan to determine if any ghosting flame occurred during the decaying period. Our observation commenced at
s and continued until the fire was extinguished, as indicated by signs of a ghosting flame. The results indicate that the flame was not directly attached to the fuel pan towards the end of the decaying period. However, it did not exhibit the characteristics of a typical ghosting flame, which is usually observed exclusively on the side of the pan. Nonetheless, notable differences were observed in the flame’s shape and characteristics after reaching minimum O
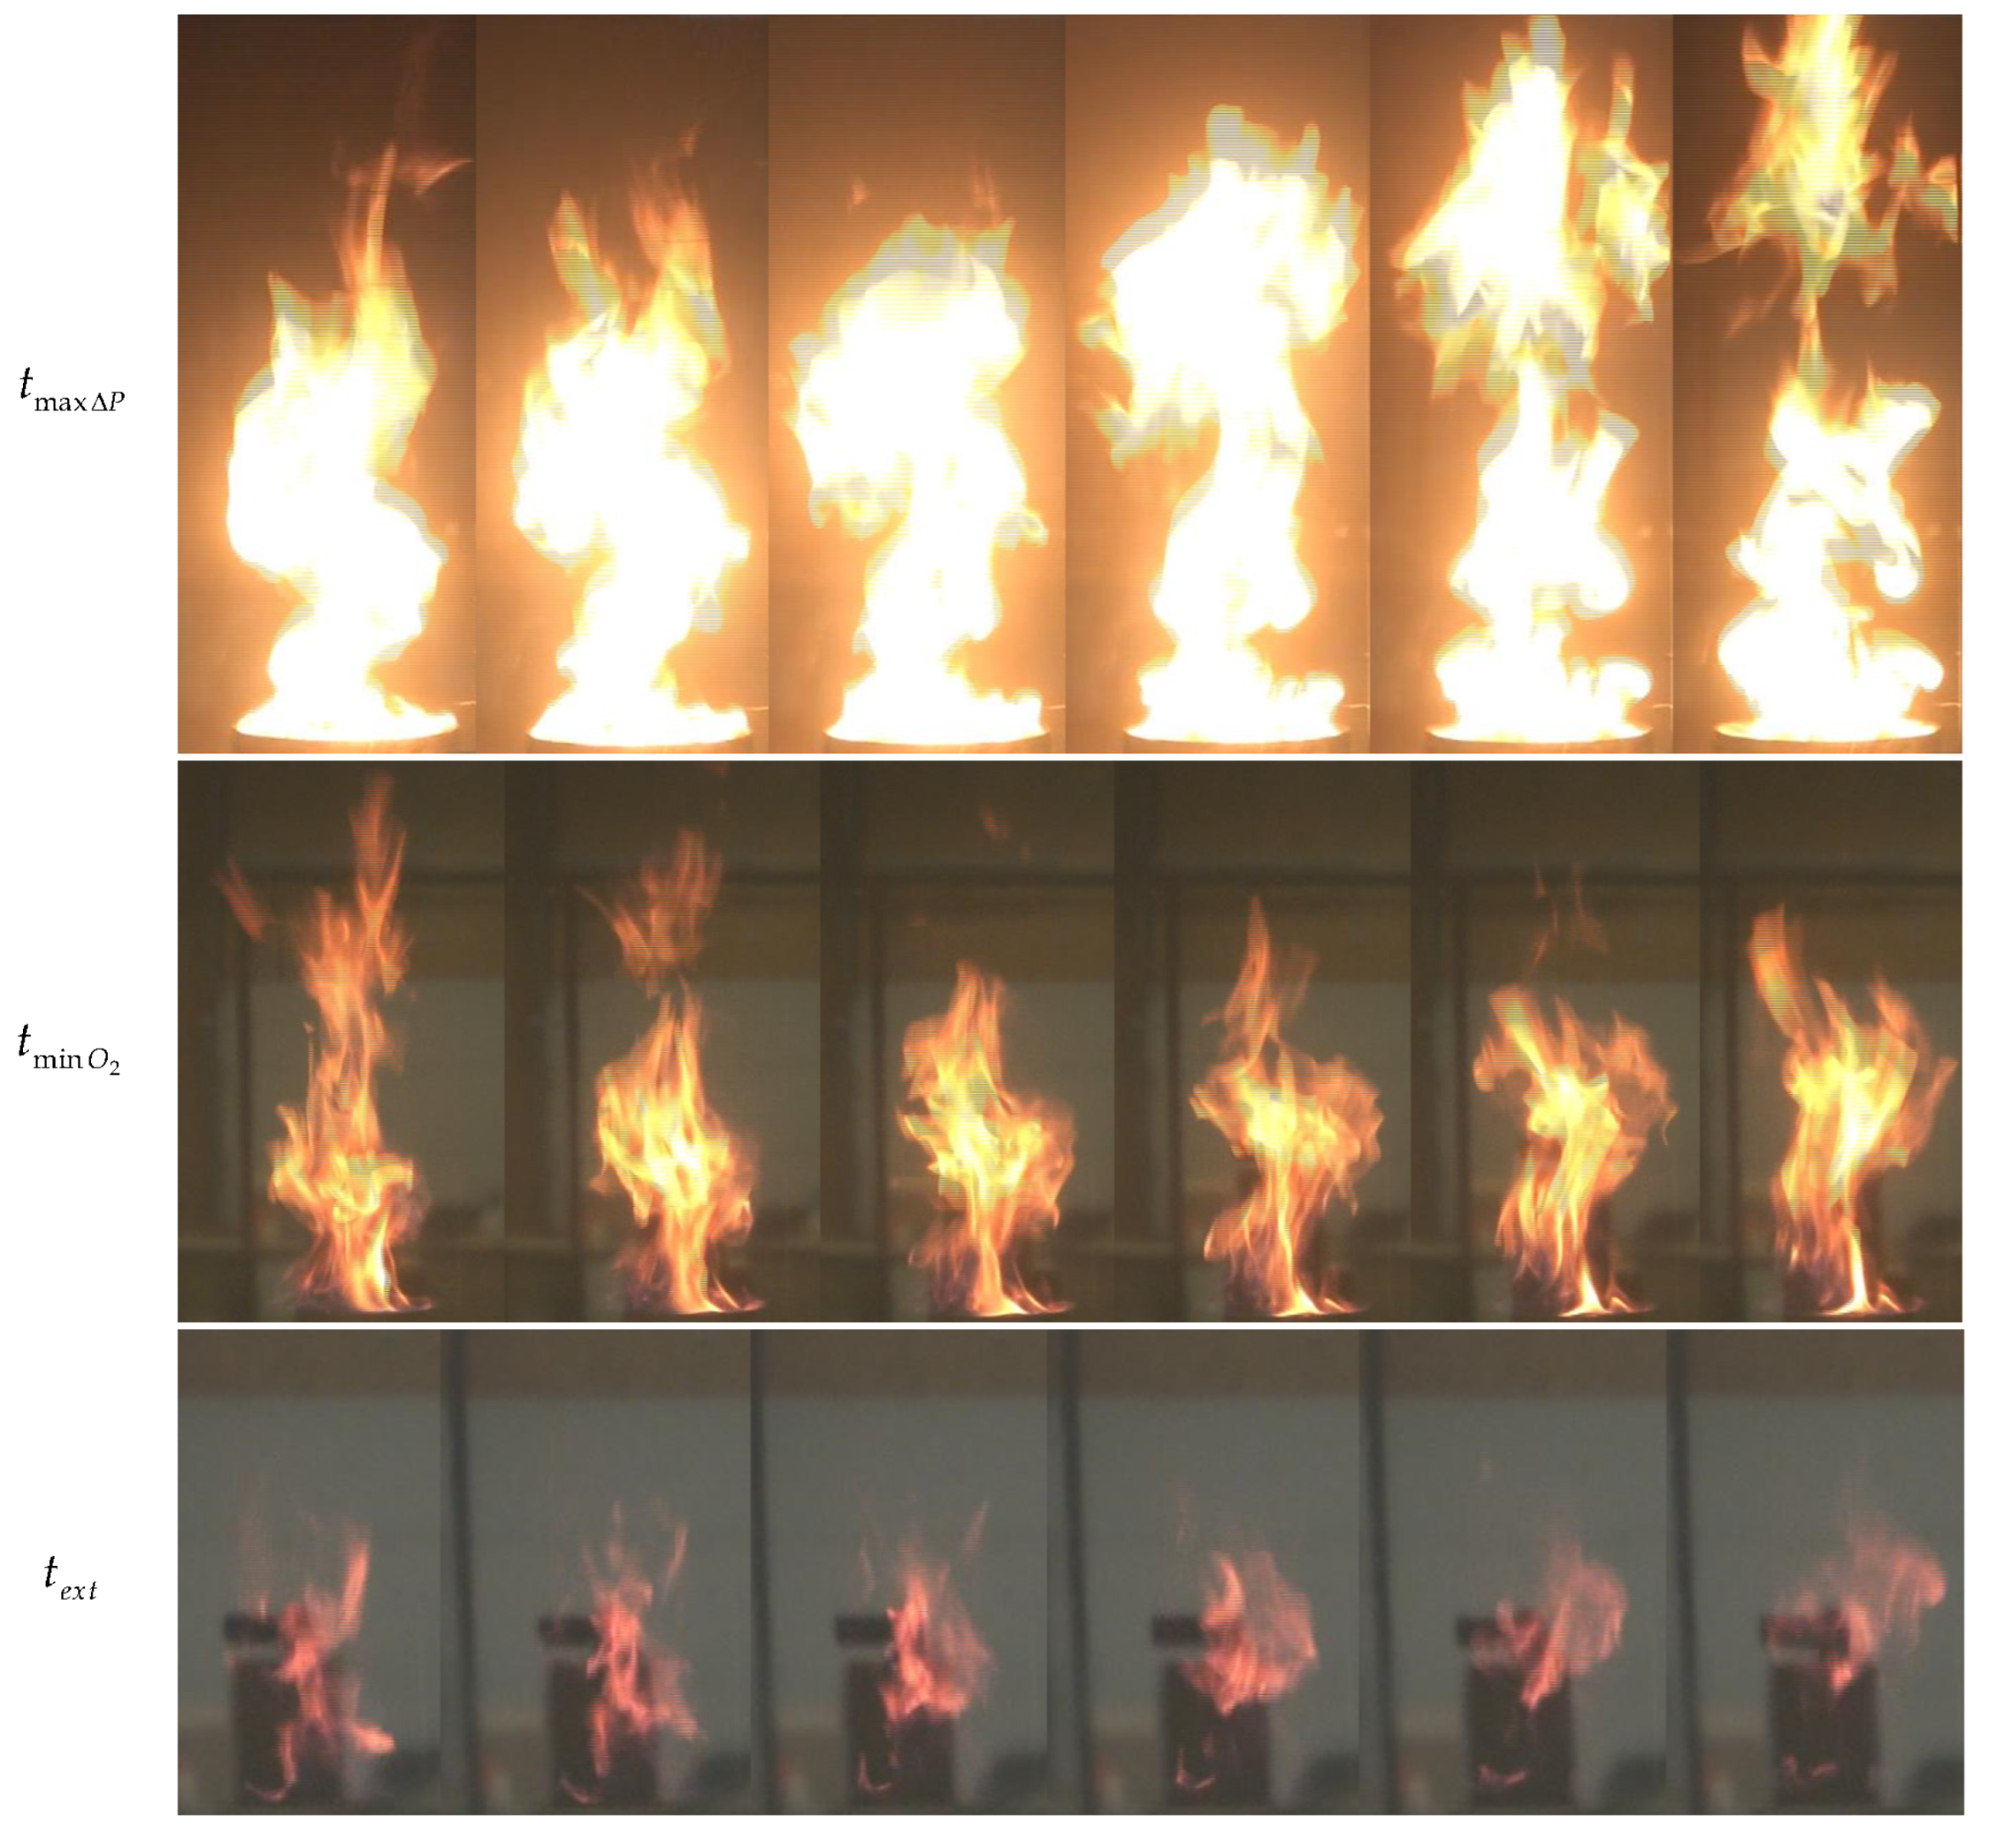
2 concentrations compared to when the oxygen concentration was relatively higher. To gain a deeper understanding of the effect of oxygen levels on flame shape, we captured images of the flame under three distinct conditions: firstly, when the pressure difference was at its maximum, corresponding to a time duration of approximately 63 seconds, resulting in an O
2 concentration of about 19.3%; secondly, during the phase of minimum O
2 concentrations, with a time duration of approximately 130 seconds, yielding an O
2 concentration of about 15%; lastly, during the nearly extinguished phase. The specifics of each condition are presented in
Figure 11. Based on the observations depicted in
Figure 11, we selected six captures of the flame to analyze further and examine. The six frames are
,
s, and so on until
s, taking each frame after observation time with a 25 fps camera. These captures are illustrated in
Figure 12.
Figure 12 shows that the flame shape is different in those three conditions. At the maximum pressure difference, the flame is more intense with a higher flame height compared to two other conditions. The average thermocouple tree temperature is about
, and the maximum temperature in the thermocouple tree is about
. At the minimum oxygen condition, the average thermocouple tree temperature is about
, and the maximum temperature is about
. When the fire is about to extinguish, the average thermocouple tree temperature is about
, and the maximum temperature in the thermocouple tree is about
.
The color of the flame is also somewhat different for each condition. The pattern of the flame height at the maximum pressure difference tends to increase. However, if we extend the flame capture, it creates something like a harmonic; it increases for about 6 or 7 frames, then suddenly decreases, then increases again up to 6 or 7 frames. This indicates that the flame oscillation frequency for this condition is about 3.5 to 4 Hz. In this study, that phenomenon is unavailable or cannot be observed for the two other conditions. The flames on a 24 cm diameter pan are described as optically thin, a condition in which the flame’s medium has low absorption and scattering of thermal radiation. In an optically thin medium, most radiation emitted by hot gases and soot particles escapes without significant interaction with the surrounding medium. This characteristic is influenced by the size of the flame, soot density, and gas composition. Optically thin flames are common in pool fires with diameters between 20 cm and 100 cm, as classified by Babrauskas [
14], where radiative heat transfer becomes more dominant than convective heat transfer. This characteristic significantly affects the heat flux measurements. Radiative heat transfer increases with flame size due to the greater flame area, while the lack of significant self-absorption ensures most emitted radiation contributes to the total heat flux. The increased turbulence observed with larger pans, such as the 24 cm case, further enhances radiative heat transfer as the flames expand and oscillate more vigorously.
3.5. Temperature and Total Heat Flux
Heat is one of the three components of the fire triangle. Therefore, understanding the temperature inside a compartment with fires is very important. Besides predicting the possibility of damage, it also affects the method and effectiveness of the fire protection system that will be applied. Below are the temperature results measured in the compartment during fires with different fire sizes.
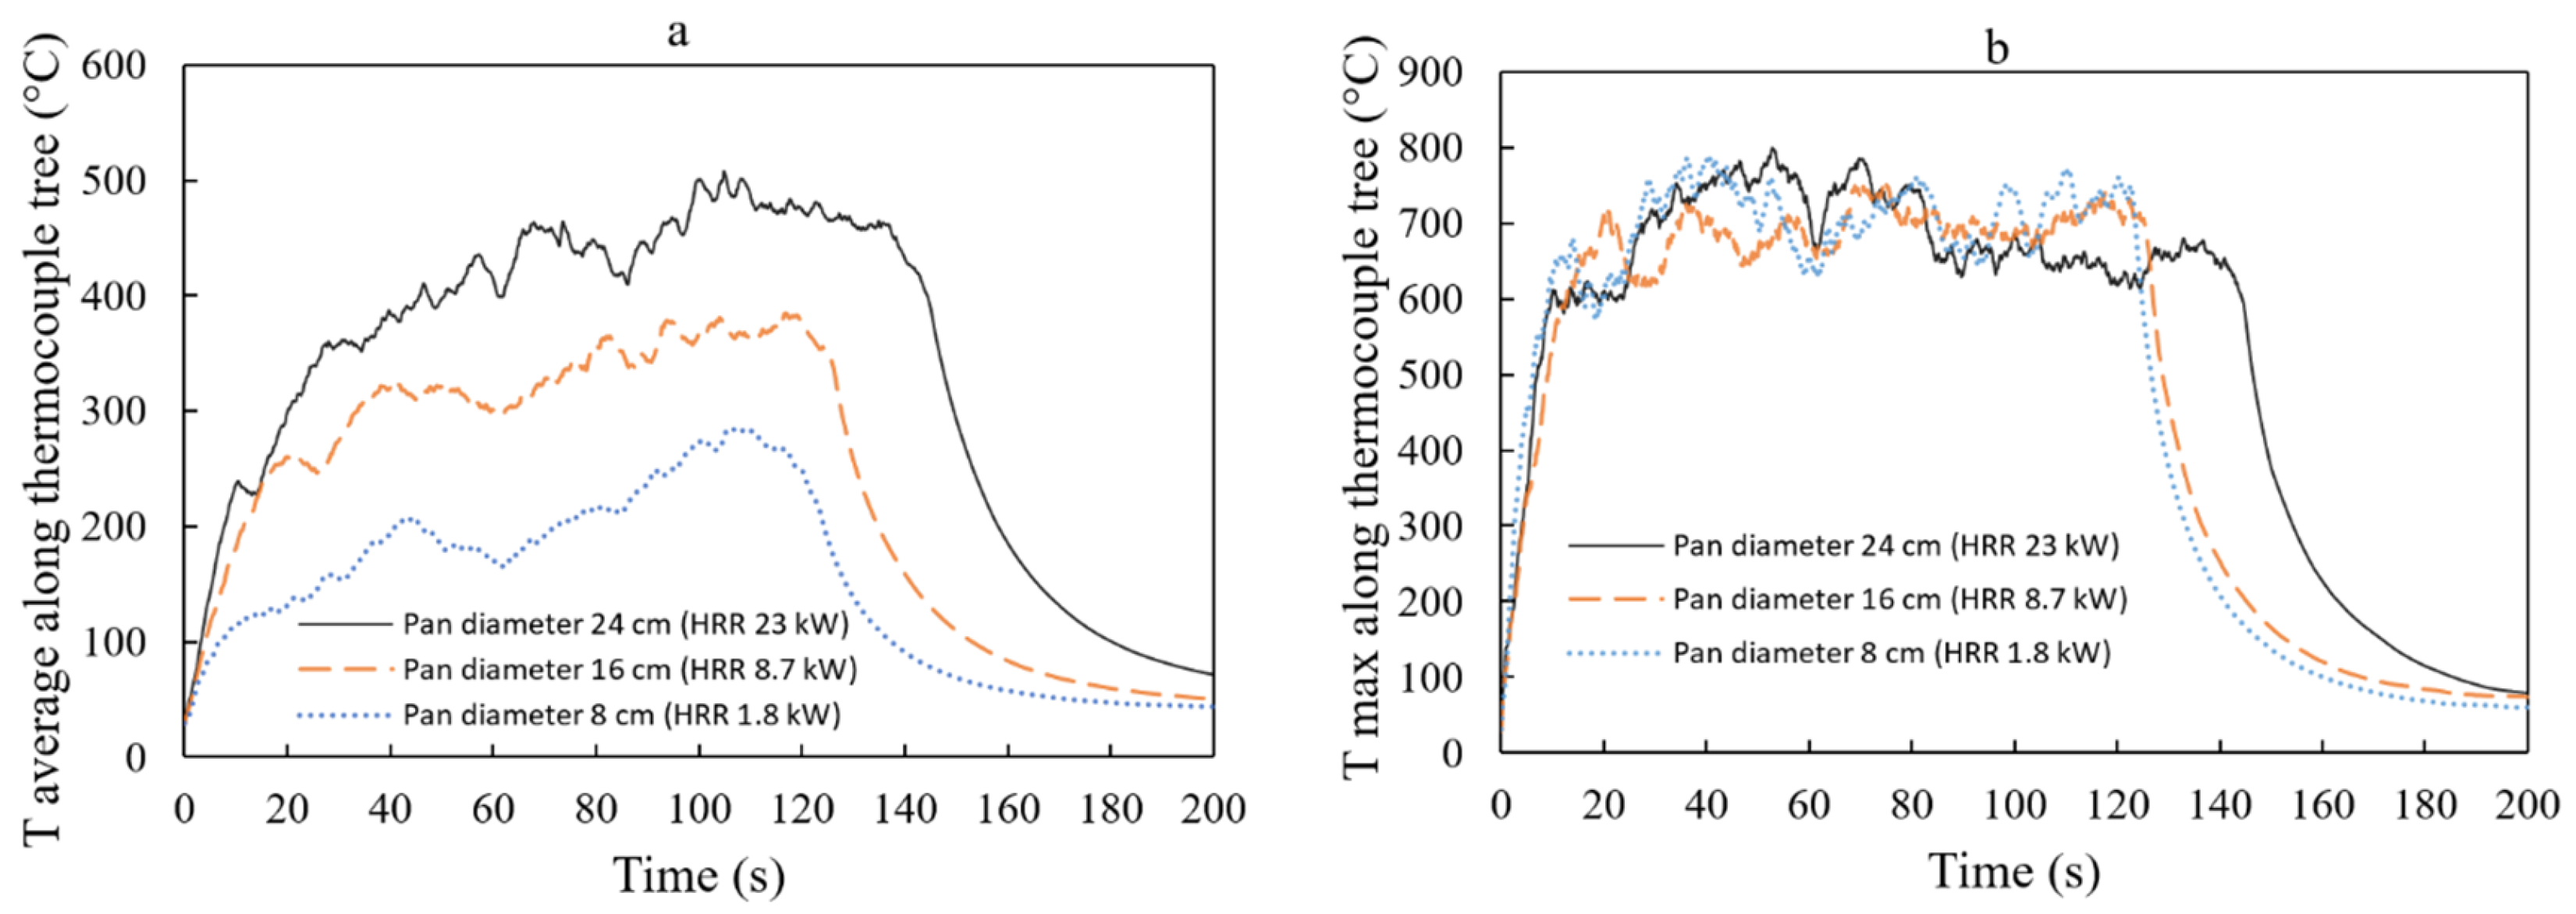
Figure 13 shows that the average temperature along the thermocouple tree increases with an increase in pan diameter. We have to pay attention to the bigger size of the fire. A higher temperature increases the likelihood of a flashover risk [
25]. For the 8 cm pan diameter (reference diameter), the average temperature is
. As the pan diameter increases to 16 cm, the average temperature rises by approximately 58.3%, reaching
. Further increasing the pan diameter to 24 cm results in an even higher average temperature of
, representing a substantial increase of approximately 106.4% compared to the reference. For a 1 cm
2 increment in pan area, the average temperature increases by approximately
.
Furthermore,
Figure 13 indicates that the maximum temperature along the thermocouple tree remains relatively similar for pan diameters of 8, 16, and 24 cm (approximately 650–
). Intriguingly, the maximum temperature recorded by the thermocouple appears to be independent of the pan’s diameter. However, for the 24 cm diameter pan, the maximum temperature appears to decrease after 80 s. This could be attributed to the production of soot, smoke, and particles, which subsequently hinder the fire’s radiation. Nevertheless, additional research is necessary to substantiate this observation. The temperature can also be expressed as a function of the tree height, as shown in
Figure 14. In this context,
represents the difference between the measured temperature and the initial room temperature of the compartment.
Figure 14 depicts the increase in average or maximum temperatures on the compartment ceiling as the fire size expands. Generally, there is a rise in the time-averaged temperature at a specific position along the tree as the pan size increases. However, the maximum temperature does not appear to exhibit significant changes with varying pan sizes. Interestingly, this study’s findings differ from those of Wang et al. [
3], who also examined temperature variations along the flame’s centerline. Wang et al. conducted experiments using various pan sizes, including two cases comparable to this study: 20 cm and 25 cm pan diameters. Their results indicated a lower maximum temperature of approximately
. This difference can be attributed to the distance between the nearest thermocouple and the fuel surface. In Wang et al.’s study, this distance was around 34 cm, whereas in this study, the first thermocouple was placed closer to the fuel surface, specifically on the pan’s tip. Wang et al. also proposed that the variation could be due to a wandering fire. Additionally, differences in compartment volume exist between the two studies. Nevertheless, both studies exhibit a similar pattern in terms of average temperature, which tends to increase over time [
3].
The temperature on the compartment ceiling is a crucial parameter that affects fire behavior and the possibility of flashover. Temperature on the ceiling is measured by the last (top) thermocouple in the thermocouple tree. For the 8 cm pan diameter (reference), the maximum ceiling temperature is , and the time-averaged ceiling temperature is . As the pan diameter increases to 16 cm and 24 cm, the ceiling temperatures rise significantly. The maximum ceiling temperature for the 16 cm pan diameter is , approximately 144.4% higher than the reference, and for the 24 cm pan diameter, it is , representing a substantial increase of approximately 498.2%. Similarly, the time-averaged ceiling temperature for the 16 cm pan diameter is , approximately 172.1% higher than the reference, and for the 24 cm pan diameter, it is , representing a substantial increase of approximately 523.6%. For a 1 cm2 increment in pan area, the time-averaged ceiling temperature increases by approximately , while the maximum ceiling temperature increases by approximately .
Total heat flux is a parameter that quantifies heat transfer to or from a surface, including radiation and heat from the fire itself, encompassing conductive, convective, and radiative flux and influencing various fire phenomena [
44,
45]. Our investigation involved measuring the total heat flux within the compartment during fires of different sizes, as illustrated in
Figure 15.
In a comparison, Nasr et al. [
46] studied heat flux with the effect of ACPH (air change per hour) using heptane as fuel. They found an average total heat flux of about 4.12
in the enclosure fire with a 26 cm pan diameter and 0.5 ACPH, whereas our case showed 6.03
. Although Nasr et al.’s study was in a different setup and sensor position, the results are comparable. Their result shows a lower value because they put heptane floating on water, which is suspect to the lower fuel temperature.
Figure 15 shows that total heat flux increases with larger pan diameters. The percentage increase in average and maximum total heat flux values was calculated for larger pan diameters and compared to the 8 cm pan as a reference. The results showed a substantial percentage increment in average and maximum total heat flux values as the pan diameter increased. For the 8 cm pan diameter (reference), the maximum heat flux recorded was 1
, and the time-averaged heat flux was 0.56
. As the pan diameter increased to 16 cm, both the maximum and time-averaged heat fluxes increased significantly. The maximum heat flux for the 16 cm pan diameter reached 3.95
, representing a substantial increase of approximately 294.1% compared to the reference. Similarly, the time-averaged heat flux for the 16 cm pan diameter increased to 2.37
, indicating a significant increment of approximately 322.7% compared to the reference. As the pan diameter further increased to 24 cm, the maximum and time-averaged heat fluxes continued to rise dramatically. The maximum heat flux for the 24 cm pan diameter was 10.75
, demonstrating a substantial increase of approximately 971.8% compared to the reference. Additionally, the time-averaged heat flux for the 24 cm diameter pan increased to 5.98
, representing a significant increment of approximately 965.4% compared to the reference. This behavior indicates a more complex interaction between radiative and convective heat transfer in confined spaces, which should be considered in thermal insulation design and fire suppression strategies.
For many materials and products, it can be generalized that the tendency of the relationship between HRR and heat flux over a substantial range of heat flux values is linear [
45], and for the HRR and pan area (
), as shown by Equation (
3), it is also considerably linear.
Therefore, we can assume that pan area and heat flux have somewhat linear relationships. With this assumption, we calculated the increments in time-averaged heat flux and maximum heat flux for a 1 cm
2 increment in pan area. For a 1 cm
2 increase in pan area, the time-averaged heat flux increased by approximately 0.01
, while the maximum heat flux increased by approximately 0.02
. These values highlight the sensitivity of total heat flux to changes in fire size, represented by the pan area. For the relationship between pan diameter and heat flux, as we know, the pan area in a circular pan can be calculated by
. This explains why the maximum total heat flux, as shown in
Figure 15, demonstrates a second-order polynomial trend, especially in this study, within the range of 8 to 24 cm diameter of heptane pool fires. However, further research is required to validate this observation.


