Article

Fire Simulation and Optimization of Fire Control System in Vehicle Compartment of Ro-Ro Passenger Ship

1
Navigation College, Dalian Maritime University, Dalian 116026, China
2
Dalian Key Laboratory of Safety & Security Technology for Autonomous Shipping, Dalian 116026, China
3
School of Construction Engineering, Shenzhen Polytechnic University, Shenzhen 518055, China
4
School of Mechanical-Electronic and Vehicle Engineering, Beijing University of Civil Engineering and Architecture, Beijing 102616, China
*
Authors to whom correspondence should be addressed.
Fire 2025, 8(11), 443; https://doi.org/10.3390/fire8110443
Submission received: 29 August 2025 / Revised: 8 November 2025 / Accepted: 12 November 2025 / Published: 14 November 2025
(This article belongs to the Special Issue Fire and Explosion Prevention in Maritime and Aviation Transportation)

Abstract

This paper constructs a numerical simulation model for the fire and fire-fighting system of an all-electric vehicle ro-ro passenger ship to study the influence of fire characteristics and fire-fighting system layout parameters on the fire-extinguishing system. The simulation results show that the fire can spread to the upper deck within 52 s, and the smoke will fill the main deck within 57 s. The study found that the battery capacity has a super-linear relationship with the fire hazard, and the fire thermal spread radius of a 240 Ah battery can reach 3.5 m. The high-expansion foam system has a low applicability in quickly suppressing battery fires due to its response delay and limited cooling capacity for deep-seated fires; the fire-extinguishing efficiency of fine water mist has spatial dependence: 800 µm droplets achieve effective cooling in the core area of the fire source with stronger penetrating power, while 200 µm droplets show better environmental cooling ability in the surrounding area; at the same time, the large-angle nozzles with an angle of 80–120° have a wider coverage range and perform better in overall temperature control and smoke containment than small-angle nozzles. The study also verified the effectiveness of fire curtains in forming fire compartments through physical isolation, which can reduce the heat radiation range by approximately 3 m. This research provides an innovative solution for improving the fire safety level of transporting all-electric vehicles on ro-ro passenger ships.

1. Introduction

In the context of global energy transformation, the transportation demand of the new energy vehicle industry in international trade is growing day by day. As an important carrier for large-scale transportation of new energy vehicles, the number of ro-ro passenger ships is rising sharply. However, the unique battery system and electrical structure of new energy vehicles have brought unprecedented challenges to the fire safety of ro-ro passenger ships. Ro-ro passenger ship fire accidents occur from time to time, most of which occur in the cabin of the car, and some even lead to major Marine accidents [1].
In recent years, the International Maritime Organization (IMO) has put forward many proposals for fire extinguishing technology and fire protection systems for ro-ro passenger ships from multiple perspectives. These include improvements in brine fire extinguishing systems from the Faroe Islands [2], a multifaceted study on high-expansion foam systems from Japan [3], optimized fire detection and monitoring tools proposed by Korea and IUM [4], the application of seawater spraying systems from China [5], and the clarification of lithium-ion battery fire terminology by France and Germany [6]. These proposals and research results from different perspectives provide important references for the optimization of the fire protection system and the improvement of fire extinguishing technology of ro-ro passenger ships. However, at present, no country has proposed any specific measures regarding the impact of the battery capacity of vehicles on fires, or regarding the use of water mist sprayers on ro-ro passenger ships, the optimization of spray angles, and the installation of fire shutters. Based on this, this study, by constructing a simulation model, aims to address the special fire safety challenges faced by ro-ro passenger ships in transporting new energy vehicles.
Currently, computational simulation tools are widely used in the ship design stage to predict and mitigate fire spread. Dynamic fire simulation helps to better assess heat and smoke trends and behavior based on cause, location, and environmental conditions [7]. This article aims to use PyroSim 2019 software to simulate fires on ro-ro passenger ships and assist in the optimization research of fire protection systems to improve the fire safety level of ro-ro passenger ships when transporting new energy vehicles. The structure of this article is as follows: Section 2 is a literature review, which mainly introduces previous research on ship fires, fire values, especially cargo hold fires, and ship fire protection system simulations at home and abroad, and demonstrates the main contributions of this article. Section 3 mainly introduces the numerical simulation theory based on FDS. Section 4 verifies the applicability and mesh independence of the PyroSim software. Section 5 presents the establishment and simulation settings of the ro-ro passenger ship fire model and fire protection system model in this paper. Section 6 analyzes the simulation results of ro-ro passenger ship fires and explores and optimizes the fire protection system. Section 7 presents the main conclusions of this paper.

2. Literature Review

At present, research on ship fires and fire protection systems both domestically and internationally mainly includes two aspects: fire experiments and numerical simulations. In the early experimental research on ship fires, Koromila et al. [8] studied the fire spread from one bus to another, while considering the entire vehicle deck of the passenger ship. Sahu et al. [9] conducted experiments on isopropanol pools in sealed cubic containers under different ventilation conditions, and their results can be used to analyze the fire hazard of ship compartments. Koromila et al. [10] used vehicle fire experiment data to calculate the heat release rate and evaluated the passability time of the deck based on the life safety performance standards of the International Maritime Organization (IMO). Wan et al. [11] compared the fire suppression performance of high-expansion foam, water film foam, and fine water mist systems on typical large-space shelter platforms through experiments, and found that water film foam was superior to high-expansion foam in extinguishing oil pool fires, which provided a basis for the selection of efficient fire suppression systems in vehicle fire scenarios. Takeda [12] used PMMA samples to simulate the fire behavior of the ship ventilation outlet shell, revealing the inhibitory effect of poor ventilation on combustion, and providing a reference for the ventilation settings of roll-on roll-off passenger ship cabins. Tamura et al. [13] measured the explosive strength of the fuel cell vehicle composite gas cylinder after combustion through experiments, providing key data for the safety of transporting new energy vehicles. Zeinali Davarani [14] used a 1:13 scale fine water mist curtain in a 1:13 scale passenger ship cargo hold model to evaluate smoke and heat suppression, providing practical insights for the application and subsequent numerical simulation of the cargo hold fire protection system. Arvidson [15] measured the total heat release rate and convective heat release rate of the passenger roll-on roll-off ship fire experimentally, aiming to ensure there was sufficient water for cooling the flames and surrounding hot objects during the fire.
However, conducting real ship experiments requires a significant amount of funds and time, which not only limits the widespread use of experimental research, but also leads to relatively few experimental studies in the field of ro-ro passenger ship fires. Using simulation experiments for fire research can obtain results in a shorter period [16]. In recent years, scholars at home and abroad have mainly focused on using various tools and methods to analyze numerical simulations of fires [17]. These studies realized numerical fire simulation through combustion model and physical model, and focused on key processes such as ignition, heat transfer, and gas diffusion, providing an important basis for ship fire prevention, and control. Many researchers simulate ship fires from different perspectives. Salem [18] employed three fire models and conducted a comparative scaled fire simulation on the vehicle deck of ro-pax ships. Themelis [19] studied the influence of natural opening and wind on the fire development and spread of part of the deck of a ro-ro passenger ship by using computational fluid dynamics CFD simulation. Bellas et al. [20] used FDS to model heptane and diesel spray, pool fires, as well as exposed and obstructed fires as defined in IMO notifications and compared the simulation results with comprehensive test data from authoritative fire testing laboratories. In the case of a fire in the ship’s hold, the heat distribution can be dynamically modeled by simulating the heat distribution of the fire to other combustible solids, for which Melek [21] used the OpenFOAM computing platform and an improved interactive fluid dynamics solver to describe the flow characteristics of the oxidized air, fuel gas, and exhaust gas systems in detail. The combustion process is numerically simulated by a consumption model based on the fuel and air stocks in each grid cell. The heat distribution drives air convection and shapes specific flame patterns. Ji et al. constructed a mathematical-physical model of ship fire based on PyroSim, generated a navigation mesh through graphical analysis of simulation data, and planned escape routes to meet the requirements of 3D environment pathfinding [22]. Marquis et al. [23] performed numerical simulations of test material samples with increasing size to support the ability of hydrodynamic models to reproduce the fire development process of composite materials. Hoang et al. [24] updated the particle positions in real time based on the Huygens model, and accurately controlled the flame brightness and scene lighting effect with the help of high dynamic range imaging technology, which provided a more realistic light and shadow representation for fire visual simulation. Nielsen et al. [25] proposed a physics-driven fire simulation method to realize the integrated simulation of fuel modeling, soot generation, and oxidation processes by coupling combustion physics and CFD simulation, which provides support for FDS. Stam et al. [26] developed a physics-driven fire model based on computer graphics, realizing dynamic evolution simulation of flames, smoke, and other gases, and providing technical support for fire control in ro-ro ships. Huang et al. [27] introduced a mathematical model coupled with physics and chemistry to explain fire behavior and motion, and outlined problems such as velocity advection and pressure projection. Nielsen et al. [25] modeled combustion as an infinitely fast chemical reaction based on an adaptive octree mesh, and improved the accuracy of explosion fire simulation through physical model drive, providing a reference for vehicle fire and even explosion.
By constructing a fire protection system to simulate the response and effectiveness in fire scenarios, key support is provided for the design, optimization, and emergency strategy formulation of fire protection systems. Back GG et al. [28] conducted experiments and demonstrated that five types of fine water mist systems can effectively control fires in a 100 cubic meter mechanical space. They suggested that IMO could appropriately relax the current design requirements for such spaces. Prasad K et al. [29] analyzed the mechanism of fine water mist suppressing the diffusion of gas jets and flames using a dual continuum model and quantified the influence of liquid droplet parameters on the fire suppression effect. Cui et al. [30] mentioned in their article that when the battery undergoes thermal runway, this modular design causes the concentration of CO and other flammable gases to rise sharply. These gases float on the upper layer and are prone to explosions. However, fine water mist can effectively suppress the explosion. Zhang et al. [31] revealed the thermal runaway mechanism of LiFePO4 batteries through multi-scale experiments and modeling and established an accurate thermodynamic prediction model. Chen et al. [32] based on IMO’s SOLAS Convention and international FTP, integrated cabin fire protection technology to construct a large-scale cabin fire risk analysis method and safety management function based on fire scene analysis. Zhang et al. [33] proposed a fine water mist control strategy. By taking advantage of fine water mists of different particle sizes at different cooling stages and integrating them to improve the overall cooling effect, suggestions are provided for implementing fine water mist in the design of automotive battery fire extinguishing systems. Li et al. [34] used LES and theoretical model to simulate the fire scene and obtain the use mechanism of water mist. The reason why pool fires are easier to extinguish is that the higher the spray speed, the larger the spray area. Since IMO has not systematically considered the inherent randomness of ship fire events, Spyrou et al. [35] established a risk calculation framework to evaluate the designed fire safety performance by combining the probability of fire, the reliability of the installed fire extinguishing system, and the prediction of losses in the case of fire growth.
To sum up, many researchers have used numerical simulation methods to study cargo hold fires and fire protection systems, mainly focusing on the following three aspects: (a) using numerical simulation methods to study the temperature distribution and smoke diffusion after a cargo hold fire, as well as the growth and spread process of the fire inside the cabin; (b) Use combustion physics combined with CFD simulation to visualize fires. In addition, in terms of simulation tools, previous researchers mostly used FDS for simulating cabin fires; (c) Build a fire protection system using modeling methods and evaluate the fire extinguishing effectiveness of sprinkler systems, gas fire extinguishing systems, and other components in different situations.
However, the simulation studies on the evolution patterns of fires on ro-ro passenger ships are still insufficient. The existing research has the following limitations: there is a lack of international unified standards, and the accumulation of risk assessment data is insufficient; in the design of fire-fighting systems, the consideration of the synergistic effect of multiple fire extinguishing agents is inadequate, and the data support is weak, affecting the reliability of the conclusions; in addition, there is also a lack of tracking and assessment of the long-term performance impact on the ship’s structure after a fire. Based on this, this study focuses on the vehicle deck and living deck of ro-ro passenger ships, and constructs a geometric model based on actual ship data. The main contribution of this paper lies in: (a) revealing the fire evolution mechanism of new energy vehicles in the special cabin environment of ro-ro passenger ships; (b) constructing a fire-fighting system model and evaluating the effectiveness of systems such as high-expansion foam and fine water mist in real fire scenarios; (c) through quantitative analysis of key parameters such as battery capacity, droplet size, spray angle, and fire curtains, targeted optimization schemes for the fire-fighting system are proposed. Thus, the simulation results allow us to explore the application of new fire protection technologies on ro-ro passenger ships.

3. Basic Theory of FDS Fire Simulation Model

FDS is based on the large eddy simulation method [36], and by solving a set of filtered and low-Mach-number approximate Navier–Stokes equations [37], it decomposes the flow field into analyzable large-scale structures and sub-grid scale pulsations that need to be modeled. In the numerical simulation, the system follows the conservation laws of mass, momentum, and energy: mass conservation is ensured through the continuity equation during the fluid micro-element motion process; momentum conservation is characterized by Newton’s second law to describe the driving mechanism of thermal buoyancy on fluid motion; energy conservation is expressed as the conversion relationship between thermal energy, mechanical energy, and chemical energy within the system.
FDS employs a fast chemical reaction model based on the hybrid fraction theory. By defining the conserved scalar, the hybrid fraction to represent all intermediate states from pure fresh fuel to pure burned products in the flow field, it simplifies the complex combustion chemical reaction problem into the solution of mixing and transport processes, and directly correlates the heat release rate with the hybrid fraction through preset relationships. The model simplifies the complex chemical reactions during the battery thermal runaway process into a single combustion reaction and solves it within the framework of combustion theory. Thermal radiation transmission is modeled by solving the radiation transmission equation within discrete solid angle ranges, treating the smoke gas particles and gas products as participating media, and calculating the radiation characteristic parameters by combining concentration and component characteristics to represent the radiation heat flux of the flame and hot smoke gas on the surrounding environment. The smoke gas transport process is described by the conserved scalar transport equation, considering convective diffusion, turbulent transport, and the generation of smoke particles. This enables the prediction of the spread paths of visible smoke during a fire, the distribution of its concentration, and its impact on visibility.
In the modeling of the fire suppression system mechanism, FDS simplifies the fire suppression effect of fine water mist as a physical cooling process of liquid droplet evaporation absorbing heat, without considering its chemical asphyxiation effect; for high-expansion foam, the equivalent particle method is used to simulate the physical coverage effect; for fireproof curtains, it is simplified as an adiabatic solid boundary to simulate its thermodynamic isolation effect. This modeling system reasonably simplifies the key physical processes such as turbulence, combustion, radiation, smoke gas transport, and fire suppression mechanisms, and together constitutes a numerical framework suitable for the simulation of ship cabin fires.

4. Fire Simulation Verification

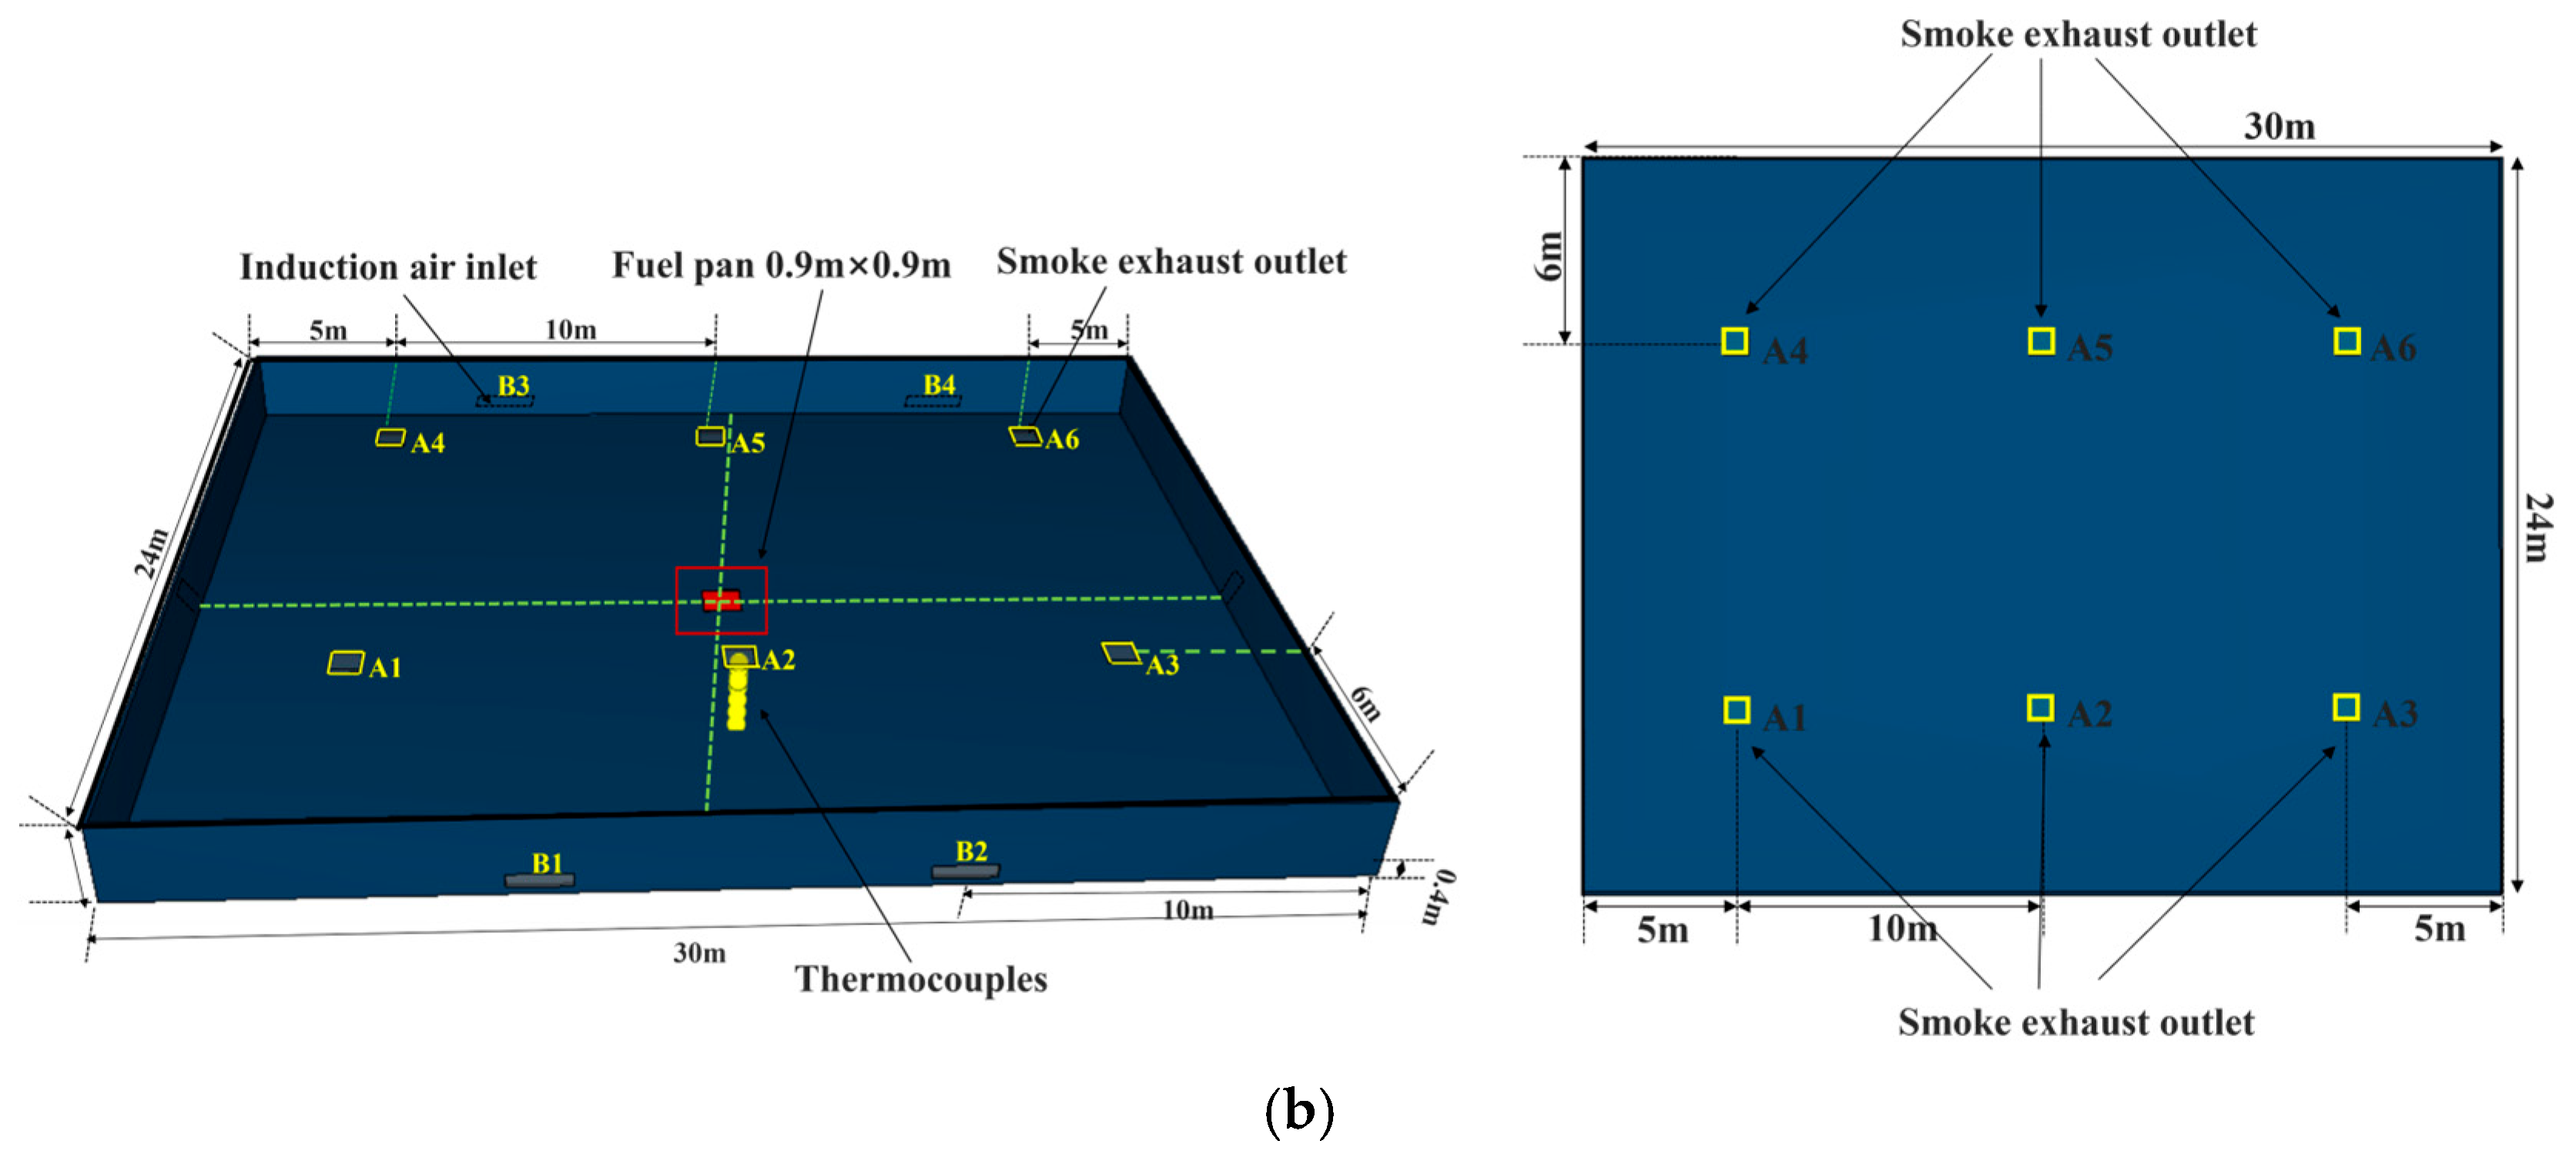
In the simulation study of ship fire, to evaluate the applicability of PyroSim software in ship fire simulation and provide an accurate basis for subsequent ship simulation, this study selected the experimental results in the references as the verification benchmark. The PyroSim simulation uses the same fuel and boundary conditions as the experiment. By comparing the simulation results with the experimental results, the correctness of the fire simulation is verified to a certain extent. The simulation selects the condition 20 in the experiment in reference [38]. Six air outlets with the size of 0.8 m × 0.8 m were opened at the top of the cabin, and the experimental marks were A1, A2, A3, A4, A5, and A6, which were evenly distributed in the center of the six equal parts of the ceiling. Four air supply outlets with the size of 1.6 m × 0.4 m were set on the side wall, and the experimental marks were B1, B2, B3, and B4. The experiment used a square oil pool with a side length of 0.9 m, and the height between the bottom of the pool and the ground was 0.15 m. Diesel oil is installed in the oil pool, and the parameters of diesel oil are shown in Table 1.
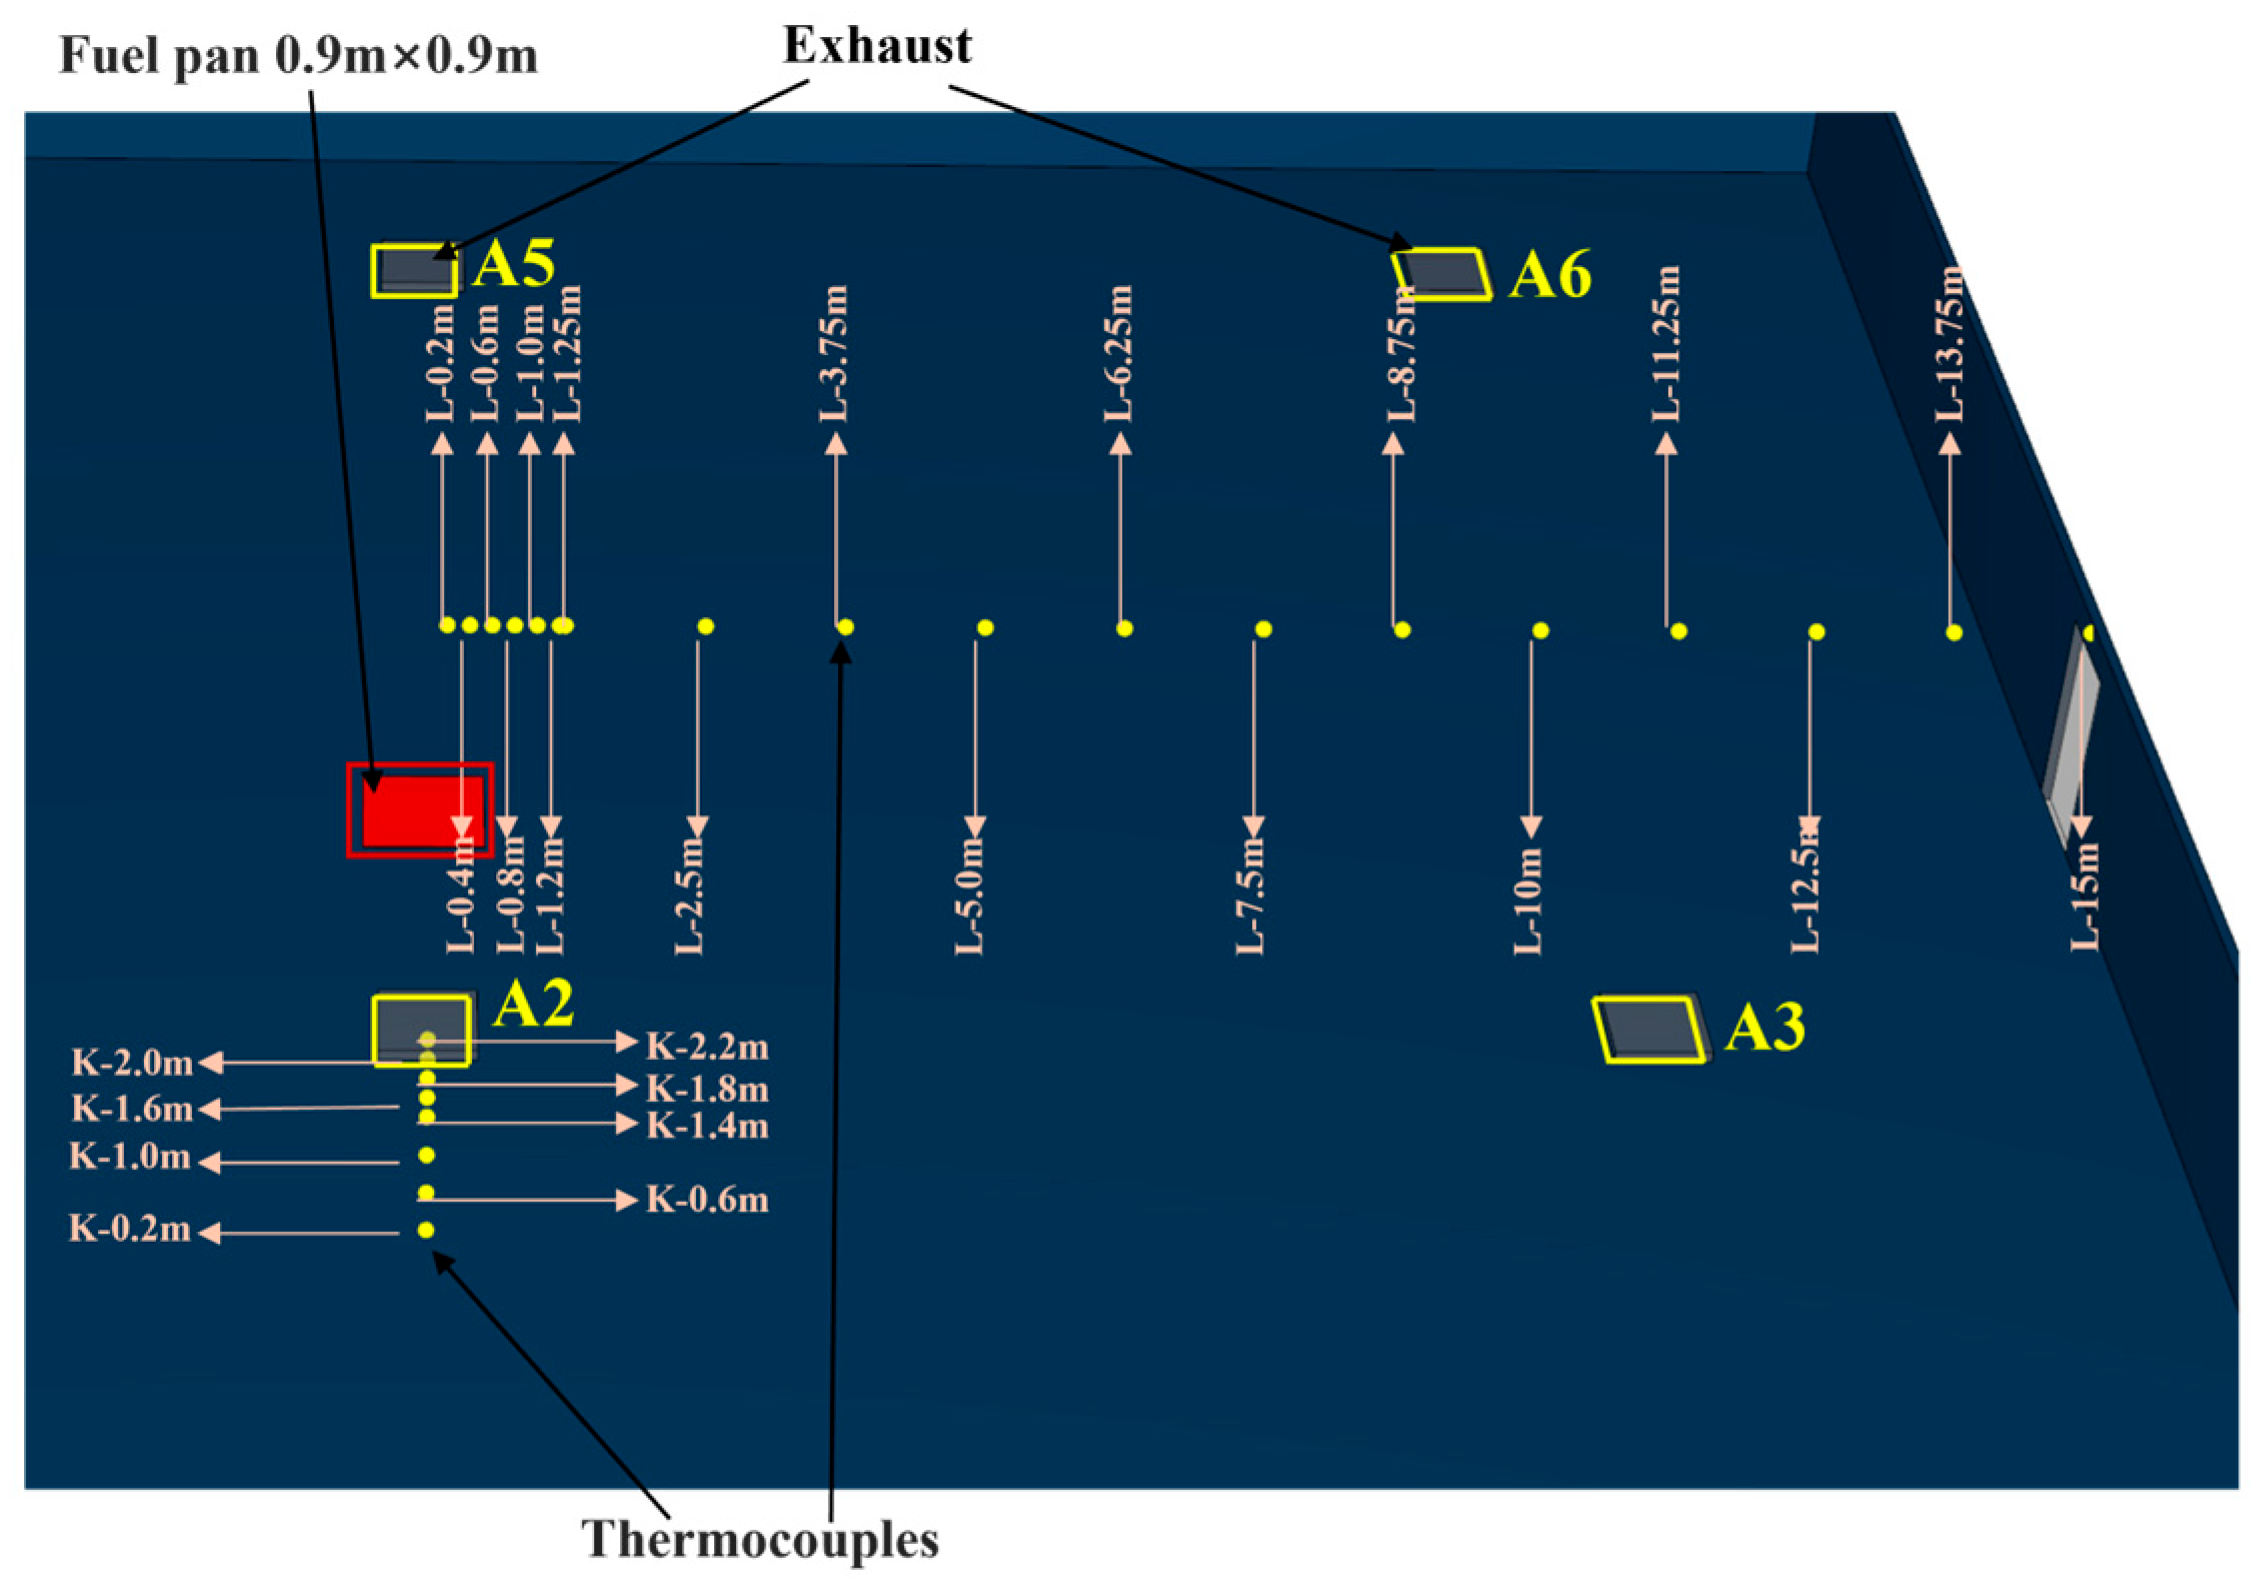
In order to enhance the simulation efficiency without affecting the combustion process, the simulation was simplified. The simplified boundary conditions and geometric model are shown in Figure 1. During the simplification process, the ventilation area, position, model size, and key parameters remained unchanged to ensure that the simplified model was consistent with the experimental combustion effect. When using the PyroSim software for simulation, the external boundary of the calculation domain was set as “Wall” to simulate the solid wall of the closed experimental box. A hexahedron with a length of 30 m (long), a width of 24 m (wide), and a height of 2.3 m (high) was constructed. The mechanical ventilation system was achieved through “Vent”: the six exhaust outlets on the top were set as “Exhaust”, and the exhaust volume of each outlet was 29.89 m3/s; the four intake outlets on the side walls were set as “Supply”, and the intake volume of each outlet was 41.67 m3/s to meet the requirements of experimental condition 20. The exhaust outlets and intake outlets were opened after 60 s, and the simulated condition A2 was the same as the experimental condition. In order to reproduce the stable state diesel pool fire scene mentioned in the literature, a fire source with a stable heat release rate was selected to minimize the uncertainty of the fire source itself, thereby minimizing the difference between the simulation results and the experimental data as much as possible.
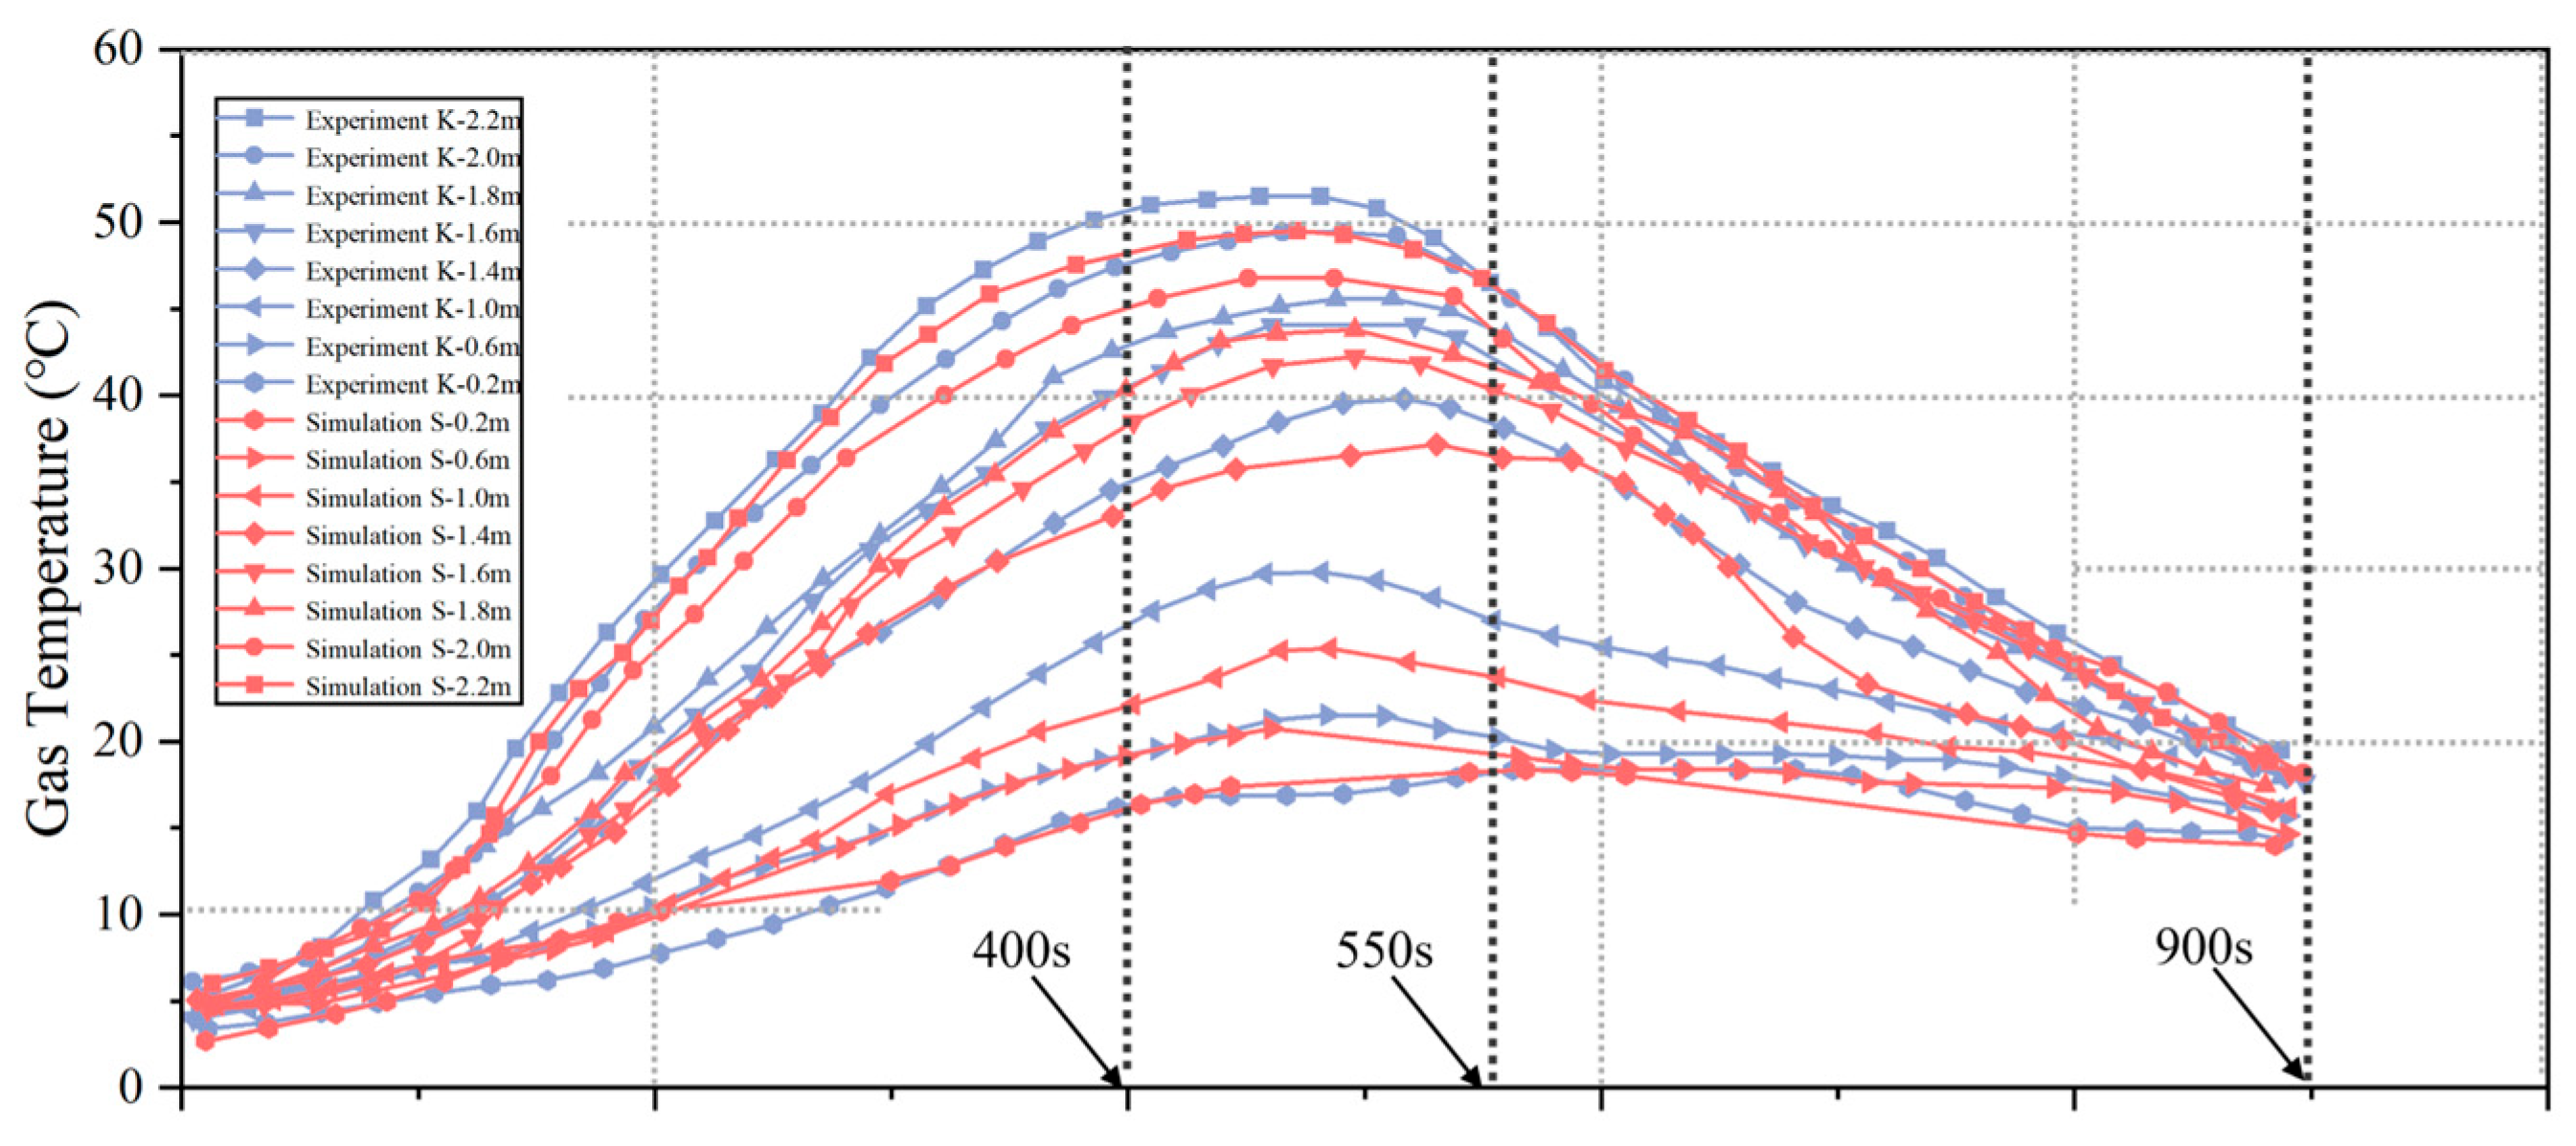
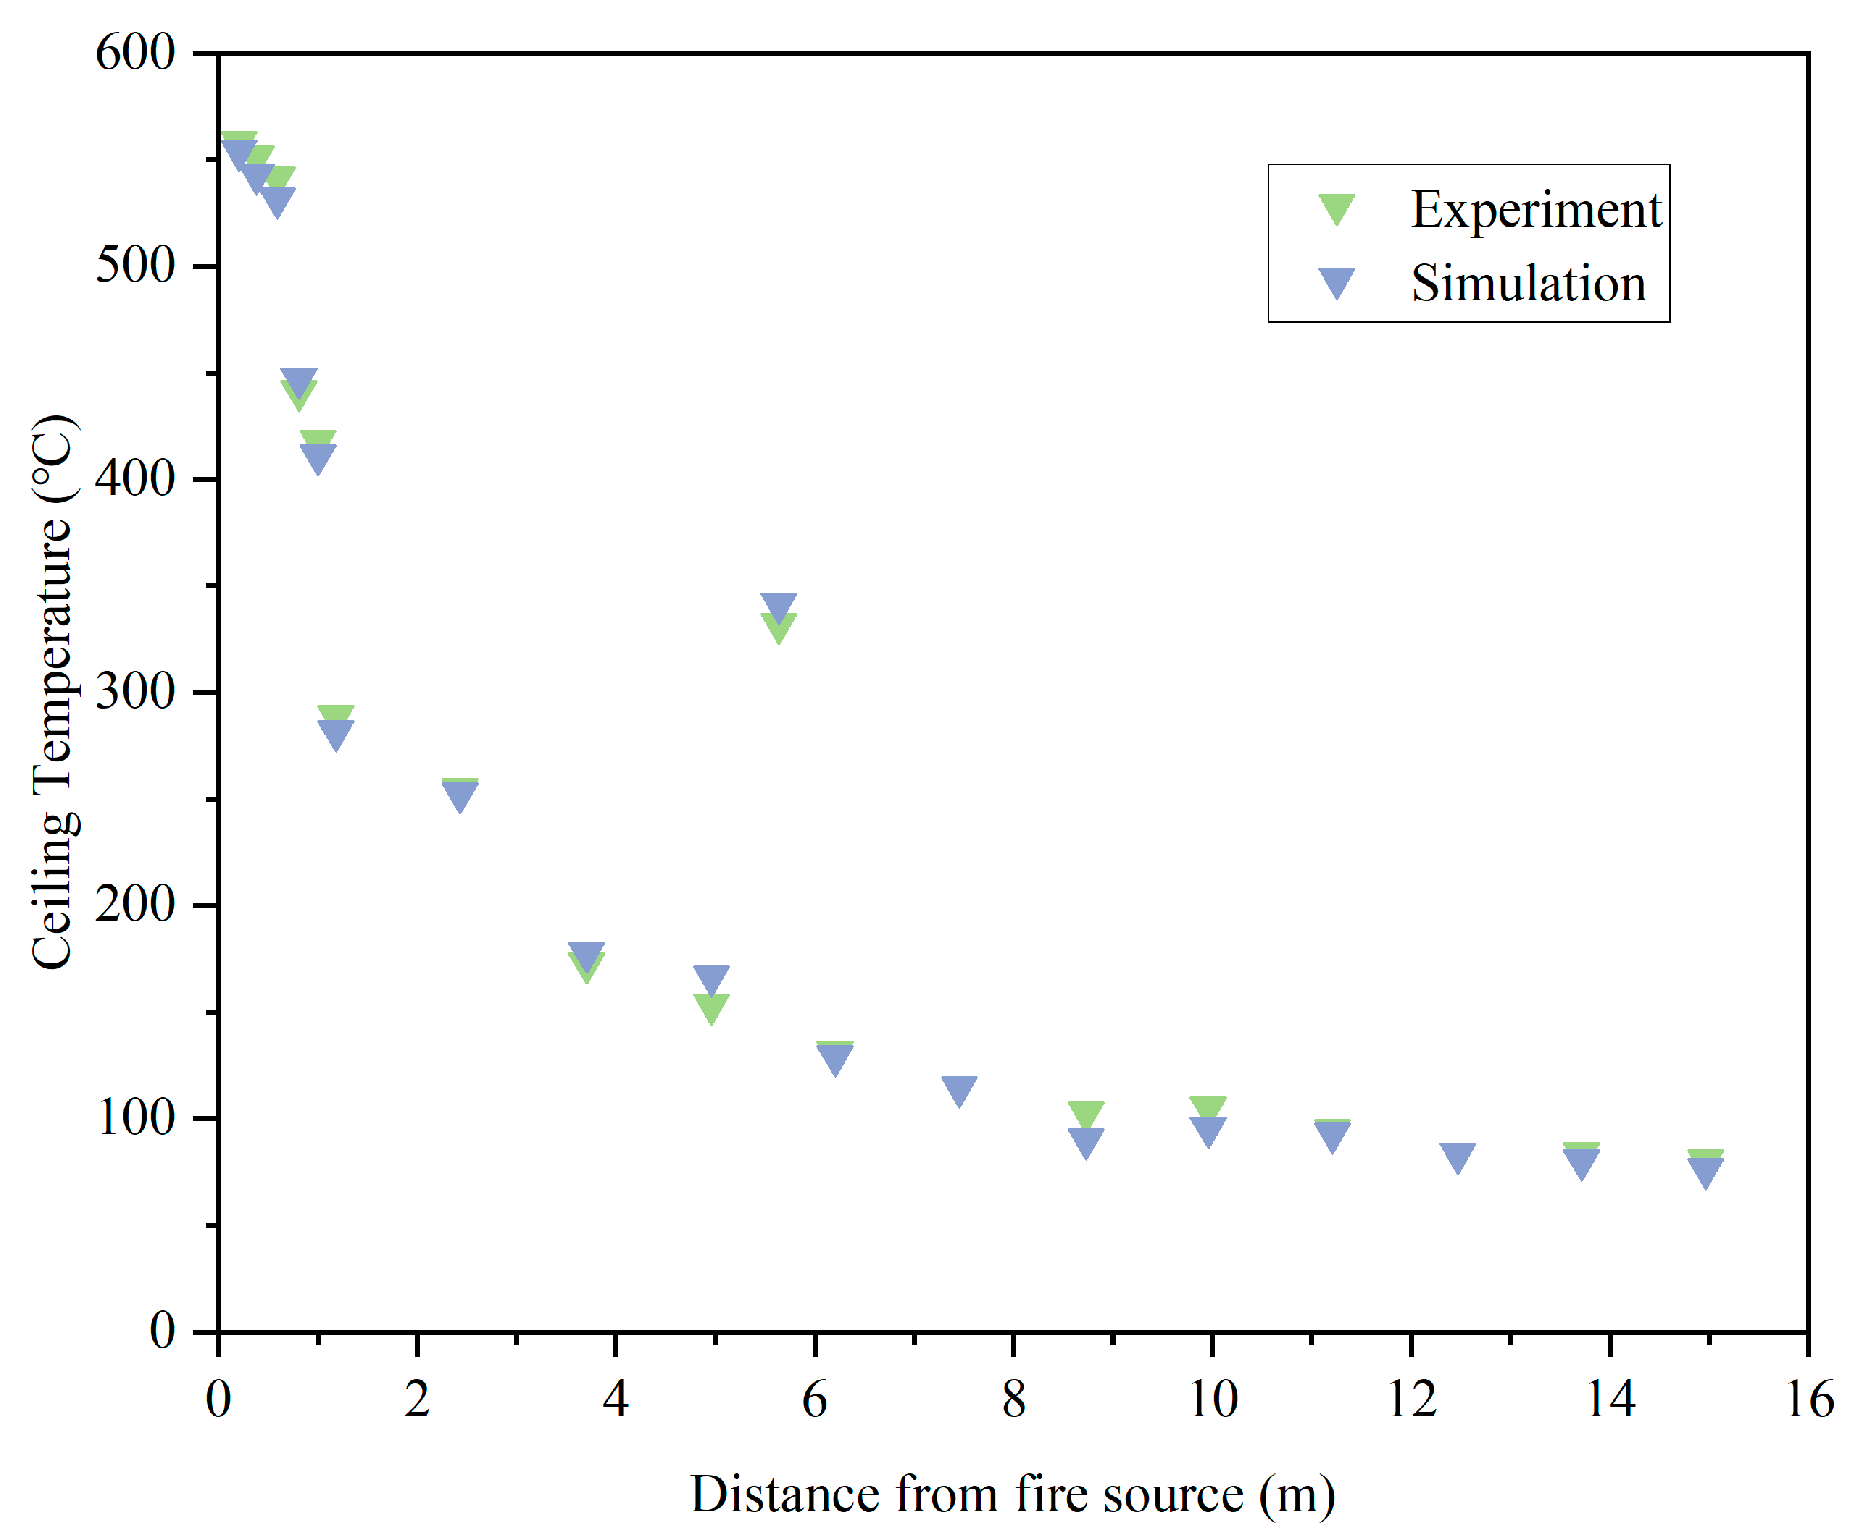
This model employs a thermocouple tree beneath the exhaust port, with 8 K-type thermocouples distributed for measuring the temperature distribution in a flat space. Additionally, 18 K-type thermocouples are horizontally arranged at a height of 2.2 m, used to measure the ceiling temperature. This is exactly the same as the experimental temperature measurement equipment. As shown in Figure 2, the tree-shaped thermocouples are vertically installed below the A2 exhaust port, with the specific position being 15 m along the x-axis and 6 m along the y-axis. The 6 horizontal thermocouple measurement points are placed at a distance of 0.2 m to 1.2 m from the heat source, with an interval of 0.2 m, while the remaining 12 horizontal thermocouple measurement points are placed at a distance of 1.25 m to 15 m from the heat source, with an interval of 1.25 m. The experimental data are labeled as K-2.2 m, K-2 m, K-1.8 m, K-1.6 m, K-1.4 m, K-1 m, K-0.6 m, and L-0.2 m, L-0.4 m, L-0.6 m, L-0.8 m, L-1.0 m, L-1.2 m, L-1.25 m, L-2.5 m, L-3.75 m, L-5 m, L-6.25 m, L-7.5 m, L-8.75 m, L-10 m, L-11.25 m, L-12.5 m, L-13.75 m, and L-15 m. The number after “K” indicates the bottom distance of the thermocouple in the verification model, and the number after “L” indicates the distance of the thermocouple from the heat source in the verification model. For example, K-2.2 m represents the actual experiment where the thermocouple is 2.2 m below the bottom, and L-0.2 m represents the actual experiment where the thermocouple is 0.2 m from the heat source. When using PyroSim software for simulation, the solid surface uses the “Wall” boundary condition to construct a hexahedron with a size of 30 m (length) × 24 m (width) × 2.3 m (height). Six exhaust outlets are set for mechanical smoke exhaust, and the exhaust volume of each exhaust outlet is 29.89 m3/s. Four air inlets are set for mechanical ventilation, and the air intake volume of each air inlet is 41.67 m3/s, to meet the requirements of experimental condition 20. The smoke exhaust and air inlet are set to open after 60 s, and the simulated conditions under A2 exhaust are consistent with the experimental conditions.
Figure 3 and Figure 4, respectively, present the comparison diagrams of the experimental and simulation results of the tree-like structure used to measure the temperature distribution below the flat space exhaust outlet and the horizontal thermocouple detector used to measure the ceiling temperature under different distance conditions. The model verification results show that the numerical simulation and the experimental data are in good agreement in predicting the temperature field. For the vertical temperature distribution of the tree-shaped thermocouple, the simulation reproduced the complete dynamic process observed in the experiment from 0 to 400 s of heating, 400 to 550 s of peak temperature and temperature drop, with the overall trend being consistent. For the ceiling temperature measured by the horizontal thermocouple, the simulation successfully captured the thermocouple temperature at a distance of 0 to 15 m from the fire source. Although there are local numerical deviations, this is mainly due to: the airflow of the mechanical ventilation system which may have minor turbulence and instability, which are difficult to fully reproduce in the simulation. The thermocouple measures its own heated temperature, not the true temperature of the surrounding gas. In high-temperature environments, it will underestimate the gas temperature due to radiation of heat to the cooler wall. However, the model’s reproduction of physical processes verifies its applicability in full-scale ship fire simulation. The blue curve in Figure 3 is the original reference data, and the green points in Figure 4 are the original reference data.
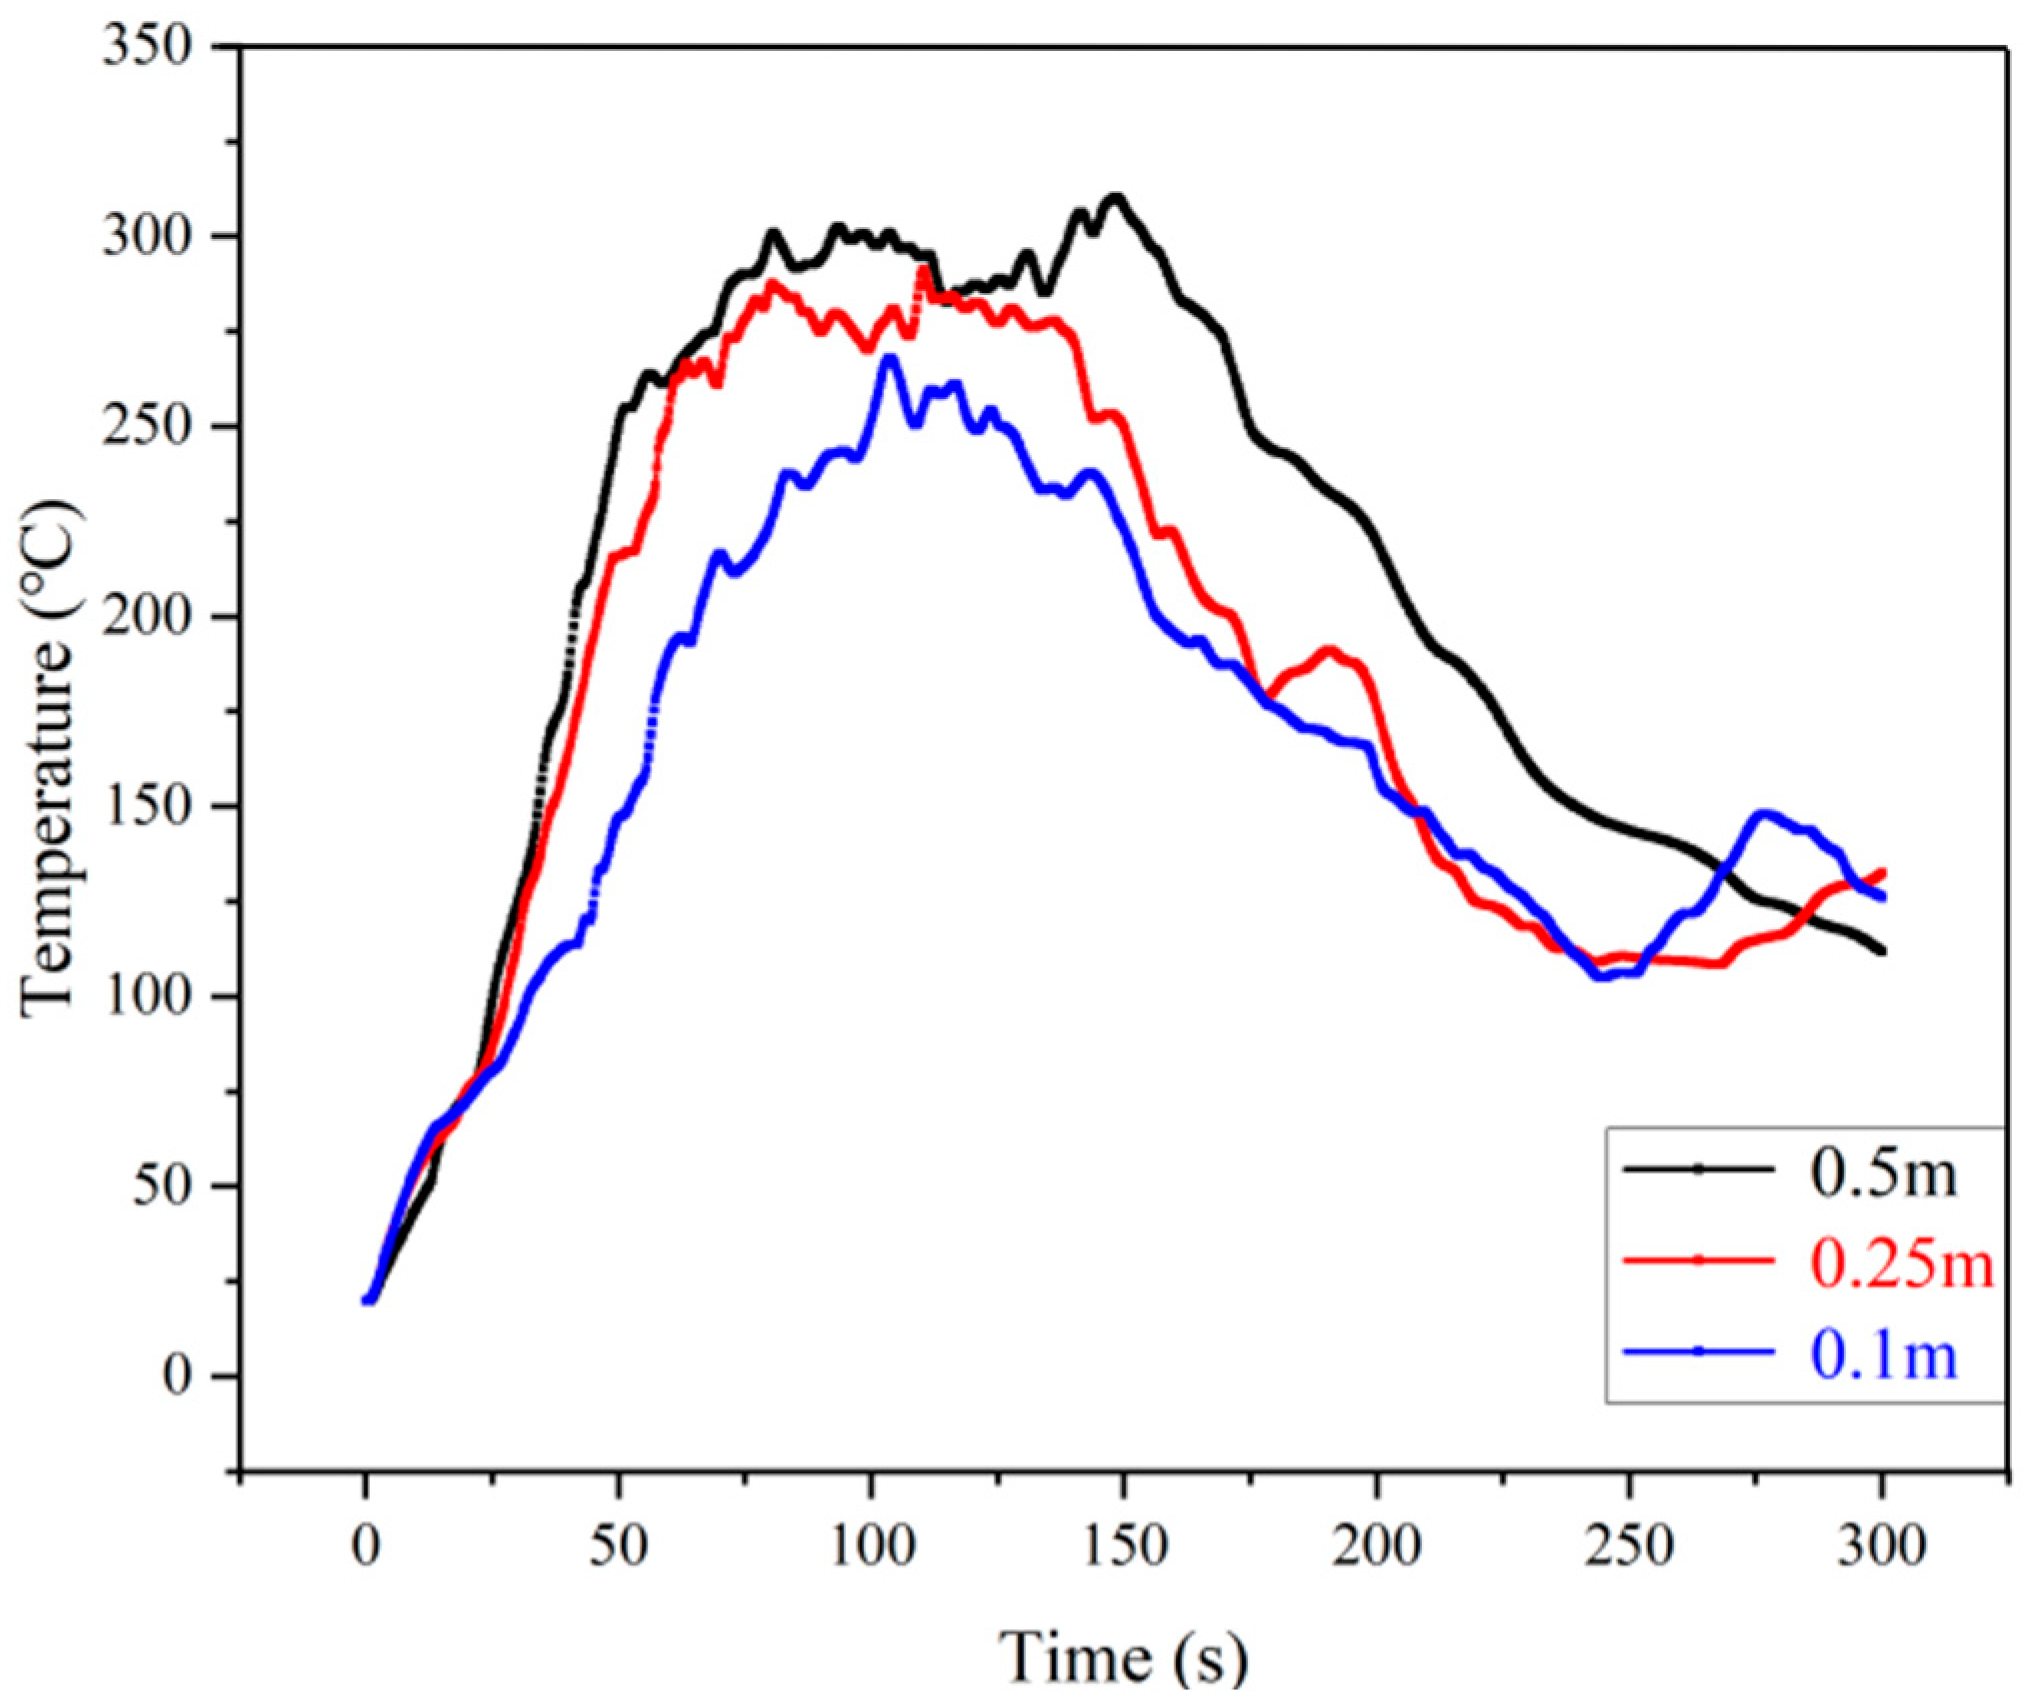
To ensure the accuracy and reliability of the PyroSim model results, a grid independence verification was conducted. A cube with a combustion material size of 2 m was set, and the measurement point positions were x = 0 m, y = 0 m, and z = 1 m. Other conditions were the same as the simulation. Three models with different grid sizes, namely 0.5 m, 0.25 m, and 0.1 m were analyzed. Figure 5 shows the simulated temperature curves of the measurement points under the three grid models. When the grid size was 0.5 m, it was unable to accurately capture the heat transfer and flow field changes at the microscopic scale of the fire, resulting in significant parameter fluctuations and large errors, which were not suitable for this simulation. As the grid was densified, the simulation results gradually became stable. When the grid size reached 0.25 m, the rate of change in the heat release rate of the fire source and the temperature at monitoring points decreased. During the continuous refinement process, the temperature fluctuation of the measurement points was less than 10 °C. Considering the computational cost and efficiency, 0.25 m was selected as the grid size for subsequent simulations.

5. Construction of Simulation Scenarios for Ro-Ro Passenger Ship Fires

5.1. Establishment of Geometric Model for Ship Cabin

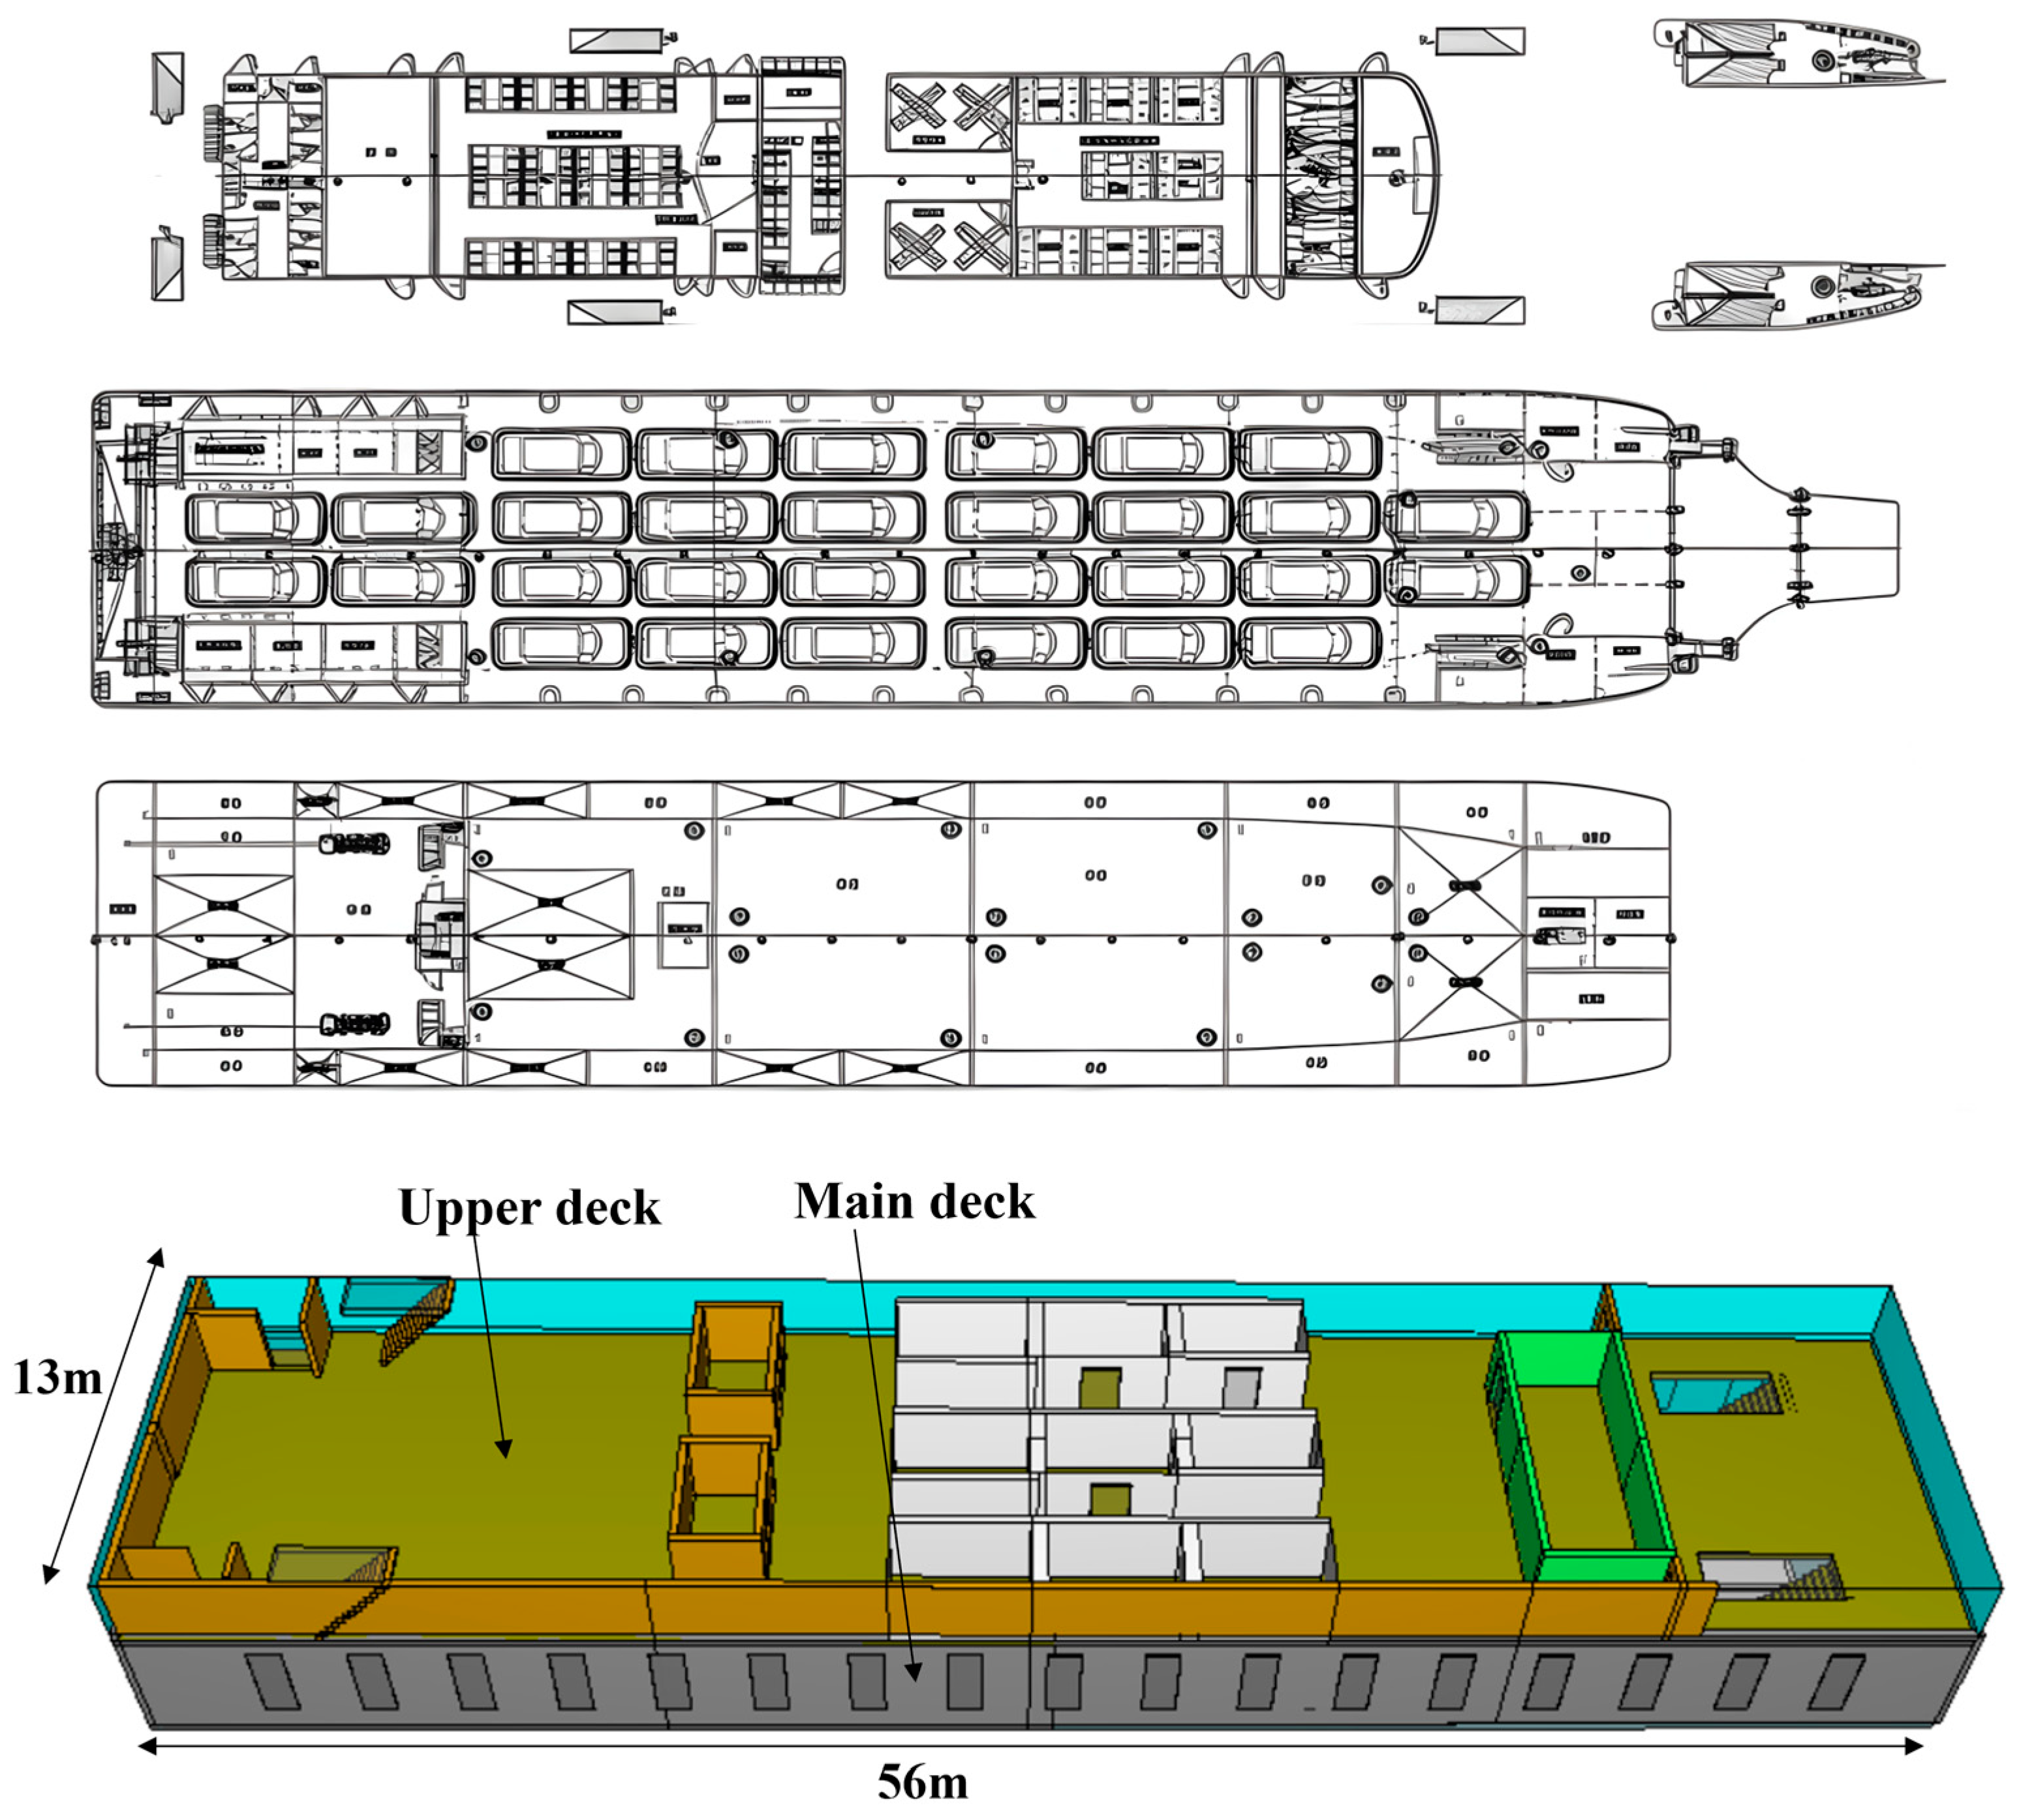
This article selected the deck and cabin area of the “Hehang Xinglong” ro-ro passenger ship as a prototype to establish an FDS fire mathematical model. The geometric model of the ro-ro passenger ship is shown in Figure 6.
Based on the modeling of the main deck and part of the upper deck, the ro-ro passenger ship was 56.0 m in length, 13.0 m in width and 4.25 m in height. The interior rooms of the upper deck cabin were simplified into a cab, nine guest rooms and two shower rooms. Among them, the cabin was 46.5 m long, 13 m wide and 2.5 m high. The front deck of the cabin was in an open-air environment. The main deck vehicle cabin was set as an open-air environment. There were ventilation openings on the walls on both sides to ensure the air circulation in the cabin. The left and right spacing of the vehicles was 1 m, and the front and rear spacing was 2.5 m. The thickness of all the decks and walls of the ro-ro passenger ship was 0.2 m. The upper deck material was thermal insulation material, and the main deck material was steel. The specific geometric model is shown in Figure 7.

5.2. Establishment of Fire Protection System Model

Fire incidents often occur on car decks, and car deck compartments are ventilated and not enclosed. Therefore, this article used a water sprinkler system as a fire protection system model to conduct fire research.
According to the International Maritime Organization Fire Suppression System Code (FSS Code), a total of 70 nozzles were installed in the vessel. The deck length was 56 m, with one nozzle installed every 4 m, and there were 14 nozzles in each row. The deck width was 13 m, with one nozzle installed every 2.6 m, and there were 5 nozzles in each column. This ensured that the coverage area of all nozzles complies with the current ship standards. All nozzles were approximately 4 m above the carriage deck and were evenly distributed on the carriage deck. The nozzle parameters were set in accordance with NFPA 750 “Standard for Fine Water Mist Fire Suppression Systems”, which defines fine water mist as Dv0.99 < 1000 μm. The response temperature of the sprinkler system was 68.33 °C, the number of droplets per second was 5000, the working pressure was 60 bar, the K factor was 1.8 L / m i n a t m 1 : 2 L/(min·atm1:2), the flow rate was 13.857 min/L, and the response time index was 80 (m·s)1/2. This ensured that each nozzle can radiate to the surrounding four carriages, thereby ensuring that once activated, the entire carriage deck can be completely extinguished and cooled [39]. The flow rate and pressure settings here constitute the benchmark conditions for subsequent research. However, in the analysis and optimization in the following text, we will focus on examining the impact of changing key parameters such as droplet size or working pressure on the fire suppression efficiency on top of this benchmark. Figure 8 shows the distribution of 70 nozzles in the sprinkler system:

5.3. Boundary Conditions and Measurement Point Settings

In the simulation, three potential fire source points were set in the center of the car deck of the ro-ro passenger ship. Among them, the vehicle located in the center was first ignited, and then the vehicles on both sides of it were ignited, to comprehensively analyze the diffusion trend of smoke on the car deck after the fire, the change in temperature field and the distribution of visibility. The central vehicle acted as the initial fire source, while the vehicles on both sides were ignited after a delay of 120 s, becoming the secondary fire source.
The maximum heat release rate was set to 3 MW, and the simulated fire time was set to 300 s [40]. The model boundary type was set to open type, including all entities as walls. The initial temperature was set to 20 °C. The ventilation mode was set to natural ventilation without any mechanical ventilation equipment, which was fundamentally different from the ventilation mode in typical building fires. The initial atmospheric pressure was set to 101.325 kilopascals. It was assumed that the initial temperatures and pressures of each area in the cabin remain consistent. During the stage of fire spread, it is usually assumed that the heat release rate increases “quadratically”, rising rapidly until it reaches a plateau, at which point the fire is considered fully developed. However, the heat release rate may also immediately start to decrease after reaching the maximum heat release rate. This is because most of the fuel has been consumed and the decay stage has begun. These qualitative fire behaviors can all be explained using the parameterized HRR form given by Equation (1) [41]. The heat output rate represents the heat released per time unit during the material’s combustion process and is usually calculated using the t2 fire model method.
Q ˙ ( t ) = Q ˙ i n c t / t i n c , 0 t t i n c Q ˙ i n c + a t t i n c 2 , t i n c < t t g Q ˙ m a x , t g < t t d Q ˙ m a x e t t d / τ d , t > t d
Here, the heat release rate Q ˙ (kW) at the end of the initial stage is presented; t represents the time point when the fire starts to spread; tg is the time required to reach the maximum heat release rate; α represents the fire intensity coefficient (kW/s2); td is the time point when the attenuation stage begins; s is the attenuation coefficient. For local fires in large spaces, the heat release rate in the fire can be expressed as time t2. In other words, the ideal growth period of a large-space local fire conforms to the t2 fire model. In addition, this paper used the ultra-fast growth fire model to simulate pool fires, and the fire growth coefficient α was set to 0.1876 kW/s2. Given that the method was consistent with the actual situation in fires, this method was used to describe the power of the fire source under this condition, without considering its attenuation stage. The simulation characterizes the battery thermal runaway process by constructing a dedicated electrochemical reaction model. The “lithium-ion thermal runaway” reaction was defined as: C3H4O3 + 2.5 O2→3CO2 + 2 H2O. The fuel was the main component of the electrolyte, ethylene carbonate C3H4O3, and its structural information was as shown in Table 2 [42].
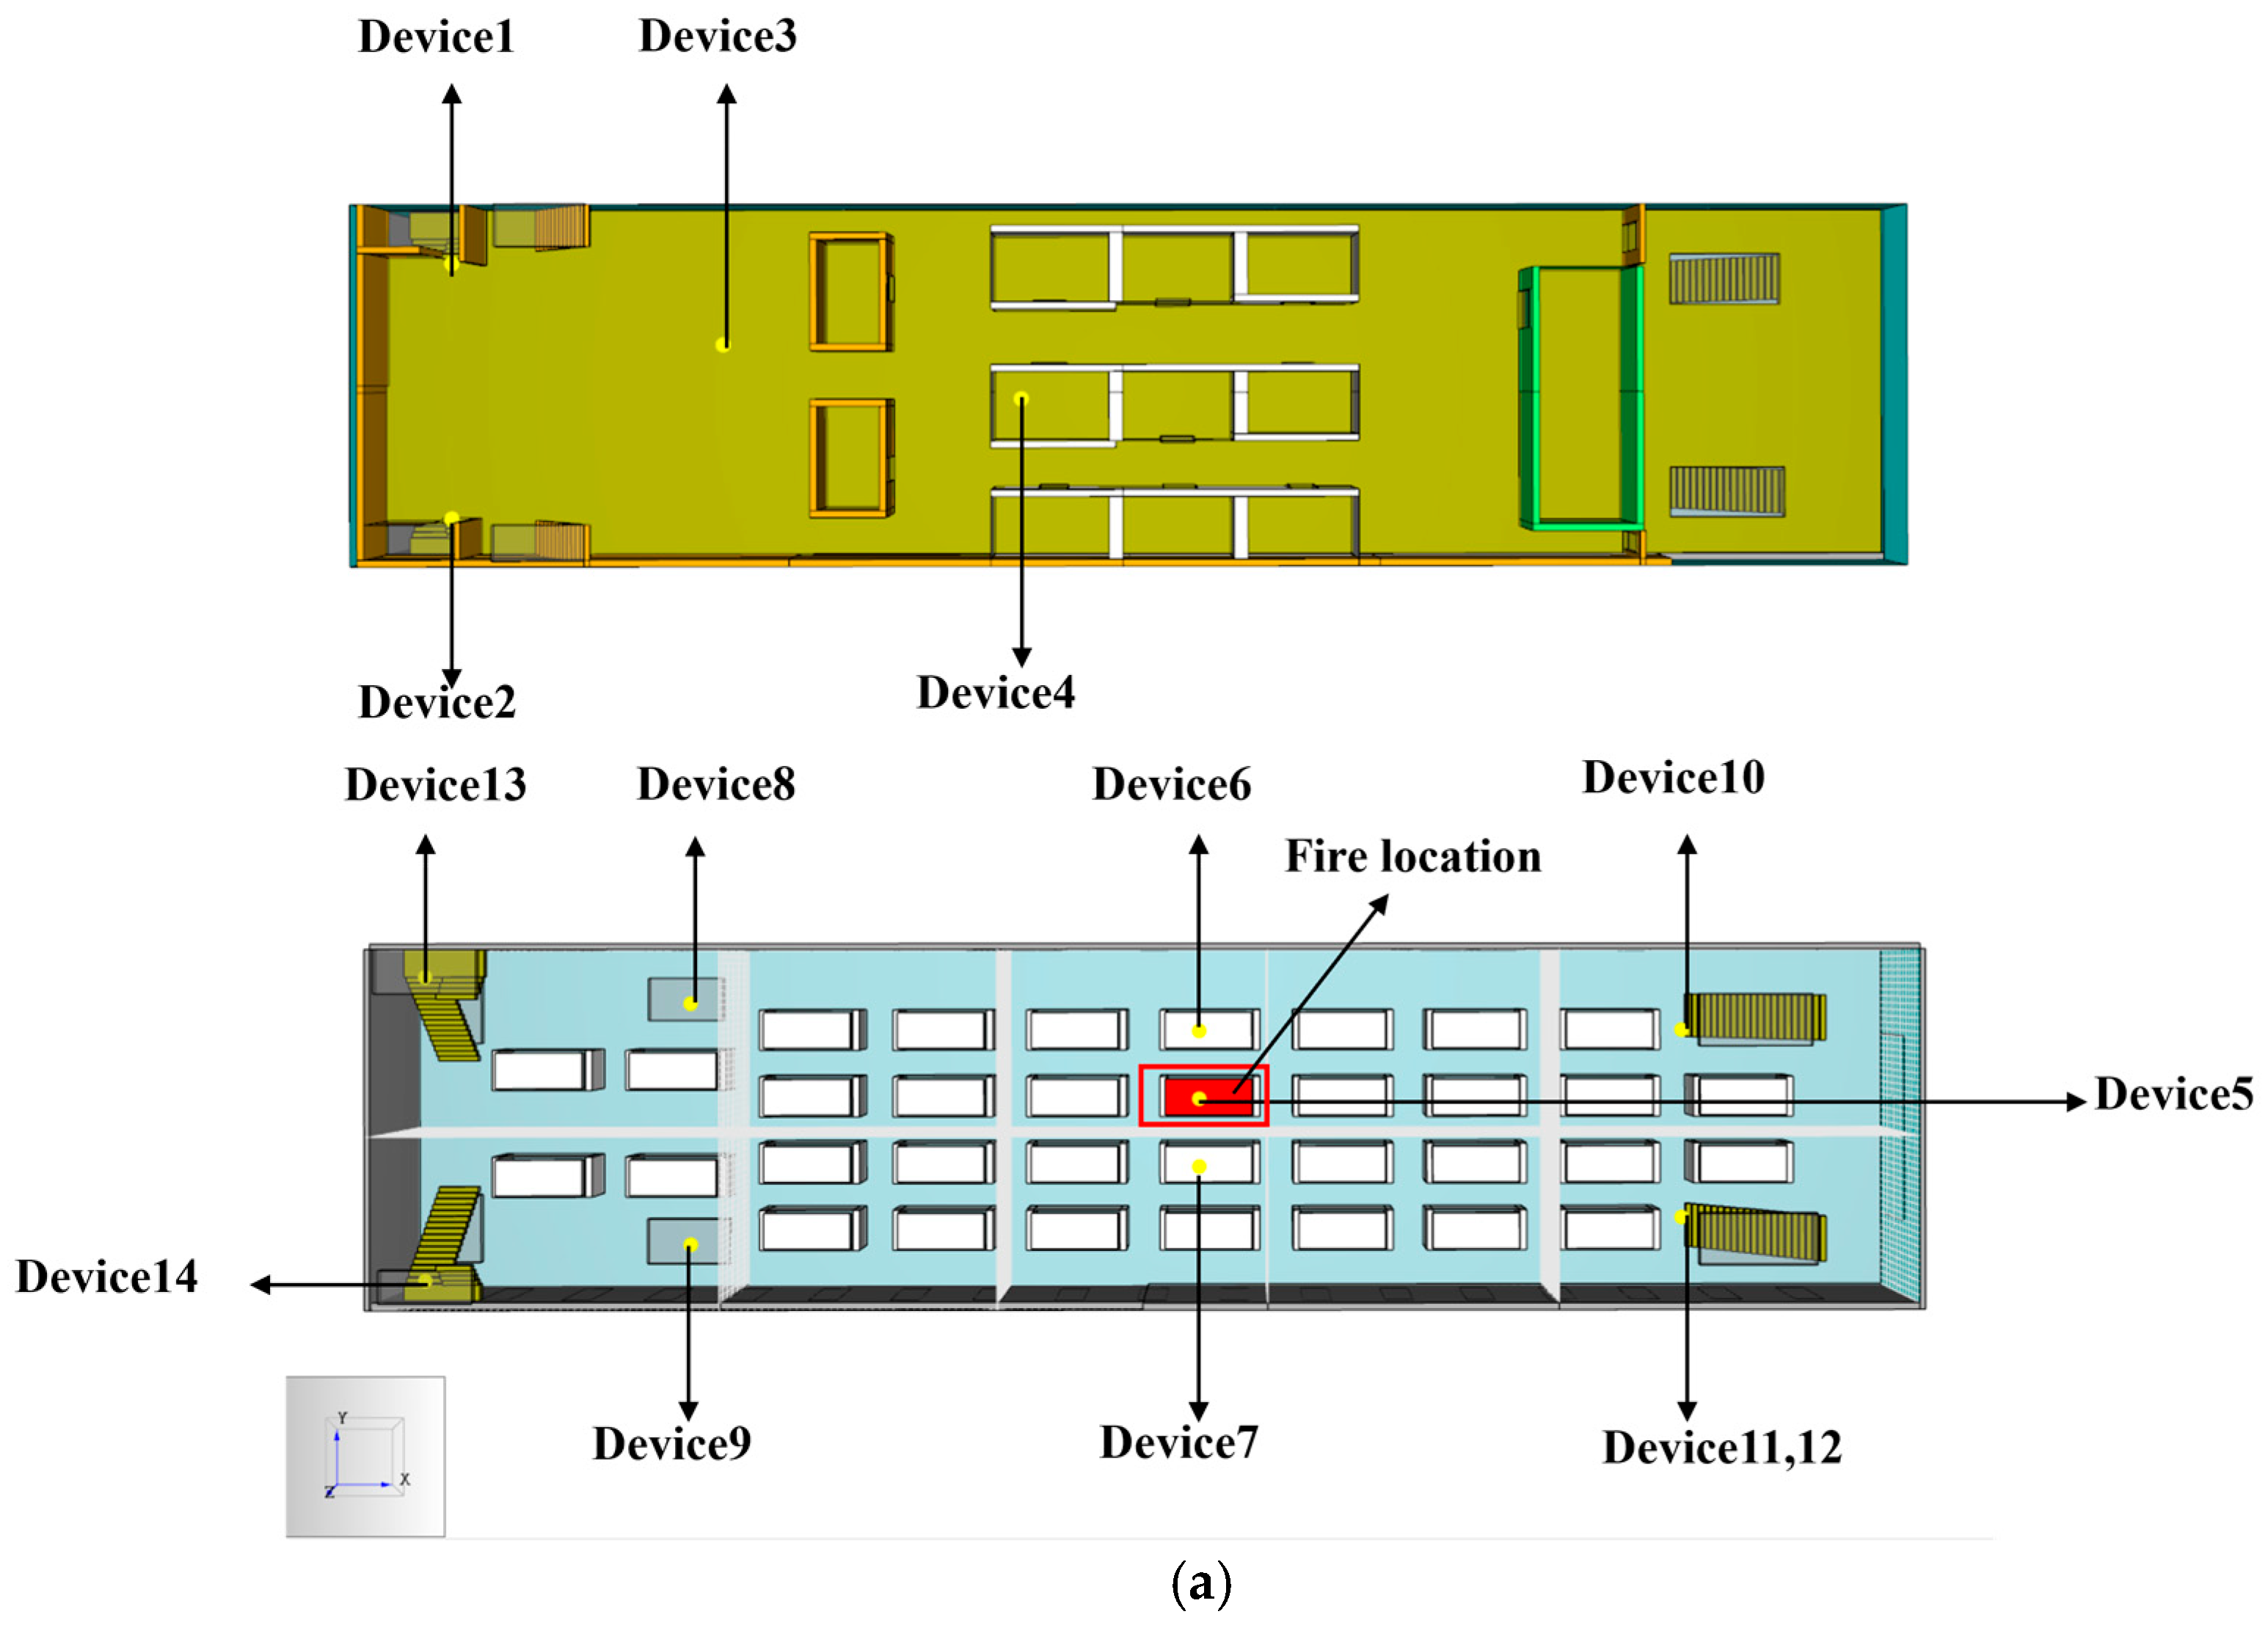
Figure 9a and Figure 9b, respectively, show the layout positions of 14 monitoring points and 14 monitoring surfaces. The monitoring points are used to monitor the visibility of each staircase, the temperature above the three fire sources, and the temperature of the upper deck guest rooms. Among them, monitoring point 5 was located directly above the fire source, while monitoring points 6 and 7 were near the fire source and both have a height of 3 m. Monitoring points 3 and 4 were located in the corridor and rooms of the upper living area. Monitoring points 3, 4, 5, 6, 7, 11, and 12 were used to measure temperature, while monitoring points 1, 2, 8, 9, 10, 13, and 14 were used to detect visibility. The monitoring surfaces were arranged at 30 m along the X-axis, 2.5 m along the Y-axis, 5 m along the Y-axis, 7.5 m along the Y-axis, 10 m along the Y-axis, and 3 m along the Z-axis, and were used to monitor the heat propagation, temperature changes, and smoke diffusion during a fire occurrence in real time.

5.4. Mesh Sensitivity Analysis

To balance the accuracy of ro-ro passenger ship fire simulation and computational efficiency, the study conducted a grid sensitivity analysis of the fire scenario. Rectangular grids are provided in FDS to divide the computational domain, and the grid cell size is usually set as an integer multiple of 2, 3, or 5. When the ratio of the fire characteristic diameter to the grid size D * /δ_x is between 4 and 16, the model results are relatively accurate [43]. The formula for the fire characteristic diameter D* is as follows:
D * = Q ˙ ρ C p T g 2 / 5
In the formula:
ρ —The density of ambient air, take 1.295 kg/m3;
C p —The specific heat of ambient air, take 1.01 KJ/kg;
T —Ambient air temperature, take 293 K;
g —Gravitational acceleration, take 9.8 m/s2;
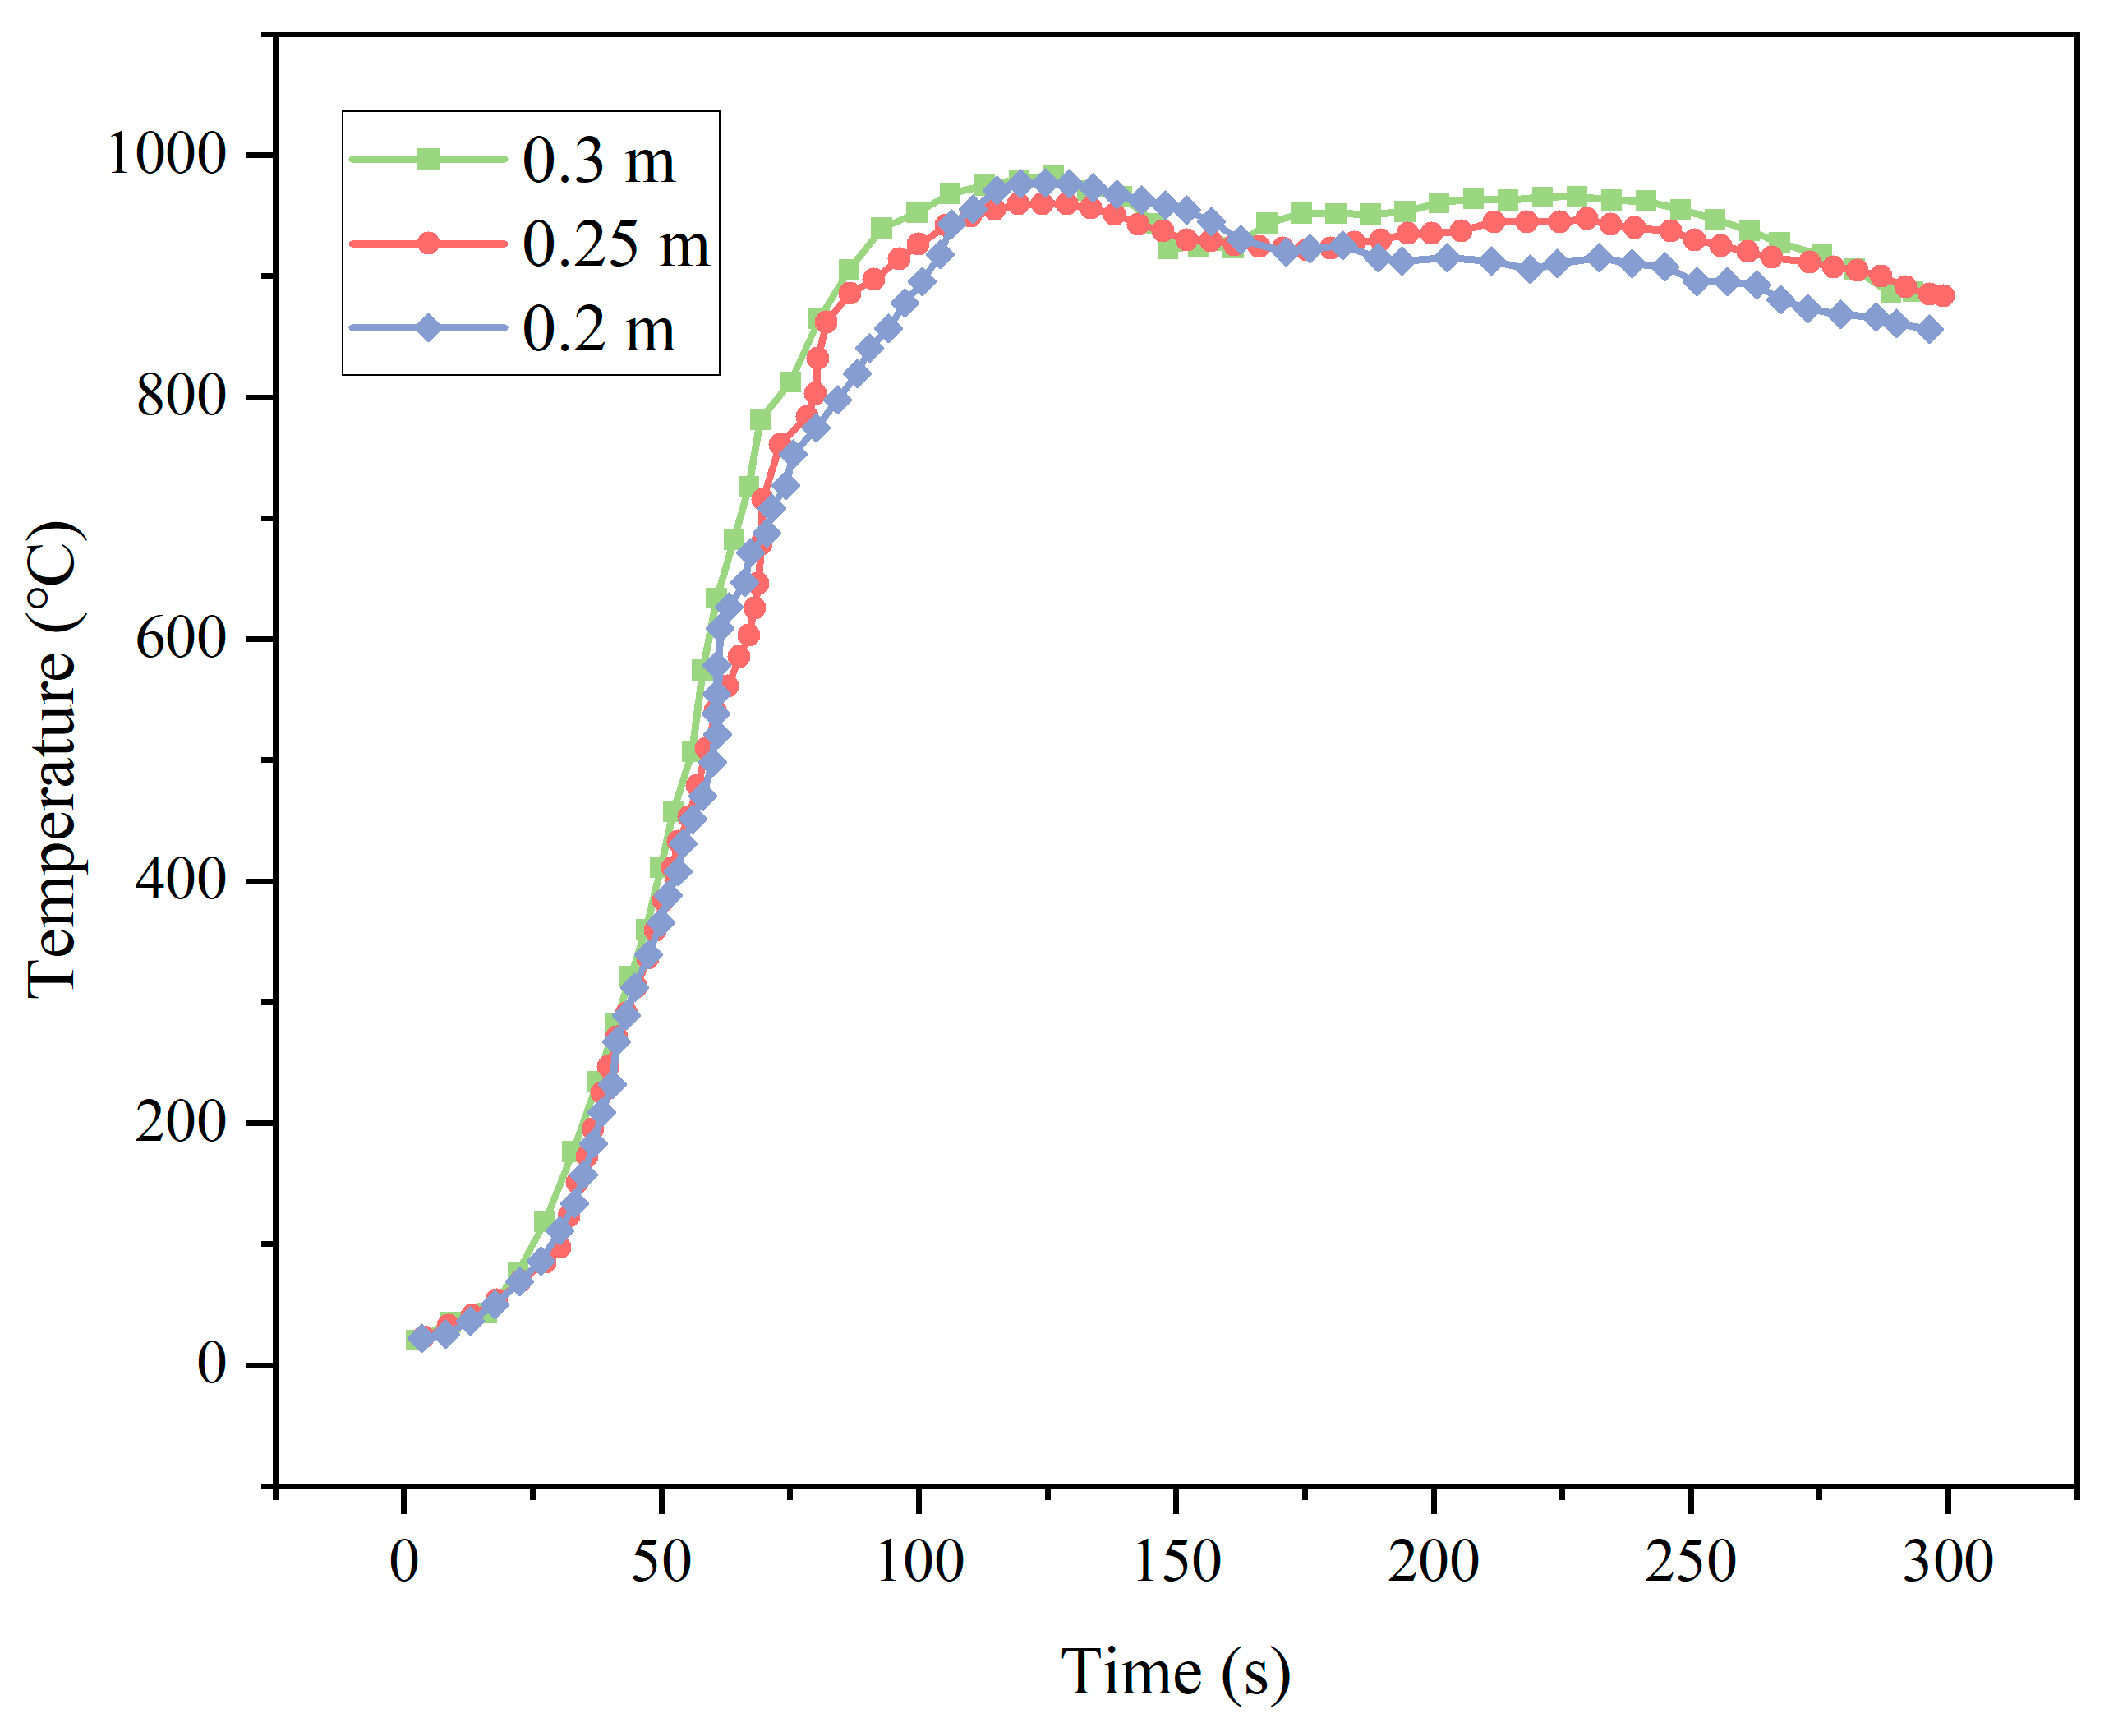
As shown in Figure 10, the temperature field distributions under grid sizes of 0.3 m, 0.25 m, and 0.2 m were compared to evaluate the influence of grid size on the simulation results. By comparing the temperature changes in the thermocouple above the fire source, it was found that due to the relatively rough 0.3 m grid, it was unable to accurately capture the microscopic processes such as flame heat radiation, smoke convection, and turbulent diffusion, resulting in significant temperature fluctuations and large errors. To quantify the grid discretization error, the grid convergence index (GCI) was further used for verification [44]. The form of GCI corresponding to the grid solution is as shown in Formula (3):
G C I m n = F s ε r m s m n r p 1
When n = [1, 2] and m = [2, 3], during the stage of refinement, ε r m s is the relative root mean square error, which is defined as:
ε r m s   m n = i 1 k ε m n 2 k 1 / 2
Among them, Fs represents the safety factor; p is the apparent accuracy order; ε is the relative error; r indicates the grid refinement factor. When there are three grid solutions available and all the solutions are within the asymptotic range, F equals 1.2. As the grid is refined, the changes in the simulation results gradually decrease, and the analysis of the GCI ratio confirms that it has entered the asymptotic convergence range. Although there are certain numerical fluctuations in the high-gradient areas such as the flame core, for the overall fire dynamics behavior and key safety parameters that determine the performance of the fire suppression system, the simulation results of these safety parameters have good grid independence. At the same time, when the grid size is 0.25 m, the simulation results tend to be stable, can better reflect the distribution of the fire temperature field and heat transfer laws, and have a higher calculation efficiency. Although the accuracy of the 0.2 m grid is close to that of the 0.25 m grid, the calculation volume increases sharply and the efficiency significantly decreases.
The mesh model is shown in Figure 11. Considering the selection of a 0.25 m mesh in this study, and to improve the calculation speed, the mesh was divided into 16 parts for independent calculation.

6. Analysis and Discussion of Simulation Results and Optimization of Fire Protection System

6.1. Analysis of the Influence Radius of a Single Vehicle Fire

Currently, most new energy vehicles use lithium batteries, and the capacity of these batteries is continuously increasing. Many researchers focus on the thermal runaway mechanism, gas generation, and flame behavior of large-capacity lithium iron phosphate batteries [31,45,46,47]. The battery capacities used in the above studies range from 27 Ah, 86 Ah, 105 Ah, to 243 Ah. Although the thermal runaway mechanism of batteries in the same material system is the same, due to the difference in capacity, the flame behavior after vehicle ignition shows significant differences. This study takes the fire scenario of lithium-ion battery energy storage facilities as the simulation object, systematically exploring the influence of different battery capacities on the spread range of electric vehicle fires. Referring to existing studies, the battery capacities selected for testing were 20 Ah, 60 Ah, 120 Ah, 180 Ah, and 240 Ah, covering the range from typical small to large commercial power batteries. In terms of heat release rate setting, Cui [48] and Wang [49] pointed out that the heat release rates of multiple groups of batteries are not a simple multiple relationship with that of a single group of batteries, showing significant non-linear characteristics, and approximately following a 1.2th power relationship. The lithium battery warehouse studied in reference [48] was a confined ventilation environment with poor air circulation, reflecting the thermal coupling effect under the condition of limited oxygen supply. This study, however, focused on the vehicle compartments of the ro-ro passenger ships, which had side ventilation openings and natural ventilation conditions. Theoretically, improved ventilation conditions would promote combustion, and the intense radiation feedback caused by flames and hot smoke accumulation might accelerate the battery thermal runaway process. However, the confined space might also lead to incomplete combustion in the later stage of the fire. These complex factors make the actual heat release rate likely to deviate from any simple linear relationship. This paper adopts the 1.2 power relationship for estimation, which provides a unified reference for performance evaluation. However, the natural ventilation environment of ro-ro passenger ships may lead to more severe fires, which poses the risk of insufficient safety margin for the fire protection system designed based on data, but also indicates the necessity of optimizing the fire protection system for the natural ventilation environment.
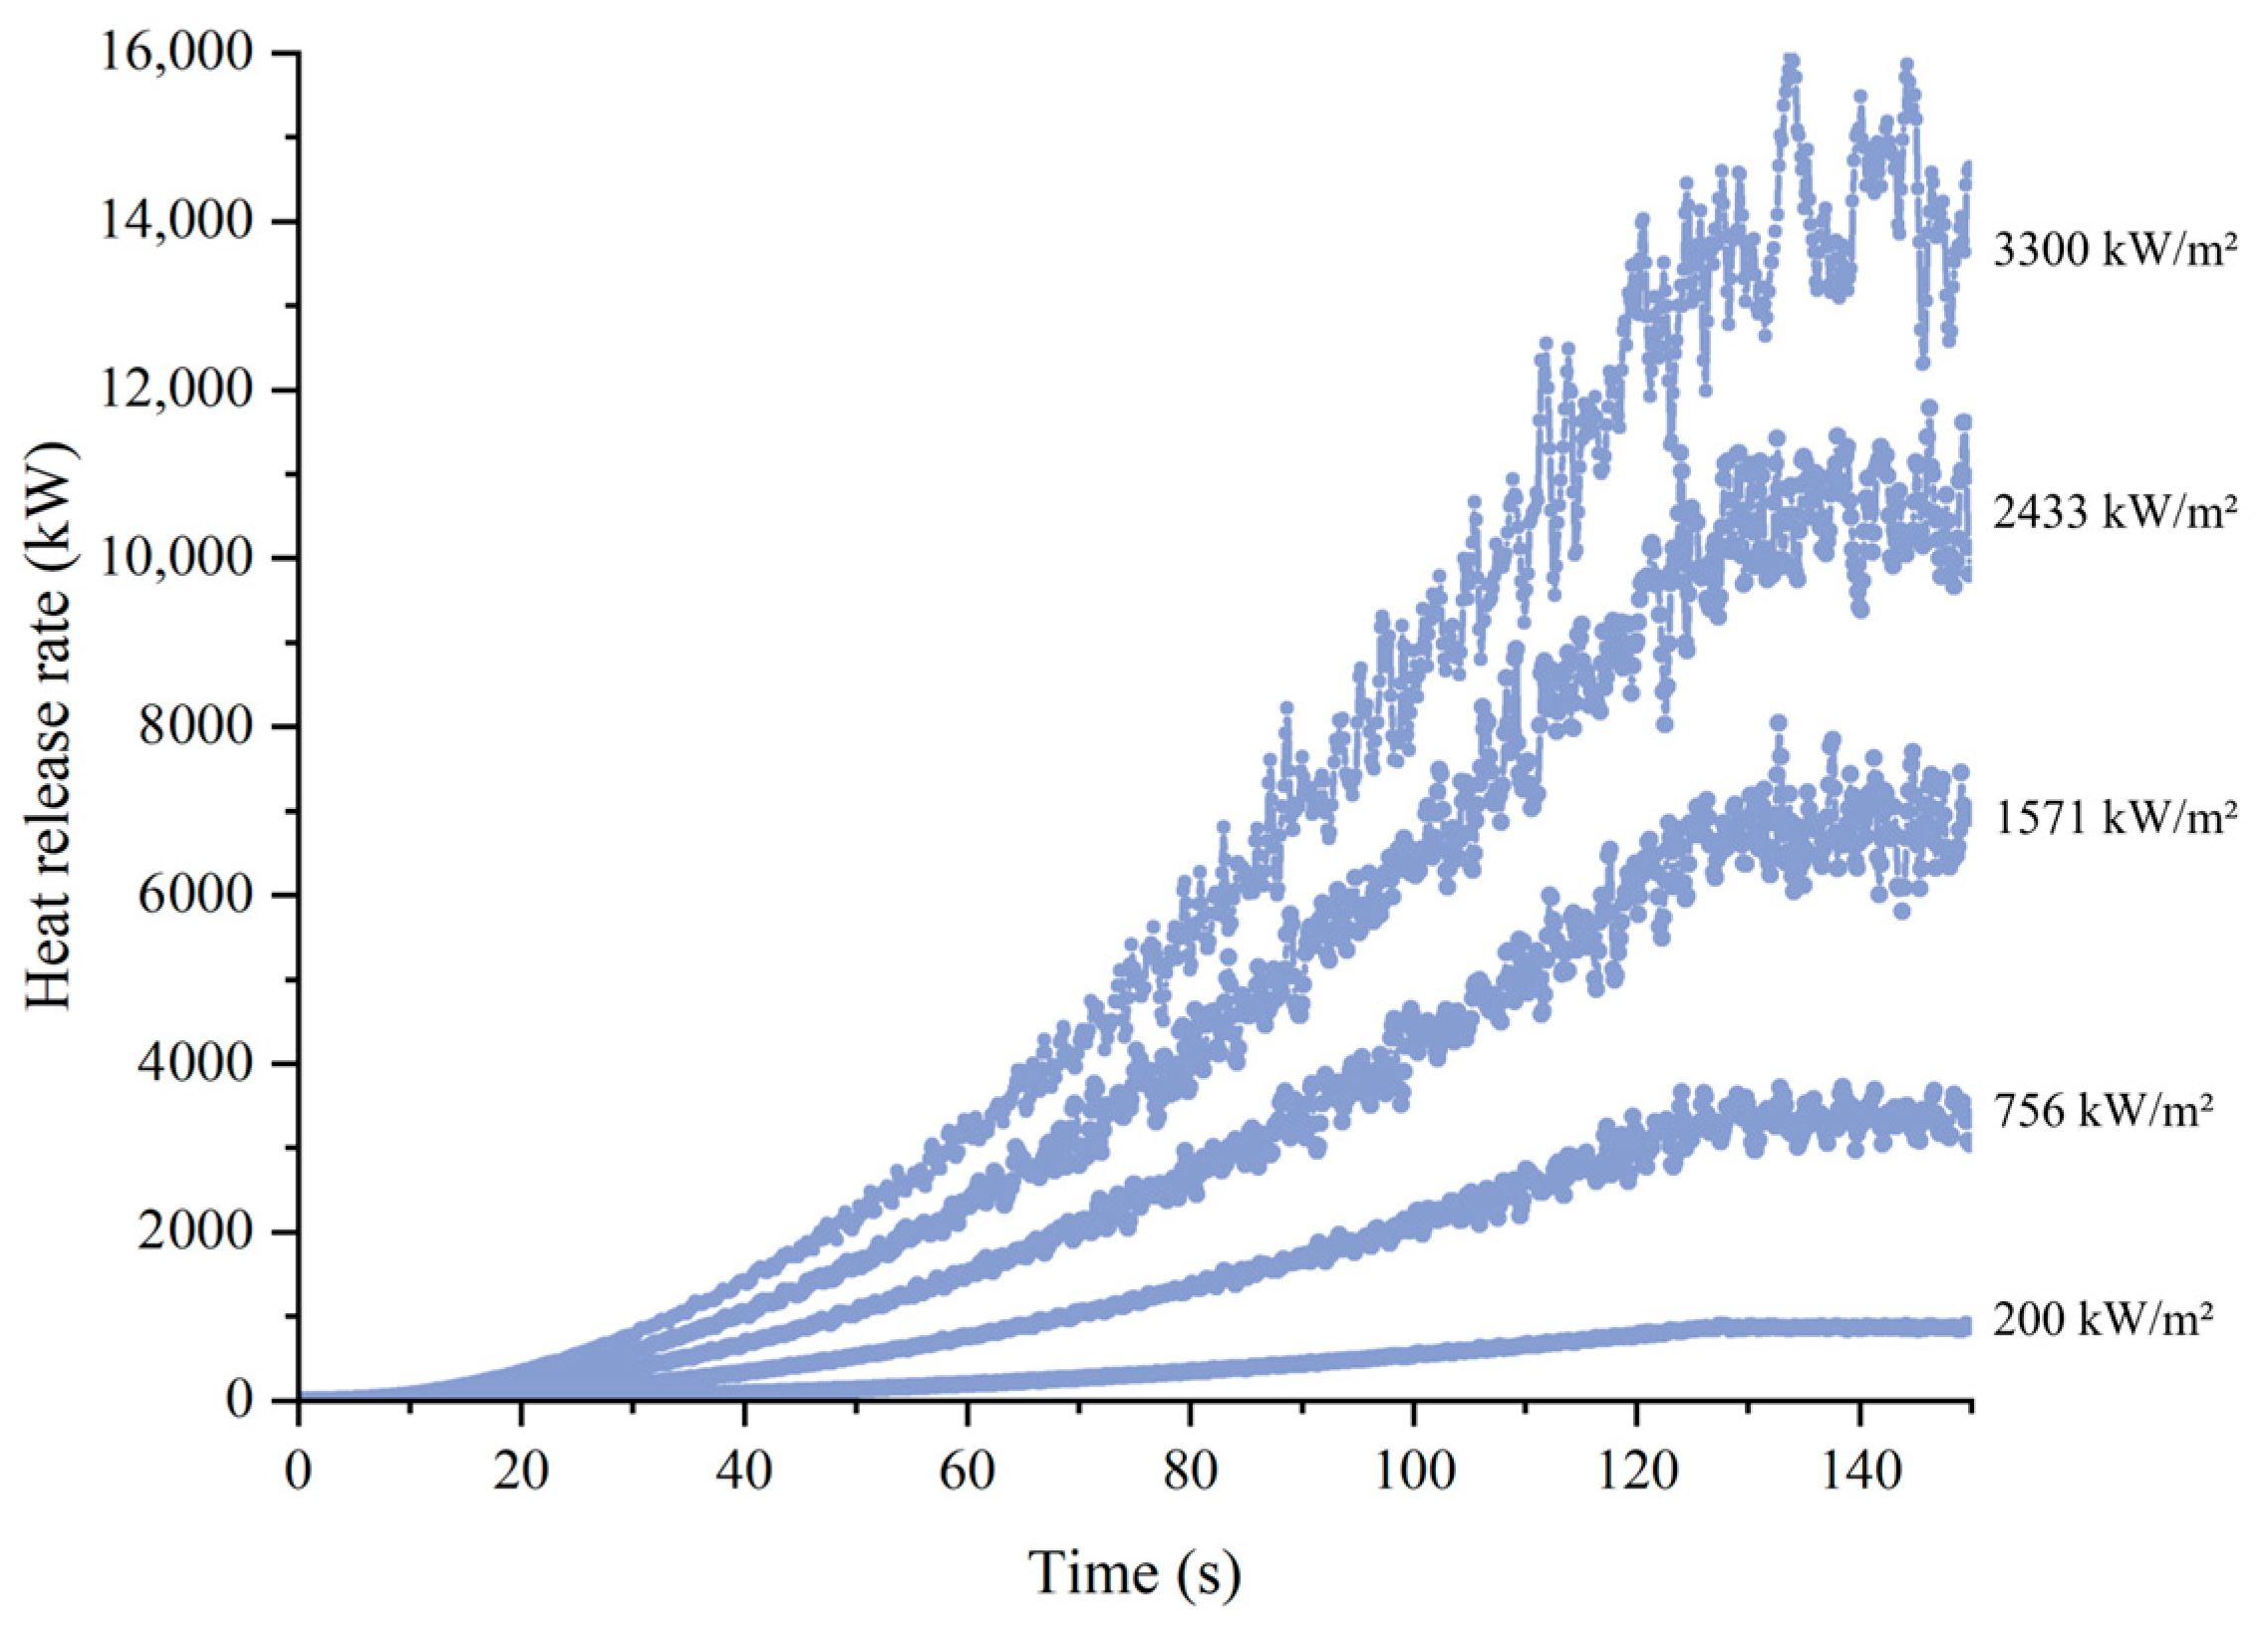
Although there is uncertainty regarding the precise power exponent, the core conclusion that “fire risk increases super-linearly with battery capacity” is robust and can provide a reasonable and conservative benchmark for the performance assessment of fire protection systems. Based on this, when conducting research on battery capacity, the reference value of the unit area heat release rate corresponding to a 240 Ah battery is set at 3300 kW/m2, which is within the reasonable range of the peak heat release rate of large-capacity batteries. The unit area heat release rates corresponding to different battery capacities are obtained as follows: 200 kW/m2 (20 Ah), 756 kW/m2 (60 Ah), 1571 kW/m2 (120 Ah), 2433 kW/m2 (180 Ah), and 3300 kW/m2 (240 Ah). This parameter setting ensures that the simulation conditions have systematicity and comparability among different capacities, thereby effectively evaluating the impact of battery capacity on the fire dynamics behavior. At the same time, to improve computational efficiency, in this section, only a single fire source is set, and the simulation time is uniformly set to 150 s. The initial conditions and fire source settings have been given in Section 5. Figure 12 shows the curves of the heat release rate changes over time when different battery capacities catch fire as obtained through FDS simulation. The HRR gradually increases in the initial stage, then rises sharply, remains fluctuating in the stable stage, and the higher the battery capacity, the more chemical energy is stored internally, and the total energy released during thermal runaway is also higher.
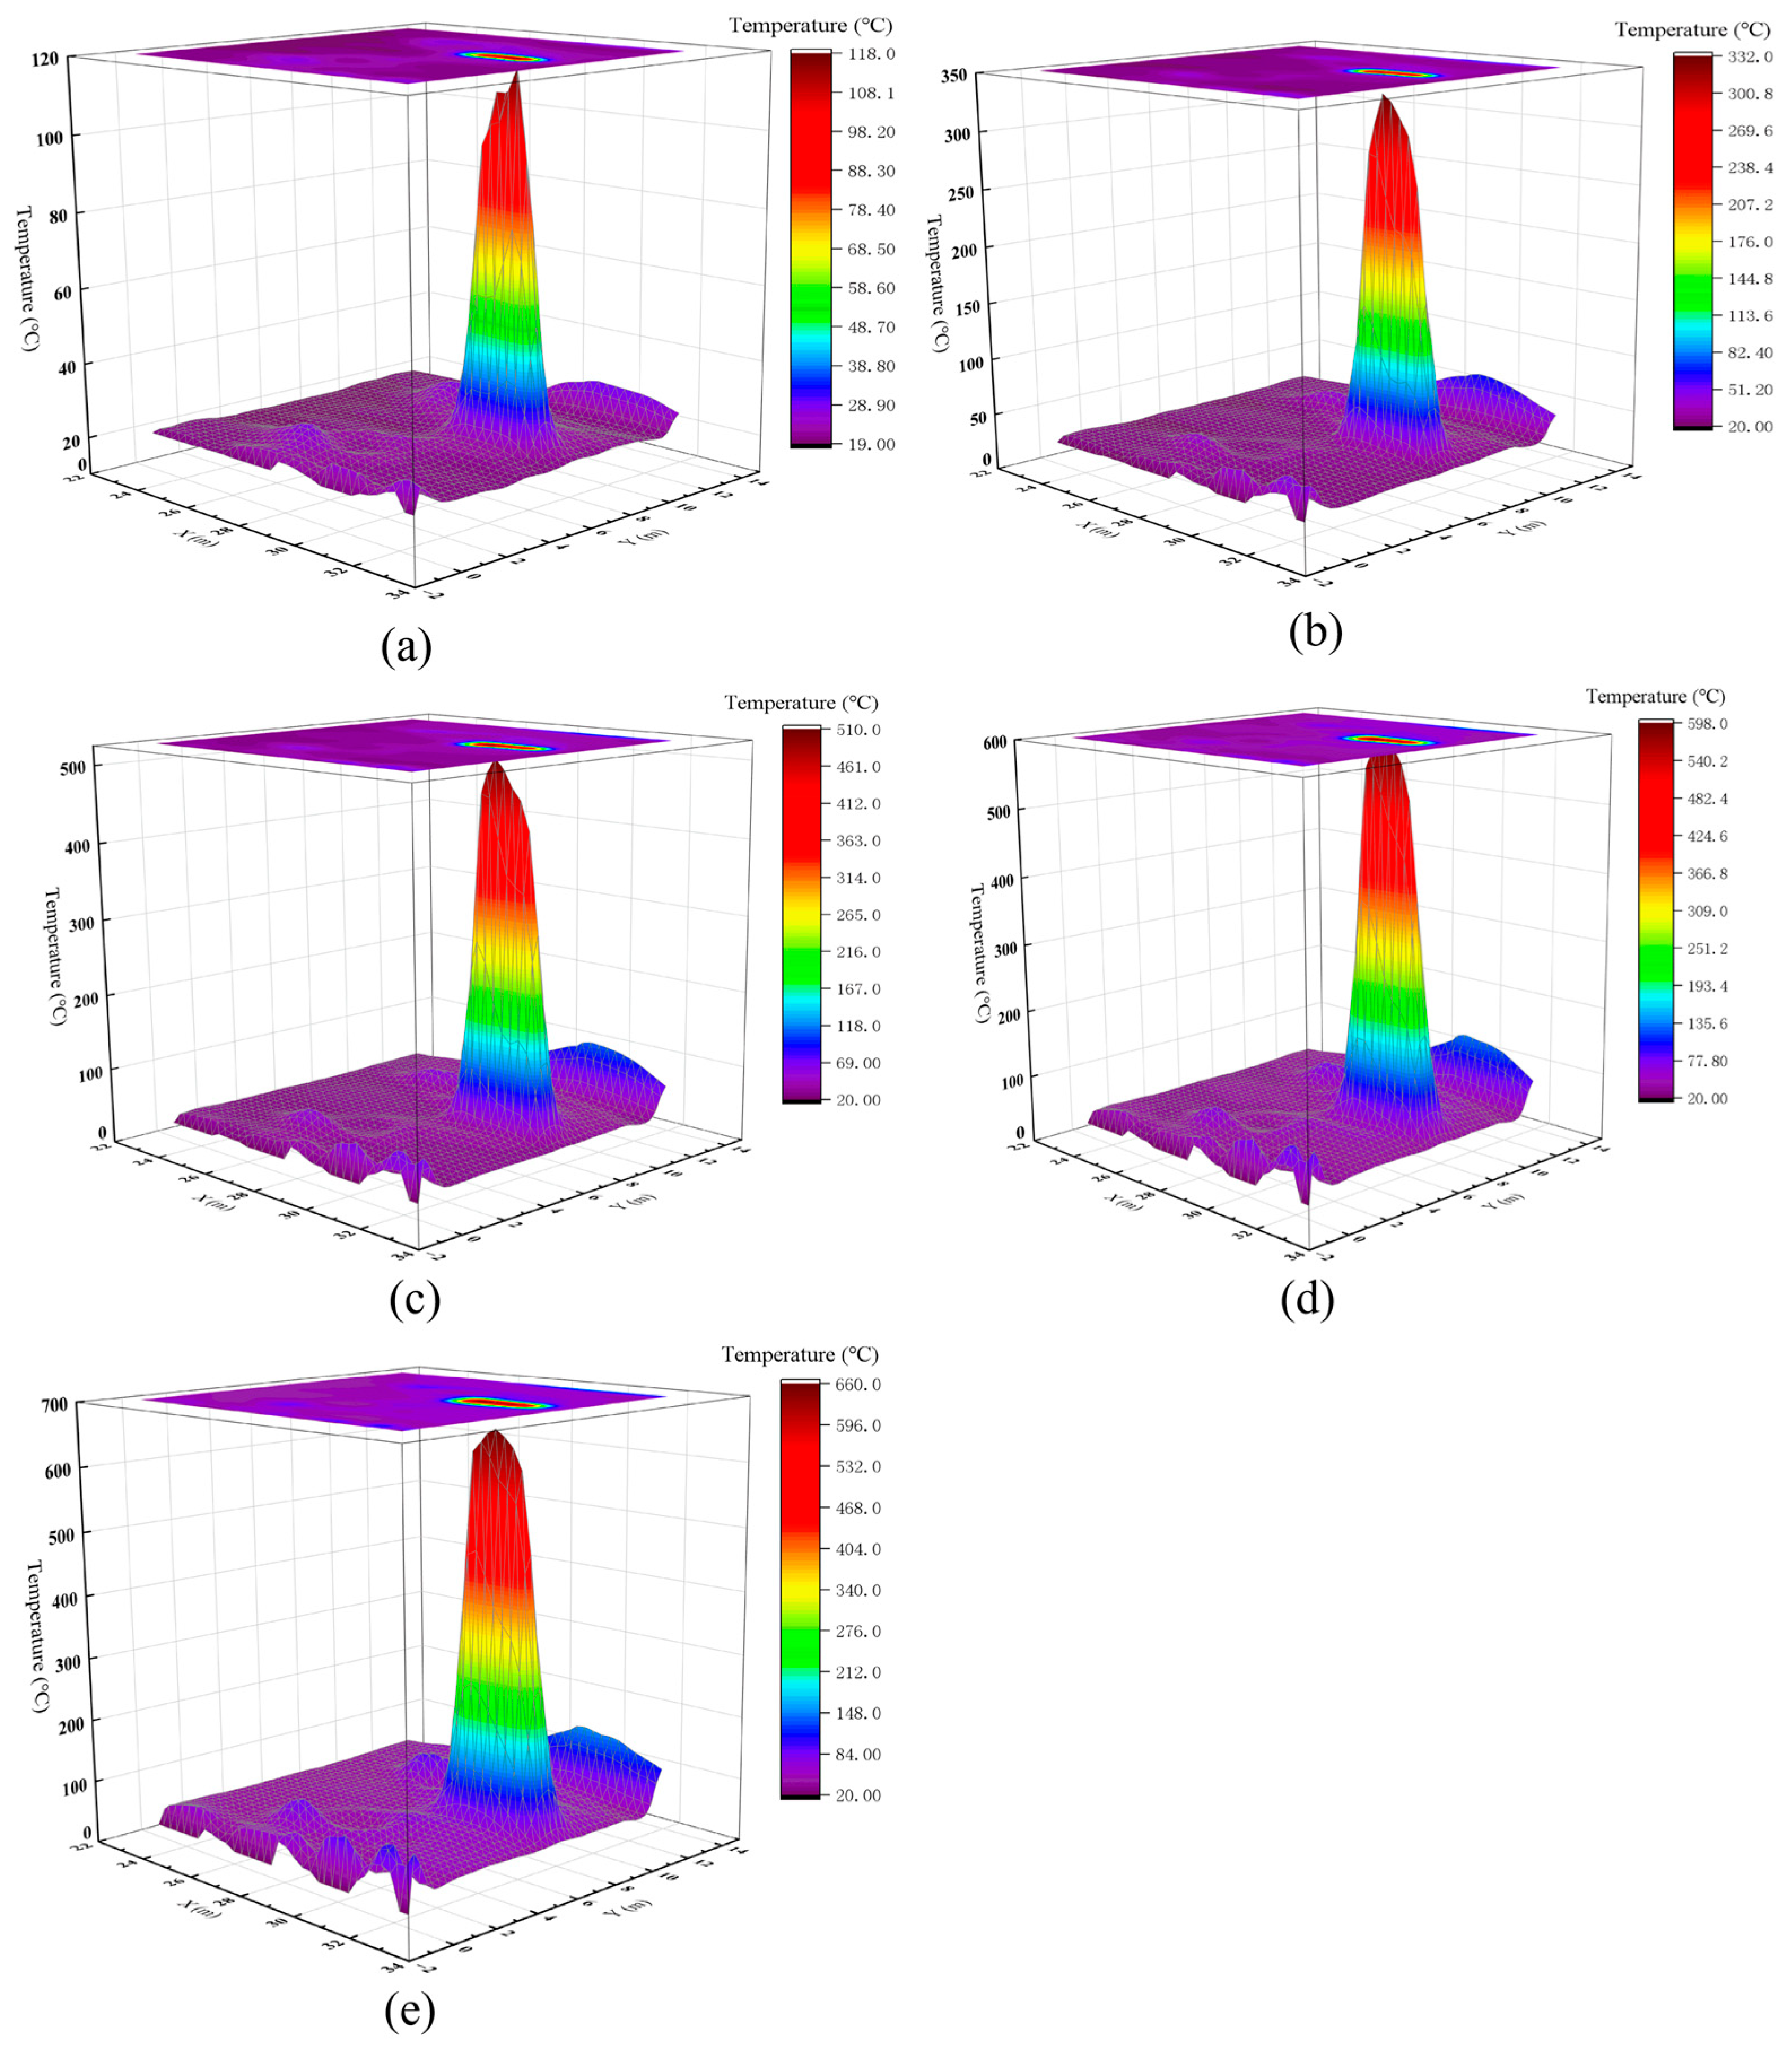
Lithium-ion batteries inevitably experience thermal runaway at 150 °C [50], which is the critical threshold identified for individual battery modules under controlled laboratory conditions. When this threshold is extended to the vehicle interior scenario in a ship cabin, factors such as the vehicle’s thermal inertia, battery pack insulation, and the shielding effect of the metal body may increase the actual environmental temperature required to trigger thermal runaway in adjacent vehicles. However, using the 150 °C standard-which is derived from the battery itself-provides a key safety benchmark. This approach ensures that the fire suppression system is designed to intervene before the spread of battery thermal runaway, thereby providing a safety margin. Therefore, this simulation uses an isothermal surface of 150 °C as a clear and crucial indicator for assessing the risk of fire spread to adjacent vehicles. Based on the simulation results, when the fire source is at a height of 3 m in the z-direction relative to the battery (at monitoring point 7), contour maps and three-dimensional diagrams of the fire temperature radius for different battery capacities of 20 Ah (a), 60 Ah (b), 120 Ah (c), 180 Ah (d), and 240 Ah (e) are plotted, as shown in Figure 13 and Figure 14.
To objectively quantify the spread of the fire, the study adopts the equivalent radius of the fire source as the key evaluation parameter. The calculation method is as follows: taking the center of the initial fire source as the center of the circle, measure the distance to the farthest point of the 150 °C isotherm as the radius (R), and the diameter of the corresponding circular area is the equivalent circular diameter (D = 2R). When the battery capacity is 20 Ah, the corresponding equivalent radius of the 150 °C fire source is almost 0. However, when the capacity reaches 240 Ah, the equivalent radius of the fire source expands to about 3.3 m. Therefore, as the battery capacity increases from 20 Ah to 240 Ah, the equivalent radius of the fire source based on the 150 °C standard shows a gradually increasing trend. The temperature also significantly rises from the 118.0 °C cross-sectional temperature to 660.0 °C, and the high-temperature area continuously expands. The car will ignite more quickly and in a larger area. This super-linear growth is mainly due to the higher heat release rate of the large-capacity battery and the stronger jet combustion effect: on the one hand, the increase in the active substances inside the battery leads to an increase in the total energy of thermal runaway cubically; on the other hand, the jet flow rate of the electrolyte increases linearly and forms a secondary combustion outside. In the ideal situation without fire prevention measures, based on the 150 °C thermal runaway temperature, an equivalent temperature surface for battery ignition is established at a heat release rate of 3000 kW/m2 per unit area.
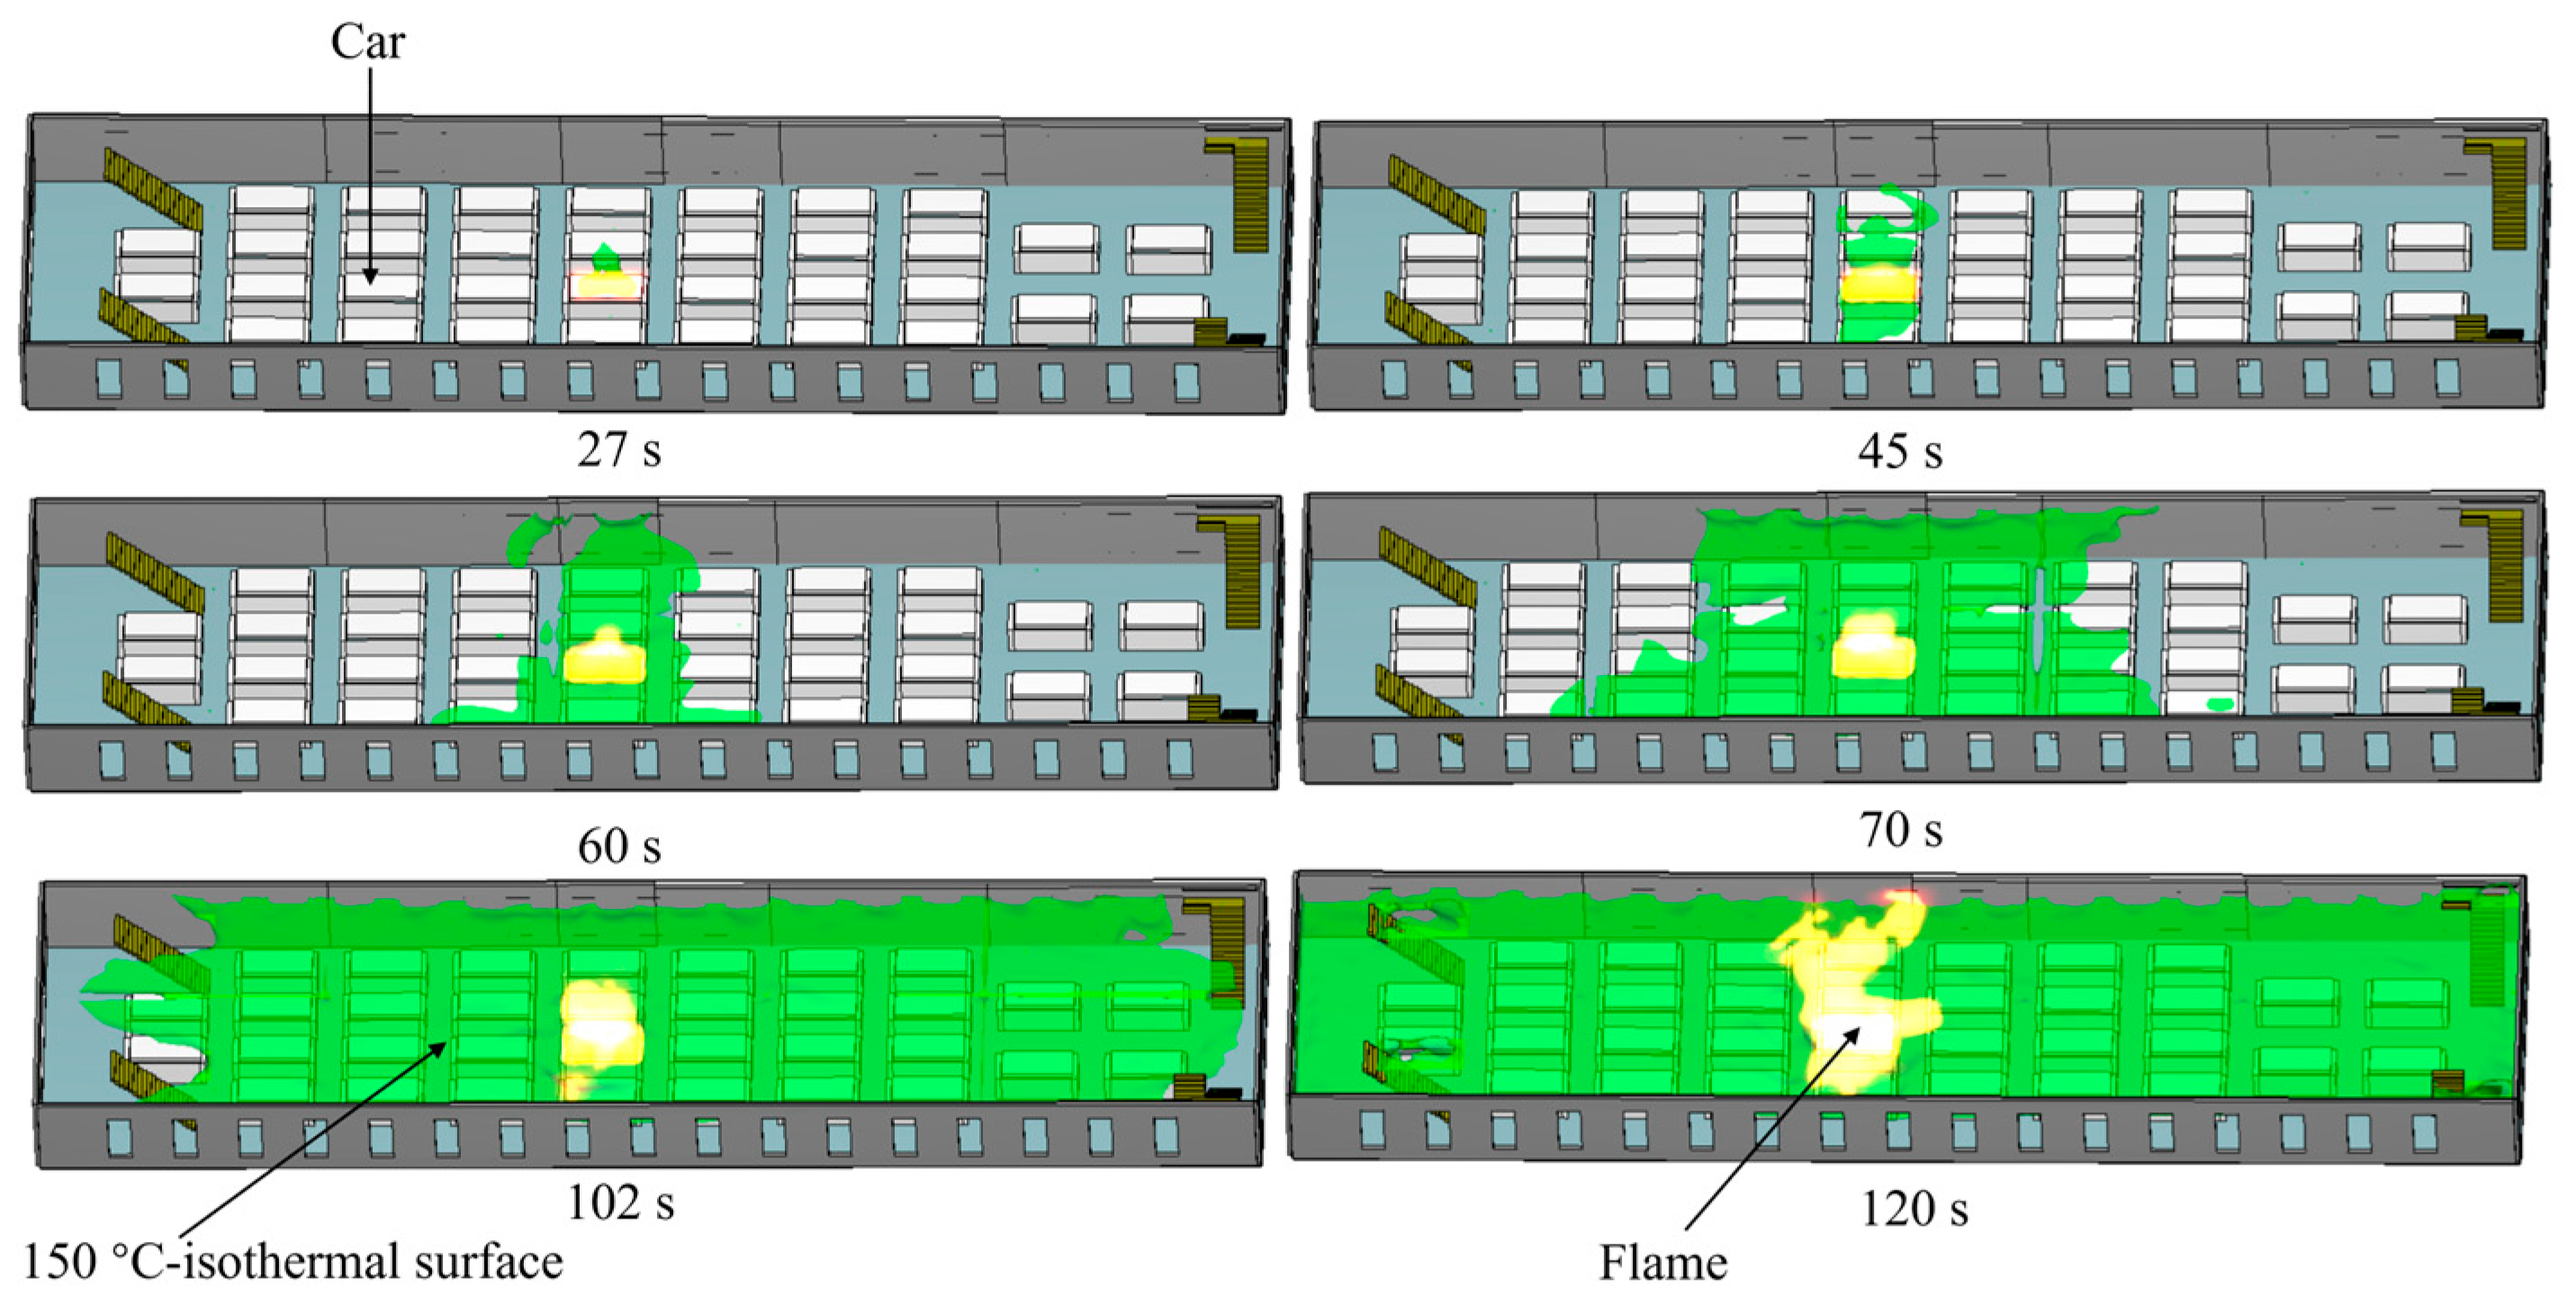
Under simulated conditions, the temperature isosurface analysis in Figure 15 indicates that the thermal influence range generated by the fire source shows a relatively symmetrical distribution characteristic. The vehicle thermal runaway occurs at 27 s, and the temperature spreads to adjacent vehicles at the 45 s, with an extension distance of 1.2 m. At the 60 s, all adjacent vehicles reach the thermal runaway temperature, and the farthest extension distance of the isosurfaces reaches 4.5 m. At the 120 s, the temperature of the entire vehicle cabin reaches the critical value for the vehicle battery thermal runaway. However, the spatial form of the flame is affected by the turbulent characteristics of the jet flame and the environmental wind field, that is, natural ventilation. The volume of the isosurfaces increases exponentially within 100 s of thermal runaway, and the expansion speed is significantly faster than that of traditional hydrocarbon fires. This is due to the intense gas production process accompanying the battery thermal runaway.
According to the relevant provisions of the “International Convention on Maritime Safety for Human Life at Sea”, clear requirements have been made for the water spray system in the fire protection system regarding the number, flow rate, and protection area (i.e., the spacing of fire sprinklers) of the fire sprinklers. Combined with various factors such as feasibility and economic benefits, a comprehensive analysis is conducted. During the ship construction process, the number and spacing of fire sprinklers are generally fixed and difficult to further increase or decrease. Therefore, the parameters related to the number, spacing, and flow rate of the water spray fire suppression system are kept unchanged. The research focuses on the use of high-expansion foam [51], the droplet size of the liquid sprayed by the sprinkler [52], the spraying angle [53], and whether fire curtains are installed [54].
Given the different opinions raised by the member states of IMO, this article selects fine water mist and high-expansion foam as the comparison examples. In the article, the parameter of System 2 from reference [51] is selected and combined with Chapter 6 of the “International Fire Protection System Rules” to set up a high-expansion foam fire extinguishing system. The design parameters of System 2 are as shown in the following Table 3:
In the simulation, all the holes were removed to simulate the air-tight and closed space during the use of foam fire extinguishing. Since FDS does not have a built-in foam model, we created a dedicated foam equivalent particle by equivalenting its properties through system 2 parameters. The particle has a density of 2.0 kg/m3 to reflect the extremely low-density characteristic of the foam. Its value is derived from the expansion of water solution with a density of 1000 kg/m3 by 500 times, simulating the macroscopic movement behavior of foam lumps with a diameter of 1200 μm. The molecular weight is changed to the corresponding air molecular weight, 29 g/mol, to better simulate the physical coverage fire extinguishing mechanism. At the same time, the particles are defined as moving. However, the model mainly captures the physical isolation mechanism of the foam. For the additional suffocating effect of oxygen dilution and temperature reduction caused by the evaporation of water vapor in the foam, due to the limitations of FDS, it could not be fully depicted. But physical coverage isolation effect of the simulated foam was reproduced. Therefore, the conclusion of this simulation regarding the effectiveness of foam fire suppression remains reliable and valid. Figure 16a and Figure 16b are, respectively, the tracer diagrams of fine water mist and high-expansion foam particles.
During the simulation, the sprinkler system used nozzle angles of 60° to 75° and droplet sizes of 500 μm. As shown in Figure 17, Figure 17a shows the temperature change above the fire source, and Figure 17b shows the temperature change near the fire source.
From the figure, it can be observed that there are differences in the temperature control characteristics of the two systems during the fire cycle. In the early stage of the fire, the small-sized droplets of the fine water mist, due to their rapid evaporation property, achieved rapid cooling of the area above the fire source, effectively curbing the peak growth of the heat release rate; in the later stage of the fire, the continuous evaporation and heat absorption mechanism of the droplets enabled the efficient removal of heat from the fire scene, and the temperatures in the core area of the fire source and the adjacent areas could be maintained at relatively low levels. The high-expansion foam system, through equivalent particle simulation, reproduced its coverage mechanism. However, due to the longer time required for foam generation, diffusion, and coverage, the temperature in the fire source area decreased slowly; in the middle and later stages, although a certain coverage layer could be formed, its cooling ability for deep fire sources was insufficient, and the temperature distribution map showed obvious continuous high-temperature areas, indicating that its suppression effect on deep-position fires such as lithium-ion batteries was limited. Therefore, the fine water mist solution demonstrated a relative advantage in temperature control. This system achieved temperature management from the early stage to the middle stage of the fire through the strong heat absorption mechanism of droplet evaporation. In contrast, the high-expansion foam system was limited by its inherent response lag characteristics and insufficient penetration cooling ability for complex combustion bodies and was less applicable in the ro-ro passenger ship vehicle compartment fire control scenarios that emphasized rapid response and deep cooling. However, after the fire was initially controlled, the high-expansion foam system could still be used for long-term coverage to prevent re-ignition.
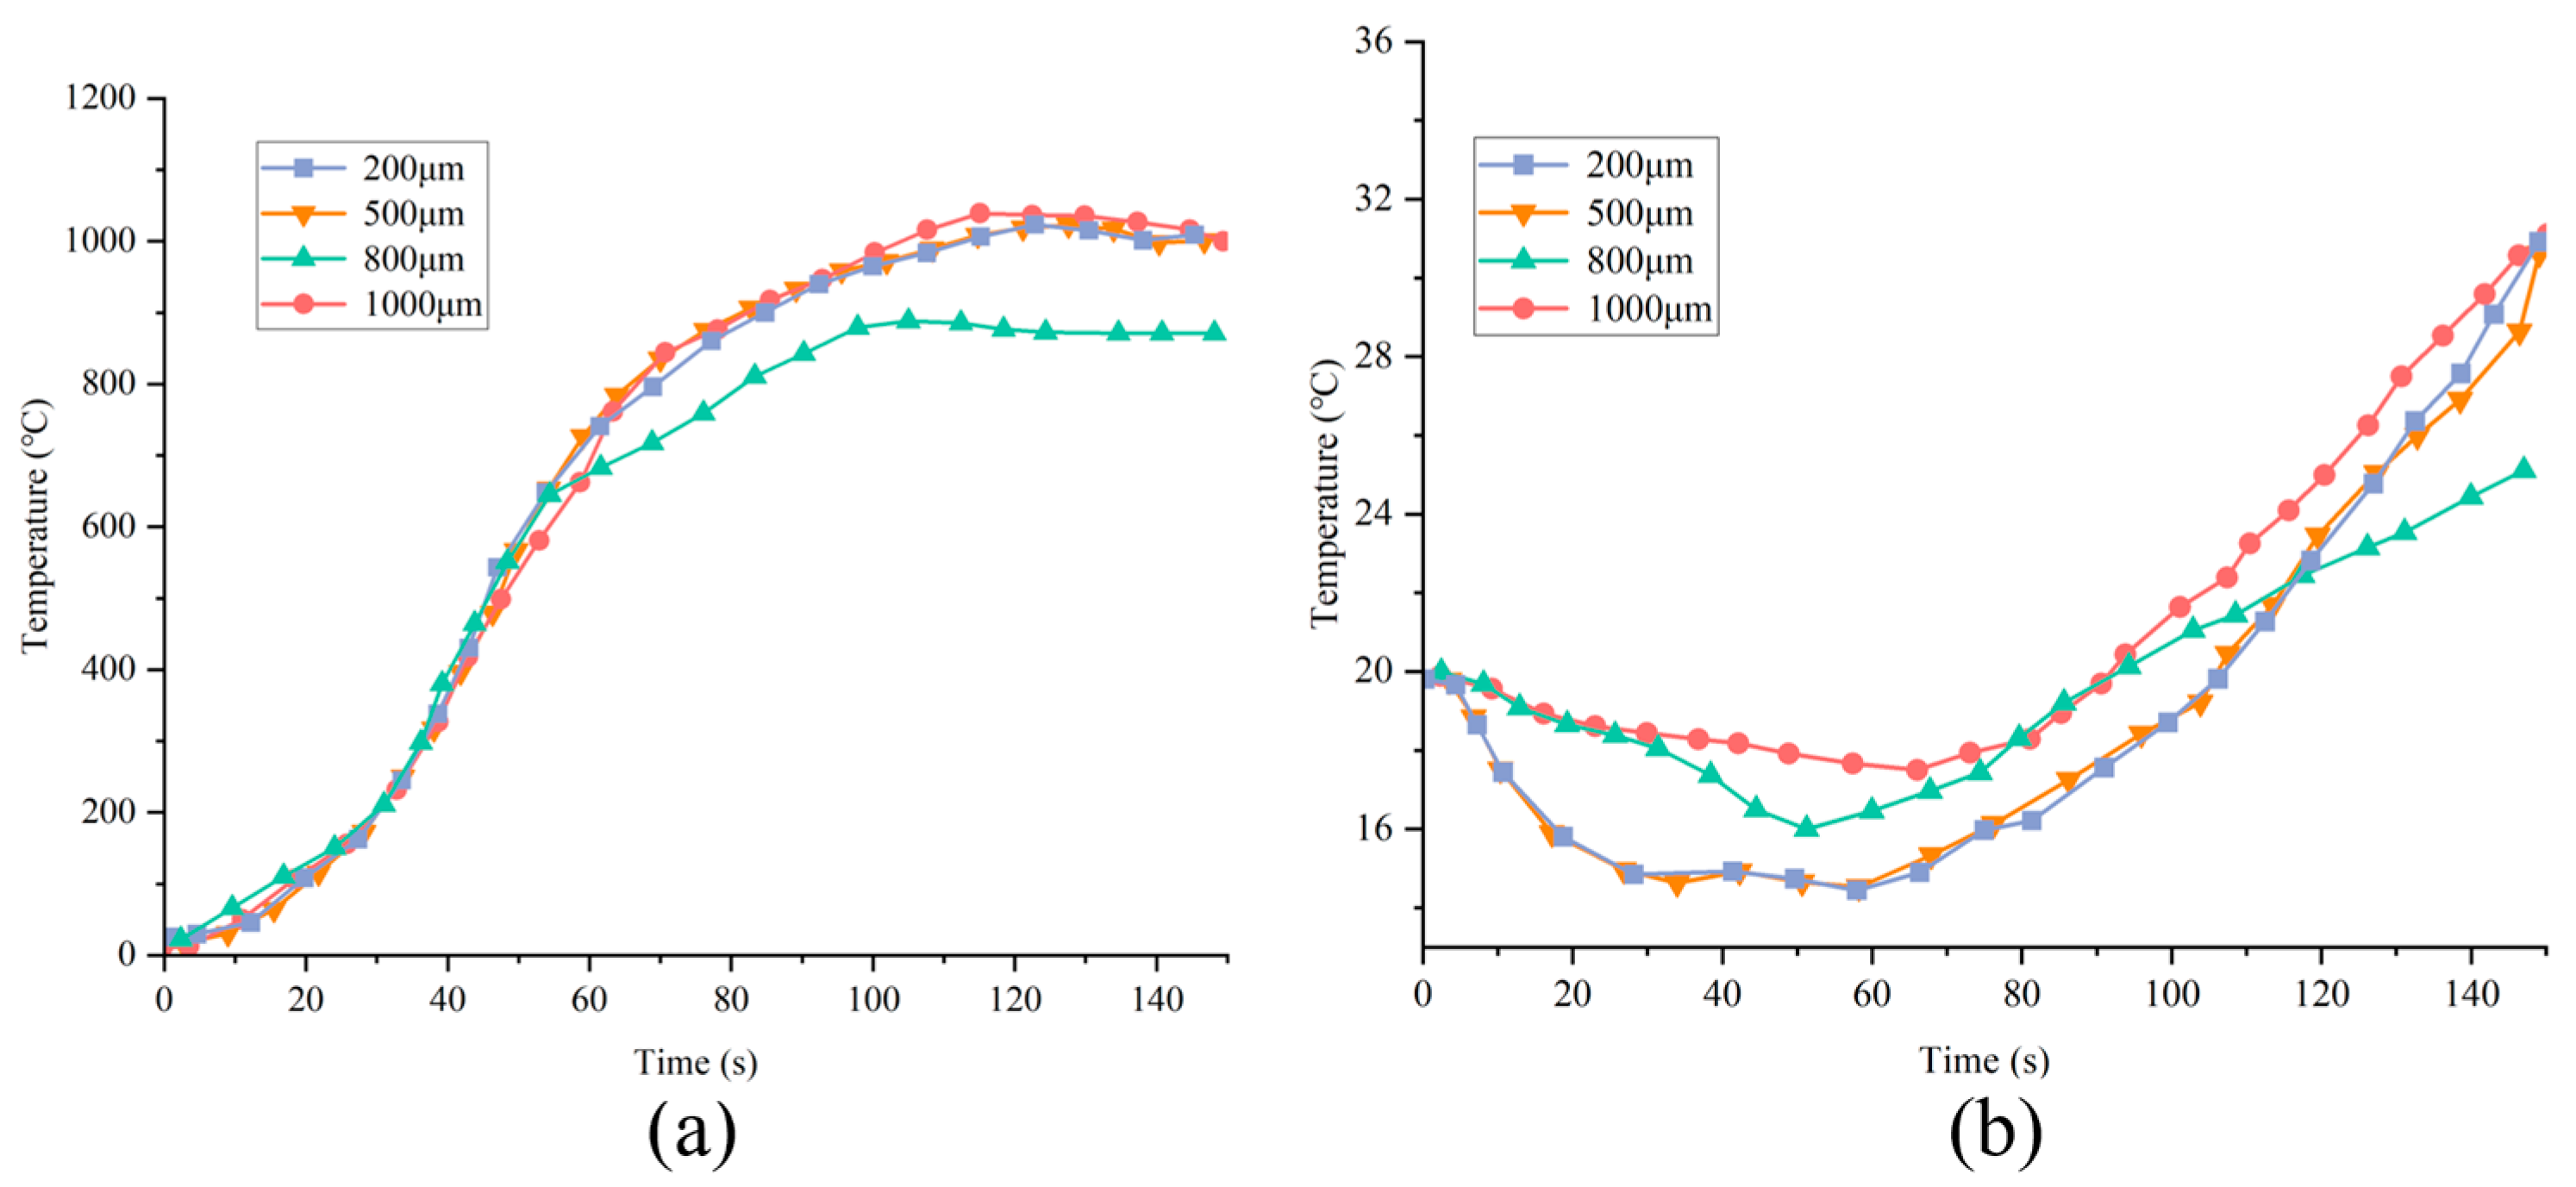
Under the same conditions, the droplet size was changed to 1000, 800, 500 and 200 µm to study the different fire suppression effects. As shown in Figure 18, they are, respectively, the temperature distribution maps of monitoring point 5 above the fire source (a) and monitoring point 11 at the staircase entrance (b). As shown in Figure 18a, the cooling effects of different diameter droplets on the battery fire were tested, and the performance ranking was 800 µm > 200 µm > 500 µm > 1000 µm. The results differ from the classical evaporative cooling theory and reveal the change in the dominant fire suppression mechanism under specific experimental conditions. The analysis suggests that in the battery fire scenario set in the study, the flames produced a very strong upward thermal airflow. The 800 µm droplets, with their penetrating power, could effectively overcome the upward airflow and directly wet the battery surface, achieving the cooling of the thermal runaway body. Although the 200 µm droplets evaporated prematurely in the airflow and achieved excellent gas cooling effect, they could not penetrate the core of the fire source. The 500 µm droplets, although having sufficient penetrating power, could not stabilize and take effect, and their evaporation rate was also slower than the smaller droplets. Therefore, the performance was actually worse than the previous one. The 1000 µm droplets had the lowest evaporation efficiency and the poorest cooling performance. As shown in Figure 18b, when the measurement point was at the staircase entrance, the ranking of cooling effects was 200 µm > 500 µm > 800 µm > 1000 µm. This indicates that with the change in spatial position, the dominant cooling mechanism has changed. In the area away from the fire source, the diffusion ability of the droplets and the suspension evaporation time in the air become the decisive factors. Small diameter droplets, due to their good diffusion ability and large total surface area, can form a wide and uniform cooling fog curtain, effectively reducing the temperature of the surrounding environment; while large diameter droplets, due to their fixed trajectory and fast settling speed, have a significantly weakened cooling effect at this distance. This phenomenon highlights the important influence of the spatial distribution characteristics of fine water mist on the fire suppression effect.
Figure 19 presents a contour map showing the relationship between the temperature above the fire source and the distance of the fire’s spread, corresponding to liquid droplet sizes of 200 (a), 500 (b), 800 (c), and 1000 μm (d). As the droplet size changes, the equivalent effective radius of the fire source also varies. Among them, the equivalent effective radius of the 800 μm droplet is the smallest, approximately 2.8 m, significantly smaller than the high-temperature range of the 1000 μm droplet. When the droplet size further decreases to 200 μm, the equivalent effective radius shrinks to approximately 3 m, and the spatial distribution of the high-temperature area is continuously compressed. This is due to the coupling effect of the droplet momentum, evaporation heat absorption characteristics, and the fire thermal environment. The 500 μm droplet has insufficient penetration force and evaporation efficiency compared to smaller droplets, so it is weaker than the 800 μm droplet in the compression effect of the equivalent effective radius; the 1000 μm droplet cannot effectively suppress the expansion of the high-temperature area due to its low evaporation efficiency, and its equivalent effective radius is the largest. This pattern reveals the key regulatory role of the momentum, evaporation heat absorption characteristics of the droplets, and the fire thermal environment in the spatial influence range of the fire source in battery fire scenarios. At the same time, small droplets have relatively limited ability to capture and settle suspended carbon black particles in the smoke due to their lighter mass and smaller momentum, which leads to a larger smoke diffusion range in their control area, accelerating the decline in visibility and expanding the potential secondary danger area.
The commonly used nozzle angle ranges in the spray fire extinguishing systems of passenger and cargo ships were selected as 30° to 80° (a), 60° to 75° (b), 60° to 90° (c), 80° to 90° (d), and 80° to 120° (e), respectively. At the same time, the droplet size was controlled at 500 μm. As shown in Figure 20, the water coverage areas of each nozzle are presented.
As shown in Figure 21, Figure 21a depicts the temperature change at monitoring point 5 above the fire source, and Figure 21b shows the temperature change at monitoring point 6 near the fire source. It can be seen that under the action of nozzles with angles ranging from 30° to 80°, the temperature rises at the fastest rate and reaches the highest peak; while for angles ranging from 60° to 75°, 60° to 90°, 80° to 90°, and 80° to 120°, the temperature rise is more gradual, and the peak value is significantly lower. The reason is that the smaller the angle, the stronger the concentration and impact of the water column, but the coverage area is limited, making it difficult to achieve uniform cooling over a large area, resulting in local heat accumulation; while for larger angles, the spray range is wider, although the cooling efficiency per unit area may decrease, it can more widely disperse or remove heat, and the overall temperature control effect is better. Specifically, the 30° to 80° nozzle angle is concentrated and has strong impact, which can reach the core of the fire source, but the coverage area is insufficient, lacking comprehensiveness in cooling a large-scale thermal runaway, and prone to causing rapid local temperature accumulation; the 60° to 75° nozzle angle is relatively concentrated, achieving a better balance between coverage area and water column pressure, being able to achieve uniform cooling to some extent, making the temperature rise more gradual; the 60° to 90° nozzle angle is further expanded, the coverage area increases, although the cooling efficiency per unit area may decrease, but the overall heat dispersion effect is better; the 80° to 90° nozzle angle is more concentrated, with sufficient water column impact, which can penetrate the flames to cool the local heat source, reducing local high-temperature accumulation; the 80° to 120° nozzle angle range is the largest and has the widest coverage, able to remove heat over a larger area, so the temperature rise is the slowest and the peak value is the lowest. In summary, the small-angle nozzles have strong impact but limited coverage, resulting in faster and higher peak temperature rise at the top and bottom of the fire source; the large-angle nozzles, due to their “wide coverage”, can more effectively disperse or remove heat, achieving better overall temperature performance. Their wide coverage characteristic is more conducive to suppressing the spread of the fire and reducing the overall temperature, but it needs to be optimized in combination with flow rate and pressure to balance coverage area and cooling efficiency.
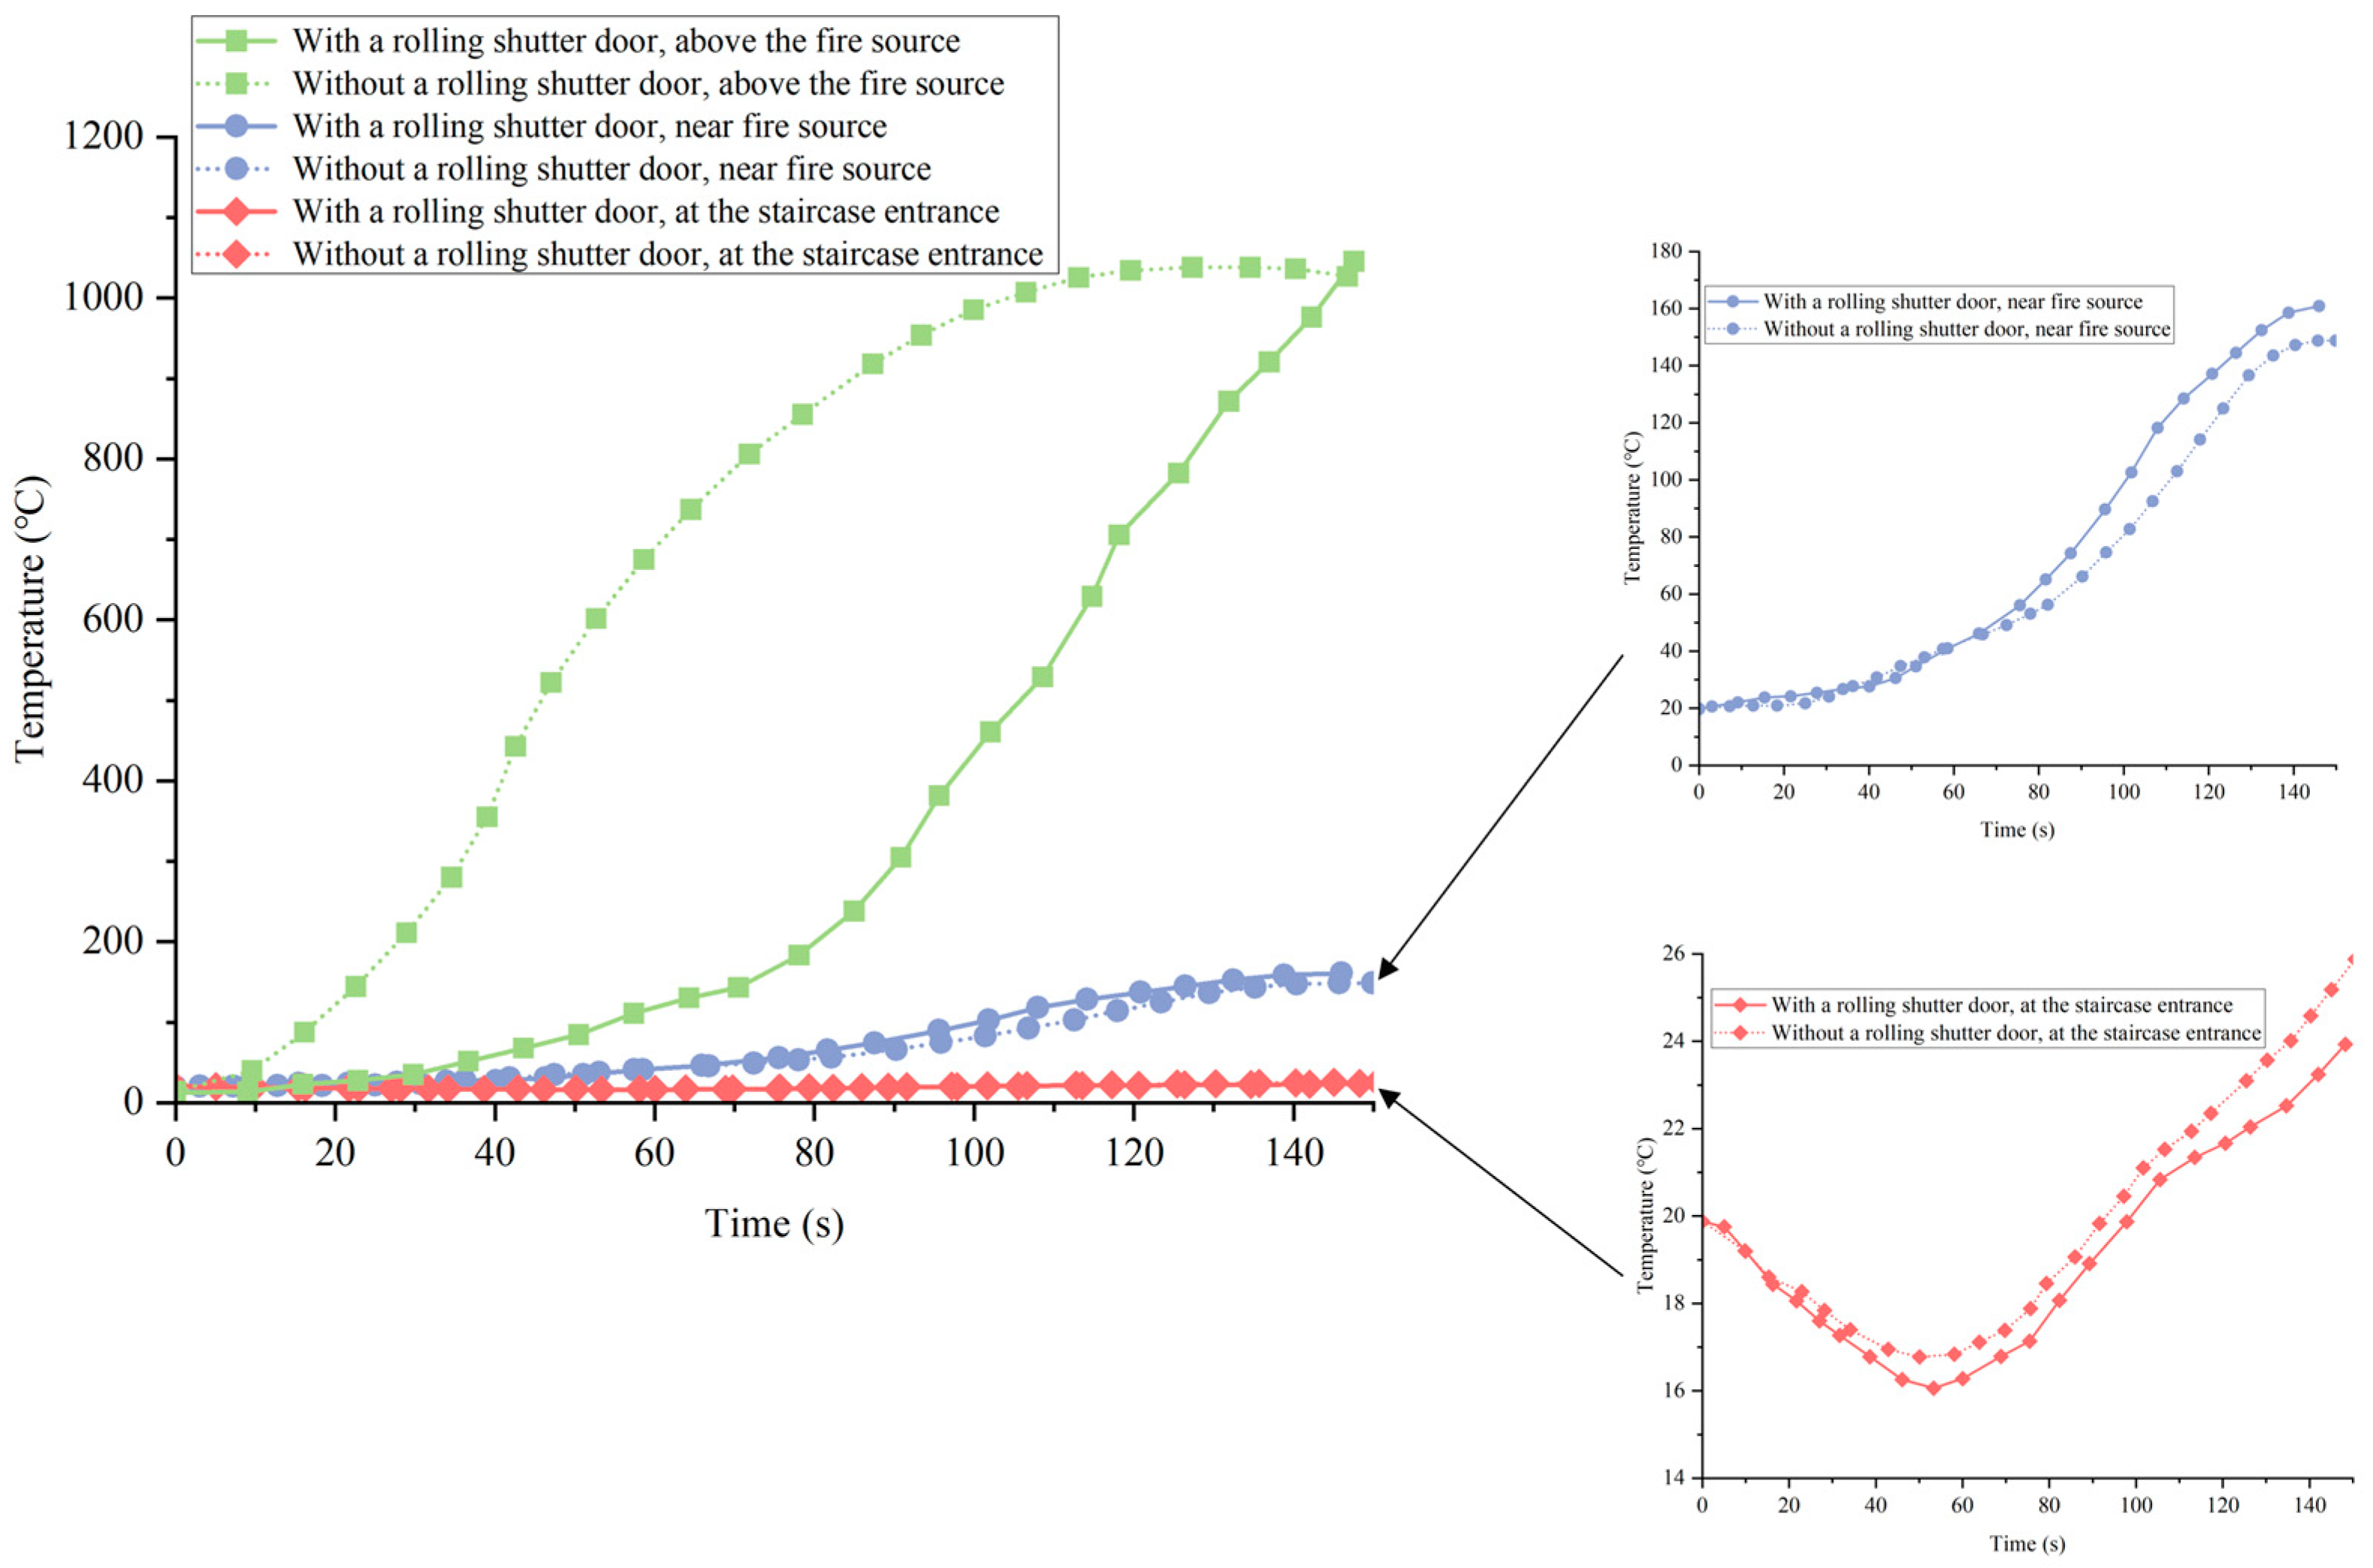
By constructing a thin wall 0.05 m thick around the fire source for containment and simulating the protective effect of the fireproof rolling shutter door after a fire occurs, the material was set as a heat insulation material. After multiple simulation tests, the height was finally adjusted to 3.5 m to ensure the best protective effect without affecting the function of the water spray fire extinguishing system. As shown in Figure 22, after opening the fireproof rolling shutter door, compared with when it was not opened, the temperature rise speed above the fire source (monitoring point 5) was slower, and the temperature rise speed in the area close to the fire source (monitoring point 6) and the staircase entrance area (monitoring point 11) was also more gentle. However, due to the effect of the fireproof rolling shutter door, the smoke rose in a smaller space, resulting in higher peak temperatures above and around the fire source than in the case without the shutter door installed. In addition, as the air temperature above the fire source gradually increased over time, the density of the hot air decreased and flowed upward and outward. At the same time, the fireproof rolling shutter door can effectively prevent the air below from entering. Under the combined effect of these two factors, the external air and the fire source could not obtain sufficient fuel for combustion, ultimately leading to a decrease in the overall temperature.
As shown in Figure 23, the temperature distribution propagation within the entire carriage before (a) and after (b) the addition of the fireproof door is presented. The top and bottom images, respectively, show the perspective view from above and the side view. The fireproof curtain exerts an inhibitory effect on the fire spread radius through physical isolation and thermodynamic regulation, and causes the high-temperature smoke to accumulate above the carriage. The 0.05 m thick insulation material structure can effectively delay the temperature rise above the fire source, reducing the thermal radiation influence radius by approximately 3 m. At the same time, by blocking the air supply below, the oxygen concentration in the combustion zone is controlled below the critical value, limiting the fire spread radius to within the 3.5 m height range of the curtain enclosure. According to the simulation, the activation of the curtain not only reduces the core high-temperature area of the fire source by 80–100 °C, but also compresses the diffusion radius of toxic smoke. This “temperature-oxygen-smoke” control mechanism enables the fireproof curtain to reduce the effective dangerous radius of the fire from 6 to 8 m in the open state to 3–5 m in the closed state, without affecting the fire-extinguishing efficiency of the sprinkler system, and forms a “three-dimensional blockade” fire prevention zone effect.

6.2. Analysis of the Smoke Spread Characteristics, Visibility and Temperature Field in a Ro-Pax Ship Fire

As shown in Figure 24, the flame of the fire source gradually increases over time. The initial flame height of the fire source reaches the upper deck at 52 s, the delayed flame height reaches the upper deck at 180 s, and the flame reaches its most vigorous stage at 240 s, with the maximum radiation range in all directions.
The Fick diffusion equation describes how concentration changes over time. This is a differential that shows how diffusion occurs when continuous diffusion takes place [55].
ϕ t = D i j 2 ϕ
In the formula, binary diffusion coefficient between molecules ith   and   jth [m2/s].
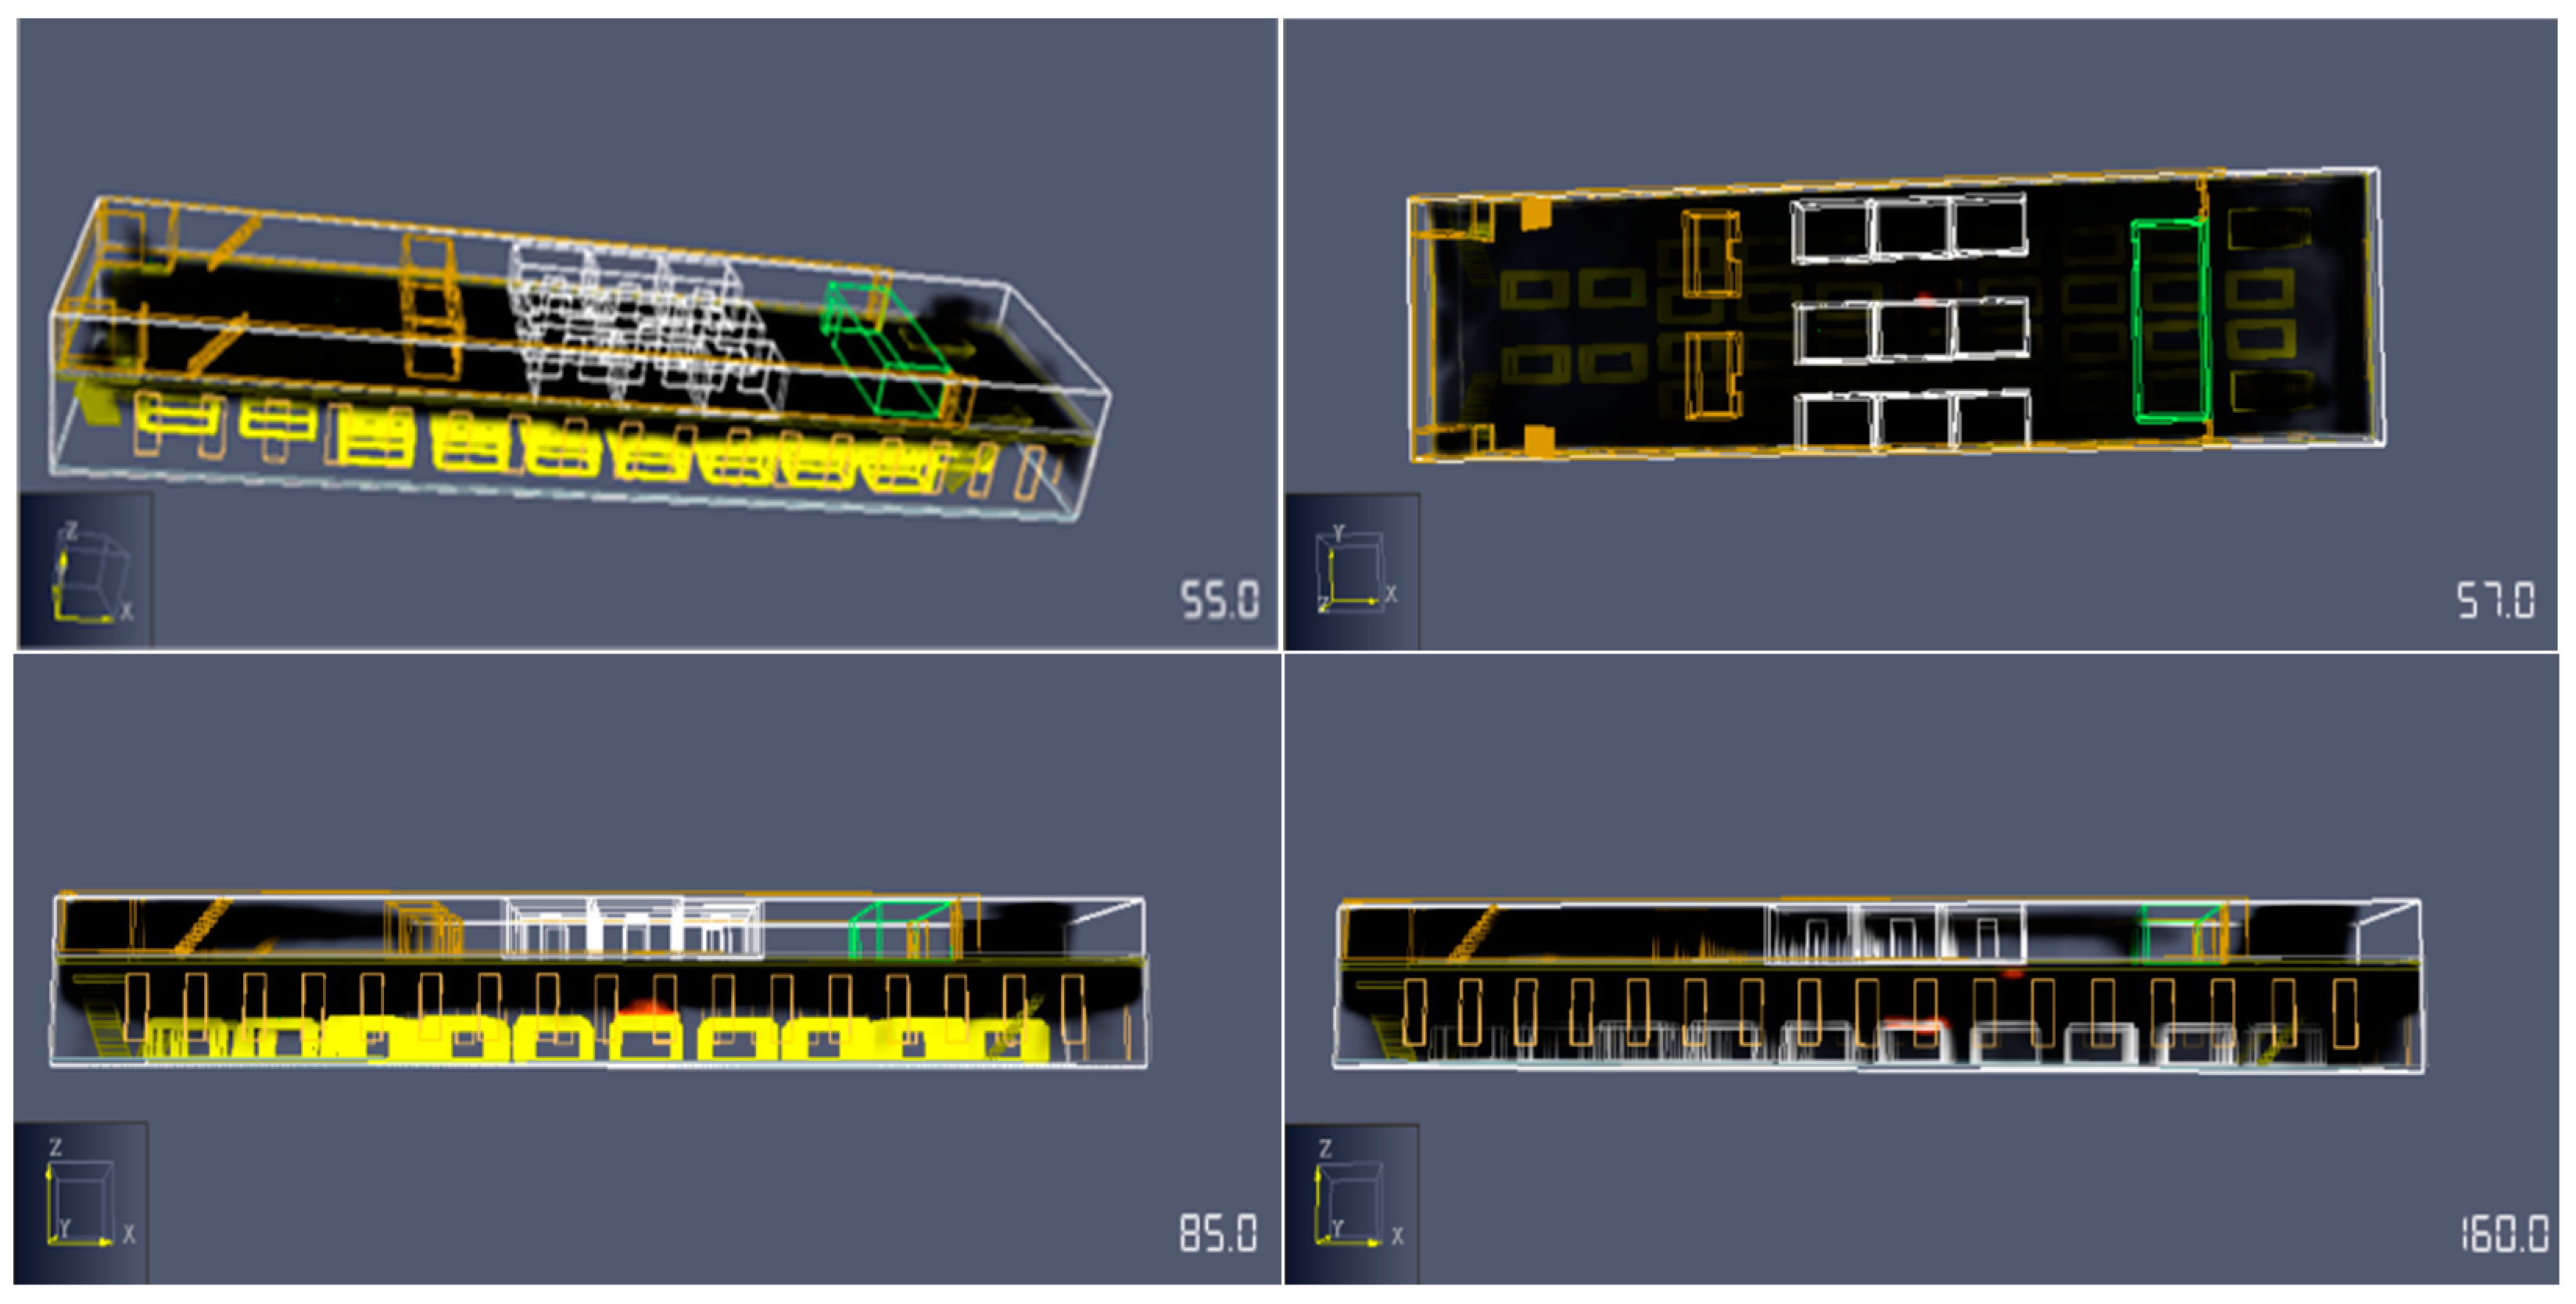
In FDS, the finite volume method is used for discretization. The open area is set to zero concentration gradient, and the adsorption boundary is adopted on the solid wall surface. The solution is obtained in FDS through the Fick diffusion equation to determine the smoke diffusion situation during the thermal runaway of the vehicle. After the car fire occurs, due to the relatively sealed environment inside the car, there is incomplete combustion in the car fire, which will produce a large amount of toxic and harmful smoke, as shown in Figure 25. At 7 s, the smoke height reaches the main deck ceiling, and after 55 s, the smoke begins to enter the upper deck from the rear staircase. At 57 s, the smoke completely covers the car compartment on the main deck. At 85 s, the smoke enters the living area on the upper deck and completely covers the upper deck compartment at 160 s. Its spread trajectory follows the classic theory of thermal buoyancy driven smoke plume and roof jet, providing a basis for the optimization of the subsequent fire protection system.
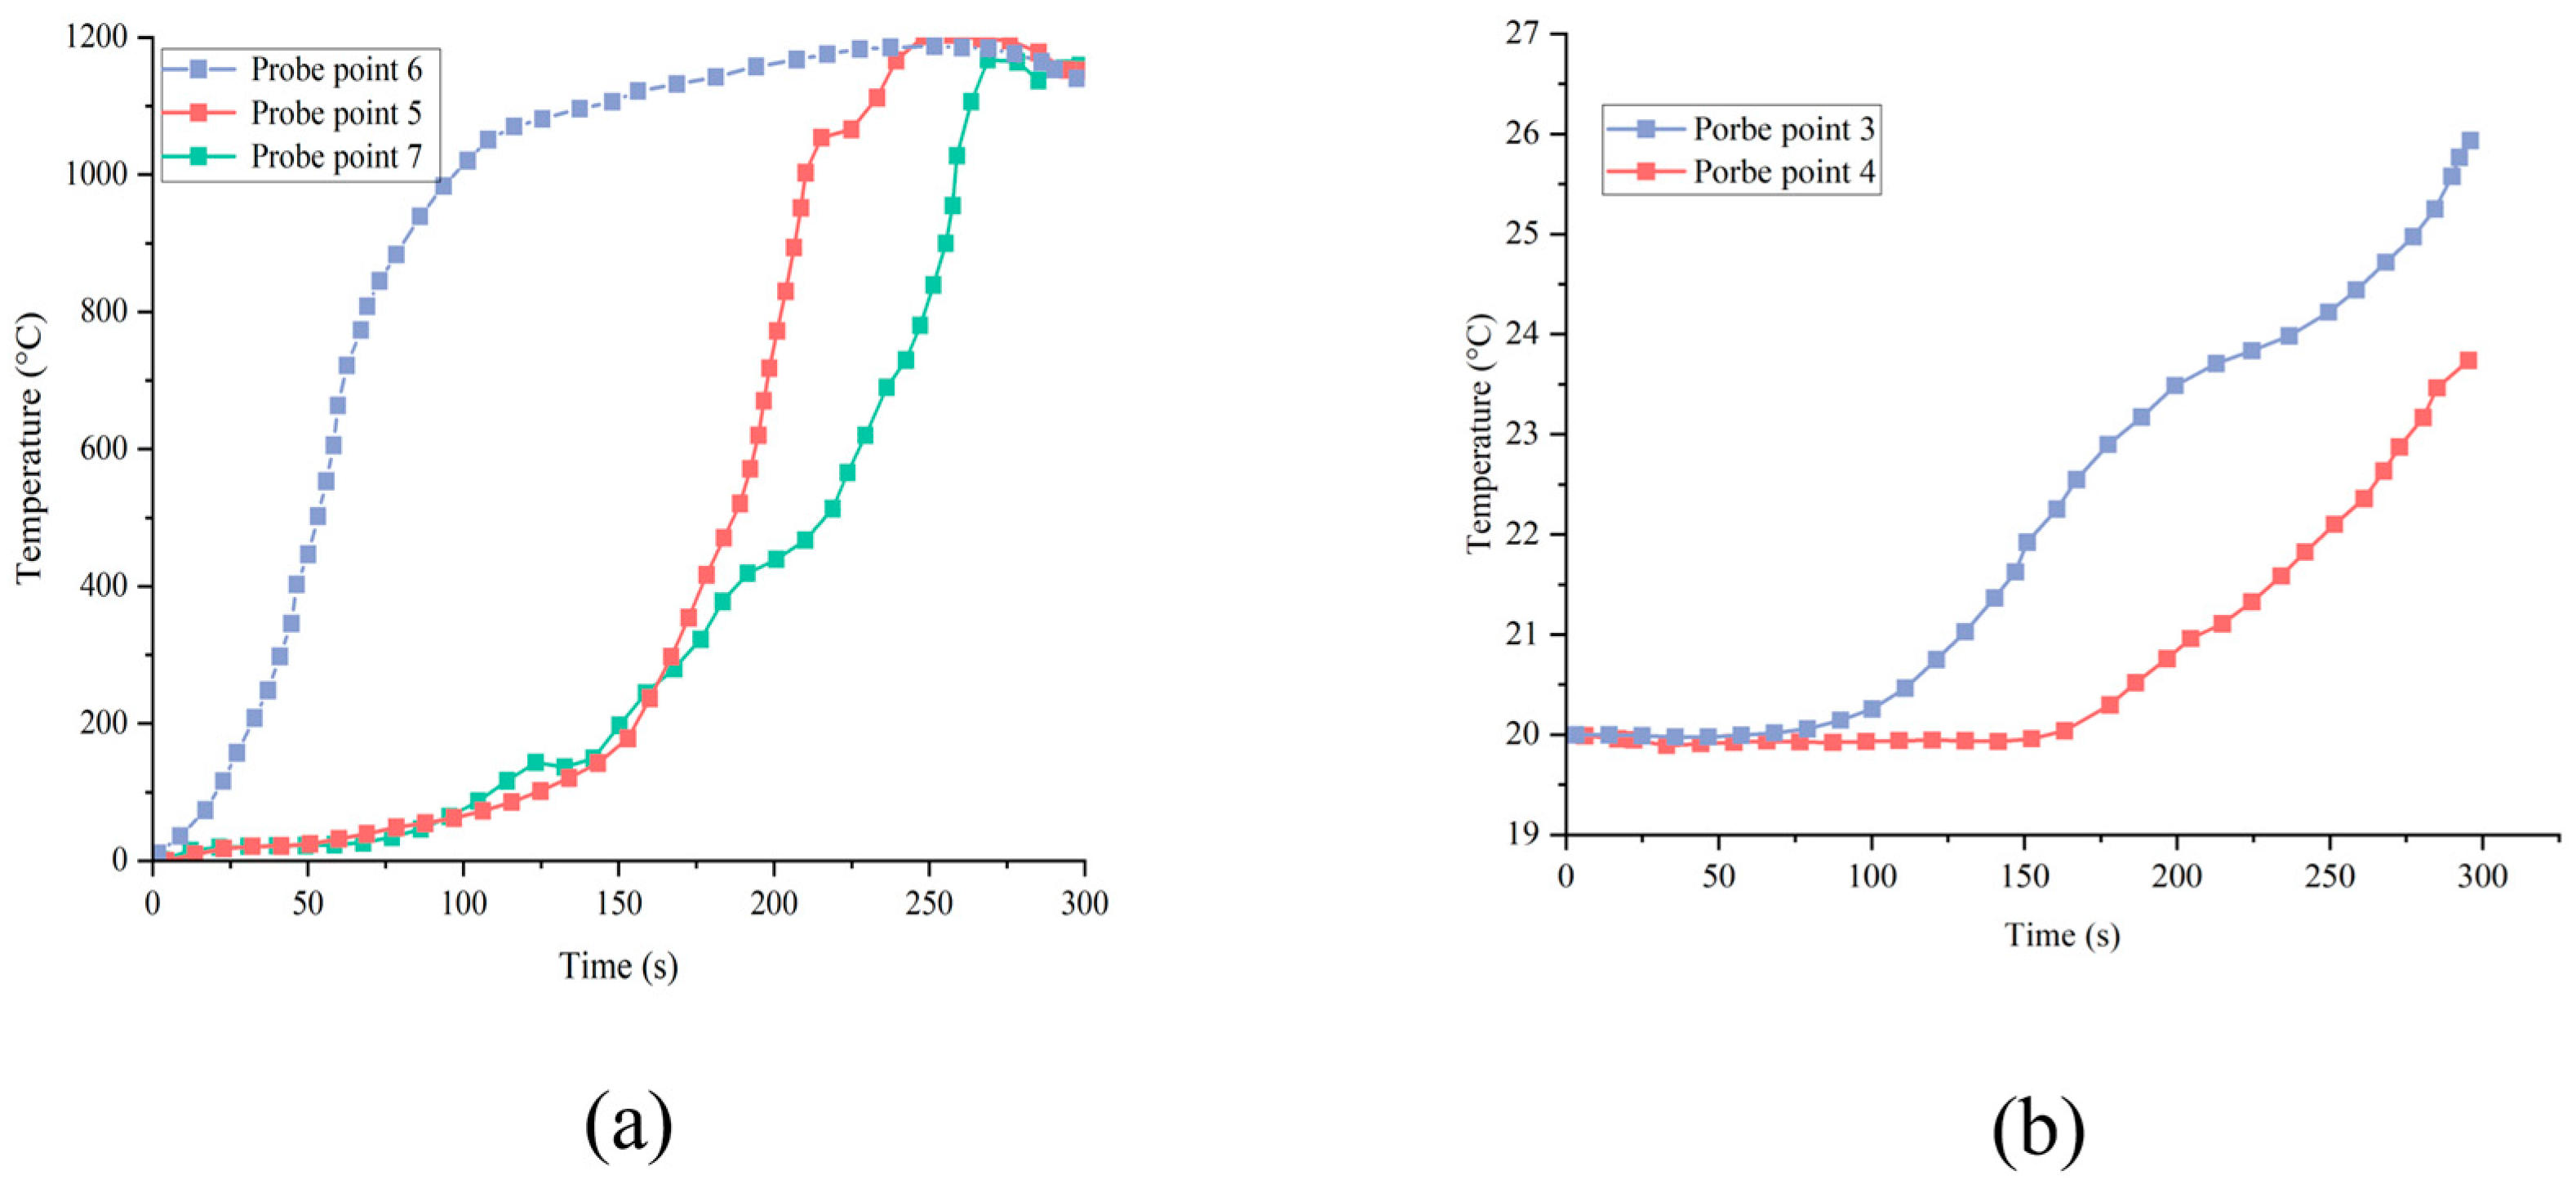
The car fire is a fully developed type of fire. In this kind of fire, the heat release rate increases with time and tends to stabilize after reaching the maximum heat release rate. Figure 26a shows the temperature curves at the characteristic point height Z = 3.0 m above the three fire sources. It can be seen that the temperature rise curve during combustion is basically consistent with the HRR change law of the heat release rate. After t = 120 s, the initial fire source enters the stable combustion stage, and the highest temperature above the fire source reaches about 1200 °C. After t = 240 s, the inner delayed fire source enters the stable combustion stage, and the highest temperature above the fire source is also about 1200 °C. The outer delayed fire source, due to its proximity to the ventilation opening, has a slower temperature rise compared to the inner side, and the temperature fluctuation is larger. After t = 270 s, tending towards stability, with a maximum temperature of 1200 °C. Figure 26b shows the temperature in the corridors and rooms of the living area on the upper deck.
The results show that, influenced by the smoke and wind generated by thermal convection, the temperature in the corridor starts to rise after 100 s and reaches 27 °C at t = 300 s, with significant fluctuations. The temperature in the room remains unchanged for the first 170 s and gradually increases after 170 s, reaching 24 °C at t = 300 s.
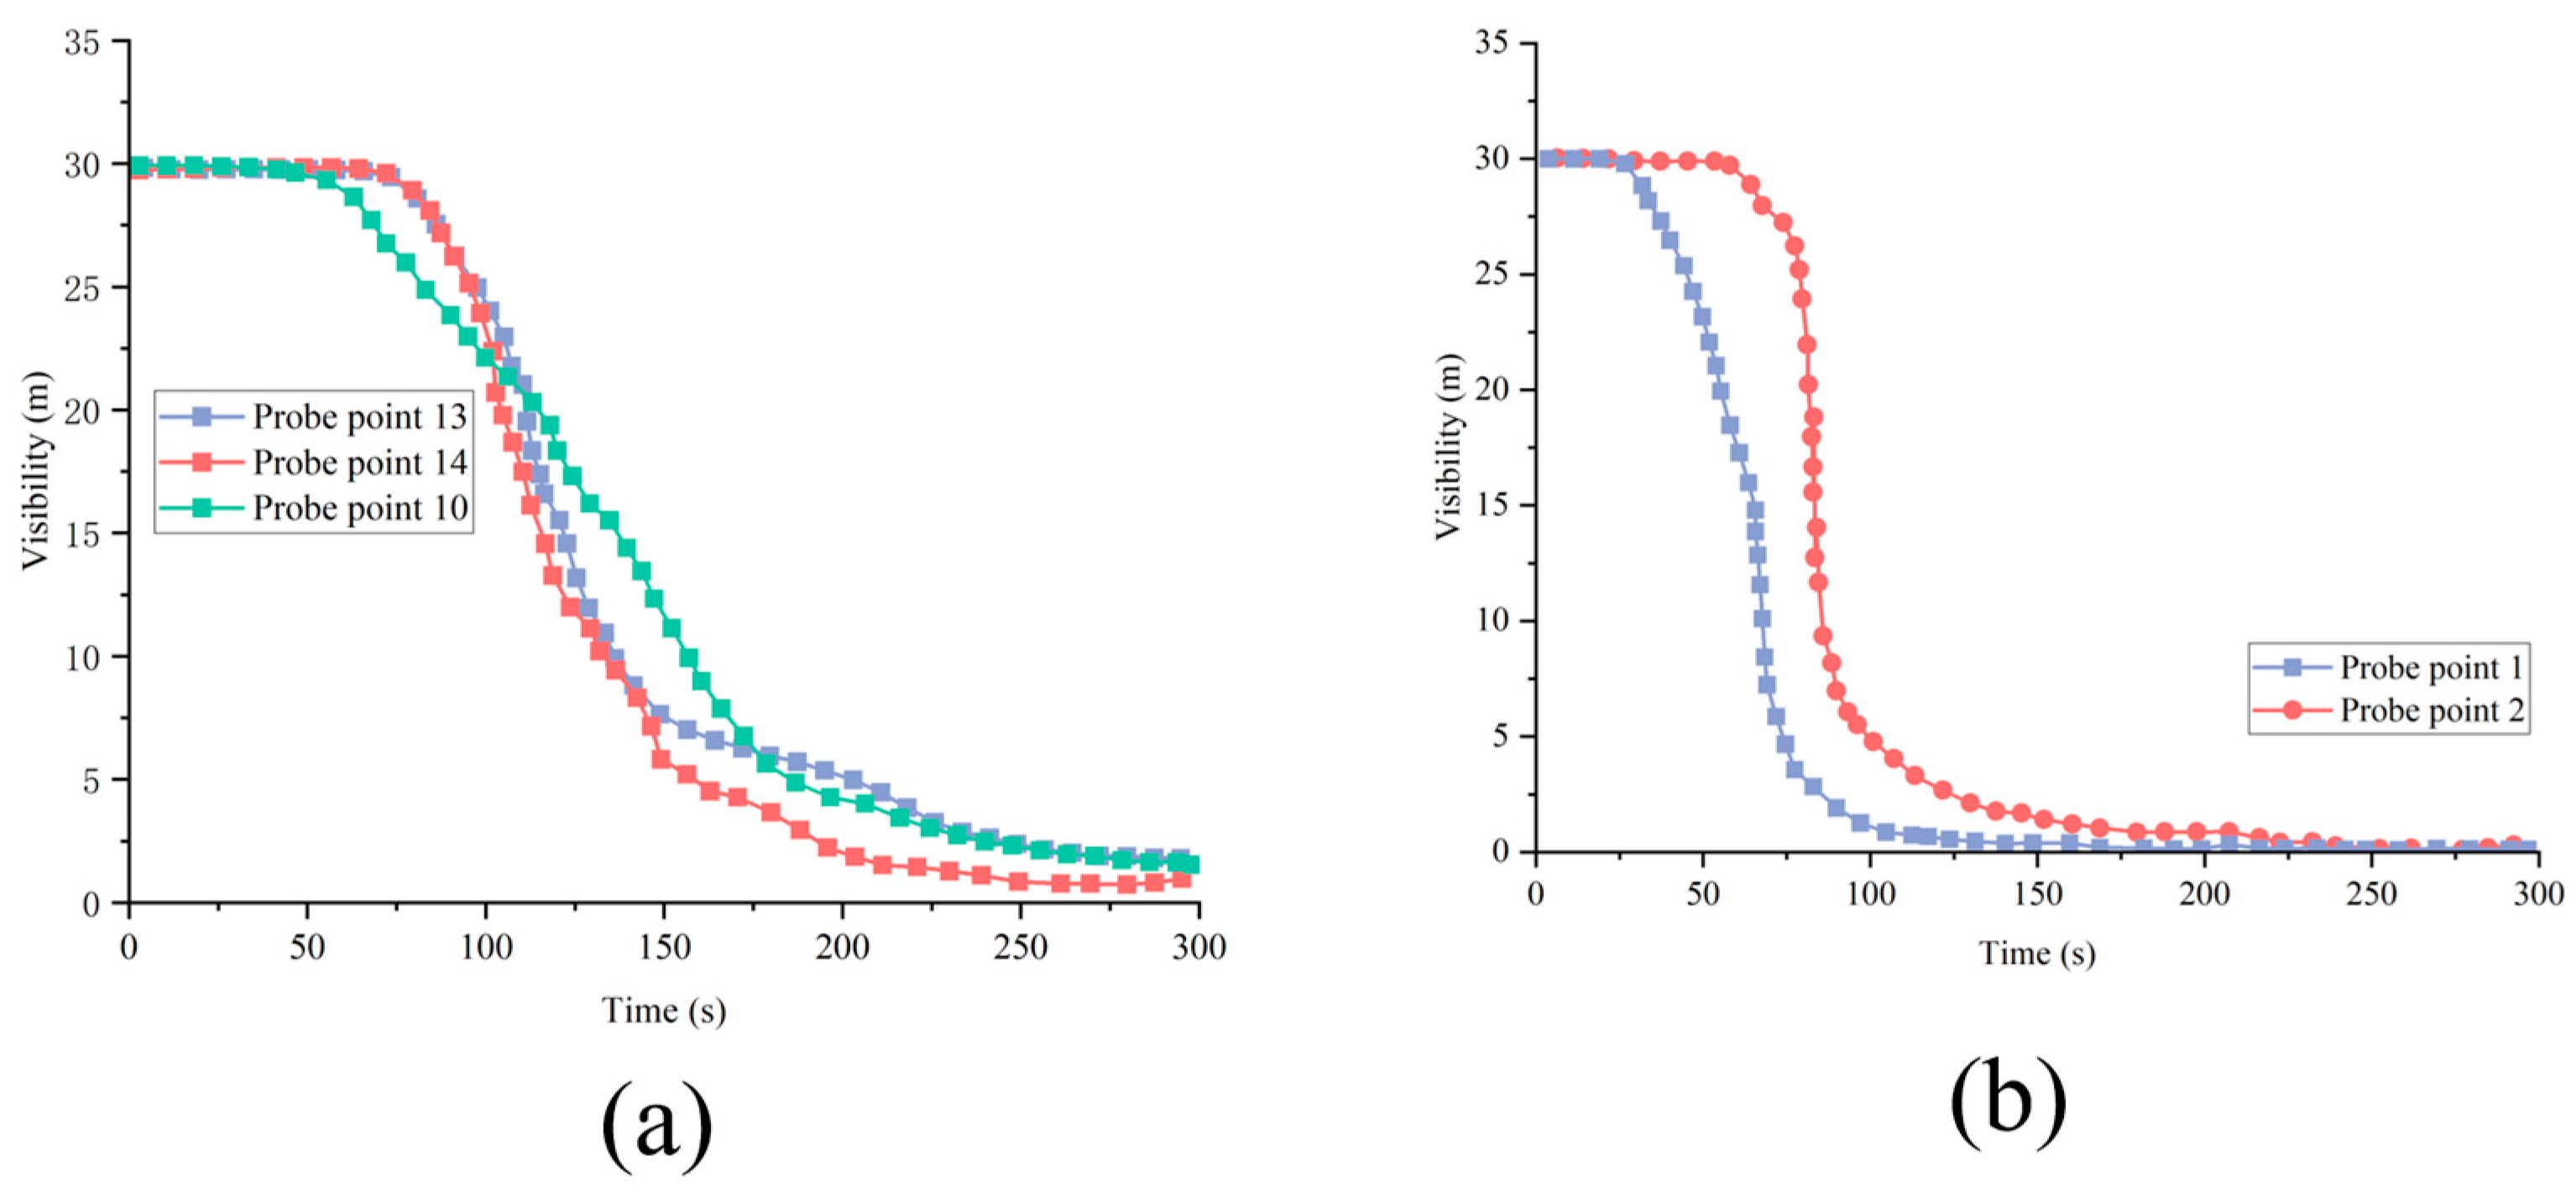
After a fire occurs, a large amount of heat is released at the source of the fire, and combustible materials burn and release a large amount of smoke. The smoke generated near the source of the fire belongs to a light fluid, and the hot smoke spreads upward to the roof of the ship’s deck building under buoyancy, forming a roof jet. After filling the roof, the smoke spreads outwards and affects visibility in other areas of the deck layer. In addition, smoke contains a large number of tiny black particles, which have strong shading properties and absorb light, reducing visibility around the smoke. The visibility changes during the fire simulation process are mainly obtained through the data obtained from the arrangement of detection points. The following analysis focuses on the time when the visibility reaches the safe visibility range of 5 m.
Figure 27 show the changes in visibility at a total of five stairwell detection points after a fire broke out on the main deck (a) and upper deck (b). It can be seen that due to the fact that smoke is a light fluid, it preferentially propagates upwards under buoyancy. Therefore, the visibility at the two stairwells on the upper deck decreased at the fastest rate to below 5 m at 70 s and 80 s, respectively, followed by the changes in visibility at the three detection points on the upper and lower stairwells on the main deck. As smoke first covered the ceiling of the main deck and then spread downwards, the decrease in visibility at this detection point was slower compared to the upper stairwell detection point, dropping to below 5 m between 150 s and 170 s.
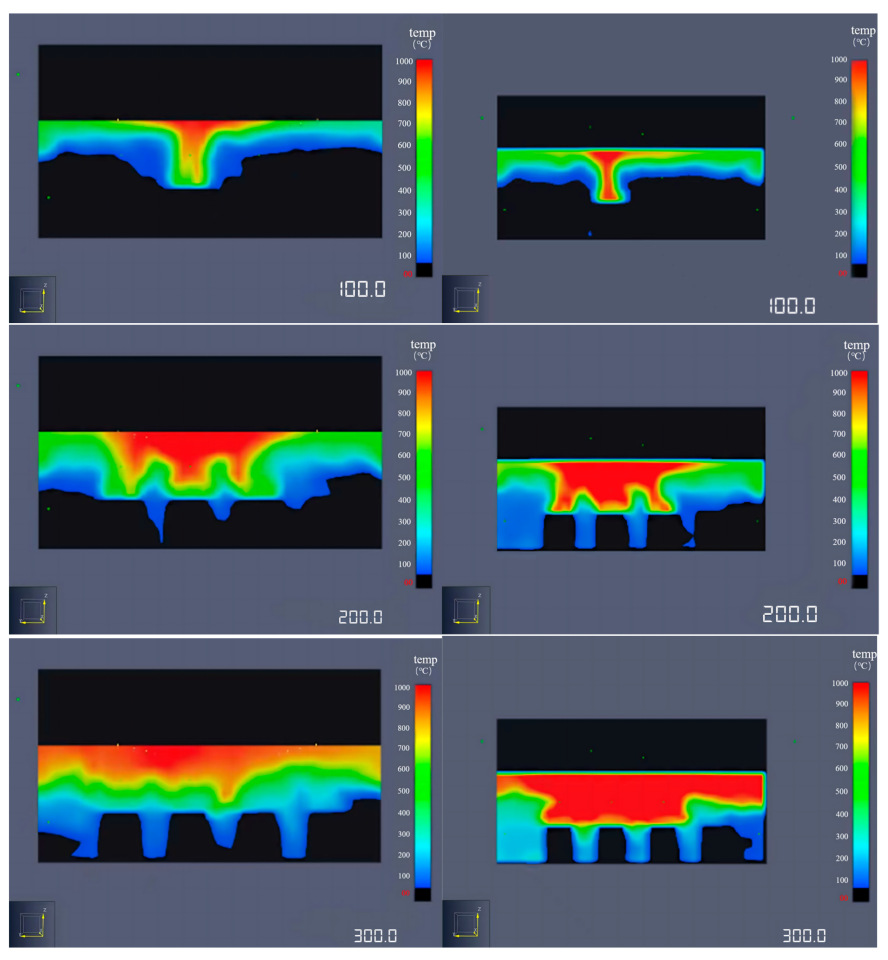
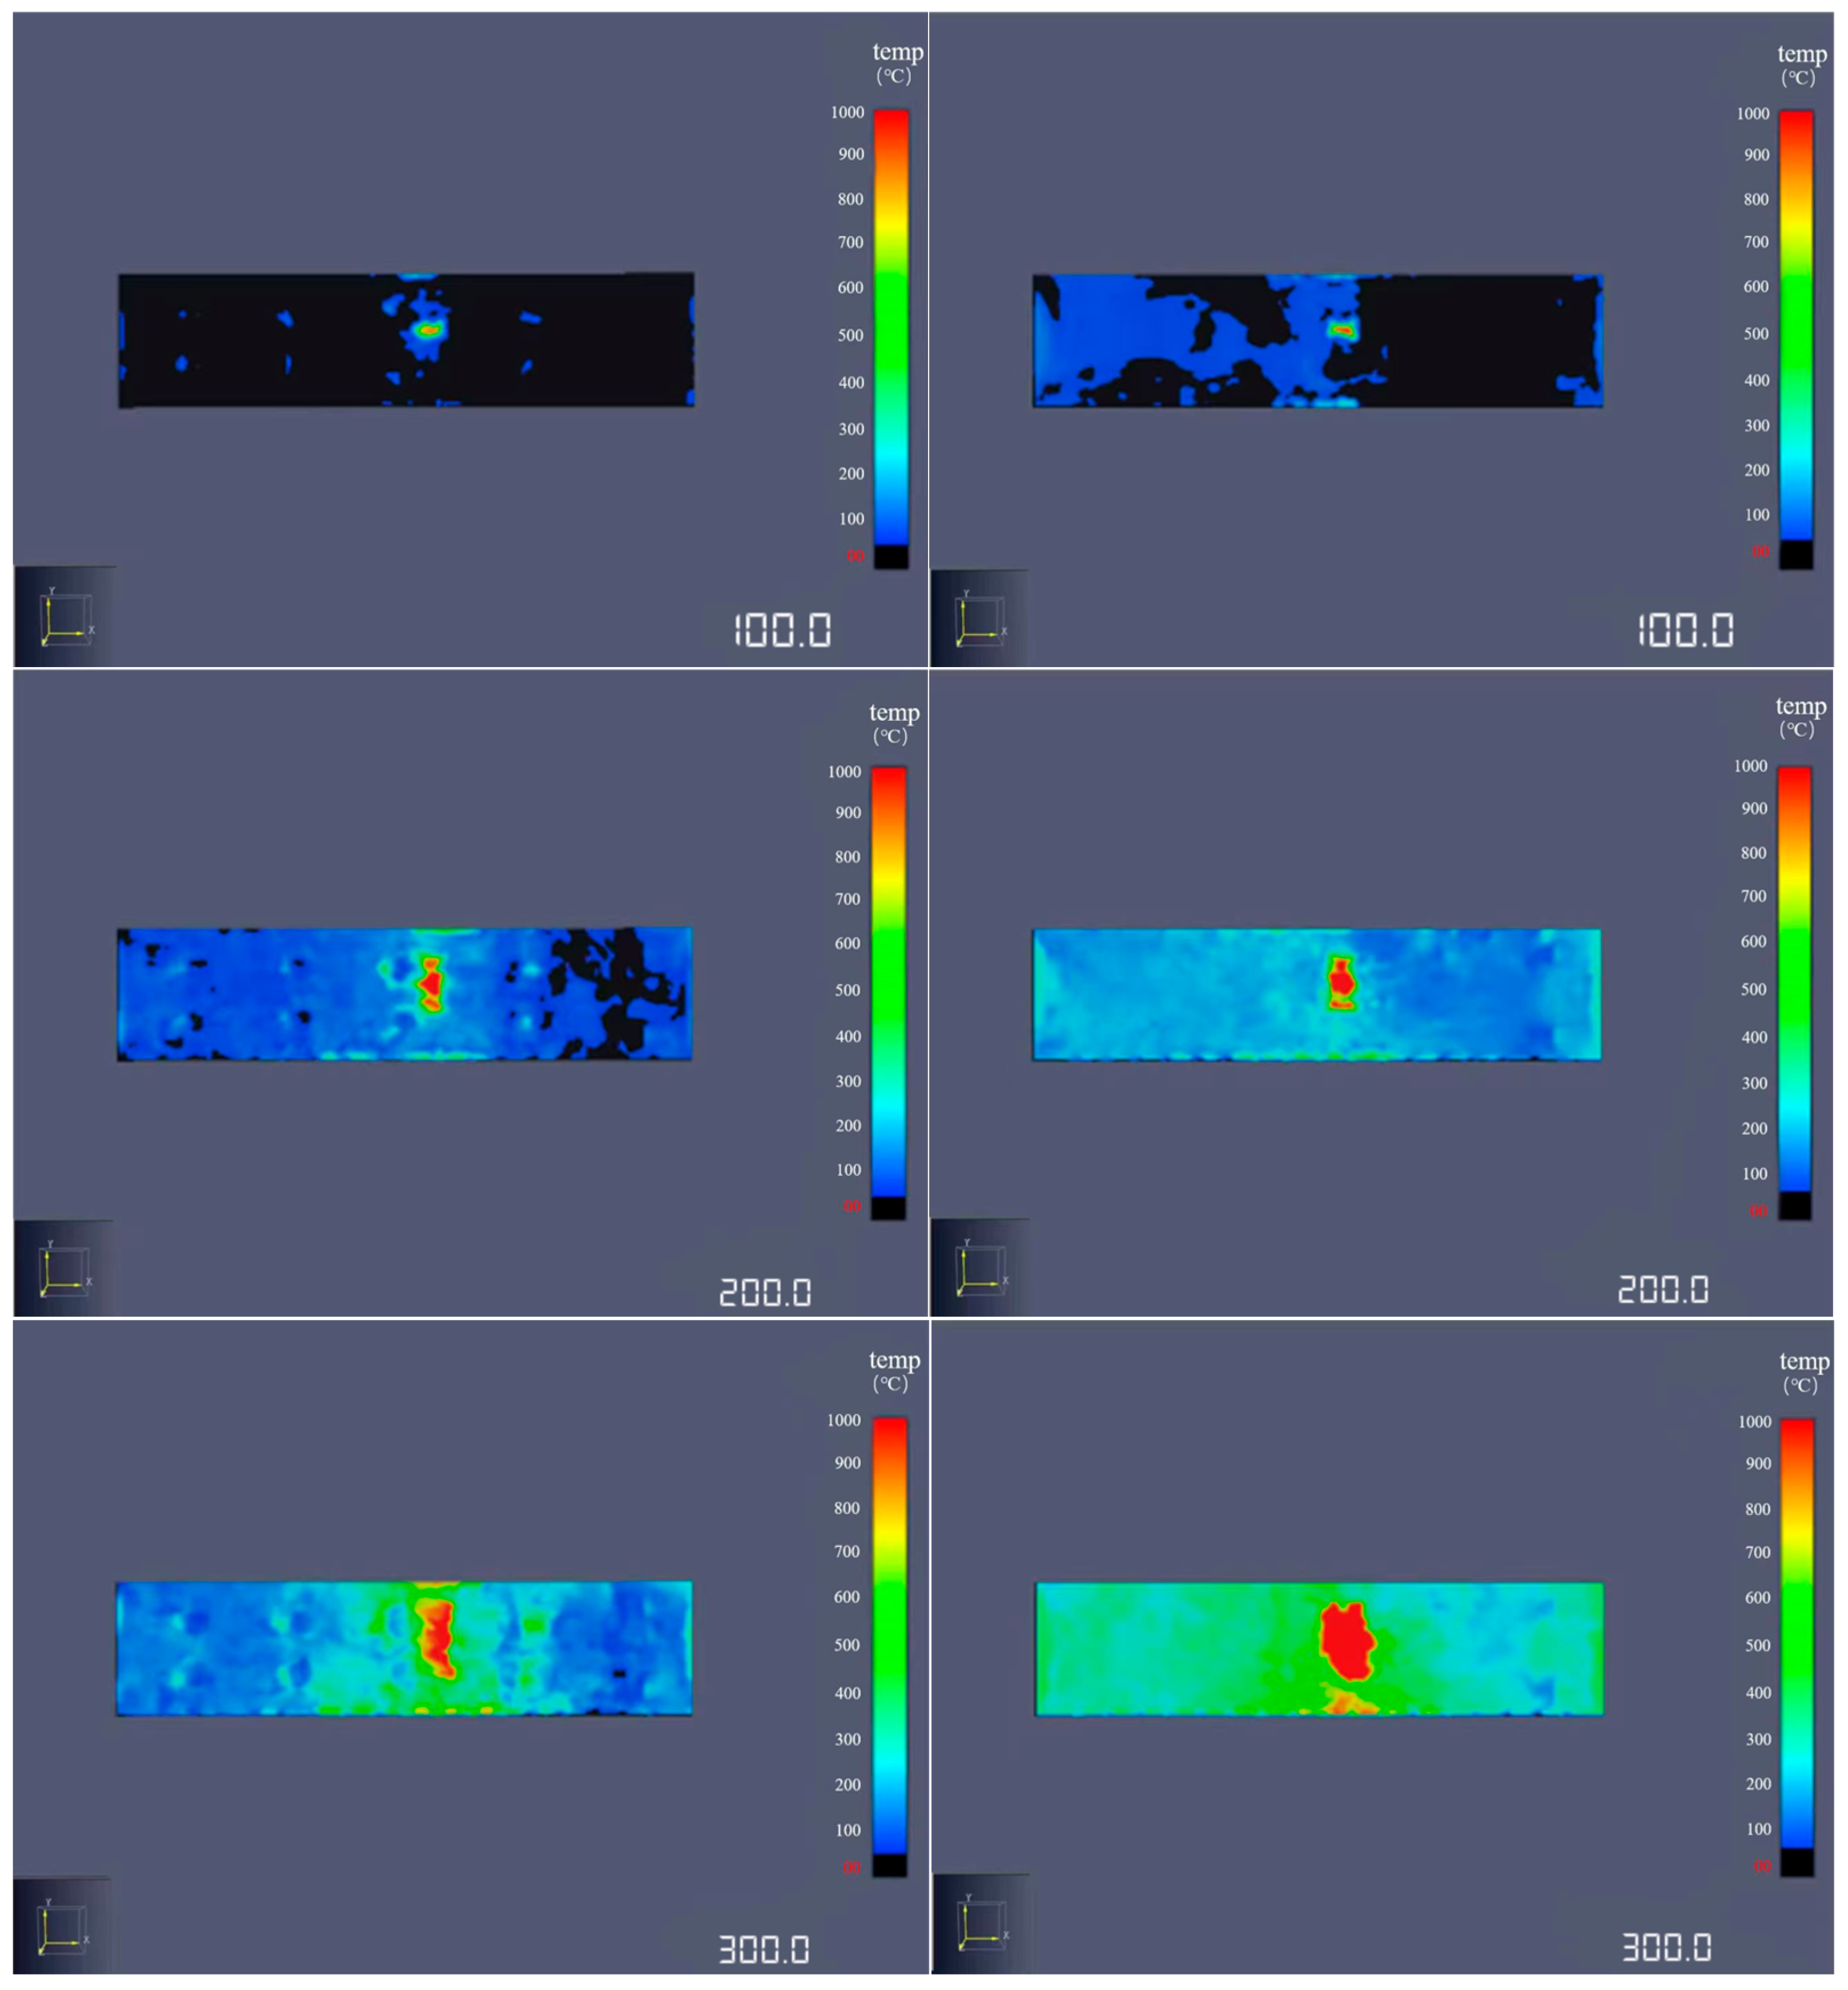
After the cabin sprinkler system is activated, the temperature of the three fire sources, the main deck staircase, the X-axis, the Y-axis and the Z-axis are monitored and analyzed. As shown in Figure 28, Figure 29 and Figure 30, by comparing the temperatures at y = 7.5 m, x = 30 m, and z = 3 m after a fire occurs at 100 s, 200 s, and 300 s with and without the water sprinkler system, it can be seen from the comparison of the charts that the temperature rise in each section when the water sprinkler system is turned on at the same time after the fire occurs is much smaller than the temperature rise in each section when the water sprinkler system is not turned on at the same time. For the convenience of observation, the color of the area between the temperature range below 60 °C and above 0 °C was changed to black in this simulation. Comparing the x-axis temperature slice with the y-axis temperature slice, it can be seen that when the sprinkler system is not turned on, the temperature in the car cabin rises rapidly. At 260 s, except for the black rectangular area representing the car model in the middle of the slice, there is no black area inside the entire space of the main deck car cabin, indicating that after 260 s, the temperature inside the entire cabin space is above 60 °C. On the other hand, after activating the water spray system, the temperature in the lower half of the interior of the main deck car compartment remained below 60 °C even after reaching the maximum value of 300 s. By comparing the z-axis temperature slices, it can be seen that after starting the sprinkler system, the heat propagation rate and diffusion range of the fire source within the same time period are much smaller than those of the source without turning on the water sprinkler system, which can effectively suppress the spread of the fire.
Because the water mist sprayed by the sprinkler system will fill the main deck car cabin, causing further decrease in visibility, this article mainly focuses on setting up visibility monitoring points at the upper deck staircase to monitor the spread of smoke after a fire occurs. As shown in Figure 31, the decrease rate of visibility data at the measurement points after turning on the water spray system is smaller than that without turning on the water spray system. It can be seen that fire water mist can slow down and block the spread of smoke, and at the same time, the water drips in the mist can also adsorb carbon particles and harmful components in the smoke.

6.3. Exploration of Optimization Strategies for Fire Protection Systems

The simulation results of the high-expansion foam fire suppression system indicate that it works by physically covering and isolating, effectively reducing the temperature of the vehicle compartment. However, this system has a significant response lag. The generation, diffusion, and formation of the foam to create an effective covering layer require a considerable amount of time, resulting in poor fire suppression efficacy in the early stages of a fire. Additionally, the foam has limited penetration and cooling capabilities for deep-seated fires such as lithium-ion battery fires. In the simulation, it can be observed that there is still continuous high temperature below the covered area, posing a risk of re-ignition. Therefore, in the scenario of ro-ro passenger ships with new energy vehicles where rapid suppression and deep cooling are emphasized, the high-expansion foam system is not the optimal choice. However, after the fire is initially controlled, it can be used to establish a long-lasting covering layer to play an auxiliary role in preventing re-ignition.
By comparing and analyzing the experimental results, it can be found that there is no optimal droplet size that is applicable to all scenarios. Fire suppression and cooling efficiency depend on the spatial position and the dominant fire suppression mechanism. In the core area of the fire source, due to the strong upward hot air current generated by the battery fire, larger particle size droplets, with better penetration ability, can effectively break through the hot air current and directly cool the surface of the battery, showing the best fire control effect. While in the areas far from the fire source, smaller particle size droplets, with better diffusion, longer suspension time and rapid heat absorption and evaporation characteristics, can form a wide cooling fog curtain, thereby most effectively reducing the temperature of the surrounding environment. Therefore, in extinguishing the fire in the carriage, the fine water mist system exhibits multi-mechanism protective characteristics: it can achieve cooling of the fire source through large particle size droplets and also achieve large-scale environmental cooling with small particle size droplets. However, due to the smaller diameter of the fine water droplets, their weight is relatively light, and their adsorption and blocking effect on smoke diffusion is also relatively limited.
The steam generated by heating water to its boiling point can both extinguish fires and has the advantages of low cost and high efficiency. However, due to the lack of cooling effect, when the gas supply is stopped and the steam condenses, the air and gas will reoccupy the space, posing a risk of re-ignition. In spray fire suppression operations, water mist particles are small in diameter, and the water vapor produced by the evaporation of water can dilute oxygen and exert a suffocating fire-extinguishing effect. However, FDS provides large-scale turbulence simulation capabilities to accurately capture the flow field and temperature field, but FDS regards the evaporation of water mist as a physical phase change process, calculates its heat absorption cooling effect, and does not consider the generated water vapor as an inert medium to participate in the combustion chemical reaction. In addition, this paper, apart from high-expansion foam, in the experiments, natural ventilation was adopted, and the suffocating effect of water vapor was not fully simulated. But this will be addressed in future work. Meanwhile to partially compensate for this limitation, this paper indirectly reflects the fire-extinguishing effectiveness of fine water mist by fully modeling its physical cooling mechanism. The simulation calculated the huge amount of heat absorbed by water droplets during evaporation, which directly led to a decrease in the temperature in the fire area, thereby inhibiting the rate of the combustion reaction.
The water mist system nozzles with different spray angles have their own advantages and disadvantages in terms of fire-fighting effectiveness after a fire occurs. Nozzles with a small spray angle have a more concentrated water flow, which can more efficiently penetrate and extinguish fires in batteries; while nozzles with a large spray angle have a more uniform water distribution, a wider coverage area, better effect in blocking smoke diffusion, and can effectively disperse or remove heat. For different types and sizes of ro-ro passenger ships, corresponding spray angles should be adopted to ensure the best smoke-blocking effect while achieving the required fire-extinguishing efficiency.
After a fire occurs, if the part of the space where the ignition source is located can be separated from other spaces, the concentration of combustion aids can be significantly reduced, thereby exerting a suffocating and extinguishing effect on the fire source. At the same time, it can effectively block the heat radiation and smoke diffusion of the fire source. Taking this article as an example, by constructing a barrier thin wall with insulation materials on all four sides to isolate the fire source, the risk of fire occurrence is greatly reduced, and the fire protection system also plays a more effective role. Therefore, in response to the possibility of secondary ignition caused by the presence of cars and a large number of combustibles in the surrounding area after a fire, it is recommended to install a fire shutter device above the ceiling of the car compartment on the main deck. At the same time, water spray and mist function can be added on the basis of the rolling shutter door to further enhance the fire prevention effect. The fire roller shutter door can fall simultaneously with the start of the water sprinkler system. Once a fire is detected, it quickly divides the interior of the main deck car compartment into multiple small spaces, separating the ignition area from other areas and greatly reducing the possibility of igniting surrounding combustibles. At the same time, research and design should be carried out on the type, hanging height, quantity, etc., of the fire roller shutter. Whether to choose a movable or fixed fire roller shutter should be based on the actual situation of different types and sizes of passenger roller boat car compartments, and the most suitable solution should be selected to ensure that the fire roller shutter plays a role while not hindering the water sprinkler system from exerting the same effect.

7. Conclusions

Through numerical simulation, this study revealed the characteristics of new energy fires on ro-ro passenger ships and optimized fire-fighting strategies. The results show that the fire impact radius of a 240 Ah battery could reach 3.5 m, with the highest temperature above the fire source, far exceeding that of smaller batteries. The high-expansion foam system had a delayed response and limited cooling capacity for deep-seated fires but could be used to establish a covering layer and prevent re-ignition after the initial fire control. The fine water mist system demonstrated significant spatial dependence and parameter sensitivity. The 800 µm droplets achieved direct cooling in the core area of the fire source with good penetration, while the 200 µm droplets performed best in the surrounding area for environmental cooling. The nozzle angle optimization study indicated that the large-angle nozzles with an angle of 80–120°, due to their wide coverage range, outperformed the small-angle nozzles in controlling the overall temperature of the fire scene and blocking smoke. A 0.05 m thick insulation structure could form an effective fire partition, reducing the heat radiation range by approximately 3 m and controlling the flame spread height within 3.5 m by limiting air supply. The fire rose to the upper deck within 52 s, entered stable combustion after 120 s; the smoke spread rapidly, reaching the main deck roof plate within 7 s, covering the main deck within 57 s, and spreading to the living area within 160 s, seriously endangering evacuation safety.
It is necessary to point out the limitations. FDS had deficiencies in depicting the multi-phase flow coverage mechanism of high-expansion foam and the chemical asphyxiation effect of fine water mist steam and did not consider the influence of ship swaying in real sea conditions on fire development. However, this will be pursued as a research direction and will be focused on in subsequent studies.

Author Contributions

Methodology, Y.Z. and W.C.; Validation, Y.Z. and W.C.; Formal analysis, Y.Z., J.G., J.B. and Y.W.; Writing—original draft, Y.Z.; Writing—review & editing, J.G., J.B., Y.W., D.A. and Q.W.; Funding acquisition, Y.W. All authors have read and agreed to the published version of the manuscript.

Funding

This research was funded by the Liaoning Provincial Natural Science Foundation, grant number 2025-BS-0241, the Fundamental Research Funds for the Central Universities, grant number 3132025155, the Key Laboratory of Xinjiang Coal Resources Green Mining, Ministry of Education (Xinjiang Institute of Engineering), Urumgi 830023, China, grant number KLXGY-Z2610, and the Shenzhen Polytechnic University, grant number LHRC20220405, 602331018PQ.

Institutional Review Board Statement

Not applicable.

Informed Consent Statement

Not applicable.

Data Availability Statement

Data are provided in this article.

Conflicts of Interest

The authors declare no conflict of interest.

References

  1. Kreuzer, E.; Sichermann, W. On Unpredictable Ship Rolling in Irregular Seas. Nonlinear Dyn. 2007, 47, 105–113. [Google Scholar] [CrossRef]
  2. Faroe Islands. Lithium Battery Fire-Extinguishing Using a Brine System and Its Application for Ro-Ro Passenger Ships; International Maritime Organization (IMO), Sub-Committee on Ship Systems and Equipment (SSE): London, UK, 2024; 11th Session, Document No. SSE 11/16, 20 December 2024. [Google Scholar]
  3. Japan. Recent Research on High-Expansion Foam Fire-Extinguishing Systems for Pure Car and Truck Carriers in Japan; International Maritime Organization (IMO), Sub-Committee on Ship Systems and Equipment (SSE): London, UK, 2024; 11th Session, Document No. SSE 11/INF.5, 18 December 2024. [Google Scholar]
  4. Republic of Korea; International Union of Marine Insurance (IUMI). Proposal for Application of Video Fire Detection System for Vehicle and Ro-Ro Space of Cargo Ships Carrying New Energy Vehicles; International Maritime Organization (IMO), Sub-Committee on Ship Systems and Equipment (SSE): London, UK, 2024; 11th Session, Document No. SSE 11/16/1, 20 December 2024. [Google Scholar]
  5. China. Real-Ship Cases of Installing Fixed Water Monitors on Containerships; International Maritime Organization (IMO), Sub-Committee on Ship Systems and Equipment (SSE): London, UK, 2024; 11th Session, Document No. SSE 11/INF.10, 20 December 2024. [Google Scholar]
  6. France; Germany. Comments on Document SSE 1112 (France and Germany); International Maritime Organization (IMO), Sub-Committee on Ship Systems and Equipment (SSE): London, UK, 2024; 11th session, Document No. SSE 11/16/3, 3 January 2025. [Google Scholar]
  7. Kang, H.J.; Choi, J.; Lee, D.; Park, B.J. A Framework for Using Computational Fire Simulations in the Early Phases of Ship Design. Ocean Eng. 2017, 129, 335–342. [Google Scholar] [CrossRef]
  8. Koromila, I.A.; Pouangare, A.; Spyrou, K.J. Design fires for vehicle decks of RO/RO passenger ships. In Proceedings of the STAB&S 2021, 1st International Conference on the Stability and Safety of Ships and Ocean Vehicles, Glasgow, Scotland, 7–11 June 2021. [Google Scholar]
  9. Sahu, D.; Jain, S.; Dhurandher, B.K.; Gupta, A.; Kumar, S. An Effect of Ventilation on Development of Thermal and Toxic Environment in Cubical Enclosure Fires. J. Braz. Soc. Mech. Sci. Eng. 2023, 45, 230. [Google Scholar] [CrossRef]
  10. Koromila, I.A.; Spyrou, K.J. Design Fire Methodology for Vehicle Spaces Onboard Ships. Fire Technol. 2023, 59, 1725–1759. [Google Scholar] [CrossRef]
  11. Wan, X.; Wang, Y.; Xu, G.; Yang, W.; Li, S.; Kang, N.; Lin, J. Experimental Study on Fire Extinguishing Performance of Typical Large Space Fires on Ships. Ships Offshore Struct. 2024, 20, 894–900. [Google Scholar] [CrossRef]
  12. Takeda, H. Model Experiments of Ship Fire. Symp. (Int.) Combust. 1989, 22, 1311–1317. [Google Scholar] [CrossRef]
  13. Tamura, Y.; Yamazaki, K.; Maeda, K.; Sato, K. The Residual Strength of Automotive Hydrogen Cylinders after Exposure to Flames. Int. J. Hydrogen Energy 2019, 44, 8759–8766. [Google Scholar] [CrossRef]
  14. Zeinali, D.; Mehaddi, R.; Ingold, F.; Parent, G.; Acem, Z.; Collin, A.; Torero, J.L.; Boulet, P. Experimental Study of Fire Containment Using Water Mist Curtains in a Reduced-Scale Deck of a Ro-Ro Ship. Fire Saf. J. 2023, 140, 103835. [Google Scholar] [CrossRef]
  15. Arvidson, M. Large-Scale Water Spray and Water Mist Fire Suppression System Tests for the Protection of Ro-Ro Cargo Decks on Ships. Fire Technol. 2014, 50, 589–610. [Google Scholar] [CrossRef]
  16. Zhou, H.; Zhang, G.; Ren, K. A Review of Cabin Fire and Numerical Simulation Technology and Intelligent Fire Protection Technology. In Proceedings of the 2022 IEEE International Conference on Electrical Engineering, Big Data and Algorithms (EEBDA), Changchun, China, 25–27 February 2022; IEEE: New York, NY, USA, 2022; pp. 353–357. [Google Scholar]
  17. Linn, R.R.; Goodrick, S.L.; Brambilla, S.; Brown, M.J.; Middleton, R.S.; O’Brien, J.J.; Hiers, J.K. QUIC-Fire: A Fast-Running Simulation Tool for Prescribed Fire Planning. Environ. Model. Softw. 2020, 125, 104616. [Google Scholar] [CrossRef]
  18. Salem, A.M. Vehicle-deck fires aboard ROPAX ships: A comparison between numerical modelling. Pol. Marit. Res. 2019, 2, 155–162. [Google Scholar] [CrossRef]
  19. Themelis, N. STAB 2021 Stability and Safety of Ships and Ocean Vehicles an Analysis of the Parameters Affecting the Propagation of Fire on the Vehicle Deck of a RoPax Ship. In Proceedings of the 1st International Conference on the Stability and Safety of Ships and Ocean, Glasgow, UK, 7–11 June 2021. [Google Scholar]
  20. Bellas, R.; Gonzalez-Gil, A.; Gomez, M.A.; Porteiro, J.; Miguez, J.L. Assessment of the Fire Dynamics Simulator for Modeling Fire Suppression in Engine Rooms of Ships with Low-Pressure Water Mist. Fire Technol. 2020, 56, 1315–1352. [Google Scholar] [CrossRef]
  21. Melek, Z. Interactive Simulation of Fire. In Proceedings of the 10th Pacific Conference on Computer Graphics and Applications, Beijing, China, 9–11 October 2002. [Google Scholar]
  22. Ji, J.; Ma, Z.; He, J.; Xu, Y.; Liu, Z. Research on Risk Evaluation and Dynamic Escape Path Planning Algorithm Based on Real-Time Spread of Ship Comprehensive Fire. J. Mar. Sci. Eng. 2020, 8, 602. [Google Scholar] [CrossRef]
  23. Marquis, D.M.; Pavageau, M.; Guillaume, E. Multi-Scale Simulations of Fire Growth on a Sandwich Composite Structure. J. Fire Sci. 2013, 31, 3–34. [Google Scholar] [CrossRef]
  24. Hoang, R.V.; Sgambati, M.R.; Brown, T.J.; Coming, D.S.; Harris, F.C. VFire: Immersive Wildfire Simulation and Visualization. Comput. Graph. 2010, 34, 655–664. [Google Scholar] [CrossRef]
  25. Nielsen, M.B.; Bojsen-Hansen, M.; Stamatelos, K.; Bridson, R. Physics-Based Combustion Simulation. ACM Trans. Graph. 2022, 41, 176. [Google Scholar] [CrossRef]
  26. Stam, J.; Fiume, E. Depicting Fire and Other Gaseous Phenomena Using Diffusion Processes. In Proceedings of the 22nd annual conference on Computer graphics and interactive techniques—SIGGRAPH ’95, Los Angeles, CA, USA, 6–11 August 1995; ACM Press: New York, NY, USA, 1995; pp. 129–136. [Google Scholar]
  27. Huang, Z.; Gong, G.; Han, L. Physically-Based Modeling, Simulation and Rendering of Fire for Computer Animation. Multimed. Tools Appl. 2014, 71, 1283–1309. [Google Scholar] [CrossRef]
  28. Back, G.G.; Beyler, C.L.; Di Nenno, P.J.; Hansen, R.L. Full-Scale Water Mist Design Parameters Testing, Report CG-D-03-99; United States Coast Guard Research and Development Center: Groton, CT, USA, 1998; p. 219. [Google Scholar]
  29. Prasad, K.; Li, C.; Kailasanath, K.; Ndubizu, C.; Ananth, R.; Tatem, P.A. Numerical Modeling of Fire Suppression Using Water Mist; NRL/MR/6410-98-8190 [Internet]; Naval Research Laboratory: Washington, DC, USA, 1998. [Google Scholar]
  30. Cui, Y.; Liu, J. Research Progress of Water Mist Fire Extinguishing Technology and Its Application in Battery Fires. Process Saf. Environ. Prot. 2021, 149, 559–574. [Google Scholar] [CrossRef]
  31. Zhang, Y.; Cheng, S.; Mei, W.; Jiang, L.; Jia, Z.; Cheng, Z.; Sun, J.; Wang, Q. Understanding of Thermal Runaway Mechanism of LiFePO4 Battery In-Depth by Three-Level Analysis. Appl. Energy 2023, 336, 120695. [Google Scholar] [CrossRef]
  32. Chen, Y.; Zhuang, S.; Yang, L.; Feng, Z. Large Ship Cabins Fire Prevention and Fire Safety Evaluation Method. In Advances in Environmental Technologies, PTS 1-6; Zhao, J., Iranpour, R., Li, X., Jin, B., Eds.; Trans Tech Publications Ltd.: Stafa-Zurich, Switzerland, 2013; Volume 726–731, pp. 877–881. [Google Scholar]
  33. Zhang, Y.; Peng, W.; Liu, X.; Ren, J.; Zang, X.; Xie, Q.; Li, J. Experimental Study on Suppression of Thermal Runaway in Lithium-Ion Battery by Mixed Particle Size Water Mist. Process Saf. Environ. Protect. 2023, 179, 189–198. [Google Scholar] [CrossRef]
  34. Li, C.; Mao, J.; Kang, Z.; Zhao, S.; Ren, H. Influence of Firefighting Intervention on Fire Spread Characteristics in Ship Engine Room. J. Mar. Sci. Eng. 2023, 11, 877. [Google Scholar] [CrossRef]
  35. Spyrou, K.J.; Koromila, I.A. A Risk Model of Passenger Ship Fire Safety and Its Application. Reliab. Eng. Syst. Saf. 2020, 200, 106937. [Google Scholar] [CrossRef]
  36. Jiang, Q.; Yuan, W. Numerical simulation of cruise ship cabin fire based on FDS. In Proceedings of the International Symposium on Artificial Intelligence and Robotics 2021, Fukuoka, Japan, 28 October 2021; Volume 11884. [Google Scholar]
  37. Wang, L.; Gao, J.; Bai, Y. Introduction and Application of Fire Dynamic Simulation Software FDS. In Proceedings of the 17th Annual Conference of Beijing Dynamic Society, Beijing, China, 25–27 February 2011. [Google Scholar]
  38. Lin, J.; Li, S.; Lu, S.; Chen, G.; Xue, Z. Large-Scale Experimental Study on the Average Temperature Distribution Model of Fire Smoke under Mechanical Ventilation in the Flat Space. Int. J. Therm. Sci. 2024, 204, 109228. [Google Scholar] [CrossRef]
  39. Yuan, Y.; Wu, S.; Shen, B. A Numerical Simulation of the Suppression of Hydrogen Jet Fires on Hydrogen Fuel Cell Ships Using a Fine Water Mist. Int. J. Hydrogen Energy 2021, 46, 13353–13364. [Google Scholar] [CrossRef]
  40. Salem, A.M. Use of Monte Carlo Simulation to Assess Uncertainties in Fire Consequence Calculation. Ocean. Eng. 2016, 117, 411–430. [Google Scholar] [CrossRef]
  41. Zhang, G.; Zhu, G.; Yuan, G.; Huang, L. Methods for Prediction of Steel Temperature Curve in the Whole Process of a Localized Fire in Large Spaces. Math. Probl. Eng. 2014, 2014, 238515. [Google Scholar] [CrossRef]
  42. Guo, G.; Wang, Z.; Wu, S.; Ju, H. Investigation on the Thermal Runaway Mechanism of Electrolyte in Lithium-Ion Batteries via ReaxFF Molecular Dynamics. Int. J. Hydrogen Energy 2024, 82, 979–985. [Google Scholar] [CrossRef]
  43. Lee, J. Numerical Analysis of How Ventilation Conditions Impact Compartment Fire Suppression by Water Mist. Ann. Nucl. Energy 2020, 136, 107021. [Google Scholar] [CrossRef]
  44. Baker, N.; Kelly, G.; O’Sullivan, P.D. A Grid Convergence Index Study of Mesh Style Effect on the Accuracy of the Numerical Results for an Indoor Airflow Profile. Int. J. Vent. 2020, 19, 300–314. [Google Scholar] [CrossRef]
  45. Zhou, Z.; Zhou, X.; Wang, D.; Li, M.; Wang, B.; Yang, L.; Cao, B. Experimental Analysis of Lengthwise/Transversal Thermal Characteristics and Jet Flow of Large-Format Prismatic Lithium-Ion Battery. Appl. Therm. Eng. 2021, 195, 117244. [Google Scholar] [CrossRef]
  46. Liu, P.; Li, Y.; Mao, B.; Chen, M.; Huang, Z.; Wang, Q. Experimental Study on Thermal Runaway and Fire Behaviors of Large Format Lithium Iron Phosphate Battery. Appl. Therm. Eng. 2021, 192, 116949. [Google Scholar] [CrossRef]
  47. Qin, P.; Jia, Z.; Wu, J.; Jin, K.; Duan, Q.; Jiang, L.; Sun, J.; Ding, J.; Shi, C.; Wang, Q. The Thermal Runaway Analysis on LiFePO4 Electrical Energy Storage Packs with Different Venting Areas and Void Volumes. Appl. Energy 2022, 313, 118767. [Google Scholar] [CrossRef]
  48. Cui, Y.; Chen, Y.; Chen, M.; Ouyang, D.; Weng, J.; Tao, C.; Zhao, L.; Wang, J. Numerical Study on the Fire and Its Propagation of Large Capacity Lithium-Ion Batteries under Storage. J. Therm. Anal. Calorim. 2023, 148, 5787–5803. [Google Scholar] [CrossRef]
  49. Wang, Q.; Mao, B.; Stoliarov, S.I.; Sun, J. A Review of Lithium Ion Battery Failure Mechanisms and Fire Prevention Strategies. Prog. Energy Combust. Sci. 2019, 73, 95–131. [Google Scholar] [CrossRef]
  50. Wu, T.; Chen, H.; Wang, Q.; Sun, J. Comparison Analysis on the Thermal Runaway of Lithium-Ion Battery under Two Heating Modes. J. Hazard. Mater. 2018, 344, 733–741. [Google Scholar] [CrossRef] [PubMed]
  51. Back, G.G.; Forssell, E.W.; Wakelin, A.J.; Beene, D.; Nash, L. An Evaluation of Total Flooding High Expansion Foam Fire Suppression Systems for Machinery Space Applications. Fire Technol. 2006, 42, 187–210. [Google Scholar] [CrossRef]
  52. Shu, Y.L.; Jeng, W.J.; Chiu, C.W.; Chen, C.H. Assessment of Fire Protection Performance of Water Mist Applied in Exhaust Ducts for Semiconductor Fabrication Process. Fire Mater. 2005, 29, 295–302. [Google Scholar] [CrossRef]
  53. Liu, H.; Wang, C.; De Cachinho Cordeiro, I.M.; Yuen, A.C.Y.; Chen, Q.; Chan, Q.N.; Kook, S.; Yeoh, G.H. Critical Assessment on Operating Water Droplet Sizes for Fire Sprinkler and Water Mist Systems. J. Build. Eng. 2020, 28, 100999. [Google Scholar] [CrossRef]
  54. Lee, S.-K.; Ho, M.-C.; Chen, J.-J.; Lin, C.-Y.; Lin, T.-H. Fire Resistance Evaluation of a Steel Roller Shutter with Water-Film Cooling System. Appl. Therm. Eng. 2013, 58, 465–478. [Google Scholar] [CrossRef]
  55. Kim, G.; Cha, J.-H.; Lee, H.-J. Numerical Study on the Effect of Temperature in the Retention Time of an Inert Agent. Fire Saf. J. 2020, 115, 103004. [Google Scholar] [CrossRef]
Figure 1. (a) Geometry and boundary conditions. (b) Geometric and boundary conditions.
Fire 08 00443 g001aFire 08 00443 g001b
Figure 2. Thermocouple location.
Fire 08 00443 g002
Figure 3. The thermocouple temperature curve below the exhaust port in the flat space.
Fire 08 00443 g003
Figure 4. Ceiling thermocouple temperature.
Fire 08 00443 g004
Figure 5. Temperature curves under different grid sizes.
Fire 08 00443 g005
Figure 6. Structural diagram (upper) and geometric model of ro-ro passenger ship (lower).
Fire 08 00443 g006
Figure 7. Geometric model of upper deck (a) and main deck (b).
Fire 08 00443 g007
Figure 8. Schematic diagram of nozzle positions in the main deck area.
Fire 08 00443 g008
Figure 9. (a) Layout diagram of monitoring points. (b) Schematic diagram of the monitoring surface layout.
Fire 08 00443 g009aFire 08 00443 g009b
Figure 10. Mesh sensitivity.
Fire 08 00443 g010
Figure 11. Mesh model.
Fire 08 00443 g011
Figure 12. HRR of different battery capacities.
Fire 08 00443 g012
Figure 13. (a) 20 Ah; (b) 60 Ah; (c) 120 Ah; (d) 180 Ah; (e) 240 Ah.
Fire 08 00443 g013
Figure 14. (a) 20 Ah; (b) 60 Ah; (c) 120 Ah; (d) 180 Ah; (e) 240 Ah.
Fire 08 00443 g014
Figure 15. The 150 °C-isothermal surface.
Fire 08 00443 g015
Figure 16. (a) the fine water mist particles; (b) high-expansion foam particles.
Fire 08 00443 g016
Figure 17. Temperature above the fire source (a) and temperature near the fire source (b).
Fire 08 00443 g017
Figure 18. Temperatures above the fire source (a) and at the entrance of the staircase (b).
Fire 08 00443 g018
Figure 19. (a) 200 μm; (b) 500 μm; (c) 800 μm; (d) 1000 μm.
Fire 08 00443 g019
Figure 20. (a) 30° to 80°; (b) 60° to 75°; (c) 60° to 90°; (d) 80° to 90°; (e) 60° to 120°.
Fire 08 00443 g020
Figure 21. Temperature changes above the fire source (a) and near the fire source (b).
Fire 08 00443 g021
Figure 22. Temperature changes above the fire source, near the fire source, and at the stairwell entrance.
Fire 08 00443 g022
Figure 23. Spatial propagation of temperature in the carriage without (a) and with (b) fire doors.
Fire 08 00443 g023
Figure 24. Changes in fire source over time.
Fire 08 00443 g024
Figure 25. Smoke spread over time.
Fire 08 00443 g025
Figure 26. Temperatures of the areas above the fire source (a) and the living areas and rooms on the upper deck (b).
Fire 08 00443 g026
Figure 27. Visibility changes on the main deck (a) and the upper deck (b).
Fire 08 00443 g027
Figure 28. Comparison of temperature slices between the x-axis with the spray system turned on (left) and the x-axis without the spray system turned on (right).
Fire 08 00443 g028
Figure 29. Comparison of temperature slices between the y-axis with the spray system turned on (left) and the y-axis without the spray system turned on (right).
Fire 08 00443 g029
Figure 30. Comparison of temperature slices between the Z-axis with the spray system turned on (left) and without the spray system turned on (right).
Fire 08 00443 g030
Figure 31. Visibility changes of the upper deck staircase.
Fire 08 00443 g031
Table 1. Physicochemical properties and fire characteristics parameters of diesel oil.
ParameterValue
Density (kg/m3, 20 °C)814
Kinematic viscosity (mm2/s)≤3.5
Heat of combustion (MJ/kg)43.2
Combustion efficiency0.8
kB Effective absorption coefficient (m−1)3.5
Table 2. The physical and chemical properties of the electrolyte carbonate ethyl ether C3H4O3.
Molecular FormulaRelative Molecular MassDensity
(g/cm3)
Flash Point (°C)Boiling Point (°C)ΔHc
(MJ kg−1)
C3H4O388.11.3214624812.66
Table 3. Design parameters of high-expansion foam fire extinguishing system.
Expansion RatioRatio ConcentrationVolume Flow Rate
(m3/min)
Flow Velocity
(1/min)
500:12.2%23610.4
Disclaimer/Publisher’s Note: The statements, opinions and data contained in all publications are solely those of the individual author(s) and contributor(s) and not of MDPI and/or the editor(s). MDPI and/or the editor(s) disclaim responsibility for any injury to people or property resulting from any ideas, methods, instructions or products referred to in the content.