Abstract
This study develops an explainable machine learning framework for wildfire prediction across Australia, integrating region-specific models and feature attribution to identify key environmental drivers. Three wildfire indicators, Estimated Fire Area (FA), Mean Fire Brightness Temperature (FBT), and Fire Radiative Power (FRP), were modeled using Lasso, Random Forest, LightGBM, and XGBoost. Performance metrics (RMSEC, RMSECV, RMSEP) confirmed strong calibration and generalization, with Tasmania and Queensland achieving the lowest prediction errors for FA and FRP, respectively. Feature importance and SHAP analyses revealed that soil moisture, solar radiation, precipitation, and humidity variability are dominant predictors. Extremes and variance-based measures proved more influential than mean climatic values, indicating that fire dynamics respond non-linearly to environmental fluctuations. Lasso models captured stable linear dependencies in arid regions, while ensemble models effectively represented complex interactions in tropical climates. The results highlight a hierarchical process where cumulative soil and radiation stress establish fire potential, and short-term meteorological variability drives ignition and spread. Projected climate shifts, declining soil water and increased radiative load, are likely to intensify these drivers. The framework supports interpretable, region-specific mitigation planning and paves the way for incorporating generative AI and multi-source data fusion to enhance real-time wildfire forecasting.
1. Introduction
Wildfire occurrence is complex and governed by interactions among weather, topography, vegetation, and human activities [1]. Weather variables critically influence wildfires, including temperature, precipitation, relative humidity, wind speed, and solar radiation [2]. Temperature extremes, both maximum and variance, affect fuel moisture and fire ignition potential, with maximum temperatures causing intense drying and variance indicating climate instability influencing unpredictable fire behavior [3]. Precipitation patterns, especially minimum rainfall and drought periods, determine fuel availability and dryness [4]. Variability in precipitation can exacerbate wildfire risk by causing rapid transitions between wet and dry conditions [5]. Relative humidity’s minimum levels indicate dry air conducive to rapid fire spread, while its variance reflects longer-term atmospheric moisture fluctuations [2]. Wind speed maxima directly correlate with fire spread rate, making understanding extreme wind events key to anticipating fire escalation [6]. Topography shapes fire behavior through slope, aspect, and elevation, which influence microclimate and fuel moisture. Vegetation type and condition affect fuel load and combustibility; mean soil water content signals persistent moisture while minimum soil water identifies critical drought stress periods [7].
Traditional wildfire models often rely on daily or short-term data, restricting their ability to capture long-term trends and environmental variability, which are crucial under changing climate regimes [8]. Incorporating time-series data of averages, extremes, and variance improves model robustness and forecasting skill [9]. Advances in remote sensing and GIS technologies enable high-resolution spatiotemporal data integration important for modeling wildfire dynamics [10]. Machine learning algorithms, including Support Vector Machine (SVM), Artificial Neural Networks (ANNs), Random Forest, Gradient Boosting, and Lasso Regression, effectively model complex non-linear relationships and perform feature selection to identify influential wildfire drivers [11]. Identified critical features in Australian wildfire prediction include relative humidity, solar radiation variation, soil moisture, precipitation variability, temperature extremes, and wind profiles [12].
The growing adoption of machine learning in wildfire prediction has highlighted a critical limitation: the “black box” nature of complex models that provide accurate predictions but lack interpretability regarding how individual features contribute to outcomes. This interpretability gap is particularly problematic in wildfire management, where understanding the relative importance of different environmental drivers is as crucial as accurate prediction for developing effective mitigation strategies. Recent advances in explainable artificial intelligence (XAI), particularly SHapley Additive exPlanations (SHAP), have emerged as powerful tools for addressing this challenge [13].
SHAP analysis, grounded in cooperative game theory, quantifies each feature’s contribution to model predictions by calculating marginal contributions across all possible feature combinations. The incorporation of SHAP values has advanced the understanding of feature importance, consistently identifying meteorological variables like Fine Fuel Moisture Code (FFMC), Drought Code (DC), Initial Spread Index (ISI), and temperature as key drivers of wildfire behavior [13]. In European summer wildfires, SHAP analysis using Long Short-Term Memory (LSTM) models revealed that the Temperature Condition Index (TCI), Solar Radiation Condition Index (SRCI), Soil Moisture Condition Index (SMCI), and Normalized Difference Vegetation Index (NDVI) are dominant contributors to summer wildfires, highlighting the critical influence of current-season and late spring climatic conditions, particularly in the Mediterranean region [14]. Australian studies using SHAP have identified humidity, wind speed, and rainfall as key meteorological drivers; elevation and slope as influential topographical factors; and the Normalized Difference Moisture Index (NDMI) as a major vegetation-related determinant of wildfire susceptibility [15].
Recent applications have demonstrated exceptional predictive capabilities, with SHAP-integrated models achieving remarkable accuracy rates. The EWXS model using Extreme Gradient Boosting (XGBoost) demonstrated 99.22% accuracy, 98.48% precision, 96.82% recall, an F1 score of 97.64%, and an AUC of 0.983, with SHAP analysis identifying proximity to villages, meteorological variables, air humidity, and vegetation temperature differences as dominant wildfire drivers [16]. Similarly, Random Forest models enhanced with SHAP analysis achieved 95.6% accuracy in wildfire susceptibility mapping, revealing that wind speed, temperature, NDVI, slope, and proximity to villages strongly increase wildfire susceptibility [17]. In Chinese contexts, XGBoost-SHAP frameworks have demonstrated outstanding predictive capability with AUC values of 0.981, identifying precipitation, temperature, and wind speed as dominant drivers of wildfire dynamics [18].
Wildfire’s unpredictability is enhanced by dynamic interactions among climate, vegetation, and human factors, making modeling a challenge [19]. Fuel moisture is a critical determinant of fire behavior, yet difficult to measure precisely due to variability in canopy and soil moisture [20]. Advances in vegetation indices, such as NDVI, have improved the estimation of live fuel moisture and helped optimize fire risk mapping [21]. Incorporating these indices into machine learning frameworks has enhanced large-scale fire prediction accuracy [22].
Machine learning models, especially deep learning architectures like LSTM and attention-based models, excel at capturing spatiotemporal wildfire dynamics, offering improved fire spread and severity prediction capabilities [23]. Regional variability necessitates tailoring models to local environmental and climatic conditions, as Australia’s broad climatic zones show marked differences in fire regimes [24]. Australia’s uniquely variable climate and geography create diverse wildfire regimes requiring tailored predictive models [24]. Climate change exacerbates fire risk by increasing temperature extremes, prolonging droughts, altering precipitation and solar radiation patterns, and shifting wind regimes [25]. It is expanding fire seasons and increasing fire severity through warming temperatures, increased drought frequency, and altered precipitation patterns [12]. Scientific consensus emphasizes that addressing these climatological shifts in predictive models is urgent for effective wildfire mitigation [25,26].
Furthermore, wildfire contributes to greenhouse gas emissions, complicating the global climate feedback loop and highlighting dual mitigation priorities [27]. Data indicate that global forests are experiencing increasing fire extent and frequency, emphasizing the need for robust global-to-local predictive frameworks. These frameworks must balance computational efficiency with ecological and climatic realism to enhance anticipatory fire management [28].
Ref. [29] incorporates key environmental factors, various climate variables, and applies time-series modeling techniques to capture evolving fire dynamics, predicting three fire characteristics: Fire Area (FA), Fire Brightness Temperature (FBT), and Fire Radiative Power (FRP). The authors achieved positive R2 values and low RMSE values, making their models good candidates for feature importance analysis, which will be carried out in this study.
This work addresses the identified research gaps by conducting comprehensive SHAP-based feature importance analyses across Australia’s diverse climate zones, extending beyond the geographic and temporal limitations of previous studies. Unlike existing research that often focuses on single regions or simplified datasets, this study analyzes all seven Australian regions to provide robust, generalizable insights into wildfire driver relationships. The methodology utilizes SHAP and feature importance analysis, addressing the critical need for interpretable machine learning models in wildfire prediction while maintaining high predictive accuracy. This approach specifically tackles the interpretability–performance trade-off by combining the predictive power of advanced machine learning models with the transparency provided by SHAP and feature importance.
The integration of time-series data capturing averages, extremes, and variance addresses the temporal dynamics gap identified in the current literature, while the multi-target approach (FA, FBT, FRP) provides comprehensive insights into different aspects of wildfire behavior. This work contributes to filling the methodological limitation gaps by providing consistent, quantitative analysis of feature contributions across diverse Australian fire regimes, supporting the development of more effective, evidence-based wildfire management strategies.
The remainder of this paper is structured as follows. Section 2 begins with the study area, followed by the research dataset, including climate and wildfire data. Subsequently, the methodology framework is highlighted. The SHAP methodology for feature importance analysis is then detailed. Section 3 summarizes the top contributing features to wildfires, followed by an analysis of top features by region and target variable displayed as heatmaps. Section 4 interprets the findings, including climate change impacts, mitigation strategies, and future work. The Conclusion Section summarizes key contributions.
2. Materials and Methods
This section describes the data sources and models from which key wildfire prediction features are derived and analyzed. This study builds on the feature importance outputs of the top-performing models reported by [29], integrating them as a core component of the research framework. Climate and wildfire datasets containing critical environmental variables are introduced as the foundation for prediction. From these datasets, key features influencing wildfire predictors in each Australian region are identified using the models developed by [29] and systematically compared through heatmap visualizations. This approach allows for an in-depth examination of spatial variability in wildfire drivers, linking environmental conditions to fire behavior while emphasizing interpretability and model transparency. The methodology thus focuses on understanding and communicating the key predictors derived from state-of-the-art model analyses.
2.1. Study Area
The study encompasses all seven Australian regions, as depicted in Figure 1: Western Australia (WA), Northern Territory (NT), Queensland (QL), New South Wales (NSW) including the Australian Capital Territory (ACT), Victoria (VI), Tasmania (TA), and South Australia (SA). Wildfires have historically impacted all these regions, and this analysis includes wildfire events from 2005 onward. Notable incidents covered include the Black Saturday bushfires of 2009, one of Australia’s most devastating disasters with 173 fatalities, where the Kilmore East fire alone accounted for approximately 70% of deaths and burned 100,000 hectares within 12 h [30].
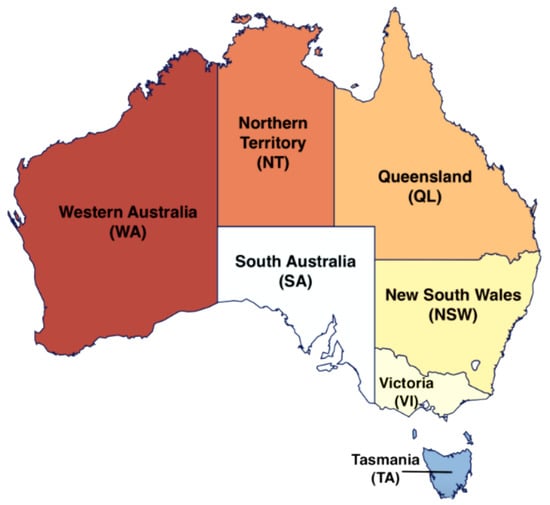
Figure 1.
Study area: the seven Australian regions.
2.2. Dataset Description
Effective wildfire prediction and management require integrating diverse datasets capturing environmental and land characteristics. This study utilizes a combination of climate and wildfire datasets used by [29], summarized in Table 1, focusing on variables critical for fire behavior analysis. Climate data are primarily sourced from the ERA5 reanalysis by the European Centre for Medium-Range Weather Forecasts (ECMWF), providing daily measurements from 2005 to 2021 of key variables including precipitation, temperature, wind speed, relative humidity, soil water content, and solar radiation. ERA5 combines satellite and ground observations at a spatial resolution of approximately 31 km, enabling the detailed assessment of both long-term climate trends and short-term weather influences relevant for wildfire risk modeling [29].

Table 1.
Summary of dataset features used in wildfire prediction [29].
Wildfire data originate from the Moderate Resolution Imaging Spectroradiometer (MODIS) MCD14DL product, offering daily records of fire activity from 2005 to 2021. Key wildfire indicators include estimated FA, mean estimated FBT, and mean estimated FRP, which serve as proxies for fire scale and intensity. Additional metrics such as confidence intervals and pixel counts provide further insights into fire behavior and spatial extent. The combination of these datasets, featuring high temporal and moderate spatial resolution, underpins the robust predictive framework developed for regional wildfire forecasting across Australia [29].
2.3. Methodology Framework
Ref. [29] demonstrated that several machine learning models, including Lasso, Random Forest, LightGBM, XGBoost, and K-Nearest Neighbors (KNN)s, can predict wildfire attributes such as FA, FBT, and FRP across Australian regions with strong accuracy. Their evaluation based on RMSE and R2 identified Lasso Regression as the best overall performer, though optimal models varied by target and region.
Building on their verified predictive framework, as can be seen in Figure 2, our study advances from prediction to explanation: we focus on understanding the key environmental and climatic drivers influencing wildfire behavior through interpretable machine learning. Accordingly, we adopt their top-performing models (Lasso, Random Forest, LightGBM, XGBoost) while excluding KNN due to its nonparametric, instance-based design, which limits its suitability for global feature attribution.
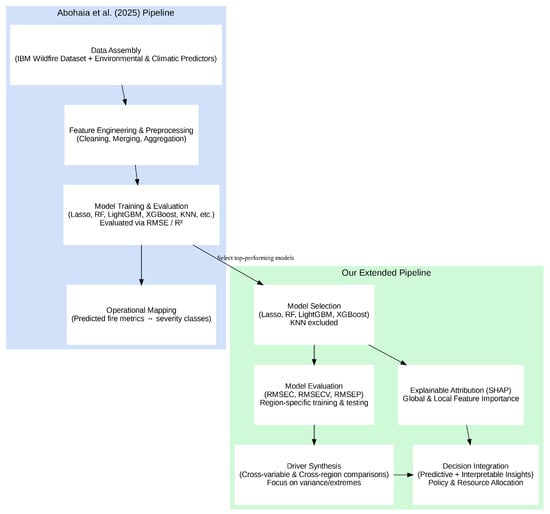
Figure 2.
Methodology framework [29].
Model Selection and Rationale
The selected models, Lasso, Random Forest, LightGBM, and XGBoost, offer a balance between predictive strength and interpretability. These algorithms support both global and local feature attribution, enabling meaningful driver analysis when paired with explainable AI methods. Lasso was used with alpha = 0.001 to allow the identification of the features more clearly. KNN was excluded because it does not yield transparent or decomposable feature influence across datasets.
2.4. Model Evaluation
Model performance was quantitatively assessed using three complementary metrics: the Root Mean Square Error of Calibration (RMSEC), the Root Mean Square Error of Cross-Validation (RMSECV), and the Root Mean Square Error of Prediction (RMSEP). The models were evaluated using a time-series cross-validation of 5 folds, so for each fold 80% for the training set and 20% for the testing set. These metrics and evaluation strategy were chosen to evaluate the robustness and generalizability of the models across different data partitions, ensuring that predictive accuracy was maintained beyond the training phase. Each error term provides insight into a different aspect of model reliability, as detailed below.
2.4.1. Root Mean Square Error of Calibration (RMSEC)
The RMSEC measures the deviation between observed and predicted values within the calibration (training) dataset. It reflects the model’s ability to fit the training data accurately:
where represents the observed value, is the predicted value, and n is the number of observations in the calibration set. Lower RMSEC values indicate that the model successfully captures the underlying data patterns without excessive overfitting.
2.4.2. Root Mean Square Error of Cross-Validation (RMSECV)
The RMSECV assesses the model’s stability and its ability to generalize during internal validation, typically using a k-fold cross-validation approach. It is computed as
where k is the number of folds, is the number of samples in fold j, and and represent the observed and predicted values for sample i in fold j, respectively. A small difference between RMSEC and RMSECV indicates that the model generalizes well and is not overly sensitive to the calibration data.
2.4.3. Root Mean Square Error of Prediction (RMSEP)
The RMSEP quantifies the predictive capability of the final model when applied to an independent test dataset that was not used during model training or cross-validation:
where m is the number of test samples, and and are the observed and predicted test values, respectively. RMSEP serves as the most rigorous measure of model performance, reflecting the model’s applicability to unseen data and its suitability for real-world deployment.
2.5. Interpretation and Comparison
Collectively, these three metrics provide a comprehensive evaluation of model accuracy and generalization. Models with consistently low RMSEC, RMSECV, and RMSEP values are considered well-calibrated, stable, and reliable. In the context of this study, the models exhibiting the lowest RMSEP values were deemed the most effective for predicting fire-related variables such as FA, FBT, and FRP across different Australian regions. This multi-metric evaluation ensures that selected models not only achieve high accuracy but also maintain predictive robustness, supporting the practical integration of explainable AI into wildfire management decision-making, particularly for policy support and operational resource allocation.
2.6. Explainable AI: SHAP
Feature attribution using SHAP is applied to identify the most influential features for predicting each target variable across regions. SHAP provides a unified, model-agnostic framework for explainable AI that quantifies the contribution of each feature to individual model predictions, grounded in cooperative game theory [31]. This method plays a critical role in interpreting machine learning models, especially when working with high-dimensional environmental data, by offering both global and local insights into how input variables affect model outcomes. In this study, tree-based models, namely RandomForestRegressor, GradientBoostingRegressor, XGBoost, and LightGBM, were evaluated using SHAP values instead of traditional in-model feature importance metrics. Unlike impurity- or gain-based importance measures, which may introduce bias toward features with higher cardinality, SHAP decomposes each model prediction into additive feature contributions, providing a consistent, interpretable estimate of influence across all samples. For each model, mean absolute SHAP values were computed to represent the average contribution of each feature to the model’s output, allowing both the magnitude and direction (positive or negative) of influence to be assessed. This approach captures non-linear dependencies between predictors such as temperature variance, soil water content, and relative humidity, offering a more transparent understanding of how these drivers affect fire-related targets across regions. For linear models such as Lasso Regression, SHAP values were also derived from model coefficients, ensuring a consistent interpretability framework across both linear and non-linear models. As with other linear methods, Lasso assumes additive effects between features and the target; however, the use of SHAP extends interpretability by expressing each coefficient’s contribution on a per-sample basis, enabling cross-model comparison within a single explanatory framework. A major advantage of Lasso Regression remains its ability to perform feature selection by shrinking less relevant coefficients to zero, which is particularly beneficial in high-dimensional datasets [32,33]. By leveraging SHAP-based feature attribution, this study enhances the transparency and comparability of model evaluation. Ranking features according to their SHAP importance provides a clear understanding of which environmental variables are most influential for each target variable and region.
2.7. Explainable AI: Feature Importance Analysis
Feature importance was computed for [29] to identify the most influential predictors for each target variable across regions. This analysis enhances the interpretability of machine learning models by revealing which features have the strongest impact on predictions.
Tree-based ensemble models, Random Forest, Gradient Boosting, XGBoost, and LightGBM, were used to estimate feature importance based on each feature’s contribution to improving decision splits. Features that lead to larger reductions in model error are considered more important. Because these models can capture complex, non-linear relationships, their feature importance scores are particularly useful for structured tabular data.
Lasso Regression was also applied to assess linear relationships. Feature importance in this model is inferred from the magnitude of the coefficients, where larger coefficients indicate stronger influence. Lasso additionally performs feature selection by shrinking less relevant coefficients to zero, which is advantageous in high-dimensional settings. By ranking features according to their contribution, the analysis identifies the key drivers of each target variable and region.
2.8. Heatmap Generation and Interpretation of Feature Importance
The heatmaps used in this study present feature ranking across multiple Australian regions, offering a comparative view of how different environmental variables contribute to wildfire prediction in each location. This was used to make the findings clear and easy to read. The y-axis lists the input features used in the models (e.g., temperature, precipitation, humidity), while the x-axis represents the regions, or fire characteristics in the case of Australia overall. Each cell contains a numerical rank from 1 to 10, with 1 indicating the highest importance of the feature for that region. Lower-ranked numbers denote features that contribute more significantly to the model’s variance explanation in that specific regional context.
The colors in the heatmap correspond to the ranking values, with cooler shades (blues) representing higher importance (ranks closer to 1), and warmer shades (reds) indicating lower importance (ranks closer to 10). This color gradient provides a visual cue to help readers quickly identify the most and least important features across regions. Together, the numeric rankings and color coding allow for cross-regional comparisons and enhance the interpretability of the model drivers within the diverse environmental contexts of Australia.
3. Results
In the following sections, the top factors affecting the best-performing models’ predictions are shown and discussed, for the three predictors: FA, FBT, and FRP.
3.1. Model Performance
Table 2 summarizes the model calibration (RMSEC), cross-validation (RMSECV), and external prediction (RMSEP) errors across all regions and target variables (FA, FBT, FRP). Across all targets, the RMSEC values are consistently lower than RMSECV and RMSEP, indicating that models fit the training data well while maintaining reasonable generalization. The small differences between RMSEC and RMSECV for most regions suggest that the models are not overfitted and exhibit stable internal performance. RMSEP, reflecting independent test set performance, shows slightly higher errors, as expected, yet remains within acceptable bounds for predictive reliability. For FA, regional variability is evident. TA achieved the lowest RMSEP (0.0044) using LightGBM, demonstrating strong predictive accuracy and model stability across calibration and validation (RMSEC = 0.00197, RMSECV = 0.00375). In contrast, WA exhibited a higher RMSEP (0.0435) with the Lasso model, indicating greater difficulty in generalizing predictions in this region, likely due to environmental heterogeneity or data sparsity. For FBT, models showed consistent performance across regions, with RMSEC, RMSECV, and RMSEP values remaining within similar magnitudes. Lasso performed robustly in most regions (NSW, NT, QL, WA), with minimal divergence between calibration and prediction errors (NSW RMSEC = 0.0781 vs. RMSEP = 0.0742). However, ensemble methods such as LightGBM and Random Forest yielded higher cross-validation errors in SA and TA (RMSECV ≈ 0.10), suggesting potential model instability for those regional data distributions. For FRP, Lasso Regression generally outperformed other models, producing balanced and low RMSEC–RMSEP differences. QL achieved the best overall performance (RMSEC = 0.0158, RMSEP = 0.0151), confirming the model’s capacity to generalize well. The SA region showed a higher RMSEP (0.0396) with Random Forest, reflecting modest overfitting between calibration and prediction phases.
Table 2.
Model performance across regions for fire-related targets.
3.2. Key Predictors of Estimated Fire Area Across Australian Regions
The feature ranking map for Estimated Fire Area (Figure 3) reveals that mean soil water content and mean solar radiation consistently dominated across most regions. In NSW, NT, and WA, mean soil water content ranked first, underscoring the critical role of surface moisture deficits in determining potential burn area. Mean solar radiation and maximum solar radiation followed closely, particularly in QL and SA, suggesting that energy input and surface heating are pivotal in fire spread and intensity.
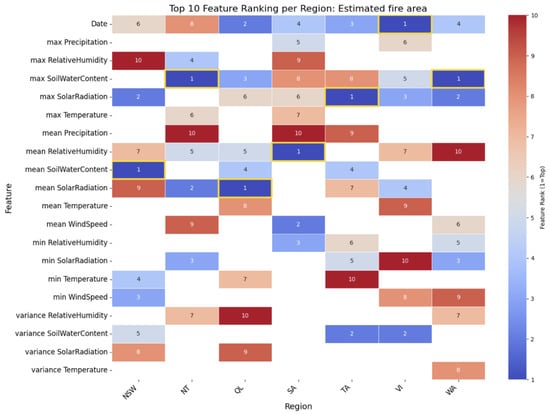
Figure 3.
Top 10 features for each region’s best model in predicting FA, with 1 = Most Important to 10 = Least Important, and the yellow outline highlighting the top feature for that region.
In cooler regions such as TA and VI, minimum solar radiation and temperature-related features (mean and minimum) appeared among the top ranks. This pattern indicates that in temperate climates, subtle variations in radiation and temperature can critically modulate fire area, likely due to the narrow range between ignition and suppression conditions. Variability-based features such as variance of soil water content and variance of solar radiation also emerged as key in some states, pointing to the influence of intra-seasonal fluctuations on fire dynamics. Overall, FA prediction is primarily driven by soil moisture availability and solar radiation, with temperature and humidity exerting secondary, regionally dependent effects.
3.3. Key Predictors of Mean Estimated Fire Brightness Across Australian Regions
For mean estimated fire brightness (Figure 4), the ranking maps emphasize the dominant influence of solar radiation across all regions. Mean solar radiation ranked first in NSW, NT, QL, SA, and VI, indicating that radiative energy directly modulates the thermal intensity of fires, as observed in brightness temperature. This is physically consistent, as solar flux affects both pre-fire drying conditions and active fire energy output. Mean soil water content and mean temperature were also highly influential, particularly in NT, QL, and TA. Regions with higher mean soil water content tended to exhibit lower brightness, reflecting dampening effects on combustion energy. Meanwhile, temperature-related metrics (mean and maximum) ranked highly in Tasmania and Western Australia, showing that localized heating strongly amplifies brightness signatures in those ecosystems.
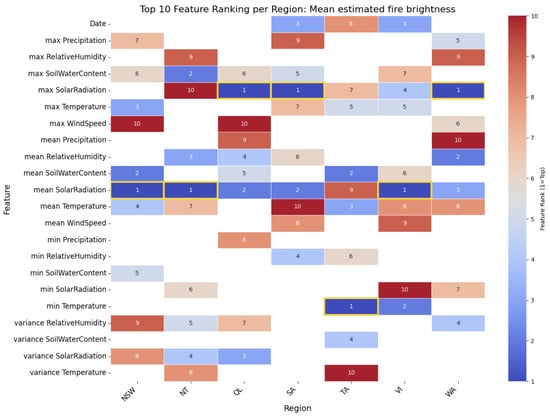
Figure 4.
Top 10 Features for each region’s best model in predicting FBT, with 1 = Most Important to 10 = Least Important, and the yellow outline highlighting the top feature for that region.
A distinguishing feature of the FBT ranking is the appearance of variance terms, notably variance in relative humidity and variance in solar radiation, as influential in NT and QL. This suggests that FBT is sensitive to short-term atmospheric variability and fluctuations in surface radiation, which can modulate the observed fire temperature on sub-daily scales. Overall, FBT is controlled by the combined influence of radiative energy input and short-term meteorological variability, reflecting its sensitivity to the physical energy balance at the fire front.
3.4. Key Predictors of Mean Estimated Fire Radiative Power Across Australian Regions
Figure 5 depicts the top 10 feature rankings for mean estimated FRP across regions. The color intensity represents the feature rank, with darker blue denoting higher importance (rank = 1). Across all regions, soil moisture, solar radiation, and relative humidity emerged as the most influential predictors, though their relative significance varied geographically.
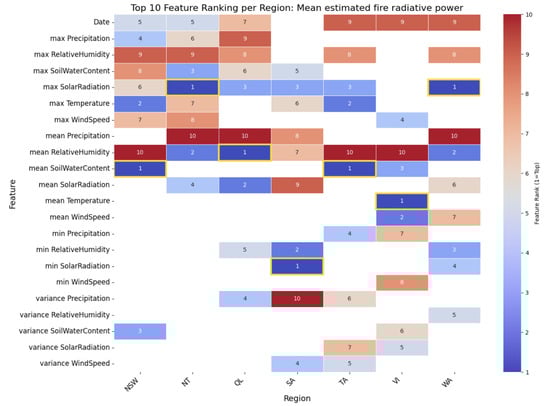
Figure 5.
Top 10 features for each region’s best model in predicting FRP, with 1 = Most Important to 10 = Least Important, and the yellow outline highlighting the top feature for that region.
In NSW, mean soil water content ranked first, highlighting the strong control of surface moisture deficits on fire intensity. Maximum temperature and maximum wind speed followed closely, aligning with known meteorological precursors of fire escalation. NT displayed a mixed influence, with mean relative humidity (rank = 2) and maximum soil water content (rank = 3) indicating the interplay between moisture retention and atmospheric dryness.
For QL, mean relative humidity and mean soil water content dominated the top ranks, reaffirming the sensitivity of subtropical regions to hydrometeorological variability. SA and VI showed distinct patterns, where minimum solar radiation and mean solar radiation held top ranks, suggesting that energy input modulates fire potential even in temperate climates. In TA, mean temperature and variance in soil water content were key drivers, reflecting how small changes in soil and air thermal conditions strongly influence combustion dynamics in cooler ecosystems.
Interestingly, WA exhibited a more distributed ranking, with mean relative humidity, maximum solar radiation, and mean solar radiation alternating in importance. This reflects the state’s highly variable climate, from arid inland zones to humid coastal regions, which creates multiple environmental pathways leading to fire radiative variations.
Overall, the cross-regional ranking pattern suggests that soil moisture and radiative variables consistently underpin fire energy release potential, while temperature and humidity act as modulators that determine short-term ignition and spread. The interplay of these predictors supports the broader finding that FRP is governed by both cumulative environmental stress (soil and radiation) and transient weather extremes (temperature and wind).
3.5. Key Predictors and Results of Feature Importance of ML Algorithms
The analysis across Australia revealed that wildfire behavior FA, FBT, and FRP is primarily driven by climatic variability and environmental extremes rather than mean meteorological conditions. Variance-based and extreme-value predictors (variance in temperature, humidity, and solar radiation; minimum temperature; minimum solar radiation) consistently showed stronger influence across all models and regions than static averages.
At the national scale, Lasso Regression identified key variables that reflect the complex interactions between energy balance, atmospheric variability, and fuel moisture. For FA, minimum solar radiation, temperature variance, and mean soil water content were the strongest predictors, emphasizing the combined influence of radiation flux and soil dryness on fire spread. FBT was mainly shaped by humidity variance, precipitation, and minimum temperature, indicating the sensitivity of fire intensity to dynamic atmospheric moisture conditions. FRP was dominated by humidity variance, solar radiation minima, and soil water extremes, suggesting that energy release rates are governed by fluctuations in moisture and radiation intensity.
Regional analysis highlighted pronounced geographic differentiation in the dominant drivers of wildfire behavior. In NSW and WA, linear models (Lasso) performed best, with soil water content, temperature variability, and radiation measures emerging as leading factors, reflecting arid to temperate climatic gradients. In contrast, non-linear models such as LightGBM (NT) and KNN (SA, TA, VI) captured local complexities in tropical and southern temperate zones, indicating that fire–climate relationships vary in linearity and feature interaction strength across the continent.
For FA, regional predictors commonly included soil moisture dynamics and atmospheric variability (variance in wind speed and humidity), particularly in NSW and NT. FBT predictors varied more widely: solar radiation, temperature extremes, and humidity variance dominated most regions, while tropical NT required non-linear models to capture radiation–moisture–wind interactions. FRP patterns further reinforced these findings, as precipitation extremes, soil water variability, and solar radiation variance were consistent determinants of fire energy release across multiple states.
Overall, the results reveal three central insights:
- Environmental variability and extremes (rather than mean conditions) are the most influential determinants of wildfire dynamics in Australia.
- Regional climatic regimes dictate which features dominate, reflecting how tropical, temperate, and arid systems respond differently to atmospheric and hydrological variability.
- Model heterogeneity, with both linear and non-linear models performing best in different regions, underscores the importance of region-specific approaches for accurately predicting fire behavior across Australia.
4. Discussion
Predictive modeling indicates that precipitation, soil water content, solar radiation, temperature variance, wind speed, and relative humidity are central drivers, and interventions must directly address these. Across all three targets, the results converge on the dominance of radiative and moisture-related variables, with variability and extremes proving more influential than average climatic conditions.
When contrasted with the SHAP-based interpretation, the feature importance results derived from the ensemble and Lasso models in [29] exhibit strong consistency in identifying the key environmental determinants of wildfire activity, yet reveal important differences in how these determinants operate. The earlier analysis quantified global rankings of influence, emphasizing radiative and hydrometeorological variability, particularly solar radiation, temperature variance, and relative humidity, as the dominant drivers of fire occurrence and intensity. However, the SHAP framework provided a more granular, instance-level perspective, uncovering the direction and conditional nature of each variable’s contribution. For instance, SHAP values showed that soil water content and precipitation exert bidirectional effects: while high values generally suppress fire potential, deficits in these variables can amplify ignition likelihood and fire spread, especially under elevated radiative load. Similarly, SHAP dependence plots indicated non-linear threshold behavior for temperature variance and relative humidity, where moderate fluctuations had limited influence but extreme deviations markedly increased predicted fire activity.
Furthermore, SHAP clustering revealed compound interactions—most notably between solar radiation and soil moisture—that underscore the significance of concurrent dry and high-radiation conditions. Such synergies, though implicit in the ensemble feature weights of [29], become explicitly quantifiable through SHAP’s additive attributions. Taken together, these findings confirm the robustness of the core predictors identified in the feature importance analysis while expanding interpretability toward mechanistic understanding. SHAP thus complements the earlier results by linking statistical influence to physical processes, enabling transparent, region-specific calibration and offering a diagnostic framework for improving predictive reliability under shifting climatic conditions.
These regional discrepancies underscore that fire behavior is governed by distinct process hierarchies: moisture and radiative flux in arid and temperate zones versus wind and convective interactions in tropical or maritime climates. The contrast between Lasso’s dominance in drier, more thermodynamically stable regions and the superior performance of ensemble models (Gradient Boosting, LightGBM, Random Forest, XGBoost) in more variable climates reveals an emergent spatial divide in model suitability across Australia. Regionally, for NSW, FBT was driven by mean temperature and precipitation extremes, QL by precipitation variability, SA by wind and humidity fluctuations, TA by relative humidity interactions, VI by humidity and wind variance, and WA by temperature extremes and solar variability. This heterogeneity underscores that no single model or variable set can fully capture national-scale fire dynamics; localized calibration and hybrid ensemble systems are essential for operational forecasting.
When considered together, the patterns across FA, FBT, and FRP reinforce a clear mechanistic hierarchy: (1) cumulative environmental stressors such as soil water depletion and solar loading set the baseline for fire potential; (2) transient meteorological fluctuations in humidity, temperature, and wind determine ignition likelihood and energy output; and (3) interaction between variability and extremes amplifies non-linear feedbacks governing fire spread and radiative intensity. These relationships explain both the superior performance of ensemble learning in regions with complex interactions and the interpretive clarity of Lasso models in more thermodynamically stable environments.
Climate change is intensifying wildfire risk across Australia by reducing soil moisture through declining precipitation and higher evaporation, increasing fuel dryness and ignition potential [4]. Erratic rainfall patterns complicate fuel management [34], while rising solar radiation and temperature extremes further elevate fire danger. Shifts toward more extreme wind events and declining relative humidity amplify fire spread and sustain ignition, particularly in northern and western regions. Collectively, these shifts imply that the dominant predictors identified in this study, solar radiation, soil moisture, and atmospheric variability, are themselves undergoing intensification, magnifying future wildfire potential. These trends highlight the need for adaptive strategies that are regionally customized, dynamically updated, and responsive to increasing variability and extremes.
Taken together, these findings emphasize two key points: mitigation must be regionally customized to reflect distinct climatic drivers, and adaptation must account for the increasing dominance of variability and extremes under climate change. Future wildfire management should therefore embrace an integrated modeling framework, combining interpretable linear methods for policy transparency with non-linear ensembles for high-dimensional forecasting. Mitigation strategies for wildfire risk in Australia must be tailored to the environmental features most strongly influencing fire behavior, with a summary of recommendations provided in Table 3. Region-specific measures are equally important: WA prioritizes wind-resistant infrastructure and rapid evacuation systems; QL focuses on vegetation management and water conservation; VI and TA emphasize defensible zones and resilient building standards; while NSW and SA strengthen fire trail networks and critical infrastructure protection. These findings reinforce that effective mitigation requires not only physical infrastructure but also the integration of predictive environmental intelligence, enabling regionally adaptive responses grounded in data-driven fire behavior modeling. Equally important are the practical implications of integrating explainable AI into wildfire management decision-making, particularly for enhancing policy support, optimizing operational resource allocation, and ensuring that model insights translate into actionable, transparent interventions. Biodiversity-sensitive fuel reduction, ecological restoration, and selective prescribed burning remain core practices, ensuring that mitigation balances risk reduction with ecosystem health.
Table 3.
Summary of wildfire mitigation strategies in Australia.
Sparse, interpretable models like Lasso highlight the primacy of extremes and variability, while the success of non-linear models in tropical and maritime regions shows the complexity of fire–climate interactions. An adaptive, model-agnostic approach, where machine learning outputs directly inform local interventions, will be critical for maintaining predictive reliability under evolving climate baselines. Future wildfire risk management in Australia will therefore depend on integrating region-specific predictive models with flexible, climate-informed mitigation strategies capable of addressing both current conditions and rapidly evolving future risks.
Future research should focus on advancing predictive capacity by integrating generative AI models such as GANs and transformers, which can capture complex spatiotemporal fire dynamics and improve real-time forecasting. Expanding the use of plant functional traits and vegetation dryness metrics will enhance ecological relevance and help identify tipping points of fire susceptibility [41]. Improved data fusion techniques that combine ground sensors, satellite imagery, and weather forecasts are essential to address current input limitations, while standardized evaluation protocols and open fire data repositories will strengthen model reliability and comparability [28].
5. Conclusions
This study demonstrates that machine learning can effectively identify and interpret the climatic and environmental drivers of wildfire behavior across Australia. Environmental variability and extremes, with soil moisture, solar radiation, temperature, and humidity emerging as consistent predictors across FA, FBT, and FRP These findings highlight that wildfire risk is increasingly governed by climatic variability and extremes rather than mean conditions, an important consideration under accelerating climate change. Beyond technical accuracy, the study emphasizes the value of explainable AI in wildfire management. Interpretable models, and the use of SHAP, can enhance policy transparency, guide targeted mitigation, and bridge the gap between predictive insights and operational decision-making. However, effective implementation depends on sustained collaboration between data scientists, ecologists, and emergency management agencies.
Author Contributions
Conceptualization, Z.A. and A.E.; methodology, Z.A. and A.E.; software, Z.A.; validation, Z.A. and A.E.; formal analysis, Z.A. and A.E.; investigation, Z.A. and A.E.; resources, A.E. and M.E.B.; data curation, Z.A., O.A.-K. and M.E.B.; writing—original draft, Z.A.; writing—review and editing, Z.A. and A.E.; visualization, Z.A. and A.E.; supervision, A.E. and M.E.B.; project administration, A.E. and M.E.B.; funding acquisition, A.E., O.A.-K. and M.E.B. All authors have read and agreed to the published version of the manuscript.
Funding
Funding was provided by the University of Wollongong in Dubai. Grant ID: URC25016.
Institutional Review Board Statement
Not applicable.
Informed Consent Statement
Not applicable.
Data Availability Statement
The data in this study was obtained from IBM by permission/license. Data will be shared upon reasonable request to the corresponding author with permission from IBM.
Acknowledgments
We sincerely thank the International Business Machines Corporation (IBM) for their invaluable role in acquiring, processing, and supplying the datasets that made this study possible. The detailed data sources are listed in Table 1 and cited within the main text. IBM’s support was integral to our analysis and significantly advanced our ability to analyze the top factors affecting ML models in predicting wildfire characteristics. We also extend our sincere gratitude to the editor and reviewers for their valuable comments and constructive feedback, which greatly helped improve the quality of this work.
Conflicts of Interest
The authors declare no conflicts of interest.
Abbreviations
The following abbreviations are used in this manuscript:
| Abbreviation | Full Form |
| CNN | Convolutional Neural Network |
| ECMWF | European Centre for Medium-Range Weather Forecasts |
| EFFIS | European Forest Fire Information System |
| ERA5 | ECMWF Reanalysis v5 |
| FA | Fire Area |
| FBT | Fire Brightness Temperature |
| FRP | Fire Radiative Power |
| K | Kelvin (temperature unit) |
| KNN | K-Nearest Neighbor |
| km2 | Square Kilometers |
| LightGBM | Light Gradient Boosting Machine |
| LSTM | Long Short-Term Memory |
| ML | Machine Learning |
| MODIS | Moderate Resolution Imaging Spectroradiometer |
| MW | Megawatts |
| NSW | New South Wales and Australian Capital Territory |
| NT | Northern Territory |
| NWCG | National Wildfire Coordinating Group |
| QL | Queensland |
| R2 | Coefficient of Determination |
| RF | Random Forest |
| RMSE | Root Mean Squared Error |
| SA | South Australia |
| SVM | Support Vector Machine |
| TA | Tasmania |
| VI | Victoria |
| VIIRS | Visible Infrared Imaging Radiometer Suite |
| WA | Western Australia |
| XGBoost | Extreme Gradient Boosting |
References
- Zacharakis, I.; Tsihrintzis, V.A. Integrated Wildfire Danger Models and Factors: A Review. Sci. Total Environ. 2023, 899, 165704. [Google Scholar] [CrossRef] [PubMed]
- Bergado, J.R.; Persello, C.; Reinke, K.; Stein, A. Predicting Wildfire Burns from Big Geodata Using Deep Learning. Saf. Sci. 2021, 140, 105276. [Google Scholar] [CrossRef]
- Lecina-Diaz, J.; Alvarez, A.; Retana, J. Extreme Fire Severity Patterns in Topographic, Convective and Wind-Driven Historical Wildfires of Mediterranean Pine Forests. PLoS ONE 2014, 9, e85127. [Google Scholar] [CrossRef]
- Pickering, B.J.; Kultaev, D.; Holyl, B.; Ababei, D.; Penman, T.D. The Changing Risk of Fire to Human and Environmental Assets under Climate Induced Altered Fire Regimes in South-East Australia. Int. J. Disaster Risk Reduct. 2025, 127, 105668. [Google Scholar] [CrossRef]
- Abatzoglou, J.T.; Kolden, C.A. Relationships between Climate and Macroscale Area Burned in the Western United States. Int. J. Wildland Fire 2013, 22, 1003. [Google Scholar] [CrossRef]
- Richardson, D.; Pitman, A.; Ridder, N. Climate Controls on Compound Solar and Wind Droughts in Australia. Preprint 2023. [Google Scholar] [CrossRef]
- Prasad, V.K.; Badarinath, K.V.S.; Eaturu, A. Biophysical and Anthropogenic Controls of Forest Fires in the Deccan Plateau, India. J. Environ. Manag. 2008, 86, 1–13. [Google Scholar] [CrossRef]
- Jain, P.; Coogan, S.C.; Subramanian, S.G.; Crowley, M.; Taylor, S.; Flannigan, M.D. A Review of Machine Learning Applications in Wildfire Science and Management. Environ. Rev. 2020, 28, 478–505. [Google Scholar] [CrossRef]
- Miao, X.; Li, J.; Mu, Y.; He, C.; Ma, Y.; Chen, J.; Wei, W.; Gao, D. Time Series Forest Fire Prediction Based on Improved Transformer. Forests 2023, 14, 1596. [Google Scholar] [CrossRef]
- Xu, R.; Yu, P.; Luo, J.; Zhang, H.; Xiao, C.; Niu, T.; Li, X. Climate Change, Environmental Extremes, and Human Health in Australia: Challenges, Adaptation Strategies, and Policy Gaps. Lancet Reg. Health West. Pac. 2023, 40, 100936. [Google Scholar] [CrossRef] [PubMed]
- Singh, H.; Srivastava, S.K. From Firestick to Satellites: Technological Advancement and Indigenous Cultural Practice in Managing Forest Fires in Australia. Hist. Environ. Policy Pract. 2024, 16, 143–166. [Google Scholar] [CrossRef]
- Abram, N.J.; Henley, B.J.; Gupta, A.S.; Lippmann, T.J.; Clarke, H.; Dowdy, A.J.; Sharples, J.J.; Nolan, R.H.; Zhang, T.; Wooster, M.J.; et al. Connections of Climate Change and Variability to Large and Extreme Forest Fires in Southeast Australia. Nat. Commun. 2021, 12, 8. [Google Scholar] [CrossRef]
- Sengupta, A.; Woodford, B.J. Recent advances in explainable machine learning models for wildfire prediction. Appl. Comput. Geosci. 2025, 27, 100266. [Google Scholar] [CrossRef]
- Li, H.; Vulova, S.; Rocha, A.D.; Kleinschmit, B. Exploring the monthly contribution of drivers on European summer wildfires with Explainable Artificial Intelligence (XAI). Ecol. Indic. 2025, 176, 113605. [Google Scholar] [CrossRef]
- Abdollahi, A.; Pradhan, B. Explainable artificial intelligence (XAI) for interpreting the contributing factors feed into the wildfire susceptibility prediction model. Sci. Total Environ. 2023, 879, 163004. [Google Scholar] [CrossRef]
- Liao, B.; Zhou, T.; Liu, Y.; Li, M.; Zhang, T. Tackling the wildfire prediction challenge: An explainable artificial intelligence (XAI) model combining extreme gradient boosting (XGBoost) with Shapley additive explanations (SHAP) for enhanced interpretability and accuracy. Forests 2025, 16, 689. [Google Scholar] [CrossRef]
- Iban, M.C.; Aksu, O. Shap-driven explainable artificial intelligence framework for wildfire susceptibility mapping using MODIS active fire pixels: An in-depth interpretation of contributing factors in Izmir, Türkiye. Remote Sens. 2024, 16, 2842. [Google Scholar] [CrossRef]
- Zou, L.; Shao, H.; Liu, Y.; Ren, C.; Chen, Q.; Bai, H.; Huang, Z.; Gu, Y. A study on the susceptibility of wildfire disasters in Wuzhou City based on interpretability model. IEEE Access 2025, 13, 115860–115880. [Google Scholar] [CrossRef]
- Chafer, C.J.; Santín, C.; Doerr, S.H. Modelling and Quantifying the Spatial Distribution of Post-Wildfire Ash Loads. Int. J. Wildland Fire 2016, 25, 249. [Google Scholar] [CrossRef]
- Vitolo, C.; Di Giuseppe, F.; Barnard, C.; Coughlan, R.; San-Miguel-Ayanz, J.; Libertá, G.; Krzeminski, B. ERA5-Based Global Meteorological Wildfire Danger Maps. Sci. Data 2020, 7, 216. [Google Scholar] [CrossRef] [PubMed]
- Chuvieco, E.; Riaño, D.; Aguado, I.; Cocero, D. Estimation of Fuel Moisture Content from Multitemporal Analysis of Landsat Thematic Mapper Reflectance Data: Applications in Fire Danger Assessment. Int. J. Remote Sens. 2002, 23, 2145–2162. [Google Scholar] [CrossRef]
- Vinodkumar, V.; Dharssi, I.; Yebra, M.; Fox-Hughes, P. Continental-Scale Prediction of Live Fuel Moisture Content Using Soil Moisture Information. Agric. For. Meteorol. 2021, 307, 108503. [Google Scholar] [CrossRef]
- Miao, Y.; Chen, Y.; Tang, F.; Zhang, X.; Hu, L. An Experimental Study on Flame Geometry and Radiation Flux of Line-Source Fire over Inclined Surface. Proc. Combust. Inst. 2023, 39, 3795–3803. [Google Scholar] [CrossRef]
- Taylor, R.; Marshall, A.G.; Crimp, S.; Cary, G.J.; Harris, S. A Statistical Forecasting Model for Extremes of the Fire Behaviour Index in Australia. Atmosphere 2024, 15, 470. [Google Scholar] [CrossRef]
- Van Oldenborgh, G.J.; Krikken, F.; Lewis, S.; Leach, N.J.; Lehner, F.; Saunders, K.R.; Vautard, R.; Otto, F.E. Attribution of the Australian Bushfire Risk to Anthropogenic Climate Change. Nat. Hazards Earth Syst. Sci. 2021, 21, 941–960. [Google Scholar] [CrossRef]
- Rafaqat, W.; Sanchez, P.; Botnen, D.; Fernez-Anez, N. Analysing Historical Events and Current Management Strategies of Wildfires in Norway. Sci. Rep. 2025, 15, 24905. [Google Scholar] [CrossRef] [PubMed]
- Zhang, Q.; Wang, Y.; Xiao, Q.; Geng, G.; Davis, S.J.; Liu, X.; He, K. Long-Range PM2.5 Pollution and Health Impacts from the 2023 Canadian Wildfires. Nature 2025, 645, 672–678. [Google Scholar] [CrossRef]
- Little, K.; Castellanos-Acuna, D.; Kettridge, N.; Flannigan, M.; Jain, P. Extreme Blocking Ridges Are Associated with Vegetation Fire Occurrence in England. Int. J. Wildland Fire 2025, 34, WF25083. [Google Scholar] [CrossRef]
- Abohaia, Z.; Elkhouly, A.; Barachi, M.E.; Al-Khatib, O. Regional Prediction of Fire Characteristics Using Machine Learning in Australia. Fire 2025, 8, 330. [Google Scholar] [CrossRef]
- Cruz, M.G.; Sullivan, A.L.; Gould, J.S.; Sims, N.C.; Bannister, A.J.; Hollis, J.J.; Hurley, R.J. Anatomy of a Catastrophic Wildfire: The Black Saturday Kilmore East Fire in Victoria, Australia. For. Ecol. Manag. 2012, 284, 269–285. [Google Scholar] [CrossRef]
- Lundberg, S.M.; Lee, S.-I. A Unified Approach to Interpreting Model Predictions. In Proceedings of the 31st International Conference on Neural Information Processing Systems (NIPS’17), Long Beach, CA, USA, 4–9 December 2017; Curran Associates Inc.: Red Hook, NY, USA, 2017; pp. 4768–4777. [Google Scholar]
- Hastie, T.; Friedman, J.; Tibshirani, R. The Elements of Statistical Learning: Data Mining, Inference, and Prediction, 2nd ed.; Springer: New York, NY, USA, 2017. [Google Scholar]
- Jain, R.; Xu, W. HDSI: High Dimensional Selection with Interactions Algorithm on Feature Selection and Testing. PLoS ONE 2021, 16, e0246159. [Google Scholar] [CrossRef] [PubMed]
- Climate Council. Climate Change and the South Australia Bushfire Threat. 2014. Available online: https://www.climatecouncil.org.au/uploads/7e9851016b27d77a54e76fcac0c3480c.pdf (accessed on 8 September 2025).
- Minderoo Foundation. Fire and Flood Resilience Blueprint; Minderoo Foundation: Perth, Australia, 2025; Available online: https://cdn.minderoo.org/content/uploads/2021/05/11143758/Fire-and-Flood-Resilience-Program-Proprosal.pdf (accessed on 8 September 2025).
- IBM. The Race to Teach AI to Fight Fires. IBM Newsroom, 2025. Available online: https://www.ibm.com/think/news/race-to-teach-ai-to-fight-fires (accessed on 8 September 2025).
- Clement, S.; Baldwin, C.; Head, L.; Adams, V.M.; Holley, C.; Gill, N. To Burn or Not to Burn: Governance of Wildfires in Australia. Ecol. Soc. 2024, 29, 108. [Google Scholar] [CrossRef] [PubMed]
- NSW Rural Fire Service. Fire Season Outlook Statement 2024–2025; New South Wales Parliament: Sydney, Australia, 2024. Available online: https://www.parliament.nsw.gov.au/tp/files/189431/Fire%20Season%20Statement%202024_FINAL.pdf (accessed on 8 September 2025).
- ACT Government. Bushfire Smoke and Air Quality Strategy 2021–2025; ACT Government: Canberra, Australia, 2021. Available online: https://www.act.gov.au/__data/assets/pdf_file/0005/2385608/Bushfire-smoke-and-air-quality-strategy-2021-2025.pdf (accessed on 8 September 2025).
- Di Virgilio, G.; Evans, J.P.; Clarke, H.; Sharples, J.; Hirsch, A.L.; Kim, J.; Marshall, A.G.; Armston, J. Climate Change Significantly Alters Future Wildfire Mitigation Opportunities in Southeastern Australia. Geophys. Res. Lett. 2020, 47, e2020GL088893. [Google Scholar] [CrossRef]
- Plumanns-Pouton, E.; Moiseev, D.; Lehmann, C.E.R.; Lamont, B.B.; Zylstra, P.; Prior, L.D. Using Plant Functional Types to Predict the Influence of Fire on Species Relative Abundance. Biol. Conserv. 2024, 292, 110555. [Google Scholar] [CrossRef]


Disclaimer/Publisher’s Note: The statements, opinions and data contained in all publications are solely those of the individual author(s) and contributor(s) and not of MDPI and/or the editor(s). MDPI and/or the editor(s) disclaim responsibility for any injury to people or property resulting from any ideas, methods, instructions or products referred to in the content. |
© 2025 by the authors. Licensee MDPI, Basel, Switzerland. This article is an open access article distributed under the terms and conditions of the Creative Commons Attribution (CC BY) license (https://creativecommons.org/licenses/by/4.0/).