Article

Scenario-Based Wildfire Boundary-Threat Indexing at the Wildland–Urban Interface Using Dynamic Fire Simulations

by
Yeshvant Matey
1,*,
Raymond de Callafon
1,* and
Ilkay Altintas
2
1
Mechanical and Aerospace Engineering Department, University of California San Diego, 9500 Gilman Dr, La Jolla, CA 92092, USA
2
San Diego Super Computer Center, La Jolla, CA 92092, USA
*
Authors to whom correspondence should be addressed.
Fire 2025, 8(10), 377; https://doi.org/10.3390/fire8100377
Submission received: 21 August 2025 / Revised: 17 September 2025 / Accepted: 18 September 2025 / Published: 23 September 2025

Abstract

Conventional wildfire assessment products emphasize regional-scale ignition likelihood and potential spread derived from fuels and weather. While useful for broad planning, they do not directly support boundary-aware, scenario-specific decision-making for localized threats to communities in the Wildland–Urban Interface (WUI). This limitation constrains the ability of fire managers to effectively prioritize mitigation efforts and response strategies for ignition events that may lead to severe local impacts. This paper introduces WUI-BTI—a scenario-based, simulation-driven boundary-threat index for the Wildland–Urban Interface that quantifies consequences conditional on an ignition under standardized meteorology, rather than estimating risk. WUI-BTI evaluates ignition locations—referred to as Fire Amplification Sites (FAS)—based on their potential to compromise the defined boundary of a community. For each ignition location, a high-resolution fire spread simulation is conducted. The resulting fire perimeter dynamics are analyzed to extract three key metrics: (1) the minimum distance of fire approach to the community boundary ( D min ) for non-breaching fires; and for breaching fires, (2) the time required for the fire to reach the boundary ( T p ), and (3) the total length of the community boundary affected by the fire ( L c ). These raw outputs are mapped through monotone, sigmoid-based transformations to yield a single, interpretable score: breaching fires are scored by the product of an inverse-time urgency term and an extent term, whereas non-breaching fires are scored by proximity alone. The result is a continuous boundary-threat surface that ranks ignition sites by their potential to rapidly and substantially compromise a community boundary. By converting complex simulation outputs into scenario-specific, boundary-aware intelligence, WUI-BTI provides a transparent, quantitative basis for prioritizing fuel treatments, pre-positioning suppression resources, and guiding protective strategies in the WUI for fire managers, land use planners, and emergency response agencies. The framework complements regional hazard layers (e.g., severity classifications) by resolving fine-scale, consequence-focused priorities for specific communities.

1. Introduction

Escalating wildfire activity across fire-prone regions globally has heightened the demand for robust, science-based assessment frameworks that protect vulnerable communities [1]. Recent catastrophic wildfire events, including the 2018 Camp Fire, 2020 Oregon fires, 2021 Marshall Fire, and the 2025 Los Angeles fires, have underscored the need for pre-ignition, community-specific threat characterization and proactive fuel management to reduce the likelihood of structural loss and fatalities within the first hours of fire ignition [2]. As development within the Wildland-Urban Interface (WUI) continues to expand into high-risk landscapes, the necessity for technically rigorous and operationally actionable assessment tools has become increasingly critical [3].
Despite widespread recognition of this, a persistent disconnect remains between advancements in computational fire modeling and the operational requirements of at-risk communities. This gap continues to impede the implementation of evidence-based fire management strategies [4,5]. Traditional methodologies have largely focused on estimating ignition probability using statistical models that incorporate meteorological data, fuel load characteristics, and historical fire occurrence patterns [6,7]. These models are often supported by fire behavior simulation tools such as BEHAVE, FARSITE, and coupled atmosphere-fire systems like WRF-FIRE [7]. However, these approaches fall short in addressing a question of paramount operational importance: “Under fire-conducive meteorology, which specific locations on the landscape most immediately threaten a defined community boundary upon ignition or fire arrival?” The absence of such spatially explicit, boundary-aware threat characterization impedes strategic fuel treatment prioritization and constrains the targeted deployment of suppression resources, thereby limiting the ability of fire managers and emergency planners to implement informed, location-specific interventions [8].
This analytical gap is reflected in two fundamental limitations. First, broad-scale probability and behavior products lack the spatial resolution to identify discrete ignition sites—or arrival corridors from adjacent areas—that would produce the most severe consequences for a given community [9]. Second, existing methods rarely quantify the spatiotemporal relationships between an ignition location and its potential impact on community assets: the rate of approach to the boundary, the likelihood of breach, and the extent of boundary affected [7]. From an operational perspective, not all burning locations present equal consequence [10,11]: threat is a function of proximity to vulnerable infrastructure, expected approach under specified environmental conditions, and the potential to compromise the boundary [12,13].
To address these limitations, this paper introduces WUI-BTI (Scenario-Based Wildfire Boundary-Threat Indexing at the Wildland–Urban Interface) as a boundary-threat (consequence) index conditional on ignition under standardized meteorology. At the core of WUI-BTI is the concept of Fire Amplification Sites (FAS)—discrete ignition locations where the interaction of topography, fuels, and local wind exposure can lead to accelerated growth and concentrated consequences for a specific community. Through exhaustive, location-specific fire-spread simulations across a defined WUI domain [14], WUI-BTI characterizes each ignition site using three operationally relevant metrics: (i) proximity (minimum approach distance for non-breaching fires), and for breaching fires, (ii) urgency (time to boundary contact) and (iii) extent (length of boundary affected). These raw outputs are mapped through monotone sigmoid transformations to a single, interpretable score that ranks ignition locations by boundary threat. The framework is ignition source agnostic and simulator-agnostic; the case study instantiates it with a specific fire-spread model.
Objectives and contributions: This paper (1) formalizes the mathematical framework for boundary-threat characterization; (2) demonstrates its application in a WUI case study; (3) compares the resulting boundary-threat surface with regional hazard classifications (e.g., Fire Hazard Severity Zones) to illustrate complementarity; and (4) provides a transparent workflow suitable for operational adoption.
Scope and terminology: Throughout, WUI-BTI denotes a boundary-threat (consequence) index that quantifies the severity of consequences conditional on an ignition under standardized meteorology. This work does not model ignition probability or asset vulnerability; WUI-BTI therefore complements probability- or loss-based risk layers by resolving scenario-specific, boundary-aware priorities for individual communities.

2. Literature Review

Wildfire assessment at the community edge requires integrating multi-source observations, fuels and topography, and physics-based fire–atmosphere modeling to answer a practical question: “where and how will fires threaten specific community boundaries under defined conditions?” Prior work advances along two complementary lines—data-driven statistical mapping of ignition likelihood and process-based simulation of spread dynamics [15,16]. Yet, despite these advances, most studies stop short of boundary-aware, scenario-specific triage: identifying which ignition locations would most rapidly approach and compromise a given community boundary under fire-conducive meteorology.
Accordingly, this review synthesizes those strands to clarify the remaining analytical gap and set the stage for a boundary-aware, scenario-based indexing approach at ignition-block scale, one that ranks ignition sites by consequence (speed and extent of boundary compromise) under standardized meteorology, rather than by ignition probability.

2.1. The Data-Driven Statistical Paradigm: Mapping Fire Likelihood

The data-driven paradigm comprises statistical, empirical, and machine-learning models that relate historical fire occurrences to predictors in order to map spatial variation in ignition likelihood [6,15,17,18]. Within the broader hazard–exposure–vulnerability framing [19], these approaches chiefly predict the hazard component. Operational fire danger rating systems—CFFDRS [20] and NFDRS [21]—aggregate fuels and meteorology into indices (e.g., FWI [22]) that feed such models. Typical predictor suites include topography, vegetation condition, and human access/activity [23,24,25]. The resulting products assign each cell a relative ignition likelihood [26,27] useful for regional planning [28] and resource allocation [7].
For boundary-focused operations at the community scale, however, these likelihood maps [29] have well-noted limits. Coarse inputs [20,23] and regional calibration can miss localized approach corridors in complex WUI terrain [30,31]. Moreover, they typically do not simulate physical spread or quantify boundary consequence once an ignition occurs—metrics such as time to boundary contact or affected boundary length [12,13]. Thus, they provide valuable context but are not designed for boundary-aware, scenario-specific triage.
A further limitation is non-stationarity: probabilities inferred from historical ignitions may not reflect present or emerging conditions as climate, fuels, land use, and anthropogenic ignitions evolve [23,32]. Such models are informative baselines, but they can be mismatched to current decision needs that hinge on the consequences of an ignition at specific locations under specified meteorology—for example, how quickly a fire would reach a community boundary and over what extent [10,33,34].

2.2. The Process-Based Paradigm: Modeling Fire Behavior

Process-based approaches model fire spread through numerical solutions [35] to combustion [36], heat transfer [37], and atmosphere–fuel interactions [38,39,40]. Using explicit inputs—fuel type, topography, and weather [41], these models estimate core behavior variables such as rate of spread and flame length, supporting scenario-based analyses for tactical planning [42]. Tool development has progressed from perimeter-growth simulators with static winds (e.g., FARSITE) [43] to coupled fire–atmosphere systems that capture wind–terrain interactions (e.g., WRF-FIRE) [44]. Despite these advances, computational demands often limit ensemble size and routine, landscape-wide exploration [35,45].
Across the literature, simulator outputs are frequently used for event reconstruction [7], small sets of representative scenarios [23], or broad behavior mapping [45]. Such usage rarely converts simulated perimeters into boundary-specific, scenario-defined consequence metrics at community scale. Emphasis remains on general spread conditions rather than standardized, boundary-aware summaries tailored to localized triage; this distinction concerns output utilization rather than risk estimation.
A complementary line of work proposes a simple, deterministic, fuel-based exposure method [46]. This approach is weather-agnostic and non-probabilistic, with mapped exposure shown to align with subsequent burned areas across large regions. While effective for broad, low-cost screening, such a univariate exposure rating contrasts with scenario-specific frameworks that translate simulator outputs into boundary-aware consequence summaries at community scale.

2.3. The Analytical Gap: Systematic Assessment

Operational needs reveal a gap that follows directly from the two prior subsections. Data-driven models provide scalable maps of ignition likelihood but largely omit the post-ignition dynamics that govern boundary consequences at community scale [47]. Process-based simulators resolve spread physics, yet computational cost commonly limits the many-scenario exploration needed for landscape-wide screening [23,35]. Fuel-only exposure maps [46] offer scalable regional screening, but by construction, they do not resolve post-ignition, boundary-specific consequences under standardized severe-weather conditions.
Consequently, a practical question remains insufficiently addressed: “under fire-conducive meteorology, which specific locations would most rapidly approach and compromise a defined community boundary upon ignition or arrival [7]?” Addressing this requires a shift from correlative likelihood to post-ignition, boundary-aware consequence metrics derived from simulations [19,48].
Recent modeling advances—such as QUIC-Fire [49,50], which captures three-dimensional wind–topography interactions at lower computational expense than traditional coupled systems—begin to narrow feasibility barriers. Even so, routine, standardized orchestration of hundreds to thousands of location-specific simulations remains uncommon, particularly for boundary-focused triage in WUI settings where urgency and spatial extent of approach matter more than ignition likelihood [51]. Existing consequence-oriented studies often emphasize a small number of “worst-case” scenarios, limiting their value for systematic prioritization across all plausible ignition sites [51,52,53].
In sum, the underdeveloped element is a scalable, simulation-driven screening framework that (i) exhaustively evaluates plausible ignition locations, (ii) summarizes outputs with consistent, boundary-specific consequence metrics, and (iii) operates efficiently enough for landscape-scale enumeration under standardized meteorology—capabilities not simultaneously realized by likelihood mapping or by traditional simulator deployments as documented in the literature [7,23].

2.4. WUI-BTI: Filling the Analytical Gap

WUI-BTI is designed to close the operational gap by providing a boundary-threat (consequence) index conditional on ignition under standardized meteorology and, from it, a systematic prioritization of ignition locations. Rather than estimating where ignitions are most likely, WUI-BTI ranks where an ignition (or arriving head fire) would most rapidly and extensively threaten a defined community boundary. The emphasis is on consequence and urgency, aligned with tactical decision needs. In this sense, WUI–BTI complements regional, fuel-based exposure screens [46] and hazard maps [54] by resolving, for a specific community and standardized meteorology, which ignition sites are most urgent and consequential for boundary defense.
Methodologically, WUI-BTI is a simulator-agnostic orchestration layer that runs many location-specific fire-spread simulations and distills their outputs into a single, interpretable score for each candidate ignition block. The framework is modular with respect to the underlying fire model: in this paper, we instantiate it with QUIC-Fire as a concrete example, but the same workflow supports alternative simulators as operational needs and compute budgets dictate. This approach balances sufficient physical realism with tractability, enabling hundreds to thousands of scenario runs over complex WUI landscapes.
At the core of WUI-BTI is the identification of Fire Amplification Sites (FAS)—discrete locations where the interaction of fuels, topography, and wind exposure concentrates boundary consequences. For each candidate site, WUI-BTI extracts three operational metrics from simulated perimeter dynamics: (i) proximity (minimum approach distance, ( D min ) for non-breach cases); and, for breach cases, (ii) urgency (time to boundary contact, ( T p )) and (iii) extent (length of boundary affected, ( L c )). Monotone, sigmoid-based transformations map these raw outputs to a single boundary-threat score, producing a continuous surface that ranks ignition sites by their consequence for the community.
For practitioners, the resulting surface provides actionable intelligence: it highlights ignition blocks whose rapid approach and large potential impact warrant fuel treatment priority, pre-positioning of suppression resources, and refinement of trigger points for evacuation planning. WUI-BTI thus complements regional hazard classifications by resolving scenario-specific, boundary-aware priorities at the community scale. The next section formalizes the mathematical construction of the index and details its application in a WUI case study.

3. Methodology

The WUI-BTI framework is built upon a formal mathematical structure that transforms raw fire simulation data into a standardized impact index for tactical decision-making. The formulation is simulator-agnostic: it can be applied to outputs from any fire-spread engine without altering the underlying physics. Its credibility, however, is inherently conditional on the quality of the simulator used. The validity of WUI-BTI results depends on the empirical grounding and real-world validation of the chosen fire model, since the framework organizes and ranks simulator outputs but does not itself resolve fire behavior. This section details the wildland–urban interface domain definition, the systematic FAS block simulation process, and the core scoring methodology that quantifies boundary threat potential under critical fire weather conditions.

3.1. Domain Definitions

3.1.1. Simulation Domain and Environmental Parameters

The simulation domain of a fire simulation tool such as QUIC-FIRE is defined as a two-dimensional grid G of size N 1 × N 2 , where each cell represents a unique spatial unit indexed by the integer pair ( i ,   j ) , such that
G = { ( i ,   j ) i { 1 ,   2 , , N 1 } ,   j { 1 ,   2 , , N 2 } } .
Simulation time is discretized as t k = k · Δ t , where Δ t represents the fixed time step and k { 0 ,   1 , , τ } denotes the time index. Each cell ( i ,   j ) G is characterized by both static and dynamic environmental parameters that govern fire behavior dynamics.
Static terrain attributes include elevation a ( i ,   j ) , measured in meters above sea level, and slope s ( i ,   j ) , representing the local terrain inclination in degrees. In contrast, vegetation characteristics are modeled as time-varying quantities, with fuel density f k ( i ,   j ) at different heights in kg/m2, fuel depth h k ( i ,   j ) in meters, and fuel moisture content m k ( i ,   j ) as a percentage, all defined at each time step t k .
The spatial dynamics of fire spread are primarily governed by atmospheric conditions. Although wind conditions exhibit temporal and spatial variability, the use of a short simulation time window permits the assumption of uniform wind speed ω s (m/s) and wind direction ω d (degrees from north) across the simulation domain. While these wind parameters remain uniform in space and constant over time, their interaction with the underlying terrain and topography significantly influences fire behavior. This wind-terrain coupling strongly shapes the anisotropic growth of the fire front by biasing spread rates in the direction of prevailing winds.

3.1.2. Urban Influence Zone and Community Boundaries

Urban or built-up areas within the simulation domain G are identified using building footprint data from the Microsoft Open Buildings dataset [55], which provides detailed vector outlines of constructed structures. These vector outlines are rasterized to create a binary occupancy field S b ( i ,   j ) , where S b ( i ,   j ) = 1 indicates that grid cell ( i ,   j ) G contains part of a building, and S b ( i ,   j ) = 0 otherwise.
To group spatially adjacent building cells into coherent structures, a contouring algorithm [56] is applied in combination with a ray-casting technique [57]. This process yields a set of building clusters denoted B ( m ) , where m = 1 , , n b , with each building cluster formally defined as
B ( m ) = { ( i ,   j ) G S b ( i ,   j ) = 1 } .
The geometric centroid ( i m ,   j m ) of each building cluster B ( m ) is computed as the mean coordinate of its constituent cells. To account for the influence of built structures on surrounding areas, a fixed-radius buffer is applied around each building centroid. The Euclidean distance from any cell ( i ,   j ) to building cluster m is computed as
Δ m ( i ,   j ) = ( i ,   j ) ( i m ,   j m ) 2 .
The urban influence zone U G is defined as follows:
U = ( i ,   j ) G | S b ( i ,   j ) = 1 or min 1 m n b Δ m ( i ,   j ) d thresh .
The community boundary U is then defined as the set of grid cells that form the perimeter of this region:
U = ( i ,   j ) U | ( i ,   j ) G U such that ( i i ,   j j ) = 1 ,
where ( i i ,   j j )   = 1 denotes 4-neighborhood adjacency (i.e., cells sharing an edge). This condition ensures that a boundary cell lies within the built-up region and is adjacent to at least one wildland cell. The resulting process generates a closed contour around each connected built-up cluster, representing the spatial boundary of the corresponding community.

3.1.3. Ignition Block Definition

Building upon this urban–wildland classification, ignition blocks I x , y are defined as spatially contiguous, uniformly sized square regions within the simulation domain G that are fully contained within wildland areas, exhibiting no spatial overlap with the built-up region U . These regions are selected to serve as candidate ignition locations for fire spread simulations, ensuring that all scenarios originate in ecologically valid, non-urbanized terrain.
The domain G is systematically partitioned into non-overlapping square subregions of dimension n × n . Each ignition block I x , y G is anchored at grid index ( x ,   y ) and includes all cells within the corresponding n × n neighborhood. A block qualifies as a valid ignition region if and only if it lies entirely within undeveloped land, i.e.,
I x , y G U ,
The collection of all such valid ignition blocks is denoted by
I = I x , y I x , y G U .
This formulation ensures that all simulated ignition scenarios originate in areas isolated from built environments. The resulting set I serves as the spatial foundation for scenario-based fire simulations, enabling systematic analysis of fire propagation toward community boundaries under diverse ignition configurations.

3.1.4. Fire Progression Tracking

The dynamic evolution of fire spread is characterized through systematic tracking of the fire perimeter as it advances across the landscape. At each time step t k = k · Δ t , the fire simulation associated with ignition block I x , y I updates the burnt status of each cell ( i ,   j ) G through the burnt percentage b k ( i ,   j ) , which quantifies the proportion of fuel consumed up to time t k . A cell transitions to active or burnt status when b k ( i ,   j ) > 0 , establishing the foundation for spatial fire spread analysis.
To extract the fire perimeter at a given time step, a contouring algorithm [56] is applied to the binary burnt-cell field. The fire front at time t k , denoted F k ( I x , y ) , is defined as the set of burnt cells that are adjacent to at least one unburnt cell. Formally, the fire front is defined by the logic condition
F k ( I x , y ) = { ( i ,   j ) G | b k ( i ,   j ) > 0 , ( i ,   j ) G : b k ( i ,   j ) = 0 , ( i i ,   j j ) = 1 } ,
where ( i i ,   j j )   = 1 denotes 4-neighborhood adjacency. This formulation ensures that the fire front captures the dynamically evolving boundary between burnt and unburnt regions as the fire propagates outward from the ignition block I x , y over time. Building on these definitions, the WUI-BTI scoring methodology is discussed in the following sections.

3.2. WUI-BTI Fire Impact Metrics

3.2.1. Boundary Breach Detection and Timing ( T p )

A boundary breach event occurs when the advancing fire front, originating from ignition block I x , y I , reaches within a critical distance δ of the community boundary U . Specifically, a breach occurs at time step t k when there exists a fire front cell ( i f ,   j f ) F k ( I x , y ) defined in Section 3.1.4 and a boundary cell ( i b ,   j b ) U such that their Euclidean distance satisfies
( i f i b ) 2 + ( j f j b ) 2 < δ .
where δ is in meters. The breach time T p ( I x , y ) is defined as the earliest time step at which this condition is met
T p ( I x , y ) = min t k | ( i f ,   j f ) F k ( I x , y ) , ( i b ,   j b ) U s . t . ( i f i b ,   j f j b ) 2 < δ
with the convention that T p ( I x , y ) = if no such condition is satisfied during the simulation period. This mathematical framework enables systematic detection of fire encroachment toward built environments and supports quantitative comparison of threat levels across different ignition scenarios. The breach indicator for ignition block I x , y is formally defined as
P ( I x , y ) = 1 if T p ( I x , y ) < 0 if T p ( I x , y ) =
where P ( I x , y ) = 1 is used to indicate a breach event and P ( I x , y ) = 0 to indicate a no breach.

3.2.2. Breach Size ( L c )

For ignition blocks that result in boundary breaches ( P ( I x , y ) = 1 ), the spatial extent of fire-boundary contact is quantified at the final simulation time step t τ . A boundary cell ( i b ,   j b ) U is classified as contacted when there exists a fire front cell ( i f ,   j f ) F τ ( I x , y ) reaches within a critical distance δ in meters, satisfying
( i f i b ) 2 + ( j f j b ) 2 < δ .
The contacted boundary set defined as C U ( I x , y ) U represents all community boundary cells that lie within the critical distance δ of the final fire front F τ ( I x , y ) . The breach size L c ( I x , y ) is then defined as the total number of contacted boundary cells:
L c ( I x , y ) = C U ( I x , y )
These metrics quantify distinct aspects of fire impact severity for breaching scenarios. As shown in the left panel of Figure 1, L c ( I x , y ) represents the spatial extent of the community boundary U that is impacted by the fire, characterizing the potential scale of exposure. The associated temporal metric T p denotes the earliest time at which the fire perimeter intersects the boundary, capturing the urgency with which suppression resources must respond.

3.2.3. Minimum Approach Distance ( D min )

For ignition scenarios where fire does not breach the community boundary ( P ( I x , y ) = 0 ), the minimum approach distance quantifies the closest proximity achieved between the fire front and the built environment. This metric is evaluated at the final simulation time step t τ , using the final fire front F τ ( I x , y ) and the community boundary U .
The minimum approach distance D min ( I x , y ) is defined as the smallest Euclidean distance between any fire front cell ( i f ,   j f ) F τ ( I x , y ) and any boundary cell ( i b ,   j b ) U
D min ( I x , y ) = min ( i f ,   j f ) F τ ( I x , y ) ( i b ,   j b ) U ( i f i b ) 2 + ( j f j b ) 2
This metric provides critical information for assessing near-miss scenarios, enabling quantitative evaluation of fires that approach community boundaries without making direct contact. As illustrated in the right panel of Figure 1, the minimum distance D min captures the closest point of fire perimeter approach relative to the community boundary U when no breach occurs.

3.2.4. Fire Impact WUI-BTI Index

The framework uses a dual-scenario scoring system based on whether a breach occurs. The formulas employ sigmoid functions to map the unbounded physical metrics onto a consistent scale.
If ( P ( I x , y ) = 1 ), the ignition block I x , y results in a fire event that breaches the community boundary U . The boundary-threat score for I x , y is characterized as follows
WUI-BTI ( I x , y ) = 1 + 1 1 + e α 1 ( r · L c ( I x , y ) β 1 ) · 1 + 1 1 + e α 2 ( T p ( I x , y ) β 2 ) + 1
where L c ( I x , y ) is the breach size, as defined in Equation (2), r is the spatial resolution of the simulation grid (in meters), and T p ( I x , y ) is the breach timing, as defined in Equation (1). This expression incorporates location-specific tuning parameters: α 1 governs the steepness of the sigmoid response to breach size, while β 1 defines the breach size (in meters) at which the sigmoid reaches its midpoint. Similarly, α 2 controls the steepness of the inverse sigmoid response to breach timing, and β 2 specifies the breach time (in seconds) at which the temporal urgency component reaches its midpoint. This formulation ensures that fires which breach the community boundary earlier and over a larger spatial extent receive a higher WUI−BTI index value. The additive constant guarantees that all breaching events are indexed above non-breaching ones.
If ( P ( I x , y ) = 0 ), the ignition blocks I x , y where no breach event occurs that is, T p ( I x , y ) is undefined, the associated boundary-threat score is quantified using the minimum approach distance as follows:
WUI-BTI ( I x , y ) = 1 + 1 1 + e α 3 r · D min ( I x , y ) β 3
where D min ( I x , y ) is the minimum distance, as defined in Equation (3), and r is the spatial resolution of the simulation grid (in meters). This expression also incorporates location-specific tuning parameters: α 3 controls the steepness of the sigmoid curve, and β 3 defines the reference distance (in meters) at which the score begins to decrease significantly. This formulation ensures that the resulting scores lie strictly within the range ( 1 , 2 ) , with smaller D min values corresponding to higher (more threatening) scores.
The final index values WUI-BTI ( I x , y ) in both cases are then uniformly assigned to all cells within the ignition block I x , y as follows:
WUI-BTI ( i ,   j ) = WUI-BTI ( I x , y ) ( i ,   j ) I x , y

3.3. Benchmarking Metrics: Parsimony and Boundary Concentration

Because WUI-BTI is a scenario-based boundary-threat (severity) index (conditional on ignition under standardized severe-weather conditions), its evaluation focuses on whether the index yields parsimonious, boundary-focused prioritization within the simulation footprint. Rather than attempting historical fire reconstruction (confounded by unknown meteorology, suppression, and landscape drift), we benchmark the resulting surface using two transparent, within-domain measures: an Area Reduction Factor (ARF) and a ring-stratified enrichment (EF). These measures are applied to the case study in Section 5.
Let G be the simulation grid, U G the urban set (Section 3.1), and U its community boundary. Denote the outside-community set by Ω out = G U . Let I be the set of valid ignition blocks (Section 3.1.3), and let r be the grid resolution in meters. For a user-specified fraction p ( 0 , 1 ] , let I p Ω out be the set of outside-community cells that belong to the top p % of cells ranked by the WUI-BTI score. Distances from U are computed on Ω out using an outside-only Euclidean distance transform. For fixed band edges a < b , define the distance ring
R [ a ,   b ) = ( i ,   j ) Ω out | min ( i b ,   j b ) U ( i i b ) 2 + ( j j b ) 2 [ a ,   b ) .
Area Reduction Factor (ARF): ARF quantifies parsimony the reduction in the outside-community footprint requiring management attention when attention is restricted to the prioritized set I p . Larger values indicate tighter, more actionable footprints for a given triage budget p:
ARF ( p ) = area ( Ω out ) area ( I p ) .
Ring-stratified Enrichment (EF): EF measures whether prioritized cells are concentrated near the boundary or dispersed farther away. Values EF > 1 indicate over-representation of prioritized cells in that ring relative to the available area, while EF < 1 indicate under-representation. For any ring R [ a ,   b ) ,
EF p R [ a ,   b ) = area I p R [ a ,   b ) / area ( I p ) area Ω out R [ a ,   b ) / area ( Ω out ) .
Relation to hazard layers: ARF and EF are interpreted alongside regional hazard classifications (e.g., FHSZ). Hazard layers provide broad regional context, while WUI-BTI—and its ARF/EF summaries—resolve scenario-specific, boundary-aware prioritization at the community scale. Numerical results are presented in Section 5.

3.4. Operational Workflow and Profile

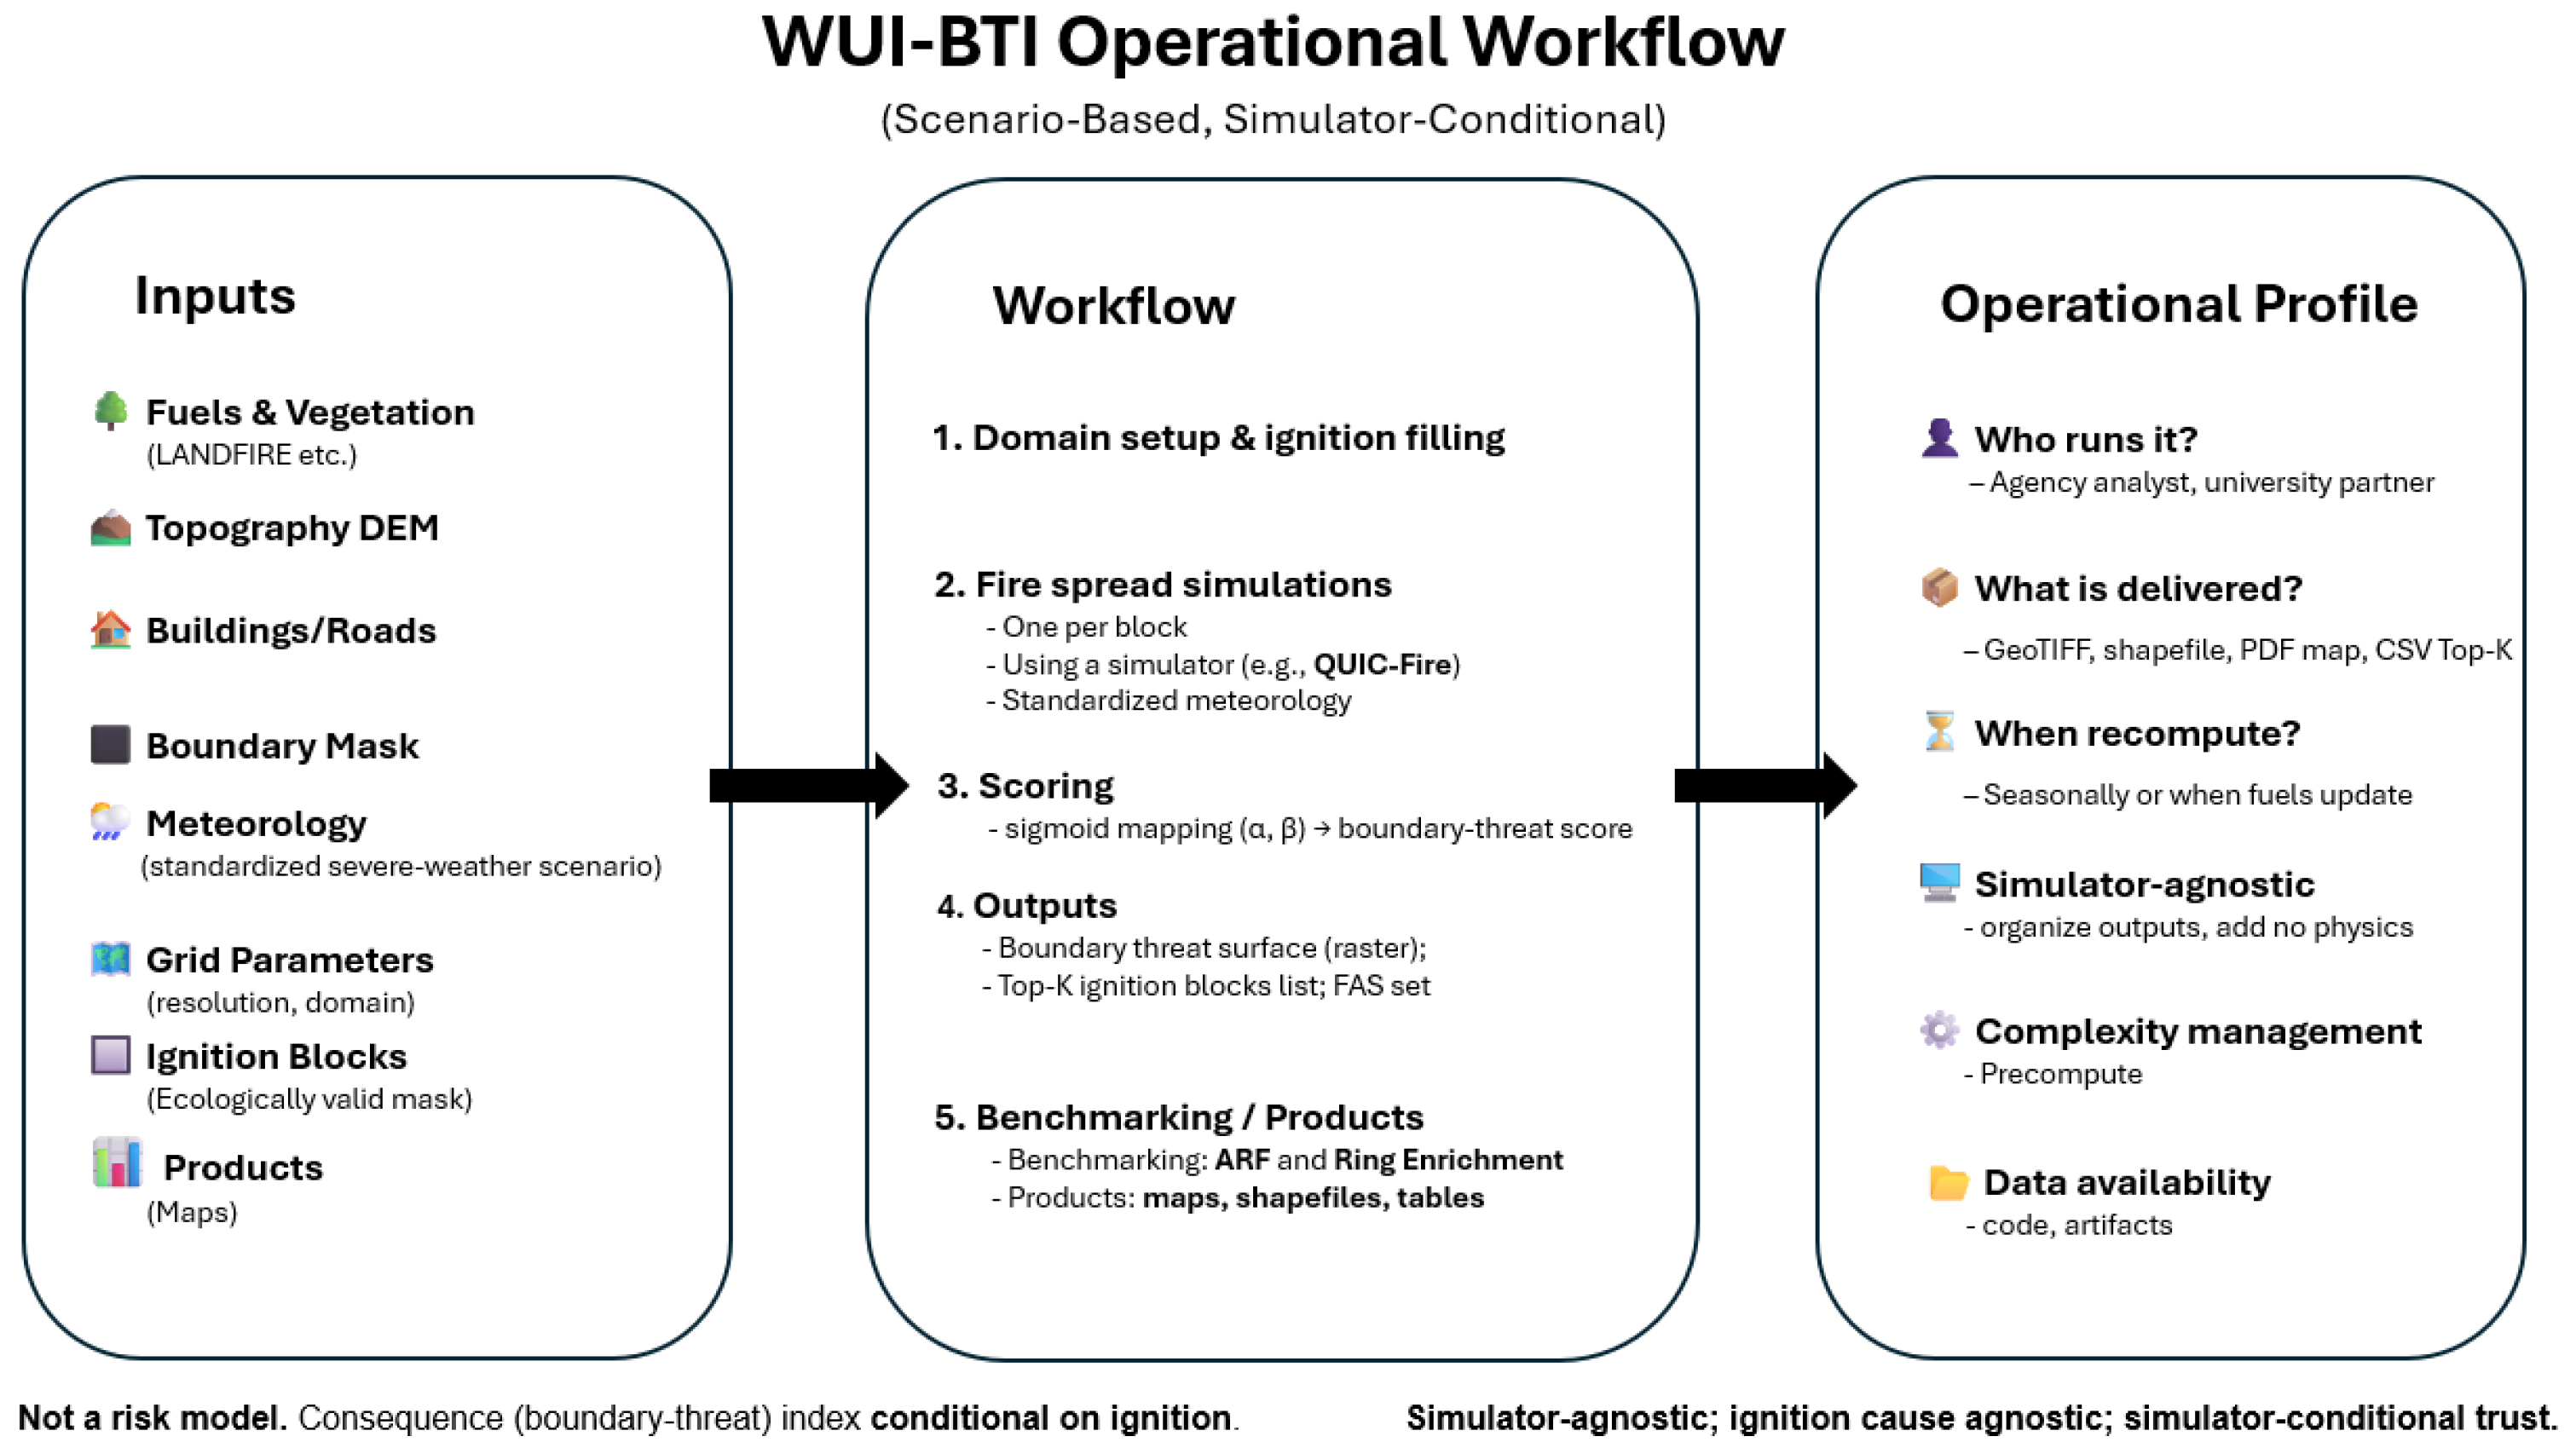
WUI-BTI provides scenario-based triage by ranking ignition blocks according to boundary threat under standardized severe-weather conditions. The framework is simulator-agnostic, organizing outputs (e.g., QUIC–Fire perimeters) without altering physics, so credibility is simulator-conditional. Inputs (Table 1) include fuels, DEM, built-environment mask, community boundary U, meteorology, grid ( G ,   r ) , and an ignition-validity mask. Each block is simulated, perimeter metrics ( T p ,   L c ,   D min ) are extracted, and scores are derived through monotone sigmoids ( α ,   β ) to yield a boundary-threat surface, top-k list, and FAS set. Evaluation uses within-domain benchmarking—Area Reduction Factor and ring-stratified enrichment—to test parsimony and boundary focus. The overall process and outputs are summarized in Figure 2, which also highlights operational aspects such as precomputation, deliverables, and reproducibility requirements.

4. Case Study

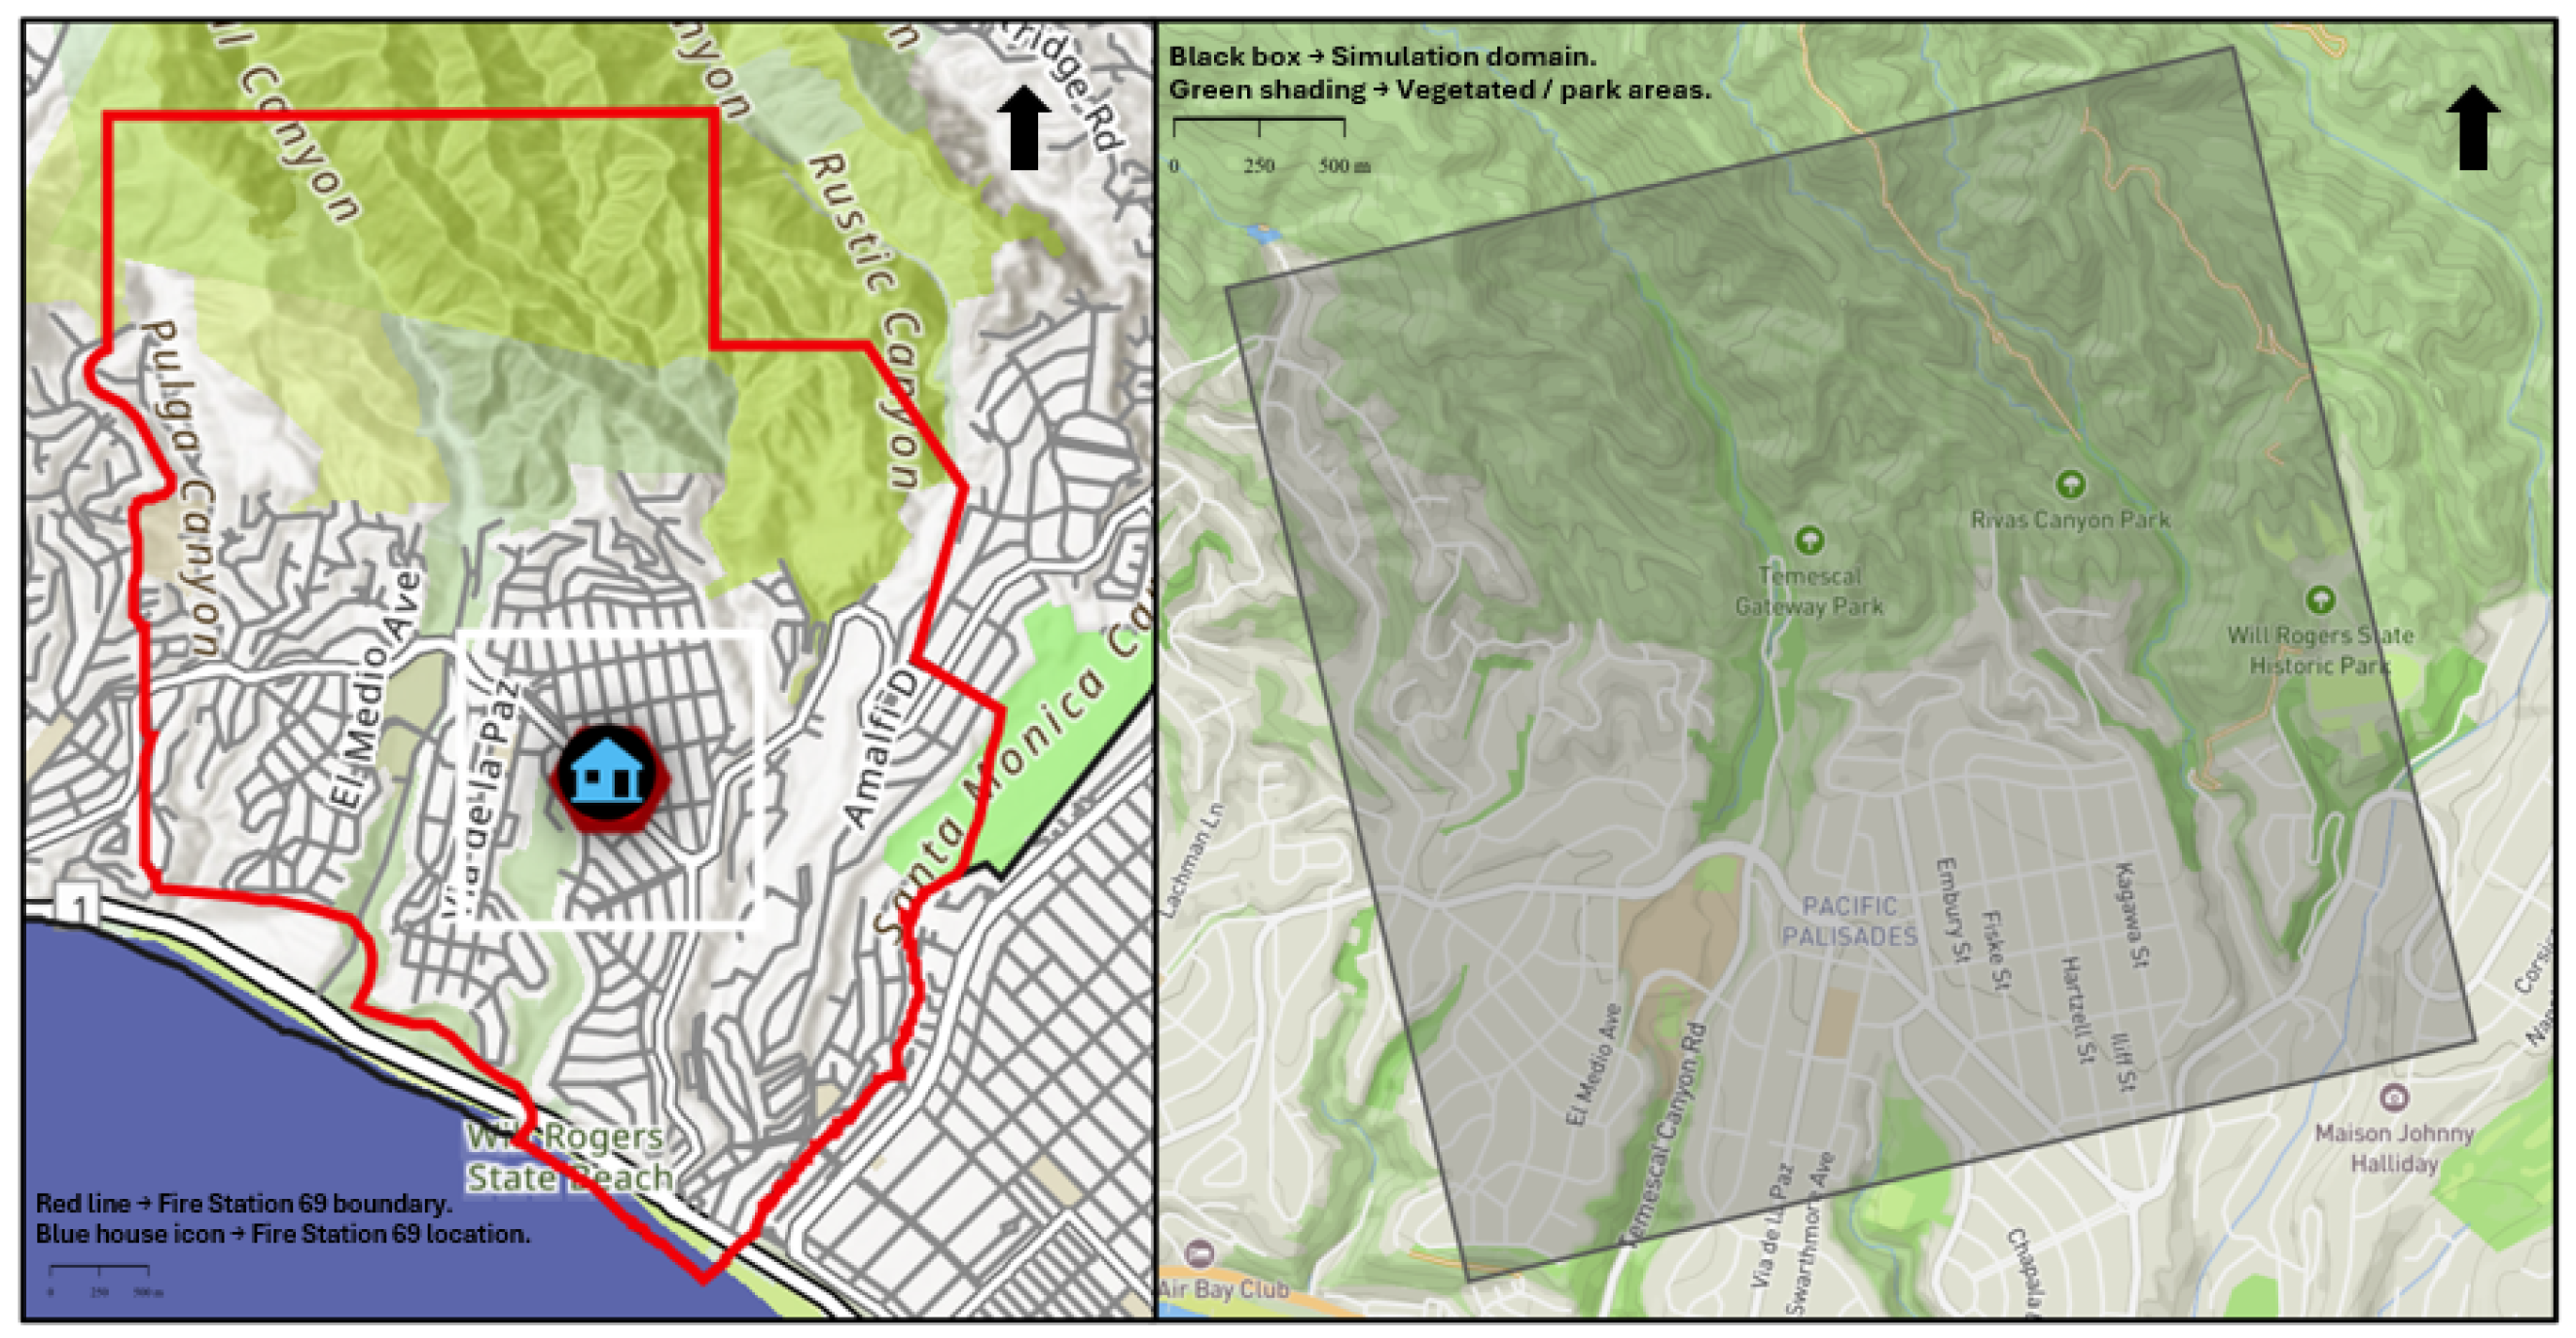
To demonstrate the WUI-BTI framework, a scenario-specific analysis is applied to the jurisdiction of Palisades Fire Station 69 (Los Angeles, CA, USA). The area was selected because CAL FIRE’s Fire Hazard Severity Zones designate it as high hazard [54] and because it lies near the ignition origins/early growth corridors of the 2025 Los Angeles wildfires, which escalated rapidly. The case study illustrates how WUI-BTI can support fuel-treatment prioritization, pre-positioning of suppression resources, and extended-response planning in high-hazard WUI settings.
Figure 3 summarizes the geography: the left panel shows the broader area of interest with the station’s jurisdiction outlined; the right panel shows the simulation domain G of area approx. 7.83 sq. km, a subset chosen to capture key topography, fuels, and vulnerable community assets for boundary-threat assessment under standardized meteorology. It is emphasized that this is a scenario analysis (not an event reconstruction), used to rank ignition locations by their potential to compromise the community boundary.
The fuel characteristics across the domain G, with dimensions N 1 = 692 and N 2 = 694 , were extracted from the LANDFIRE dataset [58]. For each grid cell ( i ,   j ) G , the fuel density f k ( i ,   j ) in kg/m2, fuel depth h k ( i ,   j ) in meters, and fuel moisture content m k ( i ,   j ) in percentage were assigned. These parameters captured the heterogeneous vegetation conditions, directly informing the spread rate and intensity of the simulated fire. An overview of these input layers is illustrated in Figure 4.
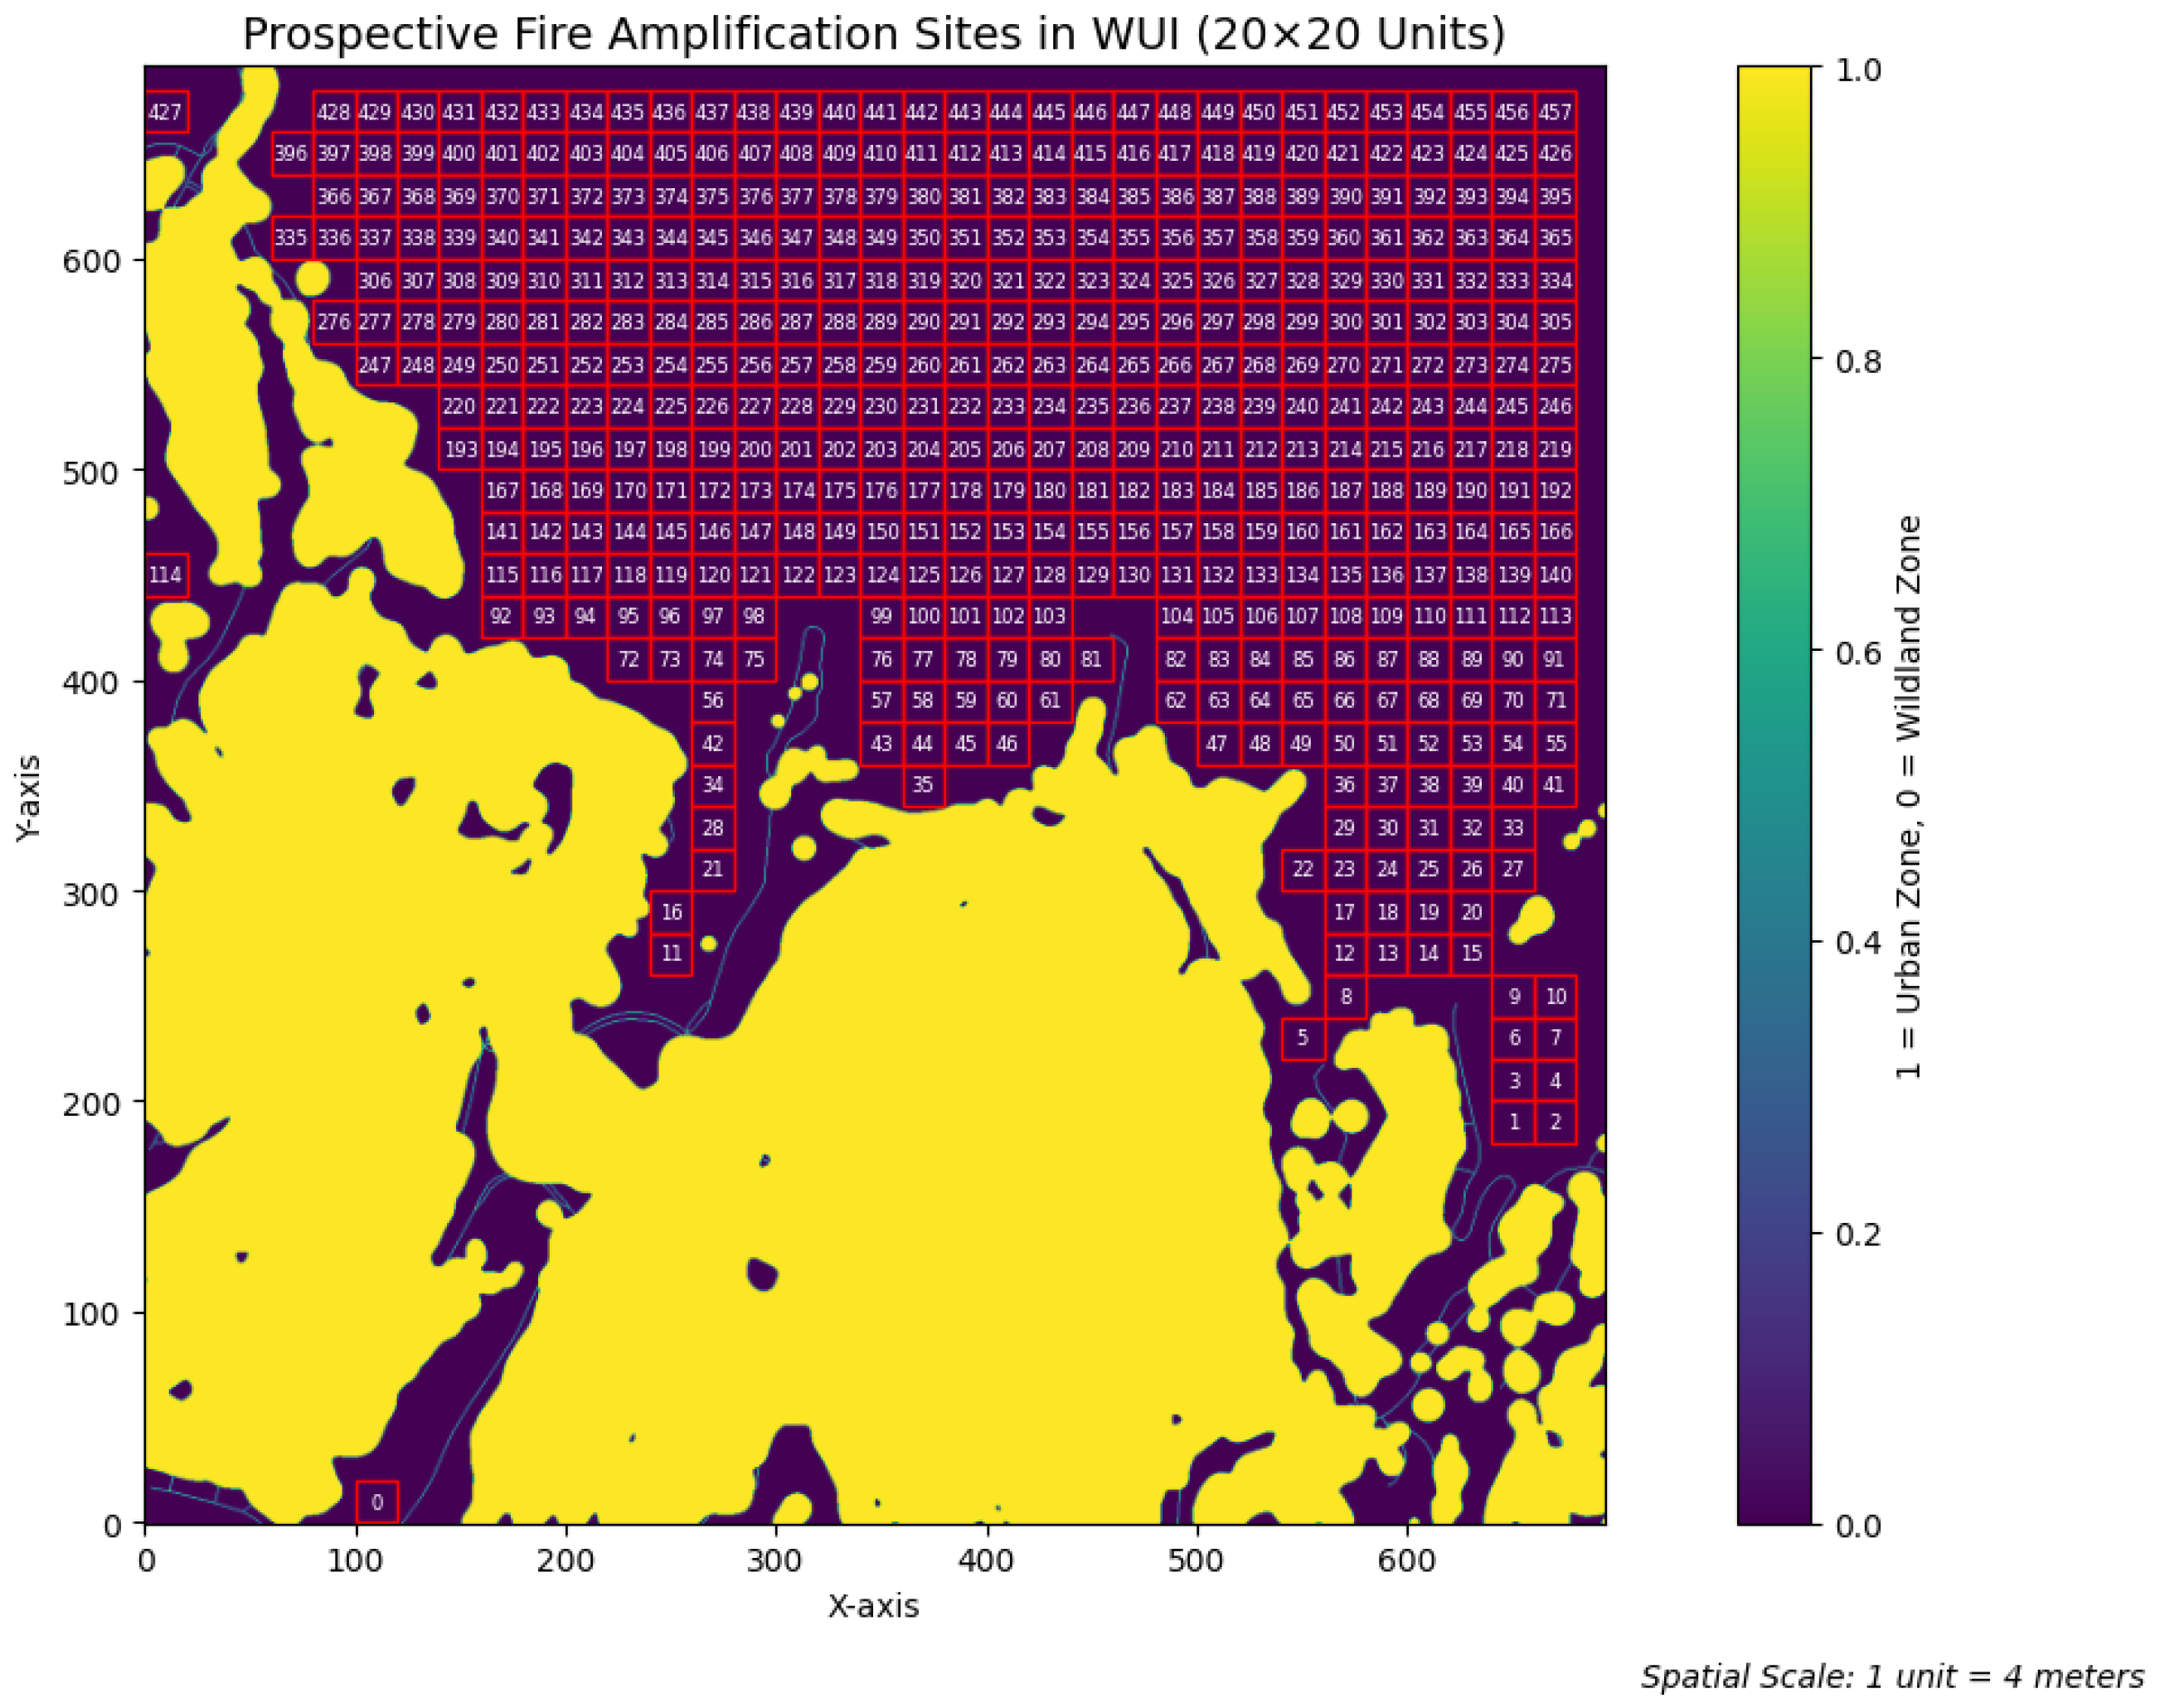
To better characterize the WUI within the simulation domain, the area was classified into urban (U) and wildland zones ( G U ). This spatial separation served as the basis for community boundary ( U ), fire ignition block ( I ) generation, and targeted scenario planning. The wildland zone ( G U ) was discretized at a spatial resolution of r = 4 m , and partitioned into a total of 457 square ignition blocks I x , y I . Each ignition block comprises n = 20 grid cells along each side, corresponding to a physical length of 80 m . As shown in Figure 5, these ignition blocks systematically cover the wildland–urban interface domain, enabling localized ignition scenario simulations and spatial analysis of fire amplification potential.
Each ignition block I x , y was independently simulated under consistent environmental conditions representative of typical Santa Ana wind events: a wind direction of 45° [59], wind speed of 18 m/s [60], ambient temperature of 25 °C [60], and relative humidity of 30% [59,60]. These wind parameters, while fixed throughout the simulation duration, significantly influenced the anisotropic expansion of the fire front due to the complex terrain. Fire spread simulations were executed using a total simulation duration T max = 1800 s, with a temporal resolution Δ t = 60 s, yielding μ = 30 time steps. For each ignition block I x , y , fire front evolution and boundary interactions were tracked to compute the WUI-BTI metrics: time to breach T p ( I x , y ) , breach size L c ( I x , y ) , and minimum approach distance D min ( I x , y ) .
The simulations were conducted using the wildfire modeling system QUIC-FIRE, which has been validated against real-world fire observations [61]. QUIC-FIRE overcomes the limitations of traditional fire behavior models such as FARSITE [43] and Prometheus [62] by explicitly resolving fire–atmosphere interactions, a critical factor for accurate prediction and operational control. Detailed descriptions of the framework are provided in [49,63]. In contrast to computationally intensive models like FIRETEC [64] and WRF-FIRE [65], QUIC-FIRE provides a more tractable solution by coupling the QUIC-URB wind solver [66,67] with the FIRE-CA fire spread model [68,69]. This integration enables the simulation of coupled feedbacks among fire, wind, turbulence, and fuel heterogeneity.
At its core, QUIC-FIRE employs a probabilistic cellular automata framework that captures the stochastic nature of fire spread and accommodates complex ignition patterns commonly used in prescribed burns. Its combination of computational efficiency and physical fidelity makes it a practical and reliable tool for fire managers developing safe and effective burn strategies. Although the methodology introduced in this paper is simulator-agnostic, QUIC-FIRE was selected as the modeling engine for the analyses presented here due to its balance of efficiency and fidelity. For clarity and reproducibility, the full set of simulation inputs and control parameters including discretization, ignition block design, environmental forcings are consolidated in Table A1 (Appendix A).
The WUI-BTI sigmoid parameters are selected to reflect operationally meaningful transitions in fire behavior severity. β 1 = 200 m marks a moderate breach size that begins to challenge containment capacity; this corresponds to the upper limit of line construction (160–200 m in 30 min) for a typical local and mutual aid crew under field conditions [70,71,72]. β 2 = 900 s is the midpoint of the 30 min simulation and aligns with the critical 10–20 min window when most initial attack efforts are decisive [73,74]. β 3 = 250 m reflects the outer edge of moderate fire concern, consistent with extended WUI buffer zones [53], multiples of defensible space recommendations [75], and ember spotting distances [76]. Slope parameters α 1 = 0.02 and α 3 = 0.02 produce transition zones of approximately 100–150 m around the spatial midpoints, while α 2 = 0.005 yields a 5–10 min transition around the temporal midpoint, reflecting suppression variability. Suggested default values summarized in Table 2.
To validate the stability of the parameter choices, a sensitivity analysis was conducted in which each parameter was individually perturbed by ± 25 % . The results, shown in Figure 6, confirm that the model outputs are most sensitive to the breach-case midpoint parameters, β 1 and β 2 .
As illustrated by the score sensitivity plot (Figure 6), perturbations in β 2 produced the largest median change in absolute scores. The rank sensitivity plot (Figure 6) further reveals that perturbations in both β 1 and β 2 cause significant rank displacement, as evidenced by their wide 10th–90th percentile ranges. These findings underscore the critical role of the operationally-derived thresholds for breach size and arrival time in determining model outcomes.
By contrast, the model exhibits considerable robustness to the slope parameters ( α 1 ,   α 2 ,   α 3 ) and the non-breach midpoint ( β 3 ). For these parameters, the candlesticks in both plots are minimal, indicating that ± 25 % perturbations produced negligible changes in both absolute score and relative rank. This suggests that the model’s stability is less dependent on the precise steepness of the transition curves than on the location of the core operational midpoints.

5. Results and Discussion

The results for five randomly selected ignition blocks I x , y are summarized in Table 3. In this scenario, Fire Amplification Sites (FAS) are defined as ignition blocks whose boundary-threat score exceeds 4 on the rescaled [ 1 , 5 ] WUI-BTI scale (i.e., WUI-BTI ( I x , y ) > 4 ). These locations represent ignition zones where local combinations of fuels, topography, and wind exposure concentrate a rapid approach to U and produce large affected boundary lengths, thereby posing an elevated threat to the community boundary. The selected examples span both breach and non-breach behaviors—ranging from fast, large-extent breaches to low-threat, non-breaching near-misses—illustrating WUI-BTI’s ability to differentiate consequence severity across the landscape under standardized meteorology.
The results demonstrate WUI-BTI’s ability to stratify ignition locations by their boundary threat. The ignition block I 640 , 200 exhibits the most severe outcome, with a rapid breach ( T p = 60 s) and a large affected boundary length ( r . L c = 2192 m), yielding the highest score on the rescaled [ 1 , 5 ] scale ( WUI-BTI = 4.97 ). This location qualifies as a Fire Amplification Site (FAS) and represents the most critical ignition scenario in the analysis. In contrast, I 580 , 260 does not breach the boundary but approaches within D min = 48 m, producing a high non-breach score ( WUI-BTI = 1.98 ). The ignition I 380 , 380 breaches late in the simulation window ( T p = 960 s) with limited impact ( r . L c = 104 m), resulting in a moderate score ( WUI-BTI = 2.61 ). The block I 620 , 660 poses minimal threat: the perimeter remains distant from U ( r . D min = 1051 m), yielding a near-baseline score ( WUI-BTI 1.001 ). Finally, I 480 , 400 shows a relatively fast breach ( T p = 180 s) but moderate extent ( r . L c = 128 m), leading to a high score ( WUI-BTI = 3.35 ).
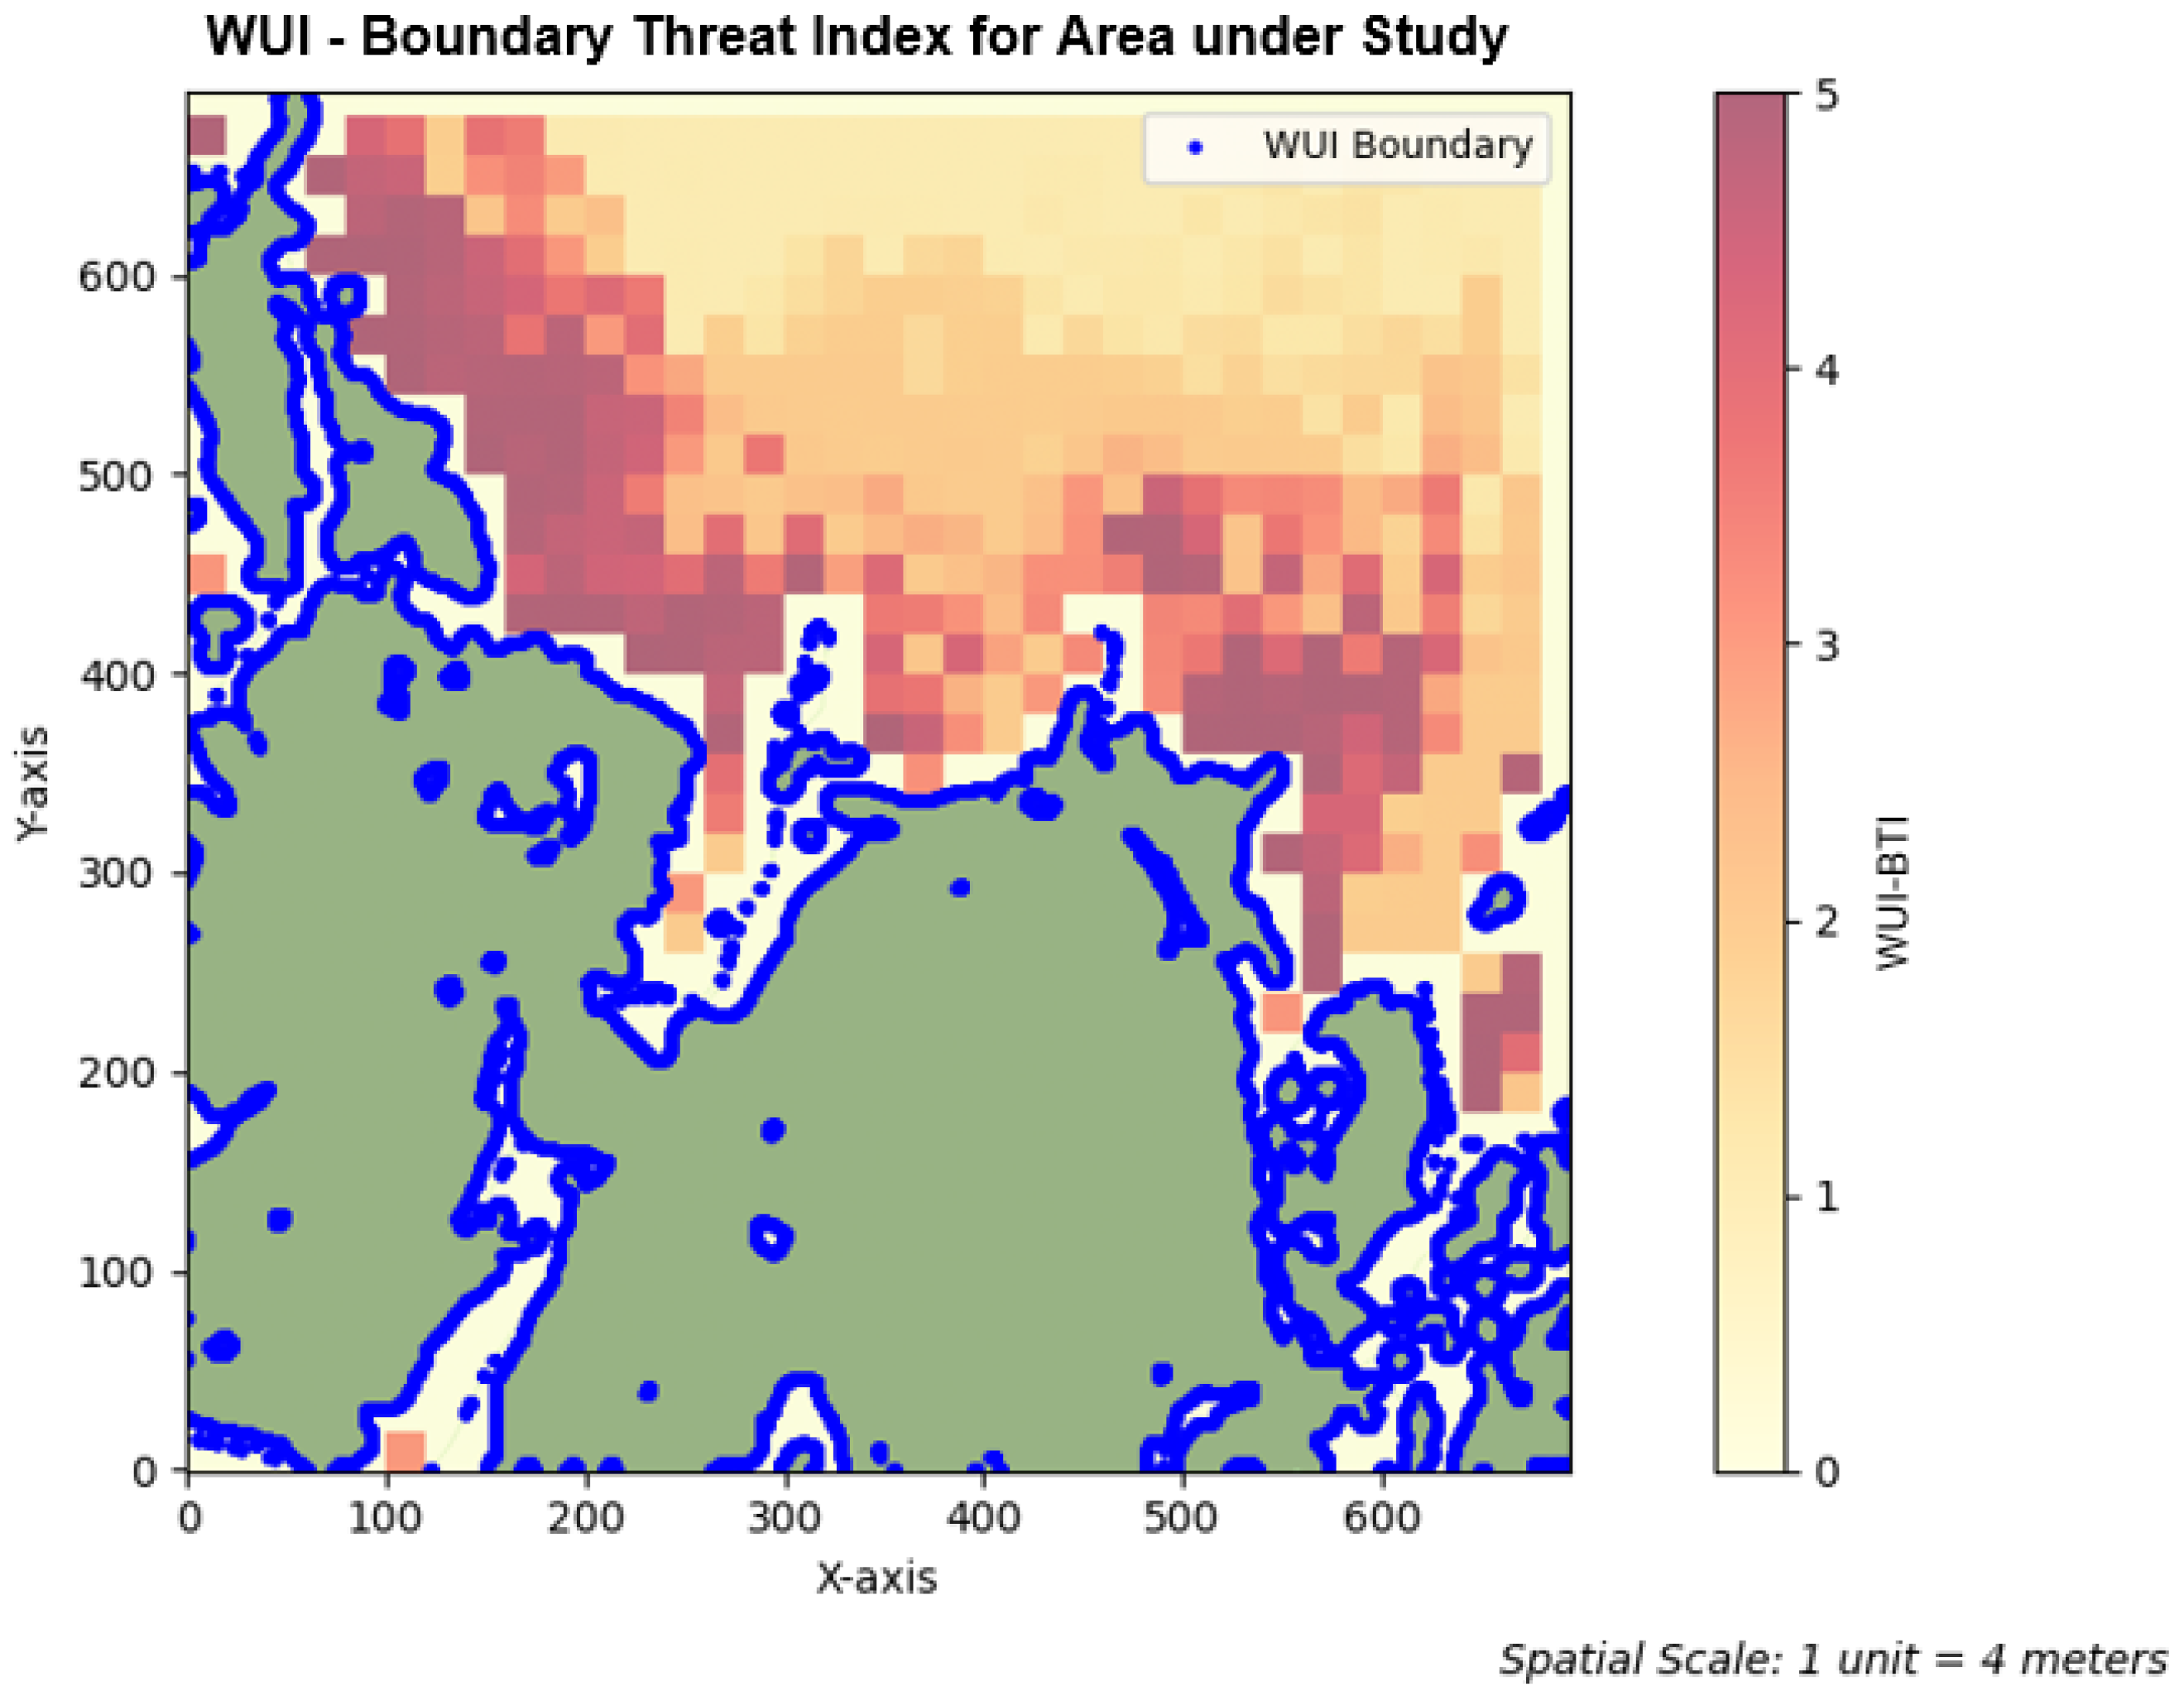
These scalar WUI-BTI values are rasterized back onto the domain by uniformly assigning each ignition block’s score to all cells ( i ,   j ) I x , y (Figure 7), producing a continuous boundary-threat surface. Critical hotspots—such as I 640 , 200 —emerge clearly and classify such zones ( WUI-BTI > 4 on the [ 1 , 5 ] scale) as Fire Amplification Sites. These areas are high-priority candidates for fuel treatment, community protection measures, and strategic resource allocation under the specified meteorology.
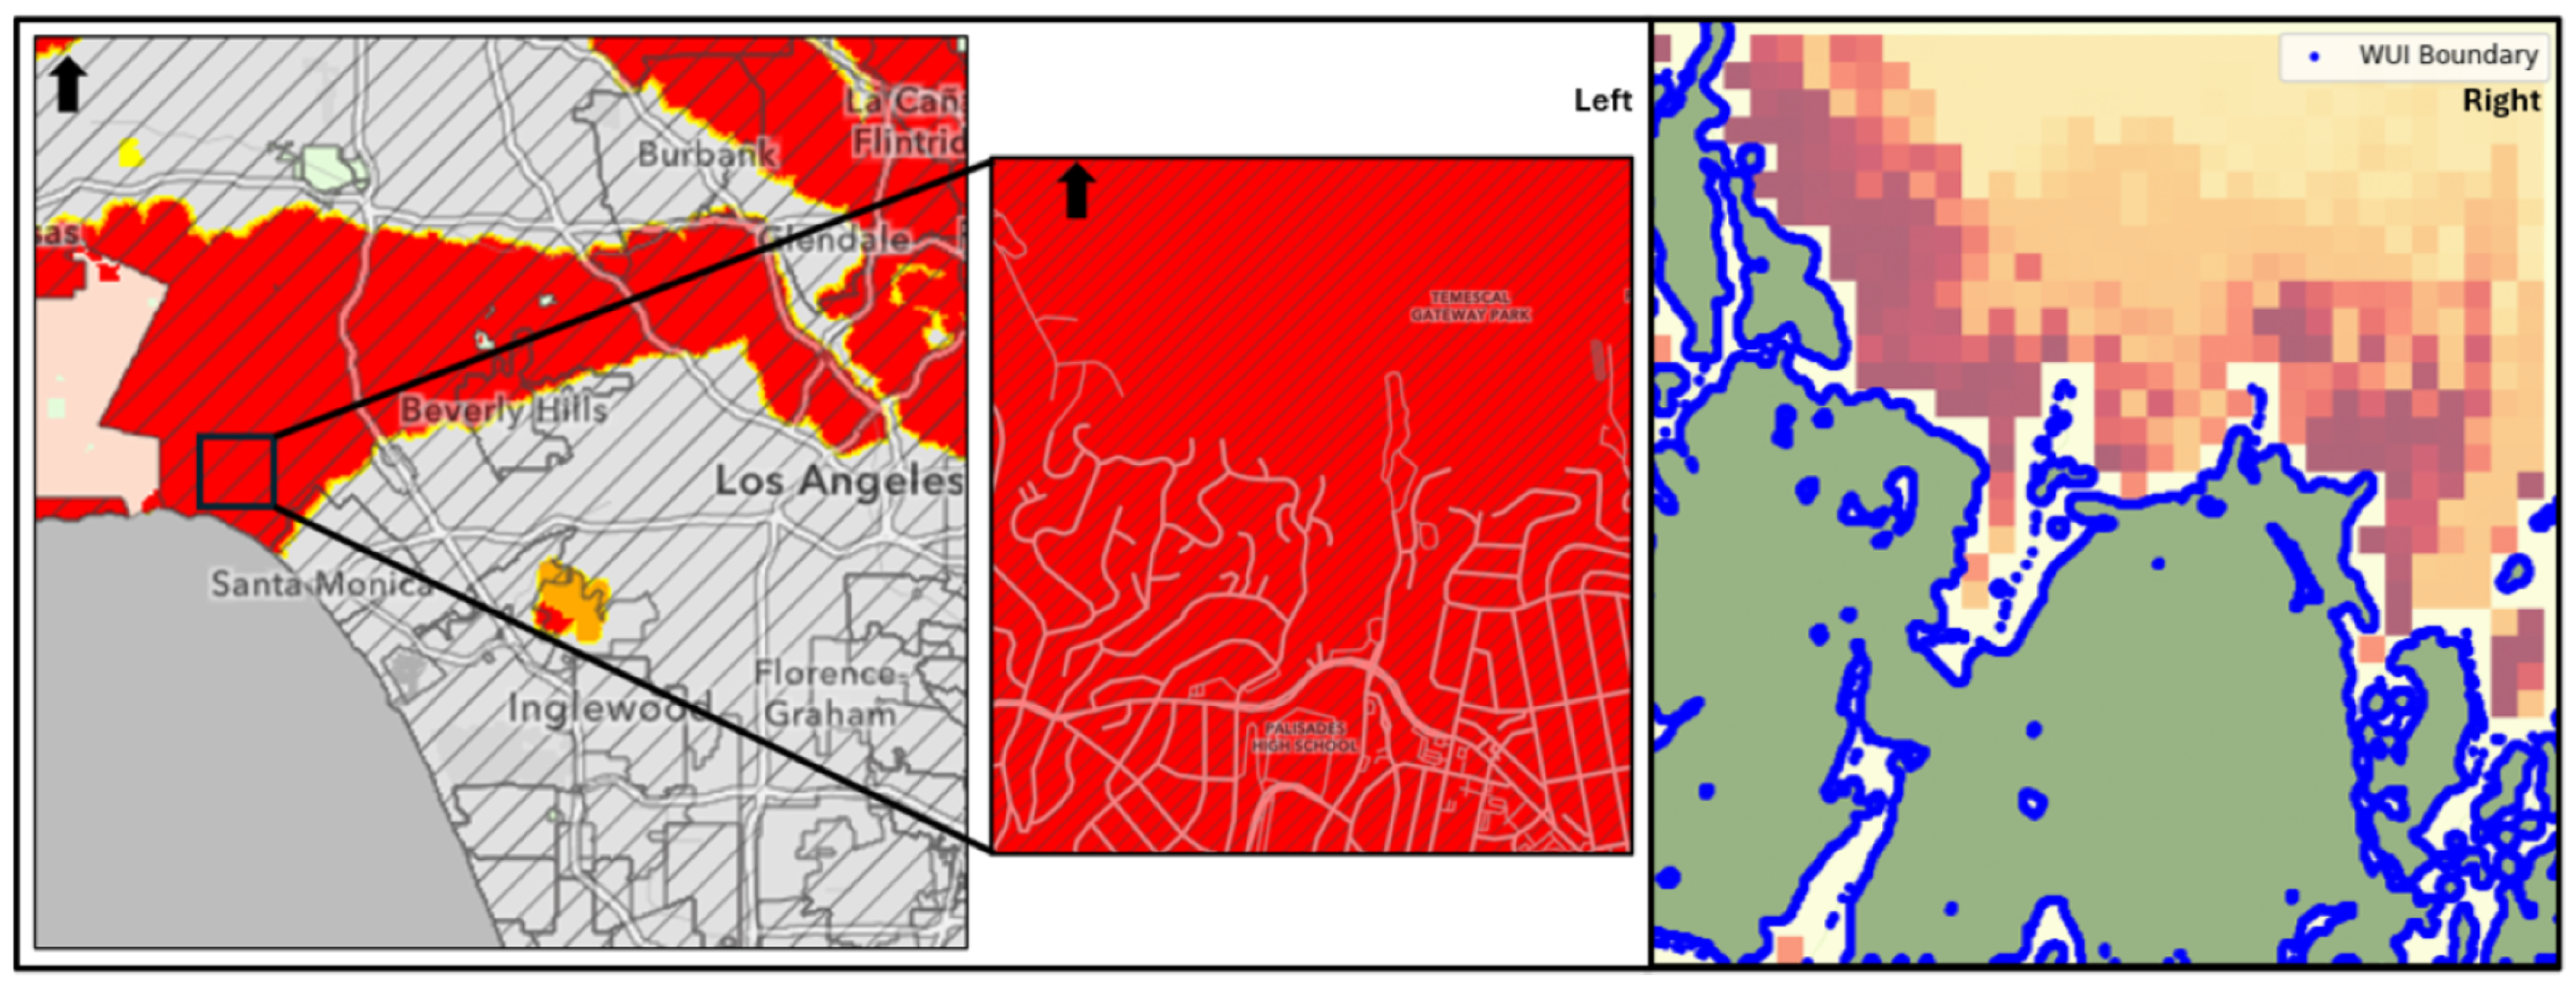
The Palisades Fire Station 69 case study illustrates how WUI-BTI functions as an operational complement to regional hazard products. The left panel of Figure 8 shows CAL FIRE’s Fire Hazard Severity Zones (FHSZ)—a regional hazard classification that provides valuable context but lacks block-scale resolution for tactical mitigation. The right panel presents the WUI-BTI boundary-threat surface under standardized meteorology, ranking ignition blocks I x , y by their scenario-specific potential to compromise the community boundary U . High-threat blocks (FAS; WUI-BTI > 4 on the [ 1 , 5 ] scale) emerge as localized priorities for fuel treatment, pre-positioning, and protection. This side-by-side display creates a benchmark comparison between an established hazard zoning product (FHSZ) and the proposed boundary-threat index (WUI-BTI). Specifically, the WUI-BTI map does not indicate the probability of fire occurrence but rather the severity of boundary threat when a fire ignites at each block, thus complementing FHSZ and supplying boundary-aware, scenario-driven guidance at the community scale.
For example, ignition block I 640 , 200 , which attains the highest score ( WUI-BTI = 4.97 ), would be the top priority for fuel-reduction treatments, prescribed burning, and pre-positioning of suppression resources under high-hazard meteorology. By contrast, I 580 , 260 does not breach the boundary but exhibits a high near-miss threat ( r . D min = 48 m), indicating a critical location where passive defenses—boundary hardening and defensible-space creation—are likely to be most effective.
As a scenario-based boundary-threat index under standardized severe-weather conditions, WUI-BTI is evaluated for its ability to provide parsimonious, boundary-focused prioritization. Rather than uncertain historical reconstructions, benchmarking uses the co-displayed hazard classification (FHSZ) and two within-domain measures—Area Reduction Factor (ARF) and ring-stratified enrichment (EF)—to show concentration on the most consequential ignition sites, without implying probabilistic forecasts or event replication.
Across the 4.183 km 2 outside-community domain, the prioritized ignition subset I p achieves strong parsimony and boundary focus (Table 4). Under the primary budget ( p = 10 % ), I p occupies 0.418 km 2 (ARF = 10.0 × ), with a median boundary distance of 118 m (p10 = 50 m, p90 = 233 m). As the budget expands ( p = 20 % ,   25 % ), parsimony relaxes (ARF = 5.0 × and 4.0 × ) and the median distance shifts outward (165–170 m), though the near-boundary emphasis remains.
For ring-stratified enrichment, distance bands were defined as R [ 0 , 250 ) , R [ 250 , 500 ) , and R [ 500 , 750 ) m using an outside-only Euclidean distance transform from U . These correspond to near-boundary triage, intermediate ember/approach corridors, and a broader context zone. Enrichment values show I p concentrated close to the boundary ( 1.86 × in 0–250 m), depleted in the mid-band ( 0.36 × in 250–500 m), and negligible beyond 500 m. These patterns persist across p { 10 % ,   20 % ,   25 % } .
Together, Figure 8 and Table 4 demonstrate WUI-BTI’s role as a benchmarked, scenario-driven complement to existing hazard classifications. Under the standardized scenario, the method reduces the outside-community footprint requiring attention by 4– 10 × , depending on the triage budget, while systematically concentrating prioritized ignition blocks I p near the boundary—where operational threat is greatest—and de-emphasizing distant areas. In contrast to broader hazard classifications such as FHSZ, which provide valuable regional context but lack block-scale operational specificity, the boundary-threat index supplies fine-grained, boundary-aware prioritization at the community scale. These findings are simulator-conditional: the credibility of WUI-BTI results depends on the fidelity of the underlying fire-spread engine, including its validation against real-world fire behavior and its accuracy in reproducing spread dynamics. WUI-BTI organizes and ranks simulator outputs but does not alter model physics, so its reliability is directly tied to the empirical grounding and predictive performance of the chosen simulator.

6. Conclusions

This paper introduced WUI-BTI, a simulator-agnostic framework that converts fire-spread simulations across plausible ignition locations into a single, interpretable boundary-threat (consequence) index conditional on an ignition under standardized meteorology. By extracting three operational metrics proximity for non-breach cases ( D min ) and, for breach cases, urgency ( T p ) and extent ( L c )—and mapping them through monotone sigmoids, WUI-BTI yields a scenario-specific ranking of ignition locations. The resulting surface identifies Fire Amplification Sites (FAS) that merit priority attention for mitigation and response.
Applied to the Palisades Fire Station 69 domain, WUI-BTI provided fine-scale, boundary-aware guidance that complements regional hazard classifications (e.g., FHSZ). While hazard maps supply regional context, WUI-BTI resolves which ignition blocks would most rapidly and extensively compromise the community boundary under specified conditions, supporting targeted fuel treatments, pre-positioning of suppression resources, and refinement of evacuation trigger points.
Validation and robustness: Validation focused on rank-based, perimeter-anchored checks consistent with operational use. Within-domain benchmarking indicated parsimonious, boundary-focused prioritization; sensitivity analyses showed stable scores and ranks under reasonable parameter perturbations, with breach midpoints most influential; and comparison with CAL FIRE FHSZ suggested convergent construct validity while adding boundary-aware, scenario-specific resolution. Together, these qualitative findings support the practical reliability of WUI–BTI for triage under standardized meteorology, while remaining simulator-conditional.
Limitations: WUI-BTI’s outputs inherit assumptions from the underlying simulator and inputs. Results can vary with model physics, wind representation, and fuel data quality; early-time observational datasets suitable for minute-scale validation remain sparse. Our standardized meteorology, short-horizon analyses are designed for triage and planning, not event reconstruction. These caveats motivate continued validation and data improvements.
Practical guidance for applying WUI-BTI is summarized below, highlighting key actions for mitigation, resource allocation, evacuation planning, and adaptive monitoring.
  • Prioritize mitigation: Treat top-ranked FAS as candidates for fuel reduction, access improvements, and boundary hardening.
  • Pre-position resources: Stage crews and equipment along boundary segments adjacent to high-threat blocks under forecast winds.
  • Refine evacuation planning: Use high-threat approach sectors to set trigger points and route contingencies.
  • Monitor and adapt: Recompute WUI-BTI seasonally or when fuels/weather regimes shift; track how the top-k list changes.
Future work will (i) incorporate multi-scenario ensembles (Design-of-Experiments) to represent dynamic weather and quantify uncertainty; (ii) extend validation using time-stamped perimeters, camera networks, and multi-simulator cross-checks; (iii) integrate exposure/vulnerability and economic-impact modules to connect boundary threat to expected consequences; and (iv) release open configurations and scripts to strengthen reproducibility. Together, these steps will advance WUI-BTI from a scenario-specific boundary-threat index to a broadly deployable decision-support capability for WUI wildfire management.

Author Contributions

Conceptualization, Y.M. and R.d.C.; methodology, Y.M. and R.d.C.; software, Y.M.; validation, Y.M.; formal analysis, Y.M.; investigation, Y.M.; writing—original draft preparation, Y.M. and R.d.C.; writing—review and editing, Y.M. and R.d.C.; visualization, Y.M.; supervision, R.d.C. and I.A.; project administration, R.d.C. and I.A. All authors have read and agreed to the published version of the manuscript.

Funding

This work was funded with project support from the National Science Foundation award 2134904 and the University of California Office of the President UCCA award R02CP7317.

Institutional Review Board Statement

Not applicable.

Informed Consent Statement

Not applicable.

Data Availability Statement

The WUI-BTI framework is a conceptual and mathematical model. The computer code to implement the framework is available from the corresponding author upon reasonable request.

Acknowledgments

During the preparation of this manuscript, the authors used ChatGPT (OpenAI, GPT-4o) to assist with language editing and formatting, and Python 3.10 for code generation and implementation of the model. All outputs were carefully reviewed, verified, and edited by the authors, who take full responsibility for the content of this publication.

Conflicts of Interest

The authors declare no conflicts of interest.

Abbreviations

The following abbreviations are used in this manuscript:
WUI-BTIWildland Urban Interface Boundary Threat Index
FASFire Amplification Site

Appendix A. Simulation Setup and Inputs

Table A1. Scenario setup, inputs, and outputs for the WUI-BTI case study (Palisades Fire Station 69).
CategorySymbol/ValueDescription
Study area & discretization
Domain size N 1 = 692 , N 2 = 694 Grid dimensions of simulation domain G
Spatial resolution r = 4 m Cell size used for discretization of G
WUI delineation U , G U , U Urban set U, wildland G U , and community boundary U
Ignition design
Ignition blocks | I | = 457 Number of square ignition blocks I x , y I covering G U
Block size n = 20 cells per side 80 m × 80 m physical dimensions per block
Environmental forcing (standardized Santa Ana scenario)
Wind direction 45 Fixed throughout simulation horizon
Wind speed 18 m s 1 Fixed magnitude
Air temperature 25   ° C Fixed ambient temperature
Relative humidity 30 % Fixed RH
Fuel & terrain inputs (from LANDFIRE)
Fuel density f k ( i ,   j ) [kg m−2]Surface fuel load per cell ( i ,   j )
Fuel height/depth h k ( i ,   j ) [m]Representative fuel depth per cell ( i ,   j )
Fuel moisture m k ( i ,   j ) [%]Fuel moisture content per cell ( i ,   j )
Topographyelevation [m]Digital elevation model over G
Simulation control
Duration & step T max = 1800 s , Δ t = 60 s Total horizon and time step
Time steps μ = 30 Number of saved output times
Outputs & WUI-BTI metrics
Time to breach T p ( I x , y ) [s]First time the fire reaches U (if breached)
Breach size r . L c ( I x , y ) [m]Length of breached boundary segment
Min Approach r . D min ( I x , y ) [m]Closest distance to U when no breach
Modeling engine
Wildfire modelQUIC–FIRECoupled QUIC–URB wind + FIRE–CA spread; probabilistic cellular automata
Framework stanceSimulator–agnosticWUI-BTI is model–agnostic; QUIC–FIRE used here for efficiency/fidelity

References

  1. Pandey, P.; Huidobro, G.; Lopes, L.F.; Ganteaume, A.; Ascoli, D.; Colaco, C.; Xanthopoulos, G.; Giannaros, T.M.; Gazzard, R.; Boustras, G.; et al. A global outlook on increasing wildfire risk: Current policy situation and future pathways. Trees For. People 2023, 14, 100431. [Google Scholar] [CrossRef]
  2. Link, E.D.; Maranghides, A. Burnover events identified during the 2018 Camp Fire. Int. J. Wildland Fire 2023, 32, 989–997. [Google Scholar] [CrossRef]
  3. Radeloff, V.C.; Mockrin, M.H.; Helmers, D.; Carlson, A.; Hawbaker, T.J.; Martinuzzi, S.; Schug, F.; Alexandre, P.M.; Kramer, H.A.; Pidgeon, A.M. Rising wildfire risk to houses in the United States, especially in grasslands and shrublands. Science 2023, 382, 702–707. [Google Scholar] [CrossRef] [PubMed]
  4. O’Mara, T.; Sánchez Meador, A.; Colavito, M.; Waltz, A.; Barton, E. Navigating the evolving landscape of wildfire management: A systematic review of decision support tools. Trees For. People 2024, 16, 100575. [Google Scholar] [CrossRef]
  5. Martell, D.L. A Review of Recent Forest and Wildland Fire Management Decision Support Systems Research. Curr. For. Rep. 2015, 1, 128–137. [Google Scholar] [CrossRef]
  6. Zacharakis, I.; Tsihrintzis, V.A. Environmental forest fire danger rating systems and indices around the globe: A review. Land 2023, 12, 194. [Google Scholar] [CrossRef]
  7. Zacharakis, I.; Tsihrintzis, V.A. Integrated wildfire danger models and factors: A review. Sci. Total Environ. 2023, 899, 165704. [Google Scholar] [CrossRef]
  8. Dunn, C.J.; Calkin, D.E.; Thompson, M.P. Towards enhanced risk management: Planning, decision making and monitoring of US wildfire response. Int. J. Wildland Fire 2017, 26, 551–556. [Google Scholar] [CrossRef]
  9. Thompson, M.P.; Calkin, D.E. Uncertainty and risk in wildland fire management: A review. J. Environ. Manag. 2011, 92, 1895–1909. [Google Scholar] [CrossRef]
  10. Parisien, M.A.; Snetsinger, S.; Greenberg, J.A.; Nelson, C.R.; Schoennage, T.; Dobrowski, S.Z.; Moritz, M.A. Spatial variability in wildfire probability across the western United States. Int. J. Wildland Fire 2012, 21, 313–327. [Google Scholar] [CrossRef]
  11. Parisien, M.A.; Walker, G.R.; Little, J.M.; Simpson, B.N.; Wang, X.; Perrakis, D.D.B. Considerations for modeling burn probability across landscapes with steep environmental gradients: An example from the Columbia Mountains, Canada. Nat. Hazards 2013, 66, 439–462. [Google Scholar] [CrossRef]
  12. Jaffe, M.R.; Scott, J.H.; Callahan, M.N.; Dillon, G.K.; Karau, E.C.; Lazarz, M.T. Wildfire Risk to Communities: Spatial Datasets of Wildfire Risk for Populated Areas in the United States; Forest Service Research Data Archive: Fort Collins, CO, USA, 2024. [Google Scholar] [CrossRef]
  13. Dillon, G.K.; Lazarz, M.T.; Karau, E.C.; Story, S.J.; Pohl, K.A. Community Wildfire Risk Reduction Zones for the United States; Forest Service Research Data Archive: Fort Collins, CO, USA, 2024. [Google Scholar] [CrossRef]
  14. Radeloff, V.C.; Hammer, R.B.; Stewart, S.I.; Fried, J.S.; Holcomb, S.S.; McKeefry, J.E. The wildland-urban interface in the United States. Ecol. Appl. 2005, 15, 799–805. [Google Scholar] [CrossRef]
  15. Xu, Z.; Li, J.; Cheng, S.; Rui, X.; Zhao, Y.; Xu, L. Wildfire Risk Prediction: A Review. arXiv 2024, arXiv:2405.01607. [Google Scholar] [CrossRef]
  16. Oliveira, S.; Rocha, J.; Sá, A. Wildfire risk modeling. Curr. Opin. Environ. Sci. Health 2021, 23, 100274. [Google Scholar] [CrossRef]
  17. Preisler, H.K.; Brillinger, D.R.; Burgan, R.E.; Benoit, J.W. Probability based models for estimation of wildfire risk. Int. J. Wildland Fire 2004, 13, 133–142. [Google Scholar] [CrossRef]
  18. Massada, A.B.; Syphard, A.D.; Stewart, S.I.; Radeloff, V.C. Wildfire ignition-distribution modelling: A comparative study in the Huron–Manistee National Forest, Michigan, USA. Int. J. Wildland Fire 2013, 22, 174–183. [Google Scholar] [CrossRef]
  19. Chuvieco, E.; Yebra, M.; Martino, S.; Thonicke, K.; Gómez-Giménez, M.; San-Miguel, J.; Oom, D.; Velea, R.; Mouillot, F.; Molina, J.R.; et al. Towards an Integrated Approach to Wildfire Risk Assessment: When, Where, What and How May the Landscapes Burn. Fire 2023, 6, 215. [Google Scholar] [CrossRef]
  20. Van Wagner, C.E. Development and Structure of the Canadian Forest Fire Weather Index System; Forestry Technical Report 35; Canadian Forest Service, Petawawa National Forestry Institute: Chalk River, ON, Canada, 1987; 37p. [Google Scholar]
  21. Deeming, J.E.; Burgan, R.E.; Cohen, J.D. The National Fire-Danger Rating System, 1978; Technical Report 39; Intermountain Forest and Range Experiment Station, Forest Service, U.S. Department of Agriculture: Ogden, UT, USA, 1977. [Google Scholar]
  22. Sharples, J.J. A note on fire weather indices. Int. J. Wildland Fire 2022, 31, 728–734. [Google Scholar] [CrossRef]
  23. Jain, P.; Coogan, S.C.; Subramanian, S.G.; Crowley, M.; Taylor, S.; Flannigan, M.D. A review of machine learning applications in wildfire science and management. Environ. Rev. 2020, 28, 478–505. [Google Scholar] [CrossRef]
  24. Dorph, A.; Marshall, E.; Parkins, K.A.; Penman, T.D. Modelling ignition probability for human- and lightning-caused wildfires in Victoria, Australia. Nat. Hazards Earth Syst. Sci. 2022, 22, 3487–3499. [Google Scholar] [CrossRef]
  25. Muhs, J.W.; Parvania, M.; Nguyen, H.T.; Palmer, J.A. Characterizing Probability of Wildfire Ignition Caused by Power Distribution Lines. IEEE Trans. Power Deliv. 2021, 36, 3681–3688. [Google Scholar] [CrossRef]
  26. Schreck, J.; Petzke, W.; Jiménez, P.; Brummet, T.; Knievel, J.; James, E.; Kosović, B.; Gagne, D. Machine Learning and VIIRS Satellite Retrievals for Skillful Fuel Moisture Content Monitoring in Wildfire Management. Remote Sens. 2023, 15, 3372. [Google Scholar] [CrossRef]
  27. Klimas, K.B.; Yocom, L.L.; Murphy, B.P.; Hudak, A.T.; Herynk, J.A.; Abatzoglou, J. A machine learning model to predict wildfire burn severity for pre-fire risk assessments, Utah, USA. Fire Ecol. 2025, 21, 8. [Google Scholar] [CrossRef]
  28. Sampson, R.N.; Atkinson, R.D.; Lewis, J.W. Mapping Wildfire Hazards and Risks; CRC Press: Boca Raton, FL, USA, 2000. [Google Scholar]
  29. Rodríguez-Martínez, A.; Vitoriano, B. Probability-Based Wildfire Risk Measure for Decision-Making. Mathematics 2020, 8, 557. [Google Scholar] [CrossRef]
  30. Tedim, F.; Samora-Arvela, A.; Aranha, J.; Coimbra, C.; Correia, F.; Pinto, D.M. Bridging knowledge gaps on the role of spatial planning in wildfire risk reduction: Insights from Portugal. Int. J. Wildland Fire 2023, 32, 403–416. [Google Scholar] [CrossRef]
  31. Bergonse, R.; Oliveira, S.; Santos, P.; Zêzere, J. Wildfire Risk Levels at the Local Scale: Assessing the Relative Influence of Hazard, Exposure, and Social Vulnerability. Fire 2022, 5, 166. [Google Scholar] [CrossRef]
  32. Ellis, T.M.; Bowman, D.M.J.S.; Jain, P.; Flannigan, M.D.; Williamson, G.J. Global increase in wildfire risk due to climate-driven declines in fuel moisture. Glob. Change Biol. 2022, 28, 1544–1559. [Google Scholar] [CrossRef]
  33. Mitchell, H.; Gwynne, S.; Ronchi, E.; Kalogeropoulos, N.; Rein, G. Integrating wildfire spread and evacuation times to design safe triggers: Application to two rural communities using PERIL model. Saf. Sci. 2023, 157, 105914. [Google Scholar] [CrossRef]
  34. Ager, A.A.; Day, M.A.; Palaiologou, P.; Houtman, R.M.; Ringo, C.; Evers, C.R. Cross-Boundary Wildfire and Community Exposure: A Framework and Application in the Western U.S.; Technical Report RMRS-GTR-392; U.S. Department of Agriculture, Forest Service, Rocky Mountain Research Station: Fort Collins, CO, USA, 2019. [CrossRef]
  35. Bakhshaii, A.; Johnson, E.A. A review of a new generation of wildfire–atmosphere modeling. Can. J. For. Res. 2019, 49, 565–574. [Google Scholar] [CrossRef]
  36. Albini, F.A. Estimating Wildfire Behavior and Effects; General Technical Report INT-30; USDA Forest Service, Intermountain Forest and Range Experiment Station: Ogden, UT, USA, 1976.
  37. Van Wagner, C. Calculations on forest fire spread by flame radiation; Departmental Publication 1185; Government of Canada, Department of Forestry and Rural Development, Petawawa Forest Experiment Station: Chalk River, ON, USA, 1967. [Google Scholar]
  38. Sullivan, A.L. Wildland surface fire spread modelling, 1990–2007. 1: Physical and quasi-physical models. Int. J. Wildland Fire 2009, 18, 349–368. [Google Scholar] [CrossRef]
  39. Sullivan, A.L. Wildland surface fire spread modelling, 1990–2007. 3: Simulation and mathematical analogue models. Int. J. Wildland Fire 2009, 18, 387–403. [Google Scholar] [CrossRef]
  40. Sullivan, A.L. Wildland surface fire spread modelling, 1990–2007. 2: Empirical and quasi-empirical models. Int. J. Wildland Fire 2009, 18, 369–386. [Google Scholar] [CrossRef]
  41. Perry, G.L. Current approaches to modelling the spread of wildland fire: A review. Prog. Phys. Geogr. Earth Environ. 1998, 22, 222–245. [Google Scholar] [CrossRef]
  42. Ager, A.; Finney, M. Application of wildfire simulation models for risk analysis. In Proceedings of the EGU General Assembly Conference Abstracts, Vienna, Austria, 19–24 April 2009; p. 5489. [Google Scholar]
  43. Finney, M. FARSITE: Fire Area Simulator-Model Development and Evaluation; Research Paper RMRS-RP-4, Revised 2004; U.S. Department of Agriculture, Forest Service, Rocky Mountain Research Station: Ogden, UT, USA, 1998.
  44. Patton, E.; Coen, J. WRF-Fire: A coupled atmosphere–fire module for WRF. In Proceedings of the The 5th WRF/14th MM5 Users’ Workshop, Boulder, CO, USA, 22–25 June 2004; pp. 221–223. [Google Scholar]
  45. Coen, J.L.; Douglas, C.C. Computational Modeling of Large Wildfires: A Roadmap. In Proceedings of the 2010 Ninth International Symposium on Distributed Computing and Applications to Business, Engineering and Science, Hong Kong, China, 10–12 August 2010; pp. 113–117. [Google Scholar] [CrossRef]
  46. Beverly, J.L.; McLoughlin, N.; Chapman, E. A simple metric of landscape fire exposure. Landsc. Ecol. 2021, 36, 785–801. [Google Scholar] [CrossRef]
  47. Elhami-Khorasani, N.; Ebrahimian, H.; Buja, L.; Cutter, S.L.; Kosovic, B.; Lareau, N.; Meacham, B.J.; Rowell, E.; Taciroglu, E.; Thompson, M.P.; et al. Conceptualizing a probabilistic risk and loss assessment framework for wildfires. Nat. Hazards 2022, 114, 1153–1169. [Google Scholar] [CrossRef]
  48. Scott, J.H.; Thompson, M.P.; Calkin, D.E. A Wildfire Risk Assessment Framework for Land and Resource Management; Technical Report RMRS-GTR-315; US Department of Agriculture, Forest Service, Rocky Mountain Research Station: Ogden, UT, USA, 2013; 83p.
  49. Linn, R.; Goodrick, S.; Brambilla, S.; Brown, M.; Middleton, R.; O’Brien, J.; Hiers, J. QUIC-fire: A fast-running simulation tool for prescribed fire planning. Environ. Model. Softw. 2020, 125, 104616. [Google Scholar] [CrossRef]
  50. Matey, Y.; de Callafon, R.; Altintas, I. Optimizing Prescribed Burn Risk Management: A Computational and Economic Modeling Approach Using QUIC FIRE Simulations. In Proceedings of the Computational Science— ICCS 2024: 24th International Conference, Malaga, Spain, 2–4 July 2024; Franco, L., de Mulatier, C., Paszynski, M., Krzhizhanovskaya, V.V., Dongarra, J.J., Sloot, P.M.A., Eds.; Springer: Cham, Switzerland, 2024; pp. 266–280. [Google Scholar]
  51. Bar Massada, A.; Radeloff, V.C.; Stewart, S.I.; Hawbaker, T.J. Wildfire risk in the wildland–urban interface: A simulation study in northwestern Wisconsin. For. Ecol. Manag. 2009, 258, 1990–1999. [Google Scholar] [CrossRef]
  52. Korená Hillayová, M.; Holécy, J.; Korený, L.; Škvarenina, J. Reducing the negative impact of wildfire disasters through multi-scenario risk analysis of land investment. Prog. Disaster Sci. 2024, 23, 100359. [Google Scholar] [CrossRef]
  53. Alcasena, F.J.; Salis, M.; Ager, A.A.; Castell, R.; Vega-García, C. Assessing Wildland Fire Risk Transmission to Communities in Northern Spain. Forests 2017, 8, 30. [Google Scholar] [CrossRef]
  54. CAL FIRE. Fire Hazard Severity Zones. 2023. Available online: https://osfm.fire.ca.gov/what-we-do/community-wildfire-preparedness-and-mitigation/fire-hazard-severity-zones (accessed on 22 July 2025).
  55. Microsoft. USBuildingFootprints. 2024. Available online: https://github.com/Microsoft/USBuildingFootprints (accessed on 22 May 2025).
  56. Suzuki, S.; Abe, K. Topological Structural Analysis of Digitized Binary Images by Border Following. Comput. Vision Graph. Image Process. 1985, 30, 32–46. [Google Scholar] [CrossRef]
  57. Shimrat, M. Algorithm 112: Position of point relative to polygon. Commun. ACM 1962, 5, 434. [Google Scholar] [CrossRef]
  58. LANDFIRE Program. Existing Vegetation Type Layer, LANDFIRE 2.0.0; U.S. Department of the Interior, Geological Survey, and U.S. Department of Agriculture. 2020. Available online: http://www.landfire.gov/viewer (accessed on 18 April 2025).
  59. Dye, A.W.; Kim, J.B.; Riley, K.L. Spatial heterogeneity of winds during Santa Ana and non-Santa Ana wildfires in Southern California with implications for fire risk modeling. Heliyon 2020, 6, e04159. [Google Scholar] [CrossRef]
  60. Miller, N.L.; Schlegel, N.J. Climate change projected fire weather sensitivity: California Santa Ana wind occurrence. Geophys. Res. Lett. 2006, 33, L15711. [Google Scholar] [CrossRef]
  61. Gallagher, M.R.; Cope, Z.; Giron, D.R.; Skowronski, N.S.; Raynor, T.; Gerber, T.; Linn, R.R.; Hiers, J.K. Reconstruction of the Spring Hill Wildfire and Exploration of Alternate Management Scenarios Using QUIC-Fire. Fire 2021, 4, 72. [Google Scholar] [CrossRef]
  62. Tymstra, C.; Bryce, R.; Wotton, B.; Taylor, S.; Armitage, O. Development and Structure of Prometheus: The Canadian Wildland Fire Growth Simulation Model; Information Report NOR-X-417; Natural Resources Canada, Canadian Forest Service, Northern Forestry Centre: Edmonton, AB, Canada, 2010. [Google Scholar]
  63. Papadopoulos, G.; Pavlidou, F. A Comparative Review on Wildfire Simulators. IEEE Syst. J. 2011, 5, 233–243. [Google Scholar] [CrossRef]
  64. Linn, R.; Harlow, F. FIRETEC: A Transport Description of Wildfire Behavior; Los Alamos National Lab.: Los Alamos, MN, USA, 1997. [CrossRef]
  65. Coen, J.; Cameron, M.; Michalakes, J.; Patton, E.; Riggan, P.; Yedinak, K. WRF-Fire: Coupled Weather–Wildland Fire Modeling with the Weather Research and Forecasting Model. J. Appl. Meteorol. Climatol. 2013, 52, 16–38. [Google Scholar] [CrossRef]
  66. Pardyjak, E.; Brown, M. QUIC-URB v. 1.1: Theory and User’s Guide; Los Alamos National Laboratory: Los Alamos, NM, USA, 2003.
  67. Singh, B.; Hansen, B.; Brown, M.; Pardyjak, E. Evaluation of the QUIC-URB fast response urban wind model for a cubical building array and wide building street canyon. Environ. Fluid Mech. 2008, 8, 281–312. [Google Scholar] [CrossRef]
  68. Achtemeier, G. Field validation of a free-agent cellular automata model of fire spread with fire–atmosphere coupling. Int. J. Wildland Fire 2012, 22, 148–156. [Google Scholar] [CrossRef]
  69. Achtemeier, G.; Goodrick, S.; Liu, Y. Modeling multiple-core updraft plume rise for an aerial ignition prescribed burn by coupling Daysmoke with a cellular automata fire model. Atmosphere 2012, 3, 352–376. [Google Scholar] [CrossRef]
  70. National Wildfire Coordinating Group (NWCG) Fuels Management Committee. Fire Line Production Rate Tables; 2014; Originally published in *Wildland Fire Incident Management Field Guide, PMS 210* (2014; discontinued 2021). Available online: https://www.nwcg.gov/committee/fuels-management-committee (accessed on 23 July 2025).
  71. International Association of Fire Fighters (IAFF). Summary Sheet: NFPA 1710 Standard. 2021. Available online: https://www.iaff.org/wp-content/uploads/Departments/Fire_EMS_Department/30541_Summary_Sheet_NFPA_1710_standard.pdf (accessed on 23 July 2025).
  72. Eggleston, J. Using Initial Fire Attack Evolutions to Evaluate a Fire Fighting Team’s Effectiveness; Technical Report; National Fire Academy: Franklin, VA, USA, 1999.
  73. Rahn, M. Initial Attack Effectiveness: Wildfire Staffing Study. In California Wildfire Staffing Study; Technical Report Wildfire Research Report No. 2; San Diego State University: San Diego, CA, USA, 2010; Available online: https://www.iaff.org/wp-content/uploads/2019/05/Initial-Attack-Effectiveness-Study.pdf (accessed on 23 July 2025).
  74. Jeremy, F.; Paul, M. Efficient Initial Attacks: Analysis of Capacity and Funding Provides Insights to Wildfire Protection Planning; Science Findings 164; Department of Agriculture, Forest Service, Pacific Northwest Research Station: Portland, OR, USA, 2014; 6p.
  75. Syphard, A.D.; Brennan, T.J.; Keeley, J.E. The role of defensible space for residential structure protection during wildfires. Int. J. Wildland Fire 2014, 23, 1165–1175. [Google Scholar] [CrossRef]
  76. Wadhwani, R.; Sutherland, D.; Moinuddin, K. Simulated transport of short-range embers in an idealised bushfire. In Proceedings of the 6th International Fire Behavior and Fuels Conference, Sydney, Australia, 29 April–3 May 2019. [Google Scholar]
Figure 1. Illustration of two fire spread scenarios from an ignition block I x , y . Left: The fire breaches the community boundary U . In this case, the spatial extent of the boundary impacted by the fire is denoted by L c ( I x , y ) , and the time at which the fire first breaches the boundary is defined as T p . Right: The fire does not reach the community boundary. In this case, the minimum distance between the fire front and the community boundary at the end of the simulation is shown as D min .
Fire 08 00377 g001
Figure 2. WUI-BTI operational workflow. Inputs (left) are processed through five steps—domain setup, simulations, scoring, outputs, and benchmarking—to generate products (maps, lists, shapefiles). The framework is simulator-agnostic, with credibility conditional on the chosen fire-spread engine; products are precomputed for routine agency use.
Fire 08 00377 g002
Figure 3. WUI-BTI framework application area: (left) Palisades Fire Station 69 jurisdictional boundary in the WUI, and (right) simulation domain selected for scenario-based analysis.
Fire 08 00377 g003
Figure 4. Fuel characteristics across the simulation domain G derived from the Landfire dataset. The subplots display surface-level spatial variation in fuel density (kg/m2), fuel height (meters), fuel moisture content (percent), and topography (meters).
Fire 08 00377 g004
Figure 5. Prospective fire amplification sites across the domain with 457 ignition blocks I x , y I of size n = 20 cells labeled with an index for reference. Urban zones (U) are indicated in yellow while the rest is wildland.
Fire 08 00377 g005
Figure 6. Sensitivity analysis of model parameters under ± 25 % perturbations. The left panel shows score sensitivity, where β 2 exhibits the largest median change in absolute scores. The right panel shows rank sensitivity, where both β 1 and β 2 display wide 10th–90th percentile ranges, indicating strong influence on rank displacement. In contrast, slope parameters ( α 1 , α 2 , α 3 ) and the non-breach midpoint ( β 3 ) show negligible sensitivity, confirming that model stability is primarily governed by the breach-case midpoints.
Fire 08 00377 g006
Figure 7. WUI-BTI Index visualization across the simulation domain. Grid colors represent WUI-BTI scores, red indicates high-threat blocks (FAS), and off-white indicates the lowest. The blue line denotes the community boundary.
Fire 08 00377 g007
Figure 8. Benchmark comparison of hazard classification and boundary-threat characterization for the study domain. Left: CAL FIRE Fire Hazard Severity Zones (FHSZ), a regional hazard classification (e.g., Very High) that provides broad context but is not scenario-specific. Right: WUI-BTI boundary-threat surface under standardized meteorology, ranking ignition blocks I x , y by their scenario-specific potential to compromise the community boundary U .
Fire 08 00377 g008
Table 1. Operational inputs and outputs for WUI-BTI.
ItemContentFormat/Notes
Fuels/vegetationLANDFIRE or equivalentRaster (GeoTIFF)
TopographyDEMRaster (GeoTIFF)
Built environmentBuildings/roads maskVector/raster (SHP/GeoTIFF)
BoundaryCommunity polygon UVector (SHP/GeoPackage)
MeteorologyStandardized severe-weatherConfig (YAML/JSON)
Grid setupResolution r, domain GConfig + CRS
Ignition blocksEcological validity maskRaster (GeoTIFF)
Boundary-threat surfaceRanked outputRaster (GeoTIFF)
Top-k blocksPrioritized ignition listCSV (block ID, score, metrics)
FAS setHigh-threat blocksVector (SHP)/CSV
BenchmarkingARF, ring enrichmentTable (PDF/CSV)
Table 2. WUI-BTI parameters for case study.
ParameterMeaningSuggested Value
α 1 Steepness for breach size influence0.02
β 1 Midpoint for breach size r . L c (in meters)200
α 2 Steepness for breach timing influence0.005
β 2 Midpoint for breach timing T p (in seconds)900
α 3 Steepness for minimum approach distance influence0.02
β 3 Midpoint for r . D min (in meters)250
Table 3. Simulation outputs and WUI-BTI values for selected ignition blocks I x , y .
Block ID I x , y Scenario T p (s) r . L c (m) r . D min (m)WUI-BTI
I 640 , 200 Breach6021924.97
I 580 , 260 No Breach481.98
I 380 , 380 Breach9601042.61
I 620 , 660 No Breach2631.001
I 480 , 400 Breach1801283.35
Table 4. Within-domain benchmarking across prioritized ignition block fractions. EF values are use/availability ratios by ring; ARF is the area reduction factor.
p = 0.10 p = 0.20 p = 0.25
Area of I p (km2)0.41830.83661.0457
ARF (×)10.005.004.00
Median dist. (m)117.6164.9169.7
EF 0–250 m1.8601.5201.433
EF 250–500 m0.3571.2821.425
EF 500–750 m0.0000.0160.141
Disclaimer/Publisher’s Note: The statements, opinions and data contained in all publications are solely those of the individual author(s) and contributor(s) and not of MDPI and/or the editor(s). MDPI and/or the editor(s) disclaim responsibility for any injury to people or property resulting from any ideas, methods, instructions or products referred to in the content.