Article

Effects of Fuel Removal on the Flammability of Surface Fuels in Betula platyphylla in the Wildland–Urban Interface

1
Key Laboratory of Sustainable Forest Ecosystem Management-Ministry of Education, Northern Forest Fire Management Key Laboratory of State Forestry and Grassland Administration, College of Forestry, Northeast Forestry University, Harbin 150040, China
2
Key Laboratory of Forest Protection of National Forestry and Grassland Administration, Ecology and Nature Conservation Institute, Chinese Academy of Forestry, Beijing 100091, China
*
Author to whom correspondence should be addressed.
These authors contributed equally to this work.
Fire 2024, 7(7), 261; https://doi.org/10.3390/fire7070261
Submission received: 26 June 2024 / Revised: 18 July 2024 / Accepted: 20 July 2024 / Published: 22 July 2024
(This article belongs to the Special Issue Forest Fuel Treatment and Fire Risk Assessment)

Abstract

:
This paper aimed to provide technical support for fuel management by exploring different strengths of fuel removal on the physical and chemical properties and flammability of Betula platyphylla forests in the wildland–urban interface. After investigating the northeastern region during the forest fire prevention period in May 2023, a typical WUI area was selected, and three different treatment strengths, combined with a control, were set up to carry out indoor and outdoor experiments for 27 weeks. Compared with previous studies, this study mainly investigated and analyzed the dynamic changes in the physical and chemical properties and fuel flammability after different intensities of treatments on a time scale. By processing and analyzing the data, the following results were obtained. Significant differences existed in the fuel loading of different time-lag fuels over time (p < 0.05). The ash and ignition point of 1 h time-lag fuel after different treatment intensities generally increased first and then decreased, and the higher heat value and ash-free calorific value generally decreased first and then increased. The physical and chemical properties of 10 h and 100 h time-lag fuel fluctuated with time, but the overall change was insignificant. The indicator that had the greatest impact on the combustion comprehensive score for different time-lag fuels was fuel loading. The change in the flammability of dead surface fuel with time varied significantly, and different treatment intensities effectively reduced the fuel’s flammability. The reduction effects, presented in descending order, were as follows: medium-strength treatment > low-strength treatment > high-strength treatment > control check. In conclusion, different treatment intensities have significant effects on the flammability of the fuel, and the medium-strength treatment has the best effect. Considering the ecological and economic benefits, adopting the medium-strength treatment for the WUI to regulate the fuel is recommended.

1. Introduction

Forest fires are huge threats to forest resources, the ecological environment, and people’s lives and property [1]. In particular, there is currently no effective method to control heavy and large-scale forest fires. With the acceleration of global urbanization, the scale of the wildland–urban interface (WUI) is gradually expanding. The WUI mainly includes two types: the intermix WUI and the interface WUI [2]. These two types of WUI areas have increased fire risk due to factors such as the complexity and quantity of fuel. If a fire occurs, the rescue operation also faces many challenges; a large number of people, the density of buildings, the proximity to forests, and the complexity of the fuel types in the area make it more difficult to control the fire. On 8 August 2023, a shrub fire in Lahaina, a tourist resort in the U.S. state of Maui, Hawaii, combined with high temperatures and high winds, killed at least 98 people and destroyed about 1800 buildings [3]. From 2005 to 2020, the total number of forest fires globally decreased by 10%. However, the proportion of WUI fires increased by 23% [4], and the continued growth of WUI fires represents a significant threat to the safety of human life and property, as well as to forest resources. Therefore, it is necessary to take appropriate measures to regulate fuel to reduce the risk of WUI fires and prevent forest fires. Meanwhile, fuel management is highly significant in reducing fire risk, protecting people’s lives, and maintaining ecological balance.
The occurrence of forest fires requires three elements: forest fuel, accelerants (oxygen), and a certain temperature [5], of which fuel is the only human-controllable factor. Fuel continues to accumulate, resulting in increased loadings, potential heat buildup, and fires that are difficult to extinguish [6]; therefore, aggressive fuel management can reduce the probability of an initial fire disaster, reduce the potential fire intensity, and mitigate potential threats to firefighters and forest resources from high-intensity fires. Fuel management refers to reducing the loadings of live and dead fuel, improving stand conditions, and reducing the forest fire intensity using prescribed burning, mechanical removal, forest tending, and other measures [7]. Chambers found that prescribed burning can reduce fuel in the long term [8], but the risk of plant invasion is higher and prone to disrupting the ecological balance [9]; Stottlemyer found that mechanical removal can reduce the heat released during combustion and reduce the fire intensity by removing coarse and aerial fuel [10,11], but it requires substantial human and material resources [12,13,14]. Fire retardants have been used to change the burning behavior of wildfires, decrease the fire intensity, and slow the fire’s advance. José found that flame retardants can reduce the flammability of fuel to a certain extent, but some of them cause negative effects on the environment [15,16]. The fuel-removal measures mainly include cutting weeds and shrubs on the surface of the forest, which can effectively reduce the effective fuel loadings on the surface [17] and reduce the probability of surface fire occurrence and fire intensity [18]. Compared with other methods, fuel removal can maintain the stability of the ecological balance and is not restricted by terrain conditions in the WUI [19]. Accordingly, fuel removal can be applied to the WUI. Meanwhile, compared with traditional forest fire suppression, the fuel-removal strategy can reduce the dependence on the personnel and equipment of the forest fire prevention professional team, reduce costs, and improve efficiency. Therefore, by implementing effective fuel-removal strategies, the ecological balance can be maintained, and the special resources for forest fire prevention can be saved under the premise of ensuring a reduction in the risk of forest fires in the WUI.
At present, the effectiveness of fuel treatment is mainly evaluated by indicators of potential fire behavior. The study by Hanmei showed that fuel loading decreased significantly in the treated stand, the fire behavior indicators were significantly lower than those in the control group, and no surface fire occurred after treatment [20]. The results found by Zong Xuezheng showed that the fire behavior indicators of the forest decreased significantly with the increase in treatment intensity [21], and Gao Min’s study showed that the medium-strength treatment had a significant effect on the characteristics of canopy fuel and the indicators of the potential fire behavior of the crown [22]. There are relatively few studies on the change in the flammability of combustibles with time. The flammability of fuel is not only an indicator used to measure the size of their combustion capacity but also plays a vital role in forest fire risk zoning, forest fire prediction, and firefighting tactics selection [23]. In order to formulate more scientific fuel-treatment measures, it is necessary to study the flammability of surface fuel [24]. Therefore, the study of flammability changes after different intensity treatments is conducive to a comprehensive understanding of the flammability dynamic change regulations of fuel.
The initial fire of a forest is generally surface fire, and its fuel base is surface fuel. Exploring the flammability of surface fuel has theoretical guiding significance for assessing forest fire risk, formulating fire prevention and control measures, and predicting fire severity [25]. Therefore, this study explored the dynamic changes in physical and chemical properties and the flammability of dead surface fuel after different removal-intensity treatments. The dead surface fuel of Betula platyphylla in a typical WUI was the research object, located in the Maoershan area. Under three different treatment intensities, the dynamic changes of the physical and chemical properties, heat per unit area, and the comprehensive combustion score of fuel with different time lags were analyzed. The applicability of fuel removal in the WUI was explored, which can provide technical and data support for establishing the basic theory system of fire prevention and control in the WUI.

2. Materials and Methods

The study area is located in Maoershan Experimental Forest Farm of Northeast Forestry University (45°15′~45°29′ N, 127°23′~127°43′ E). The forest is located northwest of Shangzhi City, Heilongjiang Province, with a total area of 26,000 hm2. It is a continental monsoon climate, with an average annual precipitation of 723 mm and an average annual temperature of 3 °C. The main vegetation in this area is a typical natural secondary forest in the eastern mountainous area of Northeast China. The main tree species include Betula platyphylla, Fraxinus mandshurica, Populus davidiana, Quercus mongolica, Pinus koraiensis, and Juglans mandshurica. Betula platyphylla is mainly located in Northeast China, North China, and other places. This is also a typical plant community in the northeast forest area of China. In recent years, the utilization of forest resources in the northeast forest area has promoted the intermingling of forests and towns, forming a large WUI area. The WUI is a special area containing natural landscapes such as forests and in proximity to urban settlements. In such areas, human activities are closely intertwined with the natural environment, and the fire risk is accordingly increased. The area selected for this study is a typical WUI area with a representative major tree species dominated by Betula platyphylla. This study aimed to investigate the effects of different treatment intensities on the physical and chemical properties and flammability of the surface combustibles of Betula platyphylla in the study area in order to find the most suitable way to manage the surface fuel of Betula platyphylla, to decrease its flammability, reduce the occurrence of fires in the WUI, and lower the intensity of potential forest fires [26].

2.1. Field Experiments

2.1.1. Set Sample Plot

In the spring fire season of May 2023, four 20 × 20 m plots were set up in the representative boundary area of the Maoershan Experimental Forest Farm of Northeast Forestry University, which were assigned as control check (CK), low-strength treatment (LST), medium-strength treatment (MST), and high-strength treatment (HST). Actual photographs of the four sample plots are shown in Figure 1.

2.1.2. Forest Characterization Survey

The tree species composition and crown density of the stand were investigated in each plot, and each tree in the plot was tallied. The diameter at breast height (DBH) and the tree height of living and dead trees were measured, respectively. The specific values are shown in Table 1.

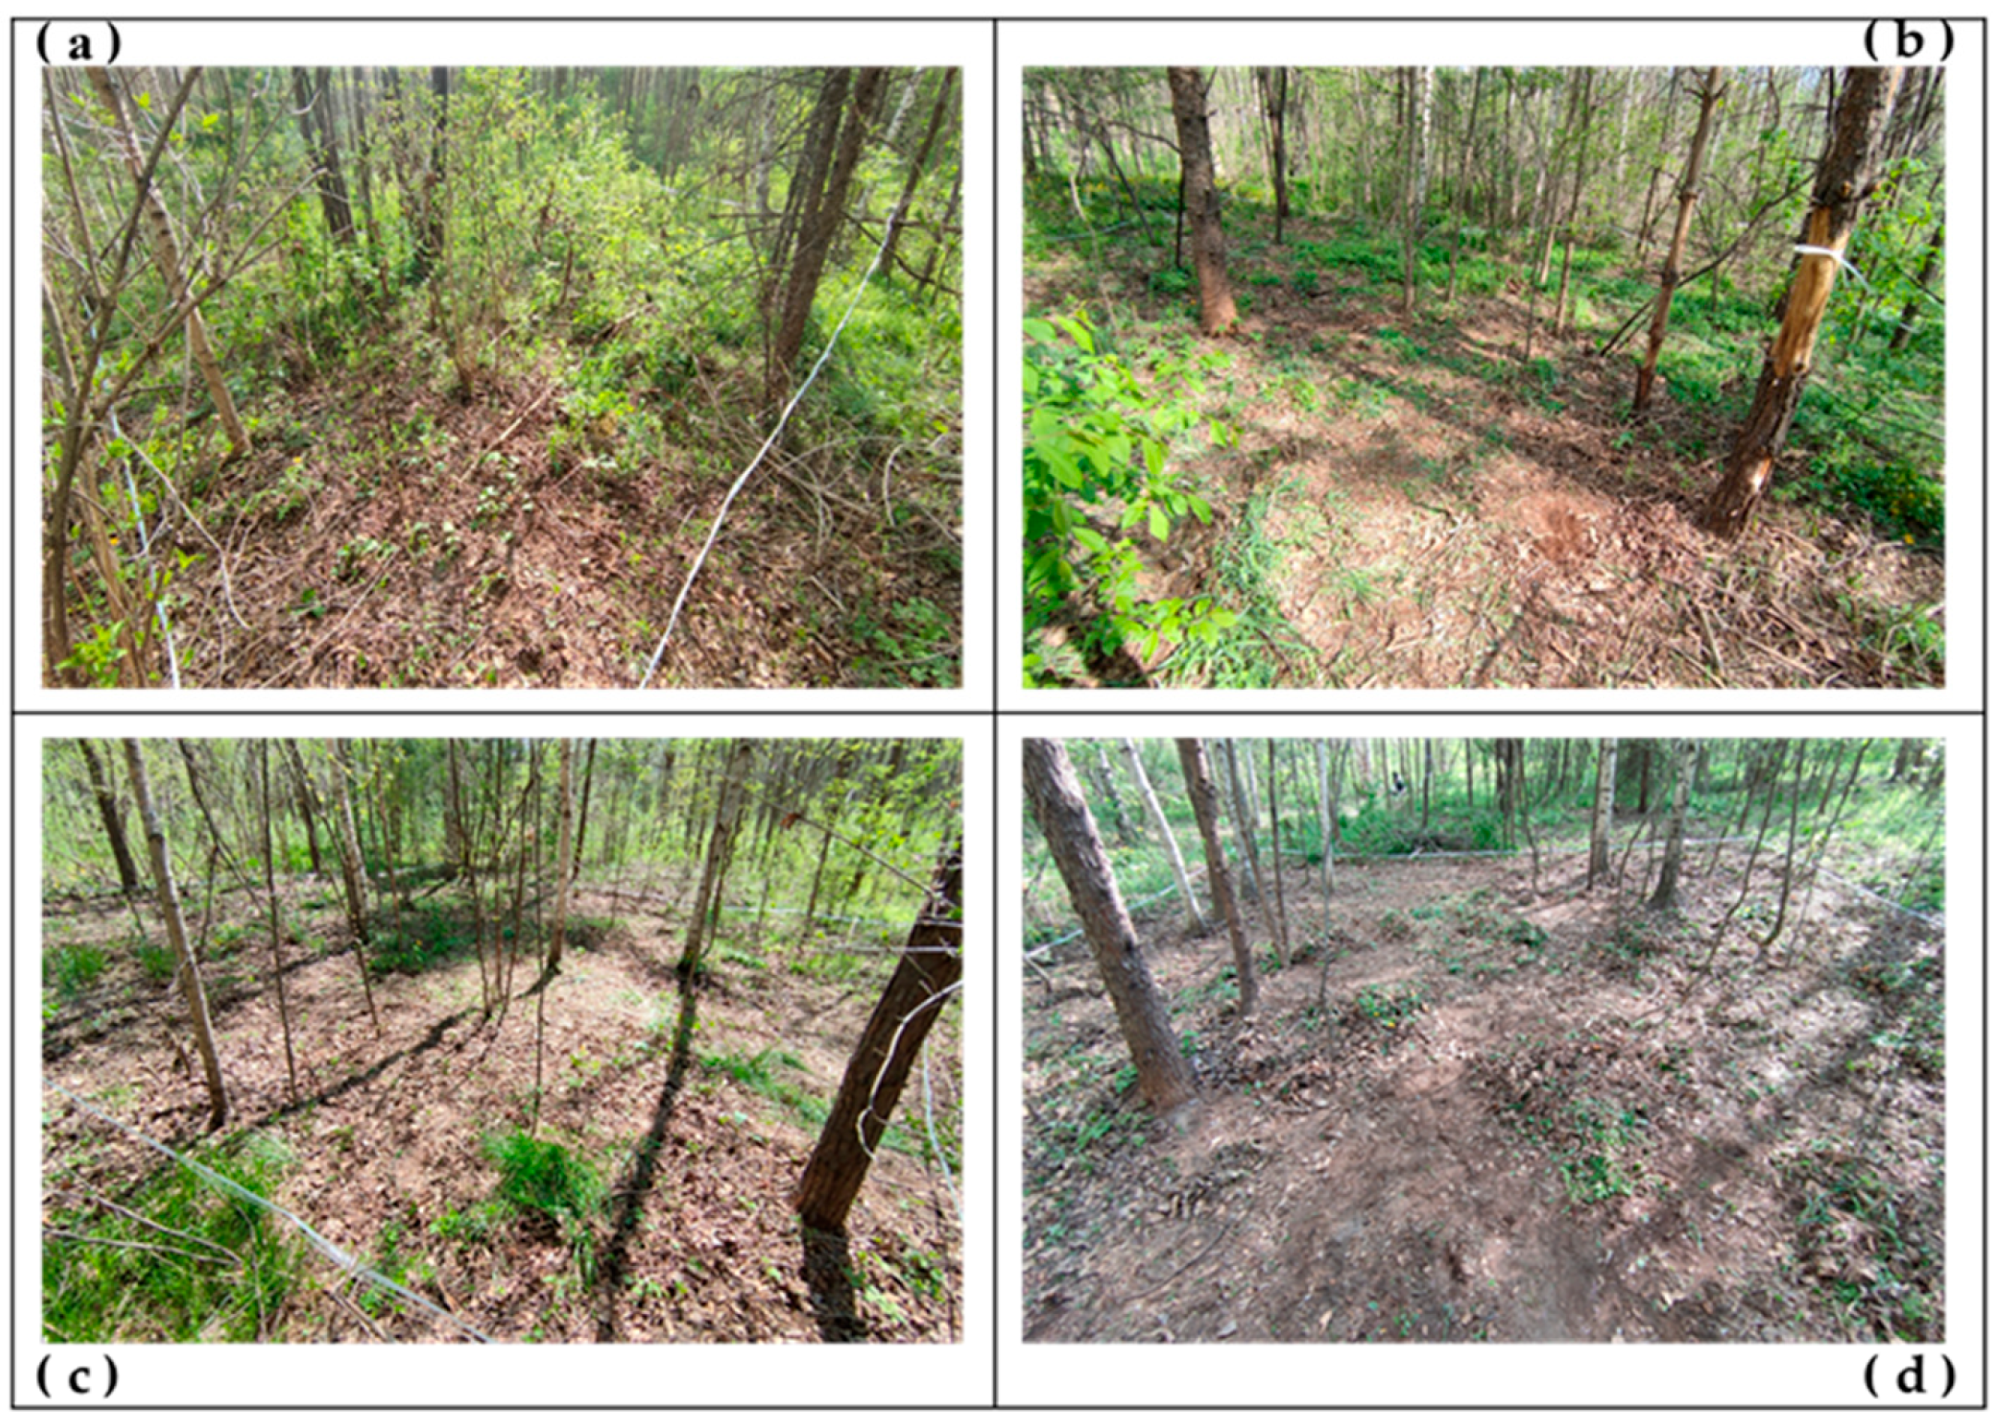
2.1.3. Fuel Treatment

Based on technical specifications of fire belts constructed by thinning in the northeast and inner Mongolia border areas (LYT 2799-2017), combined with relevant research [27] and stand conditions, three different treatment intensities of low, medium, and high were formulated, and plots were set up. The specific treatment measures are shown in Table 2.

2.1.4. Classification of Fuels

In the sample plots, 1 m × 1 m small sample squares were set up, and all dead surface combustibles were collected, weighed to determine the fresh weight, and classified according to the diameter of fuel in a 1 h time lag (branches with a diameter ≤ 0.64 cm, including upper and lower dead leaf fuel), 10 h time lag (0.64 cm < d ≤ 2.54 cm), and 100 h time lag (2.54 cm < d ≤ 7.62 cm) [28].

2.2. Laboratory Experiments

2.2.1. Calculation of Fuel Loading

The samples of fuel collected in the field were classified according to the time lag and placed in an oven at 105 °C for 24 h until the weight was constant. The dry weight of the samples was recorded, and the moisture content of the fuel was calculated to derive the loading of each type of surface fuel in the plot [29].
F M C = m H m D m D × 100 %
In the formula, FMC is the absolute moisture content of the fuel, %; mH is the fresh weight of the fuel (sample weight after sampling), g; and MD is the dry weight of the fuel (the weight of the sample after drying), g.
F = m F M C A
In the formula, F is the fuel loading, g·m−2; m is the weight of the fuel in the quadrat; and A is the area of the quadrat, m2.

2.2.2. Determination of Ash

The ash content (Ash%) is usually measured using the dry ashing method. To implement the method, the procedure is as follows: put the sample through 60-mesh sieves into a crucible, cover it with a lid to isolate the air, ash it at 500 °C in a JXL-620 intelligent integrated muffle furnace for 12 h, ensure it is completely ashed to constant weight, and subtract the weight of the crucible (the ash content of the sample) [30].
A % = m 3 m 1 m 2 m 1 × 100 %  
In the formula, m1 is the weight of the crucible, g; m2 is the weight of the crucible and sample before combustion, g; and m3 is the weight of the crucible and sample after combustion, g.

2.2.3. Determination of Higher Heating Value and Ash-Free Calorific Value

A microcomputer oxygen–nitrogen calorimeter, model XRY-1C, was used to measure the sample’s higher heating value (HHV). A total of 1 g of the dried sample was weighed and pressed into a block and then continued to dry until the weight was constant to ensure the moisture was completely removed. Then, the mass of the sample was accurately weighed (to the nearest 0.0001 g) using an analytical balance to determine its higher heating value [31]. Three replicates were used for each sample to obtain the average value. The unit used for the higher heating value and ash-free calorific value is KJ·g−1.
The ash-free calorific value (AFCV) is calculated as follows:
A F C V = H H V 1 A

2.2.4. Determination of the Ignition Point (IP)

After drying and grinding the sample through the sieve, take 0.1 g of the sample and 0.075 g of sodium nitrite (NaNO2), mix evenly, transfer to the test tube, and put into the XTRD-6 type ignition tester to determine the ignition point. The ignition point is displayed through the system platform of the ignition tester. Each sample was repeated 3 times to take the average value.

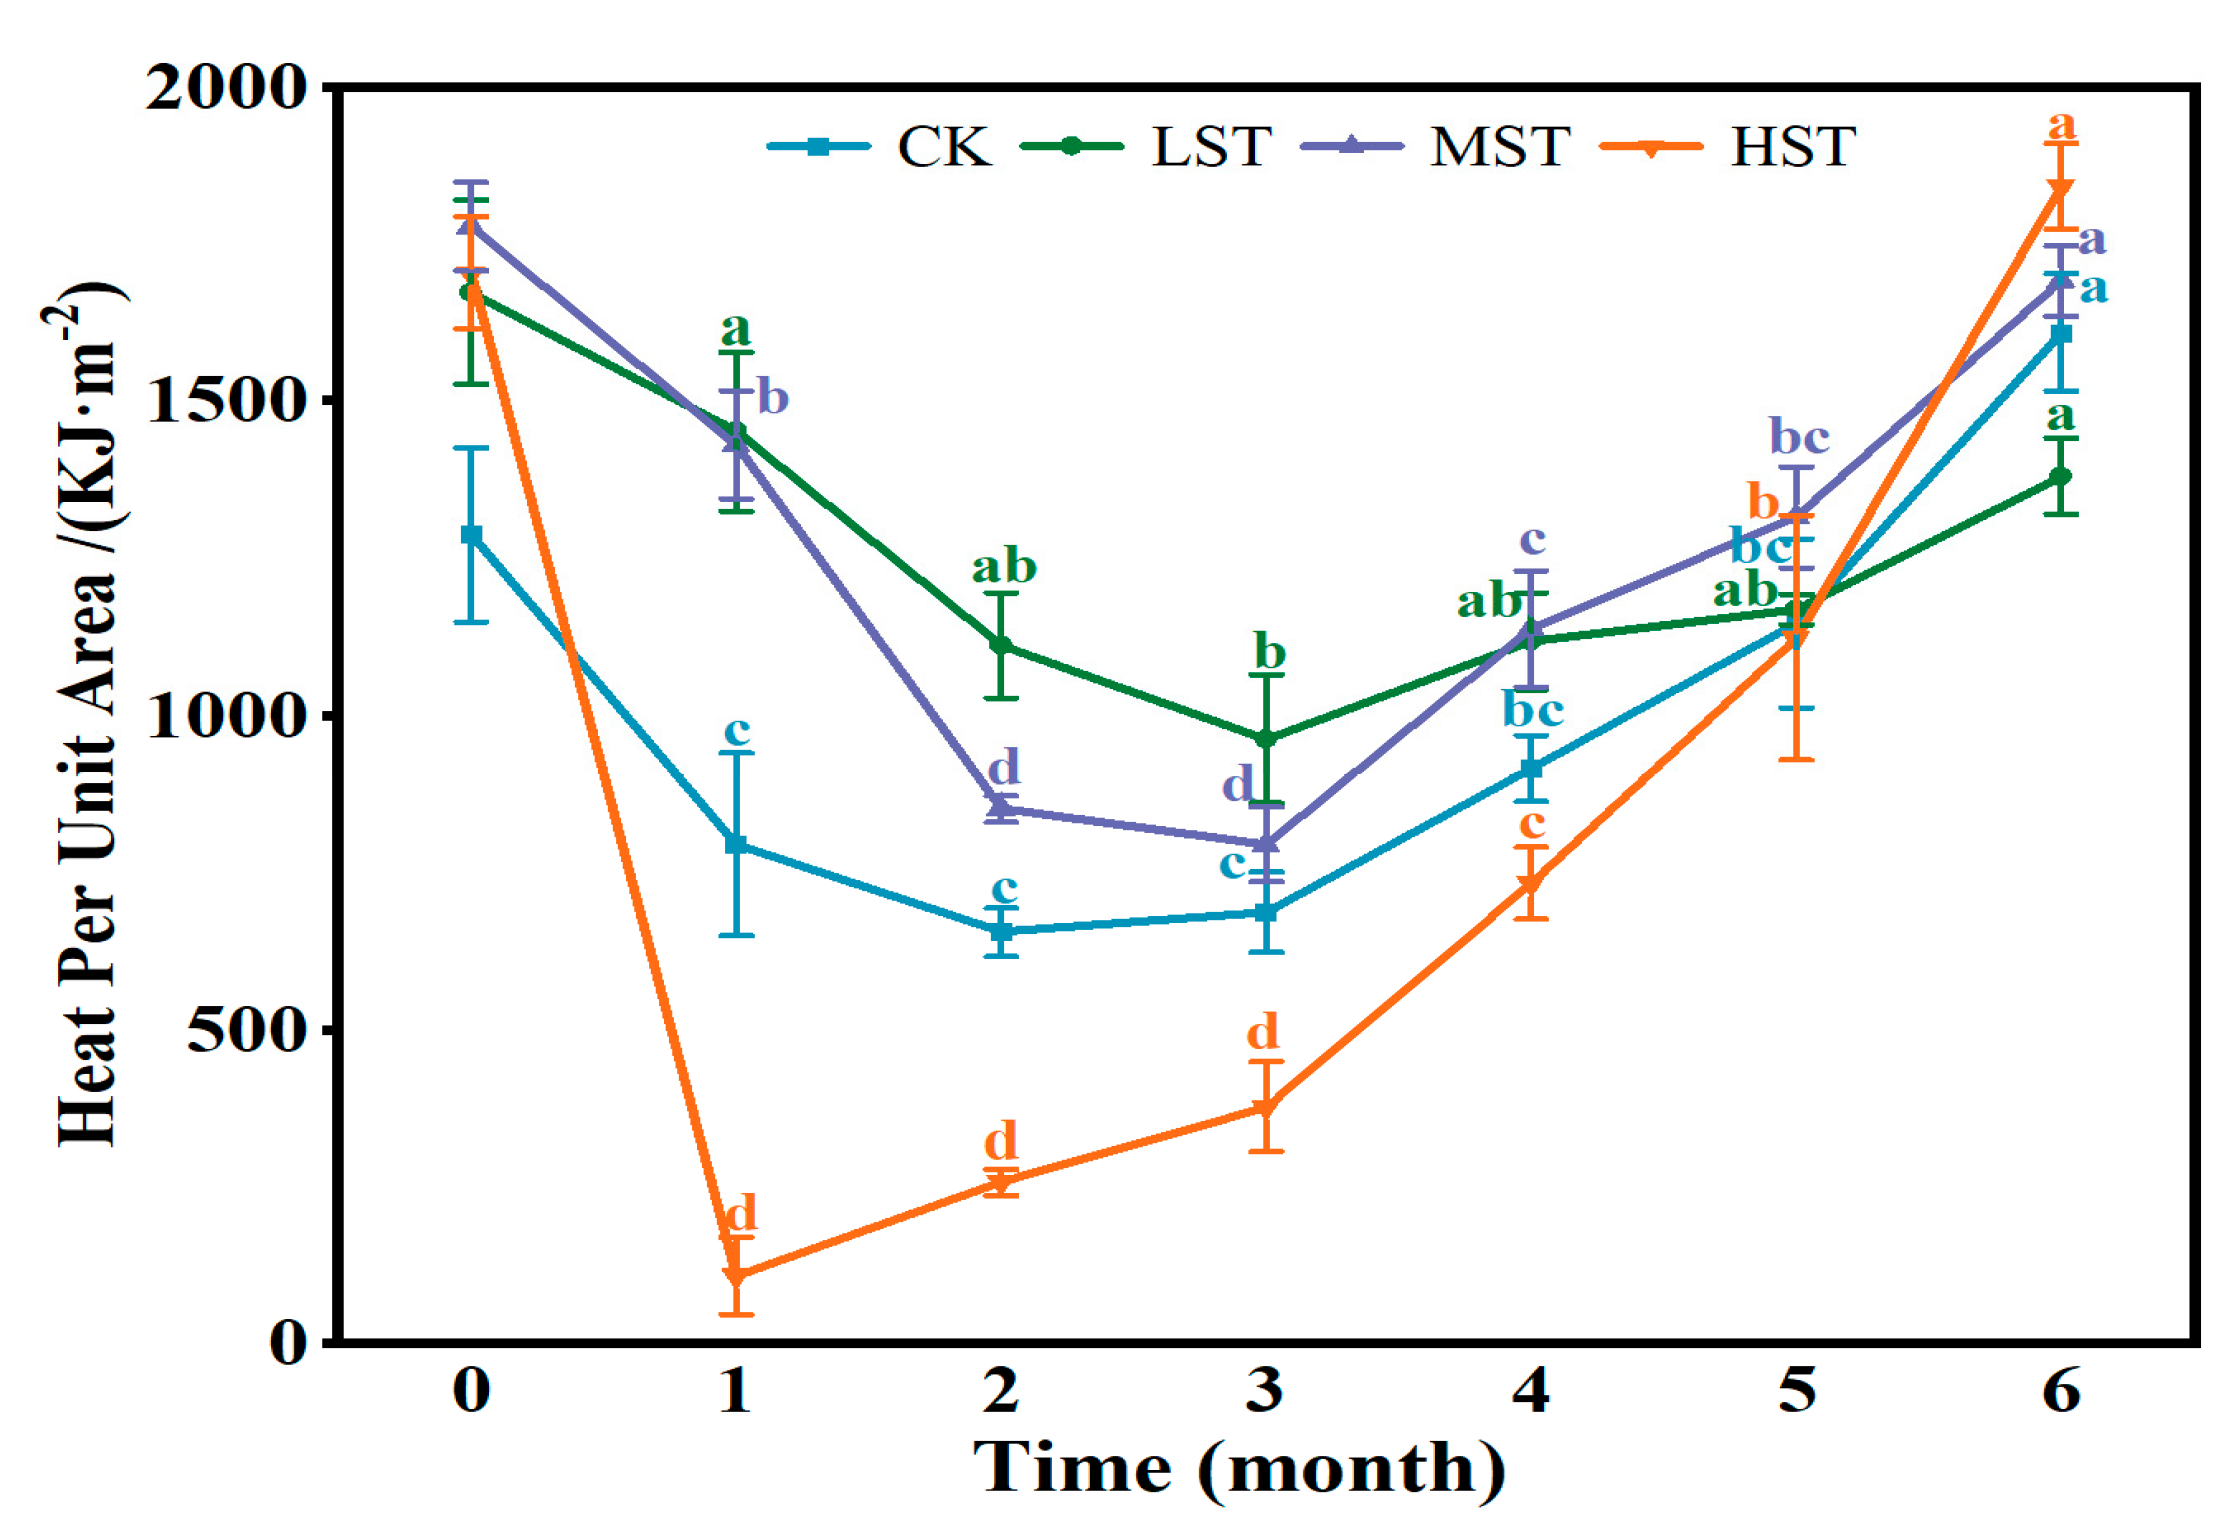
2.2.5. Calculation of Heat per Unit Area of Fuel

The heat per unit area refers to all the heat released from the complete combustion of fuel per unit area in an adiabatic condition (the product of a higher heating value and fuel loading). It can be used as a key indicator to evaluate the potential flammability of surface combustibles—that is, all the energy that may be released in an ideal condition. The calculation formula is as follows [32,33]:
P = F H
In the formula, P is the heat per unit area, KJ·m−2; F is the fuel loading; and H is the HHV.

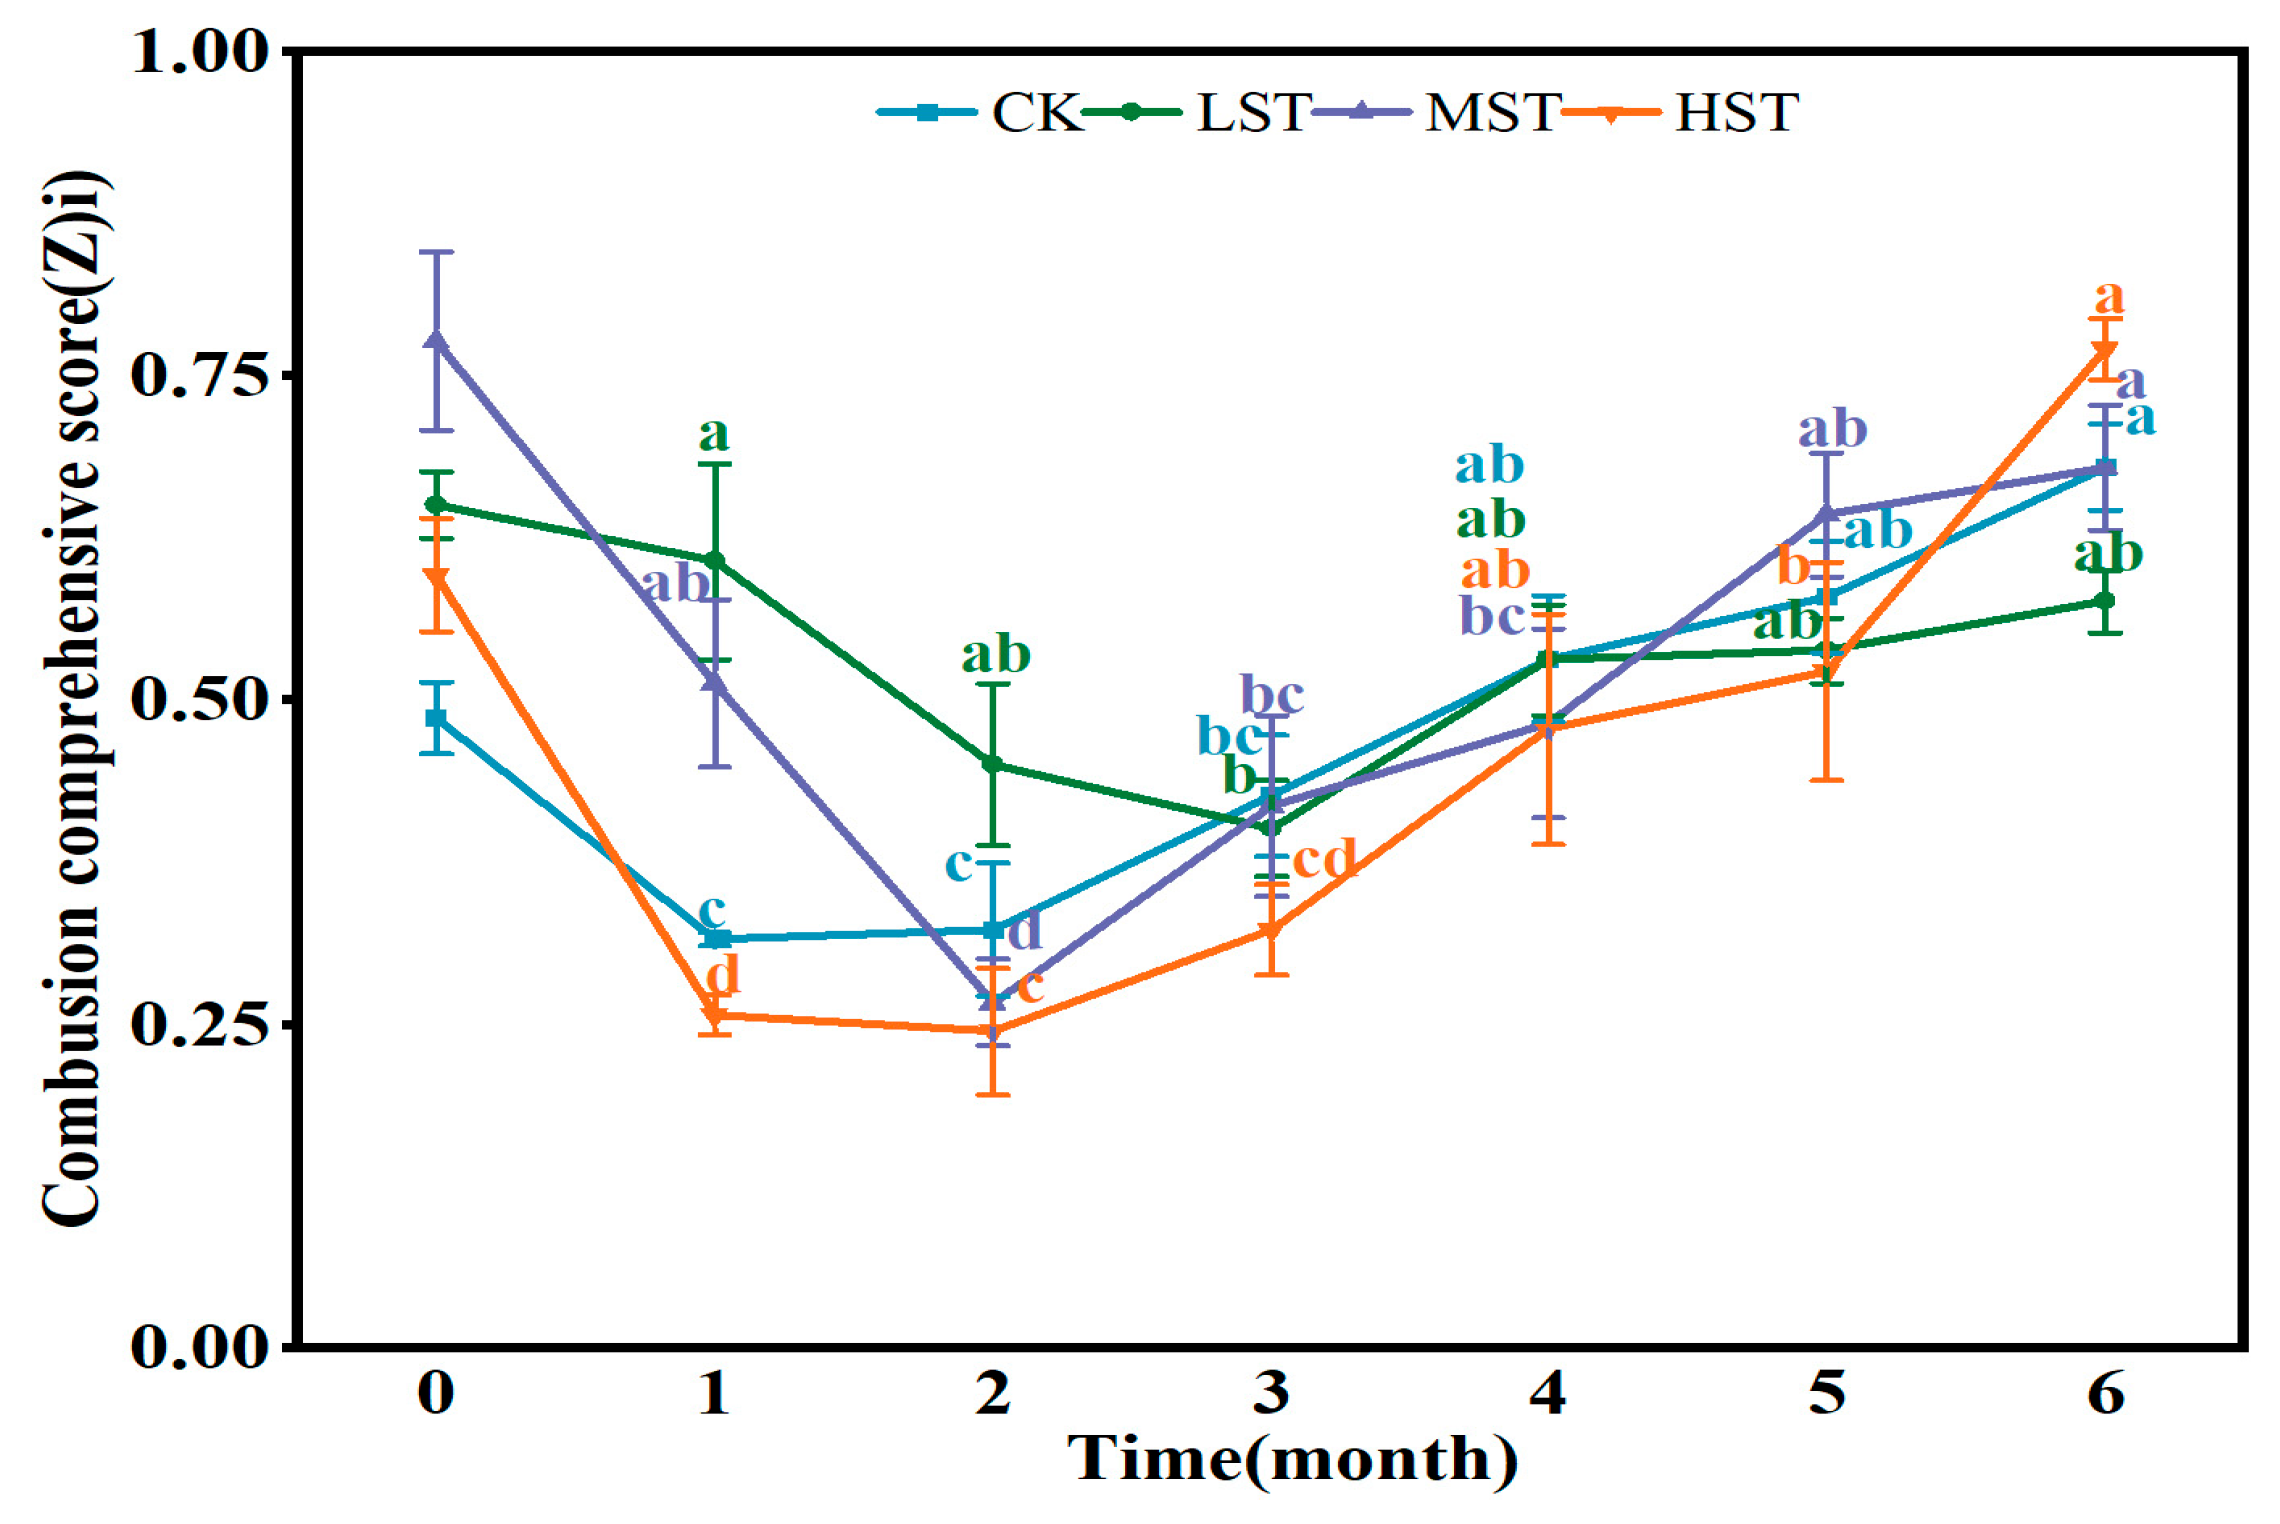
2.2.6. Calculation of Comprehensive Combustion Score

When the indicators are positively correlated with flammability, the data-standardization formula is constructed as shown in (6).
Y i j = x i j m i n x j / m a x x j m i n x j
When the indicators are negatively correlated with flammability, the data-standardization formula is constructed as shown in (7).
Y i j = m a x x j x i j / m a x x j m i n x j
In the formula, Yij are the data after standardization, max(xj) is the maximum value of the j index, and min(xj) is the minimum value of the j index.
Suppose that there are m samples and n evaluation indexes. The original judgment matrix R = (rij)m×n is formed, and the information entropy value and weight of the jth indicator are calculated as shown in Formulas (8)~(9):
p i j = r i j i = 1 m r i j e j = 1 l n m i = 1 m p i j l n p i j
ω j = 1 e j n j = 1 n e j
In the formula, i is the number of the fuel sample, i = 1,2,3…, m; j is the number of evaluation indicators, j = 1,2,3…, n; xij is the value of the jth indicator under the ith fuel sample; pij is the weight value of the jth evaluation indicator for the ith sample; ej is the information entropy value of the jth evaluation indicator; and ωj is the weight of the evaluation indicator j [34].
The formula for the comprehensive evaluation method is shown in (10).
Z i = j = 1 m ω j Y i j
In the formula, Zi is the comprehensive score of the ith fuel sample, ωj is the weight of the jth indicator, and m is the number of indicators.

2.3. Data Analysis

One-way ANOVA and least-significant difference (LSD) comparisons in SPSS27.0 software were used to analyze the differences of changes in the time scales of each indicator of different time-lag fuel under different treatment intensities. The entropy weight method (EWM) was used to determine the weights of each indicator. Then, the comprehensive evaluation method was utilized to calculate the total combustion comprehensive score of fuel. In order to eliminate the influence of different magnitudes on the results, the extreme value method was used to standardize the data; the entropy weight method weight calculation was carried out in MATLAB. The plotting was performed using origin 2021.

3. Results

In this study, six physical and chemical properties (fuel loading, ash, ignition point, higher heating value, ash-free calorific value, and heat per unit area) and the flammability of three kinds of fuels (1 h, 10 h, and 100 h time lags) in three treatment intensities (LST, MST, and HST) and control plots (CK) were compared and analyzed—the data were categorized in three or more groups, and the average value was taken—in order to explore the physical and chemical properties and flammability time-scale dynamic changes of dead surface fuel after fuel removal.

3.1. The Dynamic Changes in Physical and Chemical Properties of Fuel

As an important characteristic, the physical and chemical properties of fuel can directly reflect the changes of fuel over time. In this study, we mainly quantified the changes in the physical and chemical properties of dead fuel on the surface of Betula platyphylla in the WUI after treatment with different intensities, and the experimental results are shown in Figure 2 and Table 3, Table 4, Table 5, Table 6 and Table 7.
Fuel loading is one of the most important physical and chemical properties that directly affects the ignition rate, spreading speed, and fire intensity of forest fires [35,36]. Figure 2 shows the trend of fuel loading with time for 1 h, 10 h, and 100 h time-lag fuel after different treatment intensities. As can be seen in Figure 2, compared with the control, with the increase in time, the total fuel loading decreased for both low- and medium-strength treatments and increased less for high-strength treatment; the initial fuel loading of the control sample was 100.99 g·m−2, and the loading in the sixth month was 137.57 g·m−2, with an increase of 36.21%, which was significantly higher than that in other sample plots. With the change in time, the 1 h time-lag fuel loading after low- and medium-strength treatments decreased, 23.99 g·m−2 and 15.98 g·m−2, compared with that before being untreated, and the fuel loading of control and high-strength treatments increased, in which the fuel loading of the control sample plot was significantly increased (p < 0.05). The loading of 10 h time-lag fuel with different treatment strengths was the largest in the third–fourth months, with 25.54 g·m−2 in the control plot and 47.17 g·m−2 in the low-strength treatment, and significantly increased in the third and fourth months with the medium- and high-strength treatments, respectively (p < 0.05). The loading of 100 h time-lag fuel in the sample plot did not change significantly with time, and the initial loading was significantly increased by 8.37 g·m−2 with low-strength treatment compared with the initial loading six months after the treatment (p < 0.05). A comparison of the loadings between different treatment intensities on the time scale showed that the 1 h time-lag fuel loading of the four treatments differed significantly (p < 0.05) in months 1–4, with a smaller difference in the fifth month of loading; there was no significant difference in the 10 h time-lag fuel loading in months 4–5 (p > 0.05), and there was no significant difference in the 100 h time-lag fuel loading between the control and low-strength treatments.
The higher the ash content, the worse was the combustion performance of the fuel. As seen in Table 3, Table 4, Table 5, Table 6 and Table 7, the ash content of fuel with different time lags is a 1 h time lag > 10 h time lag > 100 h time lag. With the increase in time, the ash content of 1 h time-lag fuel in the control plot exhibited significant changes (p < 0.05), and the ash content of fuels with low-, medium- and high-strength treatments was reduced but not significantly different (p > 0.05), of which the ash content of fuel in the control plot had the largest reduction of 57.45%. The ash content of 1 h time-lag fuel with different treatment strengths differed in the first–second month (p < 0.05), and the difference gradually decreased with time. The 10 h and 100 h time-lag fuel had a significantly lower ash content than 1 h time-lag fuel; the ash content of the 10 h time-lag fuel did not change much in general, but they all had the largest content in the third–fifth months, which were 6.58%, 4.09%, 4.11%, and 5.80%, respectively. The overall change in the ash content of the 10 h and 100 h time-lag fuel after the four treatments was insignificant over time. In general, the ash content of the 1 h time-lag fuel showed a decreasing trend after 6 months of change, the ash content of the 10 h time-lag fuel showed an increasing trend with low-strength treatment, and the ash content of the 100 h time-lag fuel increased in the control plot and decreased with low-strength treatment.
The ignition point refers to the minimum temperature required to make the surface of the fuel catch fire and continue to burn for a certain period. The higher the ignition point, the less likely the fuel is to combust. Table 3, Table 4, Table 5 and Table 6 show no significant difference in the ignition point of 1 h time-lag fuel with low-, medium-, and high-strength treatments (p > 0.05), and the ignition point increases first and then decreases with time. The maximum ignition points in the first month after control and low-intensity treatment were 260.67 °C and 257.89 °C, respectively. The maximum ignition points in the fifth month after medium- and high-strength treatments were 260.92 °C and 260.17 °C, respectively. With the change in time, the ignition point of 10 h time-lag fuel decreased significantly with high-strength treatment (p < 0.05), and the minimum ignition point was 251.4 °C in the sixth month. The ignition points of fuel in the control plot and low- and medium-strength treatments reached the maximum in the sixth month, which were 256.86 °C, 255.53 °C, and 257.5 °C, respectively. The ignition points of 100 h time-lag fuel in the control sample plots increased significantly (p < 0.05), with an increase of 7.17 °C, and the change in the ignition point was not significant with low-strength treatment (p > 0.05).
The higher heating value directly affects the ignition temperature, spreading speed, and fire intensity of the fuel [37]. There is a highly significant difference between 1 h and 10 h time-lag fuel with the time change in the control sample plots (p < 0.01); there is no significant difference between different time-lag fuels with time change with low- and medium-strength treatments (p > 0.05), and there is a significant difference of 1 h time-lag fuel with time change with high-strength treatment (p < 0.05). In the first three months, there was a significant difference in the higher heating values of no treatment, low-, medium-, and high-strength treatments (p < 0.05), and in the fourth month, the difference in the heating values of the four treatments of the fuel became smaller. As can be seen in Table 3, Table 4, Table 5, Table 6 and Table 7, the higher heating value of 1 h time-lag fuel in the control plot and with low-strength treatments tended to increase with time, and the maximum higher heating value was 17.57 KJ·g−1 and 18.12 KJ·g−1 in the sixth month, while the higher heating value of medium- and high-strength treatments first decreased and then increased. The maximum heating value was 17.48 KJ·g−1 and 17.64 KJ·g−1 in the sixth month. The higher heating value of 10 h and 100 h time-lag fuel did not change significantly. The ash-free calorific value of fuel can more accurately reflect the energy contained in unit dry matter. The ash-free calorific value of 1 h time-lag fuel with control and low-strength treatment was consistent with the change trend of the higher heating value. The maximum ash-free calorific values in the sixth month were 19.12 KJ·g−1 and 19.36 KJ·g−1, respectively. The maximum ash-free calorific values in the second and fifth months with medium- and high-strength treatment was 19.19 KJ·g−1 and 19.92 KJ·g−1, respectively. The ash-free caloric value of the 10 h time-lag fuel in the control plot increased significantly (p < 0.01), and the maximum increase was 12.45% compared with other plots. The ash-free calorific value of 100 h time-lag fuel did not change much, fluctuating in the range of 17.24–18.58 KJ·g−1.
In forest combustion, heat is mainly transferred to the surrounding fuel by radiation. The heat per unit area can be used as a key indicator for evaluating the potential flammability of surface fuel, and the higher the heat per unit area, the greater the potential flammability. In this study, the heat per unit area, that is all the heat (higher heating value × fuel loading) released from fuel per unit area in the absolute dry state, is used to compare the potential heat released from surface fuel in the combustion process after different treatment intensities. The proportions of 1 h, 10 h, and 100 h time-lag fuel were calculated according to the fuel loading. Then, the heat per unit area was calculated for the four sample plots after different treatment intensities according to the proportions. Figure 3 mainly shows the trend of the heat per unit area of fuel with time in control, low-, medium-, and high-intensity sample plots after different treatment intensities. As shown in Figure 3, the heat per unit area of fuel showed a trend of decreasing and then increasing. The heat per unit area of the control plot reached a minimum of 654.75 KJ·m−2 in the second month, the heat per unit area reached a minimum of 962.55 KJ·m−2 and 793.91 KJ·m−2 in the third month with low- and medium-strength treatments, respectively; and the heat per unit area reached a minimum of 108.77 KJ·m−2 in the first month with high-strength treatment, which indicated that all the different treatment intensities effectively reduce the heat per unit area of surface fuel and decrease the potential flammability of the surface fuel. In the fifth month, the heat per unit area of the fuel in the control plot and with low- and high-strength treatments tended to be consistent, which was consistent with the change trend of the loading of 1 h time-lag fuel, so it was possible that the heat per unit area had a certain correlation with the fuel loading. The loading in the fifth month with medium-strength treatment was significantly higher than that of the other three treatments, and the heat per unit area was also relatively high. The figure shows that the heat per unit area of the fuel after different treatment strengths in the third month began to show a rising trend. Because the heat per unit area mainly considers the fuel loading and higher heating value, the reason for the rise may be due to the increase in fuel loading in the third month, and the rate of accumulation of the fuel loading is greater than the rate of decomposition, which leads to an increase in heat per unit area. After six months, the heat per unit area increased by 25.03 KJ·m−2, decreased by 17.47 KJ·m−2, decreased by 4.91 KJ·m−2, and increased by 8.07 KJ·m−2 without treatment and with low-, medium-, and high-strength treatments, respectively. The larger the heat per unit area, the stronger is the potential flammability, which shows that potential flammability is enhanced without treatment and with high-strength treatment and is weakened after low- and medium-strength treatment. However, the potential flammability of the fuel is effectively reduced after different treatment strengths.

3.2. The Dynamic Changes of Flammability of Fuel

The weights of physicochemical property indexes of different time-lag fuels were calculated using the entropy weighting method, and the comprehensive combustion scores of dead surface fuel with different treatment intensities were calculated according to the comprehensive evaluation method. Figure 4 mainly shows the trend of fuel flammability with time in control, low-, medium-, and high-intensity sample plots after different treatment intensities. Figure 4 shows that the combustion comprehensive score in the sample plot always indicated an upward trend. With low-strength treatment, the combustion comprehensive score in the first three months decreased, and the lowest comprehensive score in the 3rd month was 0.4006, which increased slowly from the fourth to the sixth months. The lowest combustion comprehensive score in the second month with medium-strength treatment was 0.2662, and the score showed an increasing trend from the third to the sixth month. The combustion comprehensive score in the second month after the high-strength treatment was significantly reduced, with a score of 0.2443, followed by an increasing trend. After 6 months, the medium-strength treatment was the most effective, with a final score of 0.6786, which was 12.57% lower than the initial score (0.7762). The increase in the combustion comprehensive score of fuel in the control sample plot compared to the initial value was larger than that of the high-strength treatment. As shown in the figure, the comprehensive combustion score of the high-strength treatment in the first to fifth months was lower than that of the control sample plot. The higher the combustion comprehensive score, the greater is the flammability; thus, in this study, without treatment and high-strength treatment increased flammability, and low- and medium-strength treatments decreased flammability, where medium strength was most effective in decreasing the flammability, but all of the three treatments were more effective than without treatment.

3.3. Correlation Analysis of the Indicators

To explore further the relationship between time, treatment intensity, and different time lags with physical and chemical properties and flammability, Pearson’s correlation analysis was performed for each indicator. Figure 5 shows the correlation between time, strength treatment, different time lags, physical–chemical properties, and fuel flammability. Figure 5 shows that time has a highly significant positive correlation with fuel loading, higher heating value, and ash-free calorific value and a highly significant positive correlation with the heat per unit area and the comprehensive combustion score, which indicates that with the change of fuel with time, the larger the fuel loading, higher heating value, and ash-free calorific value, the more powerful is the potential flammability. The time lag has a highly significant positive correlation with the higher heating value and a highly significant negative correlation with other indicators, which indicates that the larger the time lag, the higher is the higher heating value; the lower are the fuel loading, ignition point, ash-free calorific value, and ash content; and the lower is the potential flammability of the fuel. The intensity of treatment is significantly positively correlated with the calorific value of ash removal and ash content; the greater the intensity of treatment, the greater is the calorific value of ash removal and ash content. It is also significantly negatively correlated with the time lag—the stronger the treatment intensity, the lower is the fuel with different time lags. The lack of correlation between treatment intensity with the fuel loading, ignition point, higher heating value, heat per unit area, and comprehensive combustion scores may be because these indicators mainly vary with time. In contrast, the treatment intensity has less of an effect on the indicators. From a comprehensive point of view, different treatment intensities mainly affect different time-lag fuels; the stronger the treatment intensity, the less different is the time-lag fuel, and fuel with time change affects the physical and chemical property indicators, of which the higher the fuel loading, the higher the heating value and the ash-free calorific value, the lower are the ash and ignition point, and thus, the potential flammability and flammability of fuel are more powerful.

4. Discussion

4.1. Effects of Fuel Treatment on the Physical and Chemical Properties of Fuel

Fuel removal can change fuel characteristics and reduce the probability of surface fires [38]. The strength of the removal is chosen with long-term effects in mind, both to reduce the flammability of the forest and to maintain the stability of the forest ecosystem. In this study, we started by analyzing the physical and chemical properties of different time-lag fuels with various treatment intensities. The results showed that the fuel loading changes significantly, while the changes in ash, ignition point, high heating value, and ash-free calorific value were relatively insignificant. For 1 h time-lag fuel, the fuel loading showed an overall trend of decreasing and then increasing. At the same time, for 10 h and 100 h time-lag fuels, the fuel loading showed an overall trend of increasing and then decreasing, and this result mentioned above is in accordance with the study performed by Johnston [39]. After the treatment, the fuel loadings of 10 h and 100 h time-lag fuels were increased, while the surface fuel was significantly reduced. This phenomenon may be explained by the 10 h and 100 h time-lag fuels left on the surface [40] after the treatment and the rainy days in July to August (the third and fourth months) when branches were knocked down by rain, which led to an increase in the fuel loading of the 10 h and 100 h time-lag fuels. However, 1 h time-lag fuel showed an increasing trend at the later period in this study, which may be because of the formation of forest gaps with low- and medium-strength treatments and the changes in the hydrothermal conditions at the surface, which affected the decomposition process of the fuel. This improved the decomposition rate of microorganisms at the surface [41], thus promoting the decomposition of dead leaves and branches. After the high-strength treatment, the fuel loading was reduced in the beginning, but later, due to the inability to be decomposed by microbes promptly after the leaf drop, it caused a large increase in the loading. According to the study by Galicia [42], the removal of the surface litter leads to a decrease in soil microbial biomass, reducing the decomposition rate. The ash content of fuel varies with the soil environment and seasonal conditions [43]. In this study, the ash content of 1 h time-lag fuel varied significantly, which may be explained by climatic and seasonal variations. As for the 10 h and 100 h time-lag fuels, there were differences in the ash content, probably due to the variability of the tree species, but, in general, there was no significant change. In addition, in general, the ash content of the leaves has a higher mass fraction than the woods [44], which is in line with the results of our study. The larger differences in ignition points among the 10 h and 100 h time-lag fuels may be explained by the variability among the tree species. For 1 h time-lag fuel, in June and July (the second and third months), the proportion of low, higher heating value organic materials in the fuel increased due to the lower fuel loading on the surface, which was easily decomposed by soil microbes [45]. This might be the reason that 1 h time-lag fuel had the lowest higher heating value and higher ash-free calorific value in the second and third months. As for the 10 h and 100 h time-lag fuels, the changes in the higher heating value and ash-free calorific value were not significant due to their slower decomposition rate.

4.2. Effects of Fuel Treatment on the Flammability of Fuel

According to the results of the entropy weight method, the order of the degree of influence of 1 h time-lag fuel flammability indicators was fuel loading > calorific value > ignition point > ash-free calorific value > ash. The 10 h time-lag fuel flammability indicators of the degree of influence are in the order of fuel loading > ignition point > ash-free calorific value > higher heating value > ash. The 100 h time-lag fuel flammability indicators of the degree of influence are ordered as fuel loading > ash-free calorific value > ignition point > higher heating value > ash. Therefore, the flammability is subject to the combined effect of several physical and chemical properties. In the trends of the comprehensive combustion score without treatment, low- and high-strength treatments were more consistent with the trend of potential flammability; medium-strength treatment of potential fuel flammability was lowest in the third month, but the flammability was the lowest in the second month, which may be attributed to the fact that the potential flammability only considered the change of fuel loading and higher heating value of fuel, whereas the flammability considered more factors. The lowest flammability of the fuel in the second month with medium-strength treatment was probably caused by the higher ignition point and the higher ash content, which combined to produce the lowest flammability in the second month. The lower potential flammability in the third month may be due to the lower loading in the third month. Still, the consideration of fuel loading and higher heating value alone is relatively singular, and a combination of several physical and chemical properties is needed to consider comprehensively the flammability of fuel. Yang Siqi et al. found that medium-intensity thinning had the most significant effect on the fuel characteristics and potential fire behavior of artificial Robinia pseudoacacia [46]. Song Jie found that medium-intensity thinning had the most significant effect on the potential fire behavior of artificial Pinus tabuliformis [47]. It was concluded in this study that the reduction effects were, in descending order, MST > LST > HST > CK, with the medium-intensity treatment having the best effect, which is more consistent with the results of the above studies. This study comprehensively explored the effects of different removal intensities on the flammability of fuel with different time lags, but the long-term effects of removal intensities on the flammability need to be further considered in future studies, and the continuity of removal intensities needs to be explored by long-term monitoring of the changes in physical and chemical properties of the fuel after removal. In evaluating flammability, new indicators should be added to achieve a comprehensive assessment of flammability to make the study’s results more scientifically robust. Compared with other means of management, prescribed burning is an effective way to reduce the intensity and spread of fire [48]. Nevertheless, in the WUI areas with dense populations and complex fuel, large-scale fires may occur if prescribed burning is not properly planned [49]. Intermediate cuttings effectively reduce the severity of the surface fire after the initial one to three years of increased fire risk [49]. Therefore, fuel removal is a method that reduces flammability and mitigates the spread of fire without destroying the forest environment, and it is suitable for application in the WUI. Considering the long winters and low probability of fires in the Northeast area, this study only evaluated the effectiveness of fuel management in the Northeast area during the fire season. Future studies can consider extending to different regions to assess the actual effects of fuel removal.

5. Conclusions

In this study, we took the dead surface fuel of Betula platyphylla as the research object. Then, we conducted experiments on Betula platyphylla forests with three different treatment intensities combined with a control to investigate the dynamic changes in physical and chemical properties and the flammability of dead surface fuel with different time lags. The main conclusions of this study are as follows. The difference between this study and previous studies is that this one focuses on the dynamic changes in physical and chemical properties and fuel flammability with different time lags after different treatment strengths from a time scale. Within the scope of the experimental design, significant differences were found in the flammability of fuel with time after control, low-, medium-, and high-strength treatments; different treatment intensities were effective in reducing the flammability of the fuel, and Betula platyphylla treated with medium-strength treatment had the best effect on flammability reduction. Among the physical and chemical properties, fuel loading was the most influential indicator that affected the combustion comprehensive score of fuel. The other indicators did not show significant changes with time, but they all affected the comprehensive combustion scores. The Pearson correlation analysis showed that the higher the intensity of treatment, the less was the different time-lag fuel. The physical and chemical properties of the fuel changed with time, thus affecting its potential flammability and flammability. Overall, the physical and chemical properties of dead surface fuel changed over time after treating Betula platyphylla with different intensities, thus affecting the flammability of the fuel. Overall, this study shows that medium-strength treatment was the most effective in reducing the flammability of the fuel.
The study of the flammability and physical and chemical property changes of dead surface fuel of Betula platyphylla in different treatment strengths showed that the effect of medium-strength treatment in reducing flammability was more significant; the physical and chemical properties of the fuel with various treatment strengths changed with time, thus affecting the potential flammability and flammability of the fuel. In addition, the physical and chemical properties that had the greatest influence on the combustion comprehensive scores of different time-lag fuel was fuel loading. Thus, the study results provide technical support for the management and control of fuel in the WUI in the northeast of China.

Author Contributions

Conceptualization, G.Y. and J.N.; methodology, X.C. and J.N.; validation, X.C. and J.N.; formal analysis, X.C. and J.N.; investigation, X.C. and B.L.; resources, G.Y.; data curation, X.C.; writing—original draft preparation, X.C. and M.W.; writing—review and editing, B.L., L.W., J.N., H.Y. and G.Y.; visualization, X.C. and L.W.; supervision, J.N. and G.Y.; project administration, G.Y.; funding acquisition, G.Y. All authors have read and agreed to the published version of the manuscript.

Funding

The National Natural Science Foundation of China (32371881), Fundamental Research Funds for the Central Universities (2572023CT01-01), the Postdoctoral Foundation Program of Heilongjiang (LBH-Z23051), and the National Funded Postdoctoral Program of China (GZC20230398).

Institutional Review Board Statement

Not applicable.

Informed Consent Statement

Not applicable.

Data Availability Statement

The data that support the findings of this study are available upon request from the corresponding author (G.Y.).

Conflicts of Interest

The authors declare no conflicts of interest.

References

  1. Le Goff, H.; Leduc, A.; Bergeron, Y.; Flannigan, M. The adaptive capacity of forest management to changing fire regimes in the boreal forest of Quebec. For. Chron. 2005, 81, 582–592. [Google Scholar] [CrossRef]
  2. Lamsaf, H.; Lamsaf, A.; Kerroum, M.A.; Almeida, M. Assessing trends in wildland-urban interface fire research through text mining: A comprehensive analysis of published literature. J. For. Res. 2024, 35, 71. [Google Scholar] [CrossRef]
  3. Synolakis, C.E.; Karagiannis, G.M. Wildfire risk management in the era of climate change. PNAS Nexus 2024, 3, 151. [Google Scholar] [CrossRef] [PubMed]
  4. Tang, W.; He, C.; Emmons, L.; Zhang, J. Global expansion of wildland-urban interface (WUI) and WUI fires: Insights from a multiyear worldwide unified database (WUWUI). Environ. Res. Lett. 2024, 19, 044028. [Google Scholar] [CrossRef]
  5. Li, L.; Niu, S.; Chen, F.; Tao, C.; Chen, L.; Zhang, P. Analysis on surface potential fire behavior and combustion of Miaofeng Mountain Forest Farm in Beijing. J. Beijing For. Univ. 2019, 41, 58–67. [Google Scholar] [CrossRef]
  6. Miranda, A.; Carrasco, J.; González, M.; Pais, C.; Lara, A.; Altamirano, A.; Weintraub, A.; Syphard, A.D. Evidence-based mapping of the wildland-urban interface to better identify human communities threatened by wildfires. Environ. Res. Lett. 2020, 15, 094069. [Google Scholar] [CrossRef]
  7. Chambers, J.C.; Strand, E.K.; Ellsworth, L.M.; Tortorelli, C.M.; Urza, A.K.; Crist, M.R.; Miller, R.F.; Reeves, M.C.; Short, K.C.; Williams, C.L. Review of fuel treatment effects on fuels, fire behavior and ecological resilience in sagebrush (Artemisia spp.) ecosystems in the Western U.S. Fire Ecol. 2024, 20, 32. [Google Scholar] [CrossRef]
  8. Hood, S.M.; Varner, J.M.; Jain, T.B.; Kane, J.M. A framework for quantifying forest wildfire hazard and fuel treatment effectiveness from stands to landscapes. Fire Ecol. 2022, 18, 33. [Google Scholar] [CrossRef]
  9. Stotlemyer, A.D.; Waldrop, T.A.; Wang, G.G. Prescribed burning and mastication effects on surface fuels in southern pine beetle-killed loblolly pine plantations. Ecol. Eng. 2015, 81, 514–524. [Google Scholar] [CrossRef]
  10. Stephens, S.L.; Moghaddas, J.J. Experimental fuel treatment impacts on forest structure, potential fire behavior, and predicted tree mortality in a California mixed conifer forest. For. Ecol. Manag. 2005, 215, 21–36. [Google Scholar] [CrossRef]
  11. Cram, D.S.; Baker, T.T.; Fernald, A.G.; Cibils, A.F.; VanLeeuwen, D.M. Fuel and vegetation trends after wildfire in treated versus untreated forests. For. Sci. 2015, 61, 753–762. [Google Scholar] [CrossRef]
  12. Vernon, M.J.; Johnston, J.D.; Stokely, T.D.; Miller, B.A.; Woodruff, D.R. Mechanical thinning restores ecological functions in a seasonally dry ponderosa pine forest in the inland Pacific Northwest, USA. For. Ecol. Manag. 2023, 546, 121371. [Google Scholar] [CrossRef]
  13. Schwilk, D.W.; Keeley, J.E.; Knapp, E.E.; McIver, J.; Bailey, J.D.; Fettig, C.J.; Fiedler, C.E.; Harrod, R.J.; Moghaddas, J.J.; Outcalt, K.W.; et al. The national Fire and Fire Surrogate study: Effects of fuel reduction methods on forest vegetation structure and fuels. Ecol. Appl. 2009, 19, 285–304. [Google Scholar] [CrossRef] [PubMed]
  14. Rivera, J.I.; Ebensperger, F.; Valenzuela, F.; Escandar, L.; Reszka, P.; Fuentes, A. Understanding the role of fire retardants on the discontinuous ignition of wildland fuels. Proc. Combust. Inst. 2023, 39, 3775–3783. [Google Scholar] [CrossRef]
  15. Fire Suppressant and Retardant Use in the 2003 Wildfires. Available online: https://parks.canada.ca/nature/science/conservation/feu-fire/feuveg-fireveg/incendies-wildfire/maitrise-control/extinct-suppress (accessed on 6 July 2024).
  16. Kane, J.M.; Varner, J.M.; Knapp, E.E. Novel fuelbed characteristics associated with mechanical mastication treatments in northern California and south-western Oregon, USA. Int. J. Wildland Fire 2009, 18, 686–697. [Google Scholar] [CrossRef]
  17. Li, B.; Shu, L.; Ding, Y.; Sun, W.; Wu, S.; Li, H.; Wang, M.; Zhao, F. Research Progress in Plantation Fuel Characteristics and Management in China. World For. Res. 2021, 34, 90–95. [Google Scholar] [CrossRef]
  18. Agee, J.K.; Skinner, C.N. Basic principles of forest fuel reduction treatments. For. Ecol. Manag. 2005, 211, 83–96. [Google Scholar] [CrossRef]
  19. Ohlson, D.W.; Berry, T.M.; Gray, R.W.; Blackwell, B.A.; Hawkes, B.C. Multi-attribute evaluation of landscape-level fuel management to reduce wildfire risk. For. Policy Econ. 2006, 8, 824–837. [Google Scholar] [CrossRef]
  20. Han, M.; Wen, P.; Xu, H.; Zhang, Y.; Li, W.; Liu, X. Simulation of surface fire behavior of Pinus tabuliformis forest in Ming Tombs Forest Farm in Beijing. J. Beijing For. Univ. 2018, 40, 95–101. [Google Scholar] [CrossRef]
  21. Zong, X. Impacts of Fuel Management on Forest Combustibility in Daxing’anling. Chin. Acad. For. 2021. [Google Scholar] [CrossRef]
  22. Gao, M.; Ren, Y.; Zhou, X.; Chen, S.; Gao, Y.; Wang, H.; Gu, Z.; Liu, X. Effects of thinning on canopy characteristics and potential crown fire behavior of Platycladus orientalis in Xishan Forest Farm of Beijing. J. Beijing For. Univ. 2022, 44, 56–65. [Google Scholar] [CrossRef]
  23. Espinosa, J.; Benito, D.M.; Rivera, O.R.D.; Hernando, C.; Guijarro, M.; Madrigal, J. Tree Growth Response to Low-Intensity Prescribed Burning in Pinusnigra Stands: Effects of Burn Season and Fire Severity. Appl. Sci. 2021, 11, 7462. [Google Scholar] [CrossRef]
  24. Zhou, J.; Liu, X.; Guo, H. Surface fuel loading and relevant influencing factors of main forest types in southern Daxing’anling. J. Northwest Af. Univ. Nat. Sci. Ed 2014, 42, 131–137. [Google Scholar] [CrossRef]
  25. Li, Z.; Weng, Y.; Xu, J.; Geng, D.; Ning, J.; Yu, H.; Di, X.; Yang, G. Effect of the simulated surface fire behavior on water-soluble carbon and nitrogen in ash. Acta Ecol. Sin. 2022, 42, 1500–1511. [Google Scholar] [CrossRef]
  26. Zong, X.; Tian, X. Impacts of Fuel Treatment on Potential Fire Behavior of Main Forest Types in Daxing’anling. Sci. Silvae Sin. 2021, 57, 139–149. [Google Scholar] [CrossRef]
  27. Hu, H.; Niu, S.; Jin, S. Forest Fire Ecology and Management. China For. Publ. House 2005, 40–43. [Google Scholar]
  28. Ai, Y.; Cun, Y.; Fan, Y.; Cheng, R.; Liu, Y. Factors affecting surface fuel load of Pinus tabuliformis forest in Songshan, Beijing. Chin. J. Ecol. 2018, 37, 2559–2565. [Google Scholar] [CrossRef]
  29. Ma, C.; Wang, J.; Han, Z.; Wang, Q. Study on the potential fire behavior of surface fuels in coniferous forests in Haizhai Forestry, East Yunnan Province, China. Fire Sci. Technol. 2024, 43, 265–270. [Google Scholar]
  30. Wang, L.; Yang, G.; Gao, J.; Zheng, X.; Li, Z.; Weng, Y.; Di, X.; Yu, H. Changes in the Flammability of Post-Fire Aboveground Litter of Larix gmelinii. Sci. Silvae Sin. 2022, 58, 110–121. [Google Scholar] [CrossRef]
  31. Wang, J.; Shao, J.; Li, X.; Zhang, S.; Yan, D. Analysis of apoplastic load and potential burnability of old-growth Liquidambar formosana forests in Mount Qixia. For. Fire Prev. 2019, 15–18. [Google Scholar]
  32. Jiang, Q.; Zhong, S.; Zhu, W. Research on comprehensive risk assessment of forest fire in Beijing-Tianjin-Hebei region. China Saf. Sci. J. 2020, 30, 119–125. [Google Scholar] [CrossRef]
  33. Yurtgan, M.; Baysal, I.; Küçük, O. Fuel characterization and crown fuel load prediction in non-treated Calabrian pine (Pinus brutia Ten.) plantation areas. Iforest-Biogeosciences For. 2022, 15, 458–464. [Google Scholar] [CrossRef]
  34. Cruz, M.G.; Sullivan, A.L.; Gould, J.S.; Hurley, R.J.; Plucinski, M.P. Got to burn to learn: The effect of fuel load on grassland fire behaviour and its management implications. Int. J. Wildland Fire 2018, 27, 727–741. [Google Scholar] [CrossRef]
  35. Morici, K.E.; Bailey, J.D. Long-Term Effects of Fuel Reduction Treatments on Surface Fuel Loading in the Blue Mountains of Oregon. Forests 2021, 12, 1306. [Google Scholar] [CrossRef]
  36. Wang, Q.; Xiao, H.; Liu, W.; Yang, W.; Feng, A.; Li, S.; Ren, J. Study on Potential Combustibility of Ground Fuels in Kunming Xishan National Forest Park. J. Fujian For. Sci Tech. 2014, 41, 40–44. [Google Scholar] [CrossRef]
  37. Johnston, J.D.; Olszewski, J.H.; Miller, B.A.; Schmidt, M.R.; Vernon, M.J.; Ellsworth, L.M. Mechanical thinning without prescribed fire moderates wildfire behavior in an Eastern Oregon, USA ponderosa pine forest. For. Ecol. Manag. 2021, 501, 119674. [Google Scholar] [CrossRef]
  38. Jiménez, E.; Vega, N.D.; Rey, E.; Fernández, C.; Vega, J.A. Midterm fuel structure recovery and potential fire behaviour in a Pinus pinaster Ait. forest in northern central Spain after thinning and mastication. Eur. J. For. Res. 2016, 135, 675–686. [Google Scholar] [CrossRef]
  39. Monroe, M.C.; Jones, J.J.; Soldinger, A. Wildland-Urban Interface Forestry Success in Texas. South. J. Appl. For. 2012, 36, 107–109. [Google Scholar] [CrossRef]
  40. Xiao, W.; Diao, J.; Fei, F.; Guan, Q. Effects of Different Intensity Thinning on Litter Decomposition in Chinese Fir Plantations. Ecol. Environ. Sci. 2016, 25, 1291–1299. [Google Scholar] [CrossRef]
  41. Galicia, L.; Garcia, O.F. Litter quality of two remnant tree species affects soil microbial activity in tropical sea- sonal pastures in western Mexico. Arid Land Res. Manag. 2011, 25, 75–86. [Google Scholar] [CrossRef]
  42. Turner, M.G. Landscape ecology: The effect pattern on process. Annu. Rev. Ecol. Evol. Syst. 1989, 20, 171–197. [Google Scholar] [CrossRef]
  43. Hu, H.; Peng, X.; Liu, X.; Sun, L. Ash Contents of Several Principal Types of Fuels in Daxing’an Mountains. J. North-East For. Univ. 2009, 37, 55–57. [Google Scholar]
  44. Chen, M.; Shangguan, Z. Caloric Value and Nutrient Characteristics of Dominant Plant Species of Six Typical Vegetation Communities in Ziwuling Forest Area of the Loess Plateau. Sci. Silvae Sin. 2009, 45, 140–144. [Google Scholar]
  45. Yang, S.; Zhu, M.; Liu, X. Effect of thinning on fuel characteristics and carbon stock of Robinia pseudoacacia forest in Beijing Xishan Forest Farm. Ecol. Sci. 2018, 34, 94–100. [Google Scholar] [CrossRef]
  46. Song, J.; Zhu, M.; Liu, X.; Ren, Y.; Wang, Q.; Jin, Y. Effects of thinning on fuel characteristics and potential fire behaviors of Pinus tabuliformis forest in Beijing West Mountain. J. Beijing For. Univ. 2017, 39, 41–47. [Google Scholar] [CrossRef]
  47. Ritter, S.; Morici, K.; Stevens-Rumann, C. Efficacy of prescribed fire as a fuel reduction treatment in the Colorado Front Range. Can. J. For. Res. 2023, 53, 455–462. [Google Scholar] [CrossRef]
  48. Dai, L.; Zhang, X.; Liu, J. Review on Effects of Prescribed Fire on Vegetation and Soil. World For. Res. 2022, 35, 47–52. [Google Scholar] [CrossRef]
  49. Chang, Y.; He, H.; Bishop, I.; Hu, Y.; Bu, R.; Xu, C.; Li, X. Long-term forest landscape responses to fire exclusion in the Great Xing’an Mountains, China. Int. J. Wildland Fire 2007, 16, 34–44. [Google Scholar] [CrossRef]
Figure 1. Pictures of sample plots with different treatment intensities: (a) CK; (b) LST; (c) MST; (d) HST.
Fire 07 00261 g001
Figure 2. Changes of fuel loading with different time-lag fuels after different-strength treatments; (a) 1 h time lag; (b) 10 h time lag; (c) 100 h time lag; and 0 for initial data before treatment. Different letters at the same treatment in different times represent significant differences.
Fire 07 00261 g002
Figure 3. The change trend of heat per unit area of fuel after different treatment strengths; 0 indicates initial data before treatment. Different letters at the same treatment in different times represent significant differences.
Fire 07 00261 g003
Figure 4. The change trend of fuel flammability after different treatment strengths; 0 indicates initial data before treatment. Different letters at the same treatment in different times represent significant differences.
Fire 07 00261 g004
Figure 5. Correlation between time, strength treatment, different time lags, and physical–chemical properties and flammability; F indicates fuel loading, IP indicates the ignition point, HHV indicates the higher heating value, AFCV indicates the ash-free calorific value, A indicates ash, P indicates the heat per unit area, and Zi indicates the comprehensive combustion score.
Fire 07 00261 g005
Table 1. Basic information of the sample plots (mean ± sd).
Sample PlotAverage DBH (cm)Average Tree Height (m)Crown Density
CK12.0 ± 3.2312.5 ± 3.270.7
LST 12.7 ± 4.5913.9 ± 3.160.6
MST11.1 ± 3.3112.6 ± 4.290.9
HST14.4 ± 3.1213.8 ± 4.080.8
Table 2. Low-, medium-, and high-strength treatments.
Sample PlotHerbsShrubsTreesDead Surface Fuel
LSTMow stubble height of 15 cmShrubs smaller than 1.5 m, mowing retained to 15 cmTree pruning height of 1.5 mRemove 85% of dead fuel above 100 h time lag
MSTMow stubble height of 10 cmShrubs smaller than 2 m, mowing retained to 20 cmTree pruning height of 2 mRemove 85% of dead fuel above 10 h time lag
HSTRemove all herbs from the sample plotRemove shrubs smaller than 3 mTree pruning height of 3 mRemove 85% of dead fuel above 1 h time lag
Table 3. Changes in ash, IT, HHV, and AFCV of fuel with different time lags in the control plot for 6 months (mean ± sd).
Time/
Month
1 h Time-Lag Fuel10 h Time-Lag Fuel
Ash/%Ignition Point/°CHigher Heating Value/(KJ·g−1)Ash-Free Calorific Value/(KJ·g−1)Ash/%Ignition Point/°CHigher Heating Value/(KJ·g−1)Ash-Free Calorific Value/(KJ·g−1)
014.36 ± 0.11256.5 ± 1.515.89 ± 0.5518.55 ± 0.414.37 ± 0.49254.5 ± 0.515.36 ± 0.0916.06 ± 0.07
115.01 ± 0.49260.67 ± 1.8615.66 ± 0.1318.42 ± 0.123.71 ± 0.23254.56 ± 2.817.29 ± 0.0417.9 ± 0.01
215.12 ± 0.68259.17 ± 1.9715.5 ± 0.2218.26 ± 0.302.88 ± 0.64246.58 ± 1.7217.02 ± 0.2017.49 ± 0.23
314.28 ± 1.91258.73 ± 2.7715.82 ± 0.2818.48 ± 0.673.76 ± 0.66254.6 ± 1.1617.12 ± 0.2717.81 ± 0.47
410.85 ± 0.92255.83 ± 2.1916.56 ± 0.1918.57 ± 0.336.58 ± 1.38256.17 ± 2.217.5 ± 0.2118.79 ± 1.15
58.49 ± 0.67257.33 ± 3.3716.97 ± 0.1618.69 ± 0.113.67 ± 0.39254.42 ± 4.6417.46 ± 0.1518.1 ± 0.20
68.11 ± 0.31257.5 ± 2.6517.57 ± 0.2619.12 ± 0.573.31 ± 0.36256.86 ± 2.7417.58 ± 0.1618.06 ± 0.30
Table 4. Changes in ash, IT, HHV, and AFCV of fuel with different time lags after LST for 6 months (mean ± sd).
Time/
Month
1 h Time-Lag Fuel10 h Time-Lag Fuel
Ash/%Ignition Point/°CHigher Heating Value/(KJ·g−1)Ash-Free Calorific Value/(KJ·g−1)Ash/%Ignition Point/°CHigher Heating Value/(KJ·g−1)Ash-Free Calorific Value/(KJ·g−1)
08.56 ± 0.83257 ± 3.217.57 ± 0.5619.21 ± 0.443.08 ± 0.86255 ± 2.617.78 ± 0.3718.35 ± 0.46
110.73 ± 1.79257.89 ± 1.2617.09 ± 0.3419.14 ± 0.233.41 ± 0.94249.22 ± 4.0317.83 ± 0.2318.47 ± 0.56
29.47 ± 0.54257.17 ± 2.217.16 ± 0.1718.97 ± 0.442.58 ± 0.41254.75 ± 1.9117.41 ± 0.2317.88 ± 0.54
38.57 ± 0.20256.27 ± 1.6617.10 ± 0.1218.71 ± 0.282.94 ± 0.43253.67 ± 3.5417.15 ± 0.1117.65 ± 0.38
48.86 ± 0.76256.33 ± 1.0517.24 ± 0.1518.92 ± 0.333.04 ± 0.78254.5 ± 1.417.7 ± 0.1718.12 ± 0.29
510.35 ± 1.72256.92 ± 4.4117.57 ± 0.0919.19 ± 0.434.09 ± 0.60251.17 ± 3.3417.63 ± 0.2118.39 ± 0.56
66.42 ± 0.17257.78 ± 2.4918.12 ± 0.0919.36 ± 0.313.48 ± 0.58255.53 ± 1.7917.78 ± 0.1418.4 ± 0.49
Table 5. Changes in ash, IT, HHV, and AFCV of fuel with different time lags after MST for 6 months (mean ± sd).
Time/
Month
1 h Time-Lag Fuel10 h Time-Lag Fuel
Ash/%Ignition Point/°CHigher Heating Value/(KJ·g−1)Ash-Free Calorific Value/(KJ·g−1)Ash/%Ignition Point/°CHigher Heating Value/(KJ·g−1)Ash-Free Calorific Value/(KJ·g−1)
010.02 ± 1.16257 ± 1.217.01 ± 0.5018.9 ± 0.274.96 ± 0.62258 ± 1.517.51 ± 0.0518.58 ± 0.17
111.03 ± 1.04258.11 ± 1.2617.08 ± 0.3319.19 ± 0.263.96 ± 0.81255.56 ± 2.5517.06 ± 0.3217.79 ± 0.49
213.06 ± 0.89260 ± 0.4716.08 ± 0.3418.49 ± 0.453.5 ± 0.53257.25 ± 1.8717.54 ± 0.1318.14 ± 0.33
312.82 ± 1.63258.87 ± 3.0915.91 ± 0.2418.27 ± 0.833.4 ± 0.24254.07 ± 4.2517.34 ± 0.1017.98 ± 0.31
49.94 ± 2.26258.42 ± 2.0116.58 ± 0.4918.4 ± 0.503.53 ± 0.45251.75 ± 0.9217.32 ± 0.2617.92 ± 0.44
512.11 ± 3.39260.92 ± 0.5716.95 ± 0.3718.91 ± 0.364.1 ± 0.41254.92 ± 2.7317.7 ± 0.2618.47 ± 0.48
68.77 ± 1.08259.11 ± 1.9417.48 ± 0.3719.16 ± 0.743.67 ± 0.50257.5 ± 3.8217.71 ± 0.2818.38 ± 0.64
Table 6. Changes in ash, IT, HHV, and AFCV of fuel with different time lag after HST for 6 months (mean ± sd).
Time/
Month
1 h Time-Lag Fuel10 h Time-Lag Fuel
Ash/%Ignition Point/°CHigher Heating Value/(KJ·g−1)Ash-Free Calorific Value/(KJ·g−1)Ash/%Ignition Point/°CHigher Heating Value/(KJ·g−1)Ash-Free Calorific Value/(KJ·g−1)
015.23 ± 2.69258 ± 1.616.13 ± 0.4119.03 ± 0.165.27 ± 0.39262 ± 2.116.44 ± 0.1517.35 ± 0.49
18.01 ± 1.19258.44 ± 4.0717.08 ± 0.4018.57 ± 0.403.98 ± 0.36260.83 ± 3.8216.43 ± 0.5217.11 ± 0.83
211.31 ± 1.90259.89 ± 1.9916.47 ± 0.3018.58 ± 0.183.46 ± 0.40256 ± 1.5817.5 ± 0.4418.13 ± 0.81
316.3 ± 3.14256.33 ± 1.4116 ± 0.1319.24 ± 1.784.45 ± 0.75252 ± 3.0517.49 ± 0.1618.31 ± 0.39
417.1 ± 2.93258.33 ± 1.5616.28 ± 0.3419.7 ± 1.045.8 ± 2.20254.13 ± 1.5517.72 ± 0.0918.84 ± 0.93
512.98 ± 1.35260.17 ± 2.416.83 ± 0.3719.92 ± 0.533.9 ± 0.39252.83 ± 2.216.95 ± 0.2817.64 ± 0.64
69.77 ± 0.77257 ± 2.2817.64 ± 0.1119.56 ± 0.414.96 ± 1.39251.4 ± 4.5817.36 ± 0.0818.28 ± 0.67
Table 7. Changes in ash, IT, HHV, and AFCV of fuel with 100 h time-lag fuel with CK and LST for 6 months (mean ± sd).
Time/
Month
CK 100 h Time-Lag FuelLST 100 h Time-Lag Fuel
Ash/%Ignition Point/°CHigher Heating Value/(KJ·g−1)Ash-Free Calorific Value/(KJ·g−1)Ash/%Ignition Point/°CHigher Heating Value/(KJ·g−1)Ash-Free Calorific Value/(KJ·g−1)
0 3.71 ± 0.62253 ± 3.2417.24 ± 0.5217.91 ± 0.74
12.8 ± 0.52253.33 ± 5.517.14 ± 0.1517.66 ± 0.42
22.59 ± 0.49248.33 ± 4.7317.3 ± 0.4517.76 ± 0.941.23 ± 0.45253.33 ± 3.7917.5 ± 0.3918.06 ± 1.35
33.63 ± 0.72257.7 ± 4.117.66 ± 0.2818.33 ± 0.491.76 ± 0.29254 ± 8.7617.38 ± 0.3417.69 ± 0.63
45 ± 2.09258.17 ± 6.3517.39 ± 0.2318.34 ± 0.981.23 ± 0.63250.33 ± 1.5318.06 ± 0.4318.28 ± 0.64
51.79 ± 0.40253.67 ± 4.0416.93 ± 0.3617.24 ± 0.700.97 ± 0.30252.33 ± 7.2317.74 ± 0.2717.92 ± 0.56
63.59 ± 1.80260.5 ± 4.9517.75 ± 0.0518.42 ± 0.480.57 ± 0.21252 ± 4.2818.48 ± 0.5118.58 ± 0.87
Disclaimer/Publisher’s Note: The statements, opinions and data contained in all publications are solely those of the individual author(s) and contributor(s) and not of MDPI and/or the editor(s). MDPI and/or the editor(s) disclaim responsibility for any injury to people or property resulting from any ideas, methods, instructions or products referred to in the content.

