Article

Optimization Study of Fire Prevention Structure of Electric Vehicle Based on Bottom Crash Protection

School of Resources and Safety Engineering, Central South University, Changsha 410083, China
*
Author to whom correspondence should be addressed.
Fire 2024, 7(7), 209; https://doi.org/10.3390/fire7070209
Submission received: 17 May 2024 / Revised: 18 June 2024 / Accepted: 19 June 2024 / Published: 22 June 2024

Abstract

As the market share of electric vehicles continues to expand, fire accidents due to impacts from the power battery located at the bottom of the electric vehicles are receiving increasing attention. Lithium-ion batteries, as the mainstream choice of power battery for electric vehicles solving the problem that they are prone to thermal runaway due to damage when impacted, are the key to preventing and controlling fire accidents in electric vehicles. To address the protective problem of the bottom power battery of electric vehicles when it is impacted by road debris, two new types of sandwich structures with an enhanced regular hexagonal structure and semicircular arch structure as the core layer, respectively, are innovatively proposed in this article. They are used to protect the bottom power battery of electric vehicles and are compared with the traditional homogeneous protective structure in terms of protective performance. A local finite element simulation (FEM) of an electric vehicle containing the necessary components was established for simulation. Stress distribution, deformation, and energy absorption data for each component of an electric vehicle assembled with a protective structure when subjected to a bottom impact were obtained safely and cost-effectively. Three evaluation coefficients, namely, the cell shape variable (Bcmax), the protective effect parameter (ƒPE), and the total energy absorption of the structure (Ea), are proposed to compare and analyze the simulation results of different protective structures under equal mass conditions. The maximum values of the battery deformation of arched sandwich construction and reinforced honeycomb sandwich construction were 0.35 mm and 0.40 mm, respectively, which are much smaller than that of the maximum deformation of the battery under the protection of a homogeneous protective structure, which is 0.62 mm. Their protective effect parameters are 43.55 and 35.48, respectively, which proves that the optimization degree of the protective structure of the bottom of the electric vehicle after the application of the new structure is 35% or more. The total energy absorptions of the two structures are 91.77 J and 87.19 J, respectively, accounting for more than 70% of the kinetic energy in the system, which proves that the deformation of the sandwich structure can effectively absorb the kinetic energy of the collision between the road obstacle and the bottom of the car. The final results show that the arched sandwich structure showed the best impact resistance in the simulation, which can be used for the power battery’s protective structure on the electric vehicle’s bottom. This study fills a gap in local finite element modeling in electric vehicle crash simulations and provides ideas for fire prevention designs of electric vehicle structures.

1. Introduction

Since 2015, China’s new energy vehicle industry has entered a period of rapid development. During the first “13th Five-Year Plan” period (2016–2020), China produced about 5,190,000 electric vehicles and sold about 5,113,000. China’s market share of electric vehicles during these five years exceeded 50% of the global total [1,2,3]. In this process, pure electric vehicles powered by power batteries as energy storage units have gradually become the most significant production category among all models due to their relatively simple structure, more mature technology, low maintenance costs, and low environmental impact [4]. The rapid growth of the electric vehicle market share has effectively reduced the pressure on energy and the environment. However, it has also brought about electric vehicle fire accidents that differ from those of conventional fuel vehicles. Among them, the most concerning and dangerous are undoubtedly the fire accidents caused by the damage of automobile power batteries, especially short-circuit fires caused by the deformation of the batteries due to mechanical impact during traffic accidents.
Influenced by the traditional automobile industry, the research objects for electric vehicle collision studies are mostly collisions occurring at the front, rear, and side of the vehicle, and there are fewer studies on collisions on the bottom of electric vehicles [5,6,7,8]. However, as the energy core of electric vehicles, the power battery case has a large mass and needs to occupy enough space, so it is often located at the bottom of electric vehicles. Collisions on the underside of electric vehicles are more likely to cause damage to power batteries than impacts on other surfaces. Existing statistics and studies show that when electric vehicles travel at high speed, the collision between road debris and the bottom of electric vehicles is one of the main reasons for power battery damage.
Aiming at the safety of electric vehicle power batteries, scholars at home and abroad have researched their combustion mechanism, safety protection, and simulation prediction. Zhao [9] and Kong et al. [10] conducted thermal runaway tests on 18,650 lithium-ion batteries under closed, ventilated, and low-temperature conditions. It was found that both the rupture and deformation of the battery casing under different conditions are the key factors for its combustion. Zhu et al. [11,12] analyzed the failure and thermal runaway of cylindrical lithium-ion batteries under the action of mechanical energy. The study tested out the average mechanical properties of this type of battery, and the stress–strain relationship of a single cell subjected to a two-plane extrusion condition was obtained by calculation. Xia et al. [13] carried out a drop hammer impact test on soft-pack batteries and analyzed loads of soft-pack batteries using four factors: the shape of the impactor, its mass, the impact’s speed, and the impact’s location. The effects of loading conditions on deformation and damage patterns and the possibility of short-circuiting and thermal runaway were analyzed using four factors: impact shape, mass, velocity, and location. Wang et al. [14], to control the fire risk of lithium-ion batteries in large-scale applications in electric vehicles and energy storage systems, comprehensively reviewed the thermal runaway phenomenon and related fire dynamics of single-cell lithium-ion batteries and multi-cell battery packs and discussed potential fire prevention measures in their paper. García et al. [15] investigated the effects of nail penetration location, battery state of charge (SOC), and initial ambient temperature on the thermal runaway behavior of Ni-Mn-Co 811 batteries through nail penetration tests. The results showed that damage to the battery surface by collision is one of the main causes of battery explosion in electric vehicles. The thermal runaway test of electric vehicle power batteries under the impact effect, while achieving a lot of results, also has the problems of great danger and high cost, so numerical simulation has gradually become the mainstream means of research in this field. Chiu et al. [16] proposed an electrochemical numerical model to perform a low-cost test of short-circuit combustion due to the impingement of a nail in the battery pack during an electric vehicle collision. It was shown that the model can accurately obtain the onset point of the thermal runaway of the battery and the battery temperature profile during the test. Wang et al. [17] pointed out that understanding the mechanical properties of lithium-ion batteries is the key to unraveling the complex coupled thermal runaway behaviors triggered by the collision of an electric vehicle. They proposed a constitutive model of lithium-ion battery jelly rolls to describe the mechanical behaviors under dynamic loading, verified by a finite element model of lithium-ion batteries. Yu et al. [18] investigated the electrical parameter drift of lithium-ion batteries under high impact using the machete test. They established a mechanical impact dynamics (MID) model of lithium-ion batteries at the moment of high impact, which revealed the influence of diaphragm thickness, elastic modulus, and other parameters on the impact resistance performance of lithium-ion batteries. Xia et al. [19] simulated the impact mechanical response of an underground lithium-ion battery pack by building a global finite element model. They demonstrated that the homogenization model of the battery’s inner core could accurately predict the local deformation of a single battery cell. The related research provides theoretical support for further developing impact safety protection for automotive power batteries.
Along with the increase in bottom collision accidents, how to protect the power battery from thermal runaway fire due to excessive deformation when encountering kinetic energy impact has become a vital issue. At the same time, honeycomb sandwich structures with foam metal and honeycomb material as core layers have been used in various fields due to their advantages of high specific stiffness/structural strength, high specific energy absorption, and acoustic and thermal insulation. It is also been used to design impact protection structures for automotive power batteries [20]. For example, Nguyen et al. [21] proposed a multi-cellular battery assembly consisting of cylindrical battery cells surrounded by hollow tubes. This assembly protects the battery cells from high-voltage stresses utilizing sacrificial components with energy absorption and storage properties around the cells. Wang et al. [22] investigated a novel battery pack system consisting of a non-modular battery pack and a negative Poisson’s ratio tubular structure with both heat dissipation and protection. The system was shown to have better crashworthiness and heat dissipation performance while considering energy density through artificial neural networks and genetic algorithms. Zhang et al. [23] proposed a PCM with an EG/PW/Al-f sandwich structure obtained by pressing the phase change material into the holes of foamed aluminum and applying it to the thermal management and collision protective study of batteries, which proved that the sandwich structure has a good impact on energy absorption performance.
By referring to the above literature, this paper proposes a thickened double-layer protective structure and two different sandwich structures to protect the power battery at the bottom of the electric vehicle in response to the need for fire prevention in the structural design of electric vehicles, taking the 18,650 cylindrical lithium-ion battery, which has the most comprehensive relevant data, as the object of study. We have collected and organized this battery’s physical parameters from many related studies as data material for simulation. The deformation mode of the cylindrical battery encapsulated with a metal shell during the collision process was explored. The study was modeled and simulated using nonlinear explicit dynamic finite element simulation software LS-DYNA_SMP_R13. The impact deformation mode of the system, deformation mechanism, and energy consumption law of the structure contained in the software can truly reflect the situation of each part of the car during the collision. The local finite element models of the bottom battery case of electric vehicles with a homogeneous structure, double-layer protective structure, hollow semicircular arch structure, and reinforced honeycomb structure as the protective structure were established. The model was tested according to the relevant testing standards in “Requirements and test methods for the anti-collision ability of the bottom of the battery electric passenger cars” issued by the Chinese Society of Automotive Engineering [24]. The finite element simulation of the vehicle body was performed for the case of road debris collision. The stress distribution of the protective structure, maximum axial compression of the battery, protective effect parameters, and total energy absorption of the structure were used as evaluation indicators. The evaluation indicators of each system in case of bottom impacts were used to compare the protection effectiveness of different structures.

2. Materials and Methods

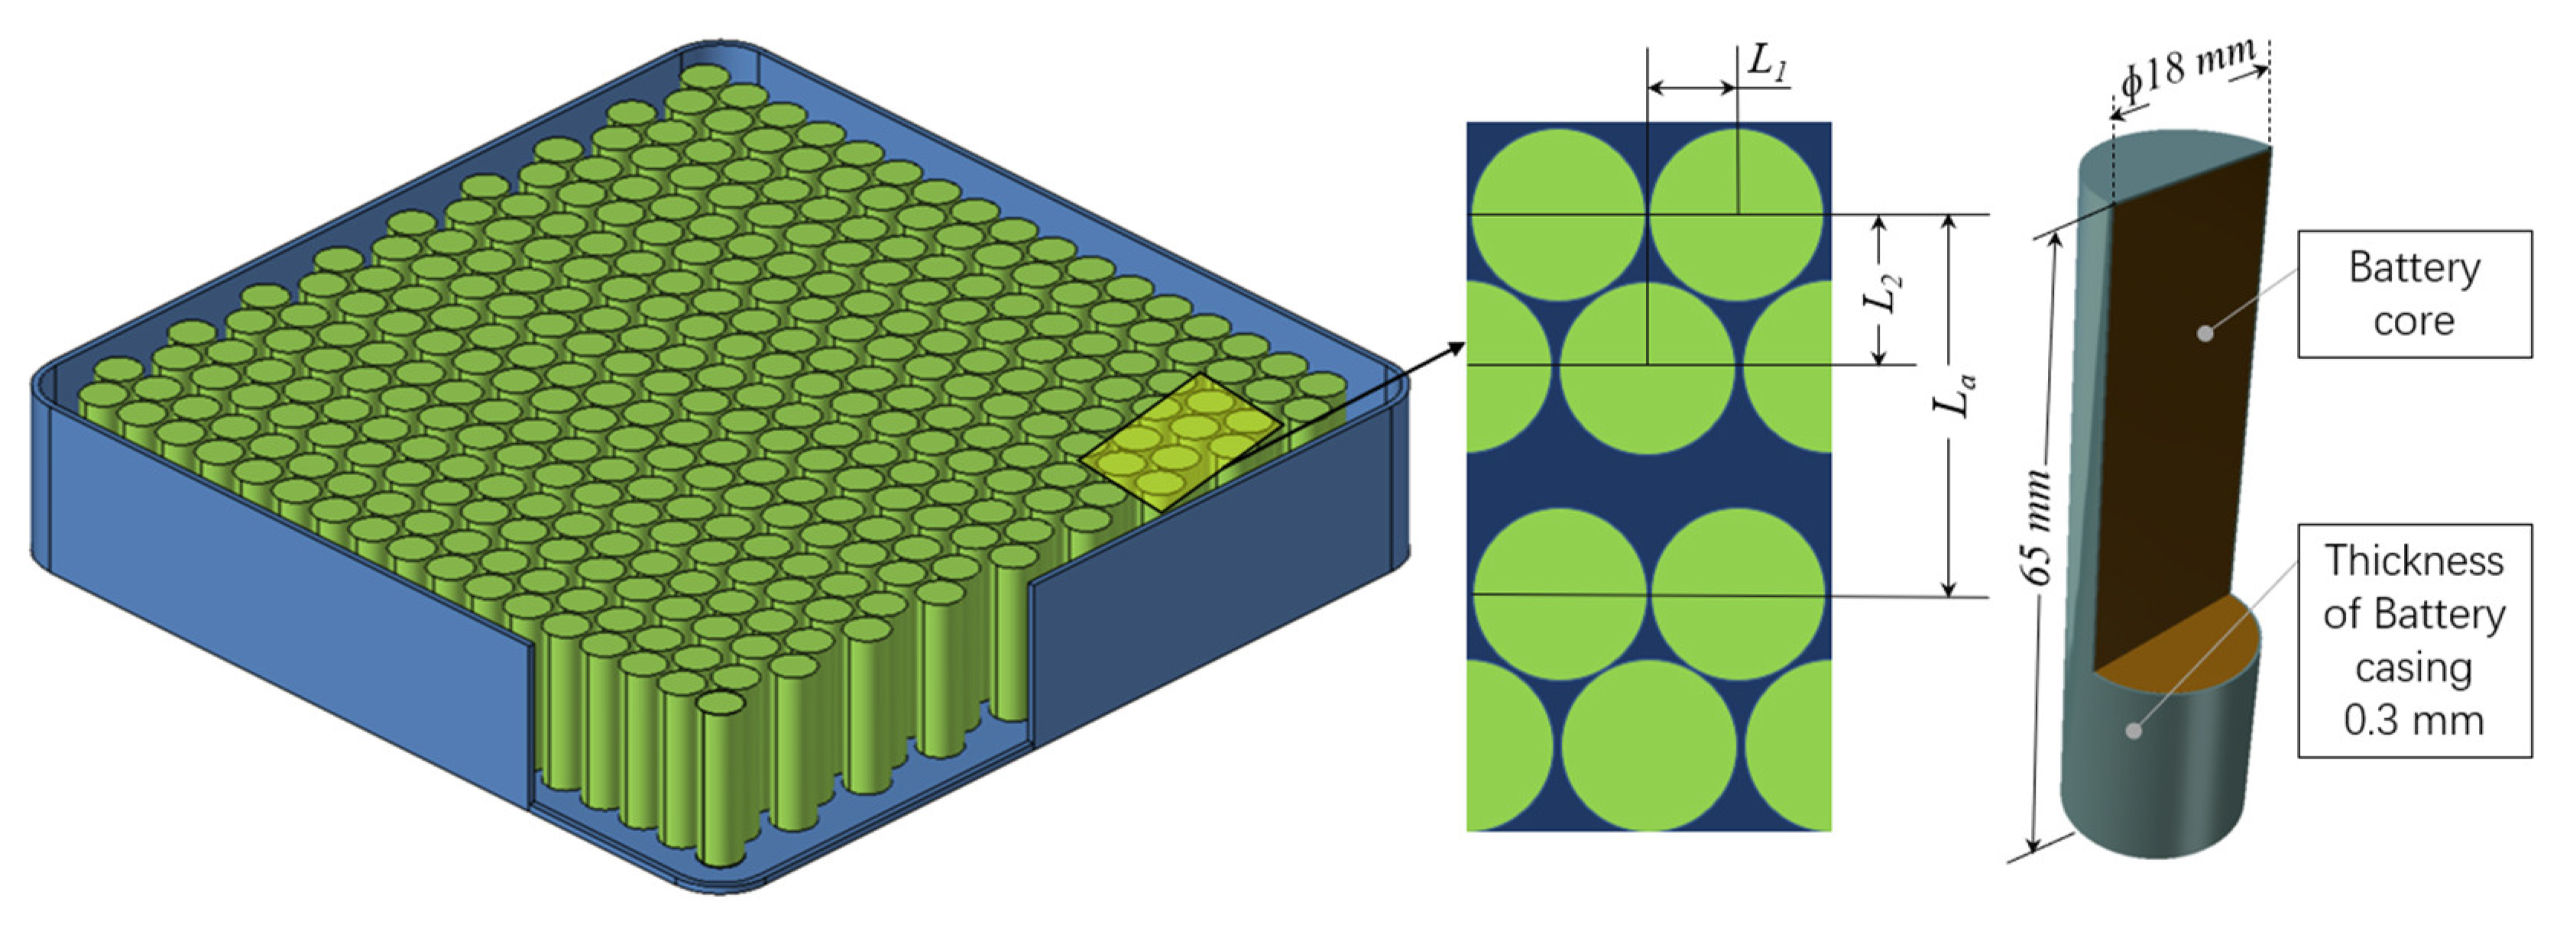
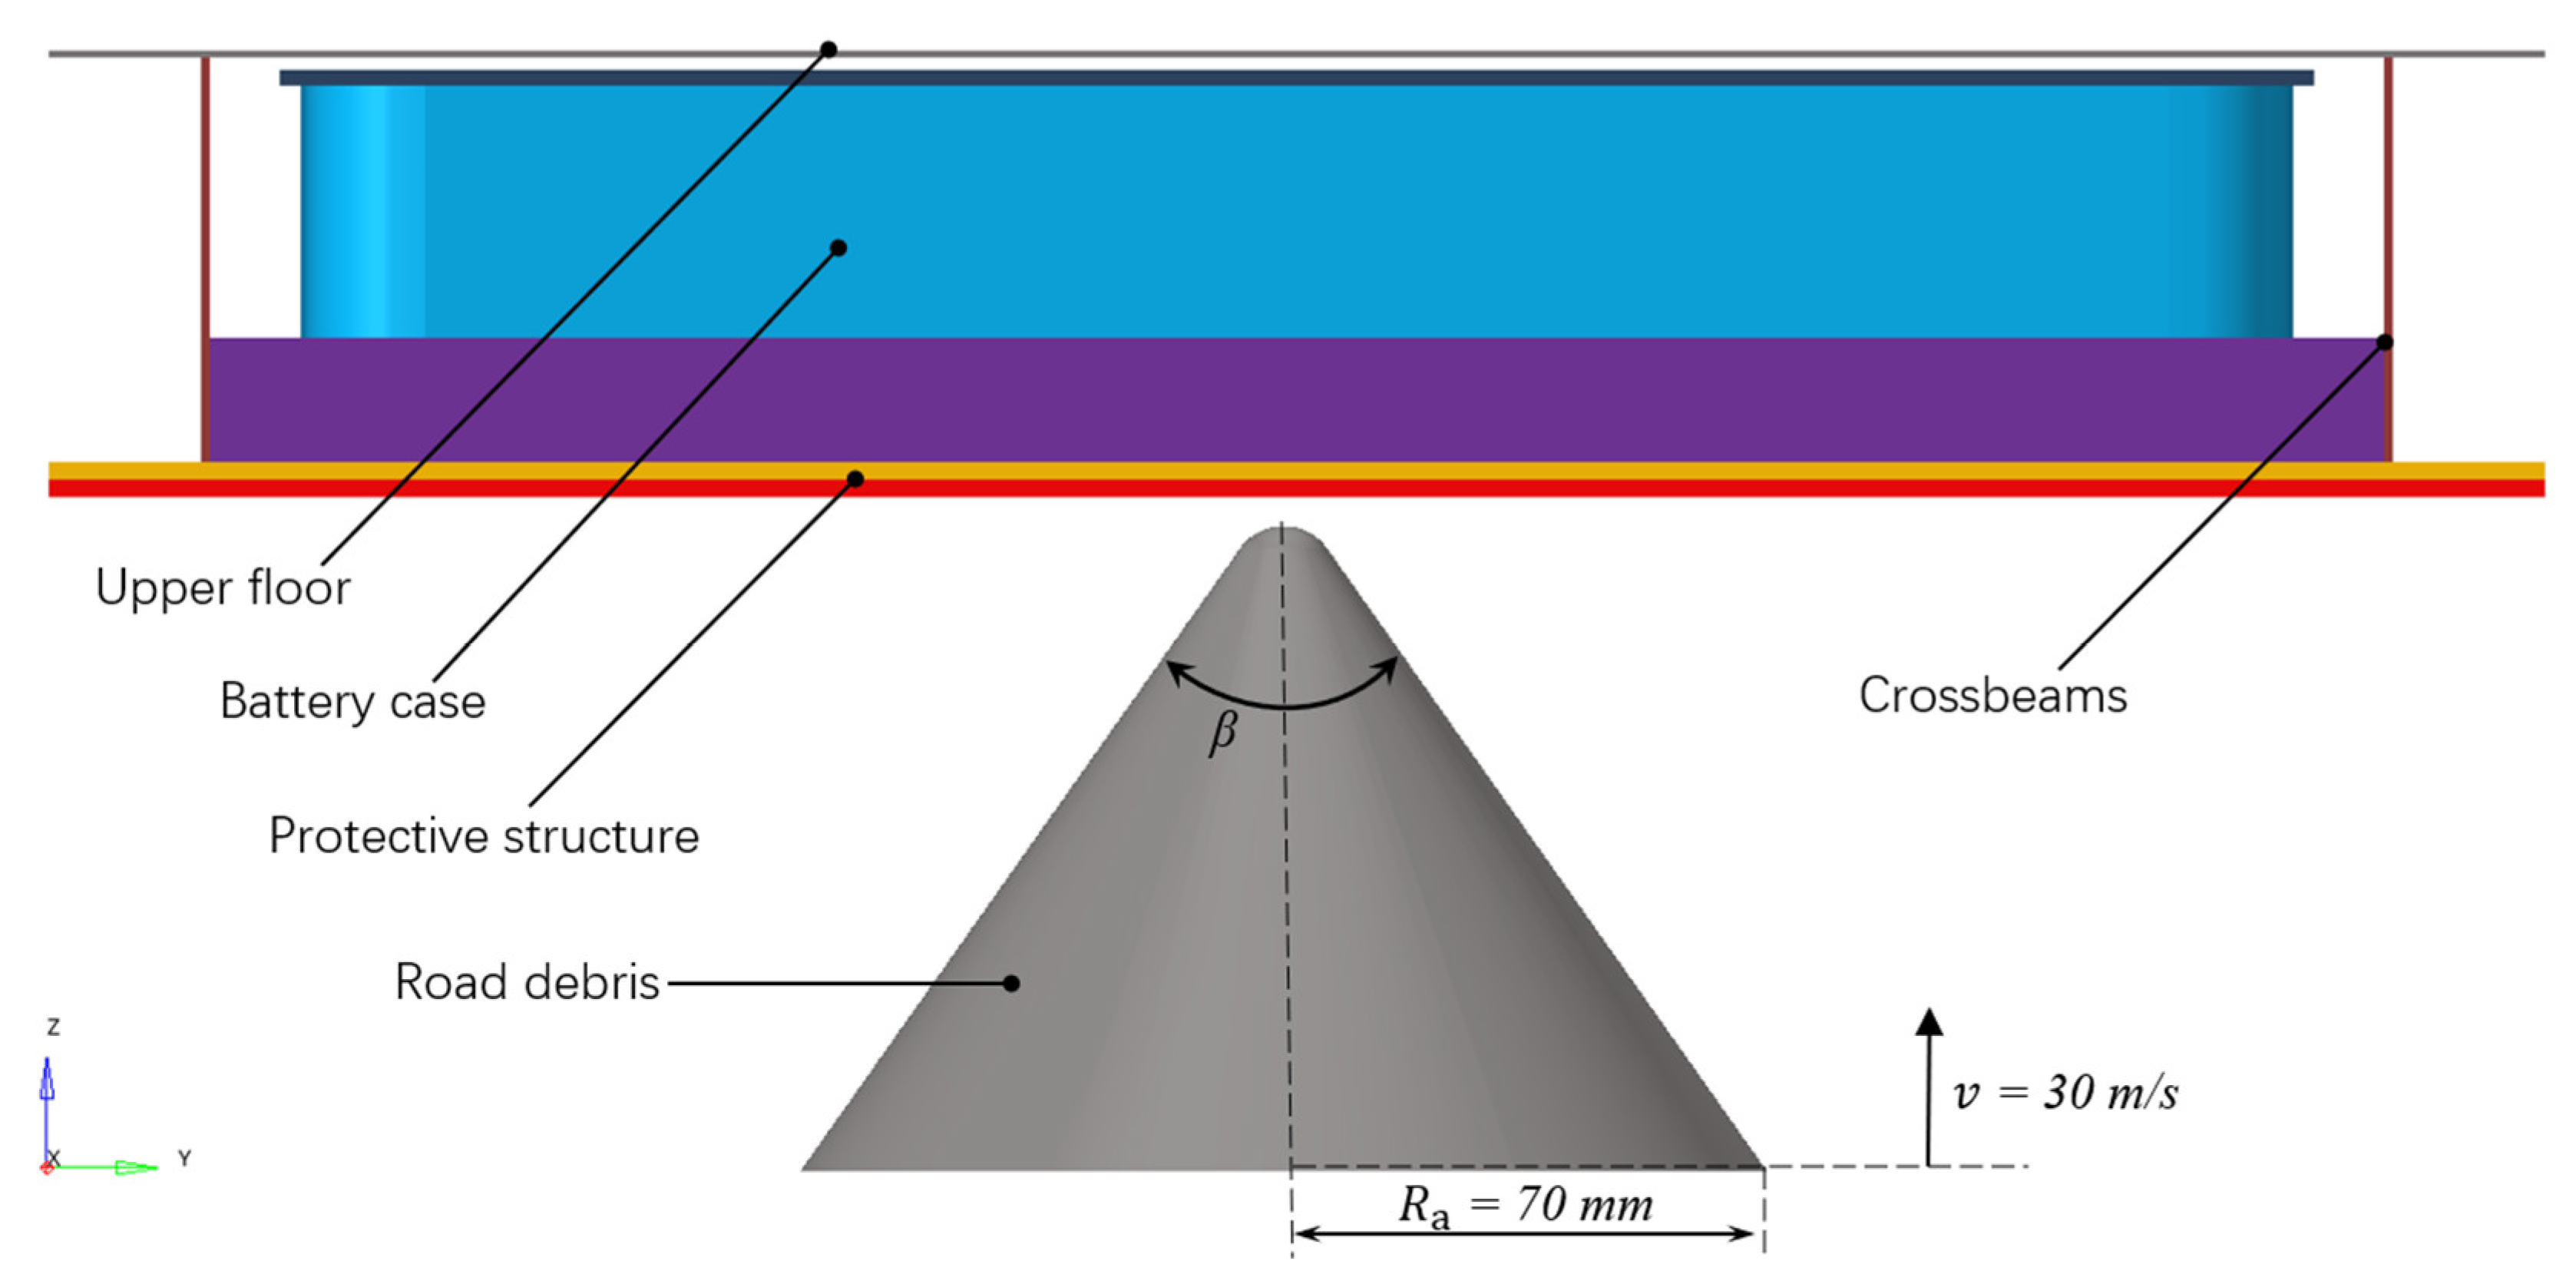
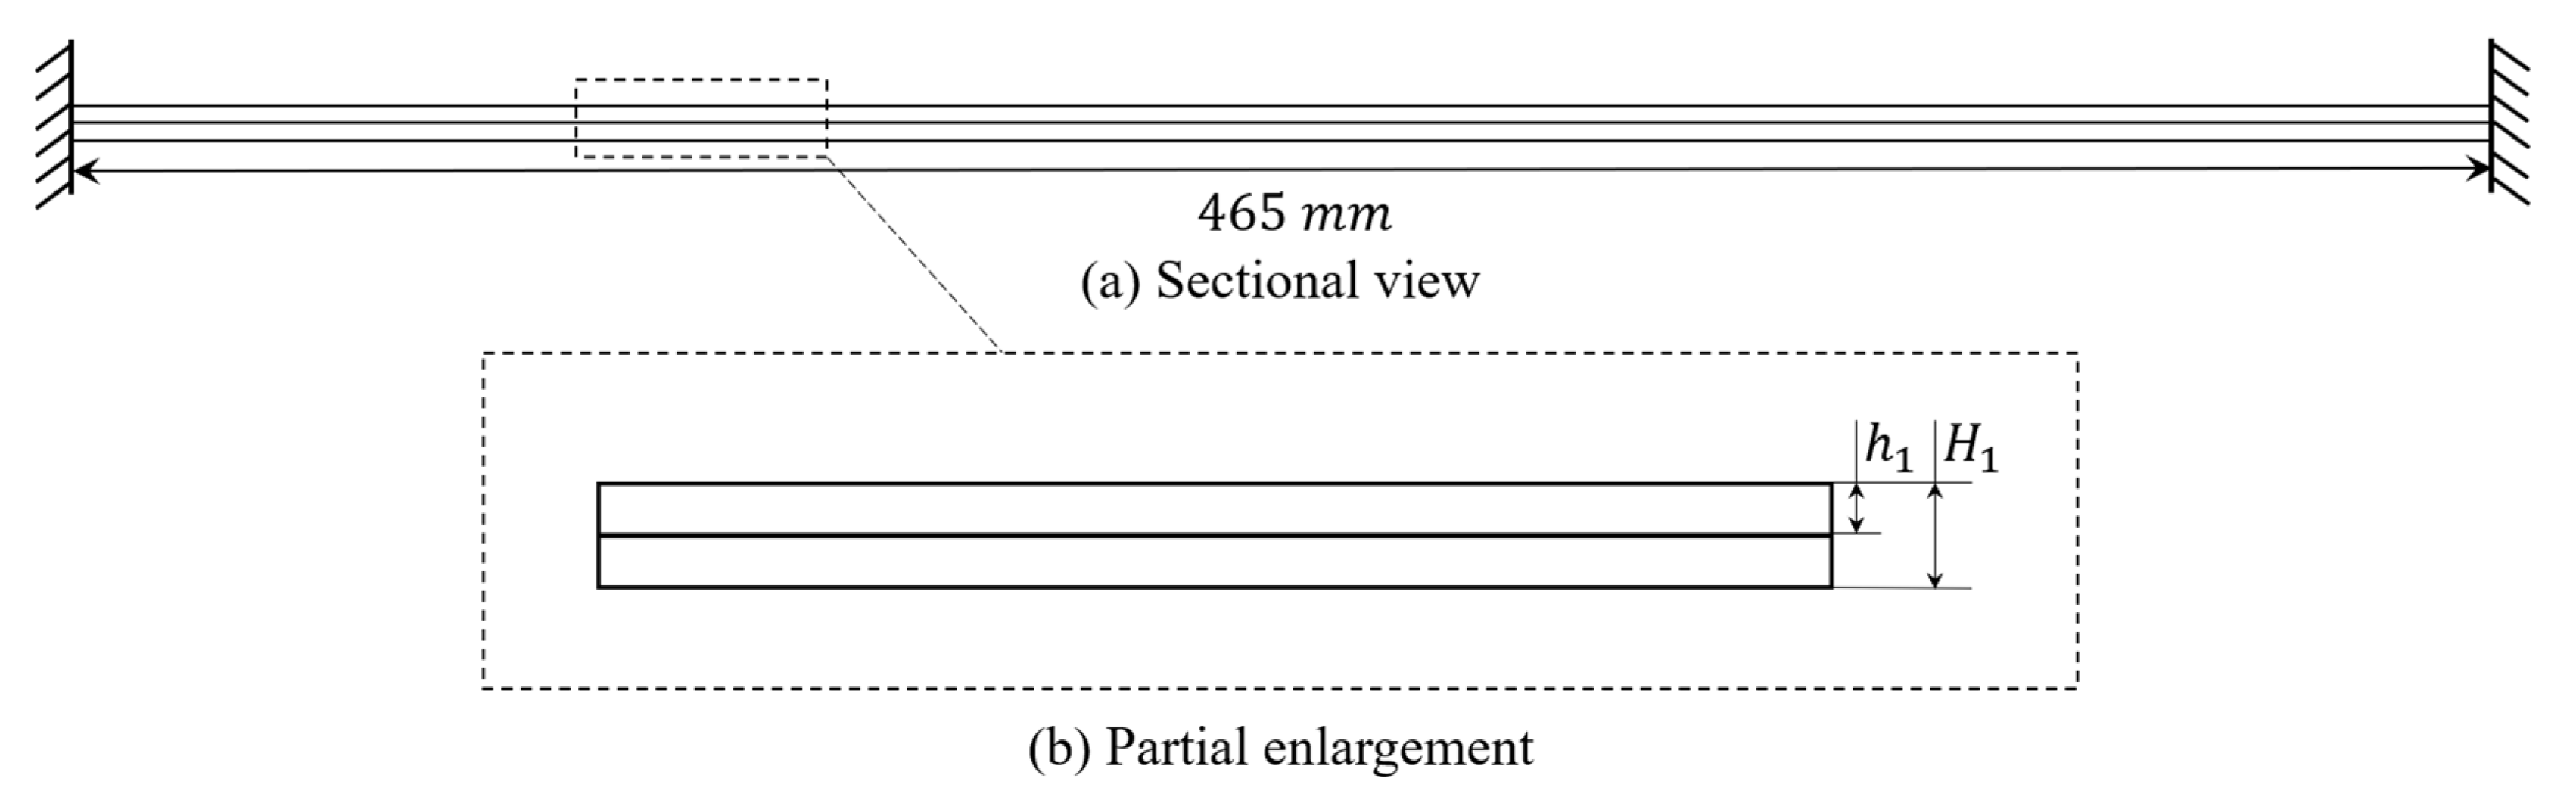
2.1. Structure of the Model

The Tesla Model S battery system structure was used as a model reference [25]. The power battery case system of an electric vehicle can be divided into six parts from top to bottom: the passenger floor, the top cover of the battery case, the battery pack, the battery case body, the crossbeam, and the protective structure, as shown in Figure 1. Among them, the passenger floor and the bottom protective structure have the same size, with a thickness of 1.5 mm; the left and right crossbeams have a size of 445 mm × 75 mm × 1.5 mm; the front and rear crossbeams have a size of 405 mm × 23 mm × 1.5 mm, which are used for the restriction of the modules and to enhance the overall rigidity/structural strength of the battery case; the overall size of the battery case is 365 mm × 365 mm × 73 mm; the thickness of the case is 3 mm; the single battery in the battery pack is a 18,650 lithium-ion battery; there is a 2 mm gap between it and the top cover of the batteries case as the buffer space for the collision; and the relevant standards and design determine the thickness of the protective structure.
As shown in Figure 2, the 18,650 battery has a cross-section diameter of 18 mm and a height of 65 mm, and its internal structure can be divided into two parts: the battery core and the steel battery casing with a thickness of 0.3 mm. The model construction needs to take into account the arrangement of inter-cell cooling tubes under actual working conditions. The battery cells are arranged in the battery case in a group of two columns in parallel, with the two columns of single cells in the group staggered. The transverse distance L1 and longitudinal distance L2 between neighboring cells in different columns in the group are 9 mm and 16 mm, respectively, and the spacing La between groups is 38 mm and parallel.

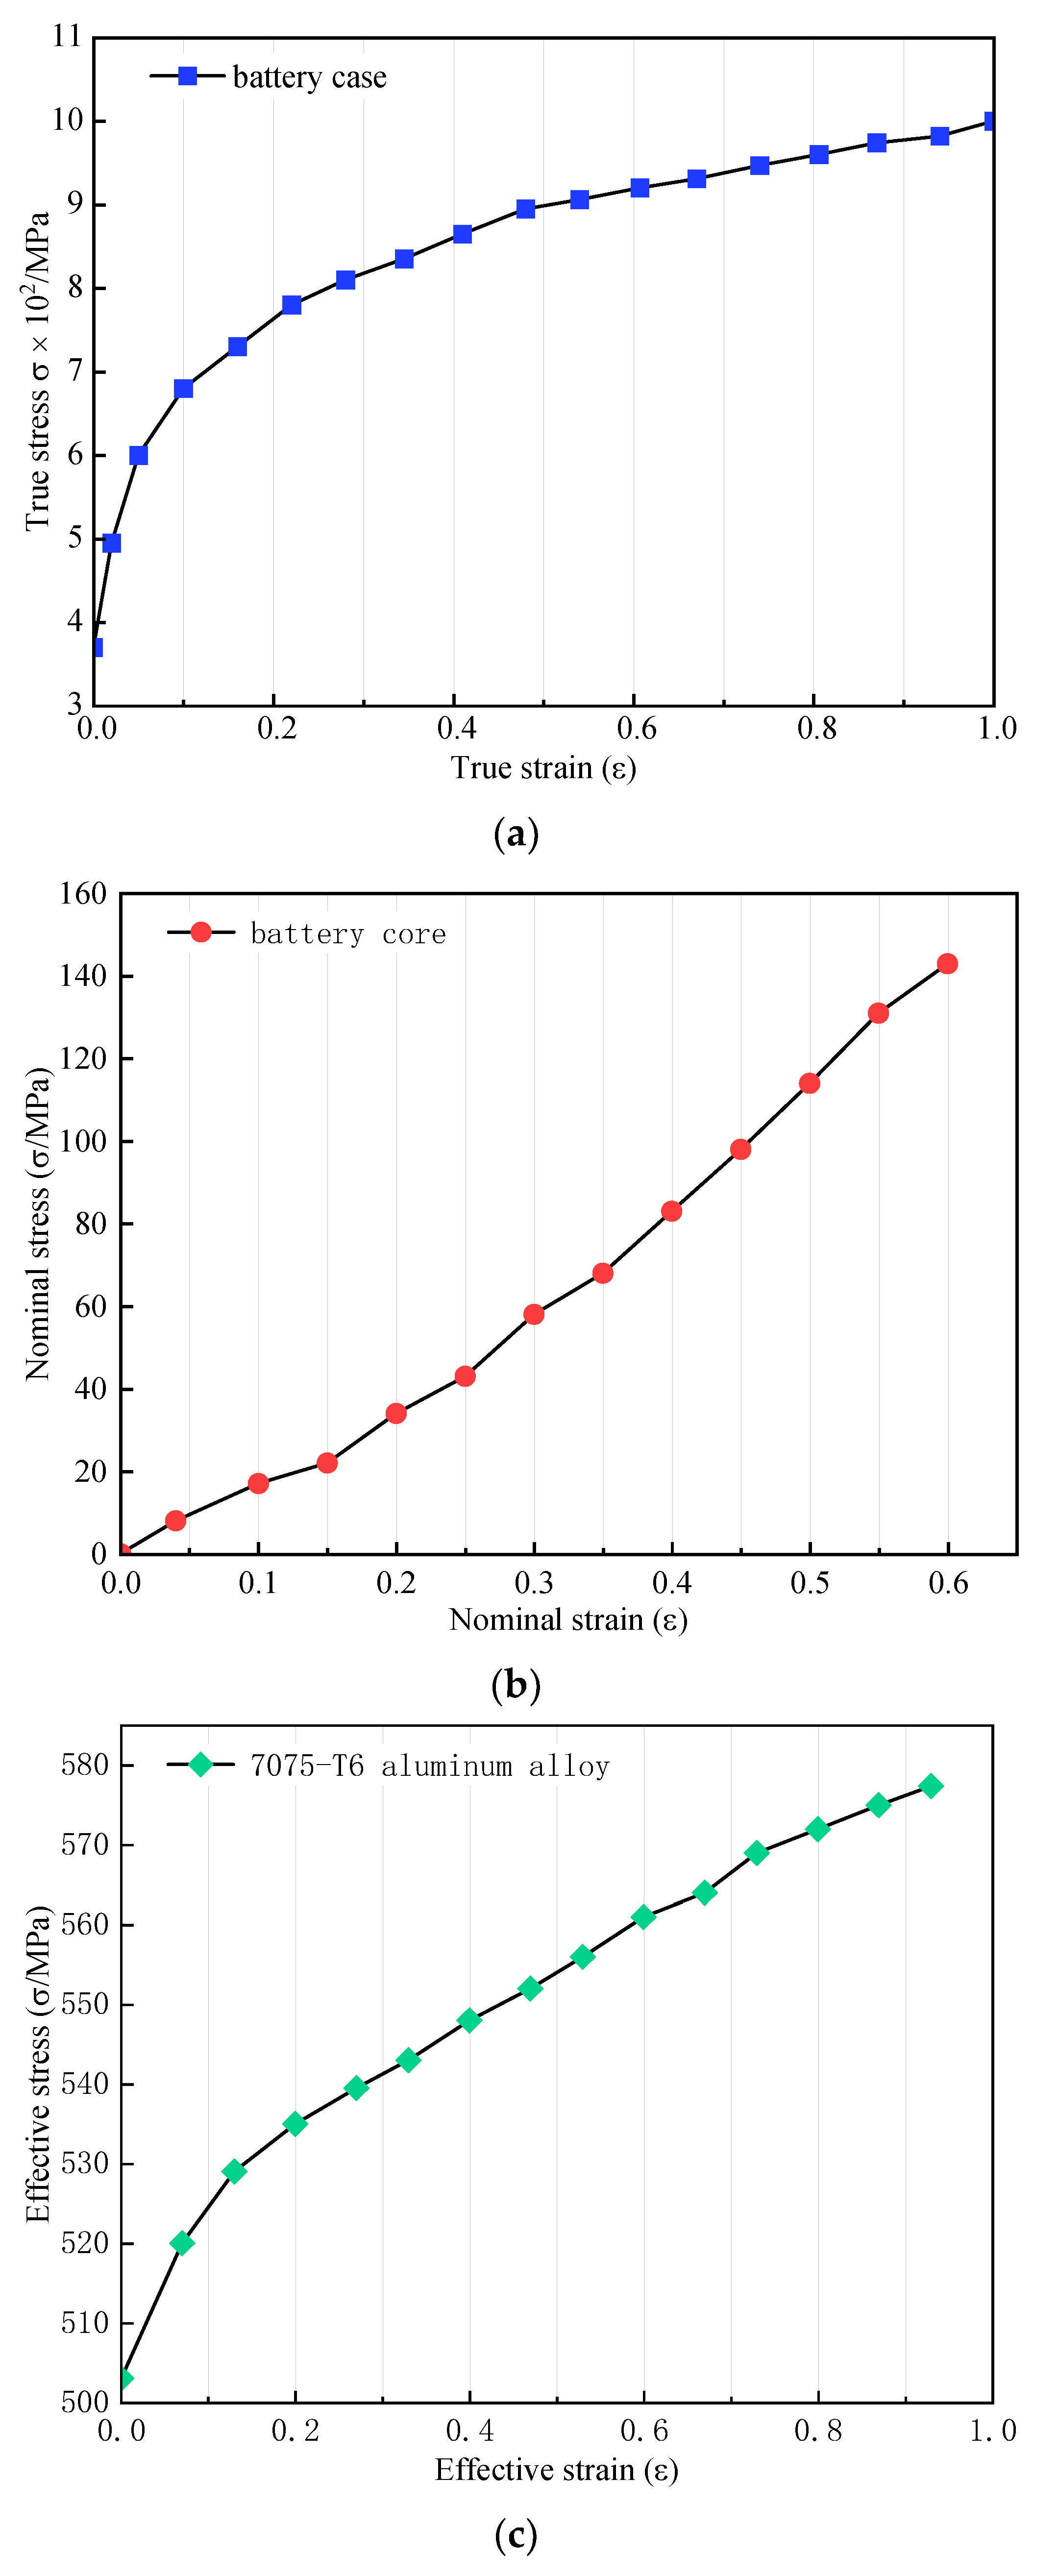
2.2. Materials and Parameters

To consider the lightweight and structural strength, the automotive industry commonly adopts high-strength composite materials such as aluminum, magnesium alloy or steel. Aluminum alloy materials are increasingly favored for their low density, wear and corrosion resistance, high specific strength and stiffness, easy processing, and recyclability. It has also become the primary application material for automobile manufacturers in various countries to reduce the weight of the vehicle while safeguarding the structural strength of the vehicle [26,27]. In this study, the 7075-T6 aluminum alloy, which has the most superior performance, was uniformly used as the material for the floor, protective structure, crossbeam, and battery case, and the material for the battery casing was soft steel. The models were all simulated using the 24-gauge ideal elastic–plastic material intrinsic model MAT_PIECEWISE_LINEAR_PLASTICITY [28]. The road debris, on the other hand, defaulted to heavy concrete material, which is widely used in infrastructure construction and was defined as a rigid body in the model using the MAT_RIGID tool. Avdeev et al. [29] showed that the battery core is volumetrically compressible, but the reaction force rises sharply under significant compression, and its elastoplastic mechanical behavior and axial compression response are similar to those of compressible foam materials. Therefore, the battery core was homogenized using the 63 compressible foam MAT _CRUSHABLE_FOAM model [30]. Compared to other models, the homogenization model ensures efficiency and accuracy in the whole vehicle or battery pack crash studies [31,32]. The mechanical property parameters of each component material in the model are shown in Table 1.
In finite element analysis, the stress–strain curve of the material is significant, and an accurate stress–strain curve can make the deformation of the model closer to the actual situation when it is subjected to a load in the simulation process, which is directly related to the accuracy and reliability of the model. According to the data in the existing related studies, the stress–strain curves of the three materials required for simulation are organized and shown in Figure 3 [33,34,35].

2.3. Finite Element Mesh Loads and Constraints

The model prototype was drawn using CATIA P3 V5R21 software and imported into Hypermesh 2022 software for pre-processing. The LS-DYNA_SMP_R13 mode was selected in the Hypermesh 2022 software to establish the impact-resistant finite element model of the battery case system. As shown in Figure 4, the degrees of freedom at the edges of the floor and protective structure were entirely restricted to simulate the system’s constraint by the body structure. A weld constraint connection is required at the connection of the cross member to the floor and protective structure, constraining the internal battery case. The obstacle acts on the bottom center of the system: the radius of the bottom surface of the conical head Ra was 70 mm, the cone angle β was 60°, the initial velocity of the impact was set to 30 m/s, and the direction was vertical up. According to the “Requirements and Test Methods for Bottom Crashworthiness of Pure Electric Passenger Vehicles” issued by the Chinese Society of Automotive Engineering, the impact energy endured by the bottom of the vehicle should be within the range of 120 ± 3 J. The collision energy was adjusted by changing the density of the obstacle, and the initial kinetic energy was limited to the range of the test requirements.
The contacts between the models are shown in Table 2. In addition, the battery casing and battery core have an adhesive relationship in actual working conditions, and it is necessary to use the CONTACT_TIED_NODES_TO_SURFACE_CONSTRAINED_OFFSET control card to set the contact between the two. In order to balance the simulation efficiency and accuracy, it is necessary to ensure that the number of cells on the minor feature edge is not less than three. The mesh size of each component in the model is confirmed by comparing the simulation effect of a simple model with this mesh size. The mesh size of the simple model with the best simulation results is the optimum mesh size for that component. Through comparison, it is found that the optimal mesh size for the protective structure is 3 mm; the optimal mesh size for the upper floor, the battery case, and the crossbeams are all 4 mm; and the optimal mesh size for the battery casings and the battery cores are 1 mm. The battery model can reflect the protection effect intuitively, and it needs to show the force and deformation sensitively. Hence, the mesh sizes of the battery casings and the battery cores are smaller. In the simulation, the model of the road debris needs to be set as a rigid body, so the mesh size of the road debris model is not required.

3. Results

3.1. Thickened Double-Layer Protective Structure

In order to enable electric vehicles to withstand the bottom of the standard driving process encountered in the collision, the relevant manufacturers use a variety of ways to strengthen the strength of the battery case body and the bottom of the car. Currently, the most obvious method is to use high-strength composite materials and high-strength structures to construct battery cases and protective structures at the bottom of the car. Compared with single-layer structures, double-layer structures in the vertical direction have a significant increase in structural strength; not only does the load-bearing capacity become more assertive, but resistance to mechanical impact from road debris is also more robust. In previous studies, the 6.35 mm thick single-layer structure has shown an insufficient protective effect in high-speed collision aluminum. Therefore, in this study, two plates made of the same specification 7075-T6 aluminum alloy were stacked to form a double-layer structure as a protective structure for the bottom of the power battery case. The total thickness H1 of the structure in the vertical direction was increased to 6.5 mm. As shown in Figure 5, the thickness of both layers of protective sheets was h1 = 3.25 mm.
In this study, the famous honeycomb structure and arch structure were used as the core layer of the protective structure by combining the actual application situation and the basis of previous research. On the premise of ensuring that the sandwich structure is of the same quality as the double-layer structure, the arched sandwich protective structure and the reinforced hexagonal honeycomb sandwich protective structure have been designed. Finally, the differences between the two were compared regarding the crash protection effect on the bottom of the electric vehicle power battery case.

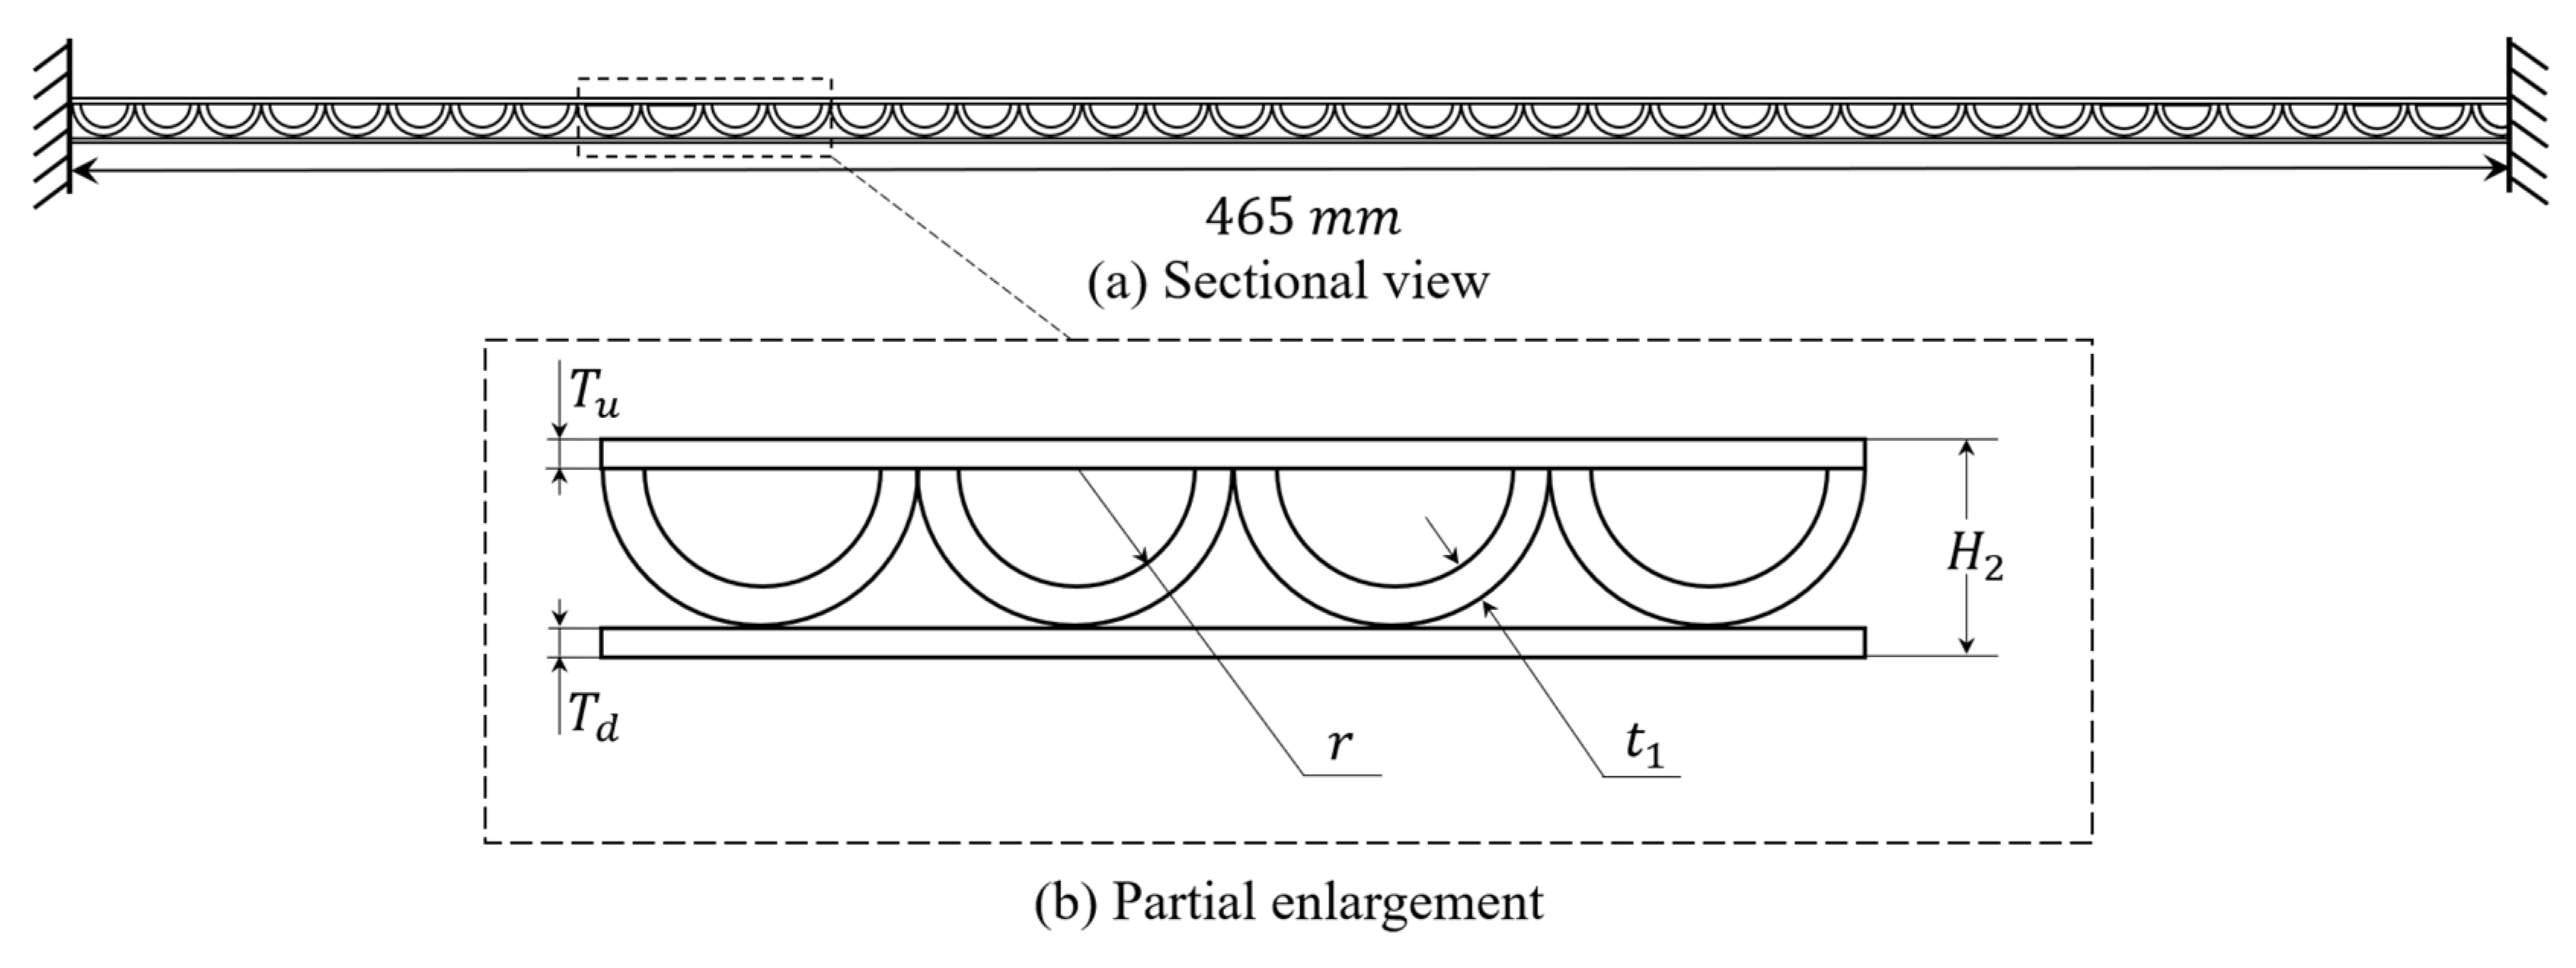
3.2. Hollow Arch Sandwich Panel

Real-life bridges, roofs, doors, windows, and furniture can be seen on the arch. When the top of the arch is subjected to a considerable force, it can be decomposed into the downward pressure at both ends and outward thrust. As long as it can withstand the outward thrust at both ends of the arch, the structure can withstand a considerable force.
As shown in Figure 6, the arch structure adopts a semicircular structure with similar morphology to a square circle between two aluminum alloy plates with a thickness of Tu = Td = 1.5 mm. The thickness of the sandwich structure is the inner circular radius of the arch structure, the thickness of the arch structure, the thickness of the upper and lower two layers of aluminum alloy plates, and the sum of the thickness of the arch structure. For a semicircular arch structure as a standard unit, set the number of standard units contained in the cross-section of the arch structure be n2, the arch structure of the inner circular radius to r, and the thickness of t1, the height of the arch sandwich structure to H2. There is a relationship between these terms, as shown in the following formula:
n 2 = 465   mm 2 × r + t 1
The isovolumetric formula for a protective structure is
465   mm × 445   mm × 1.5   mm × 2 + π r + t 1 2 π r 2 2 × 445   mm × n 2 = 465   mm × 445   mm × 6.35   mm
The relationship between the height of the arched sandwich structure H2 and the circular radius r on the inside of the arch structure is
H 2 = 1.5   mm × 2 + r + t 2
The thickness t2 of the arch structure was taken to be 2.5 mm, which was calculated by combining Equations (1)–(3):
r = 6   mm
H 2 = 11.5   mm
In this study, the arch sandwich structure was made of 7075-T6 aluminum alloy, and the height was set to 11.5 mm. The vault in the sandwich layer of the structure is directed downwards to absorb the mechanical impact energy of the road debris.

3.3. Reinforced Hexagonal Honeycomb Sandwich Panels

In nature, regular hexagonal structures exist in honeycombs, such as in the molecular structure of graphite and benzene, on the back of tortoise shells, and on other occasions; it is widely used in architectural and industrial products because of its sufficient stability, more straightforward processing, and beautiful appearance. This structure inspired by nature is called the honeycomb structure. The aerospace industry uses a honeycomb structure as a protective structure for the bottom of a power battery case. Honeycomb sandwich structures can be categorized into regular hexagonal honeycomb structures, side-stretching honeycomb structures, single-curve flexible honeycomb structures, reinforced hexagonal honeycomb structures, and so on, according to the difference in structure geometry. Among them, the reinforced hexagonal honeycomb sandwich structure has the highest structural strength, so it was chosen as the bottom protective structure. As shown in Figure 7, the reinforced hexagonal honeycomb sandwich structure consists of upper and lower layers of 1.5 mm thick plates, two layers of a trapezoidal wave-like structure composed of a honeycomb structure, and a middle reinforcing plate. The hexagons composed on its structure are regular hexagonal, and the whole sandwich structure presents the morphology of a honeycomb-like structure. The materials were 7075-T6 aluminum alloy. At the same time, to ensure an equal mass of the protective structure, the thicknesses of the trapezoidal wavy structure and the reinforcing plates were obtained by calculation. From the geometric relationship shown in the figure, let the internal hexagonal cavity side length be L, the thickness of the three-layer aluminum alloy plate composed of the sandwich structure be t2, and the height of the reinforced hexagonal honeycomb sandwich structure be H3. The equal volume formula is as follows:
465   mm × 445   mm                                                       × 1.5   mm × 2 + t 2 + 4 L L + L × c o s 60 ° × 2 + L × t 2 × 2                                                       = 465   mm × 445   mm × 6.35   mm
The relationship between the height H3 of the reinforced hexagonal honeycomb sandwich structure and the side length L of the internal hexagonal cavity is
H 3 = 1.5   mm × 2 + t 2 × 3 + L × s i n 60 ° × 2
On the premise of ensuring that the thickness of the sandwich structure is less than 20 mm, L is artificially set to 5 mm, which can be obtained by combining Equations (6) and (7):
t 2 = 0.91   mm
H 3 = 14.39   mm

4. Discussion

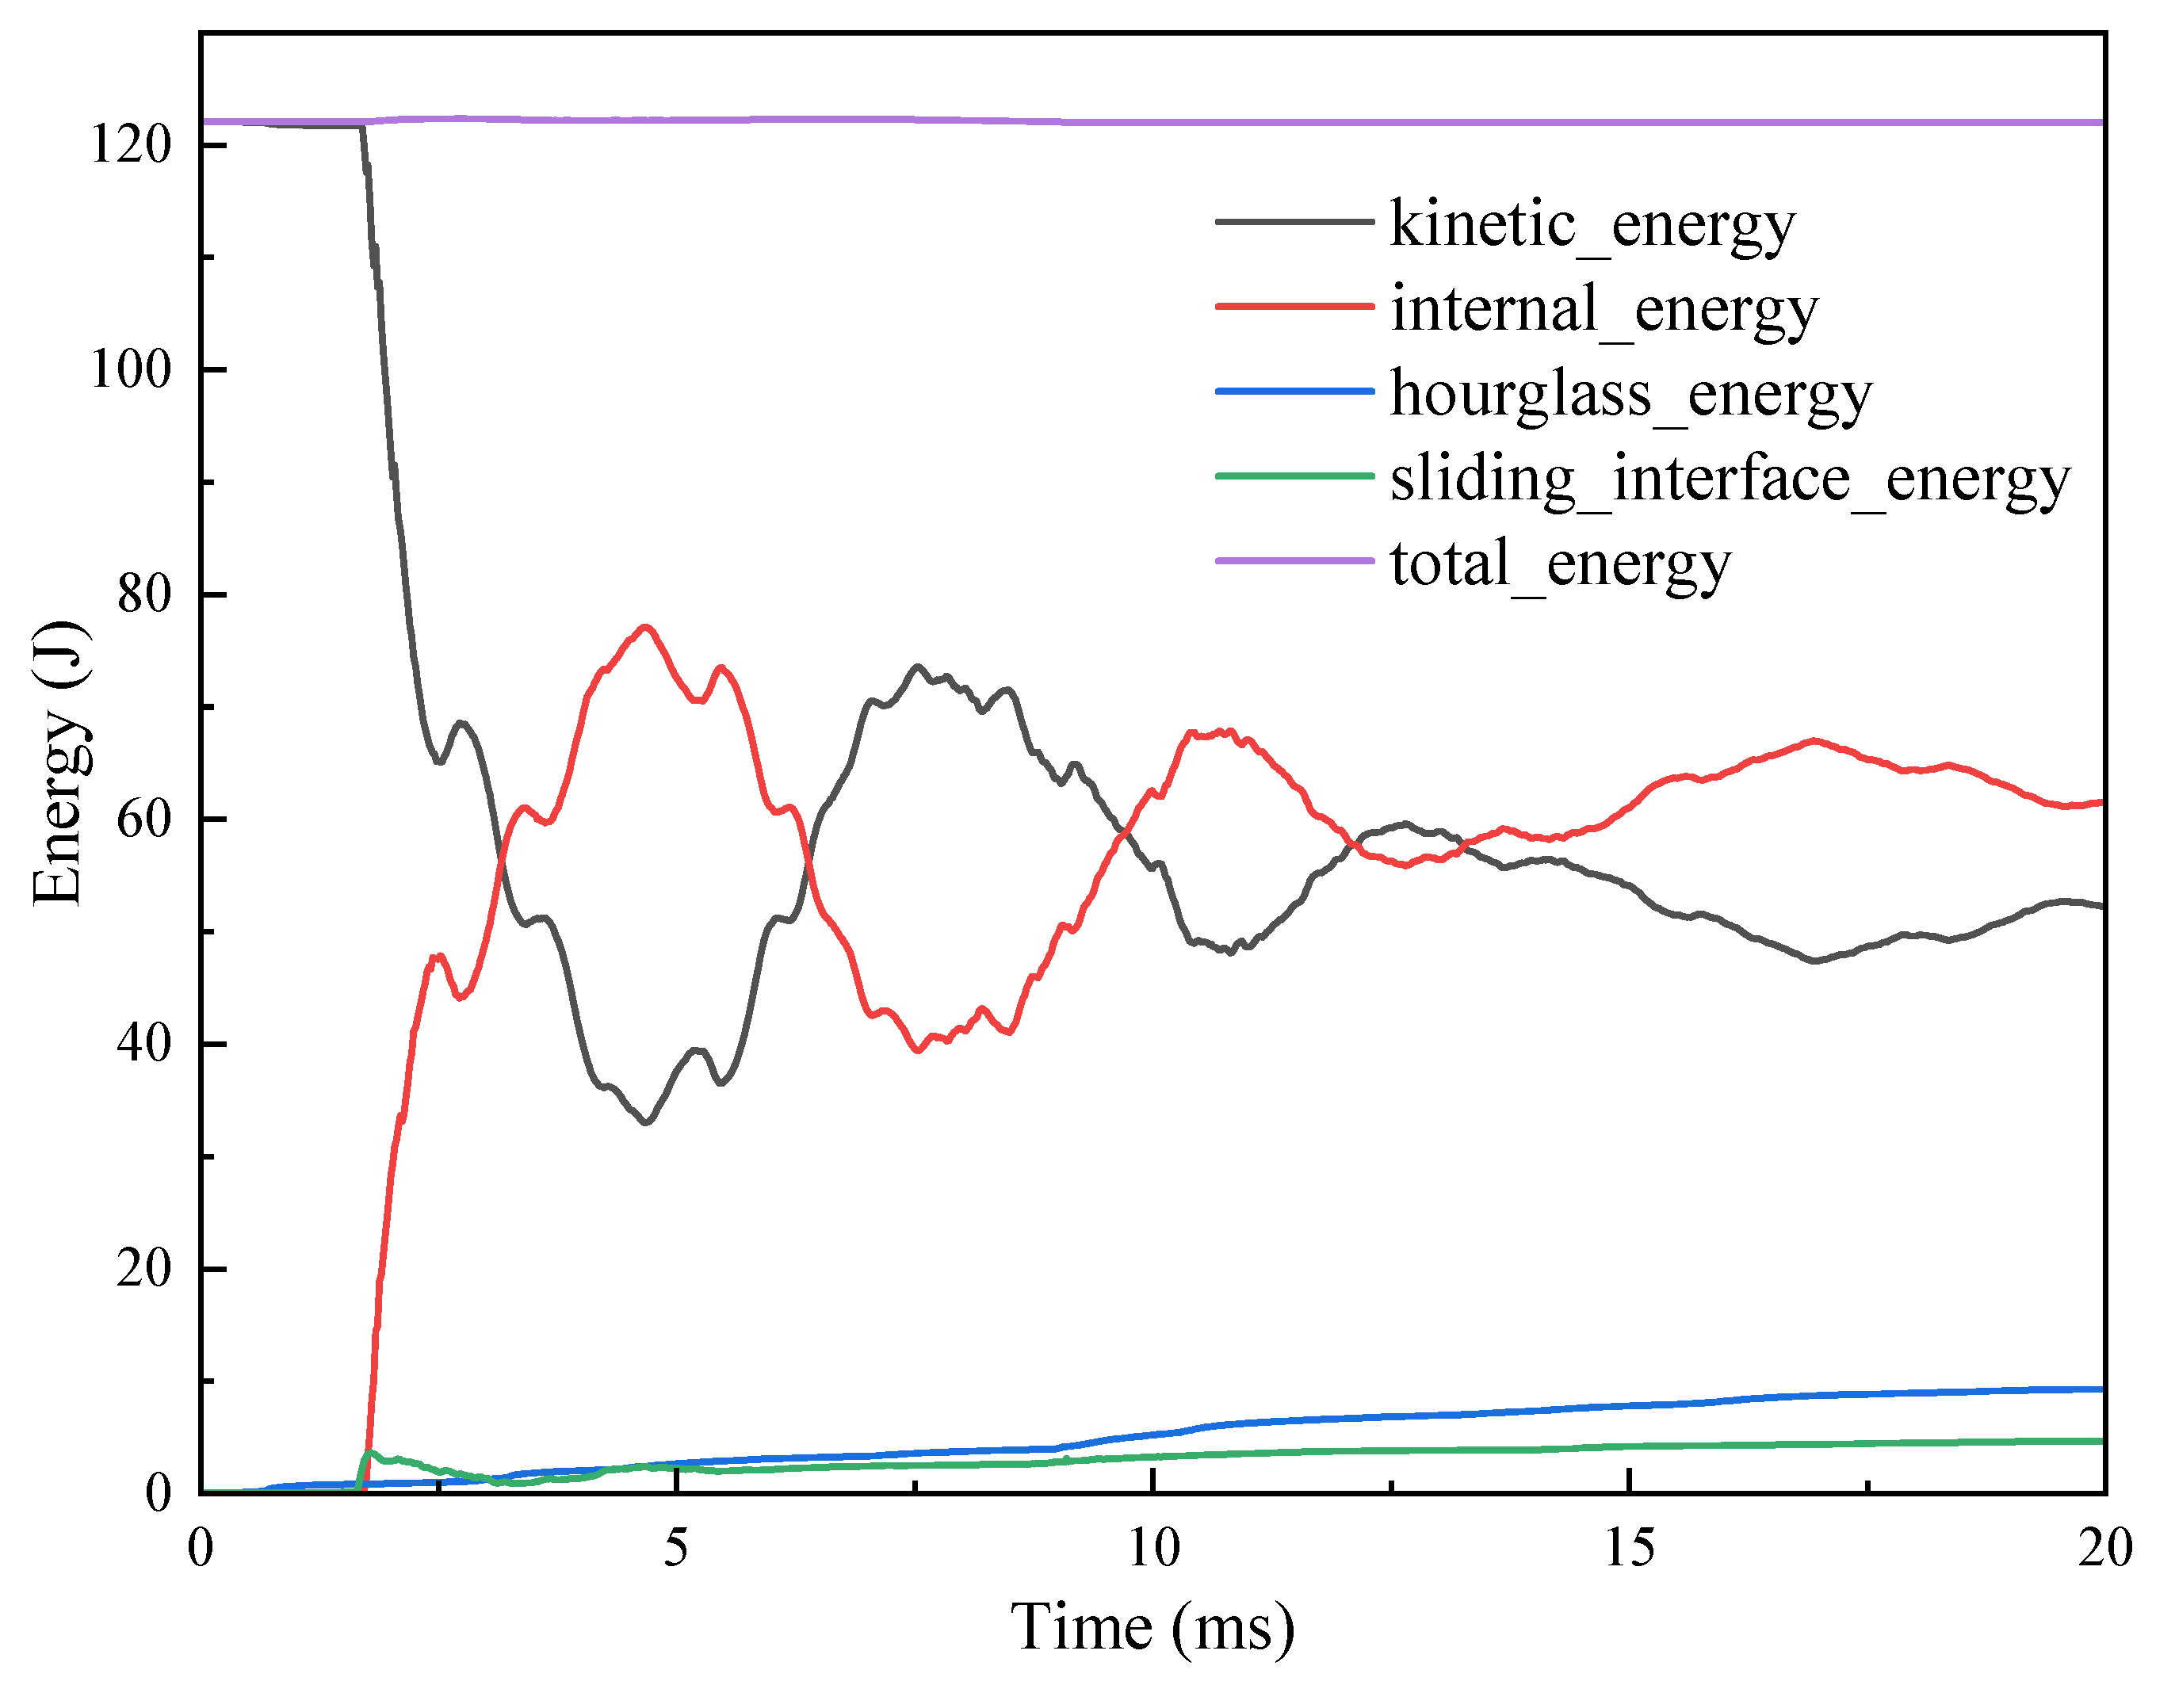
4.1. Feasibility Analysis of Simulation Calculation

The unreasonable selection of contacts between the models and algorithms during finite element simulation (FEM) can lead to sizeable interfacial slip energy (ISE) and the hourglass phenomenon, which affects the accuracy of the calculation results. The simulation involves a variety of integration algorithms and different contact algorithms, and the system will sometimes automatically increase the mass of some parts to ensure standard calculation. If the mass increases too much, it will also lead to the calculation results not being credible in the later stage. To ensure the accuracy and reliability of the calculation results, the 6.35 mm single-layer construction was used for the simulation under the experimental conditions, and the energy curves and mass gain curves were verified in the analysis process.
For general research problems, the simulation model is considered valid with a confidence level of 85%. As shown in Figure 8, all the energy curves did not change abruptly during the simulation, and the ratio of the total energy to the sum of internal energy and external work done is 1, which means that the model is energy-conserving. According to the simulation data, the mass gain curve of the model during the simulation is 0, which meets the requirement that the percentage increase of the mass curve should not be more than 5%, and the simulation results are valid.

4.2. Evaluation Indicators of Protective Effect

This study analyzed the stress distribution of different protective structures during the simulation process. At the same time, the maximum axial compression (Bc) of the battery monomer during the impact process, the protective effect parameter (ƒPE), and the total absorbed energy (Ea) of the protective structure were used as the evaluation indicators of the protective performance of the three structures. The protection effect parameter ƒPE is defined as follows:
f P E = c 0 c 1 c 0 × 100 %
where c0 is the maximum axial compression of the battery with the 6.35 mm homogeneous protection structure, and c1 is the maximum axial compression of the battery with the double-layer structure or sandwich structure. The higher the ƒPE value, the better the protection.

4.3. Analysis of Shock Response

In order to better analyze the energy absorption mechanism of different protective structures during a collision between the bottom of the battery case and the road debris, the results obtained from the LS-DYNA_SMP_R13 solution need to be post-processed. The obtained data were visualized through post-processing to analyze the stress distribution and propagation of the protective structures during collision.
Figure 9 shows the stress distribution on the protective structure when the kinetic energy of the road debris is fully applied to the model, with different stress distributions occurring on different structures. Figure 9a shows the stress distribution during a collision for the 6.35 mm homogeneous protective structure, on which the stress disperses outward from the collision point, and the energy in the center of the collision is concentrated and has a wide range of influence. Figure 9b shows the collision stress distribution during a collision for the double-layer structure. Although the total thickness of the double-layer structure is greater than that of the homogeneous structure, there is no connection between the two neighboring protective structures in the structure, which affects the overall structural strength. This results in more significant plastic deformation of the double-layer structure during a collision, and the stress distribution is more irregular and easy to transfer to a deeper layer. Figure 9c shows the stress distribution during a collision for the arched sandwich construction, where the collision stress is transferred along the protective structure and the internal arch structure, with the center of the collision absorbing more stress due to structural deformation. Figure 9d shows the collision stress distribution during a collision for the reinforced hexagonal honeycomb sandwich structure. Under equal mass conditions, the structure density of the reinforced hexagonal honeycomb sandwich structure is higher than that of the arched sandwich structure, and the stresses it suffers are diffused along the structure in a square shape. Because its structural strength is less than that of the arched sandwich structure, the center of impact is more likely to deform, resulting in a greater risk of puncture.

4.4. Comparison of Protective Effects

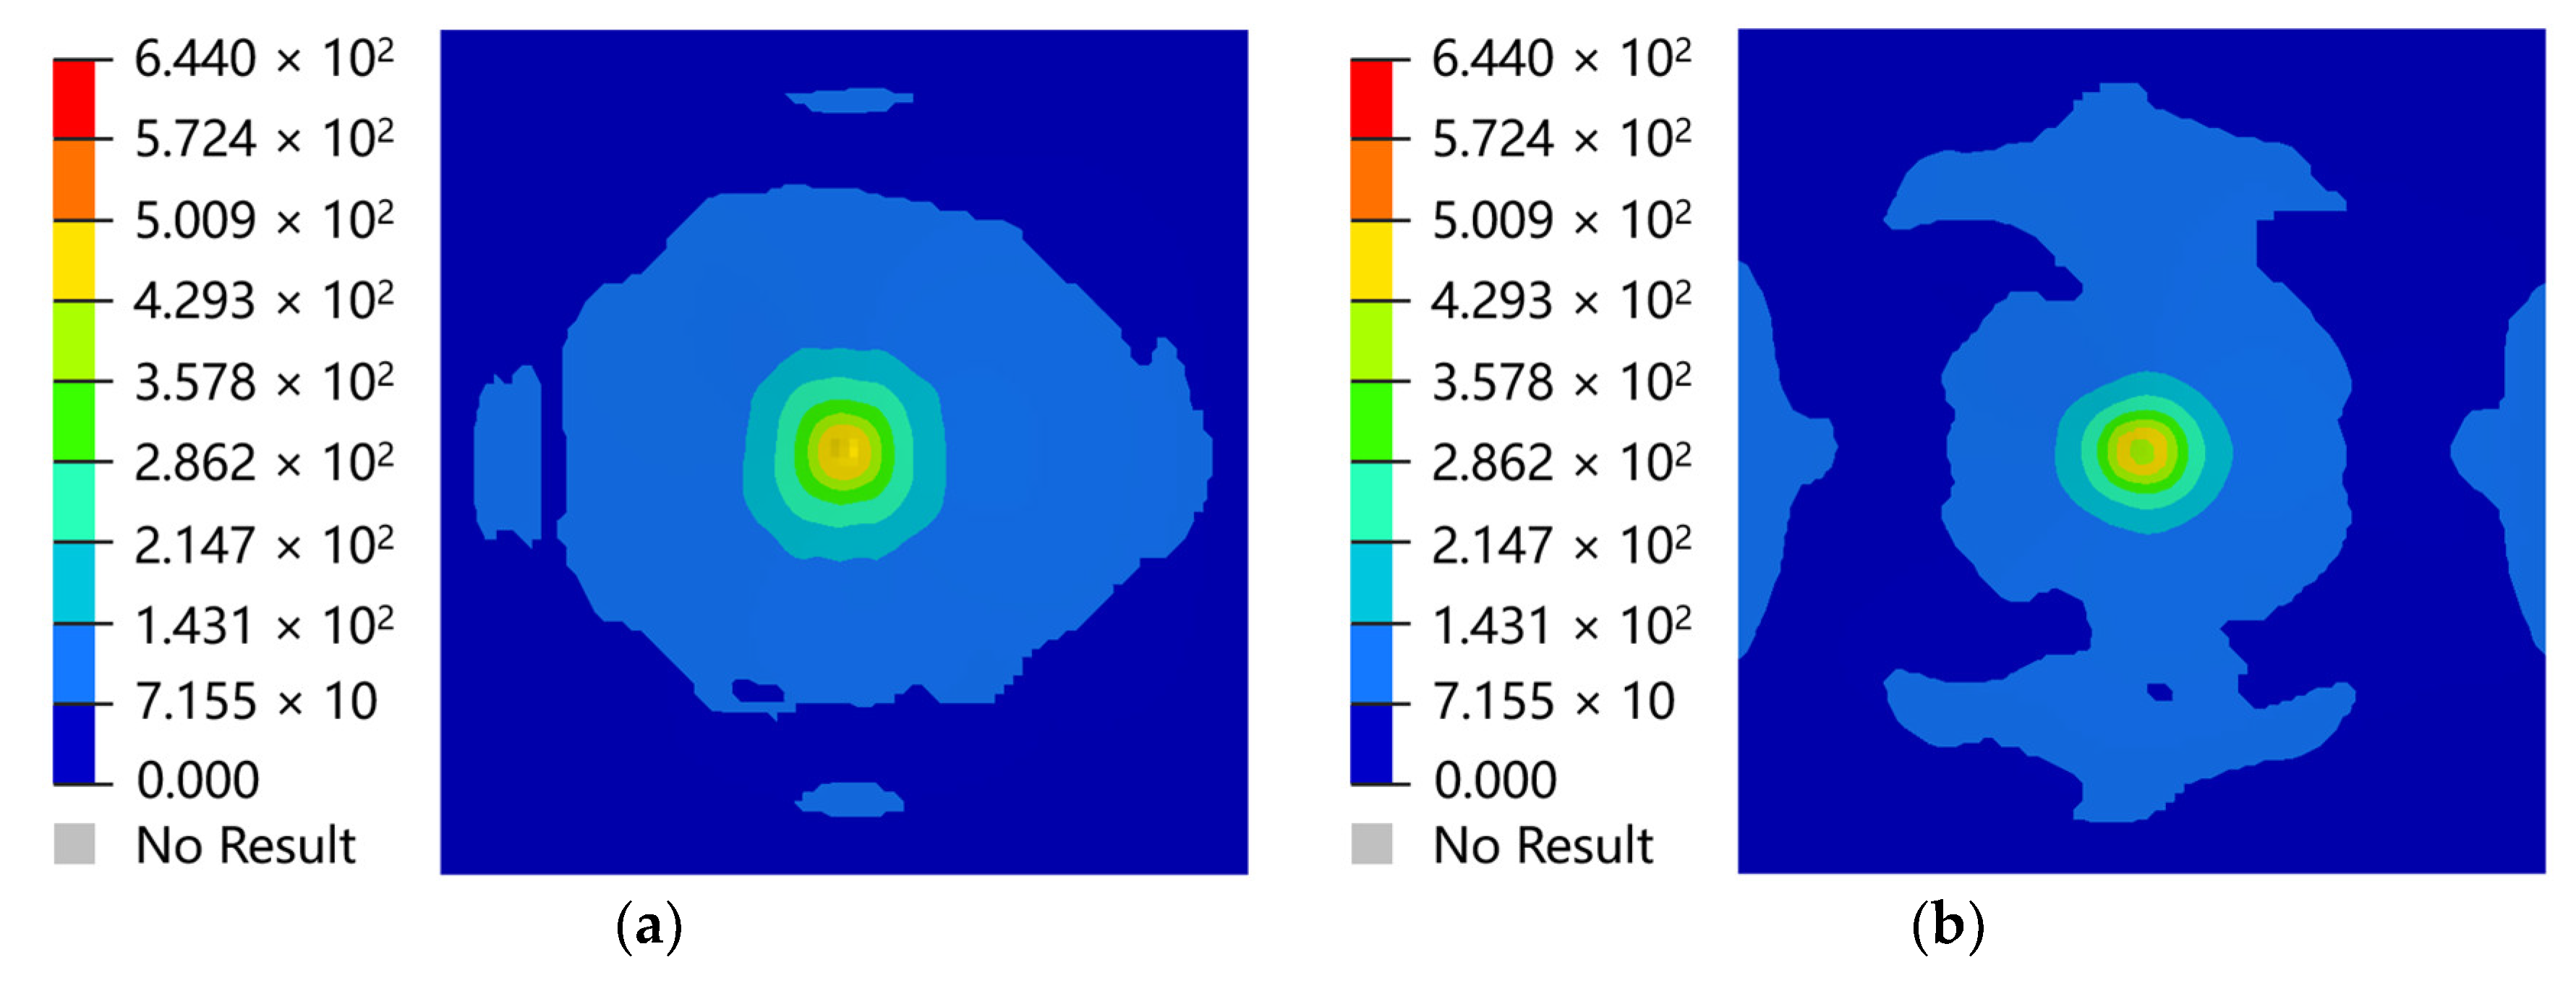
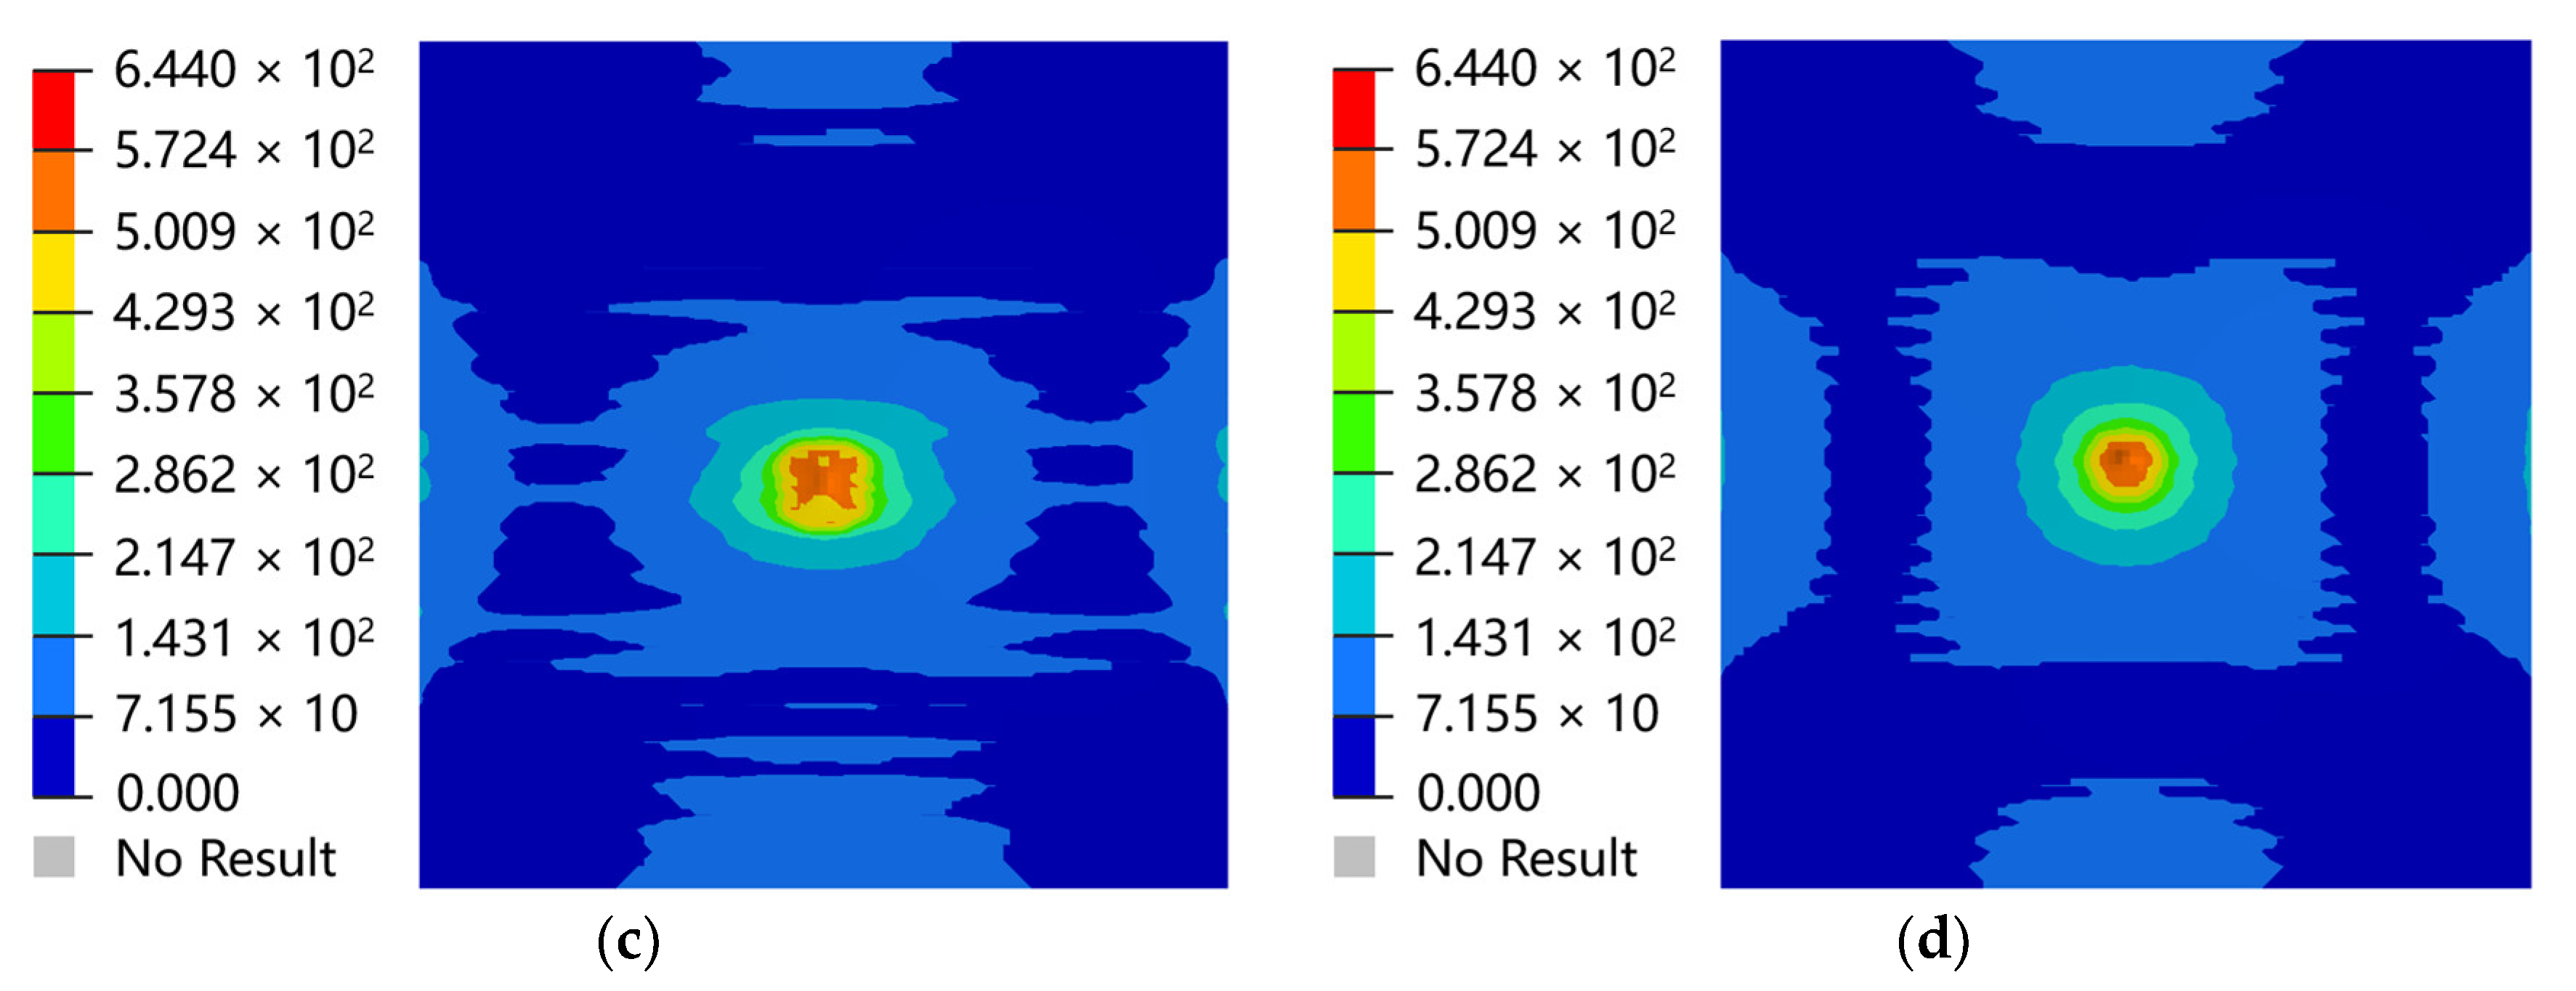
4.4.1. Analysis of Battery Axial Compression

The change curves of the axial compression of the battery corresponding to the homogeneous structure and the three protective structures with the collision time are shown in Figure 10. Figure 10 shows that the sandwich structure can effectively attenuate the degree of deformation of the power battery in the collision process. From the curves in the figure, it can be seen that the deformation trends of the batteries protected by the double-layer structure and the homogeneous structure are approximate. Both of them are subjected to the second impact because of the plastic strain of the protective structure after reaching the first peak, and then they gradually tend to be stabilized with the consumption of energy. Compared with the homogeneous and double-layer structures, the deformation curves of the power battery corresponding to the two sandwich structures are gentler. The deformation peaks occur earlier and stabilize faster due to the deformation of the core layer of the sandwich structure and energy absorption. The maximum deformation of the power battery under the protection of the arch sandwich structure is minor, which proves that the arch sandwich structure has a better protective effect on the power battery located in the upper layer in the case of bottom collision.

4.4.2. Analysis of Energy Absorption in Protective Structures

The four protective structures were chosen to be compared with the other parts in terms of energy absorption when the impactor’s kinetic energy is fully applied to the battery case model, as shown in Figure 11. The arched sandwich structure has the highest energy absorption value, indicating the best energy absorption. The reinforced hexagonal honeycomb sandwich structure has a slightly lower energy absorption value than the arched sandwich structure, but the other structures of the same model absorbed the least amount of energy, proving that its multilayer structure is more effective in cushioning; the 6.5 mm double-layer structure is weaker than the 6.35 mm homogeneous structure, which proves that purely increasing the number of layers will destroy the structural stability of the protective structure, which is not conducive to the protection of the protective structure located above the battery box.

4.4.3. Analysis of the Evaluation Indicators

The protective performance indicators of the four structures obtained through simulation are shown in Table 3. The arched sandwich structure and the reinforced honeycomb sandwich construction correspond to the maximum value of the battery deformation of 0.35 mm and 0.40 mm, respectively; the protective effect parameter ƒPE is more than 35%, and the energy absorption is almost three times the homogeneous structure. The protective structure of the double-layer structure lags behind the homogeneous structure. Although the total thickness of the material is greater than that of the homogeneous structure, the performance in protecting the power battery and absorbing energy is in a backward position. Its protective effect parameter shows that the 6.5 mm double-layer structure has a lower protective effect than the 6.35 mm homogeneous structure by 8.06%. In the comprehensive evaluation, the anti-collision performance of the arched sandwich structure is optimal.

5. Conclusions

This study established a local finite element model for an electric vehicle’s power battery case. The bottom protection structures of the model are a homogeneous plate, a double-layer homogeneous plate, a reinforced hexagonal honeycomb sandwich structure, and an arched sandwich structure. The bottom impact simulation of the model was carried out according to the latest industry standard released by the Chinese Society of Automotive Engineering. It analyzed the impact response of the system and the deformation mode and energy absorption capacity of the bottom protective structure. Finally, the protective structures were analyzed under equal mass conditions by comparing the protective performance indicators.
In analyzing the data obtained from this study and the stress distribution during the collaboration of different structures, the following conclusions can be drawn:
(1)
In this study, a local impact finite element model of the power battery case at the bottom of an electric vehicle was established using material data available in the relevant literature. The simulation results are consistent with the results in the literature.
(2)
The method of building a local model by collecting existing data can predict the changes in battery deformation and energy absorption during the impact process in a low-cost and short-cycle way. This method is suitable for many simulation tasks and small-team simulation tasks.
(3)
The arched sandwich structure and reinforced honeycomb sandwich construction correspond to the maximum values of the battery deformation of 0.35 mm and 0.40 mm, respectively; the protective effect parameter ƒPE was more than 35%. The total energy absorption of the two structures was 91.77 J and 87.19 J, respectively, accounting for more than 70% of the kinetic energy in the system, which is almost three times that of the homogeneous structure. The relevant data prove that the deformation of the sandwich structure can effectively absorb the kinetic energy of the road obstacle when it collides with the bottom of the car.
(4)
Its protective effect parameter shows that the 6.5 mm double-layer structure has a lower protective effect than the 6.35 mm homogeneous structure by 8.06%. With a close total thickness, the double homogeneous structure is less effective in absorbing kinetic energy than the single homogeneous structure because the overall structure is disrupted.
(5)
The arch structure in the arched sandwich structure can spread the stress to the whole arc surface and transfer it to the neighboring arch structure faster in case of collision. Its overall strength is higher than that of the reinforced hexagonal honeycomb sandwich structure, which has an excellent performance in the face of puncture-type impacts. It can be used to design electric vehicle structures for accidental fire prevention.
(6)
A sandwich structure takes up more space than a traditional mean value protective structure. This problem can be circumvented by incorporating the sandwich structure into the design of the battery case.

Author Contributions

Conceptualization, P.X.; data curation, P.X. and K.L.; formal analysis, K.L.; funding acquisition, J.C.; investigation, P.X.; methodology, J.C.; project administration, S.Y.; resources, J.C. and K.L.; software, J.C.; supervision, S.Y.; validation, P.X.; visualization, P.X.; writing—original draft, P.X.; writing—review and editing, P.X. and S.Y. All authors have read and agreed to the published version of the manuscript.

Funding

This research was funded by the National Natural Science Foundation Project of China under Grant No. 52274163.

Institutional Review Board Statement

Not applicable.

Informed Consent Statement

Not applicable.

Data Availability Statement

The original contributions presented in the study are included in the article, further inquiries can be directed to the corresponding author.

Acknowledgments

The authors would like to express their thanks to the National Natural Science Foundation.

Conflicts of Interest

The authors declare no conflicts of interest.

References

  1. Lv, L.; Li, X. Production Forecast of China’s New Energy Passenger Vehicles in 2021–2023 under the Compliance of Dual-Credit Policy. World Electr. Veh. J. 2021, 12, 119. [Google Scholar] [CrossRef]
  2. Tan, Q.B.; Wang, Z.N.; Fan, W.; Li, X.D.; Li, X.G.; Li, F.Q.; Zhao, Z.H. Development Path and Model Design of a New Energy Vehicle in China. Energies 2023, 16, 220. [Google Scholar] [CrossRef]
  3. Wang, S.Y. Exploring the Sustainability of China’s New Energy Vehicle Development: Fresh Evidence from Population Symbiosis. Sustainability 2022, 14, 10796. [Google Scholar] [CrossRef]
  4. Zhang, H.; Cai, G.X. Subsidy strategy on new-energy vehicle based on incomplete information: A Case in China. Phys. A Stat. Mech. Its Appl. 2020, 541, 123370. [Google Scholar] [CrossRef]
  5. Kulkarni, S.S.; Hale, F.; Taufique, M.F.N.; Soulami, A.; Devanathan, R. Investigation of Crashworthiness of Carbon Fiber-Based Electric Vehicle Battery Enclosure Using Finite Element Analysis. Appl. Compos. Mater. 2023, 30, 1689–1715. [Google Scholar] [CrossRef]
  6. Li, Q.Q.; Wu, L.J.; Chen, T.; Li, E.; Hu, L.; Wang, F.; Zou, T.F. Multi-objective optimisation design of B-pillar and rocker sub-systems of battery electric vehicle. Struct. Multidiscip. Optim. 2021, 64, 3999–4023. [Google Scholar] [CrossRef]
  7. Lian, Y.F.; Wang, X.Y.; Tian, Y.T.; Liu, K.P. Lateral Collision Avoidance Robust Control of Electric Vehicles Combining a Lane-Changing Model Based on Vehicle Edge Turning Trajectory and a Vehicle Semi-Uncertainty Dynamic Model. Int. J. Automot. Technol. 2018, 19, 331–343. [Google Scholar] [CrossRef]
  8. Pan, Y.J.; Xiong, Y.; Dai, W.; Diao, K.S.; Wu, L.; Wang, J.R. Crush and crash analysis of an automotive battery-pack enclosure for lightweight design. Int. J. Crashworthiness 2022, 27, 500–509. [Google Scholar] [CrossRef]
  9. Zhao, J.C.; Lu, S.; Fu, Y.Y.; Ma, W.T.; Cheng, Y.; Zhang, H.P. Experimental study on thermal runaway behaviors of 18650 li-ion battery under enclosed and ventilated conditions. Fire Saf. J. 2021, 125, 103417. [Google Scholar] [CrossRef]
  10. Kong, D.P.; Zhao, H.L.; Ping, P.; Zhang, Y.; Wang, G.Q. Effect of low temperature on thermal runaway and fire behaviors of 18650 lithium-ion battery: A comprehensive experimental study. Process Saf. Environ. Prot. 2023, 174, 448–459. [Google Scholar] [CrossRef]
  11. Wierzbicki, T.; Sahraei, E. Homogenized mechanical properties for the jellyroll of cylindrical Lithium-ion cells. J. Power Sources 2013, 241, 467–476. [Google Scholar] [CrossRef]
  12. Zhu, J.; Wierzbicki, T.; Li, W. A review of safety-focused mechanical modeling of commercial lithium-ion batteries. J. Power Sources 2018, 378, 153–168. [Google Scholar] [CrossRef]
  13. Xia, Y.; Chen, G.H.; Zhou, Q.; Shi, X.N.; Shi, F.Y. Failure behaviours of 100% SOC lithium-ion battery modules under different impact loading conditions. Eng. Fail. Anal. 2017, 82, 149–160. [Google Scholar] [CrossRef]
  14. Wang, Q.S.; Mao, B.B.; Stoliarov, S.I.; Sun, J.H. A review of lithium ion battery failure mechanisms and fire prevention strategies. Prog. Energy Combust. Sci. 2019, 73, 95–131. [Google Scholar] [CrossRef]
  15. García, A.; Monsalve-Serrano, J.; Lewiski, F.D.; Golke, D. Analysis of the thermal runaway phenomenon of Nickel-Manganese-Cobalt cells induced by nail penetration through high-speed infrared imaging. J. Energy Storage 2024, 75, 109709. [Google Scholar] [CrossRef]
  16. Chiu, K.C.; Lin, C.H.; Yeh, S.F.; Lin, Y.H.; Chen, K.C. An electrochemical modeling of lithium-ion battery nail penetration. J. Power Sources 2014, 251, 254–263. [Google Scholar] [CrossRef]
  17. Wang, W.W.; Yang, S.; Lin, C.; Shen, W.X.; Lu, G.X.; Li, Y.D.; Zhang, J.J. Investigation of mechanical property of cylindrical lithium-ion batteries under dynamic loadings. J. Power Sources 2020, 451, 227749. [Google Scholar] [CrossRef]
  18. Yu, D.; Ren, D.S.; Dai, K.R.; Zhang, H.; Zhang, J.M.; Yang, B.Q.; Ma, S.J.; Wang, X.F.; You, Z. Failure mechanism and predictive model of lithium-ion batteries under extremely high transient impact. J. Energy Storage 2021, 43, 103191. [Google Scholar] [CrossRef]
  19. Xia, Y.; Wierzbicki, T.; Sahraei, E.; Zhang, X.W. Damage of cells and battery packs due to ground impact. J. Power Sources 2014, 267, 78–97. [Google Scholar] [CrossRef]
  20. Wang, Z.; Gu, W.B.; Yuan, Q.; Chen, H.; Hao, L.K. Dynamic response of anti-explosion vessel with aluminum honeycomb sandwich structure. J. Vib. Shock. 2021, 40, 222–228. [Google Scholar] [CrossRef]
  21. Nguyen, T.N.; Siegmund, T.; Tsutsui, W.; Liao, H.J.; Chen, W. Bi-objective optimal design of a damage-tolerant multifunctional battery system. Mater. Des. 2016, 105, 51–65. [Google Scholar] [CrossRef]
  22. Wang, W.W.; Dai, S.J.; Zhao, W.Z.; Wang, C.N.; Ma, T. Design optimization of a novel negative Poisson’s ratio non-module battery pack system considering crashworthiness and heat dissipation. Compos. Struct. 2021, 275, 114458. [Google Scholar] [CrossRef]
  23. Zhang, Y.F.; Huang, J.H.; Cao, M.; Du, G.P.; Liu, Z.Q.; Wang, L. A novel sandwich structured phase change material with well impact energy absorption performance for Li-ion battery application. J. Energy Storage 2021, 40, 102769. [Google Scholar] [CrossRef]
  24. T/CSAE 244-2021; Requirements and Test Methods for the Anti-Collision Ability of the Bottom of the Battery Electric Passenger Cars. China Society of Automotive Engineers: Beijing, China, 2021.
  25. Rawlinson, P.D. Integration System for a Vehicle Battery pack. U.S. Patent 20120160583A1, 28 June 2012. [Google Scholar]
  26. Crupi, V.; Kara, E.; Epasto, G.; Guglielmino, E.; Aykul, H. Prediction model for the impact response of glass fibre reinforced aluminium foam sandwiches. Int. J. Impact Eng. 2015, 77, 97–107. [Google Scholar] [CrossRef]
  27. Sun, G.Y.; Wang, Z.; Yu, H.; Gong, Z.H.; Li, Q. Experimental and numerical investigation into the crashworthiness of metal-foam-composite hybrid structures. Compos. Struct. 2019, 209, 535–547. [Google Scholar] [CrossRef]
  28. Nasim, W.; Kulkarni, S.S.; Soulami, A.; Efe, M.; Rohatgi, A. Room Temperature Stamping of High-Strength Aluminum for Lightweight Structural Automotive Components. J. Mater. Eng. Perform. 2023. [Google Scholar] [CrossRef]
  29. Avdeev, I.; Gilaki, M. Structural analysis and experimental characterization of cylindrical lithium-ion battery cells subject to lateral impact. J. Power Sources 2014, 271, 382–391. [Google Scholar] [CrossRef]
  30. Sahraei, E.; Hill, R.; Wierzbicki, T. Calibration and finite element simulation of pouch lithium-ion batteries for mechanical integrity. J. Power Sources 2012, 201, 307–321. [Google Scholar] [CrossRef]
  31. Deshpande, V.S.; Fleck, N.A. Isotropic constitutive models for metallic foams. J. Mech. Phys. Solids 2000, 48, 1253–1283. [Google Scholar] [CrossRef]
  32. Khosrownejad, S.M.; Curtin, W.A. Crack growth and fracture toughness of amorphous Li-Si anodes: Mechanisms and role of charging/discharging studied by atomistic simulations. J. Mech. Phys. Solids 2017, 107, 542–559. [Google Scholar] [CrossRef]
  33. Qi, C.; Cui, L.P.; Wang, J.X.; Pei, L.Z.; Yu, C.; Yang, S. Simulation of impact resistance of sandwich protective structure for vehicle power battery pack. J. Vib. Shock. 2023, 42, 194–202. [Google Scholar] [CrossRef]
  34. Sahraei, E.; Campbell, J.; Wierzbicki, T. Modeling and short circuit detection of 18650 Li-ion cells under mechanical abuse conditions. J. Power Sources 2012, 220, 360–372. [Google Scholar] [CrossRef]
  35. Xu, B.; Kong, L.X.; Wen, G.R.; Pecht, M.G. Protection Devices in Commercial 18,650 Lithium-Ion Batteries. IEEE Access 2021, 9, 66687–66695. [Google Scholar] [CrossRef]
Figure 1. Composition and external dimensions of automotive power battery case.
Fire 07 00209 g001
Figure 2. Structure and parameters of battery modules and cells.
Fire 07 00209 g002
Figure 3. Stress–strain curves of model materials: (a) battery casing stress–strain curve; (b) battery core stress–strain curve; (c) 7075-T6 aluminum alloy stress–strain curve.
Fire 07 00209 g003
Figure 4. Loads and constraints of the simulation model.
Fire 07 00209 g004
Figure 5. Configuration and parameters of the double-layer protective structure.
Fire 07 00209 g005
Figure 6. Configuration and parameters of arched sandwich structure.
Fire 07 00209 g006
Figure 7. Configuration and parameters of reinforced hexagonal honeycomb sandwich structure.
Fire 07 00209 g007
Figure 8. Diagram showing conservation of energy.
Fire 07 00209 g008
Figure 9. Stress distribution diagram of collision: (a) the homogeneous structure; (b) the double-layer structure; (c) the arched sandwich structure; (d) the reinforced hexagonal honeycomb sandwich structure.
Fire 07 00209 g009aFire 07 00209 g009b
Figure 10. Variation in axial compression of battery with time.
Fire 07 00209 g010
Figure 11. Energy absorption in protective structure and components (Ea).
Fire 07 00209 g011
Table 1. Structural and mechanical properties of the power battery model.
Name of
Structure
Material PropertiesDensity
(ρ/g·cm−3)
Elastic Modulus
(E/MPa)
Poisson’s Ratio (υ)Yield Strength
(σ/MPa)
Upper floorMATL242.8172,0000.33505
Battery caseMATL242.8172,0000.33505
CrossbeamMATL242.8172,0000.33505
Protective
structure
MATL242.8172,0000.33505
Battery casingMATL247.85210,0000.30235
Battery coreMATL632.1010000.0110
Table 2. Contacts between the models for finite element modeling.
Master SurfaceSlave SurfaceContact TypeContact Options
Road DebrisProtective StructureCONTACT_SURFACE_
TO_SURFACE
Automatic
Protective structuresBattery case bodyCONTACT_SURFACE_
TO_SURFACE
Automatic
Protective structuresFront and rear crossbeamsCONTACT_SURFACE_
TO_SURFACE
Automatic
Protective structureSide crossbeamsCONTACT_SURFACE_
TO_SURFACE
Automatic
Side crossbeamsFront and rear crossbeamsCONTACT_SURFACE_
TO_SURFACE
Tied
Battery case bodyBattery casingCONTACT_SURFACE_
TO_SURFACE
Automatic
Battery casingTop cover of the battery caseCONTACT_SURFACE_
TO_SURFACE
Automatic
Battery case bodyTop cover of the battery caseCONTACT_SURFACE_
TO_SURFACE
Tied
Top cover of the battery caseUpper floorCONTACT_SURFACE_
TO_SURFACE
Automatic
Side crossbeamsUpper floorCONTACT_SURFACE_
TO_SURFACE
Tied
Table 3. Protective performance index values of four structures.
Evaluation IndicatorsHomogeneous StructureDouble Layer StructureArched
Sandwich
Construction
Reinforced Hexagonal Honeycomb Sandwich Structure
Bcmax/mm0.620.670.350.40
ƒPE/%−8.0643.5535.48
Ea/J32.1031.3091.7787.19
Disclaimer/Publisher’s Note: The statements, opinions and data contained in all publications are solely those of the individual author(s) and contributor(s) and not of MDPI and/or the editor(s). MDPI and/or the editor(s) disclaim responsibility for any injury to people or property resulting from any ideas, methods, instructions or products referred to in the content.

