Article

Hydrogen Jet Flame Simulation and Thermal Radiation Damage Estimation for Leakage Accidents in a Hydrogen Refueling Station

1
School of Automotive Engineering, Wuhan University of Technology, Wuhan 430070, China
2
Department of Energy, Powerchina Hubei Electric Engineering Co., Ltd., Wuhan 430040, China
3
Comprehensive Smart Energy Business Division, Shandong Electric Power Engineering Consulting Institute Co., Ltd., Jinan 250013, China
*
Authors to whom correspondence should be addressed.
Fire 2024, 7(7), 210; https://doi.org/10.3390/fire7070210
Submission received: 25 May 2024 / Revised: 16 June 2024 / Accepted: 20 June 2024 / Published: 22 June 2024
(This article belongs to the Special Issue Fire Numerical Simulation)

Abstract

With the rapid development of hydrogen energy worldwide, the number of hydrogen energy facilities, such as hydrogen refueling stations, has grown rapidly in recent years. However, hydrogen is prone to leakage accidents during use, which could lead to hazards such as fires and explosions. Therefore, research on the safety of hydrogen energy facilities is crucial. In this paper, a study of high-pressure hydrogen jet flame accidents is conducted for a proposed integrated hydrogen production and refueling station in China. The effects of leakage direction and leakage port diameter on the jet flame characteristics are analyzed, and a risk assessment of the flame accident is conducted. The results showed that the death range perpendicular to the flame direction increased from 2.23 m to 5.5 m when the diameter of the leakage port increased from 4 mm to 10 mm. When the diameter of the leakage port is larger than 8 mm, the equipment on the scene will be within the boundaries of the damage. The consequences of fire can be effectively mitigated by a reasonable firewall setup to ensure the overall safety of the integrated station.

1. Introduction

In recent years, with the growing consensus on the environment, climate change, and carbon neutrality, countries around the world have begun to focus on the energy transition. As a clean energy source, hydrogen energy has the advantages of non-pollution, high calorific value, large reserves, and wide application, which is an important way to realize low-carbon transition [1]. At the same time, hydrogen is produced in a variety of ways, and electrolysis of water to produce hydrogen can not only be virtually pollution-free but also well-coupled with photovoltaic, wind, and other renewable energy sources to produce clean green hydrogen, which has great application prospects [2]. Hydrogen is mainly stored in high-pressure gaseous storage, where the storage pressure gradually increases. Hydrogen is prone to leakage in high-pressure environments and is highly susceptible to ignition, leading to fires and explosions. Therefore, in order to improve the safety of the process of using hydrogen energy, it is crucial to conduct a careful study of hydrogen safety accidents. By analyzing the pattern of accident development and the scope of influence, accident hazards can be reduced correctly and effectively.
Hydrogen has a small ignition energy and is flammable in air at concentrations ranging from 4% to 75%. A leak of high-pressure hydrogen will form a jet flame if ignited immediately, causing thermal radiation damage to surrounding buildings and people [3]. Many scholars have experimentally investigated the properties of hydrogen jet flames. Delichatsios [4] proposed an equation for the relationship between the height of a jet diffusion flame and the flow parameters based on the Froude number of the flame, and the equation represents the experimental data well in the asymptotic and transition zones. Schefer et al. [5] conducted an experimental study of vertically oriented hydrogen jet flames and found that an increase in mass flow rate and nozzle diameter significantly increased the flame length. Subsequently, Schefer [6] conducted experiments on high-pressure hydrogen jet flames and found that the same equation for the relationship between the Froude number and the flame length used to describe low-pressure flames is also applicable to describe jet flames released at high pressures. Mogi [7] conducted experiments with horizontally oriented hydrogen jet flames and showed that the size of the flame can be affected by the nozzle size and release pressure. Imamura et al. [8] experimentally investigated the thermal characteristics of the length and downstream region of a horizontally oriented hydrogen jet flame, and empirical formulas for the flame length and width were established based on the experimental data. Fan et al. [9] conducted an experimental study on flame propagation characteristics. The results showed that the high-temperature region was similar to the flame propagation direction. The maximum ignition distance increases with the increase in gas flow rate and nozzle diameter. Zhang et al. [10] analyzed the flame behavior and temperature distribution at different leakage nozzle shapes and release pressures through experimental studies. Based on the experimental results, formulas for calculating the flame length and width under different nozzle shapes were established. Through experimental studies, it was found that there are numerous factors affecting flame shape and thermal properties.
In addition to experimental studies, a number of scholars have used simulation studies to analyze hydrogen jet flames in more detail for accidents. Brennan et al. [11] numerically simulated a vertically oriented hydrogen jet flame and compared it with the experiment. The flame shape data obtained from the simulation are in good agreement with the experiment. Cirrone [12] used CFD software to simulate a hydrogen jet fire with a leakage pressure of 900 bar and compared it with experimental results. The simulation results show that the CFD method can simulate the flame length well. Ba et al. [13] used FLUENT software to simulate and analyze the effects of ignition time and barrier wall on the flame of a high-pressure hydrogen jet. The results showed that the flame propagated rapidly to the whole combustible domain, generating instantaneous overpressure after delayed ignition, and the barrier wall could effectively reduce the propagation of temperature and overpressure. Tian et al. [14] used CFD software to simulate a hydrogen injection fire accident in a hydrogen refueling station and proposed an optimal design of protective measures. The height of the firewall should be 2 m higher than the leakage port, and the width is nonlinearly related to the leakage pressure, which is 2.5 m for 35 MPa and 45 MPa and 3 m for 70 MPa and 90 MPa. Kim [15] used Hy-KoRAM to derive that the maximum hazard distances for jet fires and thermal radiation caused by hydrogen leakage from a 90 MPa compressor are 8.2 m and 10.6 m, respectively, and the individual risk indicators are in the ALARP (As Low As Reasonably Practicable) region and the acceptable region. Park et al. [16] used HyRAM software to simulate 18 hydrogen leakage scenes. The results show that the flame length increases with increasing leakage port diameter and pressure, a phenomenon that is more pronounced at low pressures. The larger the diameter and pressure, the greater the effect on the flame’s thermal radiation. In summary, many scholars have studied high-pressure hydrogen jet flame accidents. The studies mainly include analyzing the influencing factors of flame characteristics through experiments and simulations. Some other scholars have utilized quantitative risk assessment software to determine the overall damage range of jet flame accidents.
The analytical summary of previous studies shows that there are fewer studies analyzing the consequences of accidents in detail. Meanwhile, the research scenes are mostly experimental scenes, which lack the practical application of accident analysis in complex hydrogen refueling station environments. Therefore, in order to improve the safety of hydrogen refueling stations in practical applications and to clarify the scope of hazards of safety accidents in practical scenes, this paper analyzes the risk of jet flame accidents for a proposed integrated hydrogen production and refueling station in China. A three-dimensional model of the integrated station is established to simulate the high-pressure jet flame accident and risk assessment study of the hydrogen storage area. By calculating the thermal radiation flux of the accident, the damage range of the accident is determined, and corresponding protective measures are proposed. This study can provide safety protection data support and layout improvement suggestions for hydrogen refueling stations and improve safety during practical applications.

2. Numerical Model and Boundary condition setting

2.1. Numerical Modeling of Hydrogen Jet Flames

2.1.1. Governing Equations

In this paper, the CFD software ANSYS FLUENT (2021R2) is used for the simulation study of high-pressure hydrogen jet flames. There are four basic governing equations followed by the process of hydrogen leakage to form a jet flame.
The mass conservation equation can be expressed as
ρ t + ρ u x + ρ v y + ρ w z = 0
where ρ is the density of the gas, kg/m3; t is the time, s; u , v , and w are the components of the velocity in the x , y , and z directions, m/s, respectively.
The momentum conservation equation can be expressed as
ρ u t + · ( u u ) = p x + τ x x x + τ y x y + τ z x z + F x
ρ v t + · ( v u ) = p y + τ x y x + τ y y y + τ z y z + F y
ρ w t + · ( w u ) = p z + τ x z x + τ y z y + τ z z z + F z
where u is the sum of the velocity components in the x , y , and z directions, m/s; p is the pressure, Pa; τ is the viscous stress, Pa; F x , F y , and F z are the components of the volume force F in the x , y , and z directions, N, respectively.
The energy conservation equation can be expressed as
( ρ c p T ) t + · ( ρ c p u T ) = x ( k T x ) + y ( k T y ) + z ( k T z ) + + S h
where c p is the constant pressure specific heat capacity, J/(kg·K); T is the temperature, K; k is the thermal conductivity, W/(m·K); is the dissipation function; and S h is the heat source within the fluid, W/m3.
The transport equation can be expressed as
( ρ c s ) t + · ( ρ c s u ) = x ( D s ( ρ c s ) x ) + y ( D s ( ρ c s ) y ) + z ( D s ( ρ c s ) z ) + R s
where c s is the volume fraction of component s ; D s is the diffusion coefficient of component s in air, m2/s; and R s is the production rate of component s .

2.1.2. Turbulence Model

A Realizable k-ε model is chosen for simulation, and the turbulent kinetic energy k and dissipation rate ε transport equations are
t ( ρ k ) + x j ( ρ k u j ) = x j [ ( μ + μ t σ k ) k x j ] + G k + G b ρ ε Y M + S k
t ( ρ ε ) + x j ( ρ ε u j ) = x j [ ( μ + μ t σ ε ) ε x j ] + ρ C 1 S ε ρ C 2 ε 2 k + v ε + C 1 ε ε k C 3 ε P b
where G k and G b represent the turbulent kinetic energy due to velocity gradient and buoyancy, J, respectively; C 1 ε , C 2 ε , and C 3 ε are constants describing the effect of buoyancy on ε ; Y M denotes the effect of turbulent fluctuation on ε in a compressible fluid; and μ t is the turbulent viscosity.

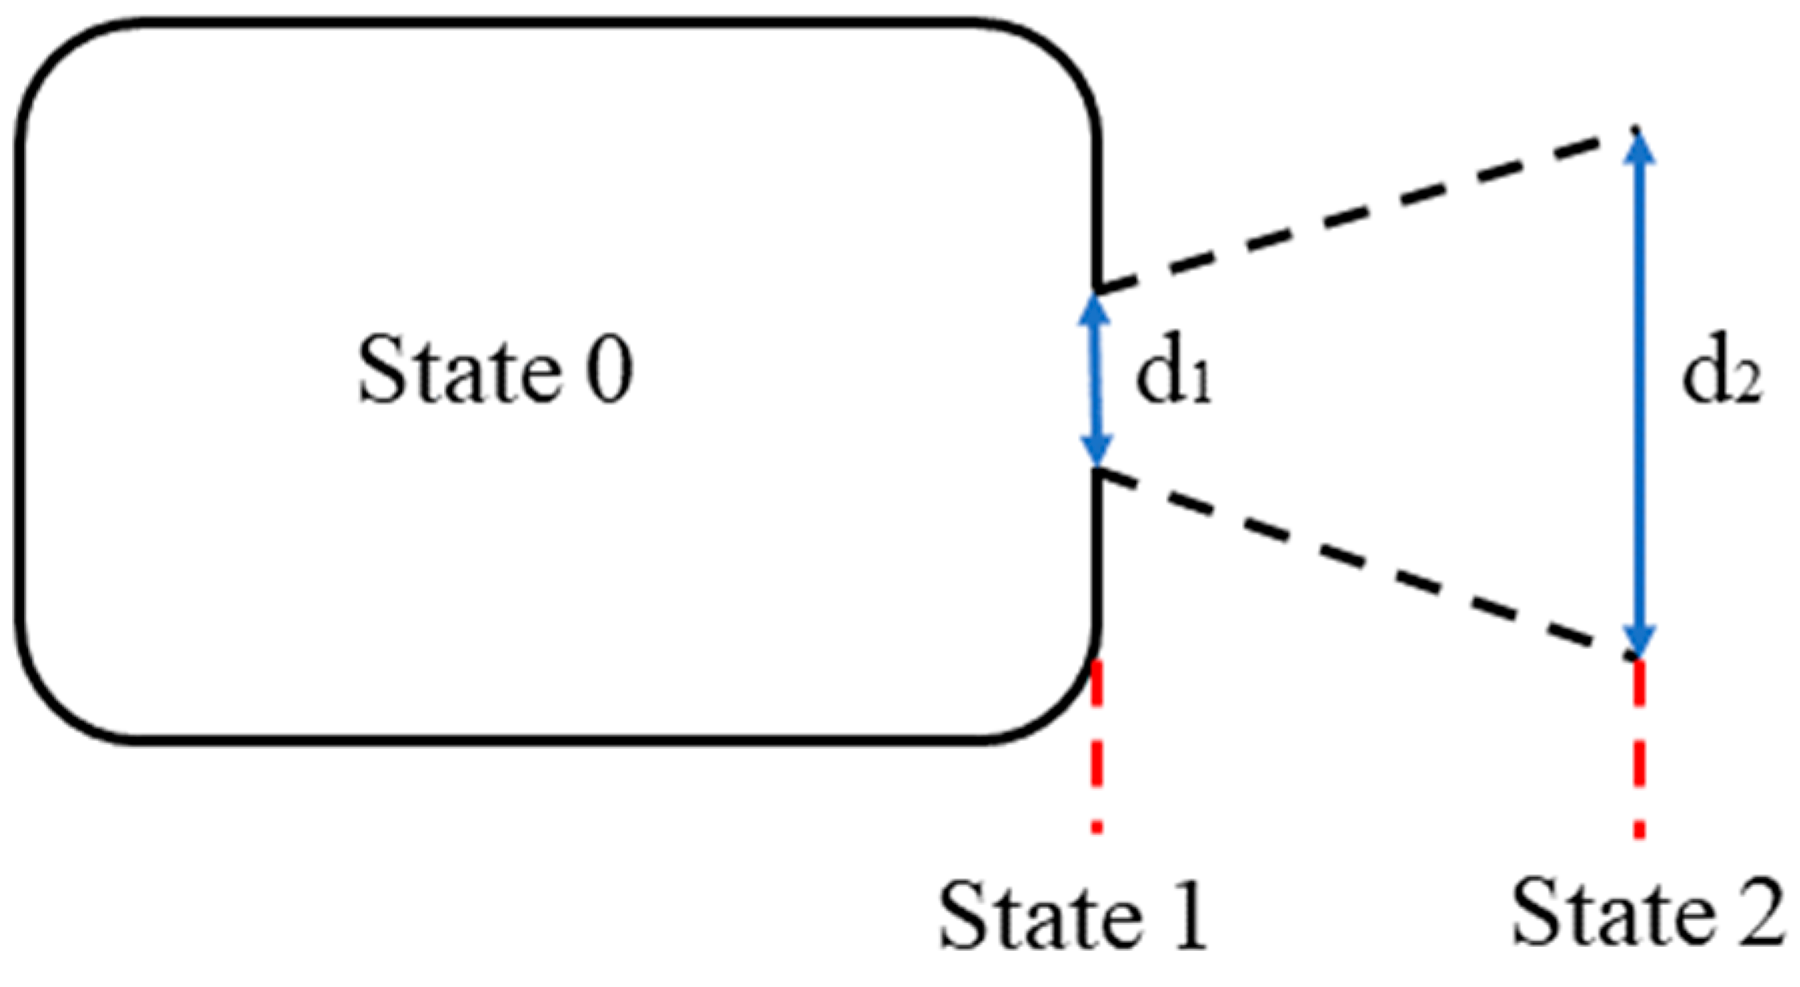
2.1.3. Virtual Nozzle Model

High-pressure hydrogen leakage creates a complex surge structure at the leakage port, which significantly increases the computational cost. In order to simplify this process, many scholars have proposed different virtual nozzle models to simplify the leakage port boundary conditions rationally. In this study, Birch87 virtual nozzle model was selected [17].
The model divides the gas into three characteristic states, as shown in Figure 1, with state 0 being the stagnant state in the tank, state 1 being the under-expanded jet at the real nozzle, and state 2 being the flow state at the virtual nozzle. The airflow parameters at state 1 are calculated by Equations (7)–(10):
p 1 = p 0 ( 2 γ + 1 ) γ γ 1
T 1 = T 0 ( 2 γ + 1 ) γ γ 1
ρ 1 = p 1 M R T 1
u 1 = γ R T 1 M
where the subscripts 0 and 1 denote the stagnation state and the under-expanded jet state at the real nozzle, respectively. p is the gas pressure, Pa; T is the gas temperature, K; ρ is the gas density, kg/m3; u 1 is the hydrogen velocity, m/s, at the real nozzle; M is the molar mass of the hydrogen gas, taken as M = 0.002 kg/mol; R is the gas constant; and γ is the specific heat ratio of the hydrogen gas, taken as γ = 1.4.
The conservation of mass and momentum of a gas from state 1 to state 2 is given by
ρ 2 u 2 A 2 = ρ 1 u 1 A 1
ρ 2 u 2 2 A 2 = ρ 1 u 2 2 A 1 + ( p 1 p 2 ) A 1
The velocity and diameter at the virtual nozzle can be calculated from Equations (7)–(12):
u 2 = u 1 + p 1 p 2 ρ 1 u 1
d 2 = ρ 1 u 1 ρ 2 ( p 1 p 2 + ρ 1 u 1 2 ) d 1
where p 2 is the ambient pressure, Pa; u 2 is the airflow velocity at the virtual nozzle, m/s; and d 1 and d 2 are the diameters of the actual and virtual nozzles, m, respectively.

2.1.4. Combustion Reaction Modeling

For gas combustion, FLUENT contains several models, among which the laminar finite rate model can be applied to the simulation of various reactions and mixing states. In this paper, the eddy dissipation model (EDM) in the laminar finite rate model is selected for the simulation of high-pressure hydrogen jet flame, considering the computational cost and accuracy. The reaction rate for the EDM model is determined by the turbulence rate, and the rate of production of substance i in reaction r is determined by the smaller value of Equations (15) and (16).
R i , r = v j , r M w , i A ρ ε k m i n R ( Y R v R , r M w , R )
R i , r = v j , r M w , i A B ρ ε k p Y P j N v j , r M w , j
where v and v are the stoichiometric coefficients of the reactants and products, respectively; M w , i is the relative molecular weight of substance i ; A and B are empirical constants; ρ is the density, kg/m3; and Y R and Y P are the mass fractions of the reactant component R and product P , respectively.

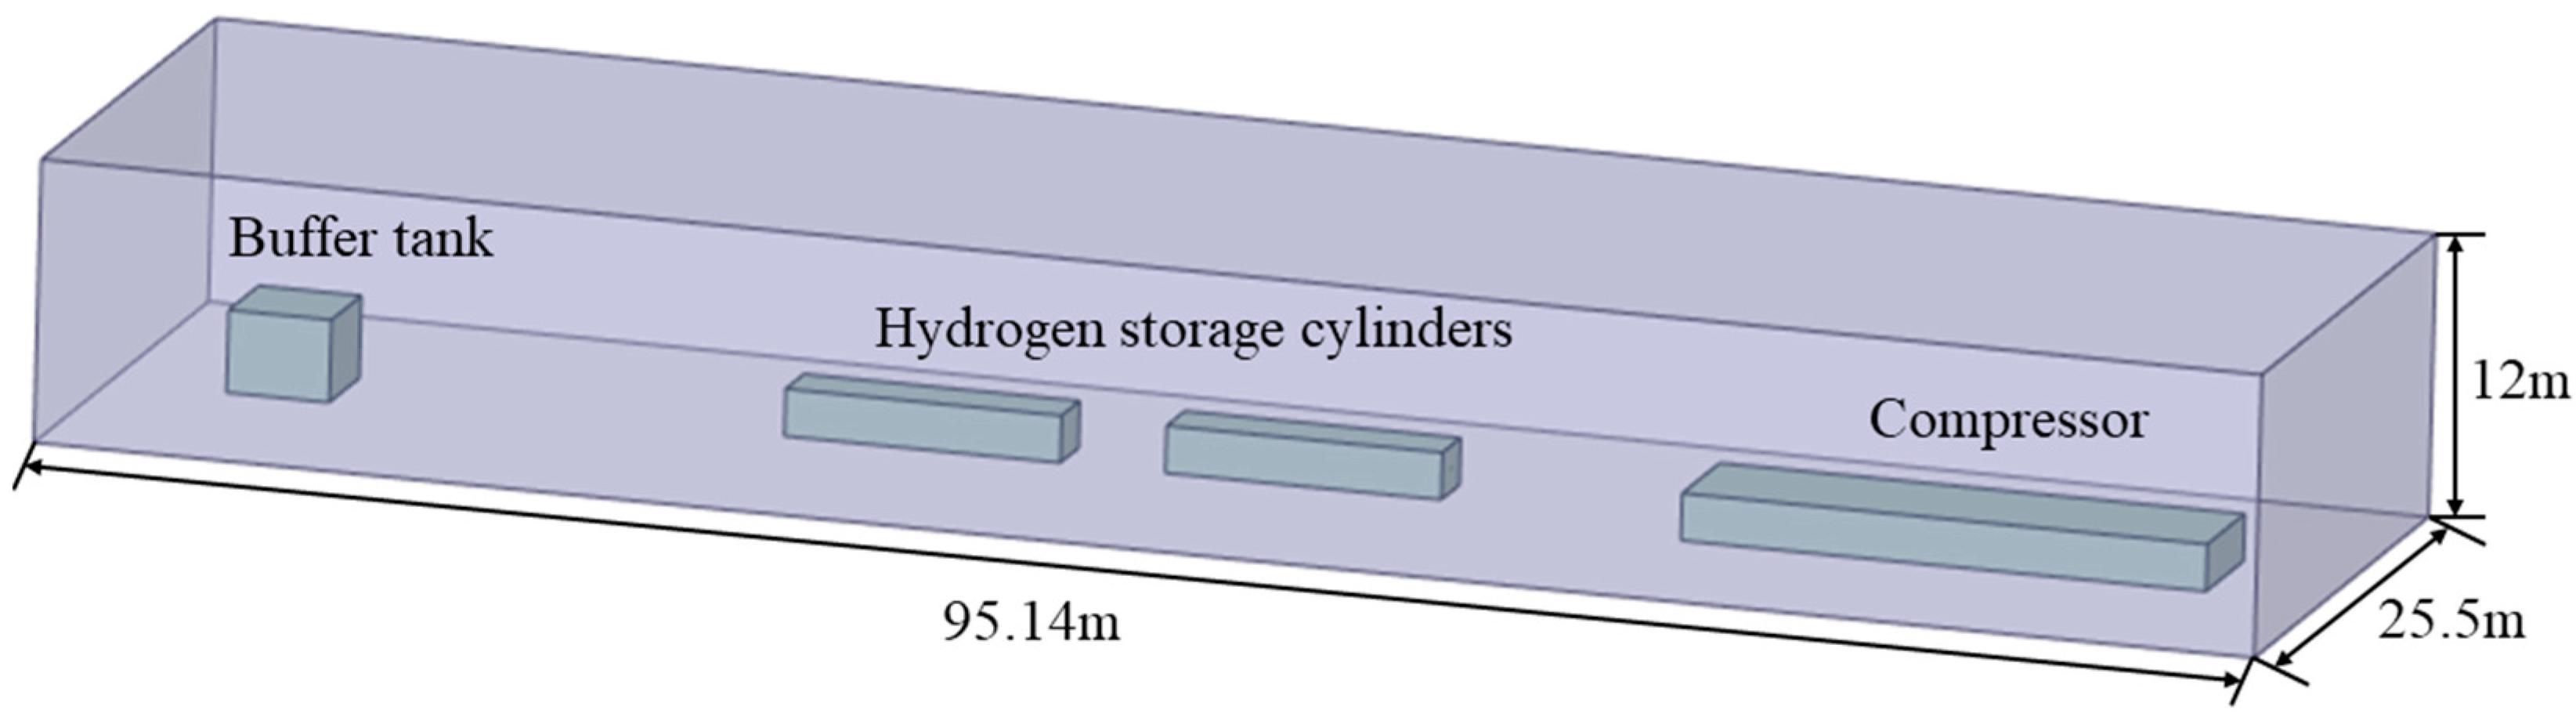
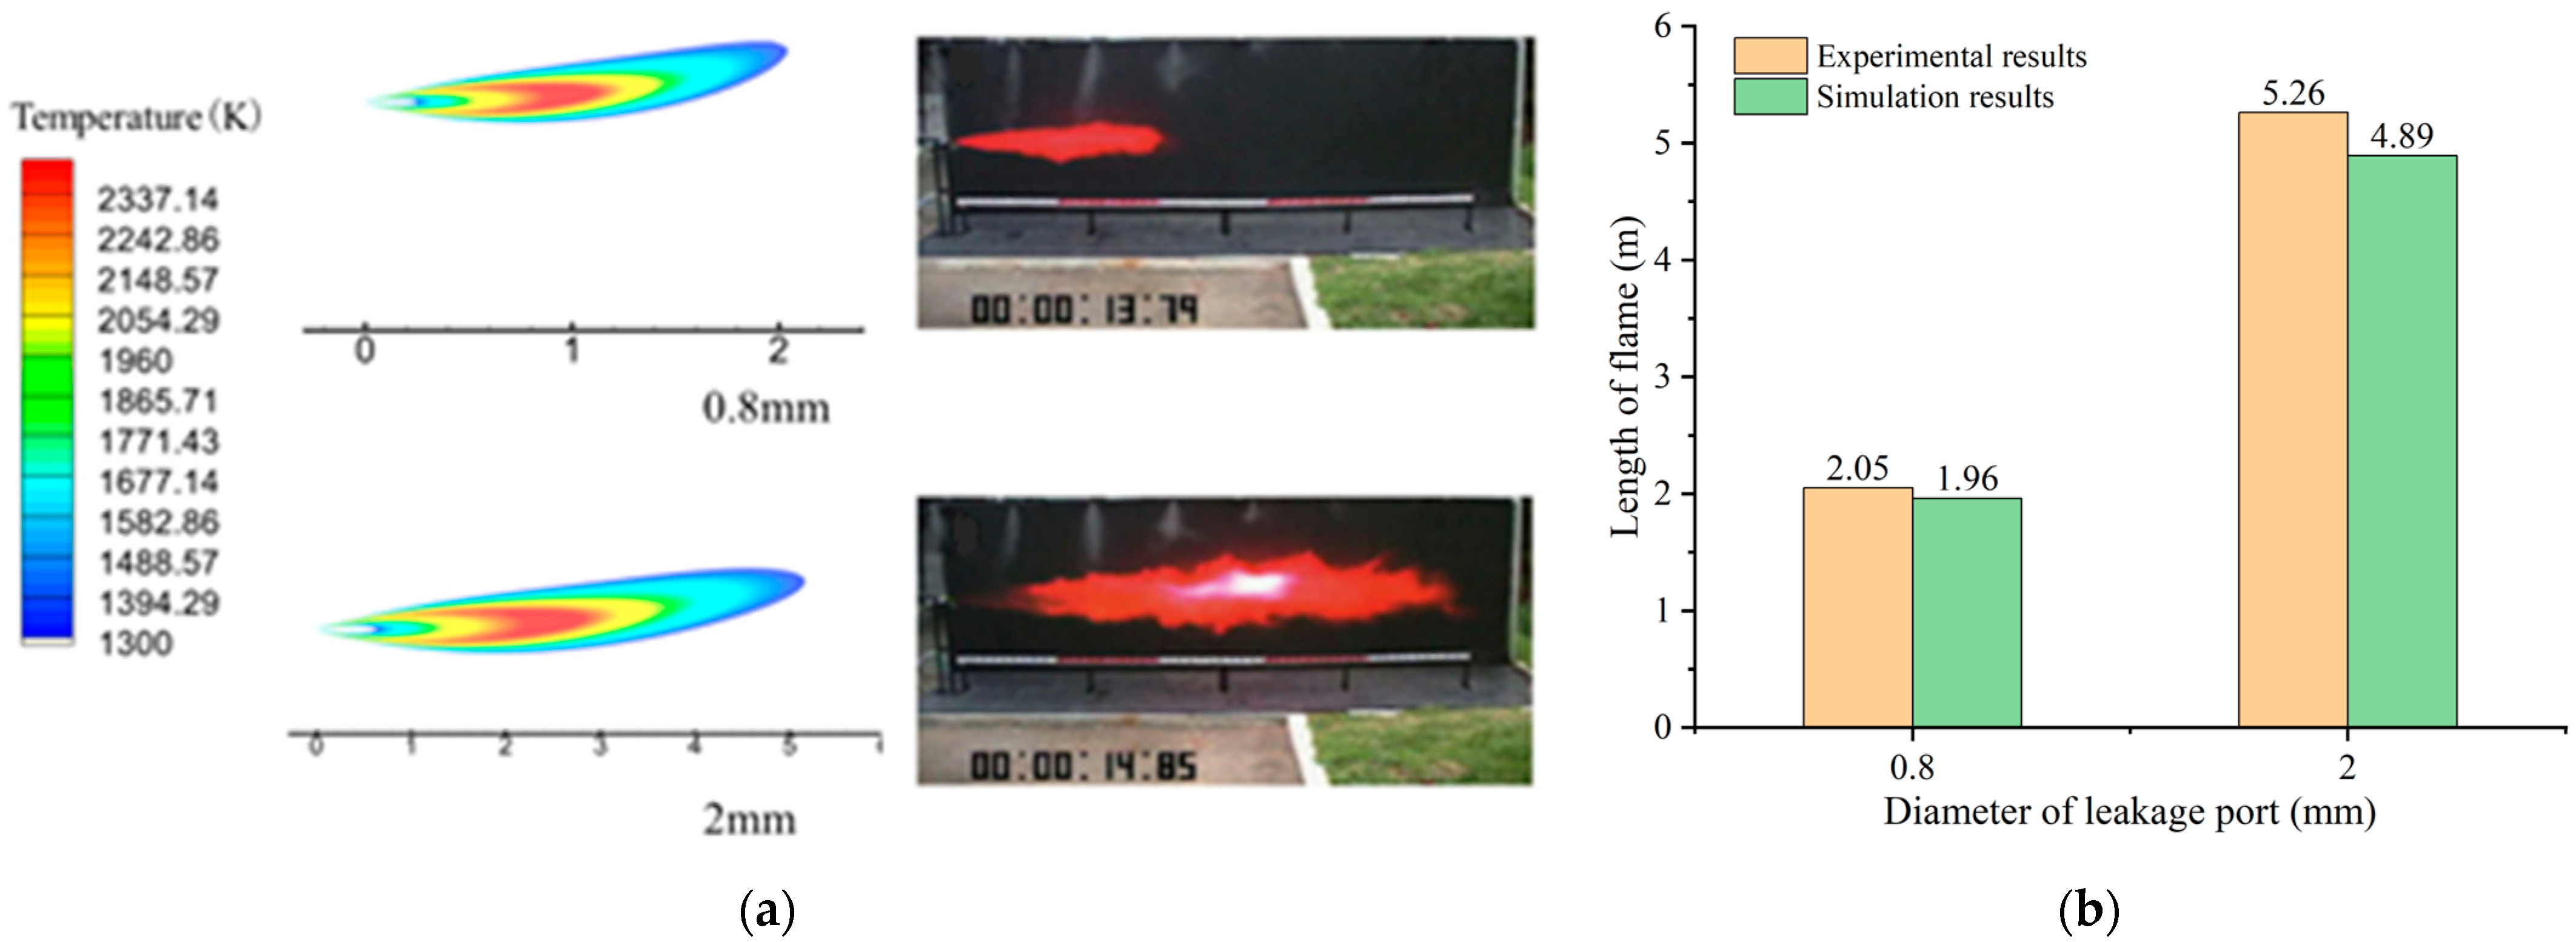
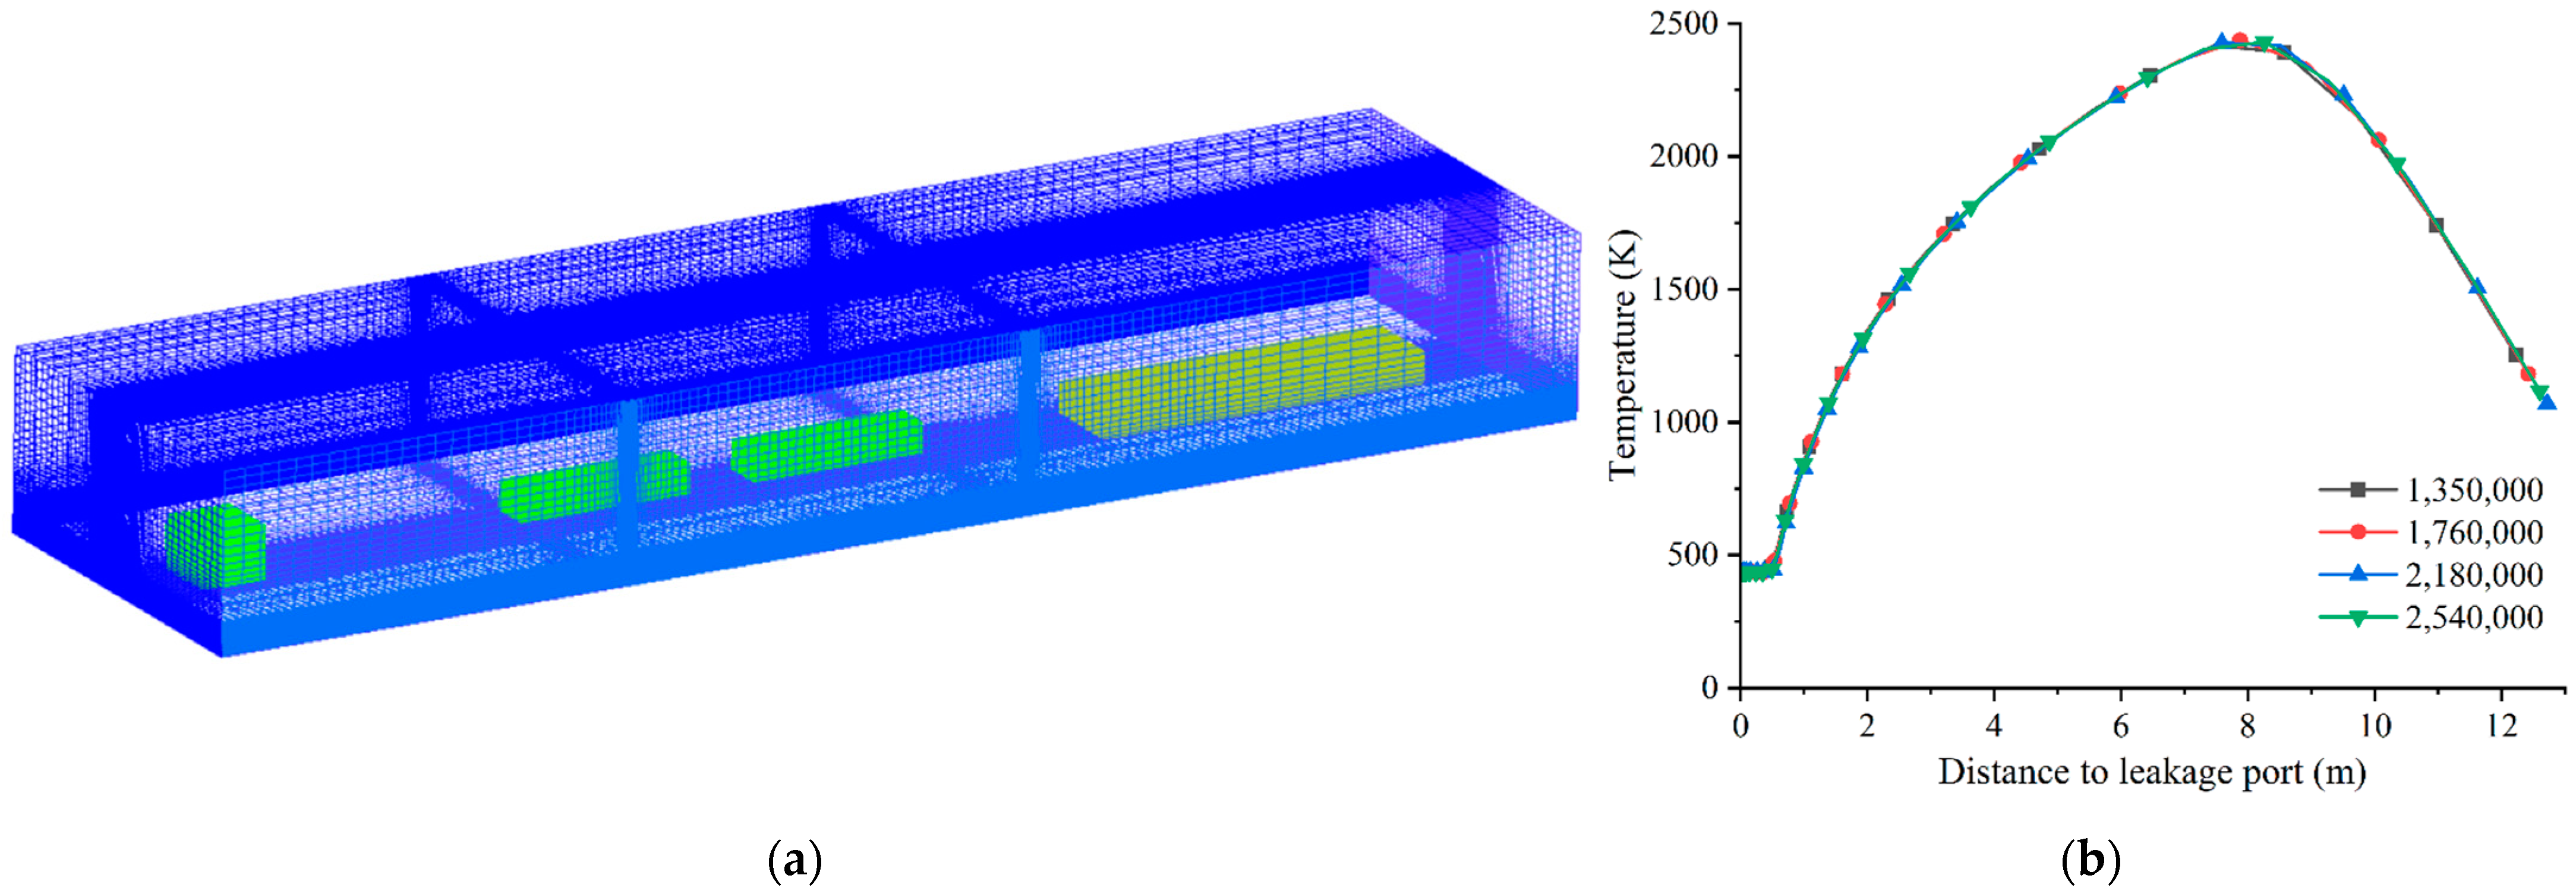
2.2. Boundary Condition Setting and Grid Verification

This study simulates and analyzes jet flame accidents in the hydrogen storage area for an integrated hydrogen production and refueling station. The overall area of the integrated station is shown in Figure 2.
The hydrogen storage area is located in the center of the station, with the hydrogen refueling area in front, the hydrogen buffer tank on the left, and the compressor on the right. An explosion-proof enclosure is arranged around the hydrogen refueling area, which provides some protection against flame accidents. Therefore, this study focuses on the leakage of hydrogen storage cylinders in the direction of the compressor and the buffer tank, which are unprotected.
The jet flame accident has a limited scope of influence, but the local equipment will have an extremely serious impact. Based on the above analysis, the hydrogen storage area is modeled locally, and the three-dimensional simplified model is shown in Figure 3, which mainly consists of two sets of hydrogen storage cylinders, compressor sets, and a buffer tank, and the overall dimensions of the computational domain are 95.14 m × 25.5 m × 12 m.
Steady-state jet flame simulation was performed using FLUENT software (2021R2) with an ambient temperature of 293 K and an ambient pressure of one atmosphere. The hydrogen leakage from a hydrogen storage cylinder set with a storage pressure of 20 MPa and a leakage port height of 1 m, considering the effect of gravity. The turbulence model is selected as the realizable k-ε model, and the combustion model is selected as the eddy dissipation model. Studies have verified that both turbulent premixed flames and jet diffusion flames give better results when the values of empirical constants A and B are 4 and 0.5, respectively [18,19,20]. Therefore, in this study, the same A = 4 and B = 0.5 are taken for simulation. The leakage port is set as the velocity inlet, and the parameters are computed by the Birch87 modeling method introduced in Section 2.1.3. The calculated airflow states at the location of the leakage port for different diameters are shown in Table 1. The gas model is set to a compressible ideal gas. The boundary of the fluid calculation region is set as the pressure outlet, and the convective terms are all in the second-order upwind format. Consider leakage as steady-state leakage.
To minimize errors, simulation method validation and mesh independence validation were performed. The horizontal jet flame experiment of Mogi et al. [7] was chosen for validation. In the experiment, high-pressure hydrogen was sprayed horizontally through a nozzle with a height of 1 m. A burner at the outlet of the nozzle ignites the ejected hydrogen gas immediately, and the burner is extinguished after ignition. The experimental studies were carried out with pressures ranging from 0.01 to 40 MPa and nozzle diameters ranging from 0.1 to 4 mm. For different experimental parameters, the length and width of the flame were measured. In this paper, two groups of experimental conditions are selected for verification: the release pressure of both conditions is 35 MPa, and the diameter of the leakage port is 0.8 mm and 2 mm, respectively. The referenced literature mainly experimentally analyzes the effect of stagnation pressure and leakage port diameter on flame shape without measuring the flame temperature. Therefore, this study focused on comparing the flame lengths when validating the experiments. A comparison of the simulation results with the experimental results is shown in Figure 4. In this study, T ≥ 1300 K was used as a temperature range criterion for visible flames [21]. From Figure 4a, it can be seen that the shape of the simulated flame is basically the same as the shape of the experimentally photographed flame, and the flame length can be seen to be closer to the scale below the flame. In order to accurately compare the flame length data, simulated and experimental data were obtained for comparison, as shown in Figure 4b. In this case, the flame lengths obtained from the simulations were obtained through the post-processing software Tecplot (360 EX 2021 R1), and the experimental data were obtained from the literature [7]. The flame length after stabilization obtained in the experiment was 1.96 m for Case 1 (0.8 mm) and 4.89 m for Case 2 (2 mm). The simulated flame lengths for Case 1 and Case 2 are 2.05 m and 5.26 m, with errors of 4.6% and 7.6%, respectively, from the experimental results. The results are in good agreement, and the simulation method can be considered reliable for modeling hydrogen jet flames.
In order to validate the mesh independence and to minimize the error caused by the number of grids, the grids were divided into 1.35 million, 1.76 million, 2.18 million, and 2.54 million, respectively. The simulation mesh is shown in Figure 5a. For the simulation, the left leakage of a 20 MPa hydrogen storage cylinder with a leakage port diameter of 8 mm and a leakage height of 1 m is selected, and the temperature distribution on the centerline of the jet is compared with that of the stabilized flame to verify the mesh-independence. The simulation results are shown in Figure 5b. The temperature distribution on the jet centerline is basically the same for different numbers of grids, and only a very small difference occurs near the highest temperature, so continuing to encrypt the grids will not have a large impact on the simulation results. Therefore, considering the accuracy of the calculation results and the cost of calculation, a grid number of 1,760,000 is finally selected for the subsequent numerical simulation of the jet flame accident.

3. Results and Discussion

3.1. Simulation of Hydrogen Jet Flame Accidents in Hydrogen Storage Areas

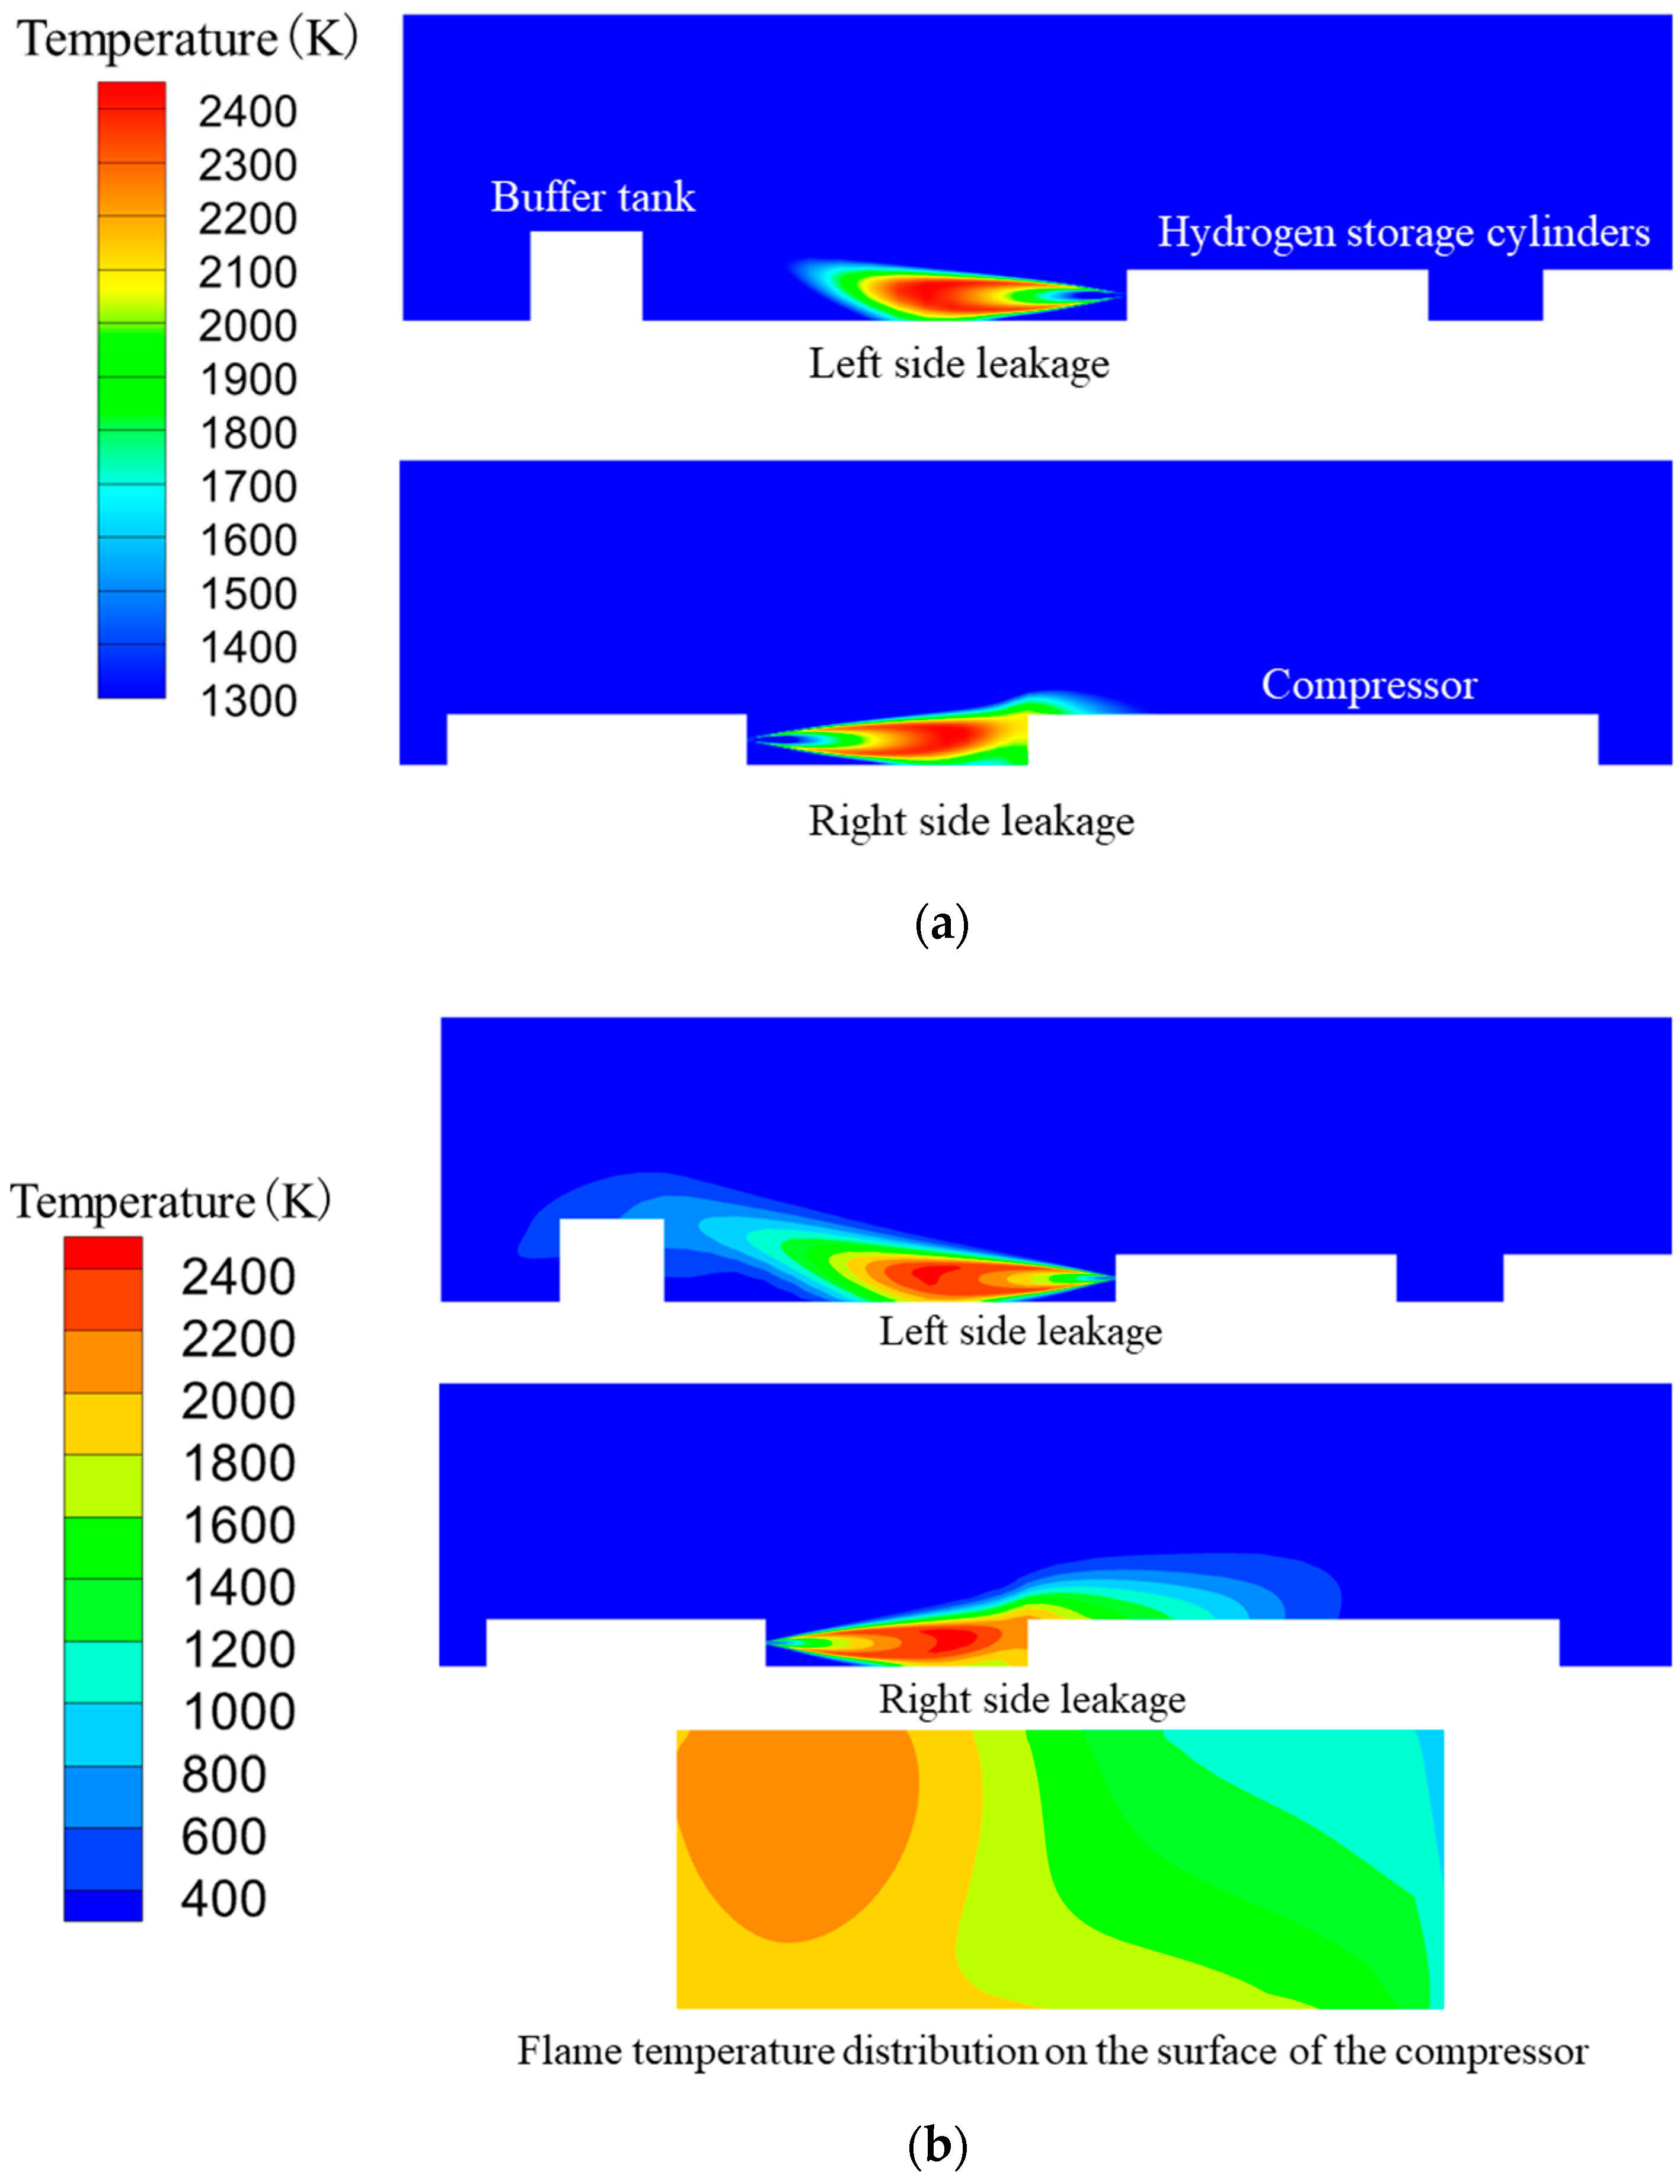
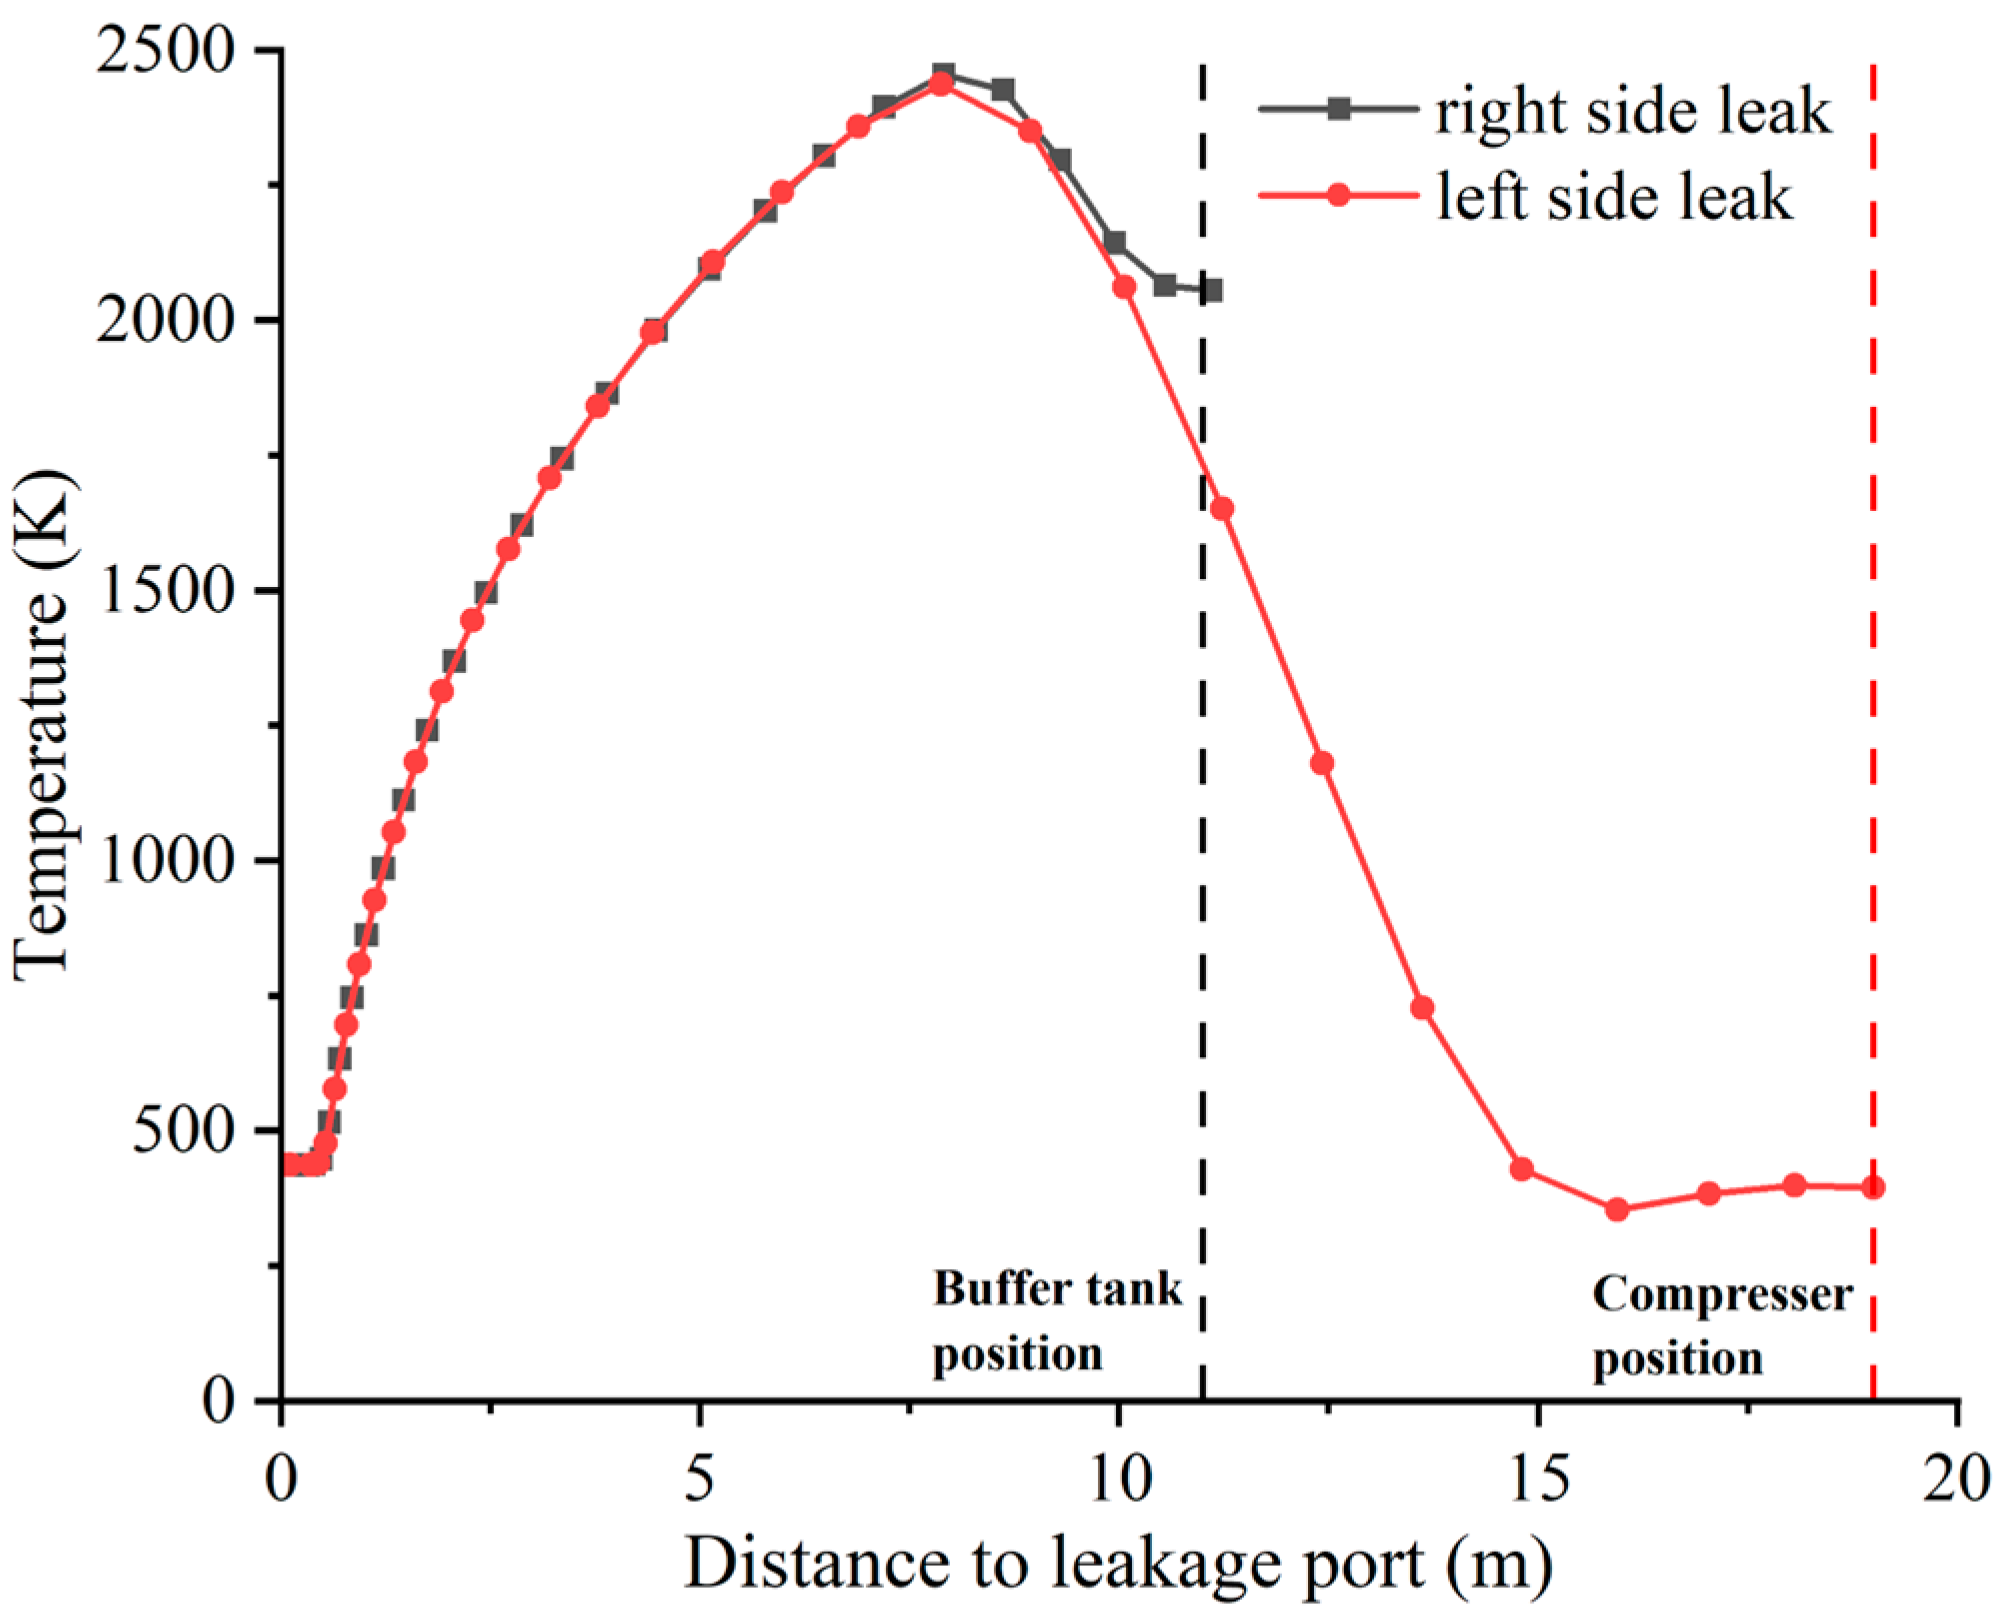
3.1.1. Effect of Leakage Locations on Equipment

Since this study was carried out for an actual hydrogen refueling station, changes in the location of the hydrogen leakage will directly change the outlet and direction of the jet flame, and the equipment and buildings it mainly affects will also change. Therefore, this study considers two high-impact leakage locations based on the hydrogen refueling station layout when analyzing the thermal radiation damage from jet flames. In this scenario, two pressure vessels, a buffer tank and a compressor, are located to the left and right of the hydrogen storage cylinders. The distance between the hydrogen storage cylinders and the buffer tank is 19 m, and the distance to the compressor is 11.1 m. In order to analyze the effects of flames and temperatures on the equipment, the leakage of high-pressure hydrogen toward the two equipment is simulated. When the diameter of the leakage port is 8 mm, the temperature distribution of the jet flame in different leakage directions and the visible flame shape are shown in Figure 6. As can be seen from the figure, the temperature field of the flame had some effect on both equipment. When leaking toward the buffer tank, the flame ends in a slight upward arc, and the surrounding temperatures are relatively low, generating temperatures of about 600 K only at the upper position of the contact surface. The compressor was much more affected, with higher temperatures on the surfaces opposite the jet, all above 1000 K, and some areas rising to temperatures of 2000 K or more. At the same time, it can be seen from the shape of the flame that the flame spreads to the upper surface of the compressor, resulting in the presence of higher temperatures on that surface. The flame temperature distribution along the centerline of the jet for leakage in different directions is shown in Figure 7, with the black contour line being the distance from the compressor to the leak and the red contour line being the distance from the buffer tank to the leak. The flame temperature at the buffer tank has dropped to a relatively low temperature of 394 K, while the temperature at the compressor reaches 2055.17 K. There is a big safety hazard when the right leakage forms a jet flame accident.

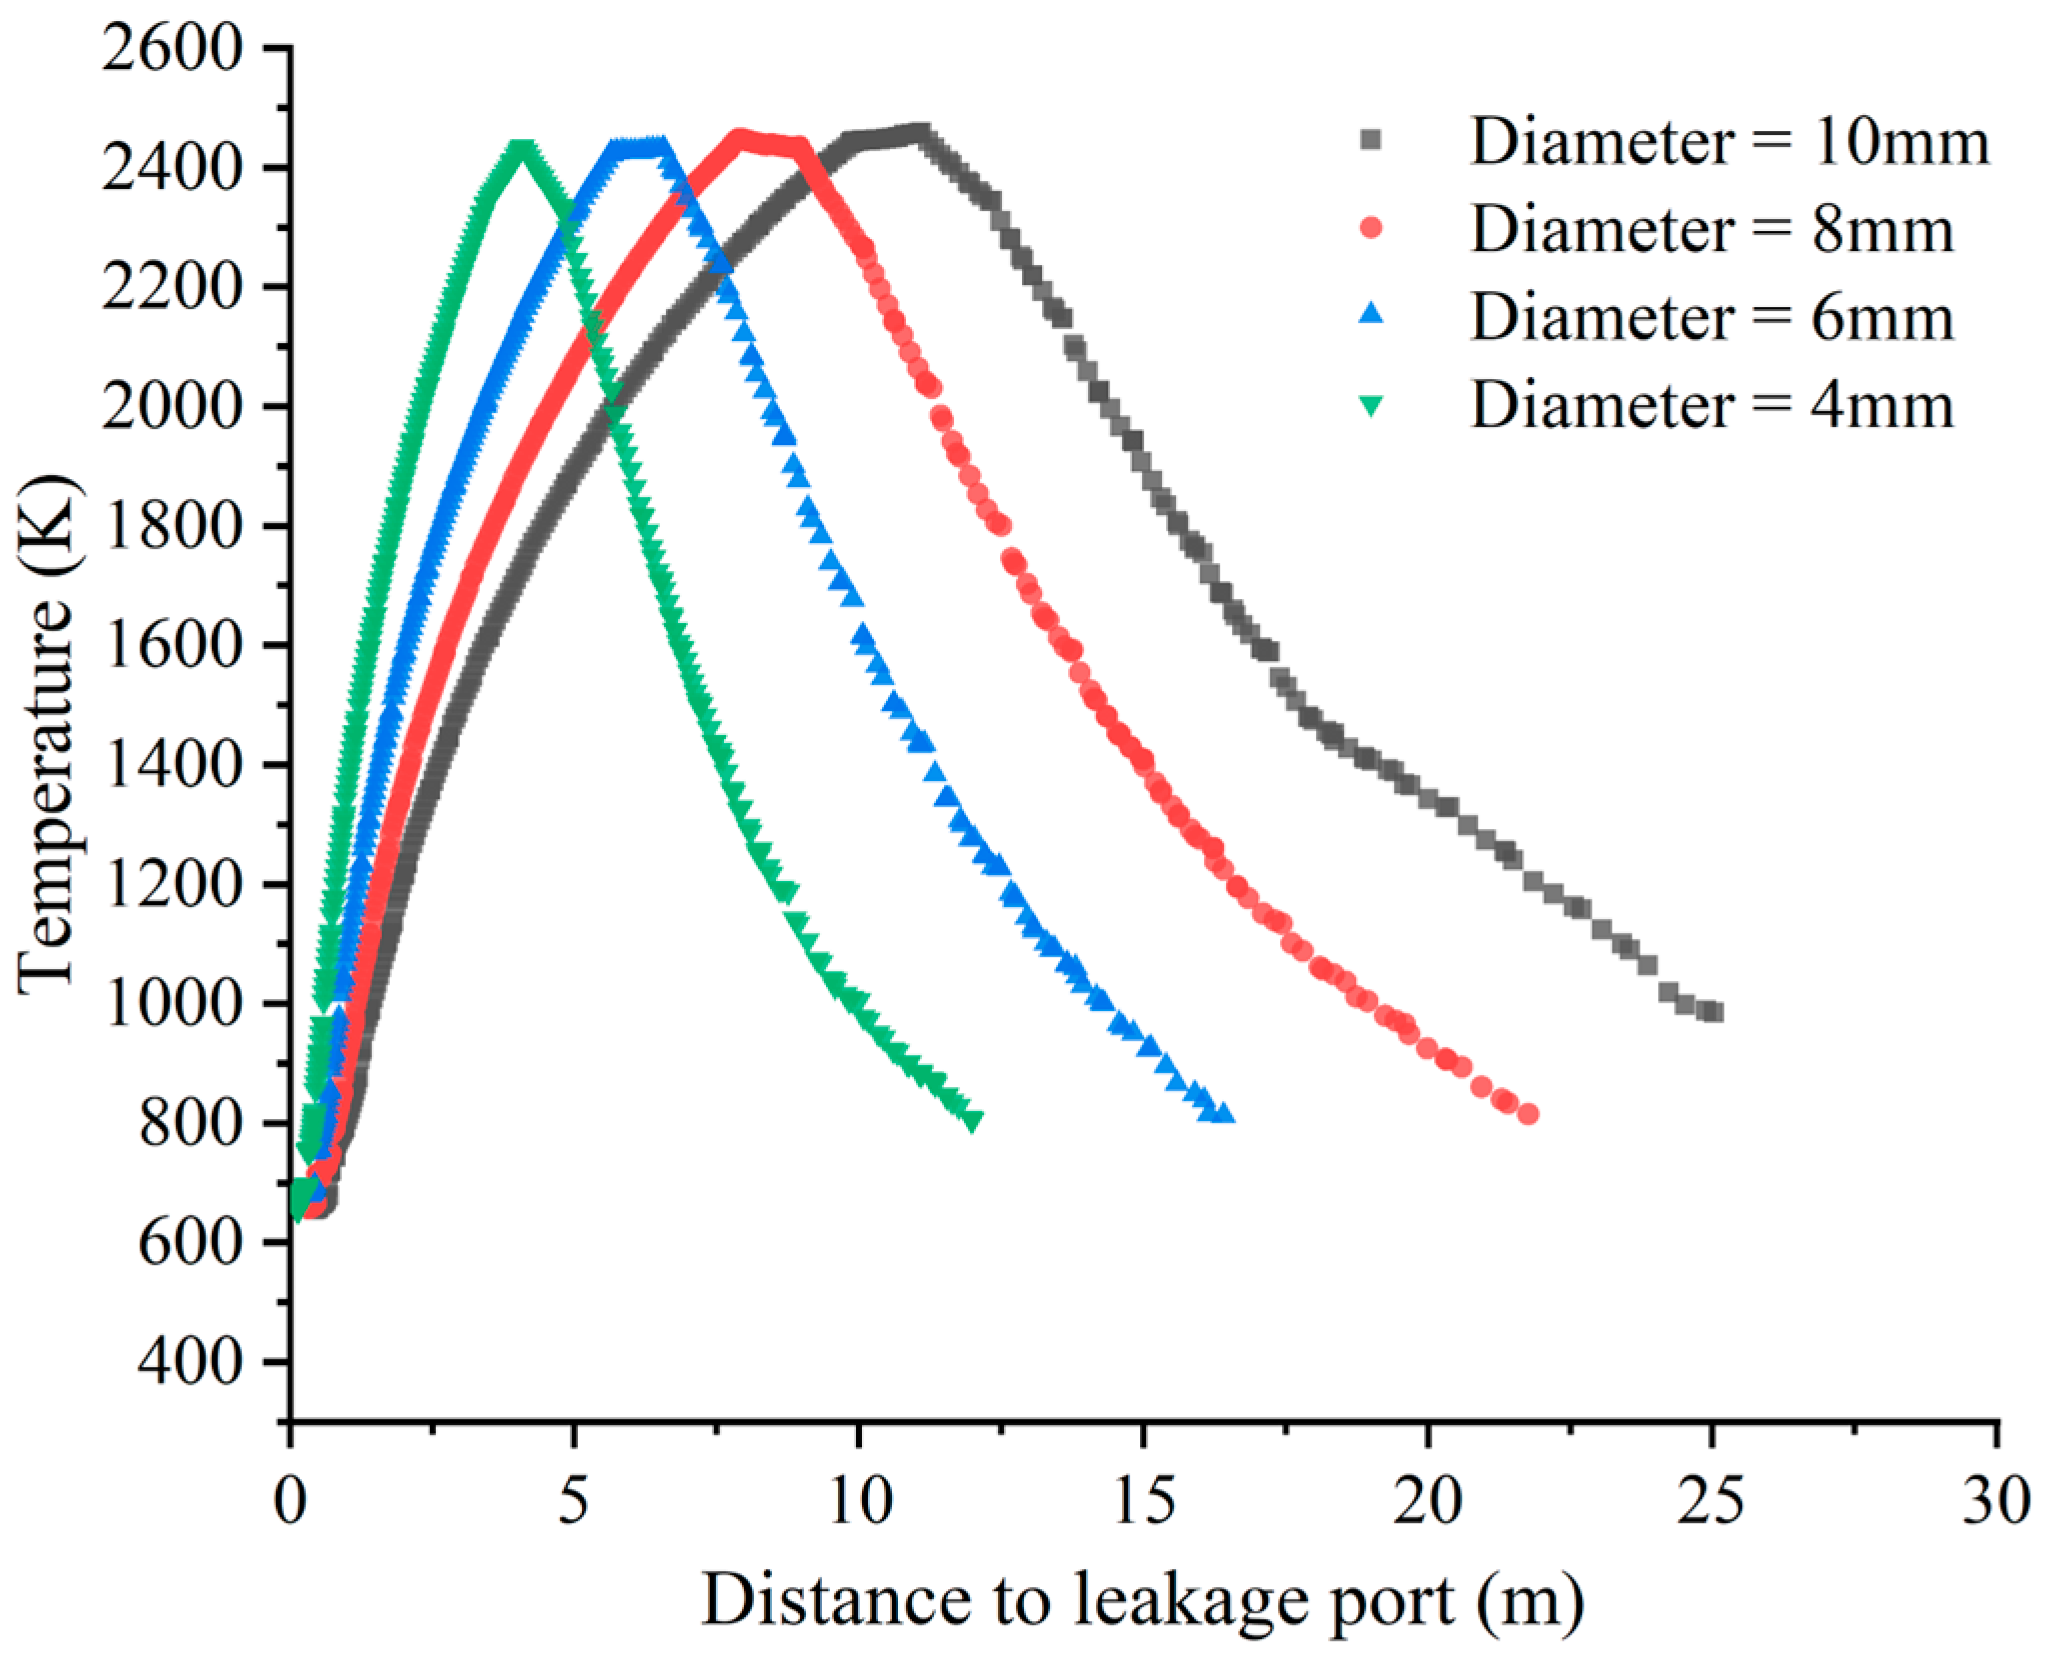
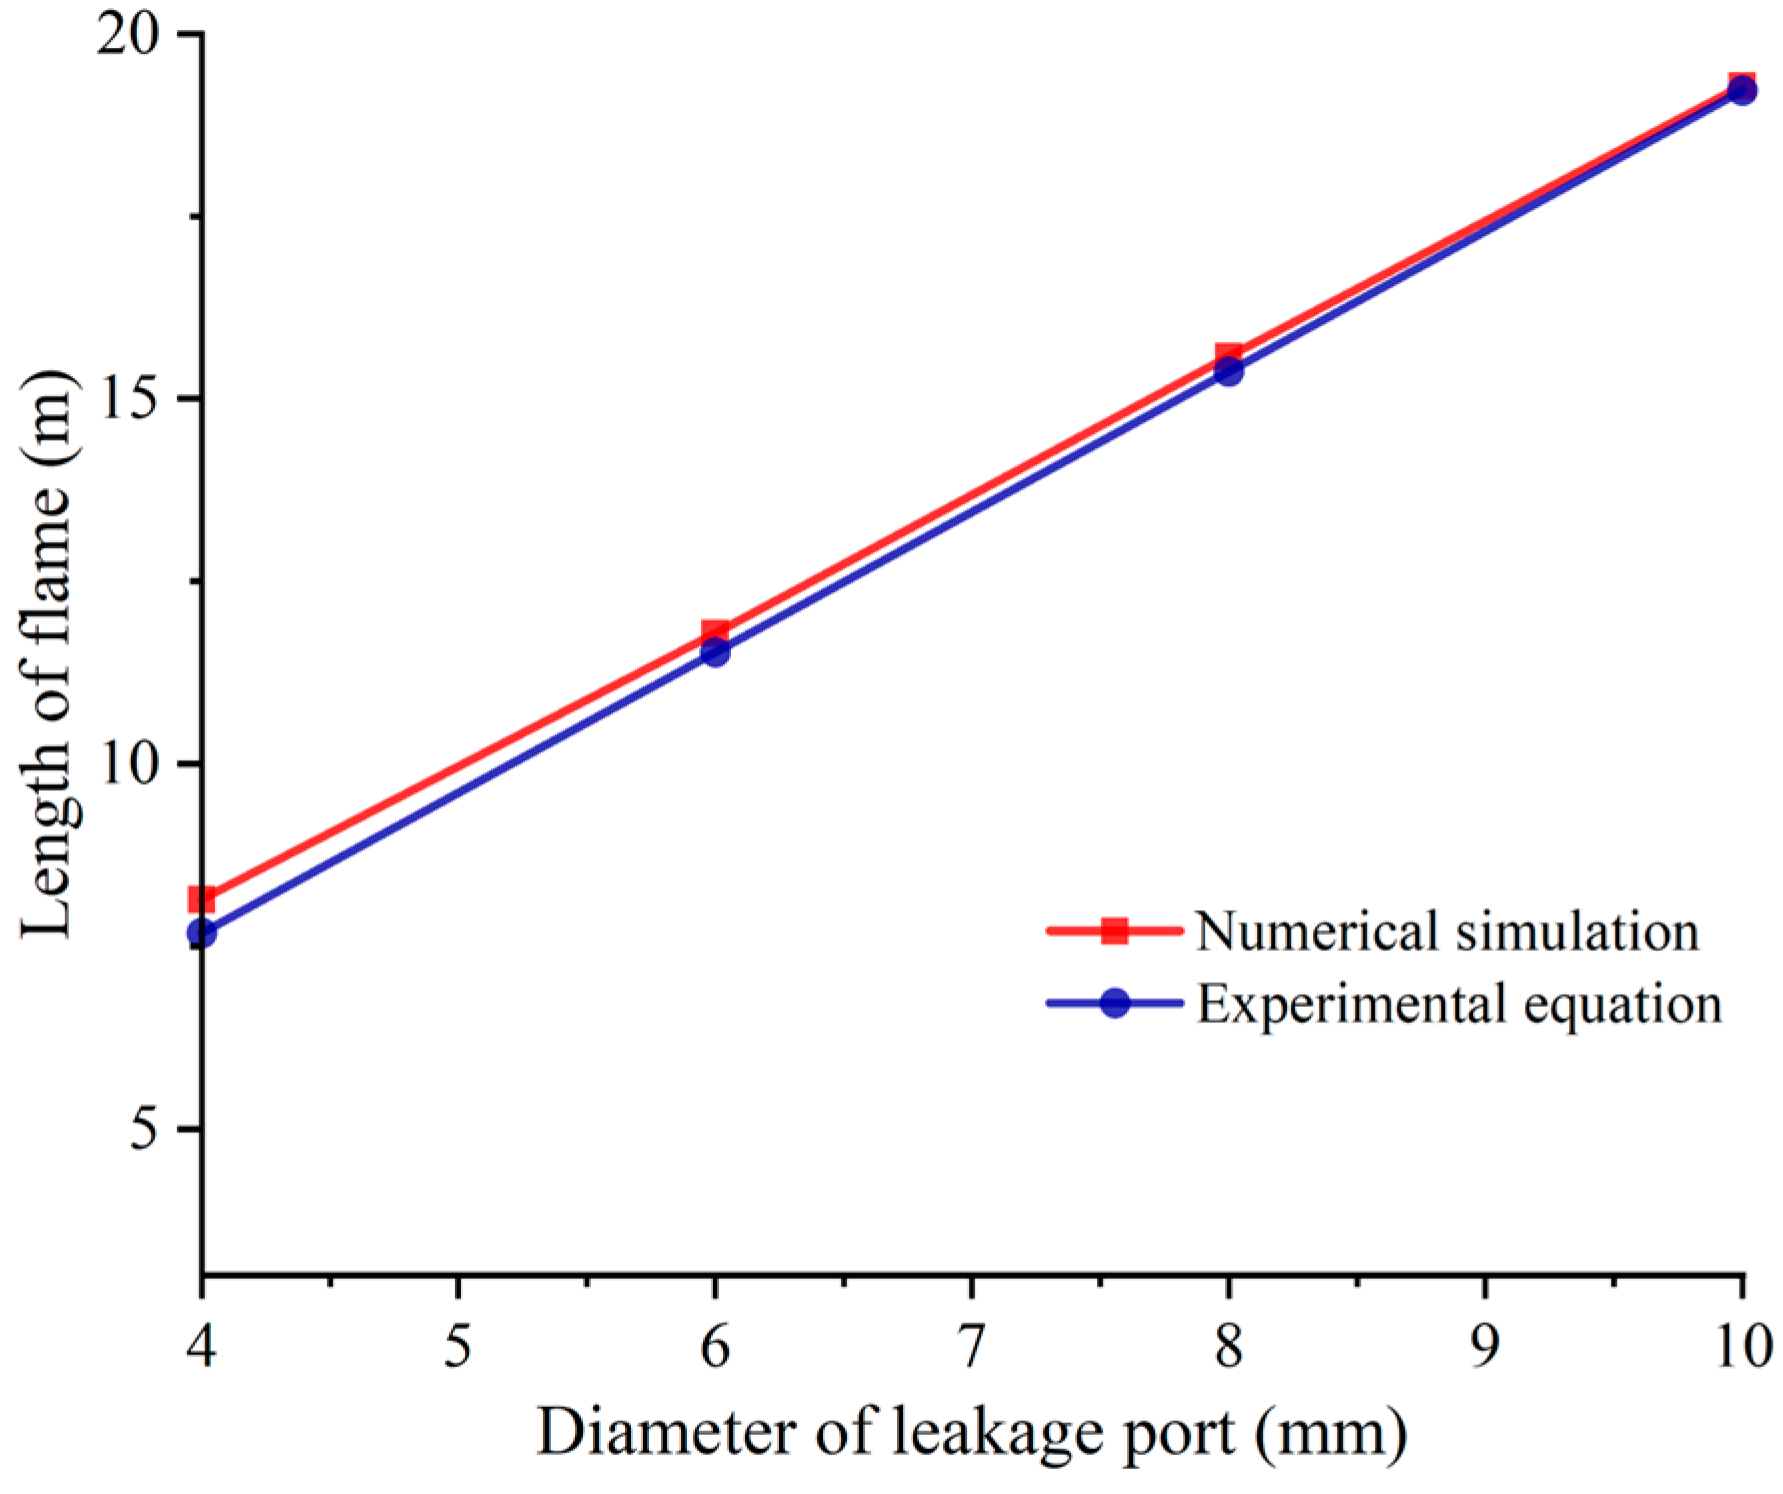
3.1.2. Effect of Different Leakage Port Diameters on Flame Characteristics

The temperature cloud diagram of the jet flame at different leakage port diameters is shown in Figure 8. The left and right sides of the figure show the temperature distribution of the hydrogen storage cylinder bank when it leaks toward the buffer tank and compressor, respectively. The range of influence of the temperature field of the flame decreases with the diameter of the leakage port. At a diameter of 10 mm, the temperature around the buffer tank and compressor are the highest, with the upper surface of the compressor reaching temperatures of over 1200 K and the temperatures on the opposite jet surface reaching temperatures of over 2400 K. As the diameter decreases, the range of influence of the flame’s temperature field decreases significantly. At a diameter of 6 mm, the flame is no longer able to develop high temperatures in the vicinity of the buffer tank.
In the case of the leakage on the left side, the buffer tank was farther away from the leakage, and the jet flame was not in direct contact with the equipment. The effect of the leakage port diameter on the jet flame was further analyzed in this direction. Figure 9 shows the temperature distribution on the flame trajectory for different leakage port diameters. For different leakage port diameters, the temperature distribution on the flame trajectory is basically close to the trend of the flame trajectory, both of which gradually rise first and then start to fall after reaching the highest temperature point. The main reason for this is that when hydrogen first leaked from the leakage port at a fast rate and high concentration, it did not burn sufficiently, resulting in a low temperature. As the distance increases, the hydrogen is further mixed with air, the hydrogen is fully combusted, and the temperature increases. When the distance is further increased, the hydrogen concentration decreases, resulting in the combustion temperature turning lower.
For different leakage port diameters, the maximum temperature of the flame was approximately the same, but the location of the maximum temperature varied, with the maximum temperature point being farther away from the leakage for larger diameters. When the diameter increases from 4 mm to 10 mm, the location of the maximum temperature increases from 4.09 m to 11.09 m from the trajectory line.
The length Lf of the jet flame at different diameters is shown in Figure 10. As the diameter of the leakage port increases, the flame length increases accordingly, and the flame length increases by 11.145 m when the diameter is increased from 4 mm to 10 mm. Comparing the simulation results with the results of the empirical formula for the flame length summarized by Mogi [7], it can be seen that the flame lengths obtained by the two methods are very close to each other, with a maximum difference of only 5.9%. The flame lengths at four different diameters from small to large are Lf,4 = 8.145 m, Lf,6 = 11.79 m, Lf,8 = 15.58 m, and Lf,10 = 19.29 m in that order.

3.2. Risk Assessment of Jet Flame Accident

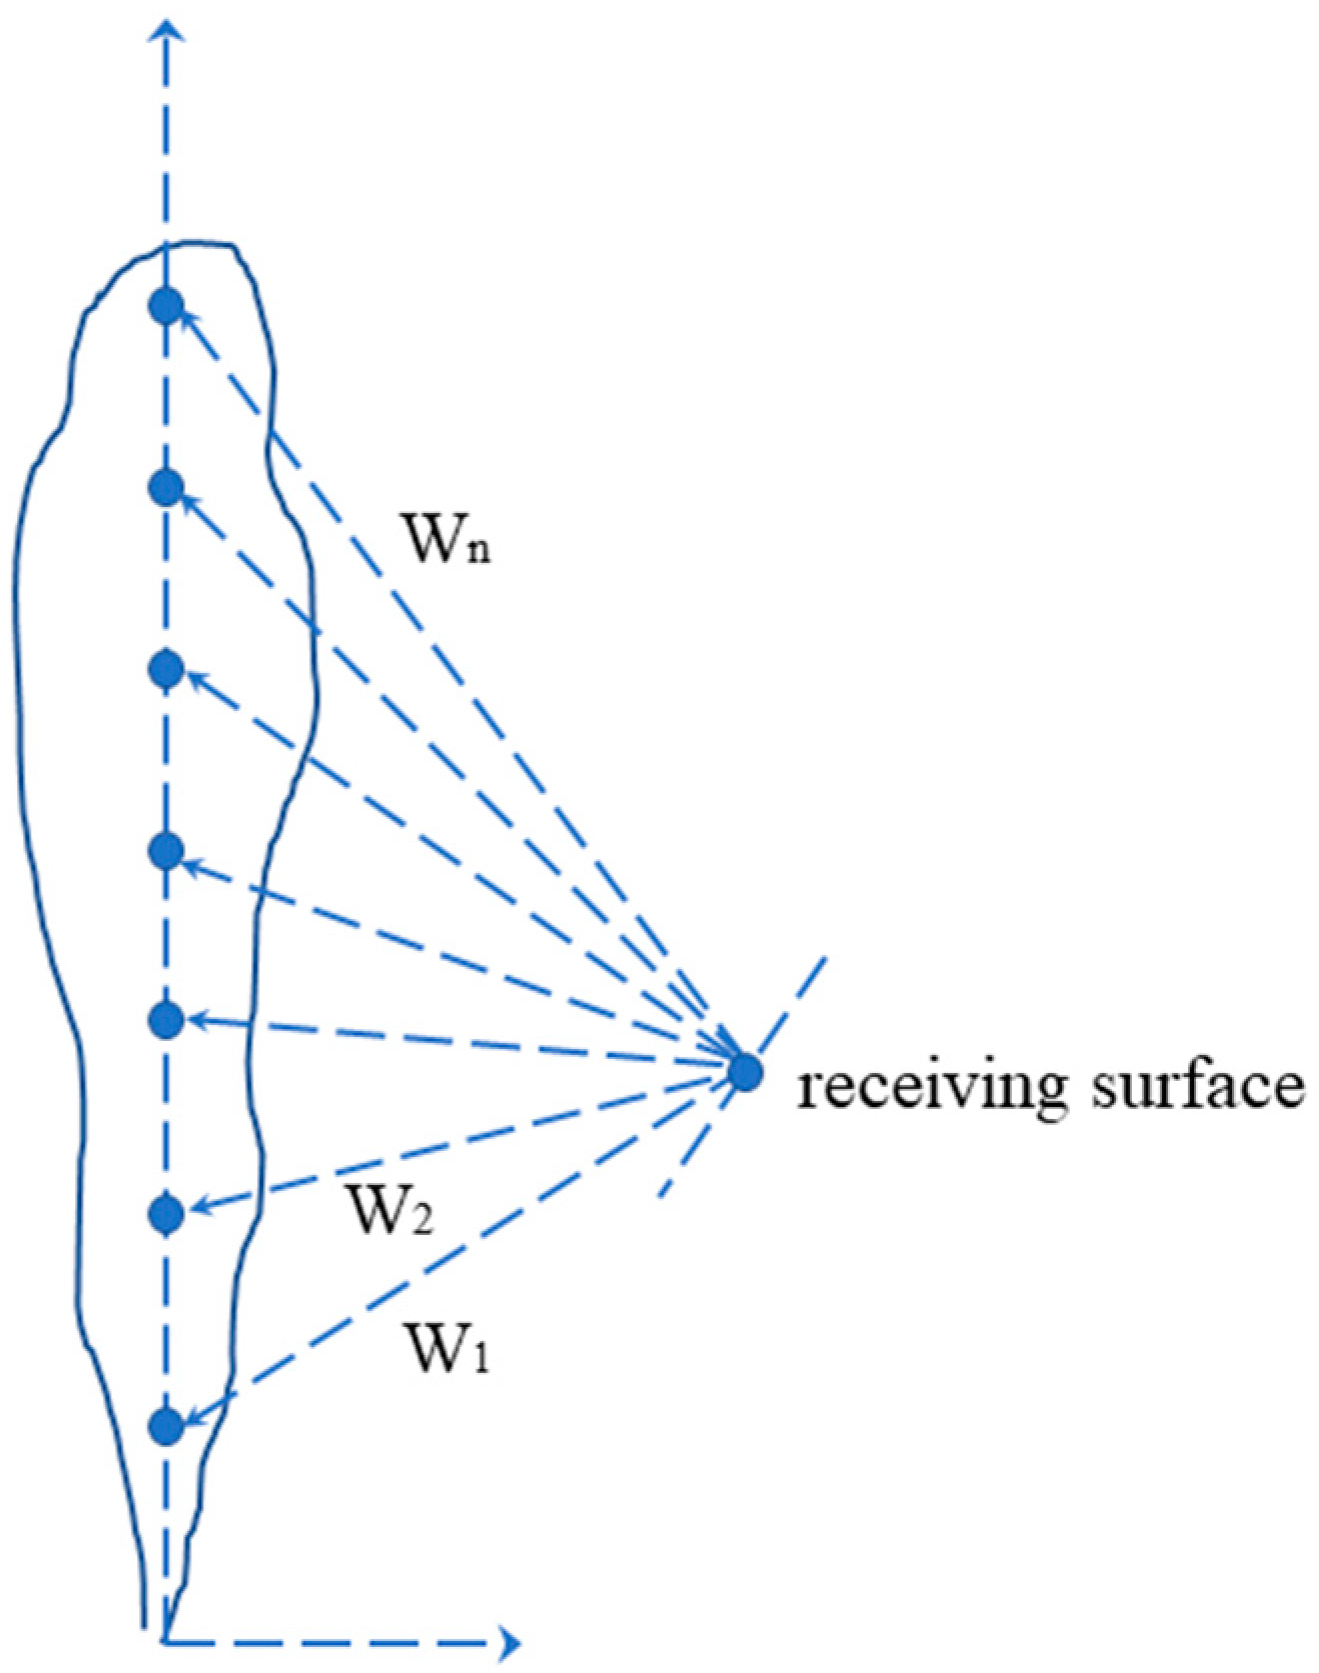
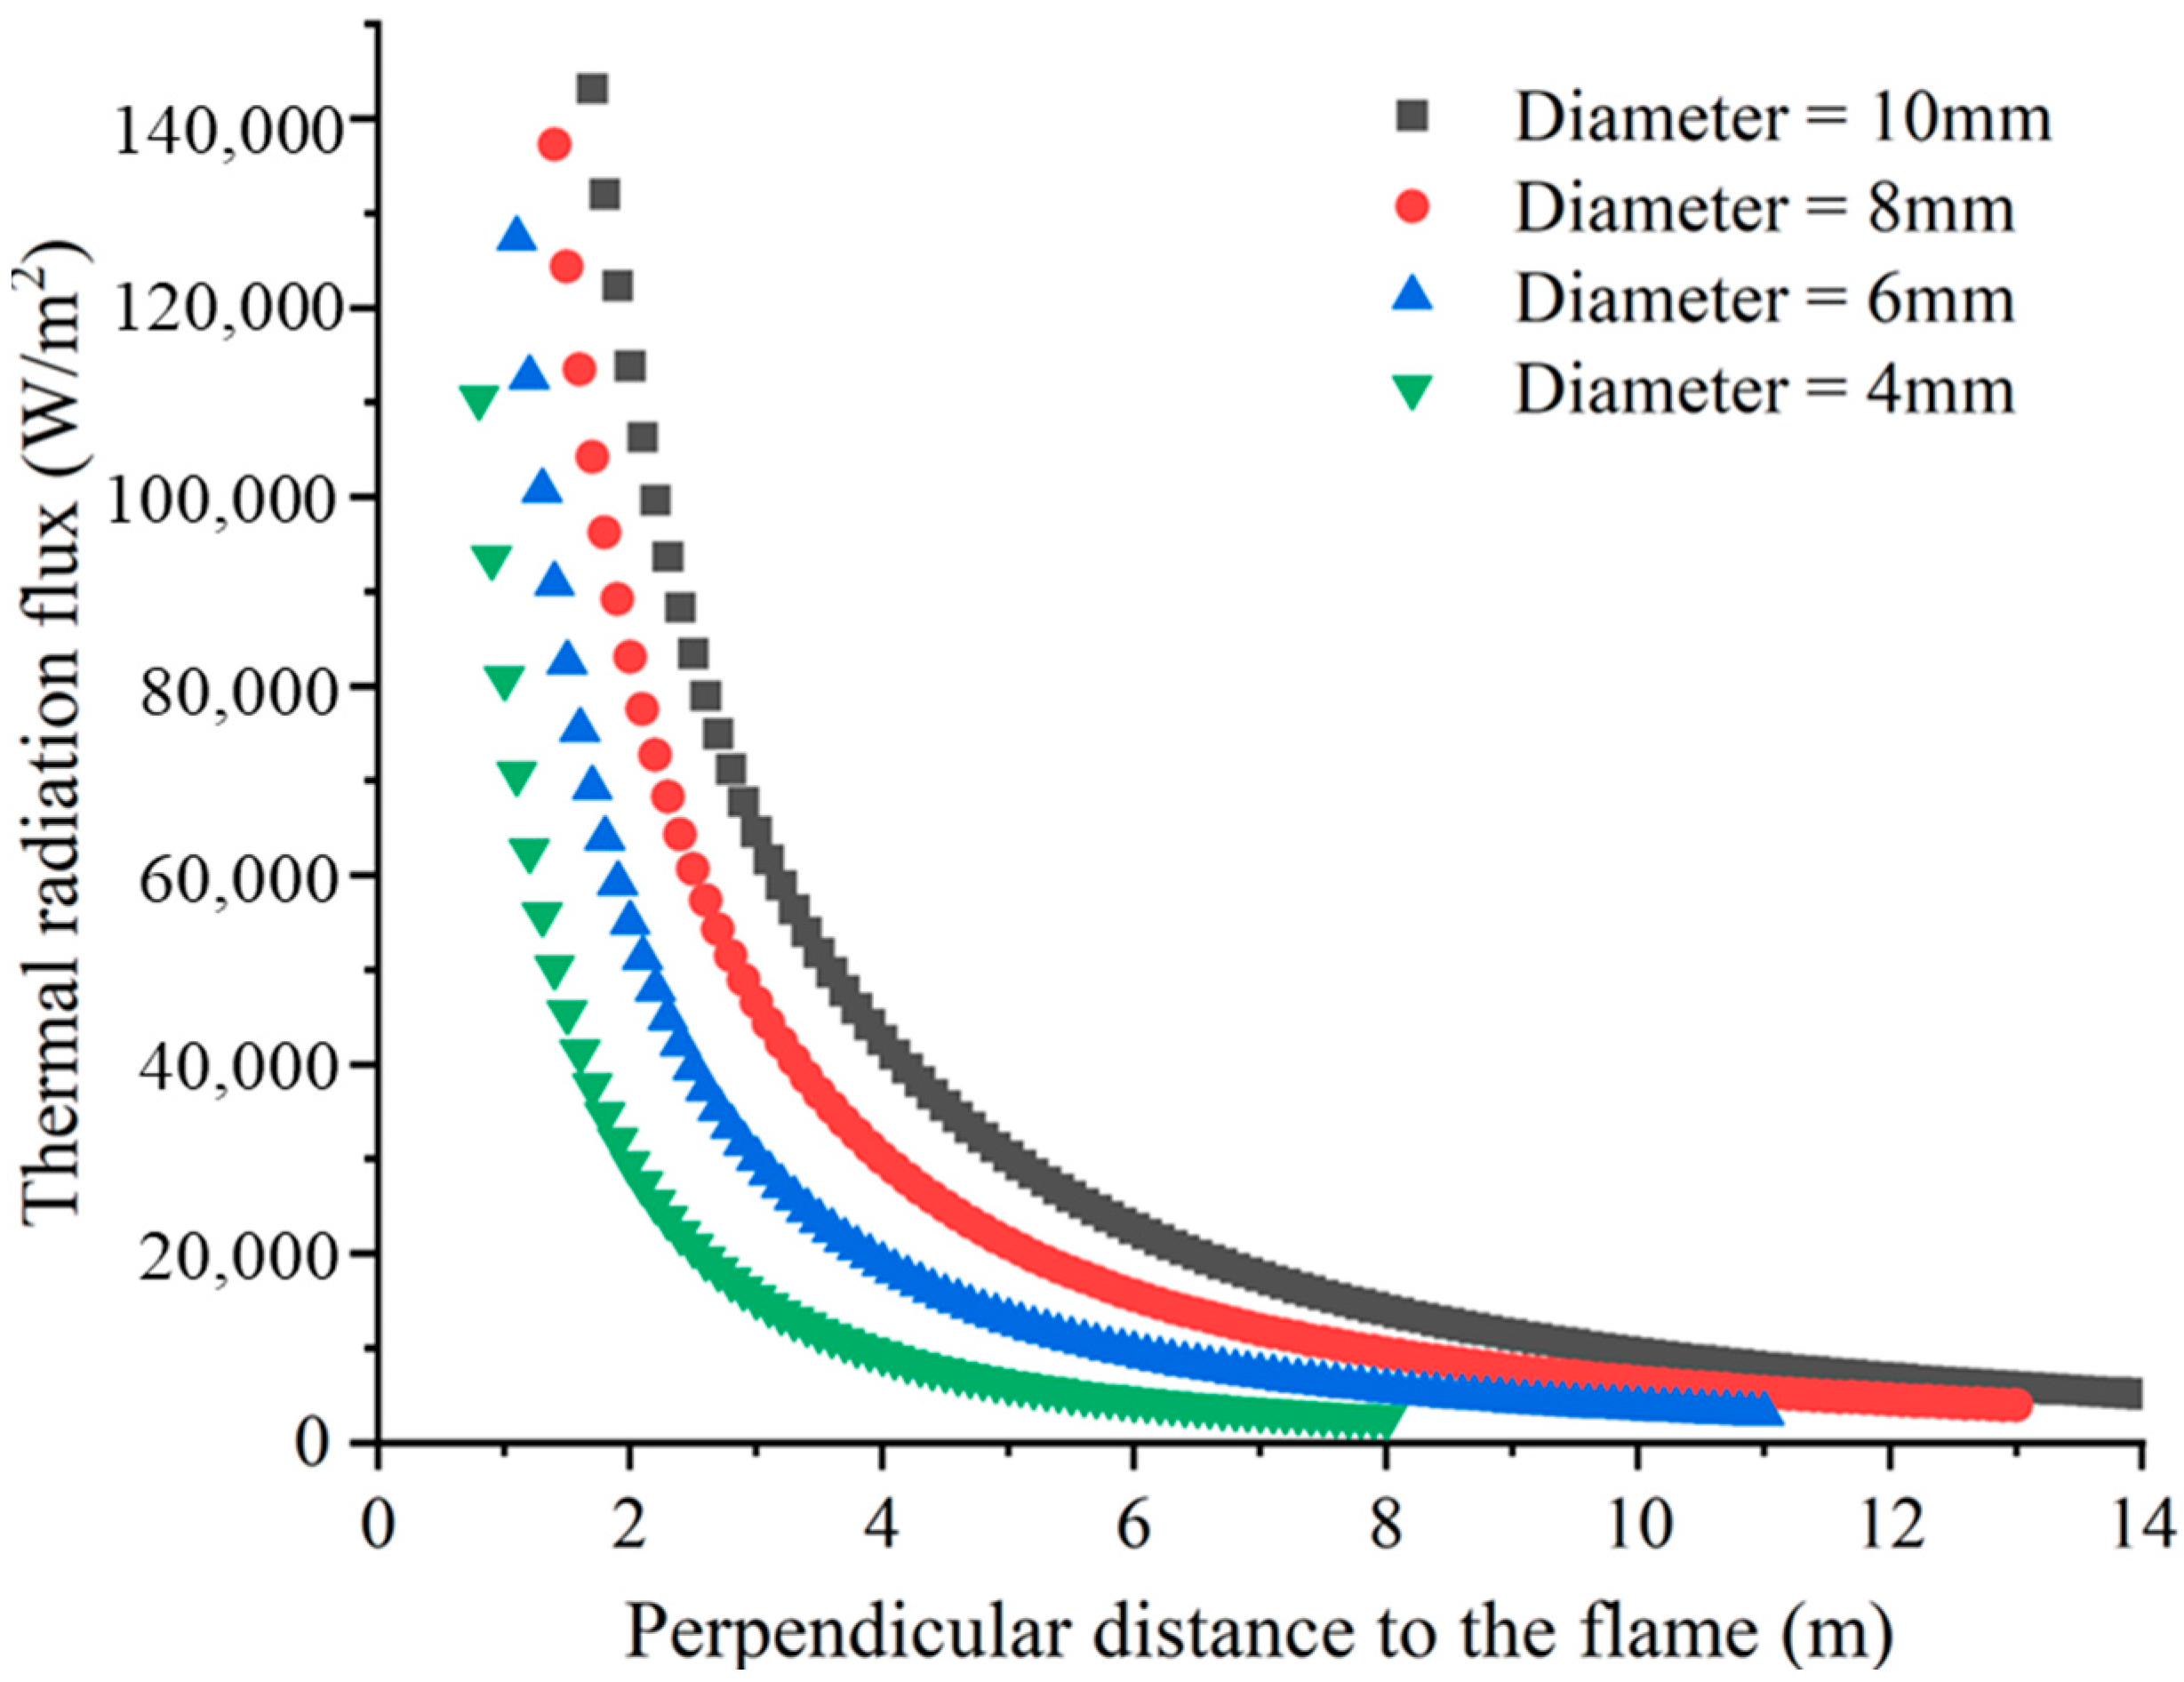
3.2.1. Calculation of Thermal Radiation Flux in Jet Flame Accidents

The assessment of injuries to people and buildings from jet flame accidents is mainly based on the thermal radiation flux. For the calculation of thermal radiation from flames, the main widely used methods are the single-point source model and the weighted multipoint source model. In this paper, multipoint source modeling is used for calculation. The model divides the flame into multiple point sources along the axis, and weights are divided for each point according to the flame temperature distribution. The heat is radiated from multiple point sources to the receiving point, and the amount of heat radiated is the sum of the amount radiated by all the point sources, as shown in Figure 11.
The heat radiation flux from the flame to the surrounding space is symmetrically distributed with the flame as the central axis, so the model usually calculates the heat radiation flux on a plane. The heat radiation at the distance S from the flame is calculated by Equation (17):
q W M P = j = 1 n q j = j = 1 n w j F m H τ j 4 π S j 2 c o s φ j
where q W M P is the total radiant heat received by the receiving surface, W/m2; q j is the thermal radiation of the j point source to the receiving surface, W/m2; w j is the weight of the j point source; F is the ratio of radiant heat to the heat released from the flame; m is the mass flow rate of hydrogen, kg/m3; H is the heat of combustion of hydrogen; τ j is the atmospheric transmittance; S j is the distance of the j point source from the receiving surface, m; and φ j is the angle between the j point source and the receiving surface.
The distance from the leakage port can be calculated by Equation (18):
Z = L f / n
Z 1 = Z / 2
Z j = Z j 1 + Z
where Z j is the distance between the j point source and the leakage port, m; L f is the flame length, m; and n is the number of point sources. The weight of each point source can be calculated by Equation (19):
w j = j w 1         j = 1 , 2 , , n 0
w j = [ n 0 n 0 1 ( n ( n 0 + 1 ) ) ( j ( n 0 + 1 ) ) ] w 1         j = n 0 + 1 , , n
j = 1 n w j = 1
where n 0 is the location of maximum thermal radiation, and the experimental data show that it is at 0.75 times the flame length.
Based on the above calculation method of heat radiation amount, the heat radiated to the surrounding area by the jet flame is calculated for different leakage port diameters. Only the flame length is considered in the calculation, assuming that the angle between the receiving surface and the point source is zero. The heat radiation flux around the flame for different leakage port diameters is shown in Figure 12. The distances in the perpendicular flame direction in the figure are calculated from the vicinity of the flame width, and the horizontal distances are calculated from the leakage port.
When the perpendicular distance to the flame is the same, the thermal radiation flux at the receiving surface increases and then decreases with increasing horizontal distance along the flame direction to the leak. When the distance in the horizontal direction is the same, the thermal radiation flux of the receiving surface will decrease with the increase in the perpendicular distance to the flame, and the rate of decrease will slow down with the increase in the distance. The larger the leakage port diameter, the greater the range of influence of thermal radiation in the perpendicular and horizontal directions of the flame and the greater the maximum value of the thermal radiation flux. For different diameters, the location of the thermal radiation flux maximum is at different distances from the leakage port, with larger diameters being farther away, at about 0.65 times the flame length. The thermal radiation flux in the perpendicular flame plane at this location decreases with increasing distance from the flame, as shown in Figure 13. The maximum value is 143,176 W/m2 at a leakage port diameter of 10 mm and decreases to 110,423 W/m2 at a diameter of 4 mm.

3.2.2. Consequence Assessment of Jet Flame Accidents

Methods for assessing the consequences of jet flame accidents consist mainly of heat flux and thermal damage criteria. The heat flux criterion uses only the value of heat radiation flux as the evaluation standard, and the threshold value of heat radiation flux in different hazardous areas is delineated to determine the safety distance. Table 2 shows the damage effects on people at different thermal radiation fluxes [22]. The threshold value for lethal emergence is 25 kW/m2, which is usually classified in engineering as the threshold for death, while 6.3 kW/m2 is the threshold for serious injury, and 1.58 kW/m2 is the threshold for minor injury.
Based on the delineation criteria, the accidental damage ranges at different leakage port diameters were divided separately, as shown in Figure 14. The accident range is symmetrically distributed with the flame as the axis, and the range is simplified in the figure to show only half of the range with the flame as the axis. The origin is the location of the leakage port, the length of the jet flame is labeled on the axis, and specific values of the flame length are shown for different diameters. The range of death is the smallest of the three damage ranges, almost at a very small distance near the flame, but the range of serious and minor injuries increases significantly compared to the range of death. The larger the diameter of the leakage port, the greater the overall damage range and the greater the impact on the surrounding area. When the leakage port diameter increases from 4 mm to 10 mm, the fatal range increases less (from 2.23 m to 5.5 m in the perpendicular flame direction), the serious injury range increases from 5.01 m to 12.59 m in the perpendicular flame direction, and the minor injury range increases the most (from 10.4 m to 26.05 m in the perpendicular flame direction).
The thermal destruction criterion assumes that the consequences of an accident depend not only on the thermal radiation flux but also on the duration of exposure. The probability of death due to an accident is related to the thermal dose, and the probability of death can be calculated using Equation (20):
P t = F ( Y | μ = 5 , σ = 1 ) = Φ ( Y 5 )
The calculated equation is the cumulative distribution function of the standard normal distribution, where the variable Y is the value of the probability of death from thermal radiation injury, which can be obtained by calculating Equation (21) [23]:
Y = 36.38 + 2.56 ln ( Q )
where Q is the thermal dose, which can be calculated by Equation (22):
Q = t · q 4 / 3
where t is the human exposure time, usually taken as 0–20 s, and q is the thermal radiation flux W/m2.
According to the above model, set the exposure time as 20 s. Considering the change on the plane at the maximum value of thermal radiation flux in the above section, the change rule of the probability of death with the distance in the perpendicular direction of the flame under different leakage port diameters is shown in Figure 15a. When very close to the flame, the probability of death has been maintained at 100%, and the larger the diameter of the leakage port, the larger the range of death at 100%. When the distance increases to a certain length, the probability of death begins to decrease sharply. The probability of death at a distance of 5.4 m from the flame decreases to the order of 10-6 at a leakage port diameter of 4 mm, which can be considered relatively safe. In comparison, this distance increases to 8.1 m, 10.8 m, and 13.5 m at diameters of 6 mm, 8 mm, and 10 mm, respectively. In order to compare the effect of exposure time on the probability of death, a 10 mm leak port with a larger hazard range was selected to compare the change in probability of death with distance for exposure times of 20 s, 15 s, 10 s, and 5 s, as shown in Figure 15b. The distance to the flame from the location where the probability of death begins to decrease significantly increases with increasing exposure time, from 2.1 m at 5 s to 4.3 m at 20 s. When the exposure time was reduced from 20 s to 5 s, the hazardous distance was reduced from 13.5 m to 7.5 m. The hazardous distance was reduced to 7.5 m when the exposure time was reduced from 20 s to 5 s.
In addition to the assessment of human injury, the safety distances for equipment within the station also need to be defined. The safety distances for buildings and equipment within the integrated hydrogen production and refueling station should comply with the criteria shown in Table 3 [24].
In this study, the hydrogen storage cylinder bank is surrounded by pressure vessels such as buffer tanks and compressors, so a heat radiation flux of 15 kW/m2 is considered as the boundary to divide the equipment spacing. The extent of the boundaries for different diameter leaks is shown in Figure 16. The figure does not distinguish between the direction of leakage but is plotted only in terms of the position of the equipment in relation to the leakage port, and the boundary range is divided by the thermal radiation flux generated when the flame is not in contact with any object. At a leakage port diameter greater than or equal to 6 mm, the compressor is within the limit of a thermal radiation flux greater than 15 kW/m2, which is a significant safety hazard. For the buffer tank equipment, when the diameter of the leakage port is 10 mm, the heat radiation flux of the jet flame to the equipment will be greater than the maximum value specified in the standard. Therefore, there is a large safety hazard in the current arrangement, and the distance between equipment should be reasonably increased so that the distance between equipment is greater than the 15 kW/m2 boundary shown in the figure.

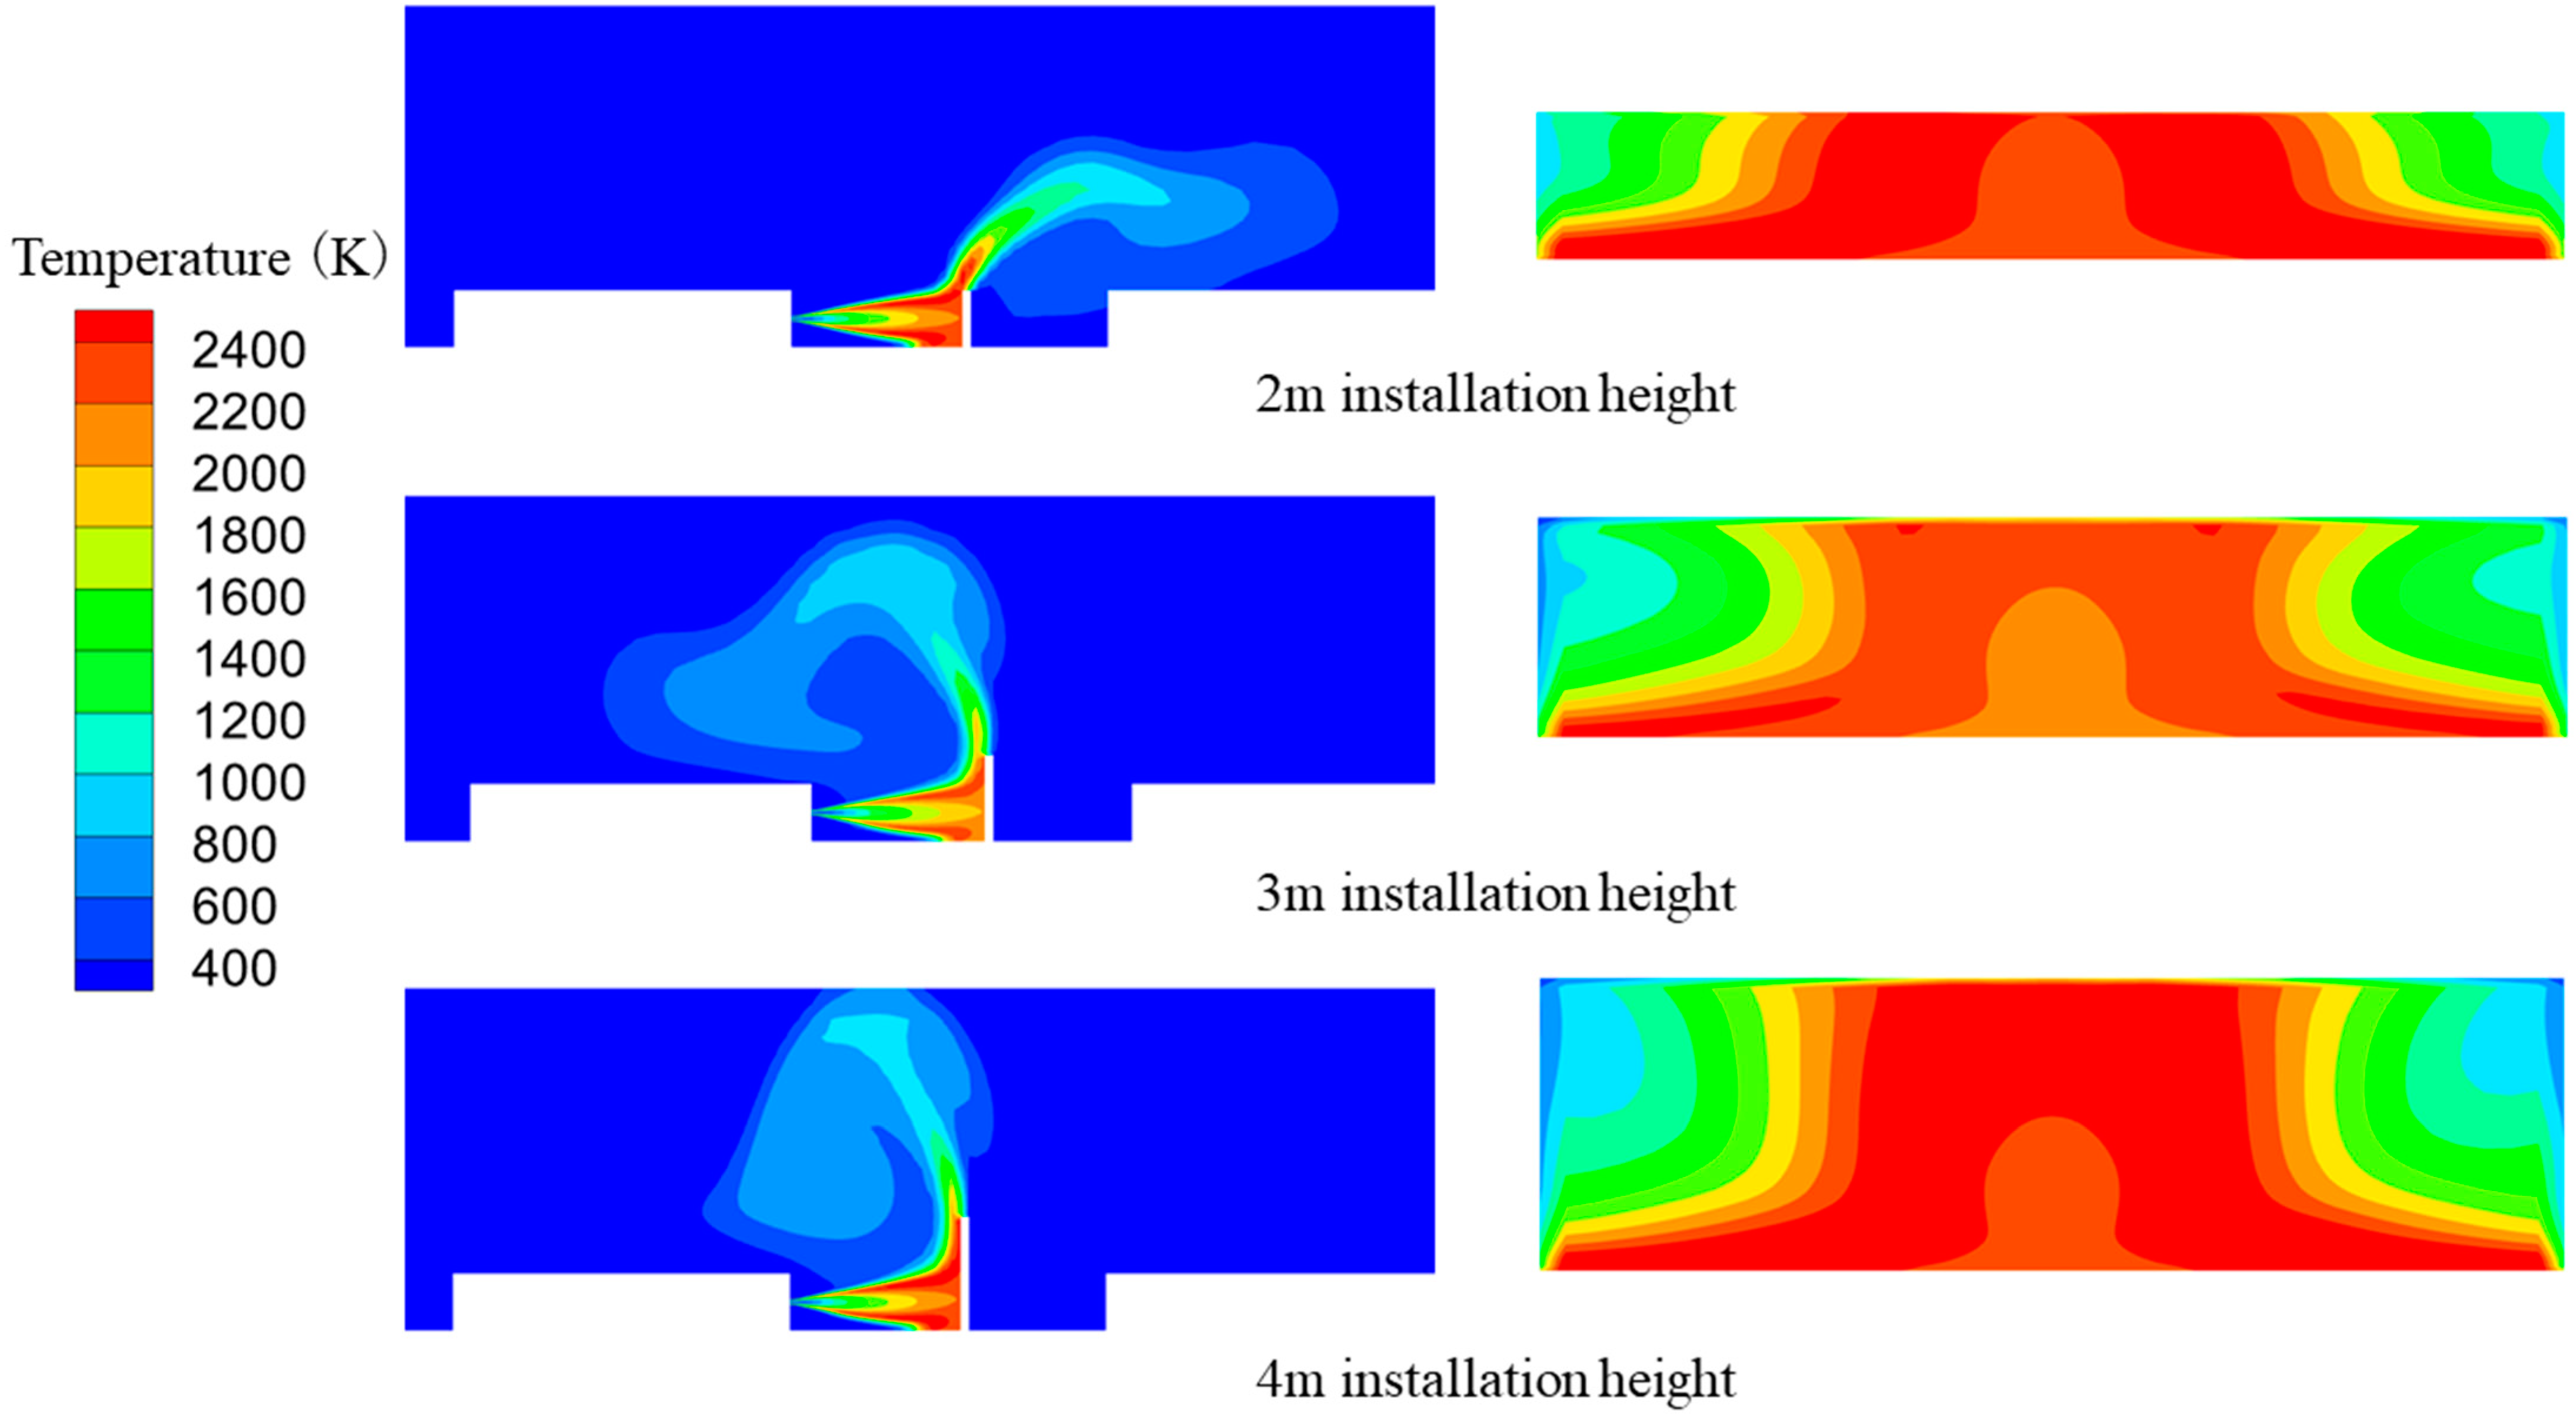
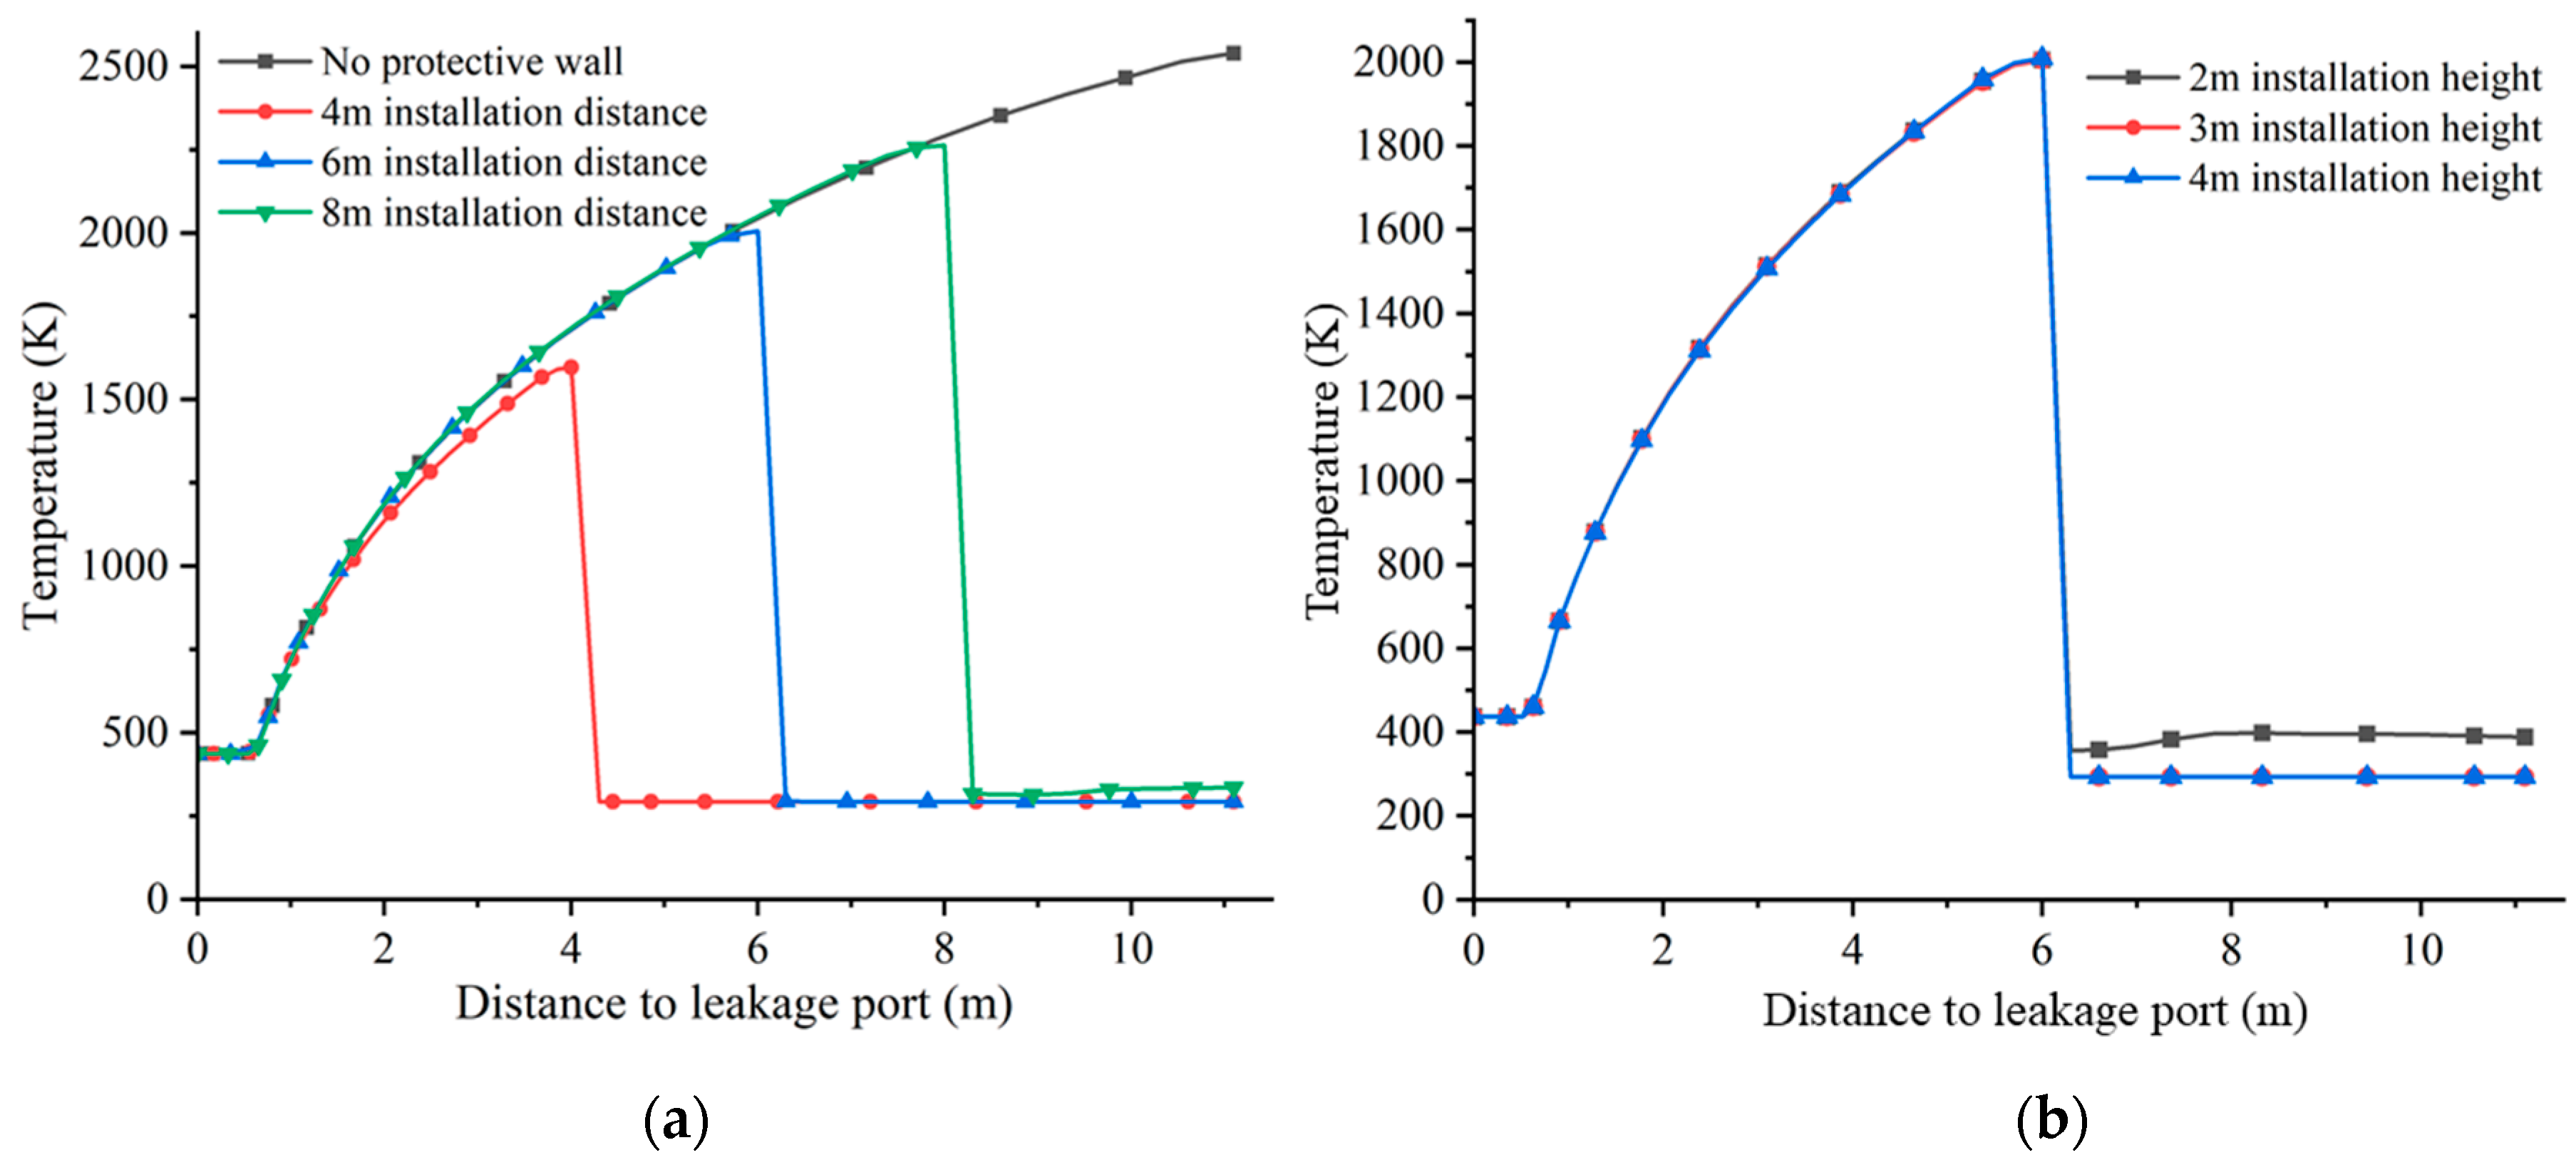
3.3. Protective Measure

From the simulation and analysis results, it can be seen that a leakage jet flame accident in the hydrogen storage area will radiate high temperatures to the surrounding equipment and personnel, which will seriously damage the equipment and threaten personal safety. Controlling the safety distance only will significantly increase the use of the area, resulting in a waste of resources. Therefore, effective protective measures are needed to reduce the hazards caused by accidents while saving space. In this section, the spread of flames and the high-temperature hazards generated by flames are prevented by adding a protective wall near the hydrogen storage cylinder bank.
On the basis of the leakage from the 10 mm diameter leakage port, a protective wall with a height of 3 m was installed at 4 m, 6 m, and 8 m in the direction of the jet stream of the hydrogen storage cylinder group, respectively. The temperature distribution of the flame and flame temperature distribution on the protective wall at different installation distances is shown in Figure 17. When the distance between the protective wall and the hydrogen storage cylinder group is 4 m, the hydrogen at the location of flame contact with protective wall does not combust sufficiently, disperse under the obstruction of the protective wall and combust sufficiently, and its flame spread to the hydrogen storage cylinders so that the temperature in the vicinity of the cylinders reaches 2200 K or higher. When the distance between the protective wall is set to 6 m before contacting the protective wall, the combustion of hydrogen is adequate. The flame impacts the protective wall after spreading around a smaller distance. The end of the flame in the direction of the hydrogen storage cylinder tilts but will not produce a higher temperature distribution on the equipment. When the distance between the protective wall and the hydrogen storage cylinder is 8 m, the protective effect is similar to the distance of 6 m, and the flame end is tilted toward the compressor, but it will not produce a high-temperature distribution on the compressor.
In order to analyze the effect of the height of the protective wall on the protective effect, the height of the protective wall was set up at 2 m, 3 m, and 4 m under distances of 6 m and the temperature distribution of the flame in different cases, as shown in Figure 18. When the height of the protective wall is 2 m, it cannot effectively block the flame. Part of the flame over the protective wall will reach the compressor diagonal above, which also leads to the compressor around a high temperature of more than 600 K. The flame temperature distribution on the protective wall shows that the center of the flame is located close to the upper edge of the wall, with some of the higher-temperature flames spreading from the upper edge to the rear of the wall. At a height of 3 m, a small amount of flame was above the height of the protective wall, with the end tilted toward the hydrogen storage cylinders, but it did not produce a temperature distribution greater than 400 K on the hydrogen storage cylinders. At a height of 4 m, the flame ends almost at the same height as the protective wall, providing better protection against the flame than at 3 m. Again, no temperature distribution greater than 400 K is produced on the equipment.
The distribution of temperature along the center of the jet with the distance from the leakage port for different installation distances and heights of the protective wall and no protective wall is shown in Figure 19. The temperature inside and outside the protective wall decreases significantly, and the surface temperature of the compressor before and after the addition of the protective wall decreases from 2538.8 K to 293 K and 334.5 K, which significantly reduces the hazard of the jet flame on the surrounding equipment. When the height is 2 m, the temperature near the compressor rises to 400 K, which is significantly higher than that of 293 K. By comparing the simulation results, considering the temperature distribution at different distances and heights, the protection effect, and resource saving, it is more appropriate to choose to add a 3 m high protective wall facility at a distance of 6 m from the hydrogen storage cylinder.

4. Conclusions

In this study, a numerical simulation of a jet flame accident in the hydrogen storage area of an integrated hydrogen production and refueling station and an analysis of the consequences of the accident are presented. The main conclusions are as follows:
(1)
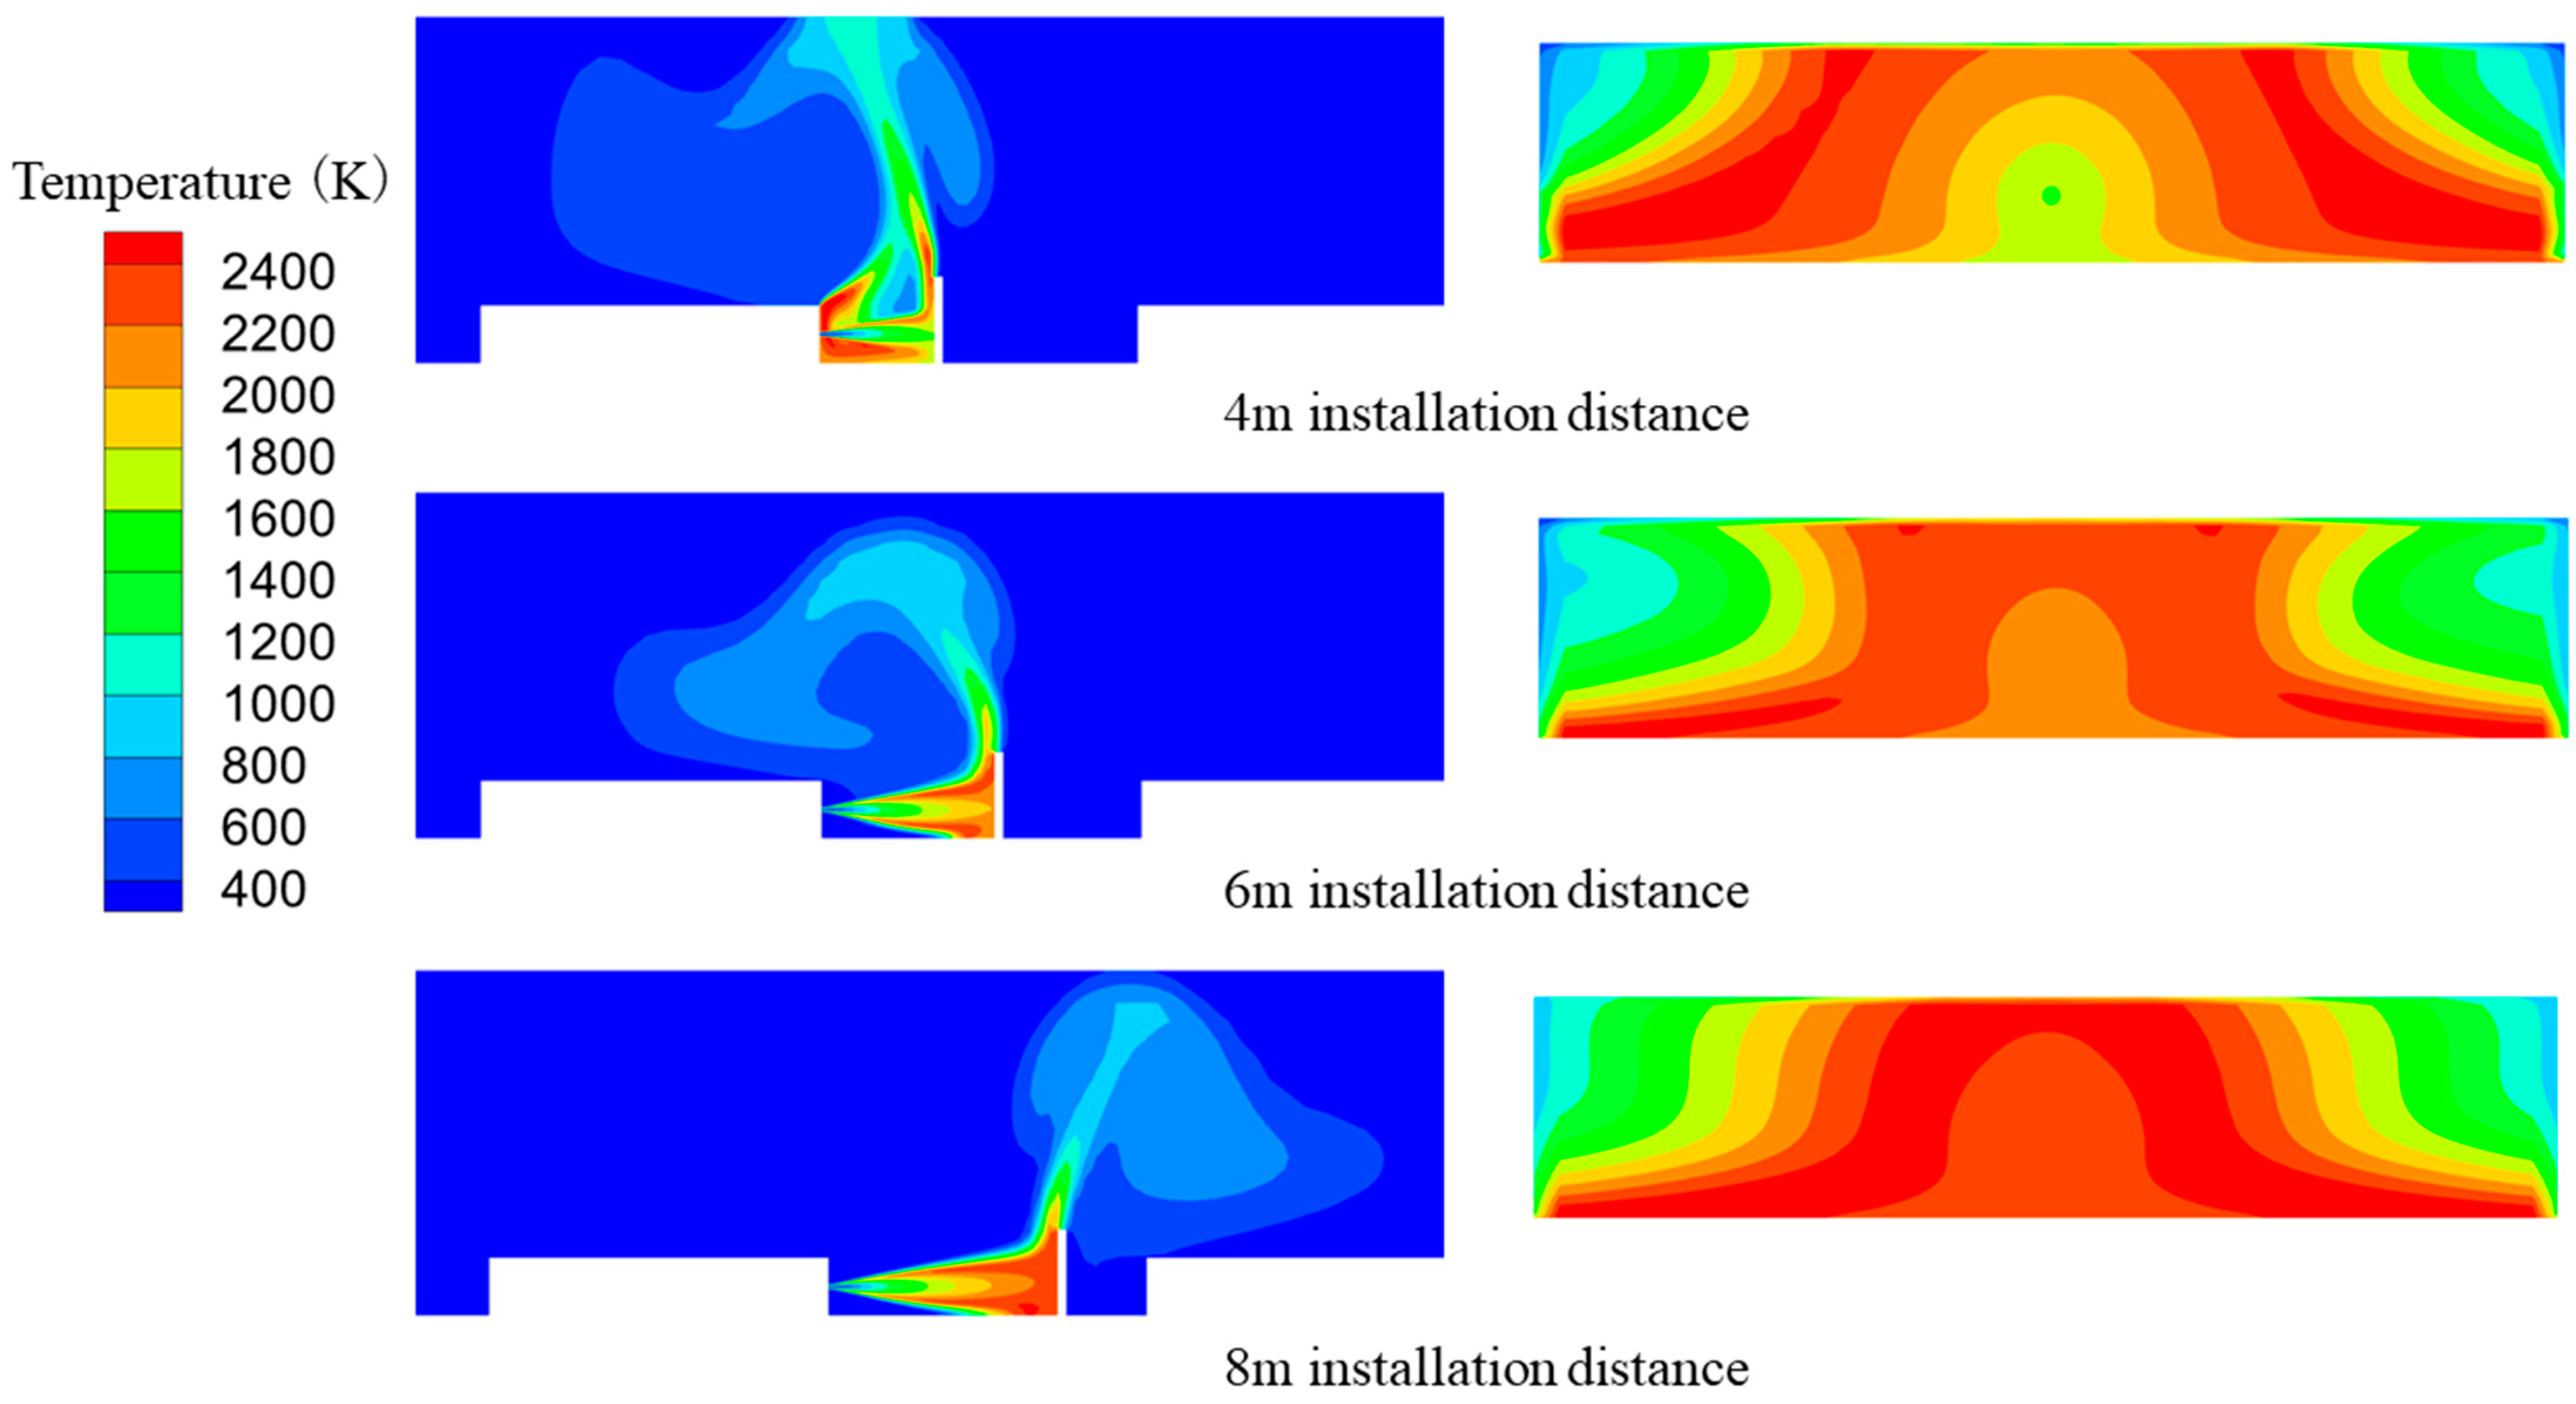
This study takes an actual integrated hydrogen production and refueling station as the research object, combining the accident analysis with the actual scene, which is more realistic. In the current station, when a jet flame incident occurs in the hydrogen storage area, the temperature around the compressor is higher and more dangerous than in the buffer tank;
(2)
The temperature distribution on the flame trajectory line first increases and then decreases. The larger the diameter of the leakage port, the longer the flame length. When the diameter increases from 4 mm to 10 mm, the flame length increases by 11.145 m. The larger the diameter of the leakage port, the wider the distribution of the temperature field generated by the flame. The flame will no longer generate direct high temperatures on the surface of the buffer tank and compressor when the diameters are smaller than 6 mm and 4 mm, respectively;
(3)
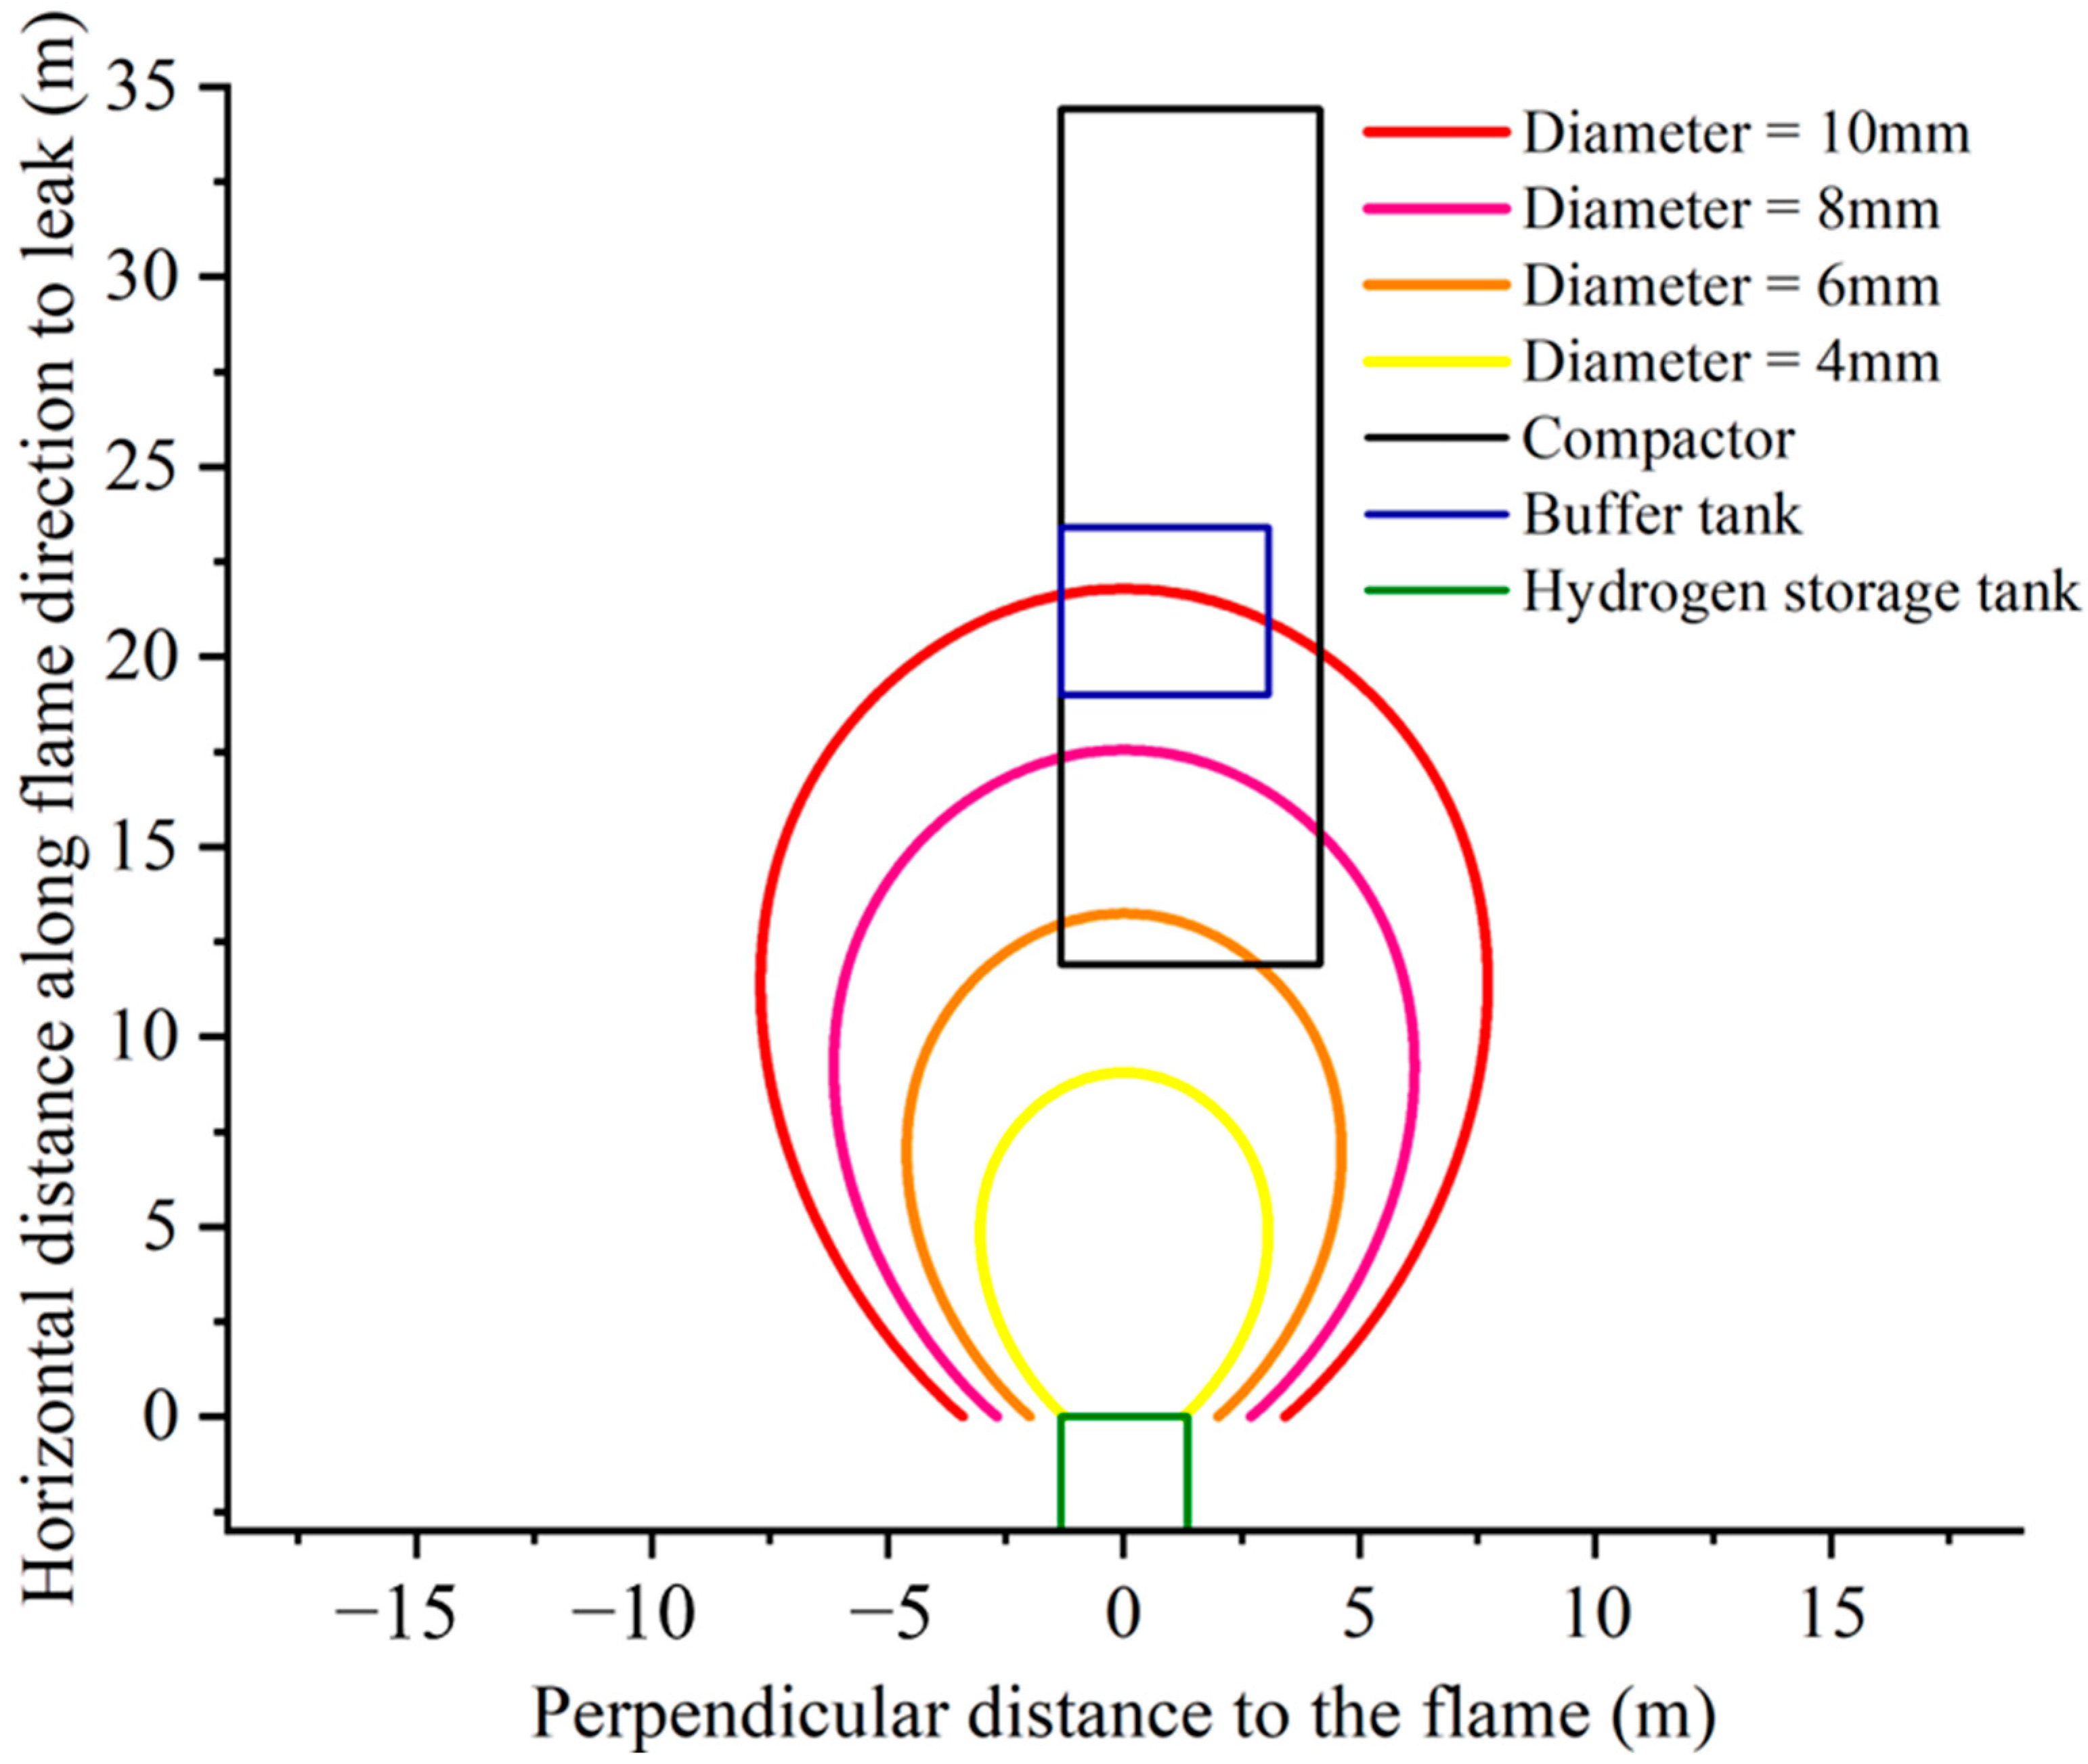
Safety distances for jet flame accidents increased with increasing leakage ports, and more so in the perpendicular flame direction. For the three injury ranges, the range of minor injuries increased the most with increasing diameter. The rate of decrease in the probability of death of a person slows down with the increase in the distance from the flame. In the current station, the compressor and the buffer tank are in the equipment hazardous area for diameters greater than 6 mm and 10 mm, respectively. Therefore, the safety distance between the equipment should be increased, or a protective wall should be installed. The distance between the protective wall and the hydrogen storage cylinders is 6 m. The height of the protective wall is 3 m, which is reasonable.
The results of this study can provide theoretical guidance, data support, and layout improvement suggestions for the safe operation of the integrated hydrogen production and refueling station. In future studies, the probability of hydrogen leakage accidents can be investigated to further improve the results of the risk assessment.

Author Contributions

Conceptualization, T.Y. and J.X.; methodology, X.F. and X.Y.; software, X.Y. and Z.X.; validation, Z.X. and H.L.; formal analysis, J.W.; investigation, J.W.; resources, X.F.; data curation, H.L.; writing—original draft preparation, X.F. and X.Y.; writing—review and editing, T.Y. and J.X.; visualization, N.X.; supervision, T.Y. and N.X.; project administration, S.C. and C.S.; funding acquisition, S.C. and C.S. All authors have read and agreed to the published version of the manuscript.

Funding

This research was funded by the Shandong Electric Power Engineering Consulting Institute Co., Ltd., “Study on hydrogen dispersion, fire thermal radiation, and overall layout optimization for new skid-mounted hydrogen production systems and hydrogen refueling stations” (042300007948), the National Key R&D Program of China (2022YFC3006005 and 2023YFB2504300) and the Key R&D Program of Hubei Province of China (2023BCB046).

Data Availability Statement

The data are contained within the article.

Conflicts of Interest

Author Xianglin Yan was employed by the company Powerchina Hubei Electric Engineering Co., Ltd., Shiyu Chen and Chunyan Song were employed by the company Shandong Electric Power Engineering Consulting Institute Co., Ltd. The remaining authors declare that the research was conducted in the absence of any commercial or financial relationships that could be construed as a potential conflict of interest.

References

  1. Mehr, A.S.; Phillips, A.D.; Brandon, M.P.; Pryce, M.T.; Carton, J.G. Recent challenges and development of technical and technoeconomic aspects for hydrogen storage, insights at different scales; A state of art review. Int. J. Hydrogen Energy 2024, 70, 786–815. [Google Scholar] [CrossRef]
  2. Boddula, R.; Lee, Y.-Y.; Masimukku, S.; Chang-Chien, G.-P.; Pothu, R.; Srivastava, R.K.; Sarangi, P.K.; Selvaraj, M.; Basumatary, S.; Al-Qahtani, N. Sustainable hydrogen production: Solar-powered biomass conversion explored through (Photo)electrochemical advancements. Process Saf. Environ. Prot. 2024, 186, 1149–1168. [Google Scholar] [CrossRef]
  3. Yang, F.; Wang, T.; Deng, X.; Dang, J.; Huang, Z.; Hu, S.; Li, Y.; Ouyang, M. Review on hydrogen safety issues: Incident statistics, hydrogen diffusion, and detonation process. Int. J. Hydrogen Energy 2021, 46, 31467–31488. [Google Scholar] [CrossRef]
  4. Delichatsios, M.A. Transition from momentum to buoyancy-controlled turbulent jet diffusion flames and flame height relationships. Combust. Flame 1993, 92, 349–364. [Google Scholar] [CrossRef]
  5. Schefer, R.; Houf, W.; Bourne, B.; Colton, J. Spatial and radiative properties of an open-flame hydrogen plume. Int. J. Hydrogen Energy 2006, 31, 1332–1340. [Google Scholar] [CrossRef]
  6. Schefer, R.W.; Houf, W.G.; Williams, T.C.; Bourne, B.; Colton, J. Characterization of high-pressure, underexpanded hydrogen-jet flames. Int. J. Hydrogen Energy 2007, 32, 2081–2093. [Google Scholar] [CrossRef]
  7. Mogi, T.; Horiguchi, S. Experimental study on the hazards of high-pressure hydrogen jet diffusion flames. J. Loss Prev. Process Ind. 2009, 22, 45–51. [Google Scholar] [CrossRef]
  8. Imamura, T.; Hamada, S.; Mogi, T.; Wada, Y.; Horiguchi, S.; Miyake, A.; Ogawa, T. Experimental investigation on the thermal properties of hydrogen jet flame and hot currents in the downstream region. Int. J. Hydrogen Energy 2008, 33, 3426–3435. [Google Scholar] [CrossRef]
  9. Fan, R.; Pan, Y.; Xiao, Y.; Wang, Z. Investigation on flame propagation characteristics and critical ignition criteria of hydrogen jet. Int. J. Hydrogen Energy 2024, 57, 1437–1445. [Google Scholar] [CrossRef]
  10. Zhang, A.; Zou, X.; Shen, J.; Li, Y.; Gao, W. Experimental investigation on hydrogen jet flame behavior and temperature distribution with different shapes of outlet. Int. J. Hydrogen Energy 2024, 63, 844–856. [Google Scholar] [CrossRef]
  11. Brennan, S.L.; Makarov, D.V.; Molkov, V. LES of high pressure hydrogen jet fire. J. Loss Prev. Process Ind. 2009, 22, 353–359. [Google Scholar] [CrossRef]
  12. Cirrone, D.M.C.; Makarov, D.; Molkov, V. Simulation of thermal hazards from hydrogen under-expanded jet fire. Int. J. Hydrogen Energy 2019, 44, 8886–8892. [Google Scholar] [CrossRef]
  13. Ba, Q.X.; Zhao, M.B.; Zhao, Z.Y.; Huang, T.; Wang, J.Q.; Li, X.F.; Xiao, G.P. Modeling of high pressure hydrogen jet fires. J. Tsinghua Univ. (Sci. Technol.) 2022, 62, 303–311. [Google Scholar]
  14. Tian, Y.; Zhang, X.Y.; Shan, M.M.; Qi, M.; Shu, C.M.; Li, B.; Liu, Y. Methodology for optimally designing firewalls in hydrogen refueling stations. Int. J. Hydrogen Energy 2024, 49, 1196–1209. [Google Scholar] [CrossRef]
  15. Kim, H.; Kang, S. Analysis of Damage Range and Impact of On-Site Hydrogen Fueling Station Using Quantitative Risk Assessment Program (Hy-KoRAM). Trans. Korean Hydrog. New Energy Soc. 2020, 31, 459–466. [Google Scholar] [CrossRef]
  16. Park, B.; Kim, Y.; Paik, S.; Kang, C. Numerical and experimental analysis of jet release and jet flame length for qualitative risk analysis at hydrogen refueling station. Process Saf. Environ. Prot. 2021, 155, 145–154. [Google Scholar] [CrossRef]
  17. Birch, A.D.; Hughes, D.J.; Swaffield, F. Velocity decay of high pressure jets. Combust. Sci. Technol. 1987, 52, 161–171. [Google Scholar] [CrossRef]
  18. Magnussen, B.F.; Hjertager, B.H. On mathematical modeling of turbulent combustion with special emphasis on soot formation and combustion. Symp. Combust. 1977, 16, 719–729. [Google Scholar] [CrossRef]
  19. Ba, Q.; Zhao, Z.; Zhang, Y.; Liu, Y.; Christopher, D.M.; Ge, P.; Li, X. Modeling of cryogenic compressed hydrogen jet flames. Int. J. Hydrogen Energy 2024, 51, 917–927. [Google Scholar] [CrossRef]
  20. Zheng, J.; Bie, H.; Xu, P.; Liu, P.; Zhao, Y.; Chen, H.; Liu, X.; Zhao, L. Numerical simulation of high-pressure hydrogen jet flames during bonfire test. Int. J. Hydrogen Energy 2012, 37, 783–790. [Google Scholar] [CrossRef]
  21. Makarov, D.; Molfeou, V. Plane hydrogen jets. Int. J. Hydrogen Energy 2013, 37, 18563–18574. [Google Scholar] [CrossRef]
  22. GB/T 37243-2019; Determination Method of External Safety Distance for Hazardous Chemicals Production Units and Storage Installations. Ministry of Emergency Management of the People’s Republic of China: Beijing, China, 2019; p. 52.
  23. Tsao, C.K.; Perry, W.W. Modifications to the Vulnerability Model: A Simulation System for Assessing Damage Resulting from Marine Spills; Final Report; Defense Technical Information Center: Fort Belvoir, VA, USA, 1979.
  24. GB 50183-2004; Code for Fire Protection Design of Petroleum and Natural Gas Engineering. Ministry of Housing and Urban-Rural Development of the People’s Republic of China: Beijing, China, 2004; p. 63.
Figure 1. Birch87 virtual nozzle model.
Fire 07 00210 g001
Figure 2. Overall schematic diagram of the integrated hydrogen production and refueling station.
Fire 07 00210 g002
Figure 3. Three-dimensional simplified geometric model for numerical simulation.
Fire 07 00210 g003
Figure 4. Comparison of flame simulation results with experimental results [7]. (a) Comparison of flame shapes. (b) Comparison of flame lengths.
Fire 07 00210 g004
Figure 5. Model meshing and grid independence validation. (a) Model meshing. (b) Grid independence validation.
Fire 07 00210 g005
Figure 6. Flame shape and temperature distribution for different leakage directions. (a) Flame shape for different leakage directions. (b) Flame temperature distribution for different leakage directions.
Fire 07 00210 g006
Figure 7. Jet centerline temperature distribution for leakage in different directions.
Fire 07 00210 g007
Figure 8. Effect of leakage port diameter on flame temperature distribution for left-side and right-side leakage location.
Fire 07 00210 g008
Figure 9. Temperature distribution on the flame trajectory line for different leakage port diameters.
Fire 07 00210 g009
Figure 10. Comparison of flame lengths calculated by numerical simulation and experimental equation for different leakage port diameters.
Fire 07 00210 g010
Figure 11. Schematic diagram of the weighted multipoint source model.
Fire 07 00210 g011
Figure 12. Variation of flame thermal radiation flux with distance in different directions for different leakage port diameters. (a) Diameter = 4 mm. (b) Diameter = 6 mm. (c) Diameter = 8 mm. (d) Diameter = 10 mm.
Fire 07 00210 g012
Figure 13. Variation of thermal radiation flux with distance in the plane of thermal radiation flux maximum.
Fire 07 00210 g013
Figure 14. Range of damage for accidents with different leakage port diameters. (a) Diameter = 4 mm. (b) Diameter = 6 mm. (c) Diameter = 8 mm. (d) Diameter = 10 mm.
Fire 07 00210 g014
Figure 15. Variation of probability of death with distance for different leakage port diameters and different exposure times. (a) Different leakage port diameters. (b) Different exposure times.
Fire 07 00210 g015
Figure 16. Effect of flame thermal radiation on equipment at different leakage port diameters.
Fire 07 00210 g016
Figure 17. Temperature distribution of flame (left) and flame temperature distribution on the protective wall (right) at different protective wall installation distances.
Fire 07 00210 g017
Figure 18. Temperature distribution of flame (left) and flame temperature distribution on the protective wall (right) at different protective wall installation heights.
Fire 07 00210 g018
Figure 19. Temperature distribution on the jet centerline for different protective wall installation distances and heights. (a) Different installation distances. (b) Different installation heights.
Fire 07 00210 g019
Table 1. Airflow state at the location of the leakage port for different diameters (20 MPa, 293 K).
Leakage Port Diameter d1Airflow Status at the Location of the Leakage Port
4 mm u 2 = 2035.4 m/s; d 2 = 34.1 mm
6 mm u 2 = 2035.4 m/s; d 2 = 51.2 mm
8 mm u 2 = 2035.4 m/s; d 2 = 68.2 mm
10 mm u 2 = 2035.4 m/s; d 2 = 85.3 mm
Table 2. Criteria for evaluating damage to the human body from thermal radiation fluxes [22].
Thermal Radiation Fluxes (kW/m2)Damage to the Human Body
≥37.5100% dead
25Major burns, 100% dead (60 s exposure)
6.3Pain in exposed skin
1.58Prolonged exposure without discomfort
Table 3. Protection standards for station building layout [24].
Thermal Radiation Fluxes (kW/m2)Building Layout Standards
≥4.73 kW/m2No office buildings shall be constructed.
≥9 kW/m2Buildings such as centralized control rooms, maintenance workshops, etc., shall not be accommodated.
≥15 kW/m2Pressure vessels and metal-walled storage tanks shall not be located.
≥32 kW/m2Concrete-walled tanks shall not be arranged.
Disclaimer/Publisher’s Note: The statements, opinions and data contained in all publications are solely those of the individual author(s) and contributor(s) and not of MDPI and/or the editor(s). MDPI and/or the editor(s) disclaim responsibility for any injury to people or property resulting from any ideas, methods, instructions or products referred to in the content.

