Abstract
Identifying the relationship between forest roads and wildfires in forest ecosystems is a crucial priority to integrate suppression and prevention within wildfire management. In various investigations, the interaction of these elements has been studied by using road density as one of the anthropogenic dependent variables. This study focused on the use of a broader set of metrics associated with forest road networks, such as road density, the number of links (edges), and access percentage based on two effect zones (road buffers of 75 m and 97 m). These metrics were employed as response variables to assess forest road network suitability in relation to wildfires, specifically the number and size of fires (2000–2021), using the Apulia region (Italy) as a case study. In addition, to enhance the comprehensive understanding of road networks in forest ecosystems in relation to wildfires, this study considered various affecting factors, including land-cover data (forest, maquis, natural grassland), geomorphology (slope, aspect), vegetation (Normalized Difference Vegetation Index (NDVI)), and morphometric indexes (Topographic Position Index (TPI), Terrain Ruggedness Index (TRI), Topographic Wetness Index (TWI)). We used geographically weighted regression (GWR) and ordinary least squares (OLS) to analyze the interaction between forest road metrics and dependent variables. Results showed that the GWR models outperformed the OLS models in term of statistical results such as R2 and the Akaike Information Criterion (AICc). We found that among road metrics, road density and number of links do not effectively demonstrate the correlation between roads and wildfires as a singular criterion. However, they prove to be a beneficial supplementary variable when considered alongside access percentage, particularly within the 75-m buffer zone. Our findings are used to discuss implications for forest road network planning in a broader wildfire management analysis. Our findings demonstrate that forest roads are not one-dimensional and static infrastructure; rather, they are a multi-dimensional and dynamic structure. Hence, they need to be analyzed from various perspectives, including accessibility and ecological approaches, in order to obtain an integrated understating of their interaction with wildfire.
1. Introduction
Wildfire is a widespread and significant environmental issue that affects natural and seminatural ecosystems [1,2]. Among factors affecting the occurrence, severity, and extent of wildfires, roads have been recognized as the most important ones, especially in Mediterranean forest ecosystems [3,4,5].
Roads can affect fires in several ways: as ignition sources, by influencing access and fire spread, as firebreaks and control lines, and, finally, by performing a crucial function as evacuation routes [6,7,8]. In heterogenous and complex landscapes such as Mediterranean forest ecosystems, the development of a well-designed road network is crucial to optimize fire management objectives [9,10,11].
Generally speaking, there are many different methods in planning forest road and public road networks. Public roads are typically designed using a point-to-point approach, which is focused on connecting origin to destination points. In contrast, for a forest road network, it is more valuable to provide accessibility to the surrounding area, in contrast to the point approach [12,13]. For this reason, forest road planning must consider topographical and geomorphological features that could hinder accessibility, as well as the many aspects related to economic (e.g., forest logging, road building and maintenance costs), environmental (e.g., landscape beauty, biodiversity conservation, water resources protection) and social points of view (connection between residential areas, access to tourist spots, employment of local settlements) [14,15]. In addition, planners must take into account all the potential natural risks associated with forest roads such as wildfire, which is considered one of the most important ecological pressures on forest ecosystems.
Many studies, including those by Elia et al. [4], Mostafa et al. [16] Hong et al. [17], Bergonse et al. [18], Sinha et al. [19], and Zhang et al. [20], have used road density and distance in wildfire mapping and modeling as independent variables. For example, Hong et al. [17] found that the spatial distribution of wildfire susceptibility is correlated to landscape attributes that have been shaped by residential areas and road networks in Huichang County, China. Bergonse et al. [18] showed that the enhancement of road density contributed to improved evacuation during wildfire disasters in Portugal. Sinha et al. [19] found that the forest road network, as one of the anthropogenic indicators, is a contributing factor to more than 60% of wildfire occurrence in the Western Ghats and the Kedarnath Wildlife Sanctuary in the Himalayas. These studies showcased road density as a metric that considers the spatial features of a transport network in terms of territorial occupation [21] as well as representing the quality of a road network in explaining wildfire occurrence.
However, road density and distance cannot be considered valuable indicators of forest accessibility across extensive regions at both regional and national scales, as they only provide a limited understanding of forest road planning. There are other metrics that can be used for evaluating accessibility in the context of a broad wildfire management analysis. Roads are not merely a one-dimensional infrastructure but should be considered multi-dimensional features that can be analyzed based on the road effect zone concept. For example, Backmund [22] estimate the access percentage by employing a “buffer strip”, i.e., an area of access around roads. The access percentage is a metric of forest road network performance and can be used to assess the effectiveness of a transportation network [23,24]. Accessibility, in this context, refers to the proportion of the forest that can be accessed from the forest road within a certain distance [25]. This metric is important for firefighting efforts because it determines how easily firefighters can reach different parts of the forest to combat wildfires, as well as helping prevent wildfires from spreading further into the forest by creating a cleared or managed area (e.g., fuel treatments) [26]. Moreover, the buffer strips can serve as anchor points for establishing fire lines or conducting controlled burns to contain the wildfire within manageable boundaries.
In addition, another important metric to assess the suitability of the road network is the interconnection of nodes and links, where the nodes signify junctions while links represent the pathways connecting them. However, it is noteworthy that in the evaluation process of road networks, links are often applied more than nodes [21,27]. By establishing a new link or branch, two nodes are connected, facilitating access to a new area adjacent to the road and bringing about an overlaying effect. This means that one point can be affected by the two edges of roads simultaneously [21,28]. Hence, as the number of these links’ increases, the likelihood of accessing various points also increases. Therefore, in a specific area, the quantity of these links effectively serves as the foundation of the road network; in addition, an increasing number of links leads to a rise in road density. Thus, link analysis can be considered an effective method for evaluating the transportation network and its side effects, based on a network topology approach [29].
Despite the widespread importance of the effects that forest roads have on wildfire, to our knowledge, there is a lack of studies focusing on the use of a more complete set of forest road metrics. Our main objective is to assess forest road network suitability in relation to the spatial occurrence of wildfires by screening a set of appropriate forest road metrics such as road density, the number of links (edges), and access percentage. To accomplish this, we employed geographically weighted regression (GWR) and ordinary least squares (OLS) to analyze the relation between forest road metrics and independent variables related to wildfire occurrence and various affecting factors such as land-cover data, geomorphological features, vegetation (Normalized Difference Vegetation Index (NDVI), and morphometric indexes, (Topographic Position Index (TPI), Terrain Ruggedness Index (TRI), and Topographic Wetness Index (TWI).
We expect that the findings of this study will offer valuable insights into selecting appropriate road metrics, thereby assisting managers in planning or ameliorating the existing forest road networks in the context of a broader wildfire risk management strategy.
2. Materials and Methods
2.1. Study Area
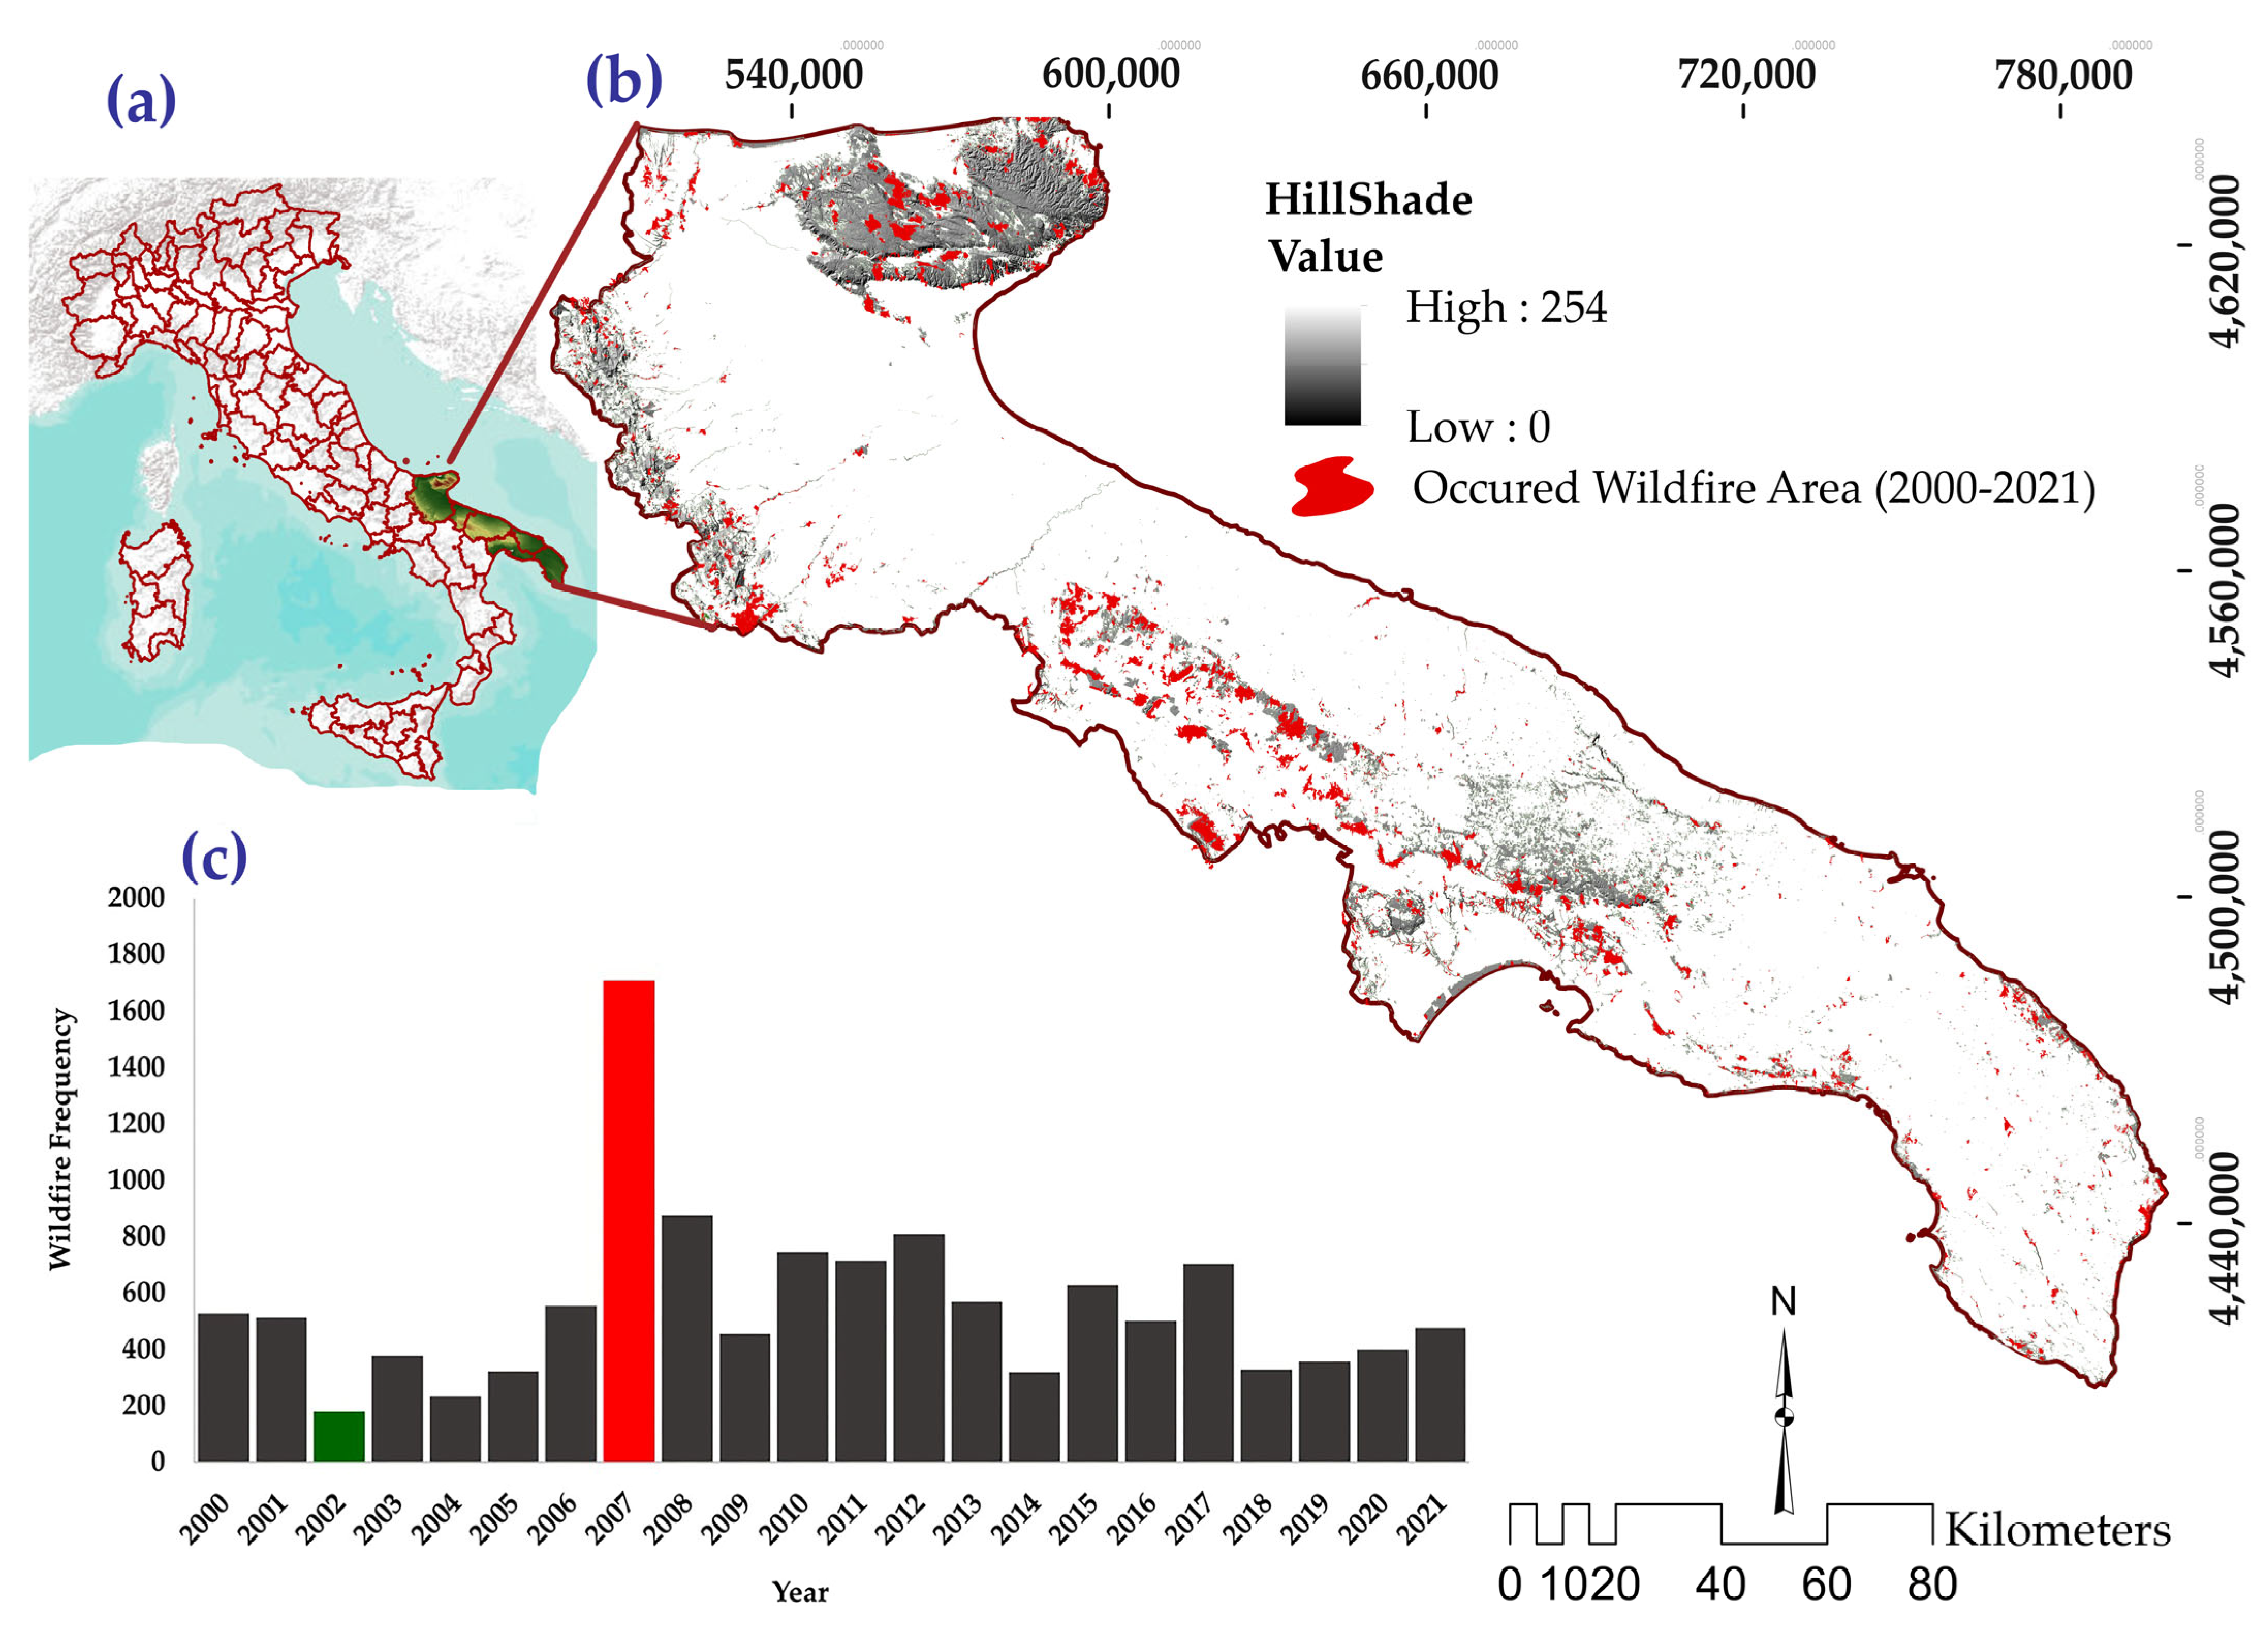
The Apulia region is situated in southern Italy, with coordinates ranging from 39°50′ to 41°50′ N and 15°50′ to 18°50′ E (Figure 1a,b). We studied this region because Apulia is affected by wildfires. The area of the region is 1,953,215 hectares, with an average elevation of 565 m above sea level (a.s.l) (range: 0 m–1150 m a.s.l). The surface roughness is high in the north and low in the rest of the region. The annual precipitation ranges from 450 to 650 mm, with a significant portion occurring as rain in the autumn and winter seasons. The mean annual temperature ranges from 12.0 °C to 19.0 °C [30].
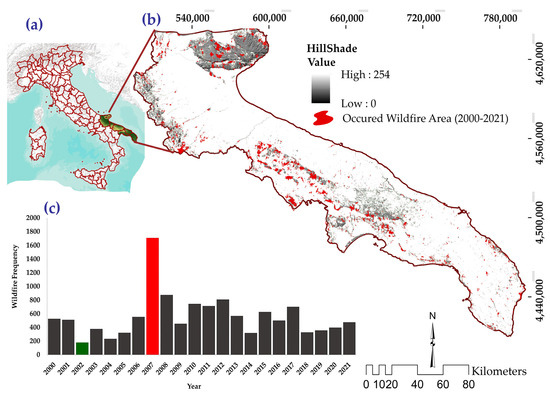
Figure 1.
Locations of the study areas in Italy (a). Forest area and wildfire distribution in the Apulia region (b). Histogram showing the occurrence of wildfire events for each year (c).
The climate exhibits mild, rainy winters and hot, dry summers, resulting in a water shortage from June to September.
Overall, 14% of this region is covered by forest areas and woodlands, including different forest categories. The total forest road network length is 12,735 km, and the road density is 51.52 mha−1 [31].
2.2. Datasets
In ArcGIS Pro 3.3.2 software, a 1000 m2 grid was produced to extract values for each single variable (Figure 2a).
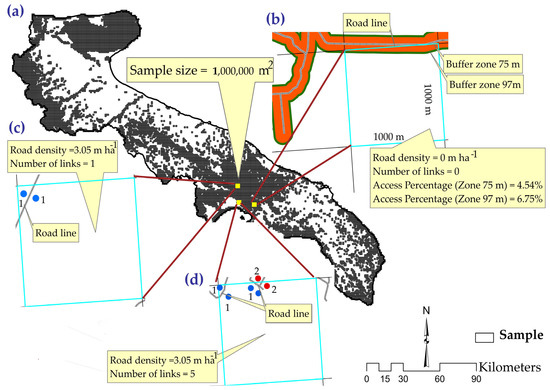
Figure 2.
(a) Samples (1 km2 grid). (b) Applied forest road buffer zones. (c,d) Difference in effect between number of links and road density.
2.2.1. Response Variables
In Figure 2b–d, we detail our response variables, i.e., road density; the number of links (edges); and access percentage based on two affecting road buffer zones, namely, 75 m, because more than 50% of previous fires occurred 0–75 m from roads, and 97 m, calculated using the Backmund method [22] (Equation (1)):
where Ap is access percentage, while Aa and At are access and total area in hectares, respectively [14,31].
Road density measures the territorial ratio between the length L of the road segment and the unit area [13,16] (Equation (2)):
where Rd is road density (m/ha−1), L represents the length of roads in meters, and Au is unit area (ha).
Number of links represents the count of edges, where edge (i, j) originates from initial point i and terminates at point j. In graph theory, graph G consists of a set of vertices (nodes) connected by edges (links). A link is a fundamental component of the road network infrastructure that facilitates flow between nodes [21,32] (Equation (3)).
where G is a collection of vertices (nodes) v that are connected by edges (links) e.
G = (v, e)
Access percentage indicates the percentage share of the open area relative to the total area of the analyzed area accessed by the road network.
2.2.2. Explanatory Factors
We considered various factors that are important in determining the relationship between forest roads and wildfires, in addition to being meaningful in forest road planning.
- Historical wildfires
The historical wildfire datasets from the Civil Protection Department (a public body responsible for forecasting and monitoring risks, developing emergency procedures, and promoting prevention) of the Apulia region were used in this study. The datasets cover the period from 2000 to 2021. These data represent the most similar and harmonized datasets on fire occurrence in the region within the considered period of study. The occur ence and wildfire size (i.e., number of ignitions per cell) were extracted with a1-km2.
- Land cover
We categorized forest and woodland land cover based on forest typology in the classes of forest, maquis and natural grassland. The forest typology includes beech forests; chestnut forests; coniferous plantations; hornbeam and European hornbeam forests, hop oak forests; hygrophilous woods; Mediterranean pine forests; other coniferous forests (pure or mixed); oak (Quercus petraea (Matt.) Liebl.), downy oak and oak (Quercus pubescens Willd.) forests; other deciduous woods; other evergreen broad-leaved forests; plantations of other broad-leaved trees; turkey oak, Farnetto (Quercus frainetto Ten.), Fragno oak (Quercus trojana Webb.), and Vallonea oak (Quercus macrolepis (Kotschy)) forests; Black (Austrian) pine, Laricio (Corsican) pine, and Loricato (Bosnian) pine forests; maquis, encompassing Mediterranean shrublands and temperate-climate shrublands; and, finally, natural grassland, including wooded pasture.
- Geomorphological data
Slope and aspect layers were used in this research as part of the geomorphological analysis. Slope is a critical geomorphological factor essential for efficient terrain analysis and description. In the context of forest road planning, slope and aspect are considered limiting parameters due to their significant influence on construction and accessibility of a road network. These factors identify potential hazards, optimize road alignments, and mitigate the environmental effects associated with linear infrastructure [33,34,35].
- Normalized Difference Vegetation Index (NDVI)
In this research, the NDVI during the fire season (June to September) for each year was extracted from Landsat 8 and Landsat 5 satellite imagery [5,36] (Equation (4)).
where NIR represents near-infrared band reflectance and Red represents red band reflectance.
- Topographic Position Index (TPI)
The TPI is a terrain classification algorithm, derived from Digital Elevation Models (DEMs). This index indicates the difference between the altitude (elevation) of a cell (pixel) and the average altitude of the cells in the neighborhood [37,38] (Equations (5) and (6)).
where z0 is the elevation value of the cell before analysis, is the sum of elevation values within a circular neighborhood of a predetermined radius (R) around the cell, and n is the number of neighboring cells considered within the predetermined radius.
- Topographic Roughness Index (TRI)
The TRI quantifies the deviation of direction from the ideal or planned form of a normal vector of a defined surface. Therefore, the roughness of terrain indicates the unevenness of elevation of the center cell from its neighboring cell [34,38] (Equation (7)).
where n is the number of neighboring cells used in the analysis; Δzi is the absolute difference in elevation between the central cell and its ith neighboring cell; and Δxi and Δyi are the horizontal and vertical distances between the central cell and its ith neighboring cell, respectively.
- Topographic Wetness Index (TWI)
The TWI is a terrain attribute obtained from DEMs, indicating the relative wetness or moisture content of the landscape [39,40] (Equation (8)).
where α represents the upslope contributing area per unit contour length; β represents the slope angle/gradient; and, combined with tan(β), it represents the frequency distributions of the slope/steepest downslope direction.
2.3. Data Processing
We applied Pearson correlation coefficients to evaluate the correlation between variables to identify variables with autocorrelation and subsequently select the suitable variables [29,41].
Ordinary least squares (OLS) and geographically weighted regression (GWR) models were employed to analyze each response variable’s association with explanatory variables. For each forest road metric during the research frame time, we input data for each cell and performed the OLS and GWR models. Various indicators, such as the Akaike Information Criterion (AICc), adjusted R-squared, R2, and Moran’s I, were used to assess the efficiency of the models [42,43,44].
- Ordinary least squares
OLS is a traditional regression method that measures a global regression coefficient. This method estimates the coefficients of the independent variables, including the intercept, which collectively define the linear relationship between the response and explanatory variables [45] (Equation (9)).
where y is the response variable, is the intercept, is the ith explanatory variable, is is the ith regression coefficient, ε is the error term, and p is the number of explanatory variables.
- Geographically weighted regression
GWR develops OLS regression using locally varying parameters, thus considering the nonstationary spatial relations of samples. In GWR, the location of the sample () is added to the regression equation to measure the local parameters [44,46] (Equation (10)).
where is the response variable for location i, ui and vi are the coordinates of location i, (ui, vi) is the intercept at location i, is the local parameter measure for the explanatory variable xik at location i, and εi is the error term.
3. Results
3.1. Variables in Detail
A total of 8973 cells (1 km2) in the grid for the study area was calculated (Figure 2a). Table 1 shows the number and percentage of grid cells with data available for wildfire numbers, road networks, and land cover variables. The map of supplementary variables is shown in Figure S1.

Table 1.
Number and percentage of cells where variables were calculated.
During time study, a total of 9764 wildfire events occurred in the Apulia region, which burned 97,664.4 hectares of forest and woodland ecosystems (Table 2). The highest and lowest values of both wildfire number and wildfire size occurred in 2007 and 2018, respectively (Figure 1c).
Table 2.
Details of wildfires that occurred from 2000 to 2021.
3.2. Correlation Assessment
The results of the Pearson correlation matrix revealed a moderate positive correlation between road metrics and independent variables (Figure S2). However, for each metric, the independent variables had different coefficients and correlation importance. For instance, for forest cover, maquis and wildfire numbers were more correlated with road density, respectively. However, the results for the number of links are different. We found weak positive correlations between the number of links and forest cover wildfire.
Regarding the 75 m buffer zone, our findings indicated a moderate positive correlation with forest cover, followed by maquis and natural grassland, respectively.
3.3. GWR and OLS Results of Road Density
The results from the OLS and GWR models for analyzing relationships between road density and explanatory variables are presented in Table 3. According to the greater adjusted R2 and lower AICc, it can be concluded that the performance of GWR model is superior to that of the OLS. The outcomes from GWR revealed that the wildfire number had a higher R2 value (0.61) than wildfire size. Among the factors related to land-cover data, the forest category had the maximum R2 and minimum AICc and residual squares. It should be noted that the TPI, as one of the morphometric indexes, had higher results in terms of R2, AICc, and residual squares (Table 3). Additionally, among the independent variables, the largest R2 value and the lowest AICc and residual squares belonged to slope.
Table 3.
OLS and GWR results for road density as response variable.
3.4. Spatial Variations in the Response of the Road Density Metric to Explanatory Variables
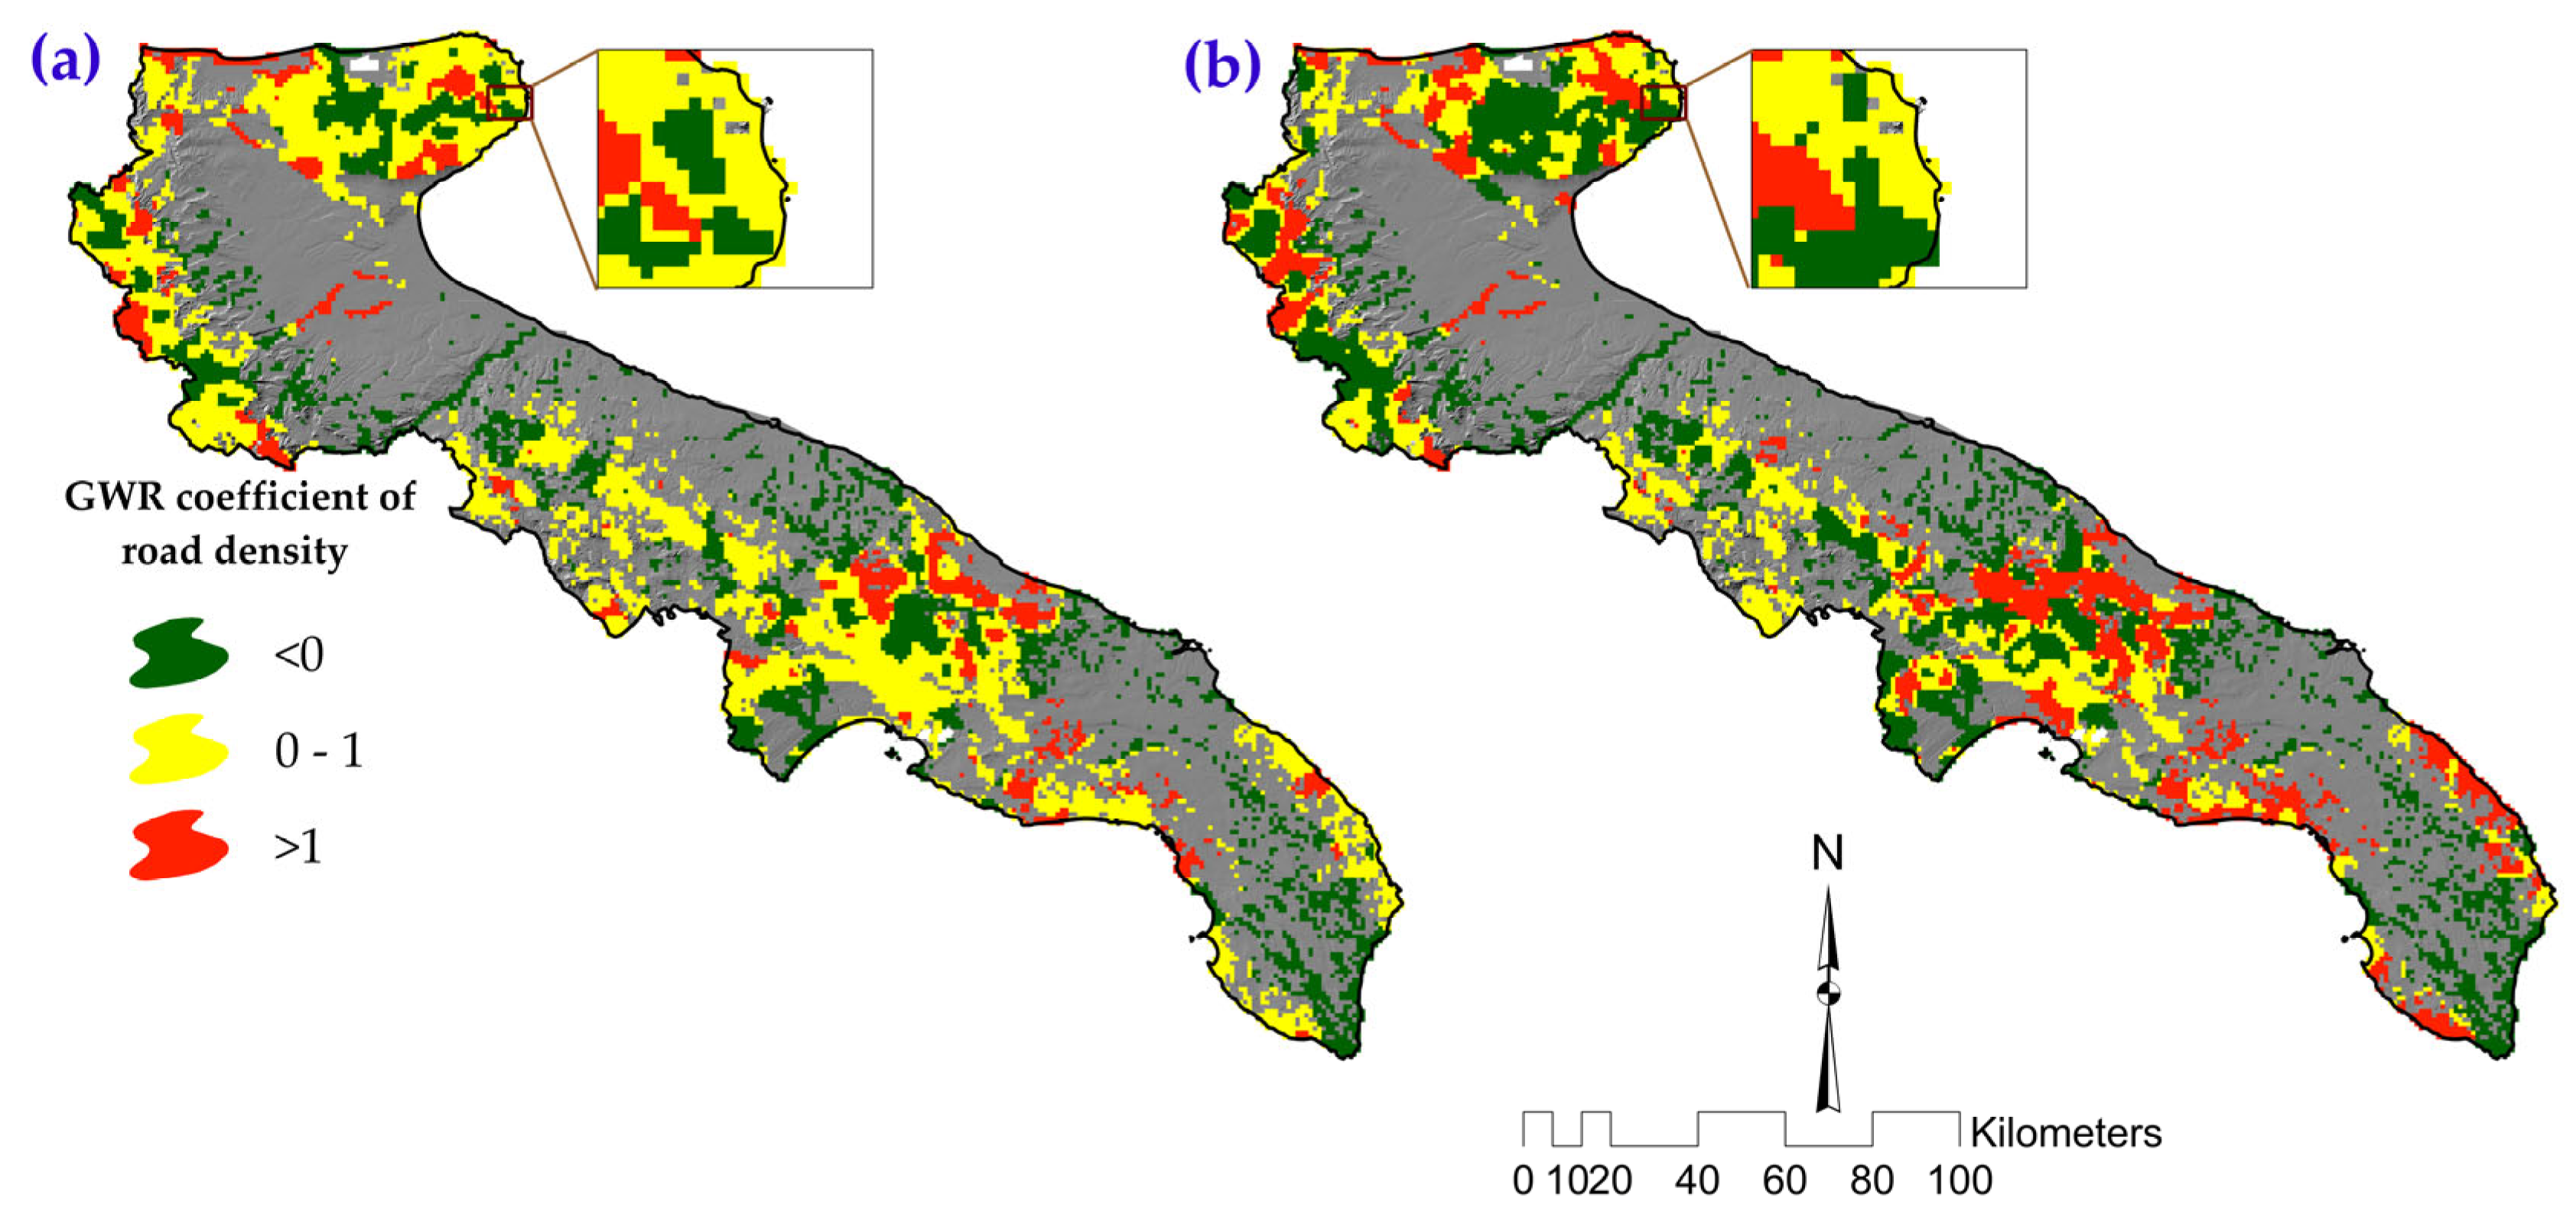
Figure 3 indicates the Spatial Variation GWR coefficients for the road density versus the independent variables. In Figure 3a, the GWR coefficient reflects a positive relationship between road density and wildfire number in most of the study areas. Figure 3b shows the weak positive relationship between road density and wildfire size, even though there appears to be a negative correlation between them in some regions. The GWR coefficients for the supplementary variables are shown in Figure S3.

Figure 3.
Distribution of geographically weighted regression (GWR) coefficients of road density as a response variable in comparison to the respective independent variables: (a) wildfire number and (b) wildfire size.
3.5. GWR and OLS Results for Number of Links
Table 4 illustrates the estimated results of both OLS and GWR models for each independent variable in relation to the number of links as one of the forest road metrics. Similar to road density, assuming a higher value of adjusted R2 and a lower AICc, the GWR model outperformed OLS for the number of links. GWR results indicated that wildfire number was more correlated to the number of links than wildfire size assuming higher R2 and lower AICc values, although there was not a significant difference between the results of these variables (Table 3). Forest category obtained the maximum value of R2 and minimum values of AICc and residual squares among land-cover variables. However, the R2 values for maquis and natural grassland were lower than 0.50 (Table 3). The R2 value for the slope variable was 0.54, accompanied by the lowest values of AICc and residual squares. Notwithstanding, the estimated R2 value for the aspect variable was below 0.50 (Table 3). The obtained R2 values for the number of links in relation to the NDVI, TPI, TRI, and TWI indexes were less than 0.50.
Table 4.
OLS and GWR results for the number of links as a response variable.
3.6. Spatial Variations in the Response of the “Number of Links” Metric to Explanatory Variables
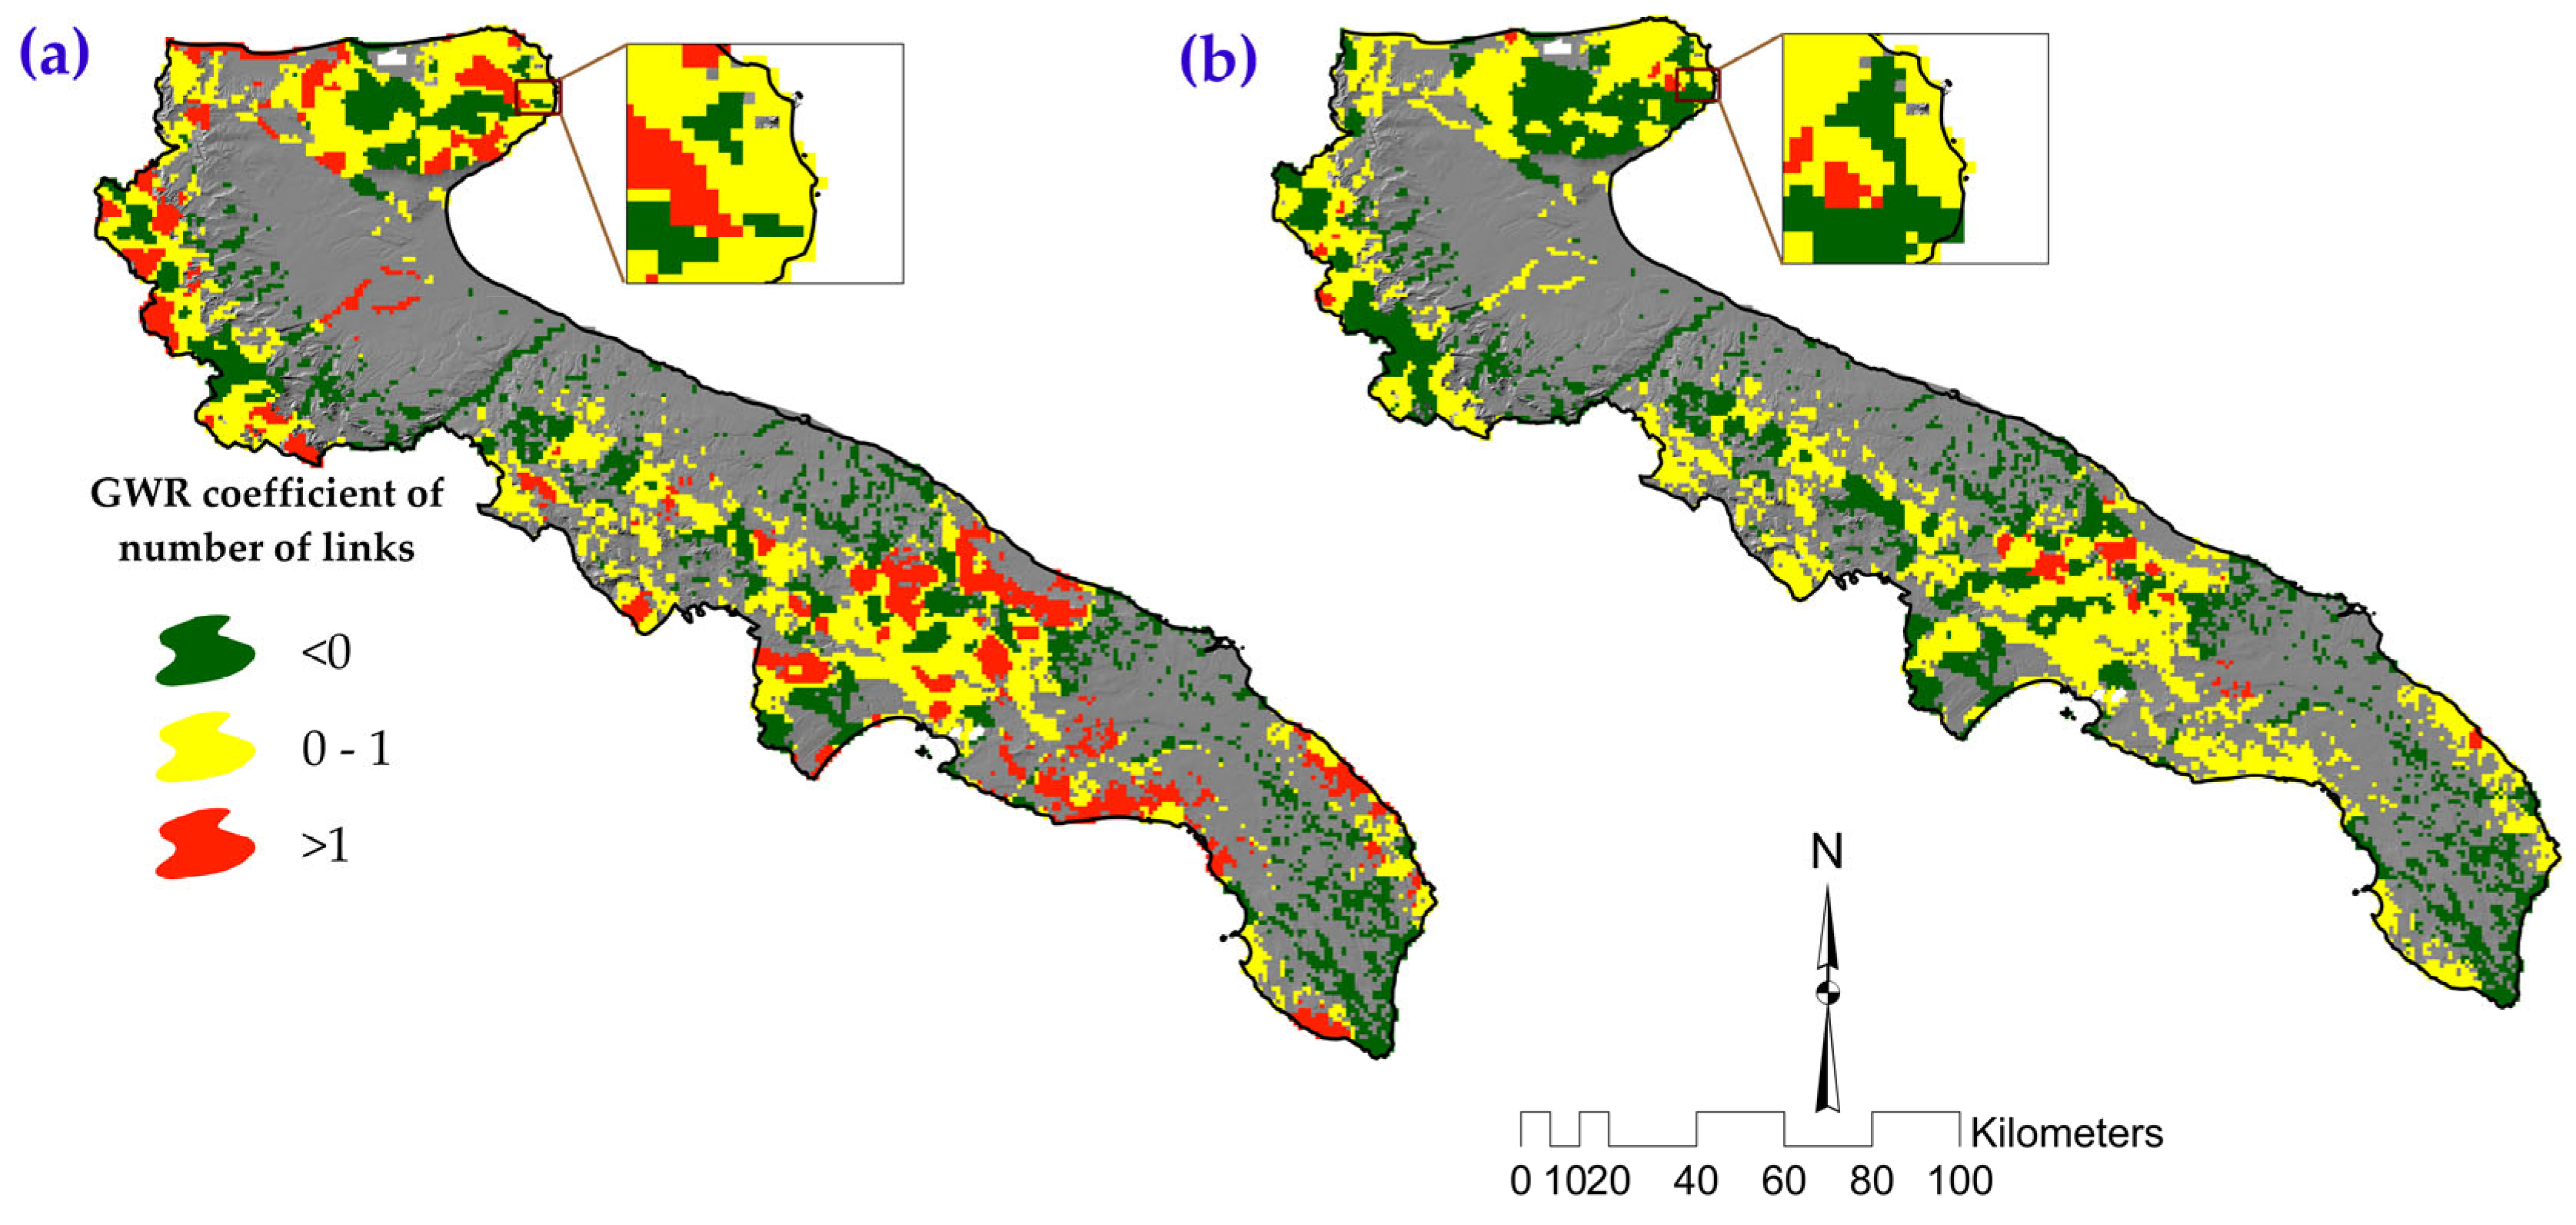
The spatial variation GWR coefficients of number of links in relation to the explanatory variables are shown in Figure 4. There is a positive relationship between the number of links metric and wildfire number in most parts of the study areas, but this trend varies, showing a negative relationship in some limited locations, (Figure 4a). Figure 4b shows a negative relationship between number of links and wildfire size, although in some areas, there is a positive correlation between these variables. The distributions of GWR coefficients of number of links as a response variable in comparison to the other variables are displayed in Figure S4.

Figure 4.
Distribution of geographically weighted regression (GWR) coefficients of the number of links as a response variable in comparison to the respective independent variables: (a) wildfire number and (b) wildfire size.
3.7. GWR and OLS Results of Access Percentage
The results of both models, considering the values of R2, adjusted R-squared, and AICc, indicate a higher level of goodness of fit in the GWR model than in the OLS model (Table 4 and Table 5).
Table 5.
GWR results for access percentage as a response variable.
The estimated results of the GWR model for the access percentage variable, calculated as two access percentages based on buffer zones of 75 m and 97 m, in relation to independent variables are indicated in Table 4. The results of the GWR models for the access percentage factor correlated with wildfire number. For wildfire size, the 97 m buffer zone appears to be the better choice, as it has higher R2 and adjusted R-squared values and a smaller AICc value. However, similar to wildfire number, the 75 m buffer zone has lower residual squares. Therefore, considering the minimized prediction errors and lower residual squares, the 75 m buffer zone appears to be the better-fitting model. It is worth noting that the values obtained for the wildfire number variable are higher overall than those for wildfire size (Table 5). Our findings for the buffer zones versus forest land cover illustrated that the 97 m buffer zone obtained higher R2 and adjusted R-squared values, while the 75 m buffer achieved lower values of residual squares and AICc. Therefore, considering this outcome, the 75 m buffer zone seems to be the better-fitting model. The results of the GWR model for the applied buffer zones in correlation to maquis revealed that the 97 m buffer zone achieved the highest R2 and adjusted R-squared values, while the 75 m buffer zone demonstrated lower residual squares. Consequently, according to the minimized prediction errors and lower residual squares, the 75 m buffer can be considered the better-fitting model (Table 5). For natural grassland cover, results show lower adjusted R-squared, AICc and residual squares for the 75 m buffer zone than for the 97 m buffer zone, thus showcasing that the former is the better-fitting model. Overall, these findings reveal that the slope factor has an advantage over aspect; Table 4 shows more details. The GWR model showed that the NDVI variable in the 75 m buffer zone had larger R2 and adjusted R2 values. However, the 75 m buffer zone had a lower AICc value. Therefore, due to a more favorable trade-off between model complexity and goodness of fit, this zone can be considered an appropriate choice (Table 5). We found that the TPI variable achieved a better fit in the 75 m buffer zone than in the 97 m buffer zone. Consequently, due to a better balance between model complexity and goodness of fit compared to the other buffer size, the 75 m buffer zone was selected (Table 5). The results of the TRI assessment showed that the 97 m buffer had higher R2 and adjusted R-squared values. Additionally, all buffer sizes showed relatively low residual squares (Table 5). We found that the TWI variable in both buffer zones had an R2 value lower than 0.50. Although the results of other parameters can be accepted, according to the lower R2, there is not a strong relationship between TWI and the access percentage variable (Table 5).
The results of the OLS model with Moran’s I values range from 0.31 to 0.45 for both buffer zones of access percentage; this finding reveals that all of the variables exhibited positive spatial autocorrelation. Table 6 shows more details of the OLS model.
Table 6.
OLS results for access percentage as a response variable.
3.8. Spatial Variations in the Response of Access Percentage Metric to Explanatory Variables
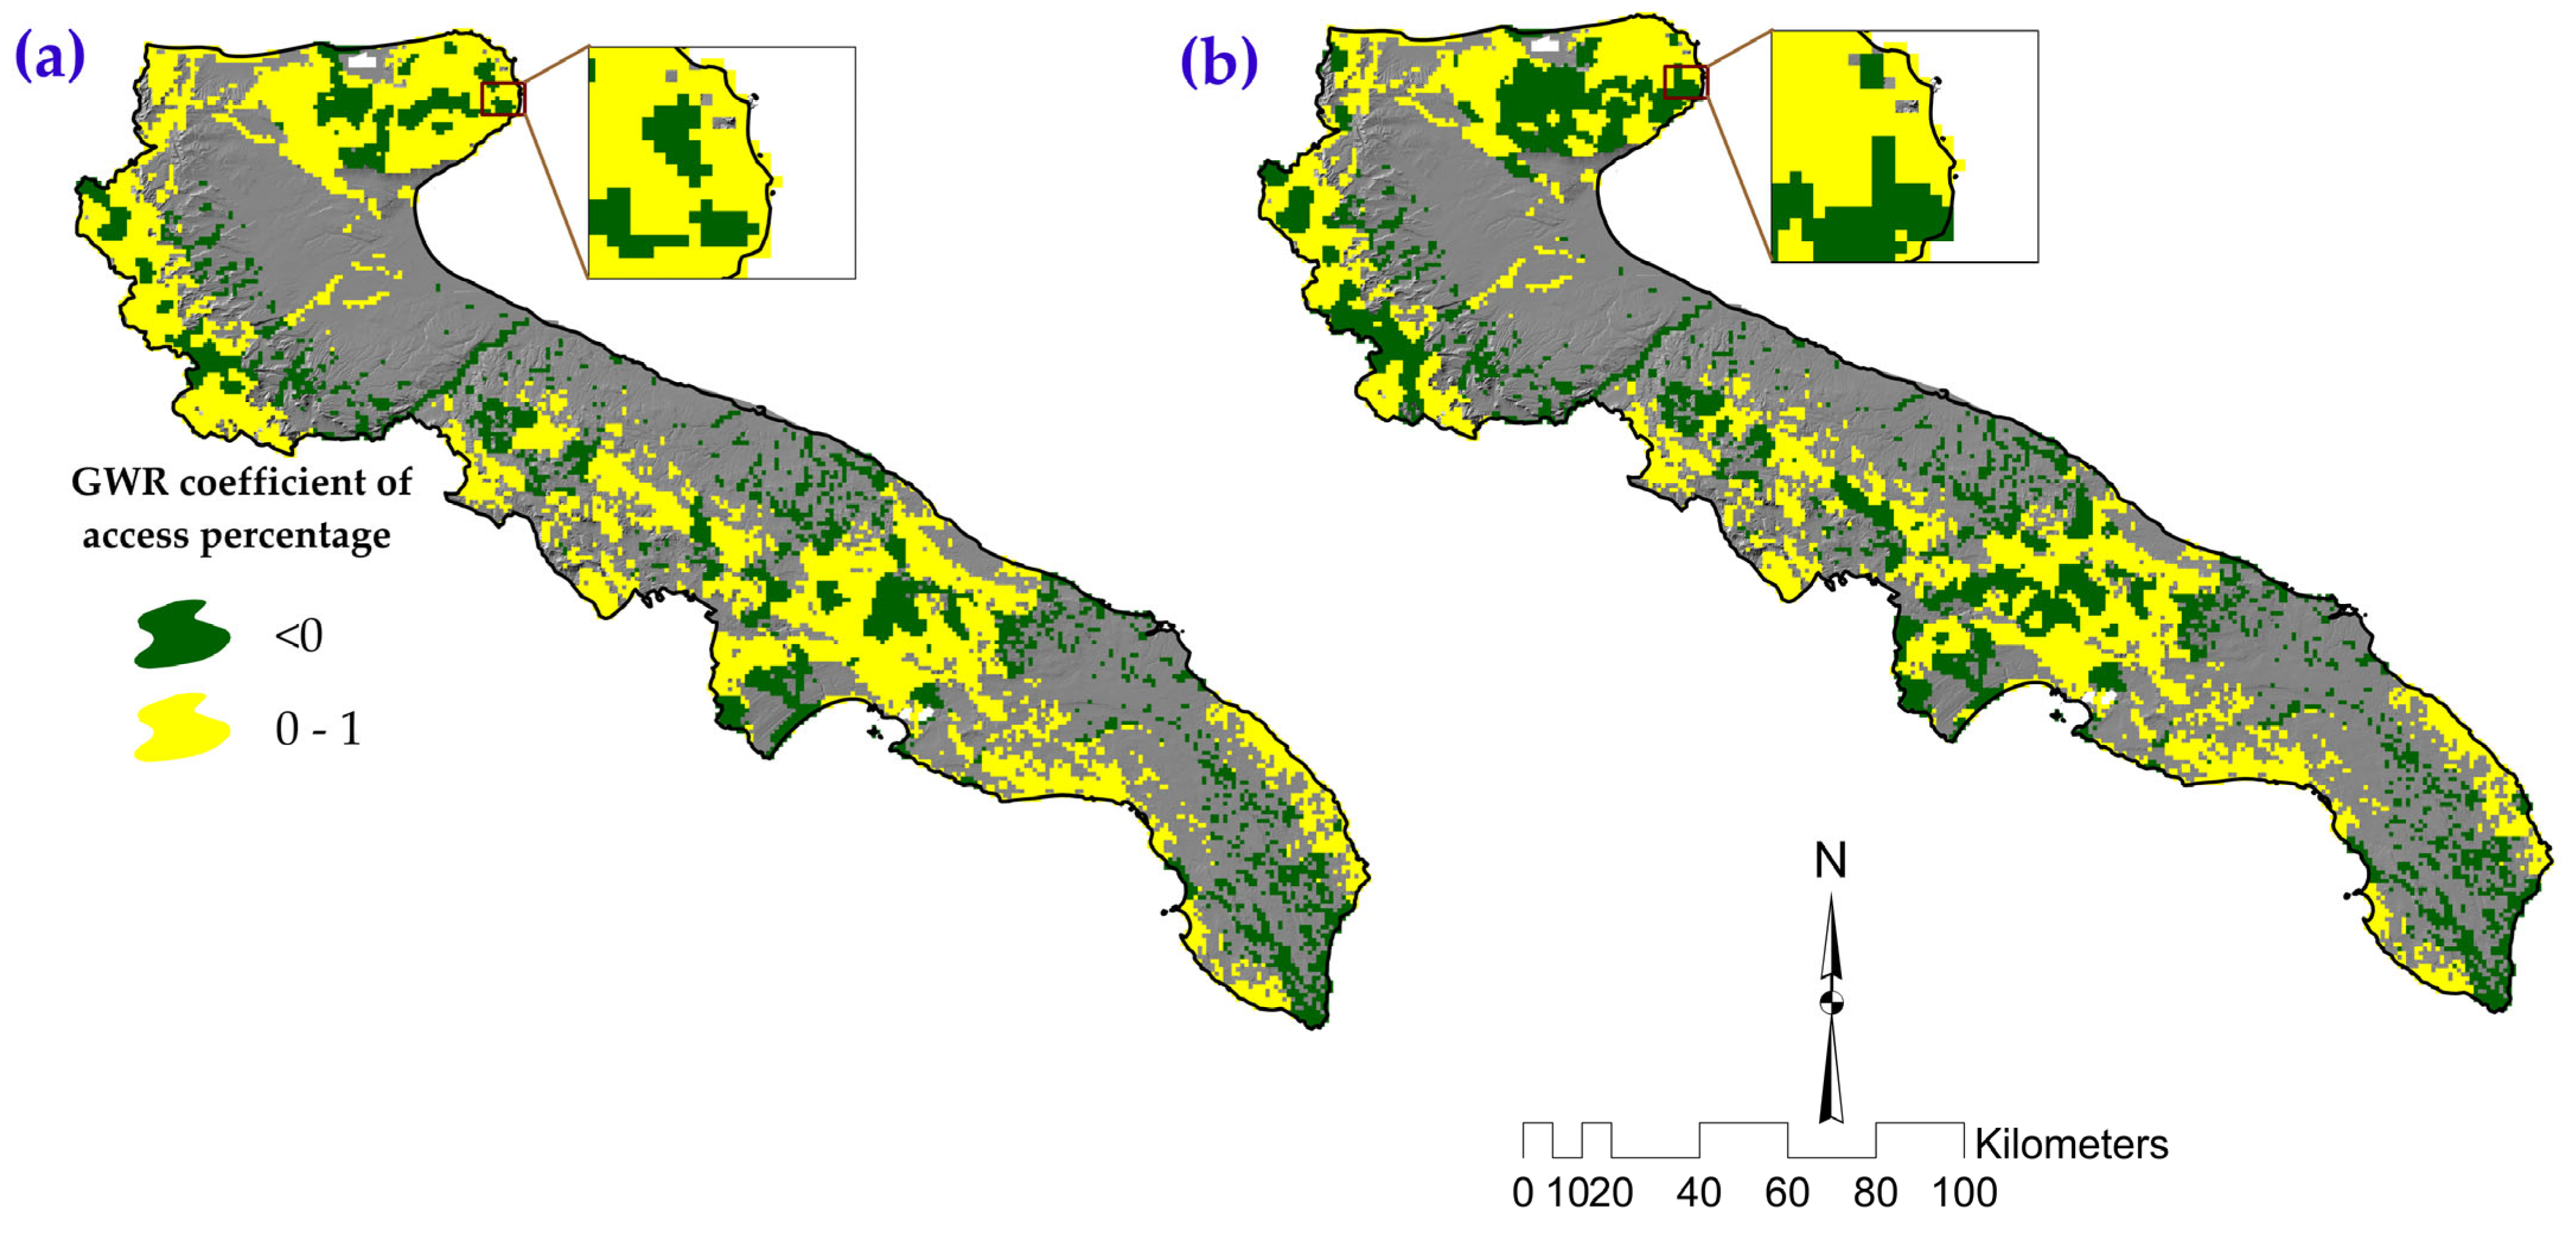
The GWR coefficients of relationship between the 75 m buffer zone and explanatory variables are shown in Figure 5. Figure 5a, shows the positive relationship between the 75 m buffer zone and wildfire number. Nevertheless, it is crucial to note that this trend is not consistent across the entire study area. In certain regions, particularly in the northern and central areas, there is a negative correlation between these variables. We observed the positive relationship between the 75 m buffer zone and wildfire size throughout the study area, although in some small areas, there is a negative correlation between these variables (Figure 5b).
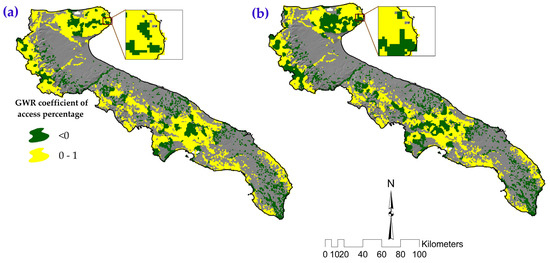
Figure 5.
Distribution of geographically weighted regression (GWR) coefficients of access percentage as a variable in comparison to the respective independent variables: (a) wildfire number and (b) wildfire size.
4. Discussion
This research study introduces innovative metrics for the evaluation of forest roads in relation to wildfire mitigation, along with considering effective variables in forest road planning to enhance wildfire management in Mediterranean ecosystems. These metrics included road density, number of links, and access percentage metrics for two buffer zones: 75 m and 97 m.
The GWR model enables the identification of relationship between variables based on spatial proximity in each location [43]. The GWR coefficients of road density for both wildfire number and size at the local scale indicated that this relationship is mostly positive across the study area, albeit we can observe a negative relationship between them locally. These findings might support the idea that regions with higher road density might face more and wider wildfires [47,48,49]. It is well known that roads are crucial determinants of wildfire occurrence as well as fundamental infrastructures connecting anthropogenic activities, including agriculture and forest logging [50,51,52]. This perspective cannot be definitively confirmed, as road density affects wildfire occurrence in multiple and inverse ways. Firstly, as the density of roads increases, so does the number of fire ignitions. However, road density can also decrease the number and size of fires, since high density means less potential fuel to ignite and spread [53]. The density of the road network also influences the timeframe between fire occurrence and detection. For example, if fire ignitions occur close to man-made developed areas (e.g., road systems), they may be rapidly suppressed, resulting in smaller and more circumscribed fires [47,50]. Nevertheless, land-cover, geomorphological, vegetational, and morphometric indexes are complementary and important when considered in relation to road density. This is because the planning, designing, construction, and maintenance of forest roads are directly and indirectly influenced by these variables [3,54]. As found in other studies, GWR indicated that road density is strongly related to slope and TPI, which are factors associated with the structure and shape of landscapes [55]. Since our study focused on forest roads, it is unsurprising that forest land cover showed the highest correlation with road density among land cover variables. This finding aligns with our research priority, as forest areas commonly need more accessibility for forest management operations [14].
As for road density, the GWR coefficient exhibited an inverse relationship between number of links and wildfire number and size in certain areas. In areas with a higher number of links, there may be a reduction in both the frequency and the spread of wildfires. Although the relationship was not very strong between the explanatory variables, this metric is helpful for understanding the structure and function of a forest road network for many purposes. It enhances the density of connections within road networks and connectivity to different areas [21,56]. In addition, the portion of the road network covered by wildfires varies greatly [7,57]; therefore, the number of links as a topological metric has the capacity to show the diverse characteristics of the road networks at multiple scales [57,58]. Understanding the correct number of links in relationship to wildfire occurrence can lead to the optimization of forest road management and wildfire mitigation in valuable forest ecosystems. This involves finding a suitable balance in the number and layout of forest roads to minimize the risk of wildfires while still meeting the needs of various stakeholders, such as loggers, firefighters, and recreational users.
As previously mentioned in this study, we did not limit the analysis of road metrics to road density and number of links. Specifically, we incorporated the metric of access percentage for two buffer zones: 75 m and 97 m. Our overall model showed that the access percentages of the two buffer zones had a positive relationship with both wildfire number and size. However, similar to previous metrics, the GWR coefficient exhibited a negative relationship between these metrics and wildfire variables locally.
These results are in line with many studies, such as Kuklina et al. [53] and Zambon et al. [50], which considered the capacity of forest roads to provide accessibility within the forest in a dual way: both as an ignition source (e.g., arson) and as an essential support for fire suppression (e.g., delineation of potential firefighting operations).
Based on the details of each buffer’s results, we found that the GWR model for the access percentage based on a 75 m buffer zone, as suggested by the values of R2, adjusted R-squared, and the AICc parameter, is the best-fitting model. Furthermore, the 75 m buffer zone showed the lowest residual squares, indicating superior model accuracy due to the minimized sum of squared and predicted values. This finding contrasts with the results of Narayanaraj and Wimberly [59], who found that high burn severity is less likely to occur in the 97 m buffer zone around forest roads.
Nonetheless, all explanatory factors were suggested to have some correlation with the response variables, showing their effective role in planning forest road infrastructure at the local scale. These findings align with the findings of other authors [55,60,61]. For example, Danilović et al. [53] found that morphometric factors had an important role in forest road planning. However, the authors of the referenced study primarily focused their attention on analyzing the effects of slope and exposure of the terrain. In contrast, our research employs a distinct set of explanatory factors, leading to different findings such as including the prioritization of areas for road network planning to enhance wildfire management, focusing on vegetation types, land cover, and morphometric characteristics. This approach is further supported by the findings of Demir [60], which align with our emphasis on a comprehensive and contemporary understanding of wildfire risk and landscape management. As stated, forest stand management is a primary reason for forest road planning and construction, which also includes constant and preventive fuel management within forested areas. Therefore, the efficient design and construction of these forest roads allows greater accessibility, aiding the implementation of preventive silvicultural operations and serving the same function as natural firebreaks within forest ecosystems. By incorporating considerations for fire risk reduction and accessibility enhancement, forest road networks not only support silvicultural activities but also contribute significantly to ecosystem resilience and wildfire management efforts.
These achievements highlight that forest road planning and wildfire management, in the broader context of forest management, are not solely a top-down, headquarters-driven process. On the contrary, forest road planning and wildfire management must be developed as a local process and bottom-up endeavor [54]. The local approach appeared to be the clear choice based on our results, as topographical, landcover, and vegetation indicators can produce divergent effects in planning effectiveness at the local scale. In research conducted by Van der Ree et al. [37], Sosa-Pérez and MacDonald [62], and Nieszała and Klich [63], the authors emphasized that a road is considered more than simply a line and that it represents a constructed surface within natural ecosystems that can significantly influence the surrounding features based on its attributes. Roads serve as conduits for human activity; facilitate transportation; and, critically, alter ecological dynamics through habitat fragmentation, alteration of hydrological processes, and introduction of invasive species. The intricate interplay between roads and surrounding features underscores the need for a nuanced understanding of their impacts on local landscapes and the necessity of integrating this understanding into planning and management strategies [64,65].
Additionally, forest roads have a vital role in facilitating post-wildfire activities, which are part of the broader wildfire management process. These post-wildfire activities aim to help ecosystem resilience, protect communities and infrastructure, and reduce future wildfire probability [66].
5. Conclusions
The relationship between forest roads and wildfires in forest ecosystems is a controversial issue that has led to the creation of two different schools of thought. These groups are separated based on their perspectives regarding the negative and positive effects that forest roads can have on wildfires, particularly regarding fire ignition and spread.
A multitude of studies on this subject have been conducted by using numerous methods and variables, without providing a unified conclusion on this issue. The lack of studies employing standardized metrics related to forest roads as response variables is a significant gap in the literature, especially for understanding the relationship between forest roads and wildfires. These deficiencies have led to uncertainty among forest road planners in making decisions about the optimal approaches for forest road planning, as well as reliable metrics related to road densities, access percentage, and numbers of links and nodes. This study aims to help in the decision making of forest road planners.
Finally, it is necessary to conduct similar research in other regions across the globe, with particular attention to Mediterranean forest ecosystems. This field of research will grow as new knowledge is obtained, facilitating a deeper understanding of the relationship between forest roads and wildfires across different geographical contexts.
Supplementary Materials
The following supporting information can be downloaded at: https://www.mdpi.com/article/10.3390/fire7060175/s1.
Author Contributions
Conceptualization, M.M. and M.E.; Methodology, M.M. and M.E.; Formal analysis, M.M.; Data curation, M.M. and V.G.; Writing—original draft, M.M. and M.E.; Writing—review & editing, M.E., V.G., R.L. and G.S.; Supervision, M.E. and G.S.; Funding acquisition, M.E. All authors have read and agreed to the published version of the manuscript.
Funding
This research received no external funding.
Institutional Review Board Statement
Not applicable.
Informed Consent Statement
Not applicable.
Data Availability Statement
The raw data supporting the conclusions of this article will be made available by the authors on request.
Acknowledgments
The paper has been carried out under the POC PUGLIA FESRT-FSE 2014/2020. Fondo Sociale Europeo approvato con Decisione C(2015)5854 del 13/08/2015. Riparti (assegni di Ricerca per riPARTire con le imprese), entitled “Applicazione di strategie di gestione dei combustibili forestali per ridurre il rischio di incendi boschivi a livello di paesaggio nelle aree di interfaccia urbano-foresta della regione Puglia”, Codice Pratica: 3301d4fe.
Conflicts of Interest
The authors declare no conflicts of interest.
References
- Parajuli, A.; Gautam, A.P.; Sharma, S.P.; Bhujel, K.B.; Sharma, G.; Thapa, P.B.; Bist, B.S.; Poudel, S. Forest Fire Risk Mapping Using GIS and Remote Sensing in Two Major Landscapes of Nepal. Geomat. Nat. Hazards Risk. 2020, 11, 2569–2586. [Google Scholar] [CrossRef]
- Shmuel, A.; Heifetz, E. A Machine-Learning Approach to Predicting Daily Wildfire Expansion Rate. Fire 2023, 6, 319. [Google Scholar] [CrossRef]
- Thompson, M.P.; Gannon, B.M.; Caggiano, M.D. Forest Roads and Operational Wildfire Response Planning. Forests 2021, 12, 110. [Google Scholar] [CrossRef]
- Elia, M.; Giannico, V.; Lafortezza, R.; Sanesi, G. Modeling Fire Ignition Patterns in Mediterranean Urban Interfaces. Stoch. Environ. Res. Risk Assess. 2019, 33, 169–181. [Google Scholar] [CrossRef]
- D’Este, M.; Ganga, A.; Elia, M.; Lovreglio, R.; Giannico, V.; Spano, G.; Colangelo, G.; Lafortezza, R.; Sanesi, G. Modeling Fire Ignition Probability and Frequency Using Hurdle Models: A Cross-Regional Study in Southern Europe. Ecol. Process. 2020, 9, 54. [Google Scholar] [CrossRef]
- Yang, J.; He, H.S.; Shifley, S.R.; Gustafson, E.J. Spatial Patterns of Modern Period Human-Caused Fire Occurrence in the Missouri Ozark Highlands. For. Sci. 2007, 53, 1–15. [Google Scholar] [CrossRef]
- Niu, C.; Nair, D.J.; Zhang, T.; Dixit, V.; Murray-Tuite, P. Are Wildfire Fatalities Related to Road Network Characteristics? A Preliminary Analysis of Global Wildfire Cases. Int. J. Disaster Risk Reduct. 2022, 80, 103217. [Google Scholar] [CrossRef]
- Dye, A.; Kim, J.; McEvoy, A.; Fang, F.; Riley, K. Evaluating Rural Pacific Northwest Towns for Wildfire Evacuation Vulnerability. Nat. Hazards 2021, 107, 911–935. [Google Scholar] [CrossRef]
- de Araujo, M.P.; Lupa, M.R.; Casper, C.T.; Waters, B. Wildfire Evacuation Scenario in Colorado: Comparison of Adapted Four-Step Metropolitan Planning Organization Modeling Results and Planning Process Findings with Actual Experience. Transp. Res. Rec. 2014, 2430, 133–144. [Google Scholar] [CrossRef]
- Akay, A.E.; Aruga, K.; Bettinger, P.; Sessions, J. Using optimization techniques in designing forest roads and road networks. Bartın Orman. Fakültesi Dergisi 2013, 15, 49–62. [Google Scholar]
- Lafortezza, R.; Sanesi, G.; Chen, J. Large-Scale Effects of Forest Management in Mediterranean Landscapes of Europe. IForest 2013, 6, 342–346. [Google Scholar] [CrossRef]
- Laschi, A.; Neri, F.; Montorselli, N.; Marchi, E. A Methodological Approach Exploiting Modern Techniques for Forest Road Network Planning. Croat. J. For. Eng. 2016, 37, 319–331. [Google Scholar]
- Heinimann, H. Forest Road Network and Transportation Engineering—State and Perspectives. Croat. J. For. Eng. 2017, 38, 155–173. [Google Scholar]
- Akay, A.O.; Akgul, M.; Demir, M.; Acar, H.H. Analysis of Factors Associated with the Amount of Forest Road Reconstruction Activity in Turkey: Autoregressive Distributed Lag Modelling Approach. Ecol. Manag. 2020, 458, 117800. [Google Scholar] [CrossRef]
- Beguš, J.; Pertlik, E. Guide for Planning, Construction and Maintenance of Forest Roads; Food and Agriculture 587 Organization of the United Nations: Rome, Italy, 2017; pp. 304–311. Available online: https://www.fao.org/sustainable-forest-management/toolbox/tools/tool-detail/en/c/1255267/ (accessed on 29 January 2024).
- Mostafa, M.; Shataee, S.; Lotfalian, M.; Sadoddin, A. Watershed Road Network Analysis with an Emphasis on Fire Fighting Management. J. Environ. Eng. Landsc. Manag. 2017, 25, 342–353. [Google Scholar] [CrossRef]
- Hong, H.; Jaafari, A.; Zenner, E.K. Predicting Spatial Patterns of Wildfire Susceptibility in the Huichang County, China: An Integrated Model to Analysis of Landscape Indicators. Ecol. Indic. 2019, 101, 878–891. [Google Scholar] [CrossRef]
- Bergonse, R.; Oliveira, S.; Santos, P.; Zêzere, J. Wildfire Risk Levels at the Local Scale: Assessing the Relative Influence of Hazard, Exposure, and Social Vulnerability. Fire 2022, 5, 166. [Google Scholar] [CrossRef]
- Sinha, A.; Nikhil, S.; Ajin, R.S.; Danumah, J.; Saha, S.; Costache, R.-D.; Ambujendran, R.; Sajinkumar, K.S.; Amrutha, K.; Johny, A.; et al. Wildfire Risk Zone Mapping in Contrasting Climatic Conditions: An Approach Employing AHP and F-AHP Models. Fire 2023, 6, 44. [Google Scholar] [CrossRef]
- Zhang, F.; Bin, Z.; Luo, J.; Liu, H.; Qingchun, D.; Wang, L.; Zuo, Z. Forest Fire Driving Factors and Fire Risk Zoning Based on an Optimal Parameter Logistic Regression Model: A Case Study of the Liangshan Yi Autonomous Prefecture, China. Fire 2023, 6, 336. [Google Scholar] [CrossRef]
- Rodrigue, J.P. The Geography of Transport Systems; Routledg: London, UK, 2020; pp. 320–330. [Google Scholar] [CrossRef]
- Backmund, F. Kennzahlen Für Den Grad Der Erschließung von Forstbetrieben Durch Autofahrbare Wege. Forstwiss. Centralblatt. 1966, 85, 342–354. [Google Scholar] [CrossRef]
- Pentek, T.; Pičman, D.; Potočnik, I.; Dvorščak, P.; Nevečerel, H. Analysis of an Existing Forest Road Network. Croat. J. For. Eng. 2005, 26, 39–50. [Google Scholar]
- Martín, B.; Ortega, E.; Cuevas-Wizner, R.; Ledda, A.; De Montis, A. Assessing Road Network Resilience: An Accessibility Comparative Analysis. Transp. Res. D Transp. Environ. 2021, 95, 102851. [Google Scholar] [CrossRef]
- Travers, E.; Härdtle, W.; Matthies, D. Corridors as a Tool for Linking Habitats—Shortcomings and Perspectives for Plant Conservation. J. Nat. Conserv. 2021, 60, 125974. [Google Scholar] [CrossRef]
- McCoy, K.; Krasko, V.; Santi, P.; Kaffine, D.; Rebennack, S. Minimizing Economic Impacts from Post-Fire Debris Flows in the Western United States. Nat. Hazards 2016, 83, 149–176. [Google Scholar] [CrossRef]
- Ferrari, C.; Santagata, M. Vulnerability and Robustness of Interdependent Transport Networks in North-Western Italy. Eur. Transp. Res. Rev. 2023, 15, 6. [Google Scholar] [CrossRef]
- Freiria, S.; Ribeiro, B.; Tavares, A.O. Understanding Road Network Dynamics: Link-Based Topological Patterns. J. Transp. Geogr. 2015, 46, 55–66. [Google Scholar] [CrossRef]
- Almotahari, A.; Yazici, A. A Computationally Efficient Metric for Identification of Critical Links in Large Transportation Networks. Reliab. Eng. Syst. Saf. 2021, 209, 107458. [Google Scholar] [CrossRef]
- Elia, M.; Lafortezza, R.; Lovreglio, R.; Sanesi, G. Developing Custom Fire Behavior Fuel Models for Mediterranean Wildland–Urban Interfaces in Southern Italy. Environ. Manag. 2015, 56, 754–764. [Google Scholar] [CrossRef] [PubMed]
- Puglia.con. Available online: https://www.sit.puglia.it/ (accessed on 2 February 2024).
- Sugiura, S.; Kurauchi, F. Isolation Vulnerability Analysis in Road Network: Edge Connectivity and Critical Link Sets. Transp. Res. D Transp. Environ. 2023, 119, 103768. [Google Scholar] [CrossRef]
- Hayati, E.; Majnounian, B.; Abdi, E. Qualitative Evaluation and Optimization of Forest Road Network to Minimize Total Costs and Environmental Impacts. IForest 2012, 5, 121–125. [Google Scholar] [CrossRef]
- Różycka, M.; Migoń, P.; Michniewicz, A. Topographic Wetness Index and Terrain Ruggedness Index in Geomorphic Characterisation of Landslide Terrains, on Examples from the Sudetes; SW Poland. 2016. Available online: https://www.schweizerbart.de/papers/zfg_suppl/detail/61/88285/Topographic_Wetness_Index_and_Terrain_Ruggedness_I?af=crossref (accessed on 2 February 2024).
- Fan, B.; Tao, W.; Qin, G.; Hopkins, I.; Zhang, Y.; Wang, Q.; Lin, H.; Guo, L. Soil Micro-Climate Variation in Relation to Slope Aspect, Position, and Curvature in a Forested Catchment. Agric. For. Meteorol. 2020, 290, 107999. [Google Scholar] [CrossRef]
- Pettorelli, N. The Normalized Difference Vegetation Index; Oxford University Press: Oxford, UK, 2013; Volume 194, pp. 11–21. [Google Scholar] [CrossRef]
- De Reu, J.; Bourgeois, J.; Bats, M.; Zwertvaegher, A.; Gelorini, V.; De Smedt, P.; Chu, W.; Antrop, M.; De Maeyer, P.; Finke, P.; et al. Application of the Topographic Position Index to Heterogeneous Landscapes. Geomorphology 2013, 186, 39–49. [Google Scholar] [CrossRef]
- Chowdhury, M.S. Modelling Hydrological Factors from DEM Using GIS. MethodsX 2023, 10, 102062. [Google Scholar] [CrossRef] [PubMed]
- Gorum, T.; Gonencgil, B.; Gokceoglu, C.; Nefeslioglu, H.A. Implementation of Reconstructed Geomorphologic Units in Landslide Susceptibility Mapping: The Melen Gorge (NW Turkey). Nat. Hazards 2008, 46, 323–351. [Google Scholar] [CrossRef]
- Beven, K.J.; Kirkby, M.J. A Physically Based, Variable Contributing Area Model of Basin Hydrology/Un Modèle à Base Physique de Zone d’appel Variable de l’hydrologie Du Bassin Versant. Hydrol. Sci. Bull. 1979, 24, 43–69. [Google Scholar] [CrossRef]
- Jafino, B.A.; Kwakkel, J.; Verbraeck, A. Transport Network Criticality Metrics: A Comparative Analysis and a Guideline for Selection. Transp. Rev. 2020, 40, 241–264. [Google Scholar] [CrossRef]
- Koutsias, N.; Martínez-Fernández, J.; Allgöwer, B. Do Factors Causing Wildfires Vary in Space? Evidence from Geographically Weighted Regression. GIScience Remote Sens. 2010, 47, 221–240. [Google Scholar] [CrossRef]
- Hu, X.; Xu, H. Spatial Variability of Urban Climate in Response to Quantitative Trait of Land Cover Based on GWR Model. Environ. Monit. Assess. 2019, 191, 194. [Google Scholar] [CrossRef] [PubMed]
- Zheng, X.; Zou, Z.; Xu, C.; Lin, S.; Wu, Z.; Qiu, R.; Hu, X.; Li, J. A New Remote Sensing Index for Assessing Spatial Heterogeneity in Urban Ecoenvironmental-Quality-Associated Road Networks. Land 2021, 11, 46. [Google Scholar] [CrossRef]
- Koh, E.H.; Lee, E.; Lee, K.-K. Application of Geographically Weighted Regression Models to Predict Spatial Characteristics of Nitrate Contamination: Implications for an Effective Groundwater Management Strategy. J. Environ. Manag. 2020, 268, 110646. [Google Scholar] [CrossRef] [PubMed]
- Elia, M.; Lafortezza, R.; Cappelluti, O.; Costa-Saura Josè, M.; Bacciu, V.; Giannico, V.; Changliang, S.; Sanesi, G. Coupling Heat Wave and Wildfire Occurrence across Multiple Ecoregions within a Eurasia Longitudinal Gradient. Sci. Total Environ. 2024, 912, 169269. [Google Scholar] [CrossRef] [PubMed]
- Latham, M.; Cumming, S.; Krawchuk, M.; Boutin, S. Road Network Density Correlated with Increased Lightning Fire Incidence in the Canadian Western Boreal Forest. Int. J. Wildland Fire 2009, 18, 970–982. [Google Scholar] [CrossRef]
- Narayanaraj, G.; Wimberly, M.C. Influences of Forest Roads on the Spatial Patterns of Human- and Lightning-Caused Wildfire Ignitions. Appl. Geogr. 2012, 32, 878–888. [Google Scholar] [CrossRef]
- Rezaie, F.; Panahi, M.; Bateni, S.M.; Lee, S.; Jun, C.; Trauernicht, C.; Neale, C.M.U. Development of Novel Optimized Deep Learning Algorithms for Wildfire Modeling: A Case Study of Maui, Hawai‘i. Eng. Appl. Artif. Intell. 2023, 125, 106699. [Google Scholar] [CrossRef]
- Zambon, I.; Cerdà, A.; Cudlín, P.; Serra, P.; Pili, S.; Salvati, L. Road Network and the Spatial Distribution of Wildfires in the Valencian Community (1993–2015). Agriculture 2019, 9, 100. [Google Scholar] [CrossRef]
- Syphard, A.D.; Radeloff, V.C.; Keuler, N.S.; Taylor, R.S.; Hawbaker, T.J.; Stewart, S.I.; Clayton, M.K. Predicting Spatial Patterns of Fire on a Southern California Landscape. Int. J. Wildland Fire 2008, 17, 602–613. [Google Scholar] [CrossRef]
- Maingi, J.K.; Henry, M.C. Factors Influencing Wildfire Occurrence and Distribution in Eastern Kentucky, USA. Int. J. Wildland Fire 2007, 16, 23–33. [Google Scholar] [CrossRef]
- Kuklina, V.; Sizov, O.; Bogdanov, V.; Krasnoshtanova, N.; Morozova, A.; Petrov, A.N. Combining Community Observations and Remote Sensing to Examine the Effects of Roads on Wildfires in the East Siberian Boreal Forest. Arct. Sci. 2022, 9, 393–407. [Google Scholar] [CrossRef]
- Kazama, V.S.; Corte, A.P.D.; Robert, R.C.G.; Sanquetta, C.R.; Arce, J.E.; Oliveira-Nascimento, K.A.; DeArmond, D. Global Review on Forest Road Optimization Planning: Support for Sustainable Forest Management in Amazonia. Ecol. Manag. 2021, 492, 119159. [Google Scholar] [CrossRef]
- Danilović, M.; Ristić, R.; Stojnić, D.; Antonić, S.; Dražić, S. Evaluation of Morphometric Terrain Parameters and Their Influence on Determining Optimal Density of Primary Forest Road Network. Croat. J. For. Eng. 2023, 44, 12. [Google Scholar] [CrossRef]
- Sreelekha, M.G.; Krishnamurthy, K.; Anjaneyulu, M.V.L.R. Interaction between Road Network Connectivity and Spatial Pattern. Procedia Technol. 2016, 24, 131–139. [Google Scholar] [CrossRef]
- Jenelius, E.; Mattsson, L.-G. Road Network Vulnerability Analysis of Area-Covering Disruptions: A Grid-Based Approach with Case Study. Transp. Res. Part. A Policy Pract. 2012, 46, 746–760. [Google Scholar] [CrossRef]
- Scott, J.H.; Thompson, M.P.; Gilbertson-Day, J.W. Exploring How Alternative Mapping Approaches Influence Fireshed Assessment and Human Community Exposure to Wildfire. GeoJournal 2017, 82, 201–215. [Google Scholar] [CrossRef]
- Narayanaraj, G.; Wimberly, M.C. Influences of Forest Roads and Their Edge Effects on the Spatial Pattern of Burn Severity. Int. J. Appl. Earth Obs. Geoinf. 2013, 23, 62–70. [Google Scholar] [CrossRef]
- Demir, M. Impacts, Management and Functional Planning Criterion of Forest Road Network System in Turkey. Transp. Res. Part. A Policy Pract. 2007, 41, 56–68. [Google Scholar] [CrossRef]
- Şakar, D.; Aydin, A.; Akay, A.E. Using GIS-Based Multicriteria Decision Support System for Planning Road Networks with Visual Quality Constraints: A Case Study of Protected Areas in Ankara, Turkey. Environ. Monit. Assess. 2020, 192, 447. [Google Scholar] [CrossRef] [PubMed]
- Sosa, G.; MacDonald, L. Wildfire Effects on Road Surface Erosion, Deposition, and Road-stream Connectivity. Earth Surf. Process Landf. 2016, 42, 735–748. [Google Scholar] [CrossRef]
- Nieszała, A.; Klich, D. How Far from the Road Should Land Cover Be Assessed? A Case Study on Mesopredator Mortality on Roads. Eur. J. Wildl. Res. 2021, 67, 23. [Google Scholar] [CrossRef]
- Banks-Leite, C.; Ewers, R.M.; Folkard-Tapp, H.; Fraser, A. Countering the Effects of Habitat Loss, Fragmentation, and Degradation through Habitat Restoration. One Earth 2020, 3, 672–676. [Google Scholar] [CrossRef]
- Scanes, C.G. Chapter 19—Human Activity and Habitat Loss: Destruction, Fragmentation, and Degradation. In Animals and Human Society; Scanes, C.G., Toukhsati, S.R., Eds.; Academic Press: Cambridge, MA, USA, 2018; pp. 451–482. ISBN 978-0-12-805247-1. [Google Scholar]
- Pons, P.; Mauri, E. Handbook of Good Practices in Post-Wildfire Management. Anifog Project. pp. 22–31. Available online: https://www.fao.org/sustainable-forest-management/toolbox/tools/tool-detail/en/c/1334992/ (accessed on 1 March 2024).

Disclaimer/Publisher’s Note: The statements, opinions and data contained in all publications are solely those of the individual author(s) and contributor(s) and not of MDPI and/or the editor(s). MDPI and/or the editor(s) disclaim responsibility for any injury to people or property resulting from any ideas, methods, instructions or products referred to in the content. |
© 2024 by the authors. Licensee MDPI, Basel, Switzerland. This article is an open access article distributed under the terms and conditions of the Creative Commons Attribution (CC BY) license (https://creativecommons.org/licenses/by/4.0/).