Article

Parametric Study of Flow and Combustion Characteristic in a Cavitied Scramjet with Multi-Position Injection

Research Institute of Aerospace Technology, Central South University, Changsha 410012, China
*
Author to whom correspondence should be addressed.
Fire 2024, 7(6), 176; https://doi.org/10.3390/fire7060176
Submission received: 24 March 2024 / Revised: 20 May 2024 / Accepted: 20 May 2024 / Published: 22 May 2024

Abstract

:
This study focuses on the three-dimensional flow and combustion characteristics of a cavitied scramjet engine with multi-position injection. A single-equation large eddy simulation (LES) turbulence model is employed, with a detailed reaction mechanism for hydrogen combustion, as described by Jachimowski. The combustion characteristics of hydrogen in the scramjet combustion chamber are analyzed. Based on the combustion chamber model, the influence of different equivalence ratios, injection timing, injection positions, and injection pressures on the flame formation and propagation process are compared. The results indicate that within a certain range, an increase in the equivalence ratio enhances the combustion intensity and chamber pressure. In the case of multi-position injection, the order of injection from different nozzles has little effect on the final flame stabilization mode and pressure distribution. The opposite-side distribution of nozzles can effectively improve the fuel efficiency and the internal pressure. Furthermore, when the nozzles are closely placed in the opposite-side distribution, the combustion efficiency increases, although this leads to a higher total pressure loss. In scenarios where the fuel injection duration is short, an increase in the injection pressure at the upstream nozzles of the cavity results in a higher local equivalence ratio, as well as reduced fuel mixing and ignition time.

1. Introduction

Scramjet engines have the advantages of a simple structure (as shown in Figure 1), light weight, a high specific impulse, fast speed, and the ability to replenish oxygen without the need to carry it with them [1,2]. They have been widely used in fields such as space shuttles, high-speed weapons, and wide-speed-range vehicles [3], and comprise one of the most efficient and promising propulsion systems [4,5,6]. When a scramjet engine operates normally, air enters the engine at extremely high speeds, and the time for fuel injection, fuel/air mixing, and combustion in the combustion chamber is only a few milliseconds [7]. It is very difficult to maintain a stable flame, so a rational flame stabilization scheme is essential. At present, the most effective method to maintain stable combustion within the combustion chamber is to form a recirculation zone [8]. The large-scale vortices generated within the recirculation zone can transport fuel to the combustion zone in a timely manner, achieve sufficient mixing, and form a stable combustion area.
The methods for building a recirculation zone fall into two main categories: the first includes using suitable physical structures, such as posts [9,10], slopes [11], tower structures [12], and concave cavities [13], while the second involves using some aerodynamic structures, such as fuel tangential injection, reverse injection, swirl injection, cross injection, and shock wave ignition and combustion. Both types of structures significantly enhance the penetrability, mixability, and permeability of fuel, improving combustion stability [14]. Among these types, research on concave cavity structures is relatively abundant, and their technology is more mature. Among them, there is a wealth of research on cavity structures. The Central Institute of Aviation Engines (CIAM) [15] first introduced the use of cavity structures in the testing of a dual-mode hydrogen-fueled scramjet engine, jointly developed by Russia and France. Subsequently, researchers conducted numerous experimental studies on cavity structures [16,17,18,19,20,21,22]. Micka et al. [16] conducted experimental research on a concave cavity dual-mode scramjet engine and identified two different combustion stability modes: concave cavity stable combustion and jet trail stable combustion. Hammack et al. [17] investigated the ignition process of concave cavities and found that the success of ignition is determined by the competitive relationship between local flow velocity, fuel concentration, and flame propagation rate. Bao et al. [18] studied the ignition process of kerosene in a dual-cavity configuration scramjet engine combustor and found that the local fuel equivalence ratio significantly affects the development of local flames in concave cavities with smaller length-to-depth ratios (L/D), while the influence is less pronounced in larger L/D cavities, with better performance observed for higher L/D ratios. Lee et al. [19] investigated the impact of concave cavity structures on supersonic combustion performance and found that ordinary concave cavities significantly improve combustion performance, while sawtooth-shaped cavities greatly reduce combustion performance. Kannaiyan et al. [20] studied the combustion characteristics of ethylene in three different combustor configurations: without cavities, with rectangular cavities, and with rear-wall inclined cavities. They found that cavities enhance combustion stability, and when the cavity depths are similar, the rear-wall inclined cavity exhibits better fuel mixing and flame stability compared to the rectangular cavity configuration. Ma et al. [21] conducted numerical studies using the RANS method to investigate the mixed combustion, with different fuel injection distances and cavity depths. The results showed that shorter injection distances and larger cavity depths reduce shear layer oscillations, leading to strong and stable combustion in the combustion chamber. Landsberg et al. [22] studied the mixing and combustion performance of cavities with different front wall inclinations through experiments and numerical simulations. The results indicated that, compared to a 90° front-wall inclined cavity, a 45° front-wall inclined cavity generates a more stable recirculation zone and vortex structure, but does not exhibit significant improvements in mixing and combustion performance.
Hydrogen-fueled scramjet engines, due to their high specific impulse characteristics, have broad application prospects in hypersonic vehicles; hence, researchers have conducted numerous simulations of hydrogen fuel combustion [23,24,25,26,27,28,29,30]. Wang et al. [23] conducted research on the combustion performance of a hydrogen-fueled scramjet engine, revealing a positive feedback relationship between the lift shear layer in the recirculation zone and enhanced combustion, which demonstrates the strong robustness of the shear layer/recirculation stable combination mode. Takeno et al. [24] conducted research on the flame stabilization mechanisms of hydrogen jets and found that spherical flame structures are instrumental in sustaining the flame. Baranyshyn et al. [25] studied the ignition timing of hydrogen–air mixtures at elevated temperatures and found that with the increase in temperature, the delay before spontaneous ignition sharply decreases from hundreds of microseconds to just a few microseconds. Koo et al. [26] studied the effect of thermodynamic nonequilibrium on the flame structure of supersonic hydrogen combustion using direct numerical simulation (DNS). The results showed that the presence of nonequilibrium at lower vibrational temperatures inhibits combustion, and nonequilibrium effects play an essential role in the internal structure of the flame. Ao et al. [27] investigated the impact of different degrees of thermodynamic nonequilibrium on supersonic hydrogen/air combustion. The results showed that when the inlet vibration temperature was 688.38 K and 1088.42 K, the combustion efficiency was 76% and 84%, respectively. At higher inlet vibration temperatures, the jet flame becomes more unstable, and the combustion heat release and local static pressure fluctuations are significantly increased. Li et al. [28] established a model based on boron, hydrocarbon, and hydrogen fuels to evaluate the performance of scramjet engines. The study found that boron fuel scramjet engines have the potential for downsizing, and they have a larger specific impulse, enabling higher Mach number cruising. Choubey et al. [29] numerically investigated the H2 injection technology at the bottom of the cavity of scramjet engines under different freestream Mach numbers. The results showed that optimal cavity bottom injection can effectively control the downstream propagation of the shock wave, and an appropriate cavity length can effectively spread the fuel. Yuan et al. [30] studied the impact of air throttling on ignition in hydrogen-fueled scramjet engines. The results indicated that air throttling not only increased the pressure within the cavity but also prevented abrupt expansion at the step location.
Currently, some researchers have conducted extensive experimental and numerical simulations on the structure of stable flames in scramjet combustion chambers. The interaction of different nozzles in the case of multi-position injection on the combustion mechanism are still unknown. In this study, large eddy simulation (LES) is used to analyze the numerical performance of a cavitied hydrogen fuel scramjet with multi-position injection to improve flame propagation and combustion stability. The effects of different injection equivalence ratios, injection timings, injection positions, and injection pressures on the combustion process and flow field characteristics are analyzed.

2. Numerical Methods

2.1. Computational Domain and Relevant Parameters

The geometric model of the scramjet combustion chamber is shown in Figure 2. The length is L = 700 mm, and the height of the combustion chamber inlet is H = 50 mm. The cavity starts to expand in the downstream region, and the inclination angle of the lower rear wall of the cavity is β = 2°. The arrangement of the combustion chamber nozzles is designed with reference to the experimental model utilized by the China Aerodynamics Research and Development Center. The total width of the combustion chamber is 70 mm, with seven nozzles set along the spanwise direction for each group. Taking a single nozzle, the selected spanwise computational domain width B of the combustion chamber is 10 mm, and the two side surfaces are set as symmetry planes. Hydrogen gas nozzles A1, A2, C1, C2, and C3 are opened in the combustion chamber. The diameter of each nozzle is 1 mm, and they are perpendicular to the wall surface. A1 and A2 are located on the upper wall of the combustion chamber, with their centers at distances of 220 mm and 300 mm from the combustion chamber inlet, respectively. C1, C2, and C3 are located on the lower wall of the combustion chamber. C1 is located upstream of the cavity, C2 is inside the cavity, and the centers of both are at a distance of 15 mm from the front wall of the cavity. C3 is located downstream of the cavity, with its center 15 mm away from the rear wall of the cavity. The distance from the front wall of the cavity to the combustion chamber inlet is ΔL = 180 mm. The total length of the cavity is l = 70 mm, the height is h = 10 mm, and the aspect ratio of the cavity is l/d = 7. The inclination angle of the rear wall is α = 30°.
To investigate the flame dynamics and combustion flow field within a scramjet combustion chamber with multi-position injection, the specific computational cases and corresponding parameter selections are provided in Table 1. Case 1, 2, and 3 are employed to examine the influence of varied equivalent ratios on flame distribution and flow field characteristics. Case 1, 4, and 5 are utilized to investigate the impact of different injection timings from nozzles at the same location on flame distribution and flow field properties. Case 1, 6, and 7 are employed to study the effects of nozzles at different positions, with a constant injection equivalence ratio, on flame distribution and flow field characteristics. Case 1, 8, and 9 are used to explore the influence of different injection pressures from nozzles at the same location on flame distribution and flow field characteristics.

2.2. Numerical Methods and Boundary Conditions
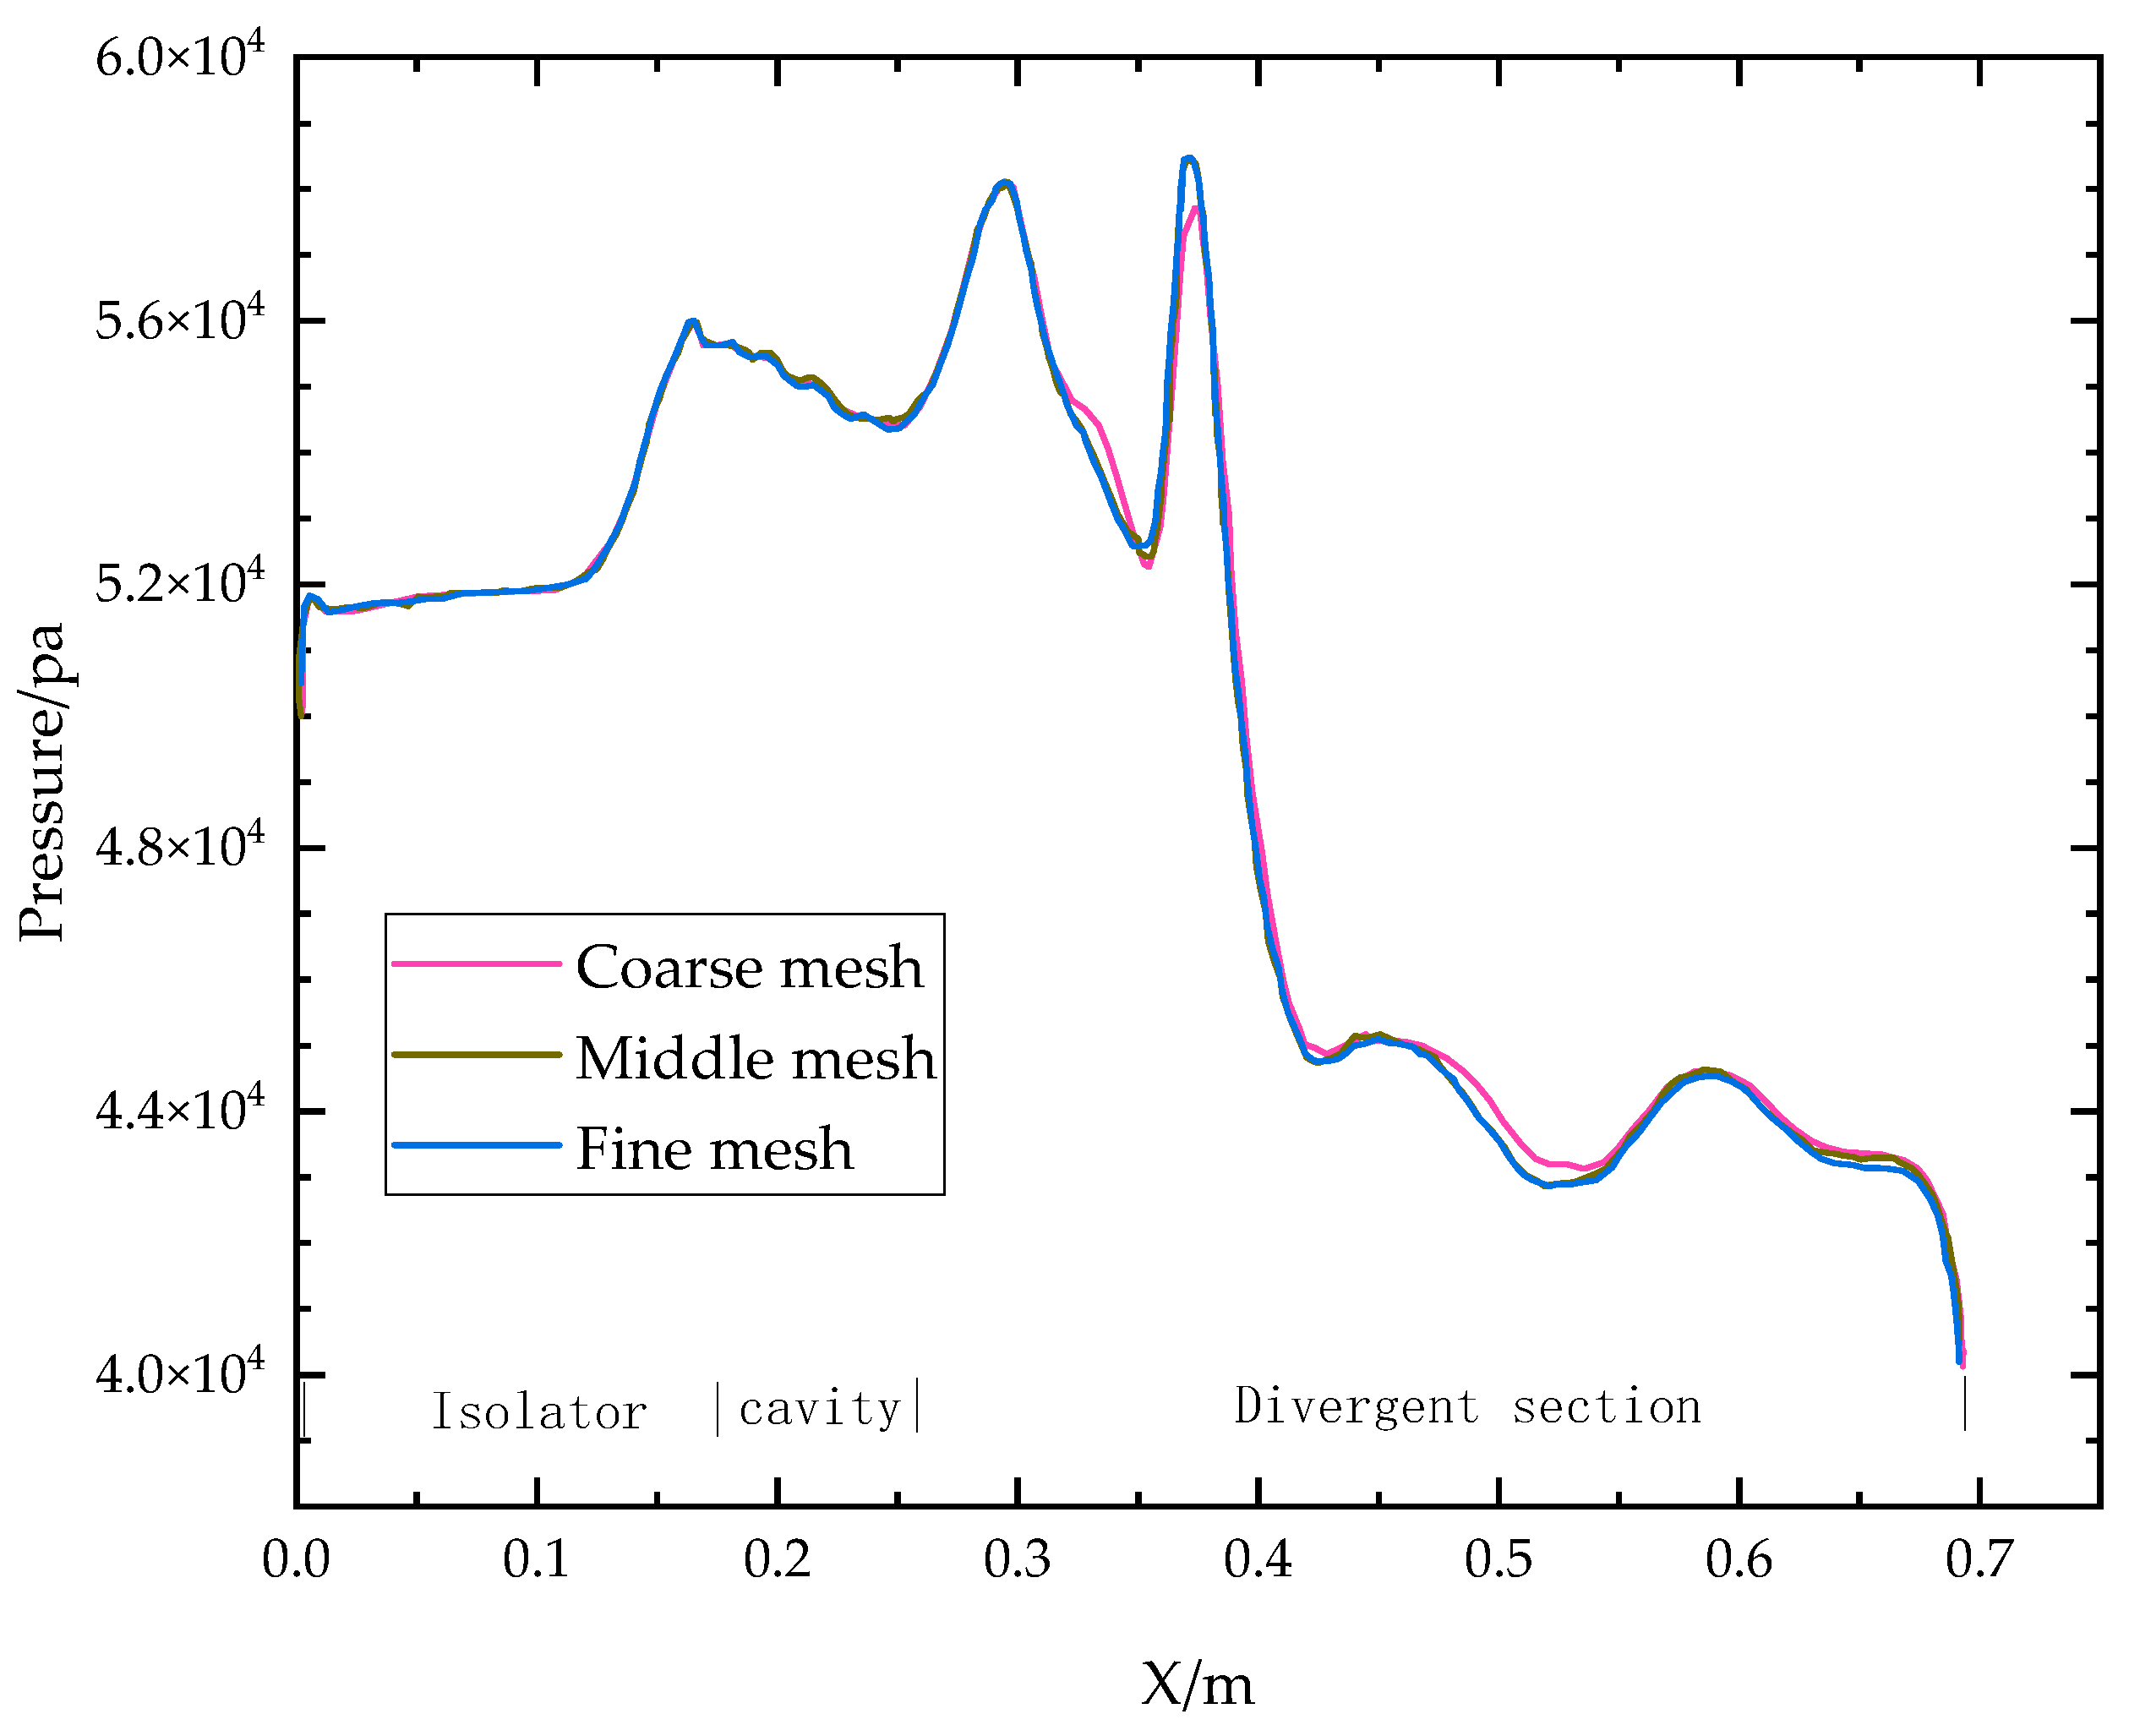
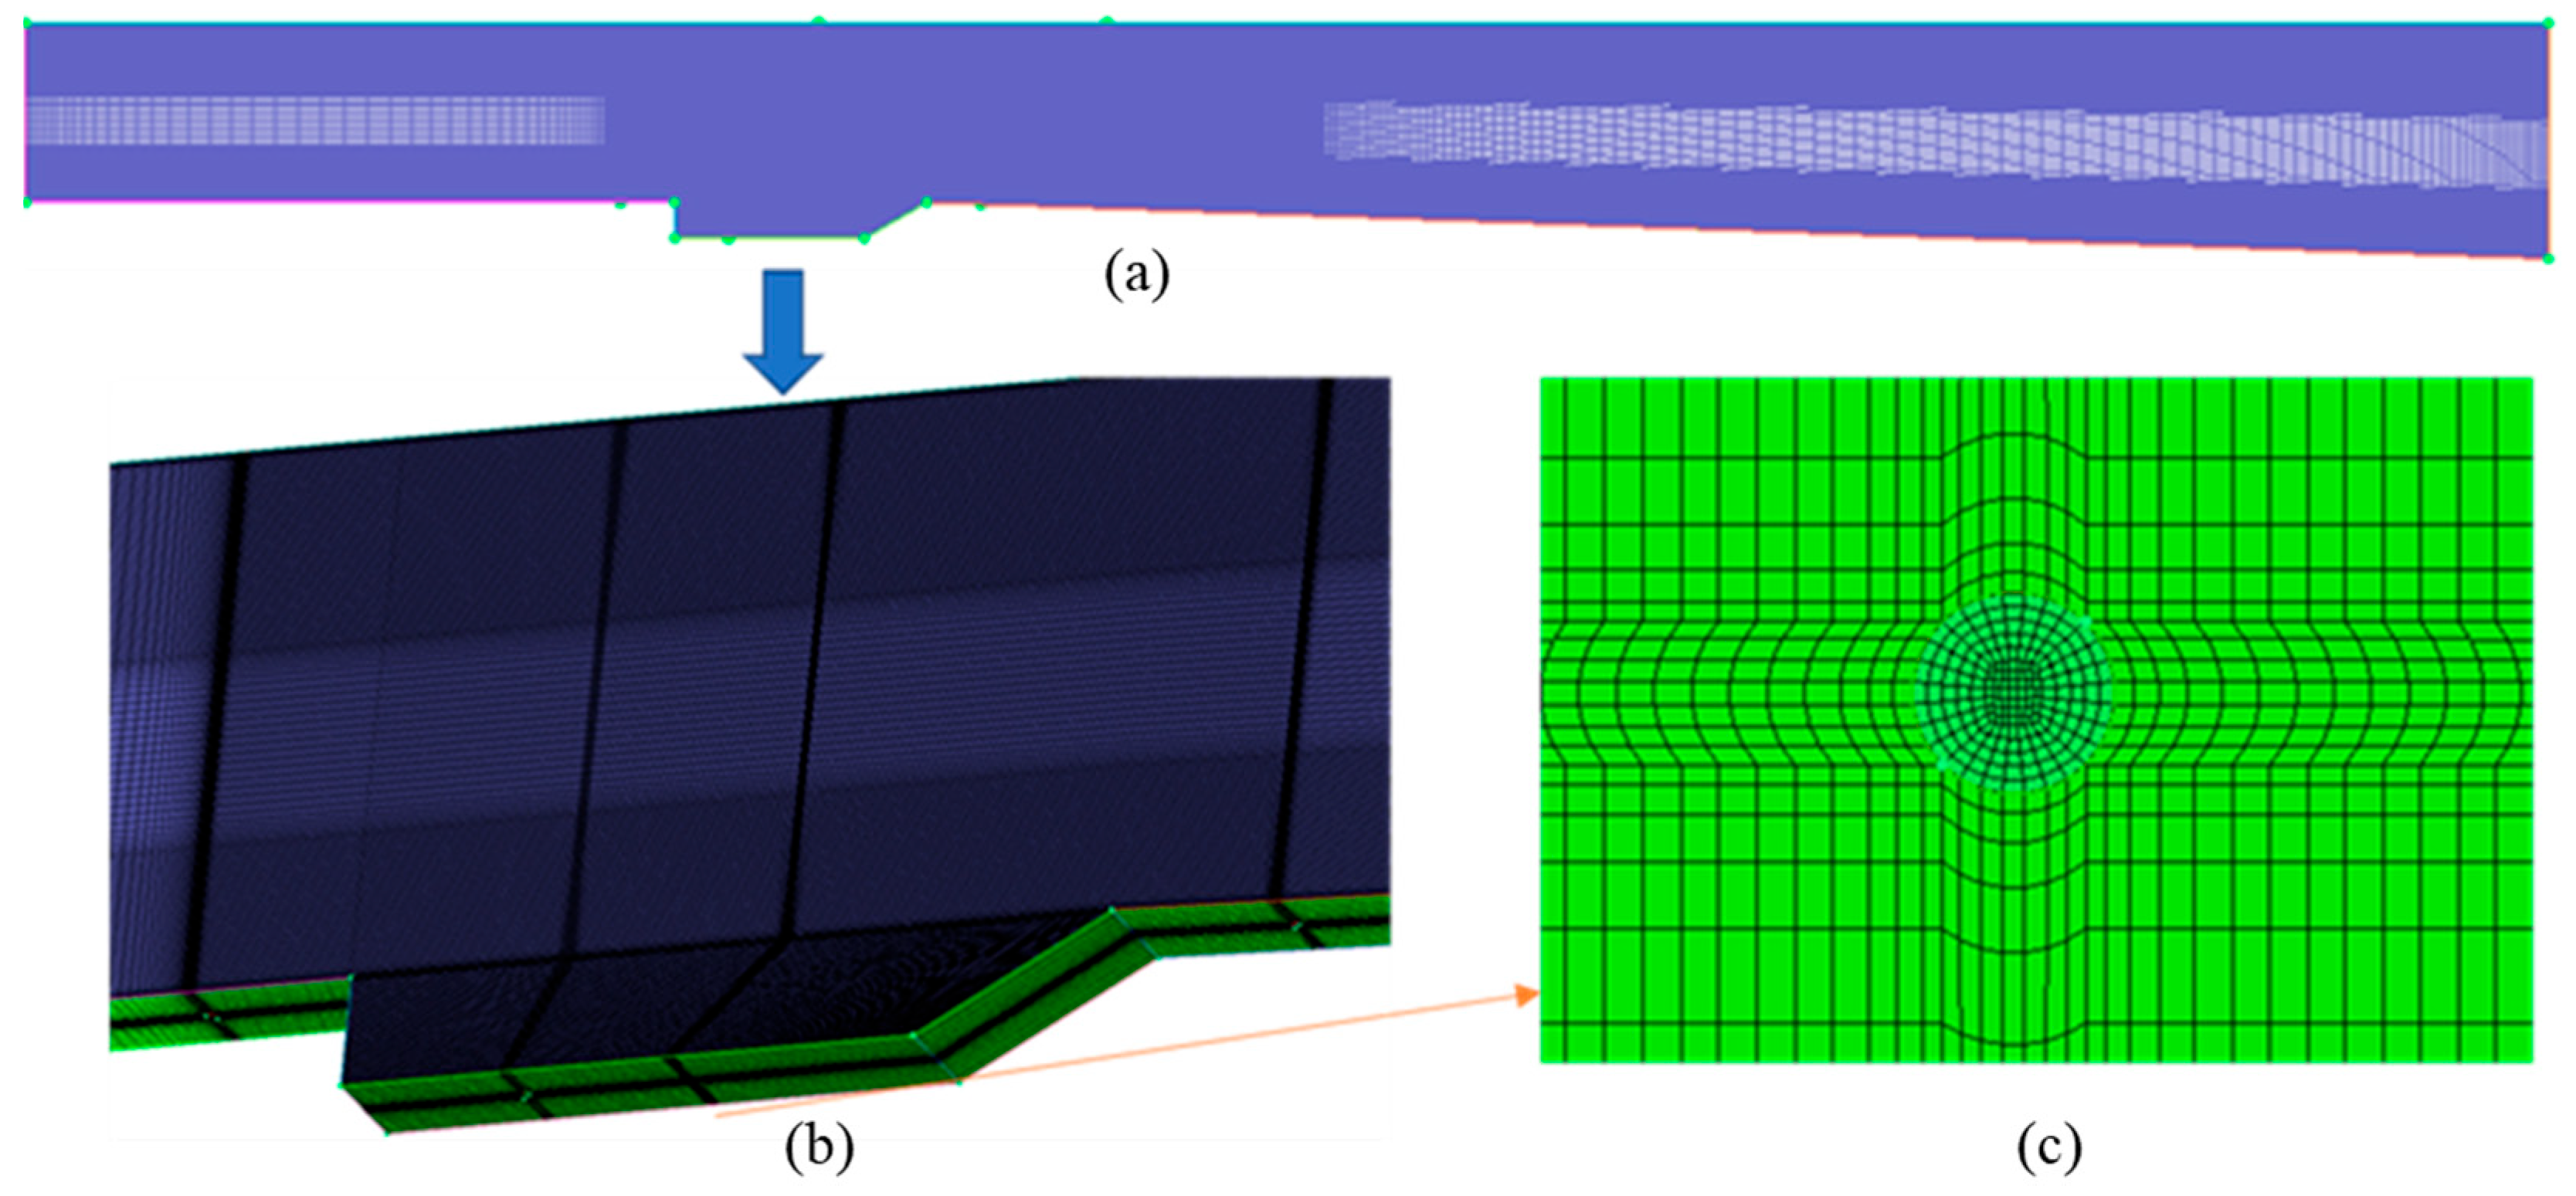
The one-equation LES turbulence model is employed in this study to close the subgrid-scale turbulent viscosity term [31,32]. A linear Boussinesq approximation is utilized to model the Leonard stress, subgrid-scale Reynolds stress, and cross stress, given as follows:
ρ ¯ τ i j = ρ ¯ L i j + R i j + C i j = μ t u ˜ i x j + u ˜ j x i 2 3 u ˜ k x k 2 3 ρ ¯ k ˜ δ i j
Here, the subgrid-scale eddy viscosity field is given by:
μ t = C μ f μ G ρ ¯ k ˜ 1 2 l
Here, f μ is a low Reynolds number damping function defined as:
f μ = 1 e α ρ ¯ E t μ S , E t = u ˜ i u ˜ i / 2 + k ˜
Here, u ˜ i represents the decomposed (Favre-averaged) velocity component values, and S denotes the local strain amplitude. The length scale (l) is expressed as:
l = Δ x Δ y Δ z 1 3
Here, Δx, Δy, Δz represent the grid sizes in the three directions that are affected by the flow velocity. The subgrid-scale turbulent kinetic energy is derived through the following transport equation:
ρ ¯ k ˜ t + x j u ˜ j ρ k ˜ = x j μ + μ t / σ k k ˜ x j + P k C e ρ ¯ k ˜ 3 2 f μ l
Here, ρ ¯ represents the average fluid density, k ˜ represents the turbulent kinetic energy, t represents time, xj represents the j-th component of the spatial coordinates, uj represents the component of the fluid velocity in the j-direction, and μ represents the dynamic viscosity of the fluid. Among them, the turbulence production term is:
P k = ρ ¯ u ˜ i x j τ i j
Here, τ i j represents the viscous stress component. The model constants in the above equations are:
C μ = 0.00854 , C k = 0.1 , C e = 0.916 , α = 0.1 , σ k = 1.0
The operating conditions for the scramjet engine are as follows: the flight Mach number is 6 (Ma = 6), the inflow Mach number at the combustion chamber entrance is Ma = 3.0, the total pressure is Pt = 2.11 MPa, the total temperature is T0 = 1650 K, and the static temperature is T = 702 K. Hydrogen is used as the fuel and is injected in a gaseous state vertically against the wall through different nozzles at a total temperature of T1 = 300 K. Combustion is achieved through spontaneous ignition.
In order to capture the detailed flow field of the combustion chamber, the calculation neglects the effects of conduction, diffusion, and other convective impacts on the flow. The subgrid-scale turbulent viscosity term is closed using the one-equation LES turbulence model, and the chemical reaction source employs a finite-rate combustion model. The computational model employs symmetric boundary conditions on both sides, and the upper and lower walls are treated as no-slip adiabatic wall boundaries. The continuity equation, momentum equation, and energy equation are discretized using a second-order upwind scheme. The Roe-FDS method is utilized for the decomposition of physical fluxes, and a second-order discretization format is applied in space. A continuous total variation diminishing (TVD) limiter is used to enhance computational convergence [33]. The formula is as follows:
u ( 1 ) = u n + Δ t L ( u n ) u ( n + 1 ) = u n + 1 2 u ( 1 ) + 1 2 Δ t L ( u ( 1 ) )
Temporally, a second-order implicit scheme is employed. The Jachimowski hydrogen eight-component 19-step detailed reaction mechanism [34] is used for the combustion chemical reaction, as shown in Table 2. The five sets of fuel injection nozzles are all sonic nozzles and use pressure-inlet boundary injection.
The performance of the engine can be evaluated using the oxygen consumption rate, the total pressure recovery coefficient, and the combustion efficiency, with the relevant formulas as follows:
Oxygen consumption rate formula:
ω = q m O 2 i n A o u t ρ ω O 2 u d A o u t q m O 2 i n
Total pressure recovery coefficient formula:
σ = i = 1 n A i p 0 , o u t , i i = 1 n A i · i = 1 m A i p 0 , i n , i i = 1 m A i 1
Combustion efficiency formula:
ϕ = q m H 2 i n A o u t ρ ω H 2 u d A o u t q m H 2 i n
where q m O 2 i n represents the mass flow rate of oxygen at the inlet of the combustion chamber, q m H 2 i n represents the sum of the mass flow rates of hydrogen injected into the combustion chamber, A o u t represents the area of the combustion chamber outlet, i = 1 n A i p 0 , o u t , i / i = 1 n A i represents the area-weighted average total pressure at the outlet of the duct, and i = 1 m A i p 0 , i n , i / i = 1 m A i represents the area-weighted average of the total pressure at the inlet of the flow passage.

2.3. Mesh Details

The grid independence was verified by using three different grid scales: coarse grid (2.5 million grids), medium grid (4 million grids), and fine grid (5.5 million grids). The influence of these three grids on the pressure distribution on the upper wall of the combustion chamber was analyzed, as shown in Figure 3. It can be observed that there are significant differences in the after-chamber shock pressure of the combustion chamber between the coarse mesh and the medium and fine meshes. However, the medium and fine meshes have a better overall fit, with the maximum error in the upper wall pressure of the combustion chamber simulated by the medium and fine meshes not exceeding 1.5%. Considering the limitations of computational accuracy and resources, this paper employs the medium grid for studying the combustion chamber.
Using Pope’s criterion, the grid resolution is verified by calculating M(x, t) [35].
M ( x , t ) = k r ( x , t ) k ( x , t ) + k r ( x , t )
k(x, t) represents the turbulent kinetic energy of the resolved motions; kr(x, t) represents the turbulent kinetic energy of the residual motions. the results are shown in Figure 4. It can be seen from the figure that the M(x, t) values at the entrance of the combustion chamber, the strong flow separation, and the vortex regions are all relatively high, which is due to the lower grid resolution at the combustion chamber inlet compared to that at the other areas. However, for most regions, especially near the combustion core region, the overall M(x, t) is in the range of 0–0.2 (shown in Figure 4), which indicates that the grid resolution is sufficient.
The total number of grids in the combustion chamber model is approximately 4 million, with a maximum grid size of 0.25 mm in the combustion region. Figure 5a presents the overall distribution of the combustion chamber grid. Since the hydrogen injection nozzles are distributed on both the upper and lower walls, the combustion region in the upper and lower parts of the combustion chamber and inside the cavity were refined to enhance the accuracy of the boundary layer calculation. Figure 5b,c shows the local grid details of the combustion chamber, with grid refinement applied to circular injection nozzles using the O-block method, resulting in a grid scale of 0.02 mm.

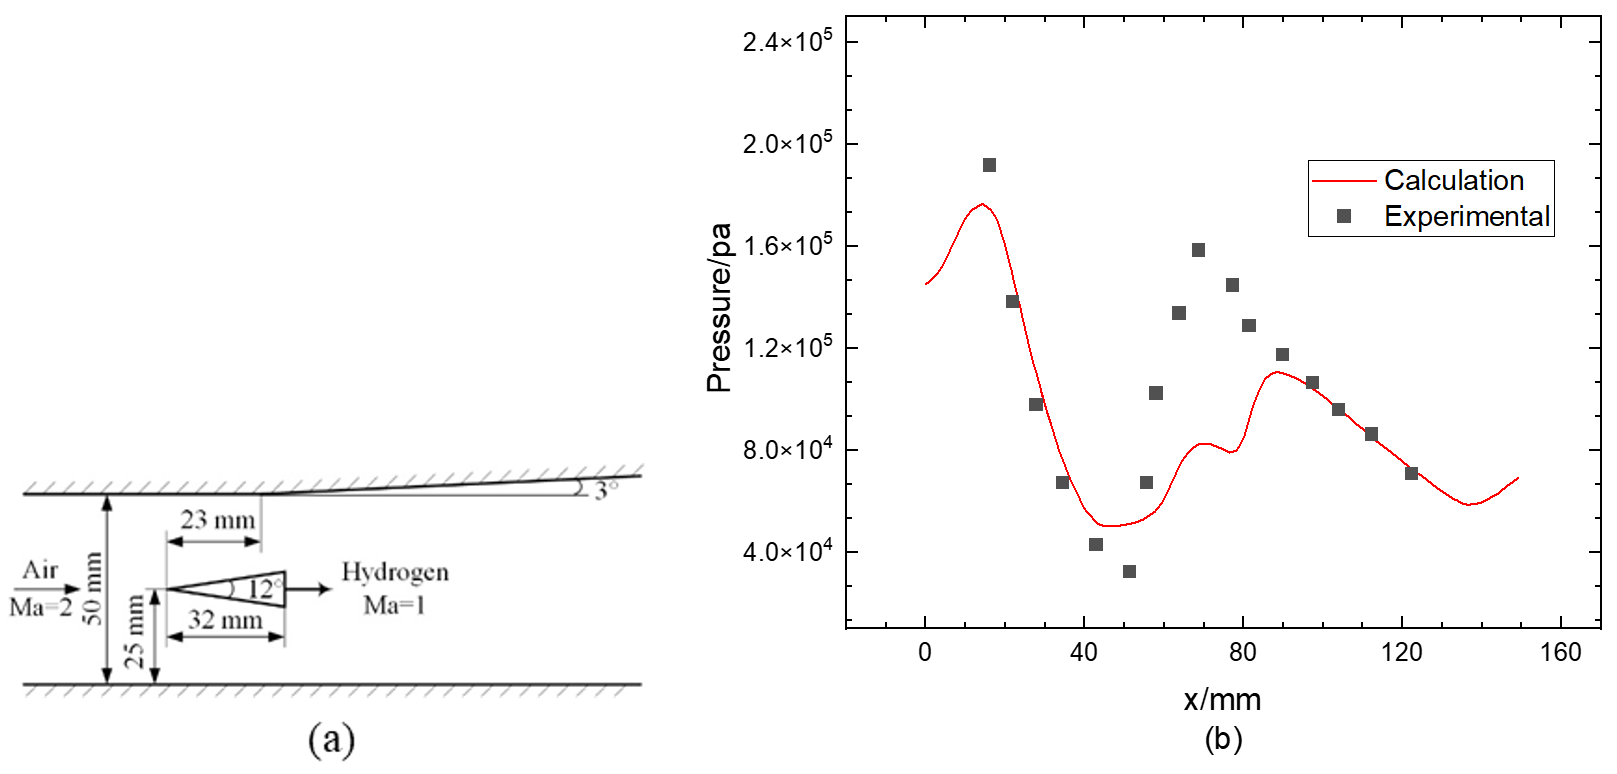
2.4. Model Validation

To verify the effectiveness of the adopted methods, we conducted a comparative validation using the DLR–German Aerospace Center (Cologne, Germany) strut-stirred fueling engine model (Figure 6a). The model has ample experimental data and has been used by multiple researchers for method validation and computational studies [31,36]. Additionally, the inlet dimensions of this model are similar to those of our own model, and hydrogen is used as the fuel injector. Therefore, we conducted the method validation using this model, with a grid number of approximately 2 million. Figure 6 presents a comparison of the calculated and experimental values of the pressure distribution on the lower wall of the combustion chamber under cold-flow conditions; in general, the pressure exhibits basically the same trend of variation in the x-direction.
Figure 7 shows the comparison between the calculated and experimental data under combustion conditions. Figure 7a shows the comparison between the calculated average velocity on the cross-sectional plane at x = 78 mm within the combustion chamber and the experimental results; Figure 7b is the comparison between the calculated average temperature at x = 233 mm and the experimental results. Overall, the calculated results are close to the experimental values in terms of distribution trends and variations, indicating the high rationality of the adopted numerical calculation method.

3. Results and Discussion

3.1. Effect of Equivalence Ratio

Figure 8 shows that the fuel combustion regions in Cases 1–3 are essentially identical, and the stabilizing flame methods are also quite similar. That is, the fuel on the upper wall primarily burns at the downstream jet location, while the fuel on the lower wall mainly burns inside the cavity and extends a certain depth towards the center of the combustion chamber, spreading downstream. However, when comparing Case 1–3, the intensity of the combustion shock wave string becomes increasingly stronger, and the distance it advances to the upstream of the combustion chamber also becomes increasingly longer. That is, as the equivalence ratio increases, the combustion intensity becomes stronger and stronger.
As shown in Figure 9, in Case 2, the combustion shock wave train eventually stabilizes at a mid-position upstream of nozzle C1. In Case 3, several high-pressure points formed by the multiple reflections of the combustion shock due to significant boundary layer separation can be observed at the center of the combustion chamber. Additionally, because of the advancement of the combustion shock wave, the area producing OH radicals upstream of the C1 nozzle becomes larger, which is due to the expansion of the recirculation zone. In Case 3, the OH radical regions formed by the nozzles on the upper and lower walls of the combustion chamber nearly contact each other in the downstream region, and the air passage narrows, as shown in Figure 9b.
It can be seen from Figure 10a that the flow field in the combustion chamber of Case 1 becomes stable after approximately 3.0 milliseconds, while Case 2 and Case 3 only require about 2.0 milliseconds. This indicates that increasing the equivalence ratio can accelerate the stabilization of the flow field. Moreover, it can be observed from the figure that as the global equivalence ratio of the fuel increases, the combustion efficiency decreases. This result is related to the degree of fuel mixing and utilization. It can be seen from Figure 10b that with the increase in the fuel equivalence ratio, the total pressure recovery coefficient at the combustion chamber outlet position presents an overall downward trend, indicating that increasing the equivalence ratio strengthens the combustion shock wave within the combustion chamber and increases the total pressure loss. It can be seen from Figure 10c that the shock wave trains for Cases 1–3 stabilize near x = 100 mm, x = 125 mm, and x = 180 mm, respectively. This indicates that the higher the global equivalence ratio of the fuel, the greater the heat release during combustion in the chamber, and the farther the shock wave train advances towards the upstream of the combustion chamber. It can be observed from the Figure 10d that the total pressure is comparatively high in the front section of the combustion chamber for all three cases, which may be due to the front section of the combustion chamber being farther away from the injection nozzle and the combustion area, resulting in lower flow losses. Because of the intense reactions inside the combustion chamber, the combustion shock train in a scramjet engine will approach the entrance of the combustion chamber. Comparing Case 1, Case 2, and Case 3, the point where the average total pressure begins to drop sharply moves closer and closer to the entrance of the combustion chamber, meaning that the combustion shock train advances farther upstream in the combustion chamber, indicating that the higher the global equivalence ratio, the stronger the combustion shock train.

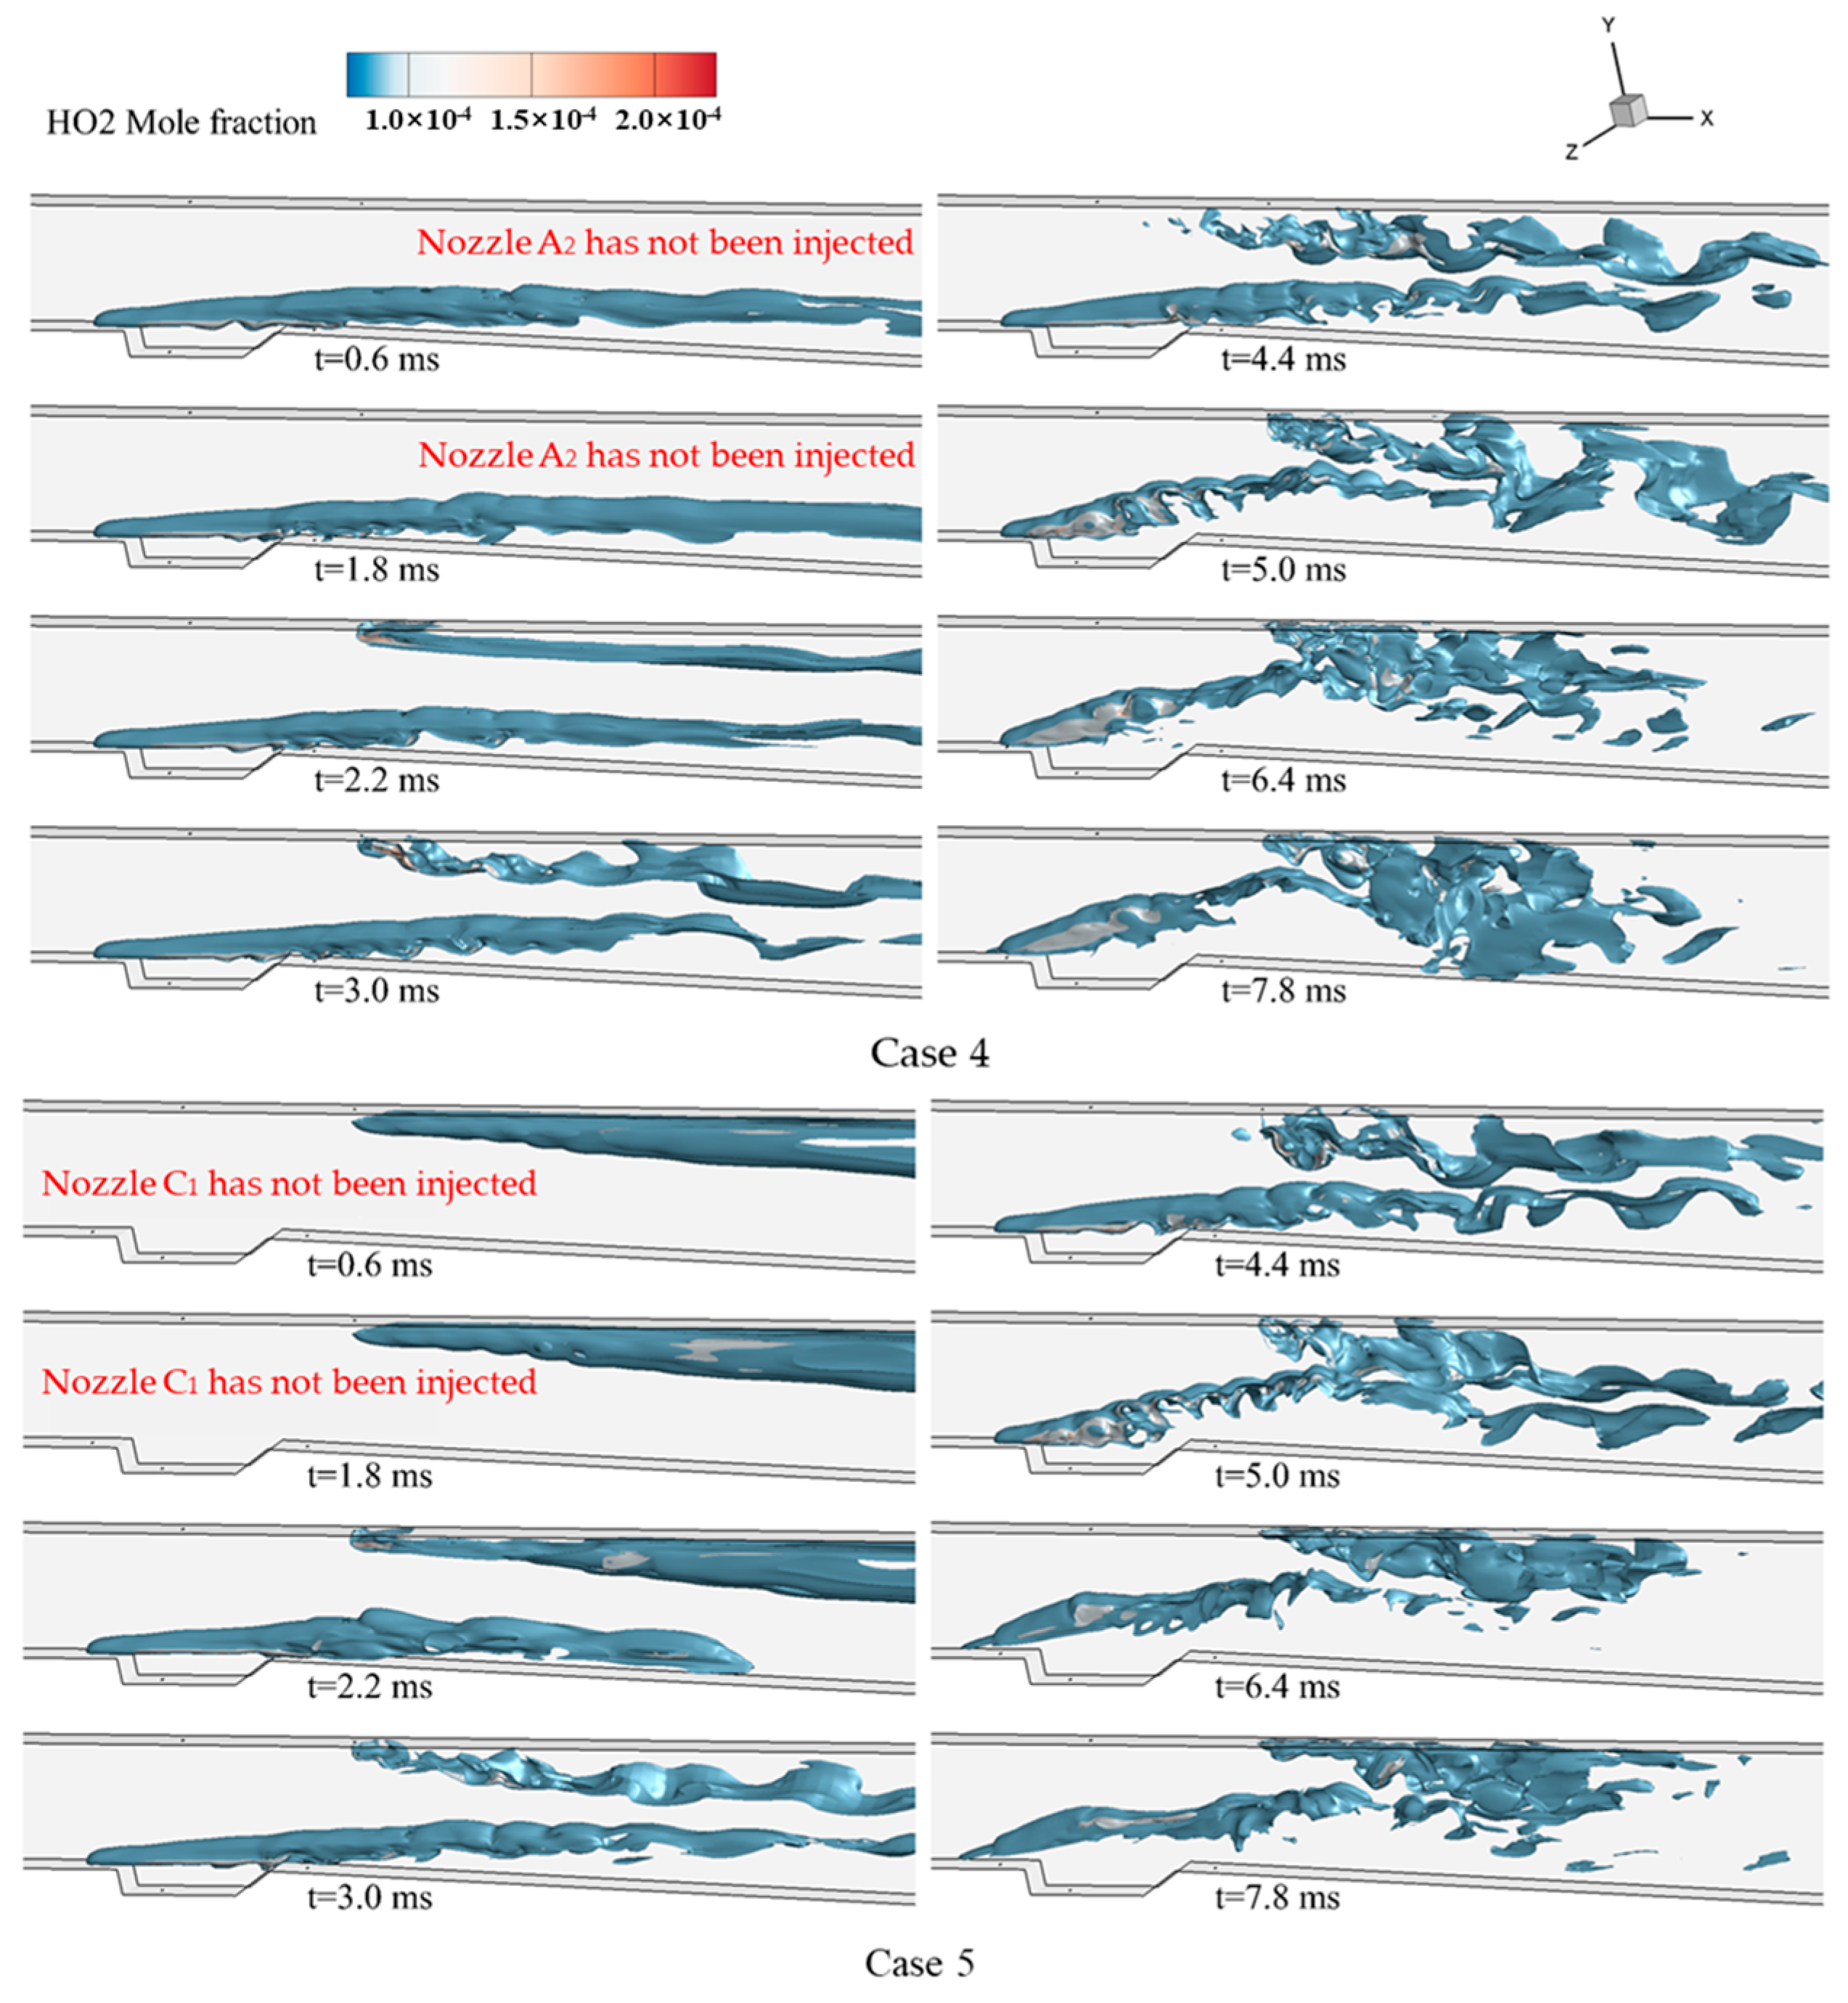
3.2. Effect of Injection Timing

Figure 11 shows the change of the HO2 mole fraction with time in the combustion chamber under different injection timings; the injection of HO2 was first started from the lower wall spray nozzle C1, followed by the upper wall spray nozzle A2 after 2 ms. As shown in the figure, at t = 0.6 ms and 1.8 ms, the nozzle A2 was not yet activated, resulting in a single-point injection from nozzle C1, with HO2 only distributed in the arc-shaped region, where fuel and air came into contact in the lower part of the combustion chamber. As nozzle A2 started to inject, in the upper part of the combustion chamber, where fuel and air came into contact, HO2 was also formed, and the location of the HO2 reaction zone remained relatively stable, as shown at t = 2.2 ms. With the injection of nozzle A2, the combustion intensity in the combustion chamber gradually increased, leading to an increase in combustion shock wave intensity and a shift towards upstream; the fuel reaction surface fluctuated significantly, as shown at t = 3.0 ms, with larger fluctuations on both sides and a tendency to move towards the center of the combustion chamber. At t = 6.4 ms, there was a contact and collision between the two reaction surfaces. At this point, the HO2 formed by the lower wall spraying had penetrated into the main stream of the combustion chamber, while the HO2 formed by the upper wall spraying had penetrated to a deeper position towards the lower wall. Subsequently, the two reaction surfaces underwent a periodic oscillation process of contact and separation, with the positions of the upper and lower combustion zones displaying a dynamic equilibrium. However, the combustion region essentially spanned the longitudinal position downstream of combustion, with fuel combustion primarily occurring in the main stream of the combustion chamber.
In Case 5, the upper wall spray nozzle A2 was first activated for injection, resulting in an arc-shaped reaction zone formed at the upper wall of the combustion chamber, with a relatively stable location. As the flowing time t > 2.0 ms, the lower wall spray nozzle C1 began to inject, and due to a slower initial temperature rise during this period, relatively stable behavior was maintained between the upper and lower reaction zones. With an increasing injection flow rate, the fuel combustion intensity gradually increased, leading to an increase in reaction zone fluctuation similar to that observed in Case 4. The fuel reaction surface gradually approached the center of the combustion chamber, with almost all of its cross-sectional area covered by the reaction zone. The final stable flow field was essentially identical to that of Case 4. Combining the analysis of the Case 1 combustion status in 3.1, it can be seen that Case 4 and Case 5 exhibit essentially the same stable combustion status as Case 1, under normal conditions.
When a single-nozzle injection is employed, the bow shock formed by the injection from the nozzle makes it difficult to significantly elevate the pressure throughout the entire combustion chamber, resulting in a weaker combustion intensity. However, when the injection conditions involve two sets of nozzles, the combustion intensity of the fuel is greatly increased. Figure 12a shows the distribution of pressure over time in the combustion chamber in Case 5. After t > 2.0 ms, The pressure throughout the entire combustion chamber has a noticeable increase. In Case 5, due to the initial injection starting from the nozzle A2, which is located closer to the rear of the combustion chamber, during the period t < 2.0 ms, the bow shock reflects fewer times inside the combustion chamber, and the high-pressure area is essentially downstream of the cavity. Moreover, due to the lack of a cavity stabilization structure on the upper wall, the fuel injected from the A2 nozzle struggles to mix and burn, leading to weaker heat release from combustion and weaker formation of shock wave trains. It can be seen from Figure 12b that after both nozzles start injecting, the degree of boundary layer separation increases, and the air passage gradually narrows, and the flow field eventually becomes essentially the same as that in Case 1. This indicates that changes in the injection timing sequence do not affect the flame stabilization mode or parameters such as pressure and Mach number within the combustion chamber after the flow field has stabilized; they only influence the relevant parameters during the process as the flow field approaches stability.
From Figure 13a, it can be seen that during the period of t < 2.0 ms, due to the unstable flow field, the fuel could not burn completely. Although Case 1 had a higher equivalence ratio under dual-nozzle injection compared to that of the other two cases, the combustion efficiency in the combustion chamber of Case 1 was extremely low at this time. The combustion reached a basic stable state after about 3.0 ms. In Case 4, the nozzle upstream of the cavity was injected earlier, taking advantage of the cavity’s mixing and ignition effect to improve the mixing utilization rate of the fuel, and its combustion efficiency was higher than that in Case 5 before 2 ms. At the initial stage of the second nozzle injection, both Case 4 and Case 5 experienced a sharp drop in combustion efficiency. This was because combustion stabilization required time, and most of the newly injected fuel did not undergo complete combustion at this time, leading to a short-term increase in the mass flow rate of hydrogen gas at the outlet of the combustion chamber and a decrease in combustion efficiency. However, as the combustion slowly became stable, the combustion efficiency gradually increased, and the combustion was basically stable around t = 4.8 ms. In both sets of cases, the time required from the second nozzle injection to the stabilization of the flow field was similar to the combustion stabilization time of Case 1, approximately 3 ms. In addition, after the combustion flow field of the three cases reached a stable state, the combustion efficiency was also basically the same, about 90%. From Figure 13b, it can be seen that during the initial combustion phase, Case 1, which employed dual-point injection, formed two bow shock waves inside the combustion chamber, leading to relatively low total pressure loss. In contrast, Case 4 and Case 5 each had only one bow shock wave, resulting in a slightly lower total pressure loss compared to the initial combustion phase of Case 1. After the combustion stabilized, the total pressure recovery coefficient was essentially the same as in Case 1, at about 24%. From Figure 13c, it can be seen that after the three sets of cases stabilized, the distribution of flow field pressure along the x-axis was essentially uniform, and the distance of the shock wave propagation was also roughly the same. This indicates that the injection timing only alters the flow field state before the combustion chamber stabilizes, while the relevant parameters remain essentially unchanged once the flow field is stable.

3.3. Effect of Position of Injection

Case 1, 6, and 7 all employ double-nozzles injection, but the positions of the nozzles are different, corresponding to the larger distance distribution, the same side distribution, and the closer distance distribution on the opposite side of the nozzle pair, as indicated by the red arrows in Figure 14. Case 7 has a similar flame stability mechanism as that in Case 1. However, due to the shorter distance between the two injection nozzles in Case 7, the arch-shaped shock waves formed in front of the nozzles have a stronger interference with each other, leading to higher pressure within the combustion chamber in Case 7. Therefore, the combustion region on the upper wall of Case 7 extends deeper into the mainstream and burns more intensely. In addition, the larger combustion area on the upper wall of Case 7 leads to more severe combustion and the expansion of combustion heat products, which have a certain impact on the combustion region of the lower wall, causing the fuel reaction region of the C1 nozzle to extend less deeply. Due to the same-side distribution of the fuel injection nozzles in Case 6, the flame stabilization form is slightly different from that of the combustion chambers in Case 1 and 7.
From Figure 15, it can be seen that the combustion shock wave train exhibits a tendency to move upstream; however, the combustion wave can only be sustained near the cavity location. Additionally, as the combustion intensity increases, the shock wave train undergoes multiple reflections within the air passage, and the density of the air inside the channel gradually increases. However, under this injection mode, the overall combustion intensity within the combustion chamber remains weak.
From Figure 16a, it can be seen that for Case 6, which features two nozzles on the same side wall for injection, the combustion intensity is relatively weak, failing to create significant boundary layer separation. Additionally, the downstream cavity nozzle C3 lacks the air required for mixing and combustion, leading to considerable fuel wastage, and thus, the lowest combustion efficiency at the chamber exit among the examples considered. In contrast, for Case 1 and Case 7, which both involve nozzles on opposite walls, Case 7 exhibits a higher overall combustion efficiency at the chamber exit compared to Case 1 after combustion stabilization. This may be attributed to the closer proximity of the nozzles, which results in the stronger bow shock waves formed upstream directly interfering with each other, creating a higher pressure point within the combustion chamber. This conversely strengthens the mixing and combustion of the fuel. This indicates that adopting a configuration with closer spaced upper and lower wall opposed injections can effectively enhance the combustion efficiency of the fuel. In Figure 16b, Case 6 exhibits weaker combustion intensity, and the absence of shock wave train dissipation within the combustion chamber results in a significantly higher total pressure recovery coefficient after the flow field stabilizes, at approximately 42%. In contrast, for Case 1 and 7, the total pressure recovery coefficient at the chamber exit remains essentially the same after the combustion stabilization, at around 24%. In Figure 16c, for Case 7, with the nozzles closer on the opposing sides, the shock wave propagation distance is longer when compared to that in Case 1, with nozzles spaced further apart, while the overall pressure at the mid-burnt zone is slightly higher. For Case 6, with nozzles on the same sidewall, the shock wave propagation distance is the shortest among the three cases, and the pressure increase is the lowest. The above analysis indicates that closely spaced opposite-sidewall injections can effectively improve fuel combustion efficiency and pressure in the combustion chamber under multi-position injection conditions, but they may lead to increased total pressure losses.

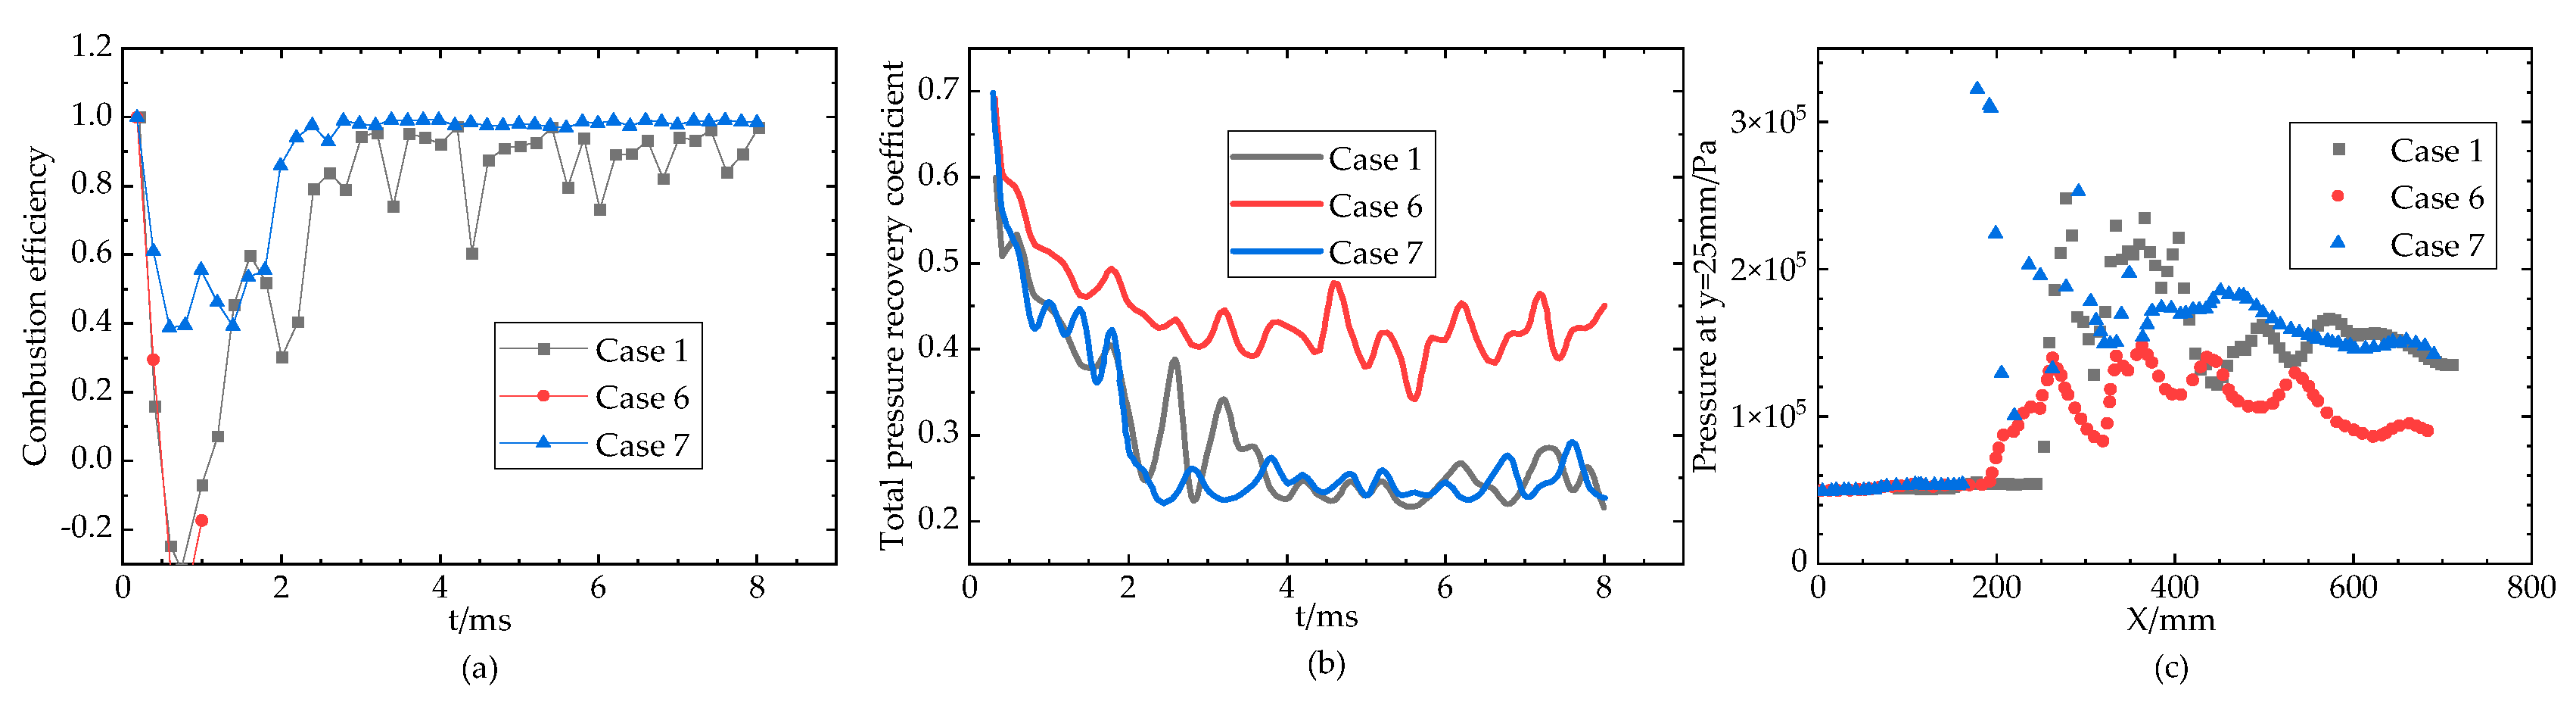
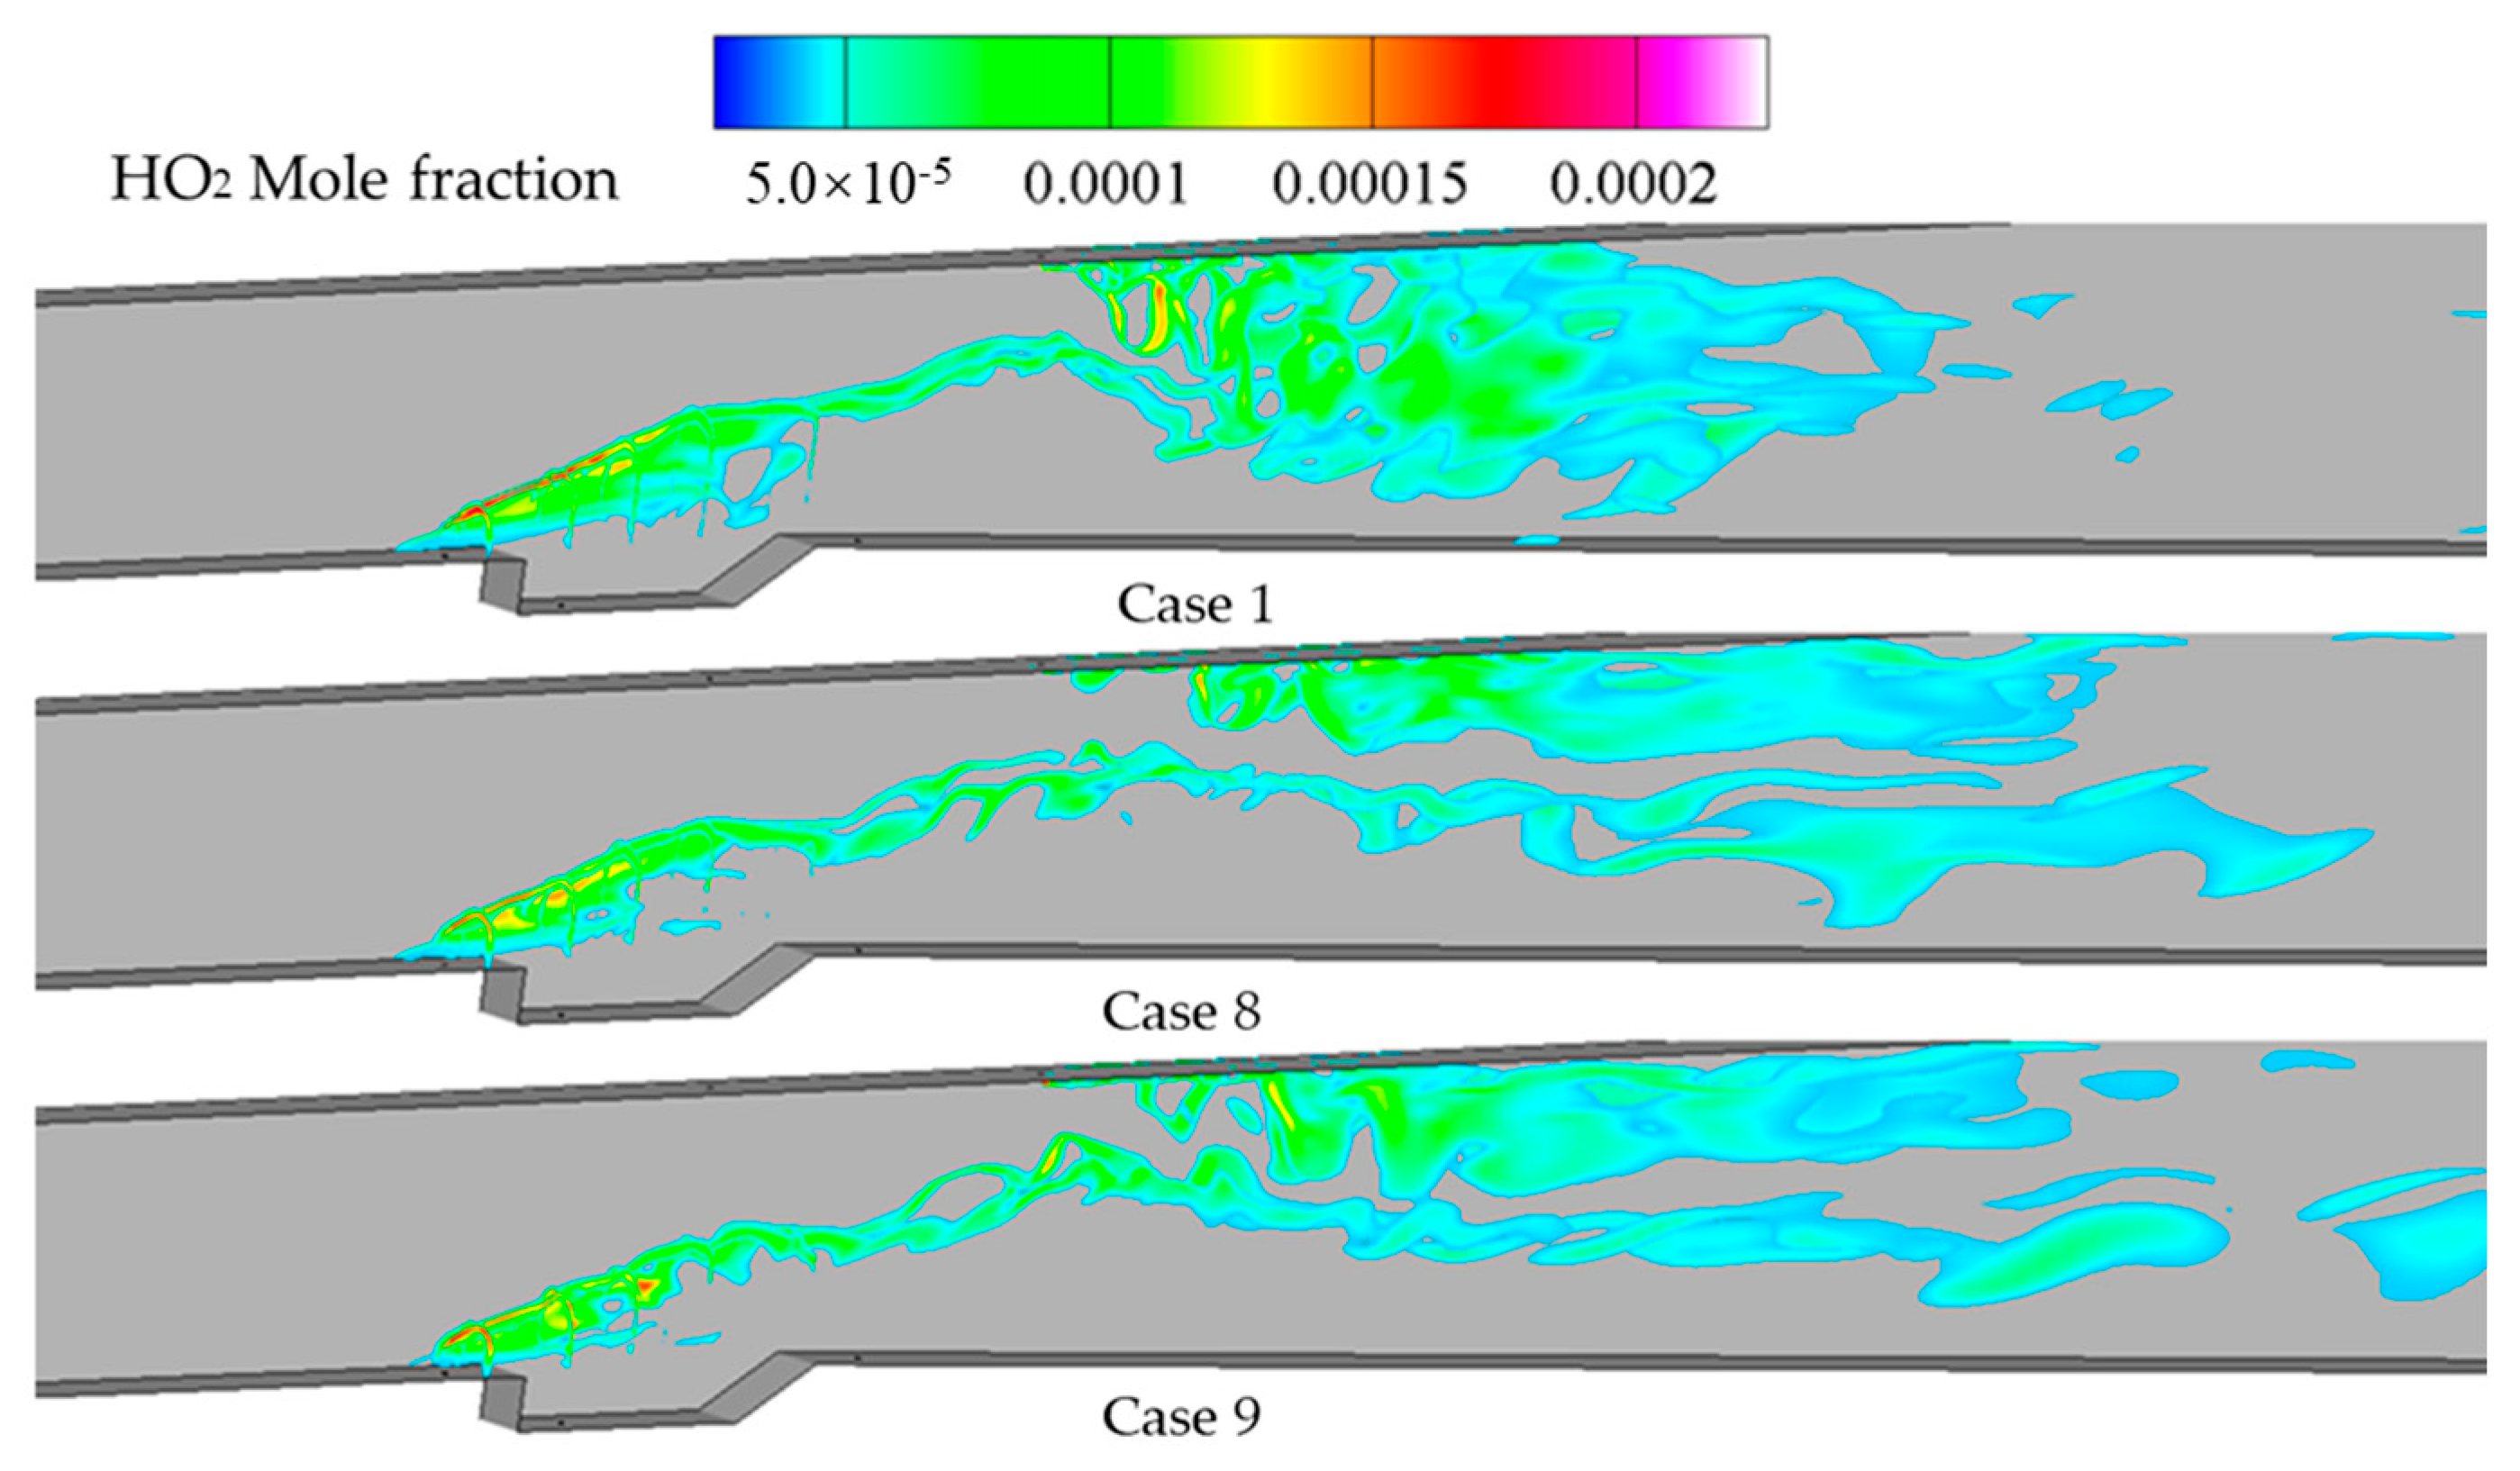
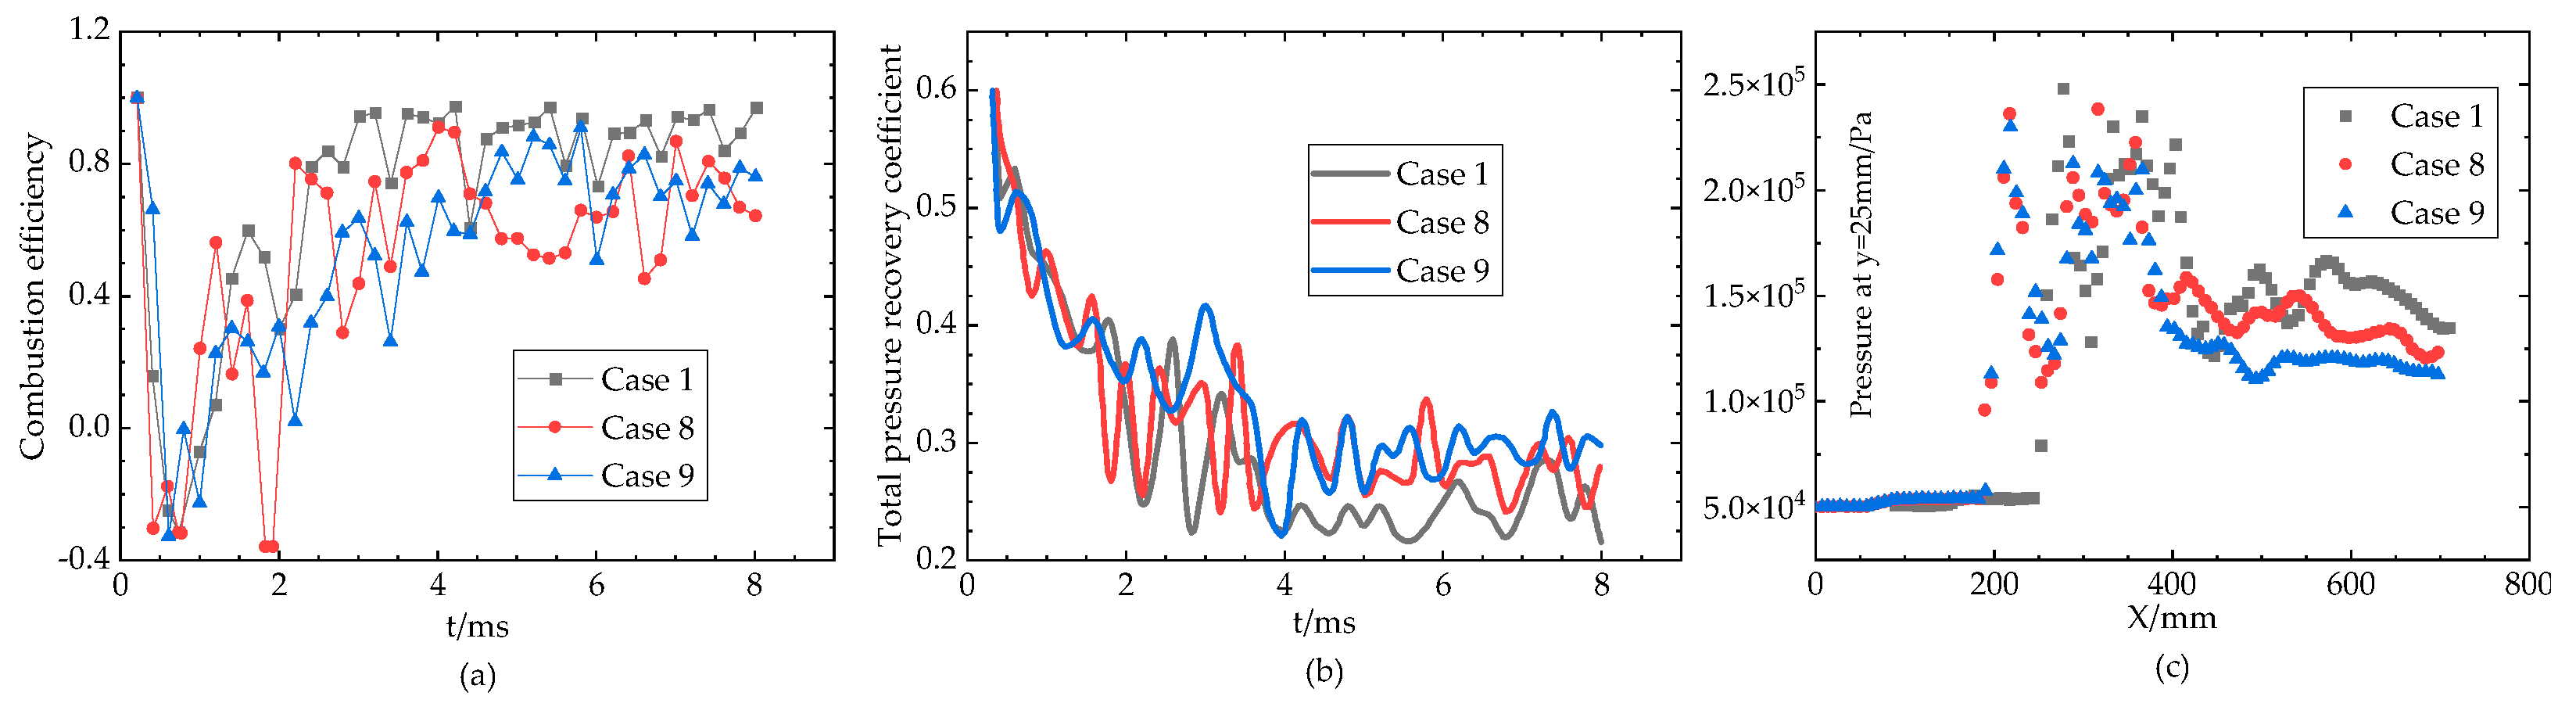
3.4. Effect of Injection Pressure

In the Case 1 combustion chamber (As shown in Figure 17), both A2 and C1 nozzle injection resulted in HO2 radical production that collided and merged over a wide area downstream of the combustion chamber, indicating a larger reaction zone area within the combustion chamber once it reached a stable state. In contrast, compared to Case 1, the combustion-formed HO2 diffusion depth at nozzle A2 in Cases 8 and 9 is relatively smaller, with reactions primarily occurring near the wall surface. Therefore, in this case, the HO2 produced at the upper and lower walls had no contact, and there was a relatively narrow unreacted region between them. This indicates that under the multiple-position injection working mode of a combustion chamber, ensuring a consistent global equivalence ratio for fuel injection and maintaining the injection pressures of all nozzles at similar or equal levels can enhance combustion performance.
In Figure 18a, the combustion efficiency change processes for Case 8 and Case 9 are essentially similar, with combustion reaching stability after about 4.5 milliseconds, and the combustion efficiency stabilizing at around 70%. The combustion efficiency of Case 1 is higher than that of Case 8 and 9. In Figure 18b, the total pressure recovery coefficient at the exit position for Case 8 and Case 9 is higher than that of Case 1, at approximately 28%. In Figure 18c, the propagation distance of the combustion shock wave is roughly the same for Case 1, 8, and 9, near x = 200 mm. In the combustion region, the overall pressure value for Case 1 is significantly higher than for Case 8 and 9. Additionally, at the downstream location of the combustion chamber, the pressure in Case 8 is higher than in Case 9. This may be because the injection pressure of nozzle A2, which is closer to the downstream position in Case 8, is higher, leading to an increase in fuel downstream and the combustion zone shifting towards the downstream, thereby enhancing the combustion intensity in the downstream region.

4. Conclusions

This article conducts an in-depth analysis and research on the multi-position injection combustion flow field and flame of a cavitied scramjet combustion chamber with multi-position injection. Through combining OH, HO2 free radicals, and temperature distribution, the flame development process under different injection equivalence ratios, injection timing, injection position, and injection pressure is analyzed, and the flow field changes are discussed. At the same time, the motion and pressure changes of the shock wave in the combustion chamber are analyzed. In the result evaluation, a quantitative analysis is conducted on three aspects: combustion efficiency, total pressure recovery coefficient, and the distribution of pressure along the x-direction at the y = 25 mm location. The following conclusions are drawn:
(1)
The higher the global equivalence ratio of the fuel, the greater the heat release during combustion in the chamber, and the farther the shock wave train advances towards the upstream of the combustion chamber. In the combustion zone and downstream region of the combustion chamber, the higher the global equivalence ratio, the more significant the increase in combustion chamber pressure.
(2)
When multiple-position injection occurs in a scramjet combustion chamber, different injection timings have little impact on flame stability patterns and fluid field parameters at stable states. Different injection timings only affect the working characteristics and related parameters of the flow field before reaching a stable state. This indicates that different injection timing has a relatively small impact on combustion efficiency and total pressure loss.
(3)
Compared with distribution on the same side of the wall surface, distribution on the opposite side of the nozzle can significantly improve fuel combustion efficiency and the internal pressure of the combustion chamber. At the same time, when the nozzle spacing is smaller with opposite nozzle distribution, greater combustion efficiency can be achieved. However, this also leads to increased total pressure loss, which in turn affects the total pressure recovery coefficient.
(4)
When multi-position injection occurs in a combustion chamber, if the injection pressure of each group of nozzles is equal or similar, the stable speed of the flow field in the combustion chamber significantly increases. At the same time, when fuel is injected at high pressure near the downstream region, it causes the local combustion area to shift backward and increases the pressure downstream of the combustion chamber. This indicates that injection pressure and location have important impacts on combustion efficiency and pressure distribution.
These research findings hold significant implications for enhancing the design of scramjet engines. By adjusting the position, number, and injection pressure of the nozzles, a uniform distribution of fuel within the combustion chamber can be achieved, effectively reducing the accumulation of unburned fuel, minimizing thermal energy loss, and improving combustion efficiency. Furthermore, in-depth studies on injection timing have revealed the crucial role of fuel release timing in regards to combustion stability and efficiency, providing a scientific basis for precise control of the combustion process. These discoveries not only aid in optimizing the mixing and combustion of fuel but also guide the design of combustion chamber layouts, alleviate thermal stress, and thereby enhance the overall performance of the engine. For the propulsion system design of hypersonic vehicles, these research outcomes offer invaluable theoretical support and technical assistance.

Author Contributions

Conceptualization, W.X.; software, W.X. and P.L.; validation, W.G.; data curation, W.G. and Q.S.; writing—original draft preparation, W.X. and P.L.; writing—review and editing, J.L. All authors have read and agreed to the published version of the manuscript.

Funding

This work was supported by Key Laboratory Continuously Supporting Project (grant No. WDZC6142703202216) and the National Natural Science Foundation of China (Grant No. 12272133).

Institutional Review Board Statement

Not applicable.

Informed Consent Statement

Not applicable.

Data Availability Statement

The raw data supporting the conclusions of this article will be made available by the authors on request.

Conflicts of Interest

The authors declare no conflicts of interest.

Nomenclature

Latin characters:
Hinlet height (mm)
hheight of the cavity (mm)
Lcombustion chamber length (mm)
ΔLdistance between the inlet and the cavity (mm)
ltotal length of the cavity (mm)
Bcombustion chamber width (mm)
Pttotal pressure (MPa)
T0total temperature (K)
Tstatic temperature (K)
ttime (ms)
Greek symbols:
βexpanded angle of the combustion chamber (°)
αinclination angle of the back wall of the cavity (°)
ωoxygen consumption rate
σtotal pressure recovery factor
ϕcombustion efficiency
Abbreviations:
ERequivalent ratio
PLIFplanar laser-induced fluorescence
MaMach number
Msmillisecond

References

  1. Li, L.-q.; Huang, W.; Yan, L.; Li, S.-b. Parametric effect on the mixing of the combination of a hydrogen porthole with an air porthole in transverse gaseous injection flow fields. Acta Astronaut. 2017, 139, 435–448. [Google Scholar] [CrossRef]
  2. Huang, W.; Jin, L.; Yan, L.; Tan, J.G. Influence of jet-to-crossflow pressure ratio on nonreacting and reacting processes in a scramjet combustor with backward-facing steps. Int. J. Hydrogen Energy 2014, 39, 21242–21250. [Google Scholar] [CrossRef]
  3. Sam, L.; Idithsaj, P.; Nair, P.P.; Suryan, A.; Narayanan, V. Prospects for scramjet engines in reusable launch applications: A review. Int. J. Hydrogen Energy 2023, 48, 36094–36111. [Google Scholar] [CrossRef]
  4. Curran, E.T. Scramjet Engines: The First Forty Years. J. Propuls. Power 2001, 17, 1138–1148. [Google Scholar] [CrossRef]
  5. Abdulrahman, G.A.; Qasem, N.A.; Imteyaz, B.; Abdallah, A.M.; Habib, M.A. A review of aircraft subsonic and supersonic combustors. Aerosp. Sci. Technol. 2023, 132, 108067. [Google Scholar] [CrossRef]
  6. Yang, Q.; Bao, W.; Chetehouna, K.; Zhang, S.; Gascoin, N. Thermal behavior of an isolator with mode transition inducing back-pressure of a dual-mode scramjet. Chin. J. Aeronaut. 2017, 30, 595–601. [Google Scholar] [CrossRef]
  7. Kumar, S.; Pandey, K.M.; Sharma, K.K. Recent developments in technological innovations in scramjet engines: A review. Mater. Today Proc. 2021, 45, 6874–6881. [Google Scholar] [CrossRef]
  8. Huang, W.; Pourkashanian, M.; Ma, L.; Ingham, D.B.; Luo, S.B.; Wang, Z.G. Investigation on the flameholding mechanisms in supersonic flows: Backward-facing step and cavity flameholder. J. Vis. 2011, 14, 63–74. [Google Scholar] [CrossRef]
  9. Watanabe, J.; Kouchi, T.; Takita, K.; Masuya, G. Characteristics of hydrogen jets in supersonic crossflow: Large-eddy simulation study. J. Propuls. Power 2013, 29, 661–674. [Google Scholar] [CrossRef]
  10. Li, L.; Rong, C.; Hu, S.; Zhang, B.; Liu, H. Intelligent variable strut for combustion performance optimization of a wide-range scramjet engine. Int. J. Hydrogen Energy 2024, 49, 1–13. [Google Scholar] [CrossRef]
  11. Jacobsen, L.S.; Gallimore, S.D.; Schetz, J.A.; O’Brien, W.F.; Goss, L. Improved aerodynamic-ramp injector in supersonic flow. J. Propuls. Power 2003, 19, 663–673. [Google Scholar] [CrossRef]
  12. Lee, S.-H. Mixing augmentation with cooled pylon injection in a scramjet combustor. J. Propuls. Power 2012, 28, 477–485. [Google Scholar] [CrossRef]
  13. Tian, Y.; Yang, S.; Le, J.; Su, T.; Yue, M.; Zhong, F.; Tian, X. Investigation of combustion and flame stabilization modes in a hydrogen fueled scramjet combustor. Int. J. Hydrogen Energy 2016, 41, 19218–19230. [Google Scholar] [CrossRef]
  14. Suneetha, L.; Randive, P.; Pandey, K. Numerical investigation on mixing behavior of fuels inreacting and non-reacting flow condition of a cavity-strut based scramjet combustor. Int. J. Hydrogen Energy 2019, 44, 16718–16734. [Google Scholar] [CrossRef]
  15. Vinogradov, V.A.; Kobigsky, S.A.; Petrov, M.D. Experimental investigation of kerosene fuel combustion in supersonic flow. J. Propuls. Power 1995, 11, 130–134. [Google Scholar] [CrossRef]
  16. Micka, D.J.; Driscoll, J.F. Combustion characteristics of a dual-mode scramjet combustor with cavity flameholder. Proc. Combust. Inst. 2009, 32, 2397–2404. [Google Scholar] [CrossRef]
  17. Hammack, S.D.; Ombrello, T.M. Spatio-temporal evolution of cavity ignition in supersonic flow. Proc. Combust. Inst. 2021, 38, 3845–3852. [Google Scholar] [CrossRef]
  18. Bao, H.; Zhou, J.; Pan, Y. Effect of cavity configuration on kerosene spark ignition in a scramjet combustor at Ma 4.5 flight condition. Acta Astronaut. 2015, 117, 368–375. [Google Scholar] [CrossRef]
  19. Lee, K.; Kang, S.; Lee, Y.; Cha, B.; Choi, B. Effects of fuel injectors and cavity configurations on supersonic combustion. J. Propuls. Power 2013, 29, 1052–1063. [Google Scholar] [CrossRef]
  20. Kannaiyan, K. Computational study of the effect of cavity geometry on the supersonic mixing and combustion of ethylene. J. Comput. Sci. 2020, 47, 101243. [Google Scholar] [CrossRef]
  21. Ma, G.; Sun, M.; Li, F.; Yang, Y.; Huang, Y.; Wang, H. Effect of fuel injection distance and cavity depth on the mixing and combustion characteristics of a scramjet combustor with a rear-wall-expansion cavity. Acta Astronaut. 2021, 182, 432–445. [Google Scholar] [CrossRef]
  22. Landsberg, W.O.; Curran, D.; Veeraragavan, A. Experimental flameholding performance of a scramjet cavity with an inclined front wall. Aerosp. Sci. Technol. 2022, 126, 107622. [Google Scholar] [CrossRef]
  23. Wang, T.; Li, G.; Yang, Y.; Wang, Z.; Cai, Z.; Sun, M. Combustion modes periodical transition in a hydrogen-fueled scramjet combustor with rear-wall-expansion cavity flameholder. Int. J. Hydrogen Energy 2020, 45, 3209–3215. [Google Scholar] [CrossRef]
  24. Takeno, K.; Kido, H.; Takeda, H. Flame stabilisation mechanism for under-expanded hydrogen Jets. Fire 2024, 7, 48. [Google Scholar] [CrossRef]
  25. Baranyshyn, Y.; Kuzmitski, V.; Penyazkov, O. Ignition delay and reaction time measurements of hydrogen–air mixtures at high temperatures. Fire 2024, 7, 43. [Google Scholar] [CrossRef]
  26. Koo, H.; Raman, V.; Varghese, P.L. Direct numerical simulation of supersonic combustion with thermal nonequilibrium. Proc. Combust. Inst. 2015, 35, 2145–2153. [Google Scholar] [CrossRef]
  27. Ao, Y.; Wu, K.; Lu, H.; Ji, F.; Fan, X. Combustion dynamics of high Mach number scramjet under different inflow thermal nonequilibrium conditions. Acta Astronaut. 2023, 208, 281–295. [Google Scholar] [CrossRef]
  28. Li, C.; Xia, Z.; Ma, L.; Chen, B.; Feng, Y.; Zhang, J.; Duan, Y. Performance analysis on the specific impulse and specific thrust of scramjet with a quasi-one-dimensional model. Energy 2023, 267, 126400. [Google Scholar] [CrossRef]
  29. Choubey, G.; Solanki, M.; Bhatt, T.; Kshitij, G.; Yuvarajan, D.; Huang, W. Numerical investigation on a typical scramjet combustor using cavity floor H2 fuel injection strategy. Acta Astronaut. 2023, 202, 373–385. [Google Scholar] [CrossRef]
  30. Yuan, M.; Wang, P.; Zhang, Y.; Tian, Y.; Chen, S.; Cheng, K. Assessing the effect of air-throttling on ignition dynamics in a hydrogen-fueled scramjet under various fuel-injection strategies using LES. Acta Astronaut. 2023, 212, 111–122. [Google Scholar] [CrossRef]
  31. Génin, F.; Menon, S. Simulation of turbulent mixing behind a strut injector in supersonic flow. AIAA J. 2010, 48, 526–539. [Google Scholar] [CrossRef]
  32. Gicquel, L.Y.; Staffelbach, G.; Poinsot, T. Large eddy simulations of gaseous flames in gas turbine combustion chambers. Prog. Energy Combust. Sci. 2012, 38, 782–817. [Google Scholar] [CrossRef]
  33. Gottlieb; Shu, C.-W. Total variation diminishing Runge-Kutta schemes. Math. Comput. 1998, 67, 73–85. [Google Scholar] [CrossRef]
  34. Horiuti, K. Large eddy simulation of turbulent channel flow by one-equation modeling. J. Phys. Soc. Jpn. 1985, 54, 2855–2865. [Google Scholar] [CrossRef]
  35. Pope, S.B. Ten questions concerning the large-eddy simulation of turbulent flows. N. J. Phys. 2004, 6, 35. [Google Scholar] [CrossRef]
  36. Waidmann, W. Experimental Investigation of the Combustion Process in a Supersonic Combustion Ramjet (SCRAMJET) Combustion Chamber; DGLR-Ahrestaqung: Erlangen, Germany, 1994. [Google Scholar]
Figure 1. Schematic diagram of the combustion chamber structure.
Fire 07 00176 g001
Figure 2. Schematic diagram of the combustion chamber.
Fire 07 00176 g002
Figure 3. Grid independence validation.
Fire 07 00176 g003
Figure 4. Distribution of M(x, t) at different times.
Fire 07 00176 g004
Figure 5. (a) Schematic of the overall combustion chamber grid; (b) grid schematic of the cavity; (c) grids of the injection nozzle.
Fire 07 00176 g005
Figure 6. (a) Schematic of the DLR combustion chamber structure; (b) a comparison of the pressure distribution on the lower wall of the combustion chamber under cold-flow conditions.
Fire 07 00176 g006
Figure 7. (a) Average velocity at x = 78 mm, (b) average temperature at x = 233 mm.
Fire 07 00176 g007
Figure 8. Distributions of OH radical mass fraction in the combustion chambers of cases with different equivalence ratios at t = 5.2 ms.
Fire 07 00176 g008
Figure 9. (a) The pressure distribution in the combustion chamber under different equivalence ratios at t = 5.2 ms; (b) the Mach number distribution in the combustion chamber under different equivalence ratios at t = 5.2 ms.
Fire 07 00176 g009
Figure 10. (a) The change in combustion efficiency at the exit of the combustion chamber over time with different equivalence ratios; (b) the variation in the total pressure recovery factor at the exit of the combustion chamber over time with different equivalence ratios; (c) the distribution of pressure along the x-direction at the y = 25 mm location within the combustion chamber at t = 8.0 ms for different equivalence ratios, (d) the averaged total pressure on the cross-sections of the combustion chamber along the streamwise direction under different equivalence ratios (time-averaged for the period of 0–14 ms).
Fire 07 00176 g010
Figure 11. The change in the HO2 mole fraction with time in the combustion chamber under different injection timings.
Fire 07 00176 g011
Figure 12. (a) The distribution of pressure over time in the combustion chamber of Case 5; (b) the Mach number distribution over time in the combustion chamber of Case 5.
Fire 07 00176 g012
Figure 13. (a) The change in combustion efficiency at the exit of the combustion chamber over time with different injection timings; (b) the variation in the total pressure recovery factor at the exit of the combustion chamber over time with different injection timings; (c) the distribution of pressure along the x-direction at the y = 25 mm location within the combustion chamber at t = 8.0 ms for different injection timings.
Fire 07 00176 g013
Figure 14. At t = 8.0 ms, the OH mass fraction for different injection position cases.
Fire 07 00176 g014
Figure 15. The density variation in the Case 6 combustion chamber over time.
Fire 07 00176 g015
Figure 16. (a) The change in combustion efficiency at the exit of the combustion chamber over time with different injection positions; (b) the variation in the total pressure recovery factor at the exit of the combustion chamber over time with different injection positions; (c) the distribution of pressure along the x-direction at the y = 25 mm location within the combustion chamber at t = 8.0 ms for different injection positions.
Fire 07 00176 g016
Figure 17. At t = 8.0 ms, the distribution of HO2 at cross-sections of z = 0.5 mm and 5.0 mm under different injection pressures.
Fire 07 00176 g017
Figure 18. (a) The change in combustion efficiency at the exit of the combustion chamber over time with different injection pressures; (b) the variation in the total pressure recovery factor at the exit of the combustion chamber over time with different injection pressures; (c) the distribution of pressure along the x-direction at the y = 25 mm location within the combustion chamber at t = 8.0 ms for different injection pressures.
Fire 07 00176 g018
Table 1. Parameters for the different cases.
CaseInjection
Pressure/MPa
Global Equivalent RatioNozzle
Location
Injection
Timing
12.00.35A2, C1Simultaneous injection
22.00.52A1, C1, C3Simultaneous injection
32.00.70A1, A2, C1, C3Simultaneous injection
42.00.35A2, C1A2 delayed injection by 2 ms
52.00.35A2, C1C1 delayed injection by 2 ms
62.00.35C3, C1Simultaneous injection
72.00.35A1, C1Simultaneous injection
8PA2 = 3.0, PC1 = 1.00.35A2, C1Simultaneous injection
9PA2 = 1.0, PC1 = 3.00.35A2, C1Simultaneous injection
Table 2. Related parameters of hydrogen (O2 + 3.76N2) combustion mechanism.
NumberReactionA (mole·cm·sec·k)nE (cal·mole−1)
1H2 + O2 = HO2 + H1.00 × 10140.0056,034.7
2H + O2 = OH + O2.60 × 10140.0016,810.4
3H2 + O = OH + H1.80 × 10101.008905.5
4H2 + OH = H + H2O2.20 × 10130.005153.2
5OH + OH = O + H2O6.30 × 10120.001090.7
6H + OH + M = H2O + M2.20 × 10222.000.0
H2O/6.0
7H + H + M = H2 + M6.40 × 10171.000.0
H2/2.0/H2O/6.0
8H + O + M = OH + M6.00 × 10160.600.0
H2O/5.0
9H + O2 + M = HO2 + M2.10 × 10150.00−1000.6
H2/2.0/H2O/16.0
10O + O + M = O2 + M6.00 × 10130.00−1801.1
11HO2 + H = OH + OH1.40 × 10140.001080.7
12HO2 + H = H2O + O1.00 × 10130.001080.7
13HO2 + O = O2 + OH1.50 × 10130.00950.6
14HO2 + OH = H2O + O28.00 × 10120.000.0
15HO2 + HO2 = H2O2 + O22.00 × 10120.000.0
16H + H2O2 = H2 + H2O1.40 × 10120.003602.2
17O + H2O2 = OH + HO21.40 × 10130.006404.0
18H2O2 + OH = H2O + HO26.10 × 10120.001430.9
19H2O2 + M = OH + OH + M1.20 × 10170.0045,528.2
H2O/15.0
Disclaimer/Publisher’s Note: The statements, opinions and data contained in all publications are solely those of the individual author(s) and contributor(s) and not of MDPI and/or the editor(s). MDPI and/or the editor(s) disclaim responsibility for any injury to people or property resulting from any ideas, methods, instructions or products referred to in the content.

