Article

Effect of Interlayer Materials on Fire Performance of Laminated Glass Used in High-Rise Building: Cone Calorimeter Testing

School of Engineering, Design and Built Environment, Western Sydney University, Penrith, NSW 2751, Australia
*
Author to whom correspondence should be addressed.
Submission received: 29 January 2023 / Revised: 17 February 2023 / Accepted: 21 February 2023 / Published: 22 February 2023

Abstract

:
Laminated glass is prominently used nowadays as building construction material in the façade and architectural glazing of high-rise buildings. On the other hand, the fire safety of the high-rise building with laminated glass is also receiving more attention from the fire safety regulatory authorities and researchers due to recent fire incidents. Different interlayer polymeric materials are used in modern laminated glass to prevent the breakage of the glass façade, which can also increase the fire risk through a lower ignition time, and higher heat release and smoke production. Therefore, further research is required to understand the fire behaviour of laminated glass. In this study, the fire performance of the laminated glass has been investigated using cone calorimeter testing and the effect of different parameters such as glass thickness (6, 10, 12 mm), interlayer materials (PVB, SGP and EVA) and heat flux (25, 50 and 75 kW/m2) on the fire behaviour of laminated glass has been studied. It is found that the glass thickness, interlayer material and heat flux can significantly influence the reaction-to-fire properties such as peak heat release rate (pHRR), total heat release, time to ignition, and smoke production of laminated glass. In addition, total smoke production (TSP) is also very high for PVB (3.146 m2) and SGP (3.898 m2) laminated glass compared to EVA (0.401 m2) laminated glass and it is affected by these parameters. Finally, a simplified equation is developed to predict the pHRR of laminated glass by correlating the mass loss and external heat flux.

1. Introduction

Glass façades have recently been used more frequently in modern high-rise buildings owing to their high artistic, durable, and environmentally friendly qualities [1]. However, when exposed to fire, their breakage and fallout may create a new vent, allowing fresh air entrainment and fire spread, potentially greatly accelerating the development of a compartment fire. When a fire spreads from an interior space to exterior cladding, the glass façade’s fire performance is crucial [2]. Modern architecture uses laminated glass instead of monolithic glass due to its limited brittleness. Laminated glass is made up of two or more monolithic layers joined together through polymer interlayers. The most common interlayers are ethylene-vinyl acetate (EVA) and polyvinyl butyral (PVB) [3]. The polymer interlayer allows the element to deform and redistribute the load through the glass panes, which helps to avoid crack propagation and sudden failure of laminated glass [1,2,3]. This makes laminated glass safer in construction industry applications compared to monolithic glass. In addition, laminated glasses have the ability to reduce the heat transfer, leading to more comfort inside the building. However, the presence of a certain amount of polymer material used as an interlayer in laminated glass makes it combustible, depending on the volume of glass and interlayer material ratio [2], which need to be investigated to identify the fire hazard of laminated glass with different interlayer materials.
To understand the behaviour of laminated glass, many studies have been carried out [4,5,6,7,8,9,10,11,12,13]. The mechanism of thermal cracking in glass structures is investigated in [4,5,6]. It was determined that the thermal gradient is the primary cause of glass breakage in a fire because thermal stress develops between the heated surface and the insulated cooler edge [5]. Harada et al. [7] used a propane radiation panel to test two types of glass (treated float glass and wired glass) under different heat flux and lateral restraint of the glass and measured the time to initial crack and fallout, temperatures and thermal stress. Based on the test data, they developed a simple model to predict the glass cracking and/or breaking. It was concluded that thermal stress varies from 10 to 25 MPa depending on the type of glass and it does not have any effect of the restraint of the glass on crack development. Shields [8,9] conducted full-scale experiments in an ISO 9705 room to investigate the differences in the fire behaviour of single glazing with different fire locations. Wang et al. [10] investigated the effects of thermal breakage on the fire response of single, insulated, and laminated glazing. Their study reported that insulated and laminated glass could last longer than single glass. Debuyser et al. [1] exposed laminated and monolithic glass panes to heat fluxes ranging from 10 to 12 kW/m2 for around 50 min. The laminated glass panes consisted of three layers of glass bonded with two layers of PVB or SentryGlas interlayer. No ignition or flaming was observed for the seven laminated glass specimens used in their study. However, the heat fluxes used were low compared to what would be expected in a fire or standard tests. More recently, Wang and Hu [6] investigated the performance of laminated glass under fire conditions. They exposed two 600 × 600 mm laminated glass specimens to the thermal exposure. The external heat flux was between 7.7 and 25 kW/m2. The laminated glass panes consisted of two layers of 6 mm thick glass with a 0.38 mm thick PVB inter-layer. The study recommended the 0.38 mm PVB interlayer and 3 mm glass-pane considering the relatively low construction cost with reasonable fire performance.
Despite the widespread use of non-fire-resistant laminated glass, there is very little information on its fire performance, particularly in reaction-to-fire properties (heat release rate, peak heat release rate, total heat release, mass loss rate) and smoke production rate. Furthermore, most existing research has been conducted in a standard furnace, which provides limited insight into the reaction-to-fire properties and smoke production rate [11]. However, a cone calorimeter, which is useful for analysing smoke production and toxicity, can be used to analyse the reaction-to-fire properties [12,13]. Therefore, further research is required to understand the reaction-to-fire properties and smoke productions of laminated glass using a cone calorimeter.
To address the abovementioned research gaps, the reaction-to-fire properties of the laminated glass have been investigated in the present study using a cone calorimeter. The main parameters considered in this study are glass pane thickness, interlayer materials, and external heat flux. The current study analyses and discusses the impact of those parameters on the reaction-to-fire properties of laminated glass. In addition, the smoke hazard and fire hazard assessment have been discussed in this study. Finally, a simplified formula is provided to predict the peak heat release rate (pHRR) of laminated glass. The outcomes of this study will provide a better understanding of the reaction-to-fire properties and smoke hazards, which will be helpful to train fire safety engineers in designing fire-safe buildings using laminated glass.

2. Materials and Experimental Set-Up

2.1. Materials

In this research study, laminated glasses with different interlayers were purchased from the local market in Australia, which are grade A laminated safety glasses. Laminated glass is made using two glass panes bonded together with a layered material, as shown in Figure 1. The glass panes considered in this study were 3, 5 and 6 mm thick and tested this parameter to observe the effect of the glass pane’s thickness on the reaction-fire properties. Three interlayer materials (PVB, SGP and EVA) used in different laminated glasses in building applications were considered in this study. PVB (polyvinyl butyral) is an amorphous polymer that is composed of three monomers such as vinyl butyral (76–80 wt.%), vinyl alcohol (18 to 22 wt.%) and vinyl acetate (1 to 2 wt.%) [3]. Plasticisers have been incorporated into PVB to improve mechanical properties without affecting the adhesion and optical properties. SGP (SentryGlas® Plus) is an ionomer containing a hydrocarbon backbone with partially or entirely neutralised pendant acid groups. It is stiffer and shows less sensitivity to working temperature than PVB. EVA (ethylene-vinyl acetate) consists of ethylene (10 to 40 wt.%), vinyl acetate (32 to 34 wt.%) and some specific additives [3]. The density and thermal conductivity of the interlayer materials are presented in Table 1.

2.2. Test Specimens

A total of 21 samples were considered in this experimental study. The details of each sample are given in Table 2. The parameters that were studied in this study are (1) glass pane thickness (3, 5 and 6 mm); (2) external heat flux (25, 50 and 75 kW/m2); (3) interlayer material types (PVA, SGP, EVA). Three samples were considered to check the repeatability of each parameter. The last digit of each sample represents the repeating test number for the same configuration. For example, in specimen S6PVB50-1, S represents the sample, 6 represents the nominal thickness value of glass, PVB represents the polymeric interlayer type such as PVB, and the next two digits represent the heat flux considered during testing.
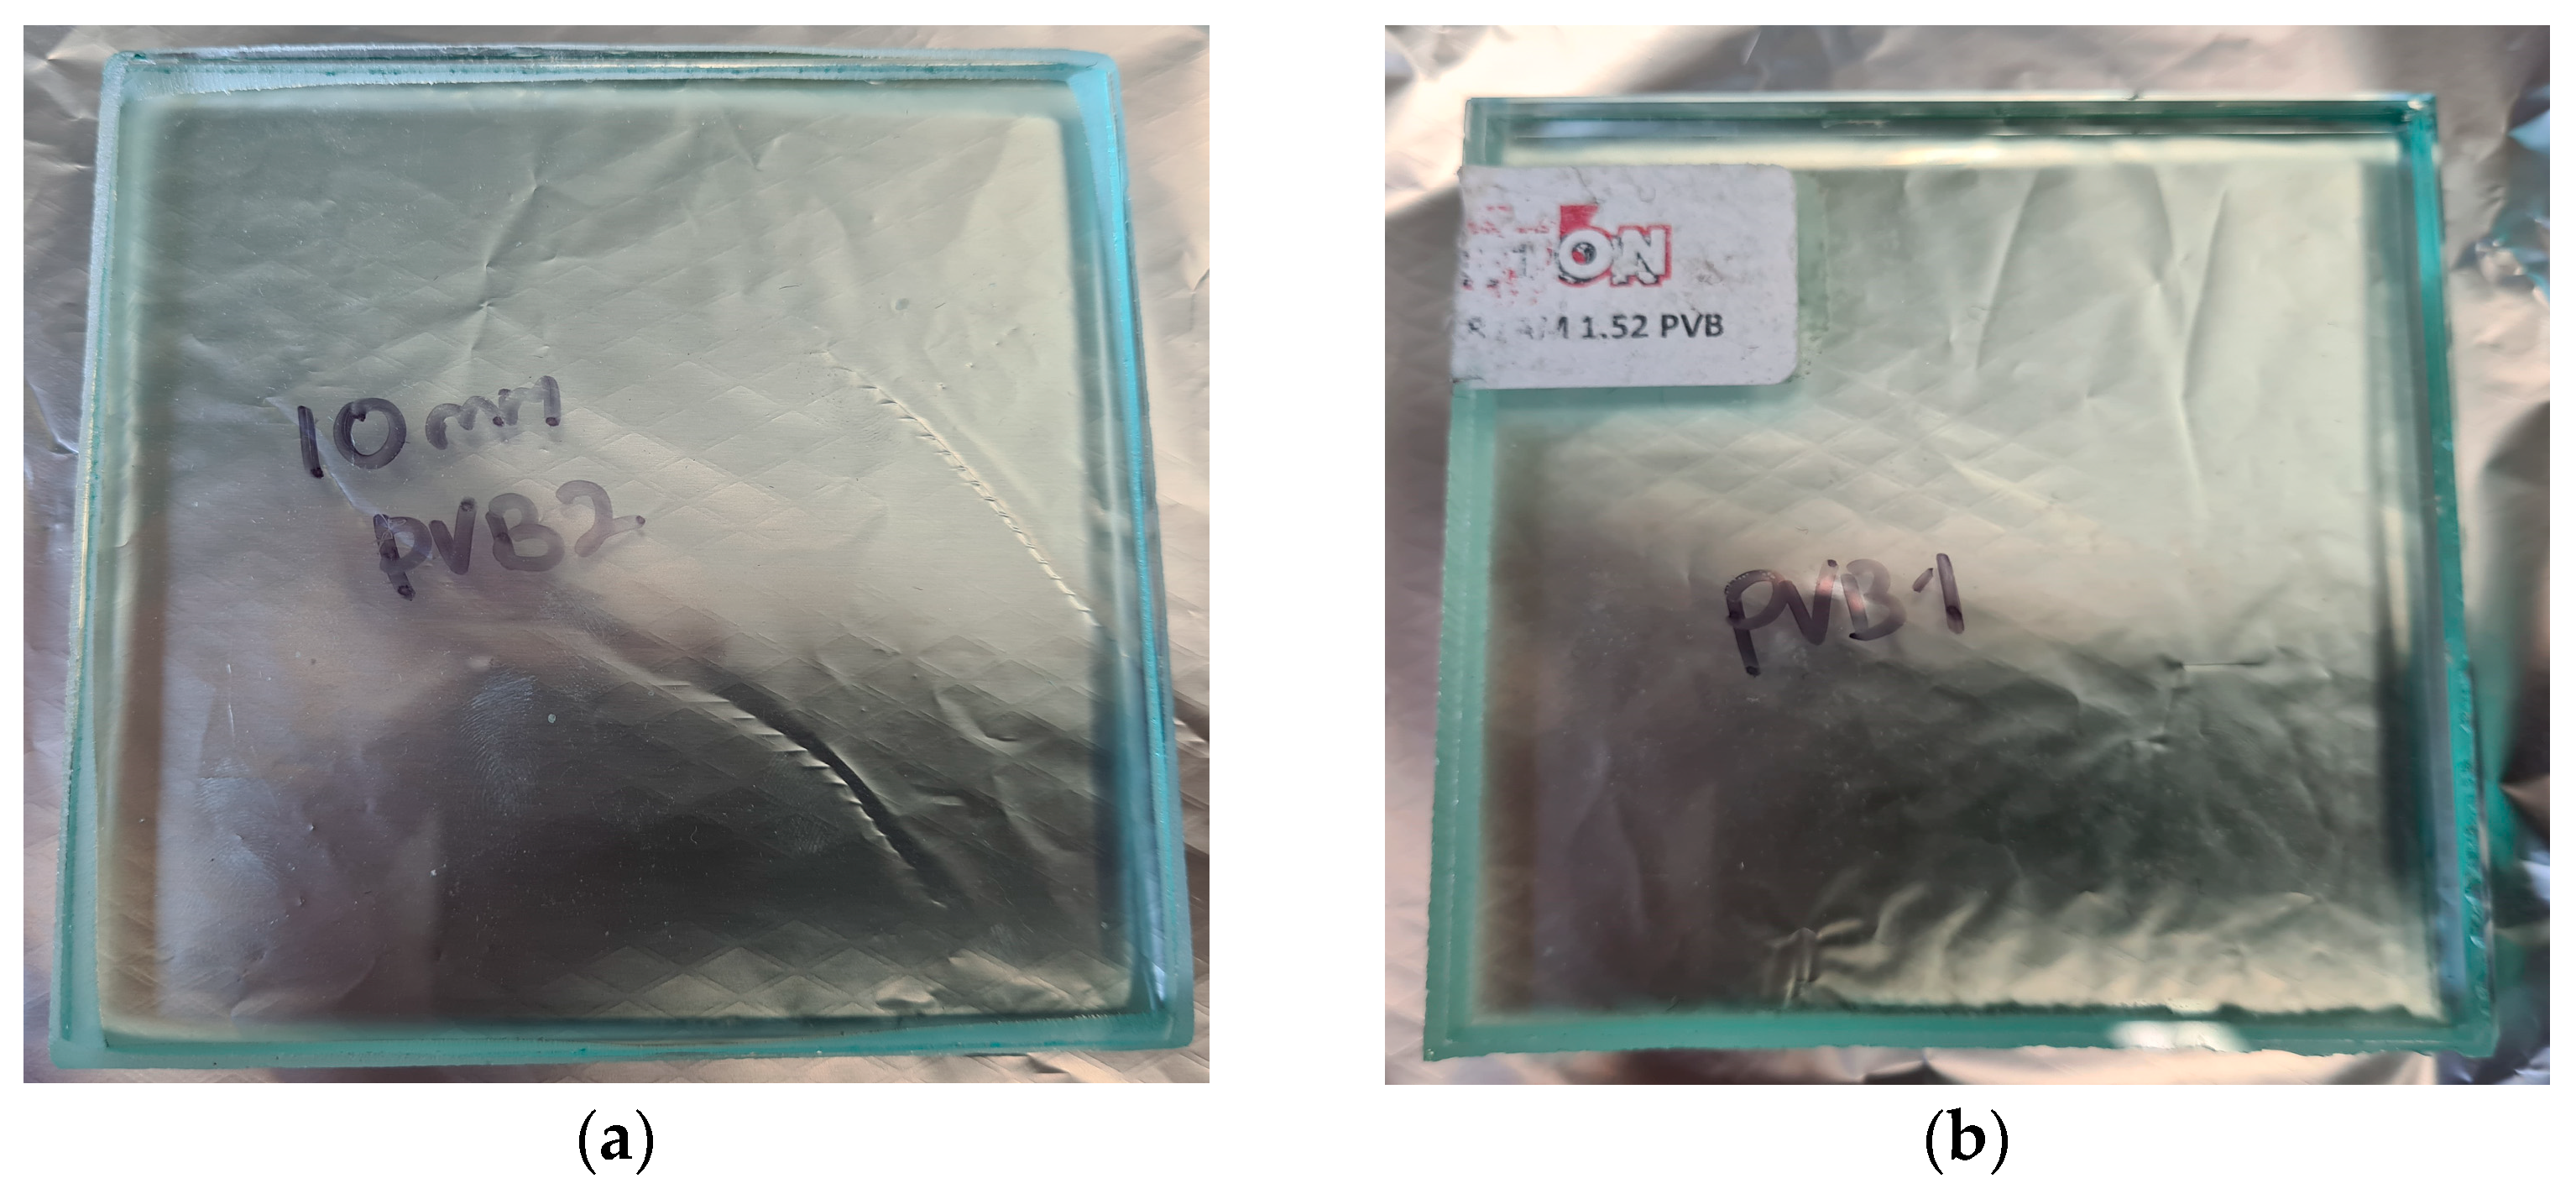
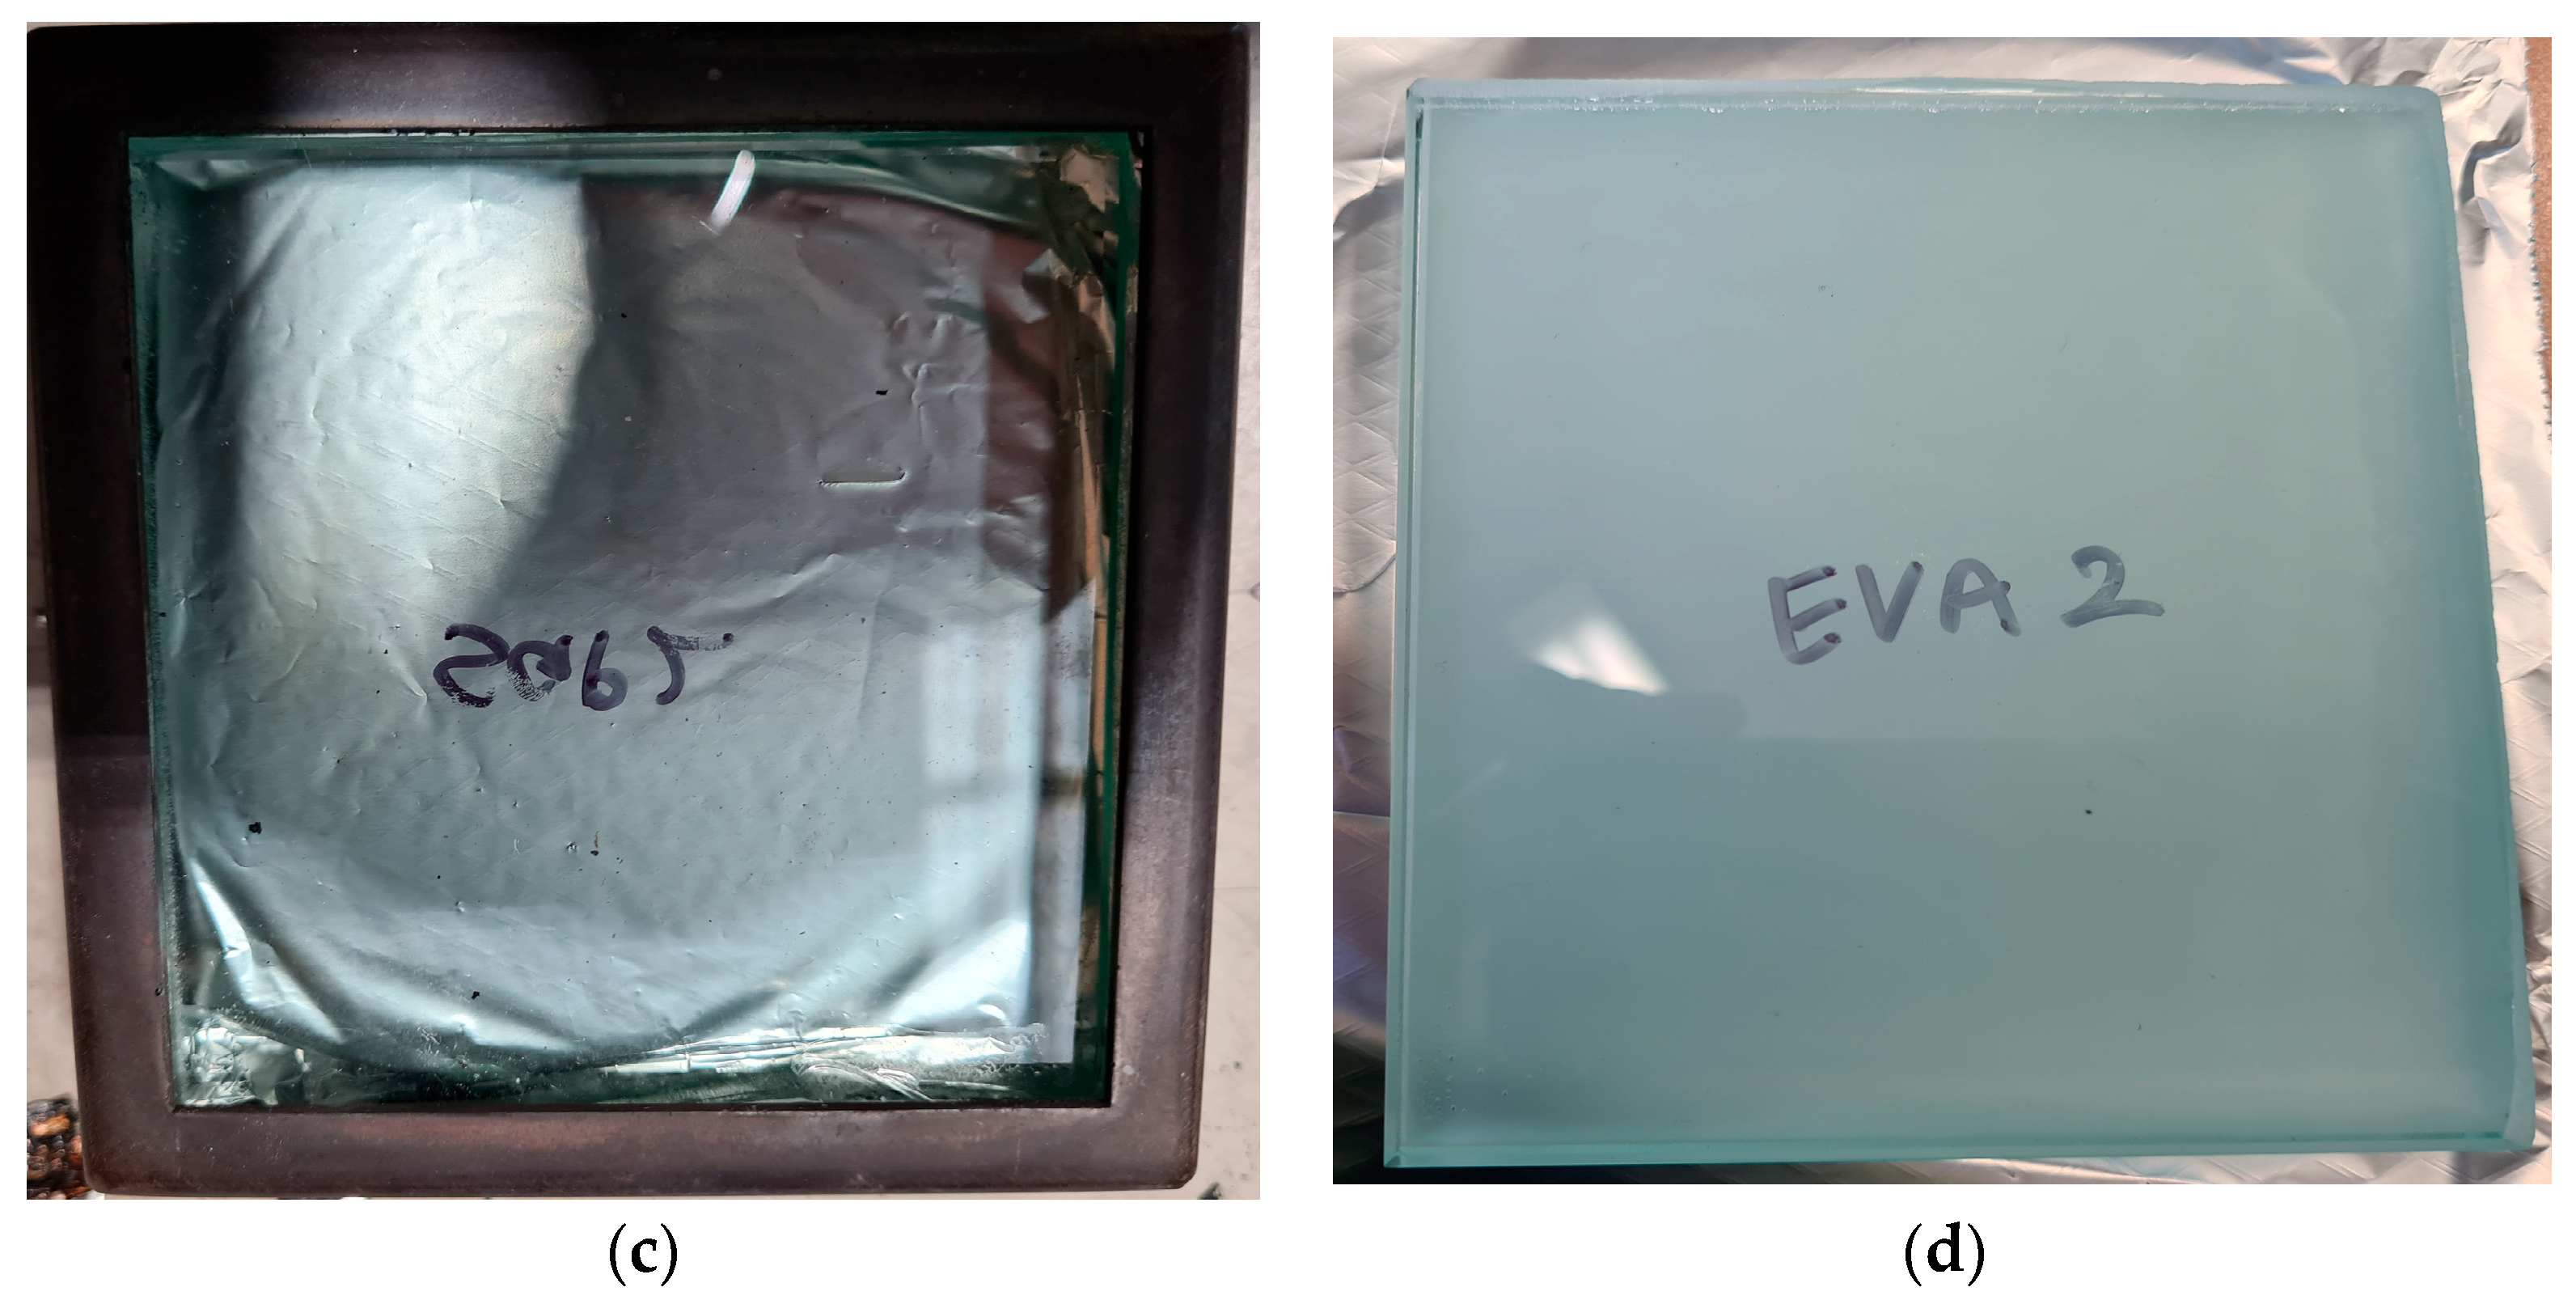
The first three specimens (S6PVB50-1, S6PVB50-2, S6PVB50-3) were tested at a heat flux of 50 kW/m2 for the laminated glass with a 3 mm glass pane and 0.38 PVB interlayer. With the same interlayer material (0.38 PVB) and heat flux (50 kW/m2), another three specimens (S10PVB50-1, S10PVB50-2, S10PVB50-3) were tested to investigate the effect of glass pane thickness (3 mm ad 5 m) on the fire properties. The effect of different heat fluxes (25, 50 and 75 kW/m2) was also studied, which are labelled as S10PVB25, S10PVB50 and S10PVB75 for 25, 50 and 75 kW/m2 heat flux, respectively, as shown in Table 2. Another nine specimens (S12PVB50-1, S12PVB50-2, S12PVB50-3, S12SGP50-1, S12SGP50-2, S12SGP50-3, S12EVA50-1, S12EVA50-2 and S12EVA50-3) were tested to analyse the effect of different interlayer materials (PVB, SGP and EVA). The heat flux (50 kW/m2), interlay thickness (1.52 mm), and glass pane thickness (6 mm) were the same for all nine specimens. The tested specimens of each category are shown in Figure 2.

2.3. Sample Testing Using a Cone Calorimeter

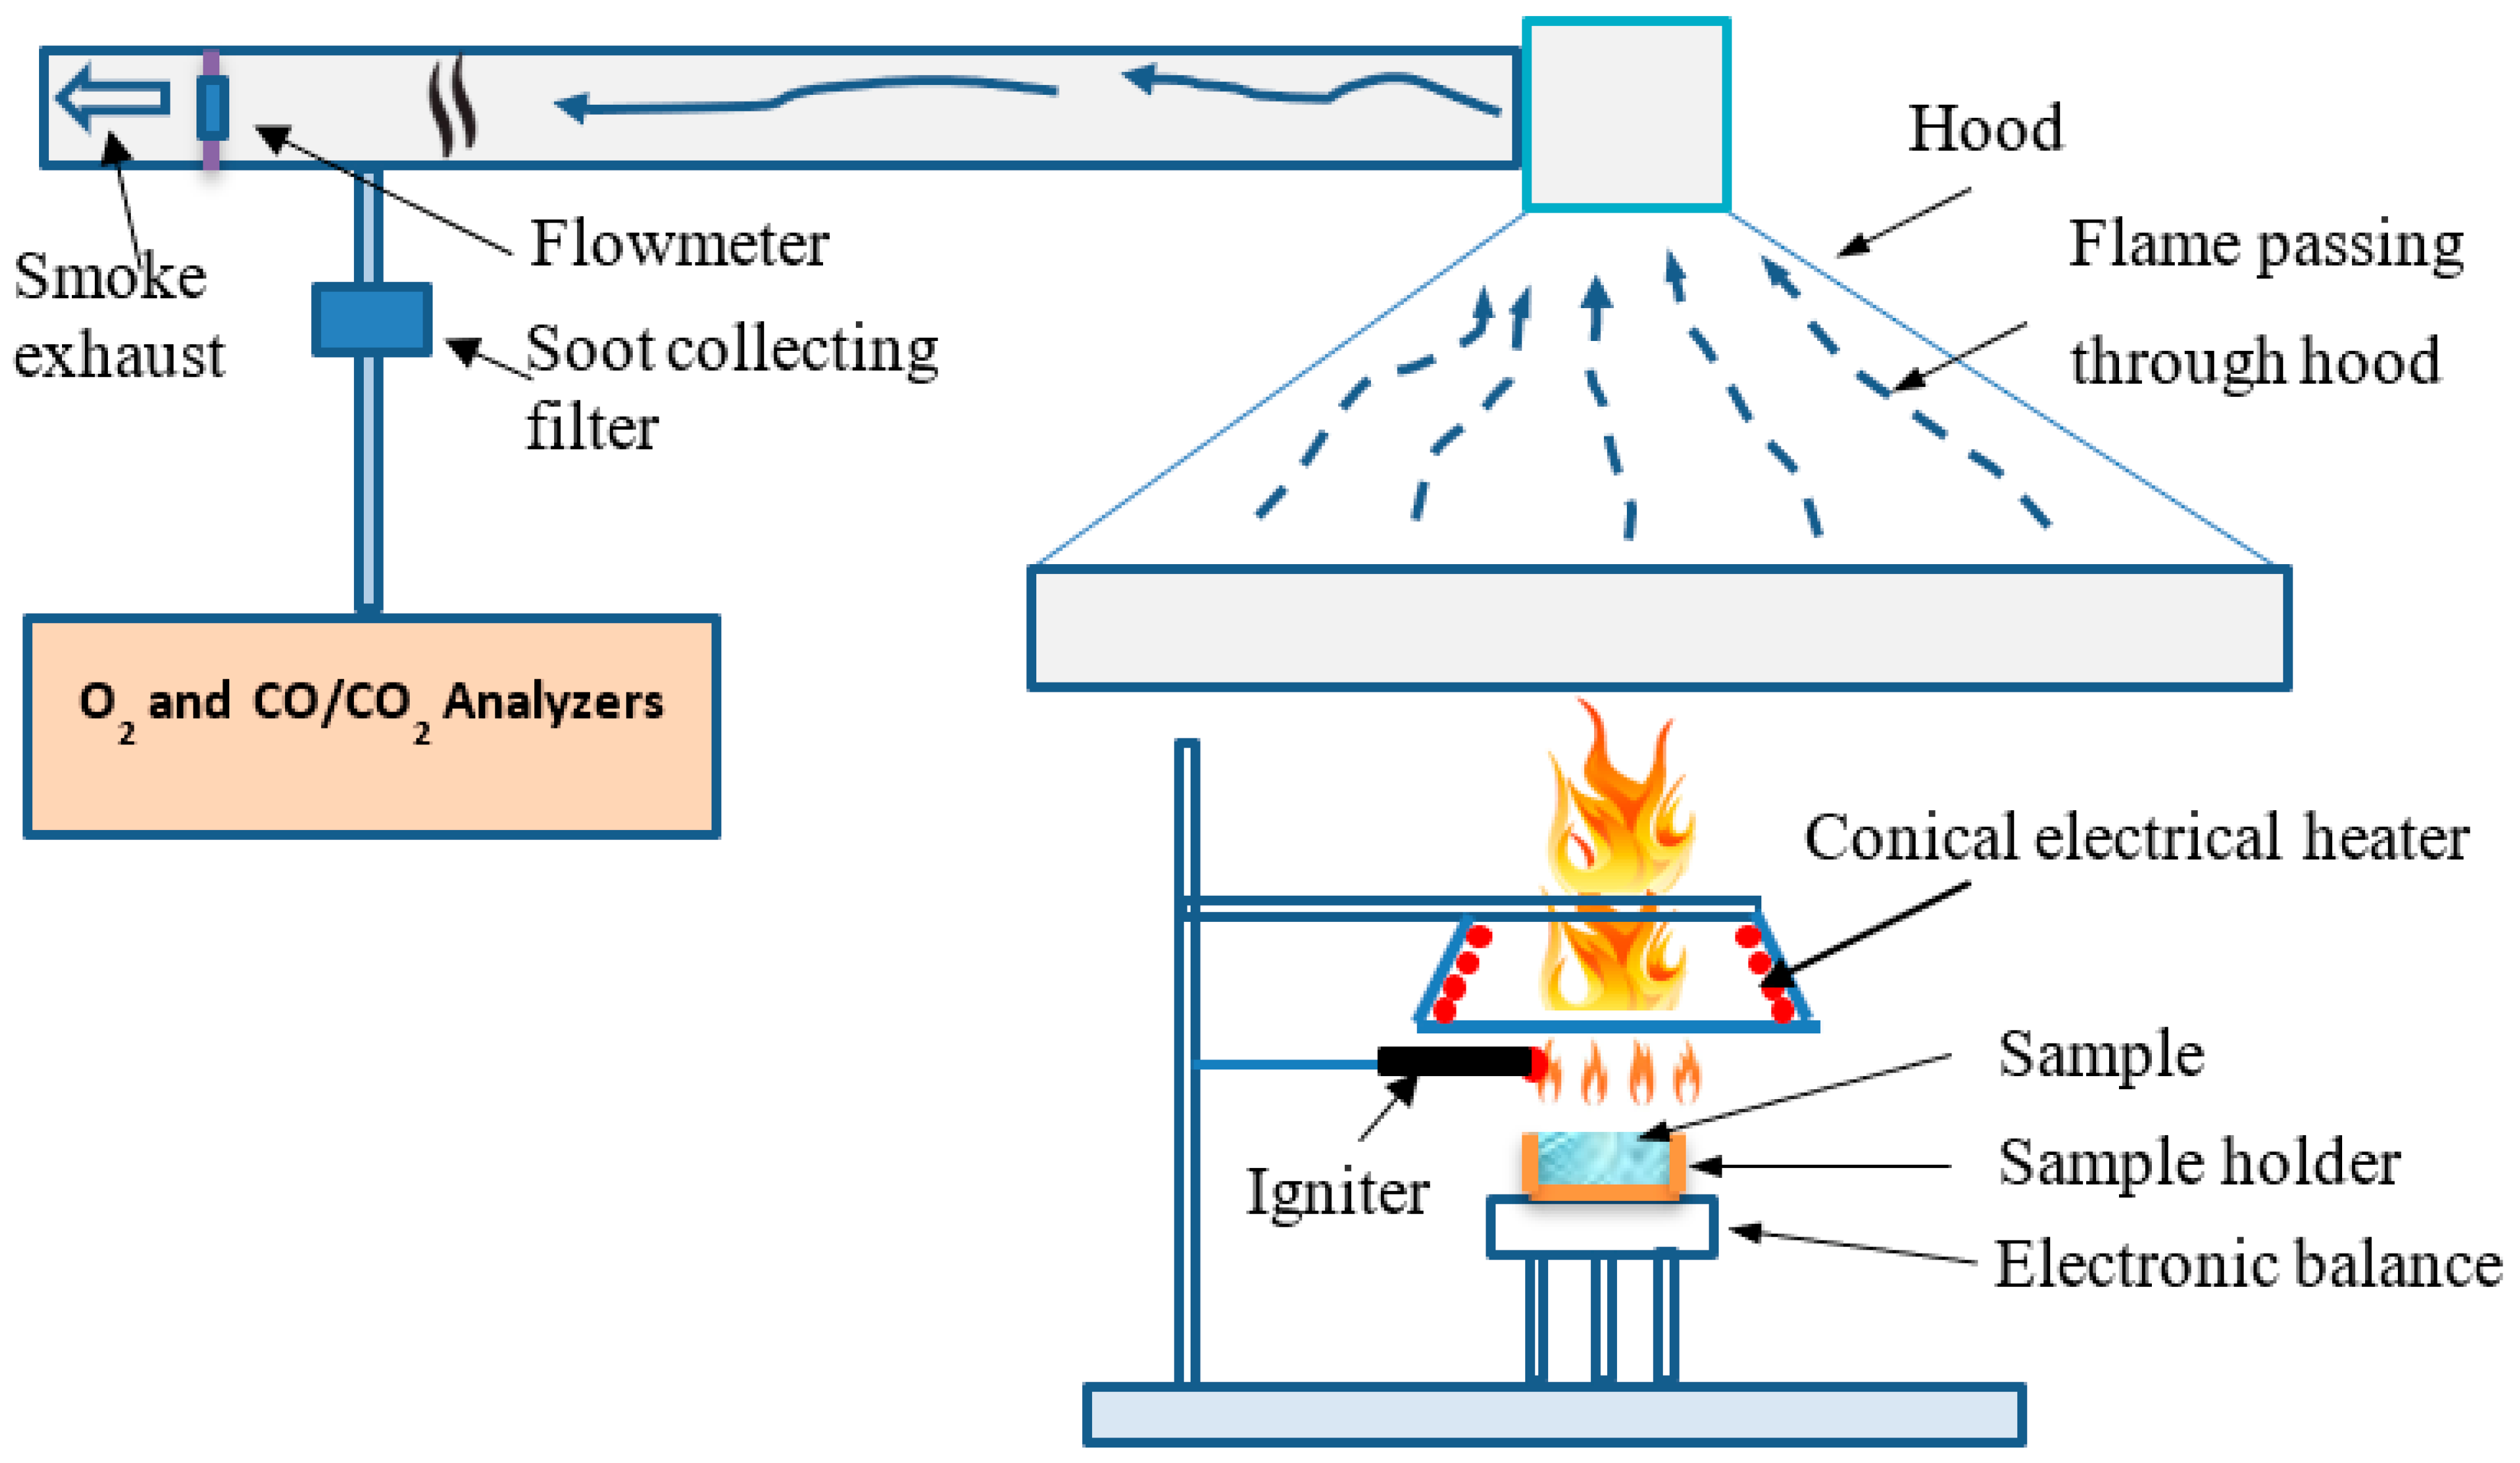
All laminated glass specimens were tested horizontally using a cone calorimeter following AS/NZS 3837. AS/NZS 3837 is the method of testing for heat and smoke release rates of materials and products using an oxygen consumption calorimetry, and it is based on the ISO 5660-1 test standard (Standards Online 2012). In this study, the back and the side of the samples were covered with aluminium foil and then kept over a ceramic fibre backing pad to avoid heat loss [14]. The distance between the cone heater and the top surface of the sample was kept at 25 mm. Similar to other works [15], a spark igniter located 13 mm above the centre of the specimen was used to pilot the ignition. Laminated glass samples were placed horizontally on the specimen holder. The cone heater consists of 5 kW electrical heating element, and the temperature of the heater is controlled by three type k thermocouples inserted inspires. It is worth mentioning that the target heat flux, such as 25 kW/m2, 50 kW/m2 and 75 kW/m2, is kept constant before starting any test. The test data, such as heat release rate (HRR), smoke production rate (SPR) and carbon monoxide production (COP), were recorded at 10-second intervals throughout each test. A typical cone calorimeter horizontal test set-up for a laminated glass specimen is shown in Figure 3.

2.4. Data Measurement Details

In this study, the heat release rate (HRR), total heat release (THR), effective heat of combustion (EHC), mass loss rate (MLR), smoke production (TSP) and specific extinction area (SEA) are measured. The HRR was calculated according to oxygen depletion using Equation (1) [16].
HRR = 13.1 × 10 3 × 1.10 C × Δ P T e × ( 0.2095 X o 2 ) ( 1.105 1.5 X o 2 )
where C is the orifice flow meter calibration constant, ∆P is the pressure drop at the orifice meter, and Te is the absolute temperature of the gas at the orifice meter [16]. The pHRR was determined by calculating the mean values for each sample and for each heat flux. The mass loss rate (MLR) was also measured during each test, and the average values were calculated. Total heat release (THR) was measured while testing (Equation (2)). Effective heat of combustion (EHC) can be calculated with Equation (3).
THR = 0 HRR ( t ) d t
EHC = HRR MLR
pHRR = pMLR × EHC

3. Results and Discussion

For studying the flammability of laminated glass materials, pHRR and time to ignition parameters are the key parameters used to assess fire safety [17,18]. These parameters are also helpful for correlating the full-scale and bench-scale tests.

3.1. Effect of Glass Pane Thickness

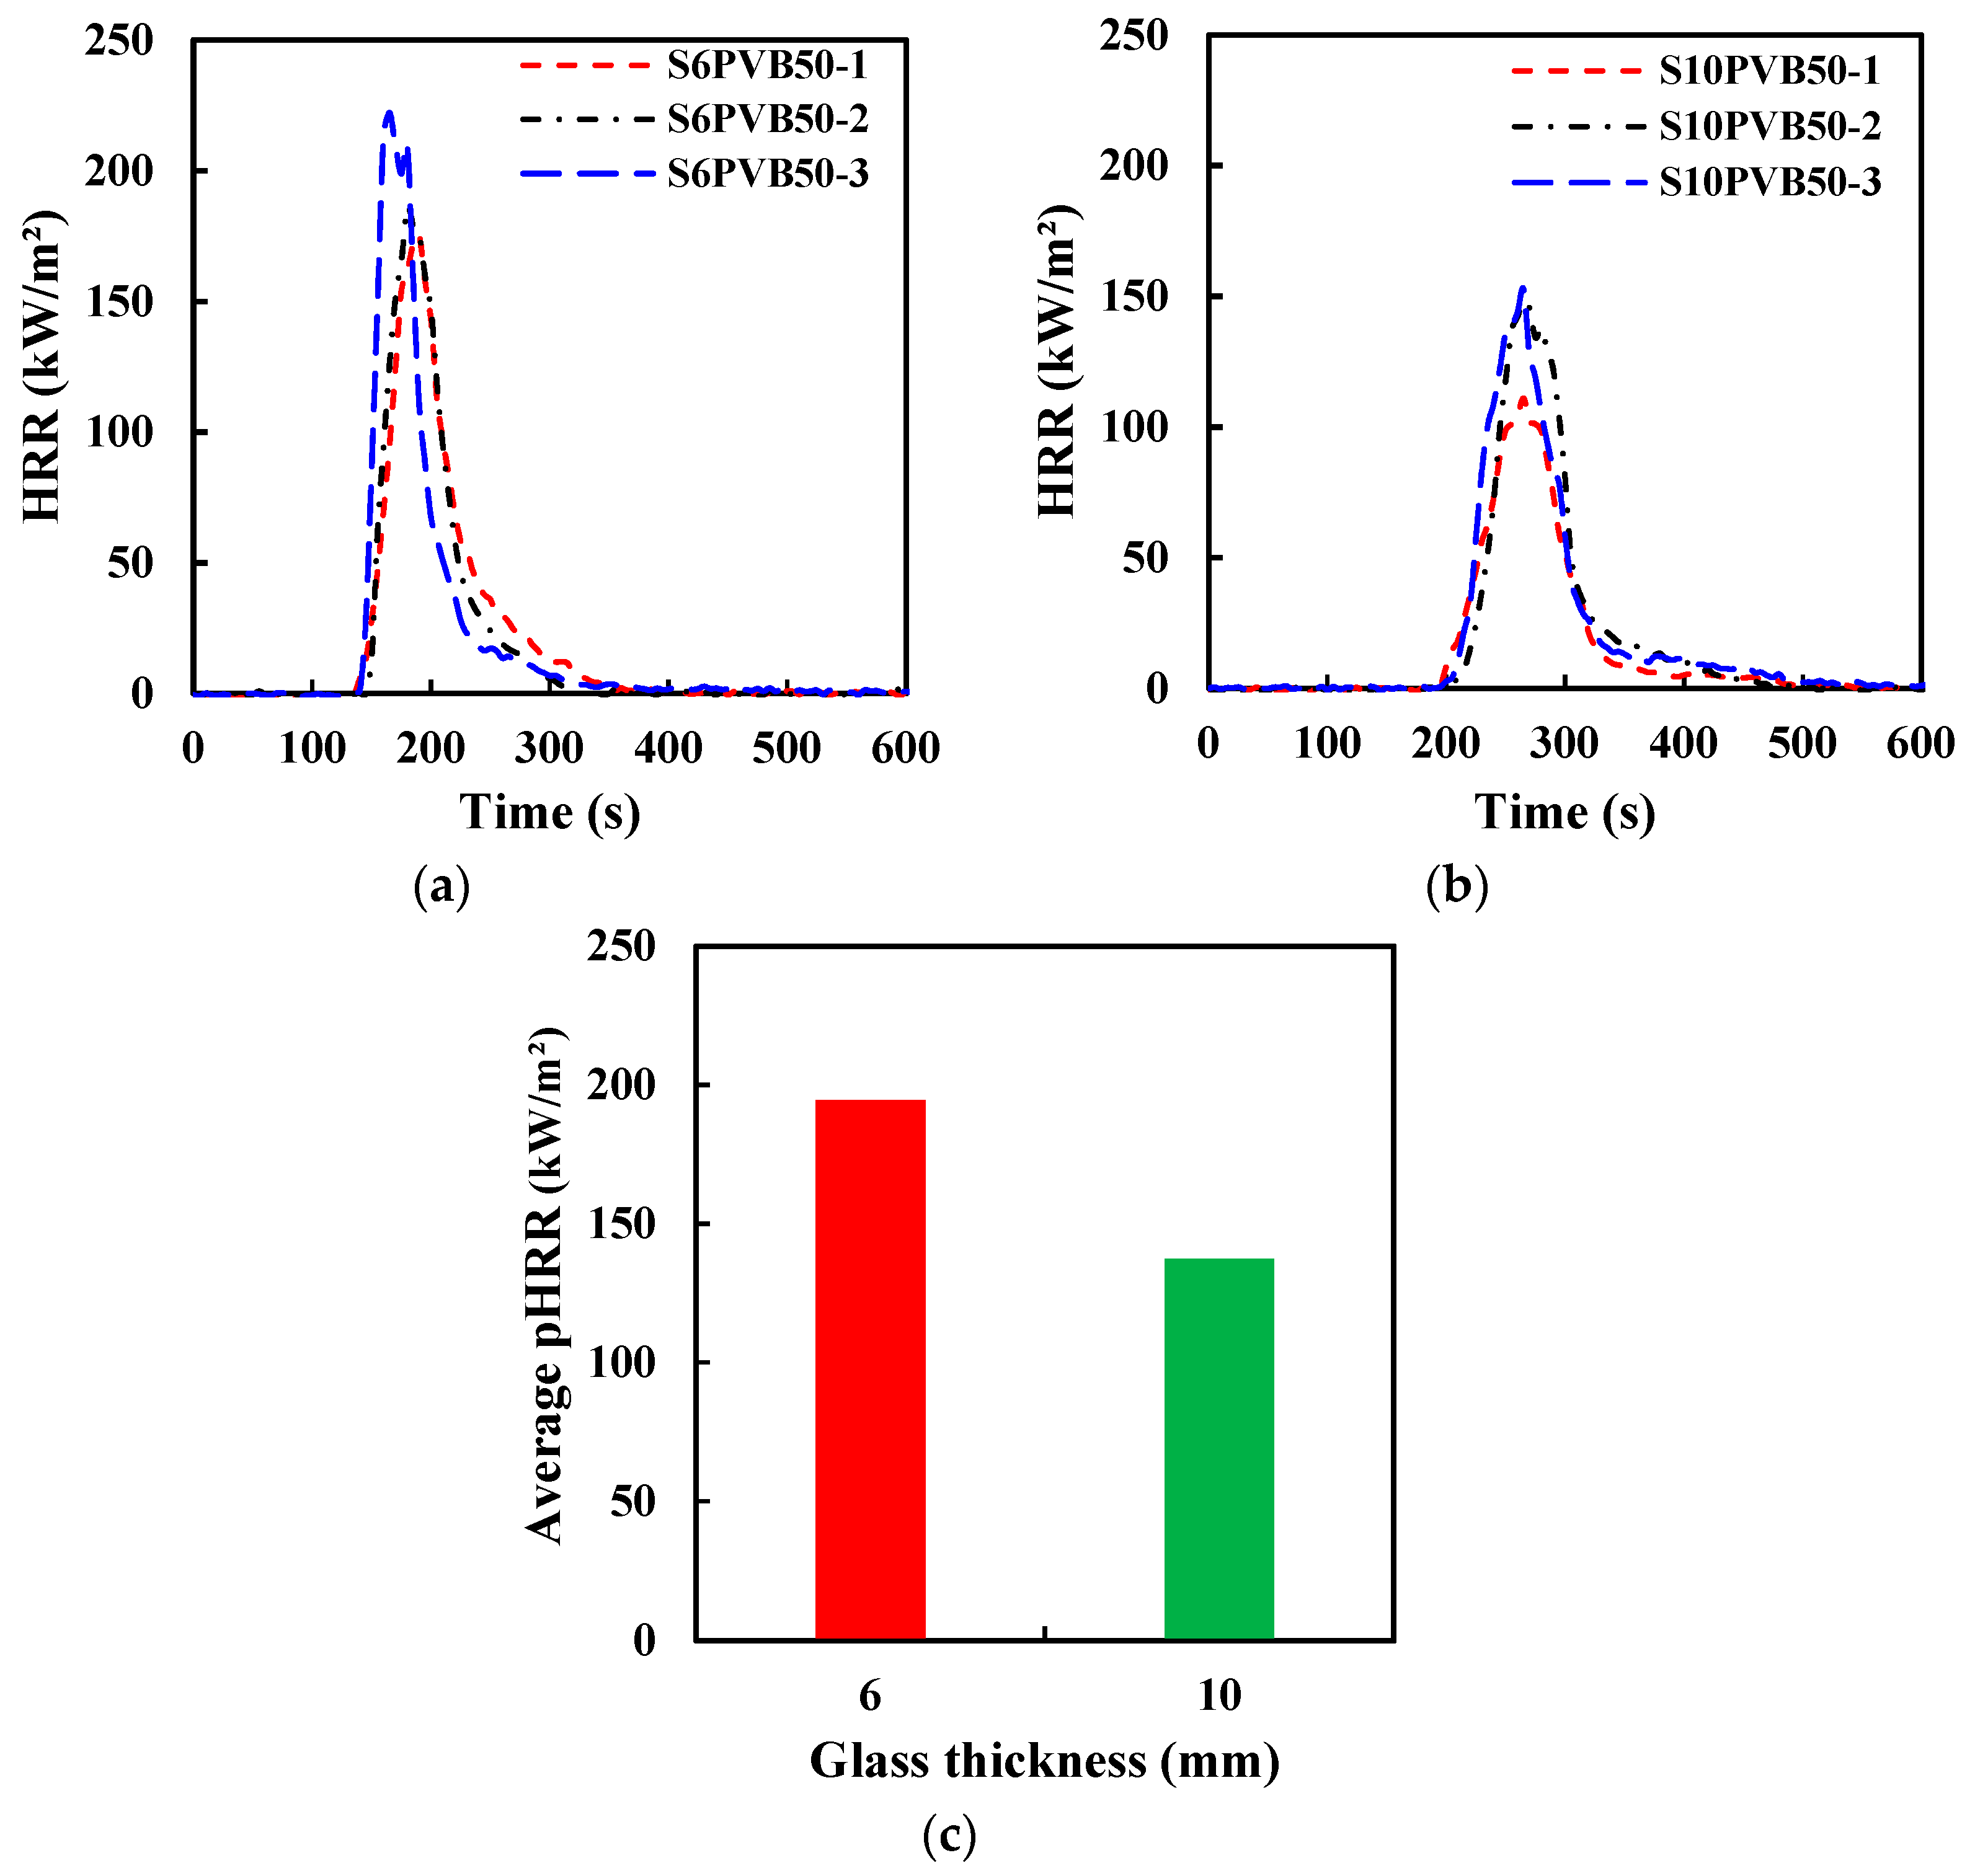
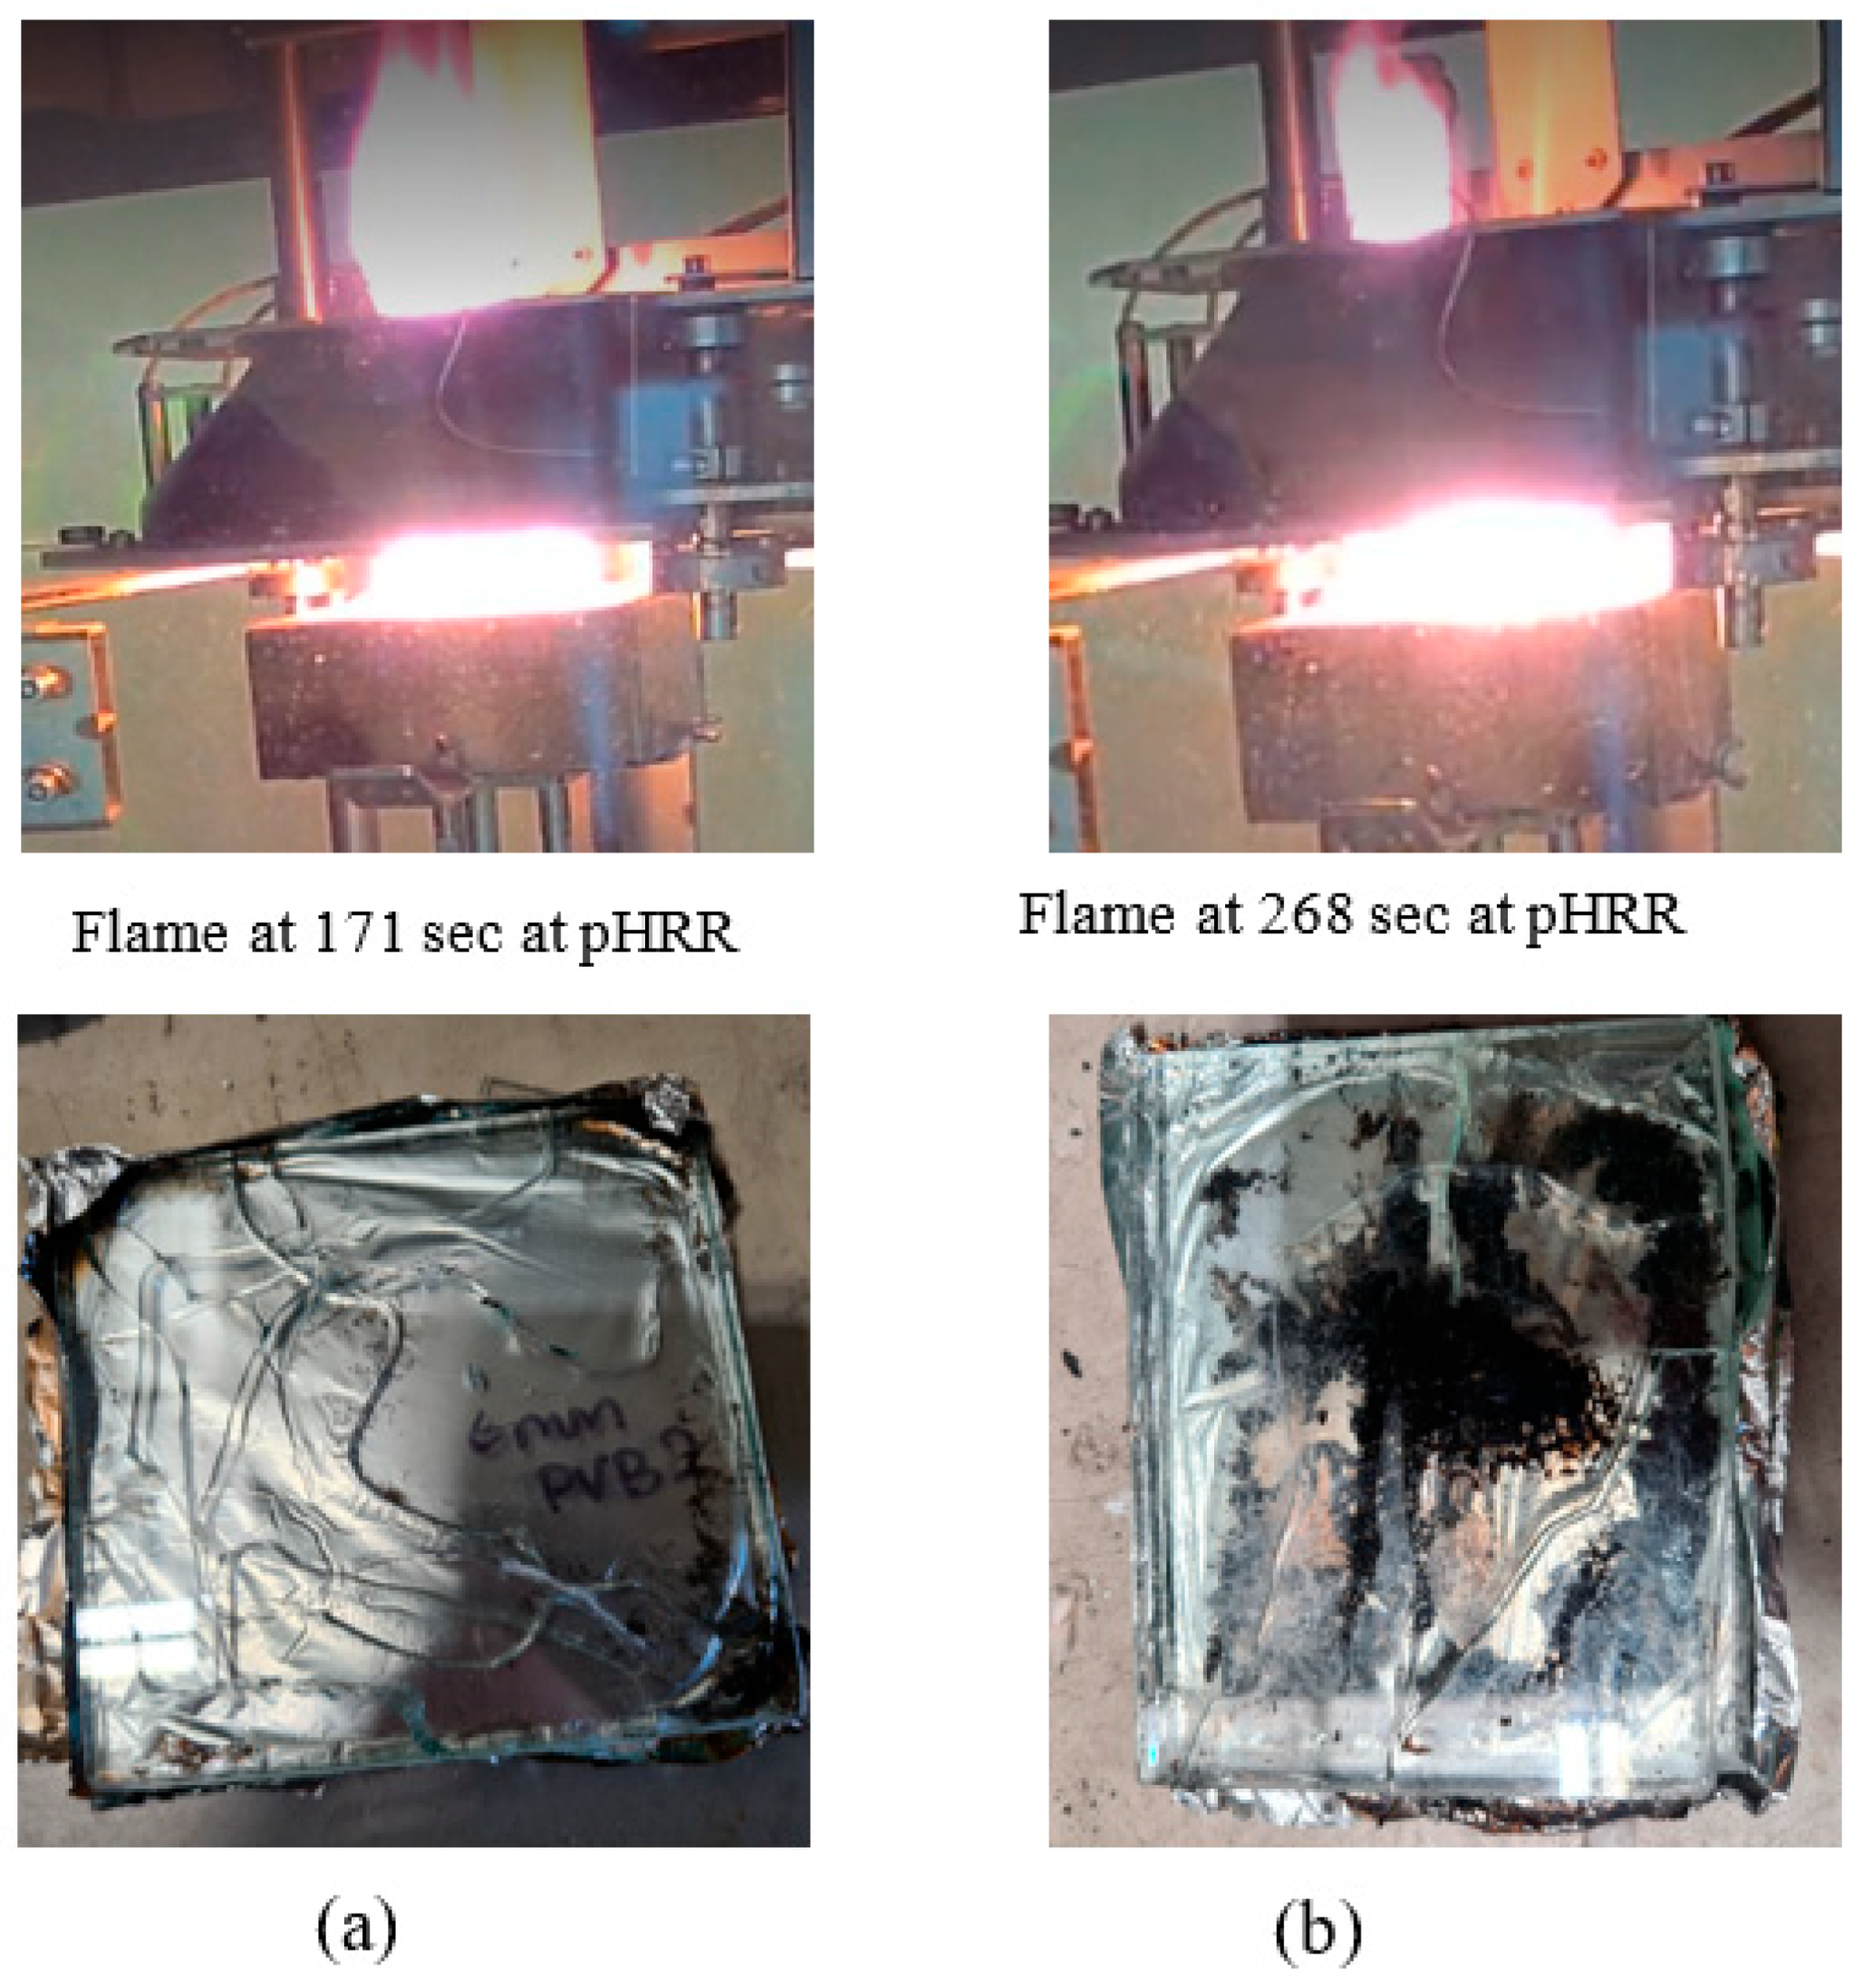
The effect of laminated glass thickness was studied by analysing the samples with 3 mm and 5 mm glass pane thickness with the same interlayer PVB thickness at 50 kW/m2 heat flux. The heat release rate of each sample of 6 mm laminated glass and 10 mm laminated glass is shown in Figure 4a–c, and the average heat release rate of 6 mm and 10 mm laminated glass with 0.38 PVB interlayer is shown in Figure 4a. It can be seen from Table 2 and Figure 4a and that the maximum and minimum heat release rate for 6 mm laminated glass samples were observed as 222 kW/m2 and 175.05 kW/m2, respectively. The average heat release rate of 6 mm laminated glass samples with 0.38 mm PVB interlayer was 194.45 kW/m2, as shown in Figure 4c. In the case of three 10 mm laminated glass thickness samples, the maximum heat release rate was observed at 153 kW/m2. The average heat release rate of 10 mm laminated glass samples with 0.38 PBV interlayer is 137.33 kW/m2, as shown in Figure 4c. The 6 mm thick laminated glass showed a higher average heat release rate than the 10 mm thick laminated glass sample at 50 kW/m2 heat flux. For both types, there was a 0.38 mm thick PVB interlayer. Therefore, the glass pane thickness greatly influenced the heat release rate. It was also observed that the 3 mm glass pane had started to crack earlier. As a result, ignition occurred earlier for a 3 mm glass pane when compared to a 5 mm thick glass pane, as shown in Figure 5. Similar works have been carried out on PMMA by Paul et al. [19], where the HRR values decreased with sample thickness. Similarly, in another work on EPS and XPS insulations by Weiguang et al. [20], the pHRR value gradually decreased with a thickness increase for the EPS sample.
The top glass layer of the 6 mm samples cracked in 30 to 40 s, whereas the top glass layer of the 10 mm samples cracked in 57 to 108 s (see Figure 5a,b). These findings imply that as thickness increases, cracking time can be delayed. When the maximum normal stress of materials reaches the materials’ ultimate strength, cracks occur [14]. Therefore, the maximum stress required to reach the ultimate strength of 10 mm samples is assumed to take longer than that of 6mm samples. Moreover, thicker samples (10 mm) had fewer cracks than thinner samples (6 mm). This is because the crack was first initiated at the edge for both samples and then propagated very quickly.

3.2. Effect of Heat Flux

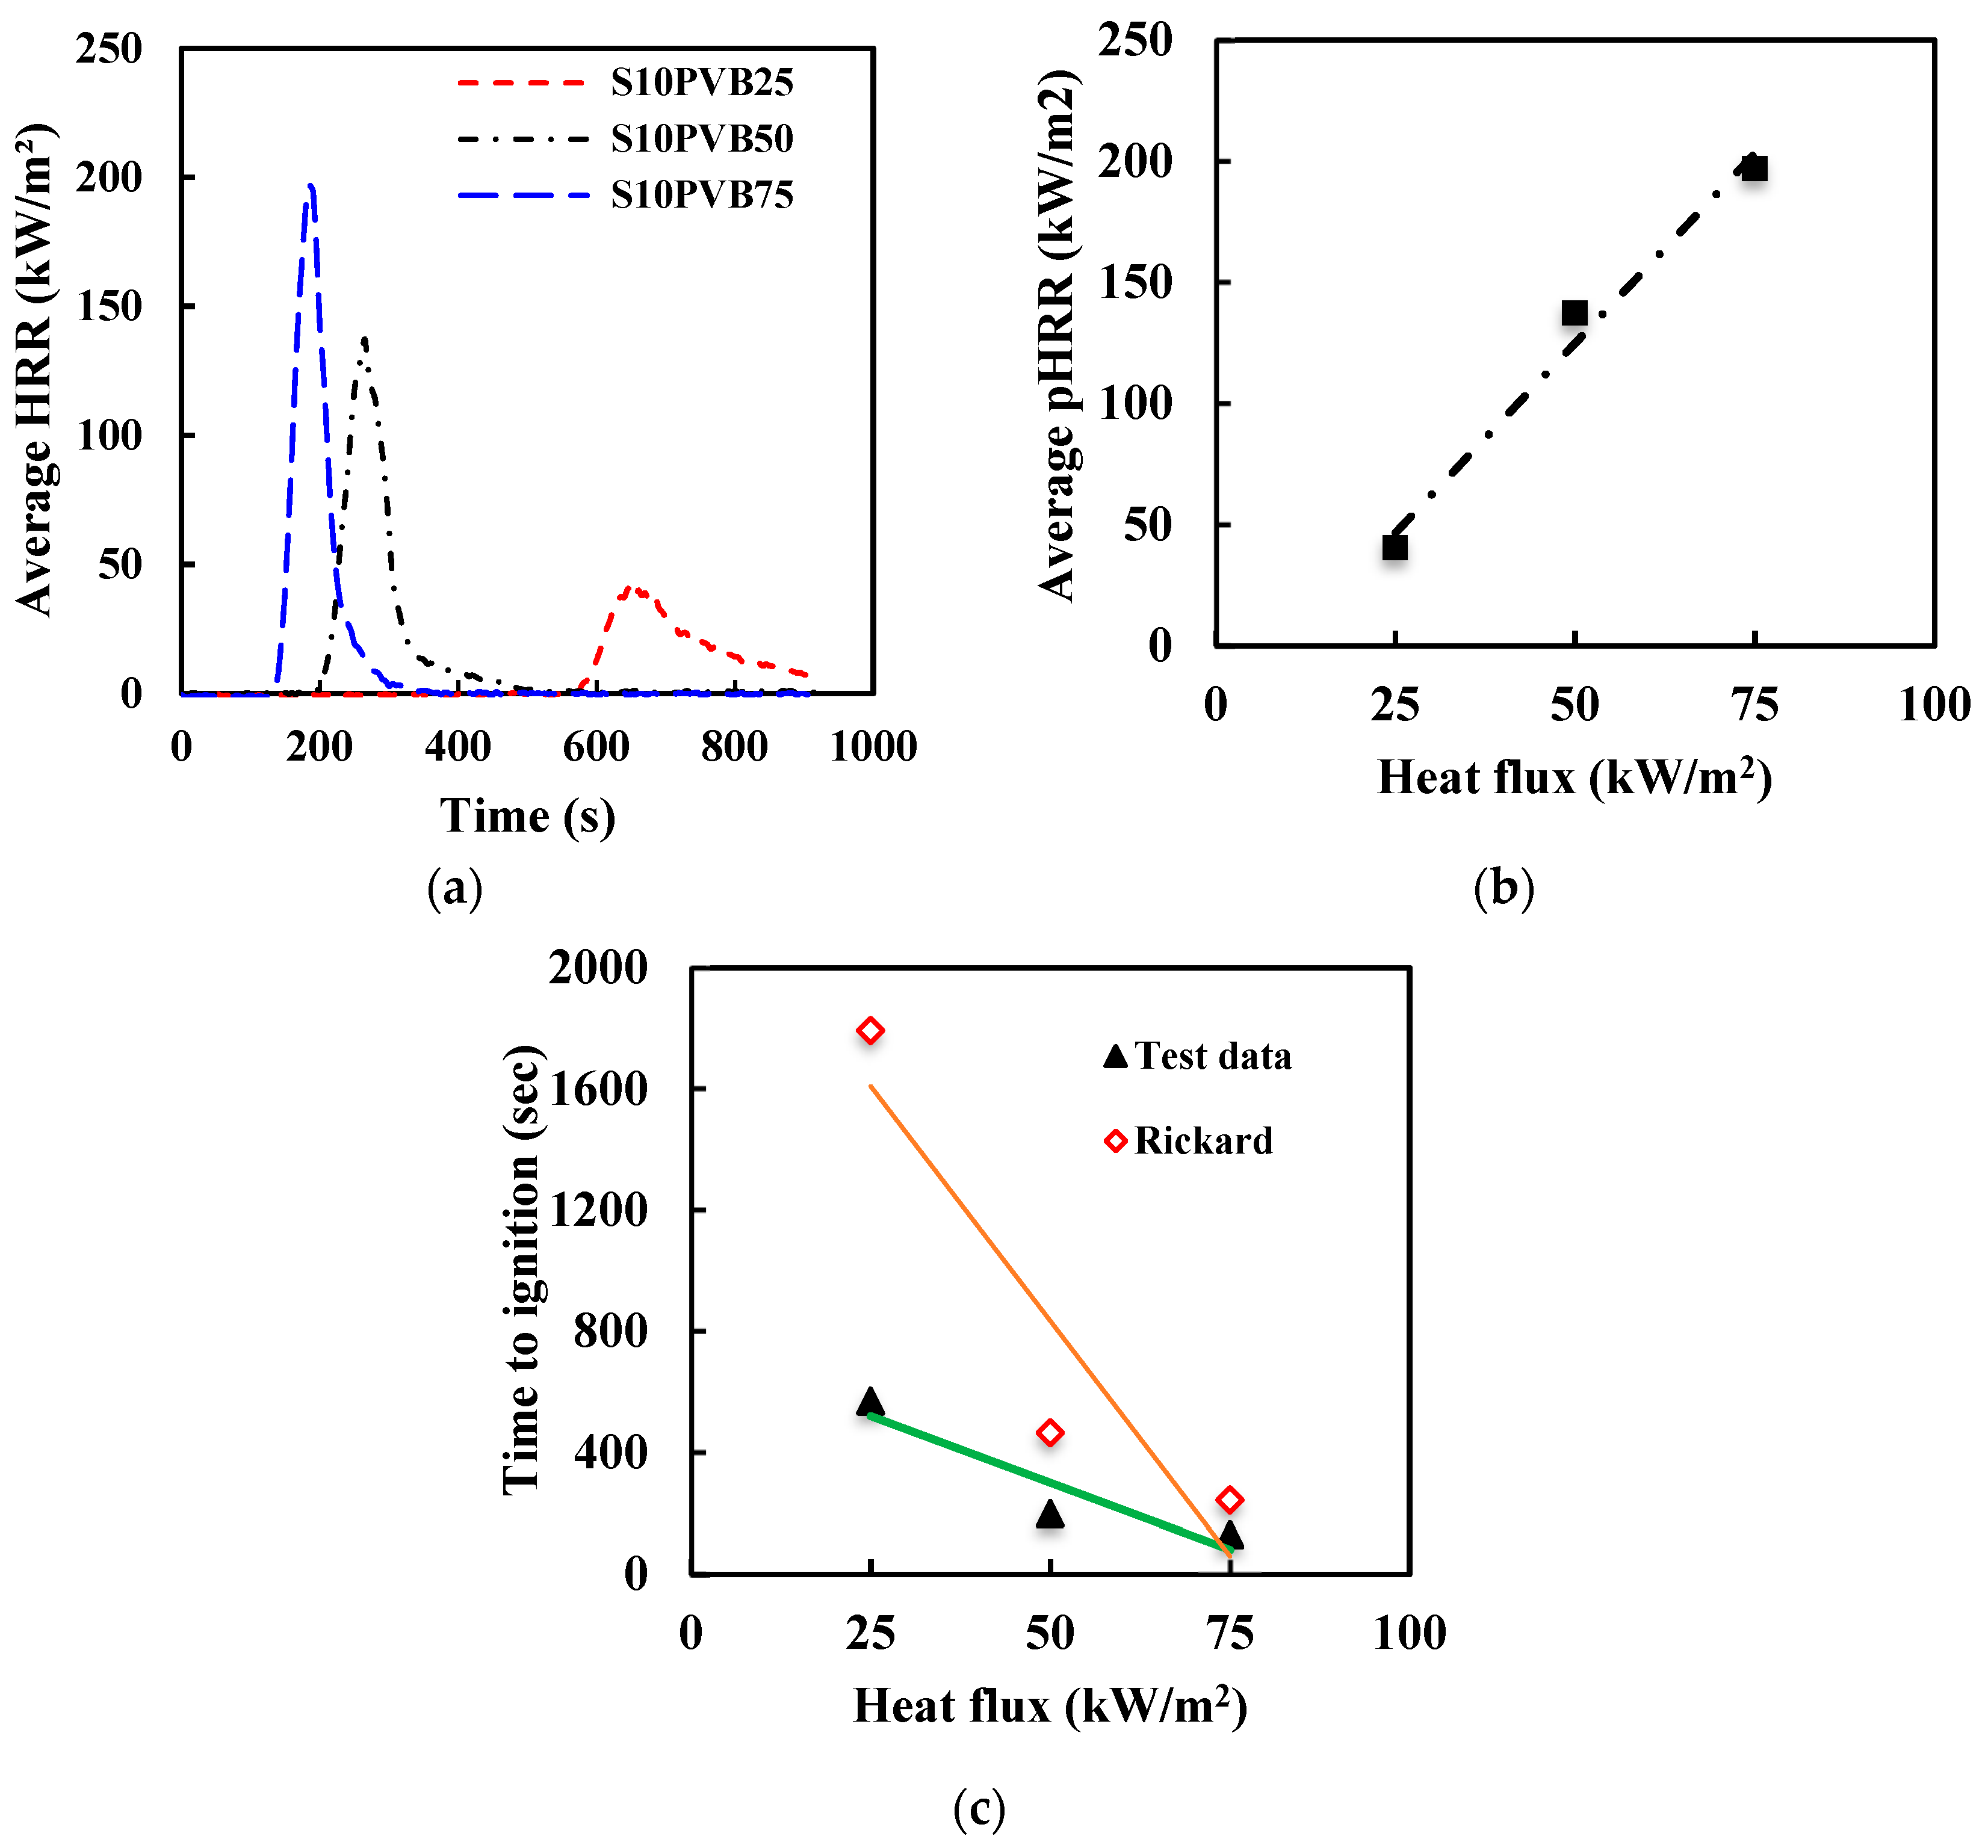
Three 10 mm laminated glass samples with 0.38 mm PVB interlayer were tested for each heat flux exposure of 25, 50 and 75 kW/m2. The average heat release rate of the 10 mm laminated glass with different heat fluxes (25 kW/m2, 50 kW/m2, 75 kW/m2) is shown in Figure 6a. At 25 kW/m2 heat flux, the peak heat release rate was 40.52 kW/m2, whereas at 50 kW/m2 heat flux, the peak heat release rate was 137.33 kW/m2. The peak heat release rate at 75 kW/m2 heat flux was 197 kW/m2. A gradual increase was observed in the heat release rate (HRR), with an increase in the heat flux from 25 to 75 kW/m2, as shown in Figure 6b. The key observations indicate the glass had started to crack earlier at 75 kW/m2 of heat irradiance when compared to 50 kW/m2 and 25 kW/m2. This resulted in the samples being exposed to 25 kW/m2 of heat irradiance to record a lower peak heat release rate, as the interlayer had reacted within the glass but did not emit a large amount of gas. This behaviour indicates that the time it takes for the glass to crack on the exposed surface and how the gasses from the reaction of the interlayer are emitted will affect the heat release of the laminated glass. It was stated by Babrauskas [5] that in a broader sense, for many products, the HRR value is linearly proportional to the external heat flux, though the deviation from the linearity at very high and low heat flux is common for many materials. A similar response was observed in a previous study related to XPS polymer [15], where the peak heat release rate (pHRR) increased to 492 kW/m2 at 50 kW/m2 from 423 kW/m2 at 35 kW/m2. However, the trend was the opposite in the case of EPS. Similar work was conducted by Rickard et al. [11] by imposing radiant heat flux on the PVB interlayer laminated glass samples. It was found that the HRR value increased at 50 kW/m2 compared to 25 kW/m2 and again slightly decreased at 75 kW/m2. The trend of time-to-ignition is the same as studied by Rickard et al. [11], as shown in Figure 6c. Though the interlayer thickness was 1.2 mm in Rickard’s study, the required time-to-ignition at higher heat flux was almost similar. At lower heat flux (25 kW/m2), the effect of the thickness variation was acute; thus, the ignition was delayed significantly (Figure 6c).
The fire hazard increases with the increase in external heat flux, as seen in Figure 7. The burnout was high for the sample tested at 75 kW/m2 compared to the 25 kW/m2 heat flux. Within 185 s, the flame reached its peak state when mass loss and pyrolysis accelerated greatly. The pHRR was also significant in that case. In the case of 25 kW/m2 heat flux, the cracking was initiated at the corner; after the fire test, only the crack existed (Figure 7a). There was no significant burning, which indicates very low mass loss during the burning process at 25 kW/m2 heat flux.

3.3. Effect of Interlayer Materials of Laminated Glasses

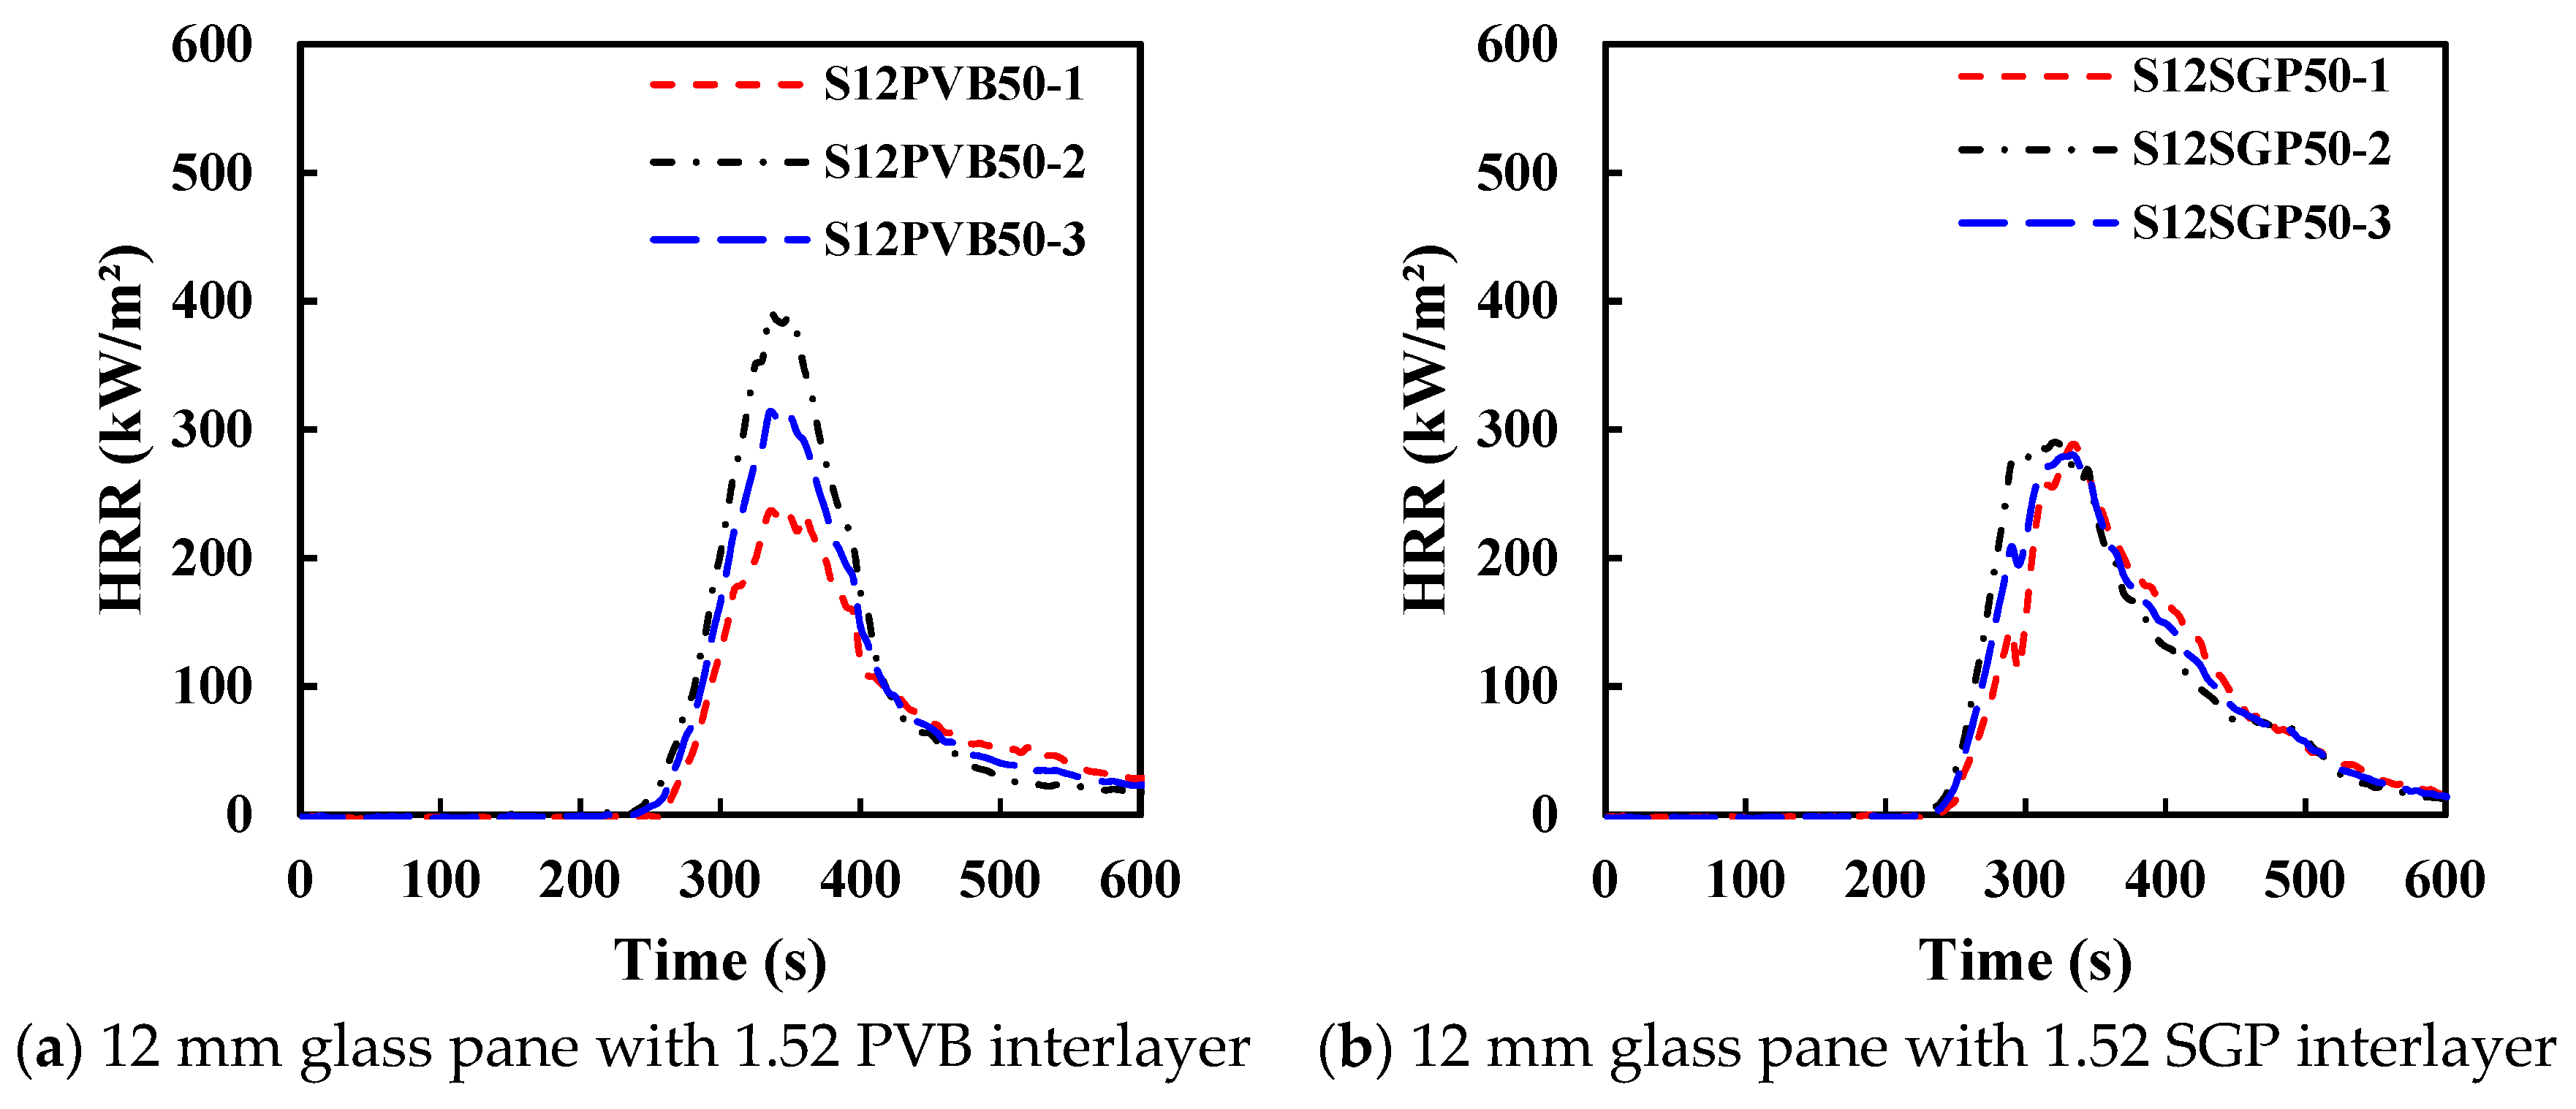
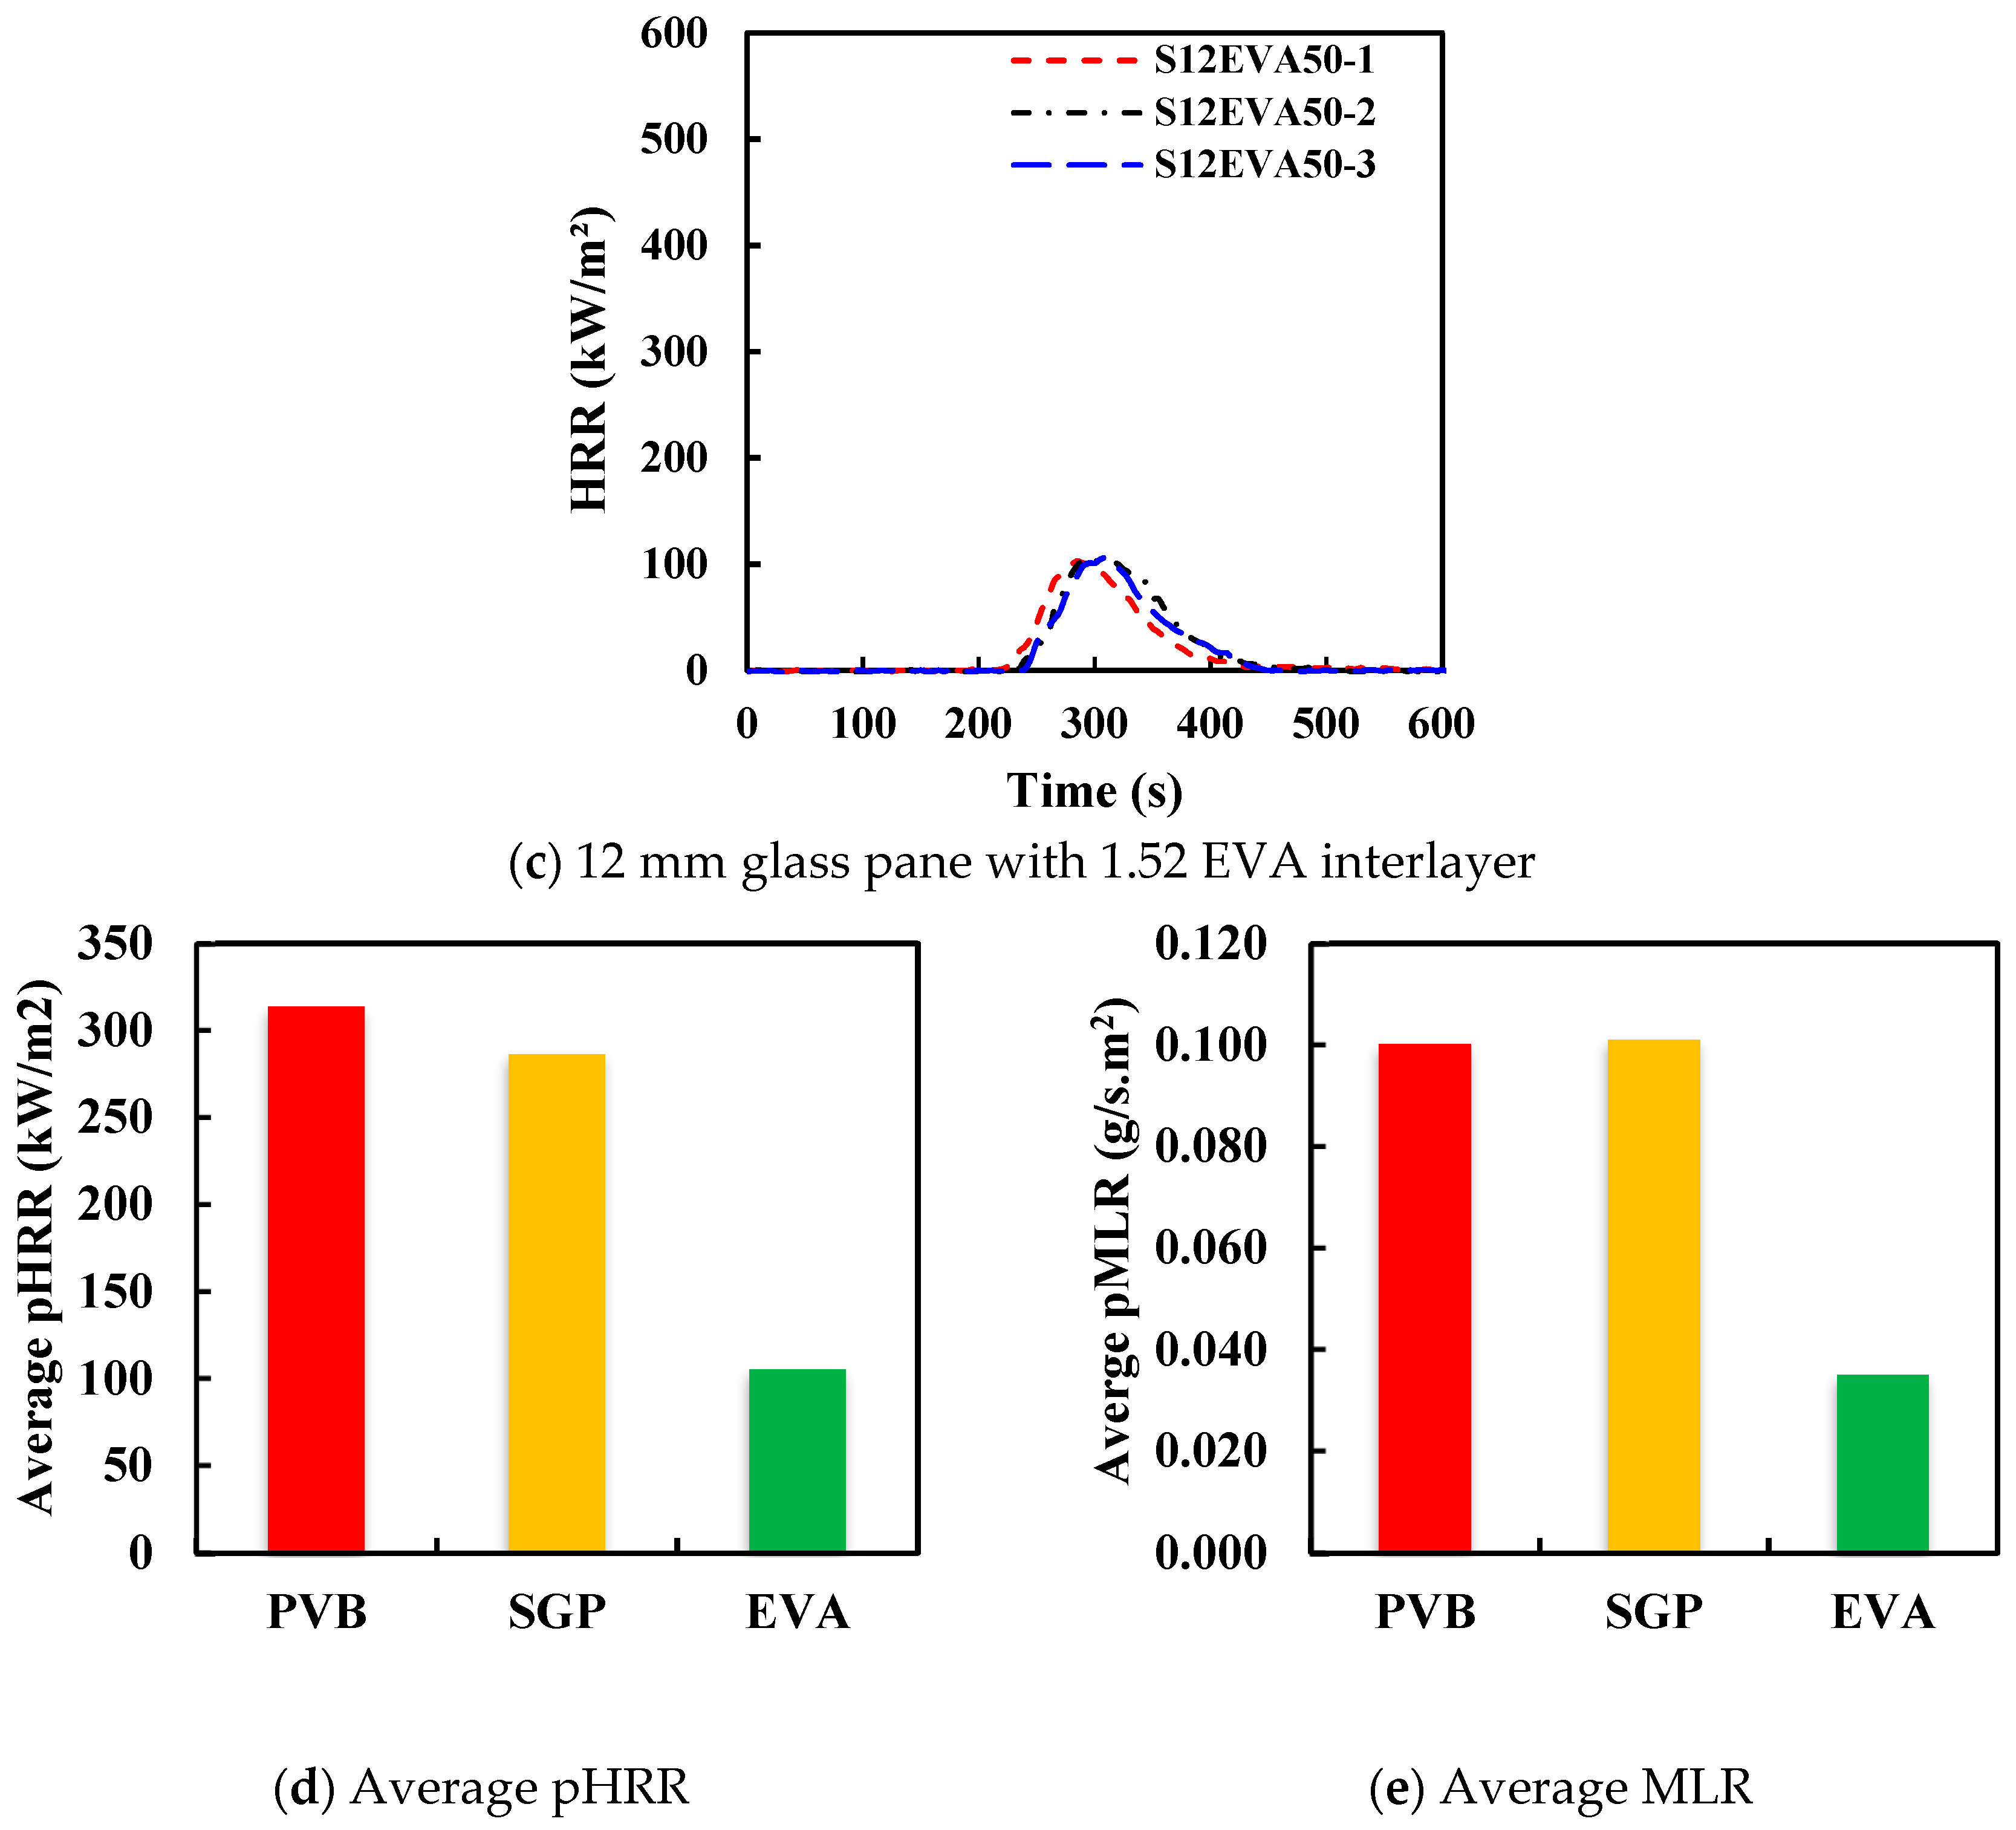
The effect of interlayer materials (PVB, SGP and EVA) of the laminated glass with a 6 mm glass pane at 50 kW/m2 heat flux was investigated. For each category of the interlayer, three samples were considered. The heat release rate of each sample of PVB, SGP and EVA laminated glass is shown in Figure 8a–c, and the average peak heat release rates of PVB, SGP and EVA laminated glass are shown in Figure 8d. For PVB interlayer samples, the maximum heat release rate was 399 kW/m2, as shown in Figure 8a, and the average value of peak heat release rate was 313.5 kW/m2, as shown in Figure 8d for the second sample. Ignition of the first sample was observed to have started along the edges of the sample rather than along the crack (Figure 9). This phenomenon led to a slower spread of flame along the cracks, slower flame extinguishment and a lower peak heat release rate of 236 kW/m2, which was 935 s after ignition. The peak heat release rate for the first and second samples was 236 kW/m2 and 399 kW/m2, with an average of 313.5 kW/m2. The average time it took for the two samples to reach their peak heat release rate from the flaming starting time was about 77 s.
In the case of 12 mm SGP laminated glass, the maximum heat release rate was 290 kW/m2, as shown in Figure 8b, and the average heat release rate was 286.23 kW/m2, as shown in Figure 8d. However, for 12 mm EVA laminated glass samples, the peak heat release rate was 107 kW/m2, as shown in Figure 8c, and the average heat release rate was 105 kW/m2, as shown in Figure 8d. Therefore, the peak mass loss rate of EVA laminated glass is remarkably different compared to PVB and SGP laminated glasses, as shown in Figure 8e. The pHRR is directly related to the mass loss rate (Equation (4)) [21]. The higher the mass loss rate, the greater the pHRR value. The reason is due to a high mass loss; as there will be more pyrolysis gas generation, the more combustible gas will be there to accelerate the heat generation.
Interlayers also played an important role in crack development. The PVB samples cracked between 35 and 127 s (see Figure 9a), whereas the SGP samples cracked between 60 and 87 s (see Figure 9b). In the case of EVA samples, the crack appears between 84 and 154 s (see Figure 9c). As a result, EVA samples provide greater stress crack resistance than the other interlayer samples. This longer cracking time may be due to EVA’s higher stiffness compared to PVB, which is almost similar to that of SGP [3]. Nearly 100 s before ignition, pyrolysis gases were detected. The flame reached its peak moment at 335 s after the test started in case of PVB interlayer (see Figure 9a), whereas it was at 296 s for the EVA sample (see Figure 9c).

3.4. Discussions

The fire performance of any combustible and non-combustible materials is evaluated based on the reaction-to-fire properties, fire hazard and smoke hazard [12,13,14,15]. In this study, the fire performance of PVB, SGP and EVA interlayer laminated glasses is also discussed based on the reaction-to-fire properties, fire hazard and smoke hazard. The measured reaction-to-fire properties, fire and smoke hazards of PVB, SGP and EVA interlayer laminated glasses are listed with averaged calculated values in Table 3. The details of these factors are discussed in the below sub-sections.

3.4.1. Ignition Time

It is found that the ignition time is greatly influenced by the thickness of the glass pane as well as by the different external heat fluxes. It is noticeable from Figure 10a that the ignition time is the same (225 s) for all three types of interlayers (PVB, SGP, EVA). However, the flame-out time was 250 s and 243 s in the case of EVA and SGP, respectively, whereas it was slightly longer for PVB samples (261 s) (Figure 10b). The flameout time also increased with the increase in thickness but gradually decreased with the increase in external heat flux. EVA interlayer samples reached pHRR more quickly than the others (Figure 10c). It took 296 s for the EVA sample to reach pHRR, whereas it took 328 s and 335 s for the SGP and PVB samples, respectively. The ignition time for the 6 mm glass sample was 130 s and increased to 200 s for the 10 mm thick laminated glass sample with the same heat flux exposure of 50 kW/m2 in Figure 10a. The thinner glass pane cracked earlier, allowing volatile gases to emit earlier and ultimately resulting in an earlier ignition than that of the 10 mm thick glass samples. The glass pane crack was due to thermal stress built because of the temperature gradient. The 3 mm glass pane had started to crack earlier as the inner portion expanded more quickly than the 5 mm glass pane. Before ignition, the mass loss rate was significantly higher than any other time, which subsequently contributed to the pyrolysis and ignition. In the case of the 10 mm glass sample, the mass loss rate was lower than the 6 mm glass sample, which delayed the time to evolve the pyrolysis gas to contribute to the ignition process. The time required for the 12 mm glass samples to reach their peak heat release rate from the flaming starting time was varied. The average time was 316 s from the test’s beginning. It was observed that flaming started occurring at the bottom of the case before stopping and intensifying on the exposed face. In Rickard et al.’s [11] work, the authors pointed out that the ignition time altered in various samples due to changes in the transmissivity of heat flux. As the glass pane cracked and the interlayer started bubbling, it influenced the transmissivity of the glass and interlayer. Their experiment found that after glass cracking and interlayer bubbling, the measured heat flux on the sample was greatly reduced in the case of a lower external heat flux of 25 kW/m2. At 75 kW/m2, the measured heat flux on the sample was less reduced than in the earlier case. It was mentioned that the presence of gas also influenced the measured heat flux on the sample. Weiguang et al. [20] used a cone calorimeter to observe the fire performance of polystyrene (PS) foam with different external kW/m2, where it was only 23.5 s at 45 kW/m2. Another reason was mentioned by Klasen et al. [22], who reported that the re-radiation of the sample altered with the increase in sample temperature.

3.4.2. Total Heat Release

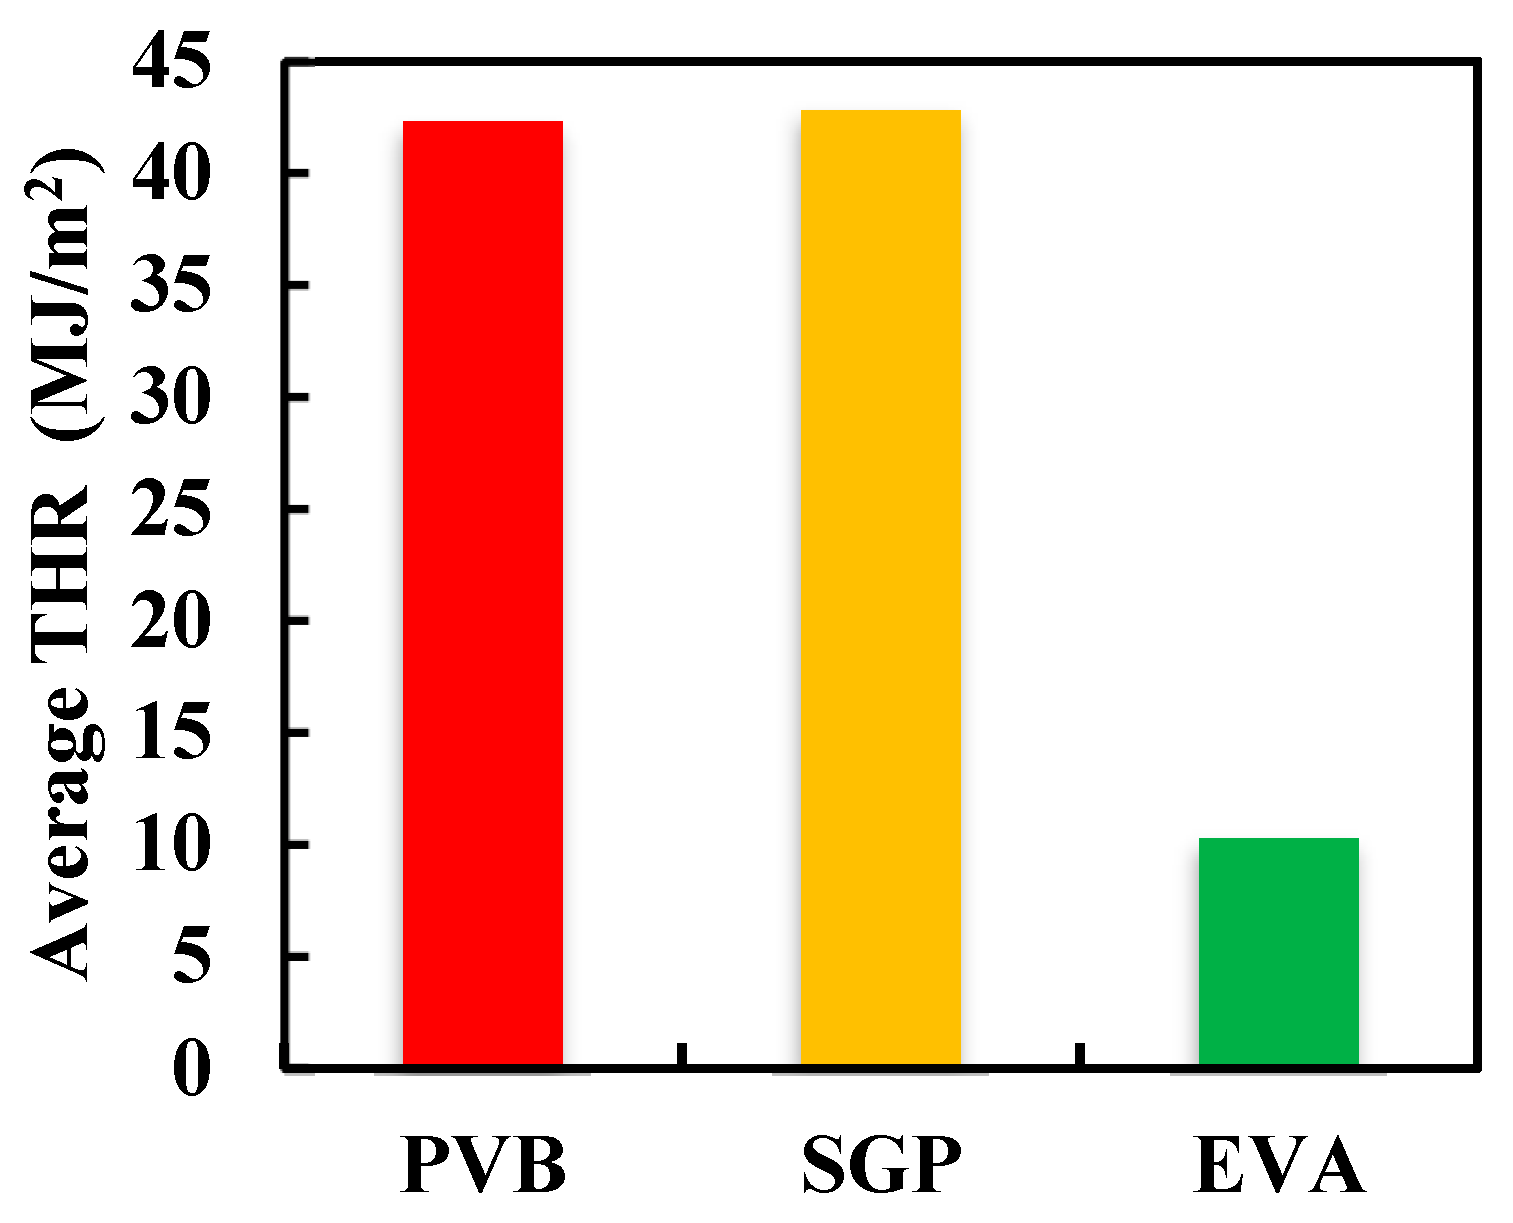
The total heat release of all samples is determined to quantify the total fire load of each specimen at the end of the test, which will provide an indication of the fire hazard of laminated glass [23]. The total heat release obtained from each test at the heat flux of 50 kW/m2 is shown in Figure 11. It can be seen from Table 3 that the values of total heat release were almost the same for both the 6 mm laminated glass with 0.38 mm PVB interlay (11.27 MJ/m2) and the 10 mm laminated glass with 0.38 mm PVB interlay (11.21 MJ/m2). It was also the same (11.19 MJ/m2) for the 10 mm laminated glass with 0.38 mm PVB interlay when tested at the heat flux of 75 kW/m2, see Table 3, but lower THR (8.48 MJ/m2) was observed when testing the same sample at the heat flux of 25 kW/m2. However, the average THR value was significantly high for 13 mm laminated glass with 1.52 mm PVB interlayer (42.28 MJ/m2) and 13 mm laminated glass with 1.52 mm SGP interlayer (42.79 MJ/m2) (see Table 3 and Figure 11). On the other hand, the average THR value was significantly low (10.26 MJ/m2) for 13 mm laminated glass with 1.52 EVA interlayer samples (see Table 3 and Figure 11). It implies that based on THR, EVA possesses less fire load than the other two interlayers (PVB and SGP).

3.4.3. Mass Loss Rate

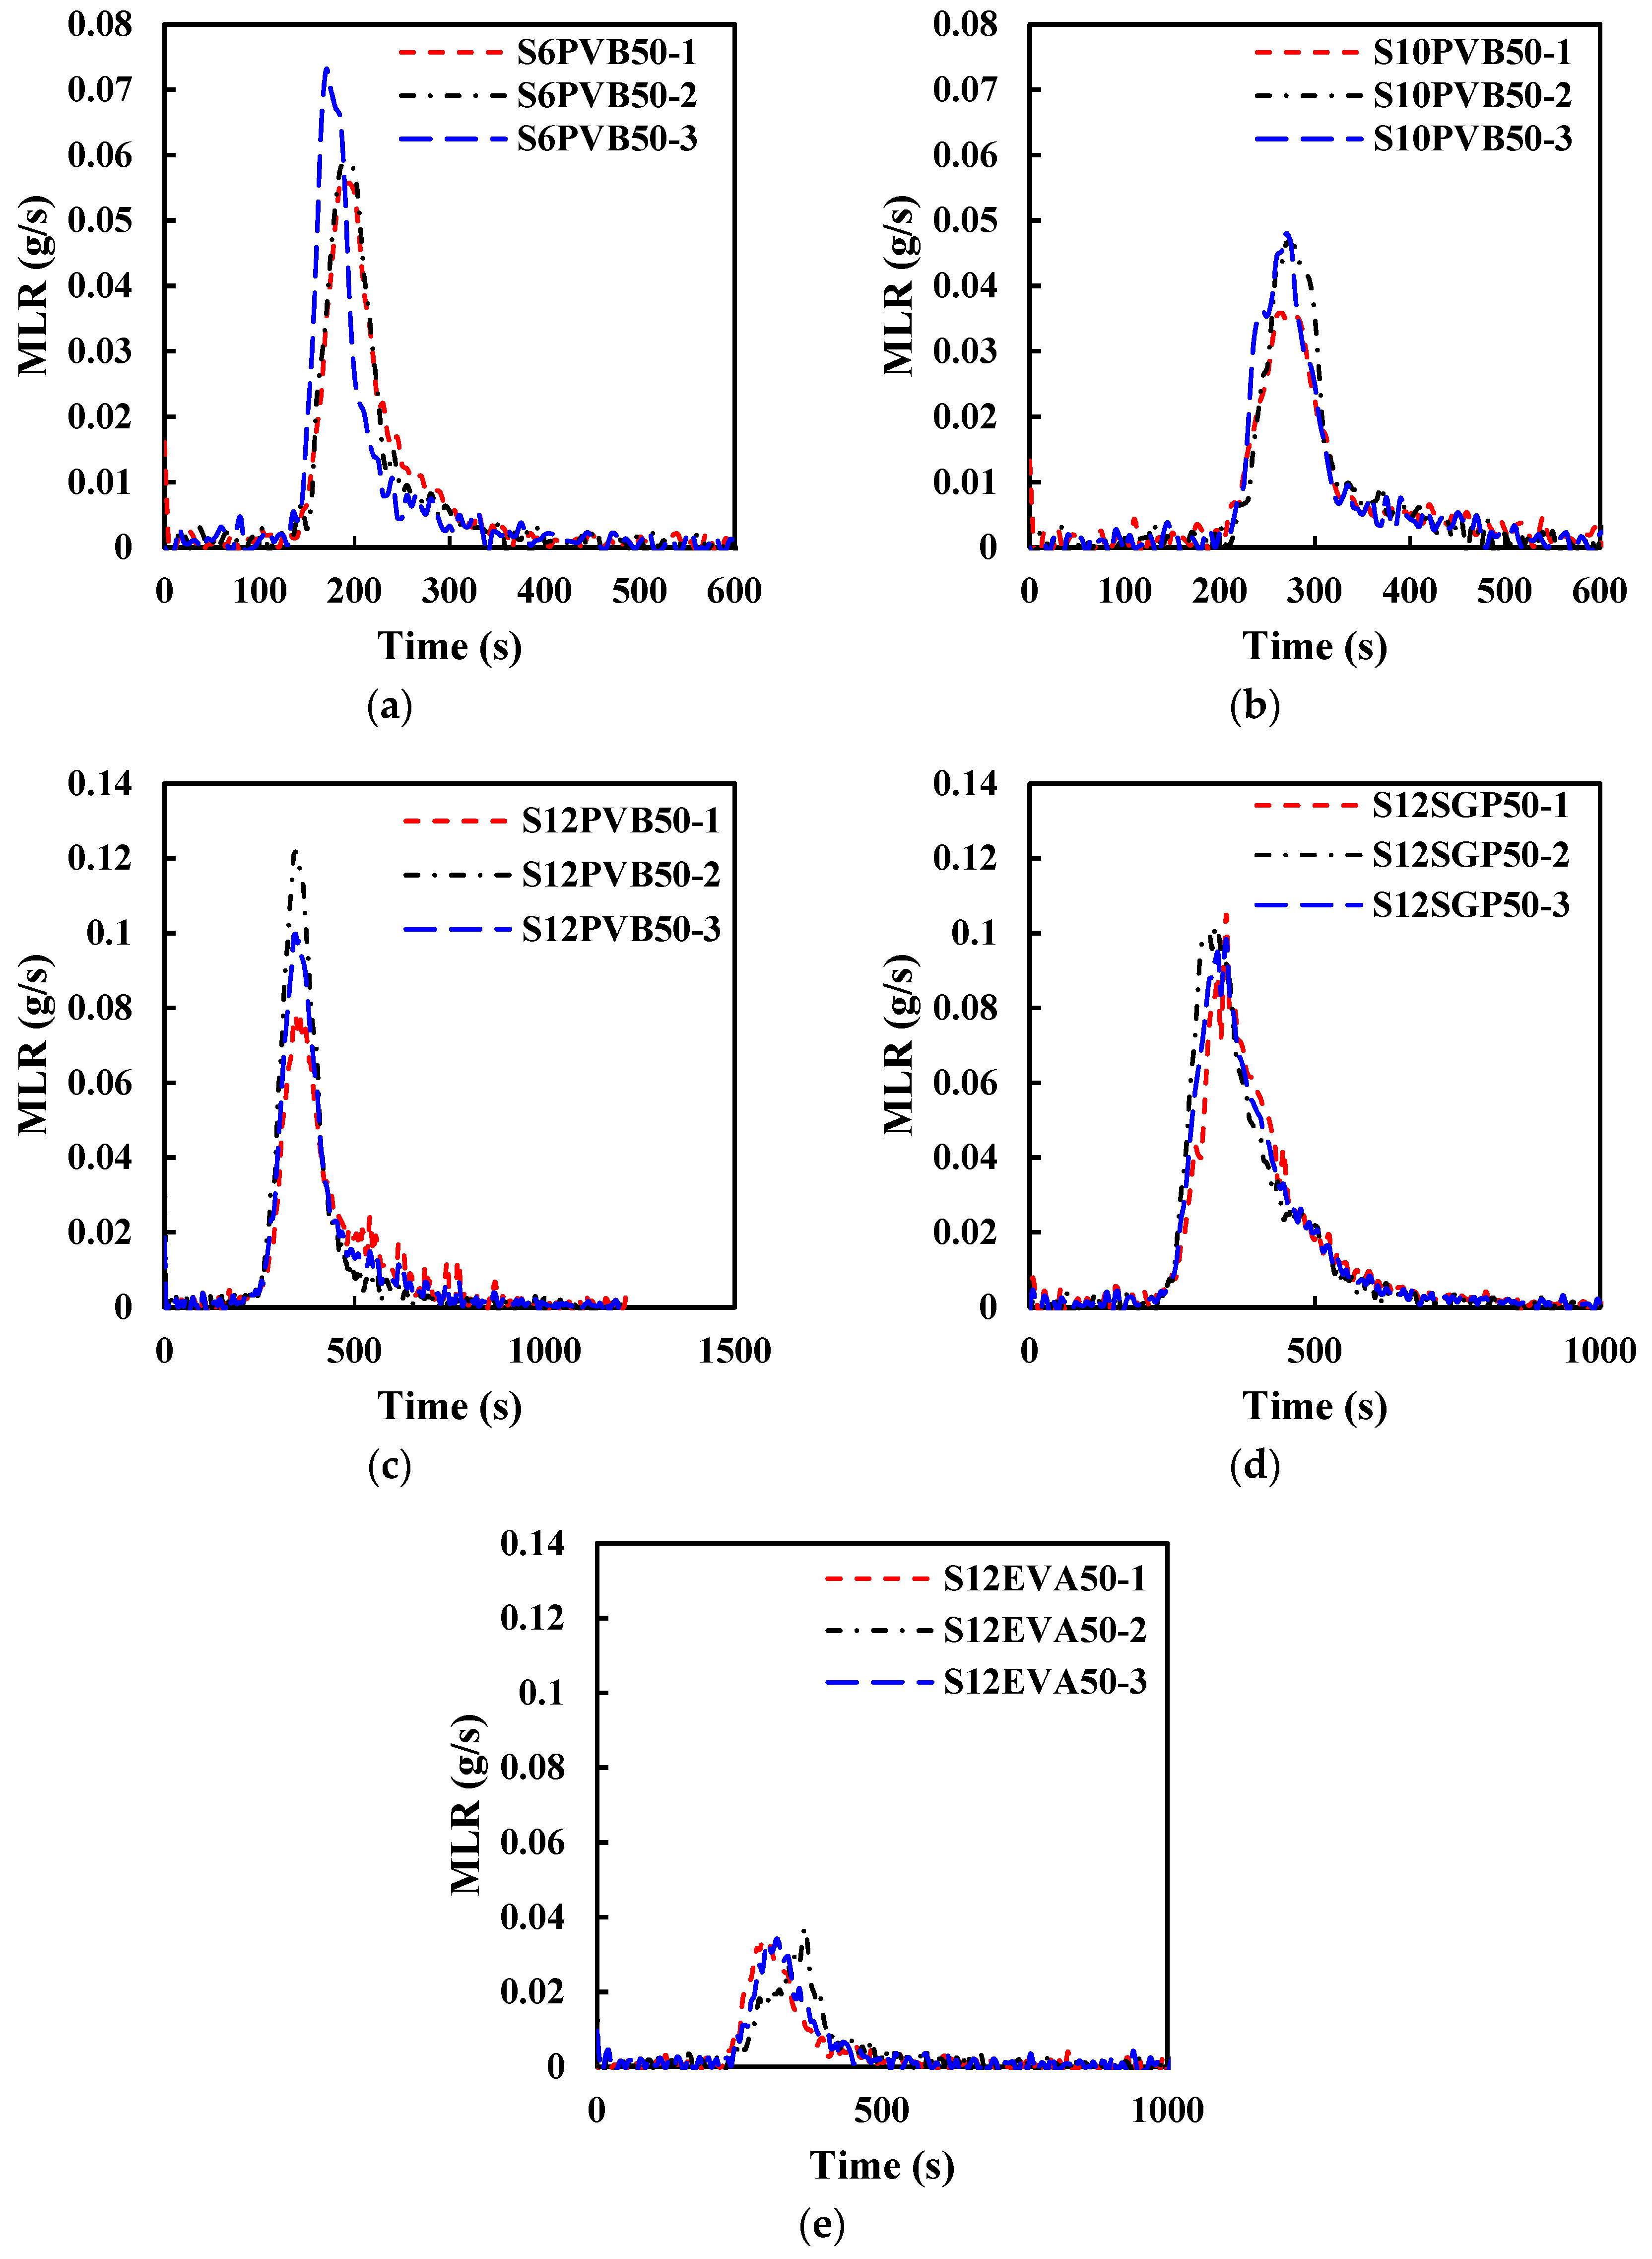
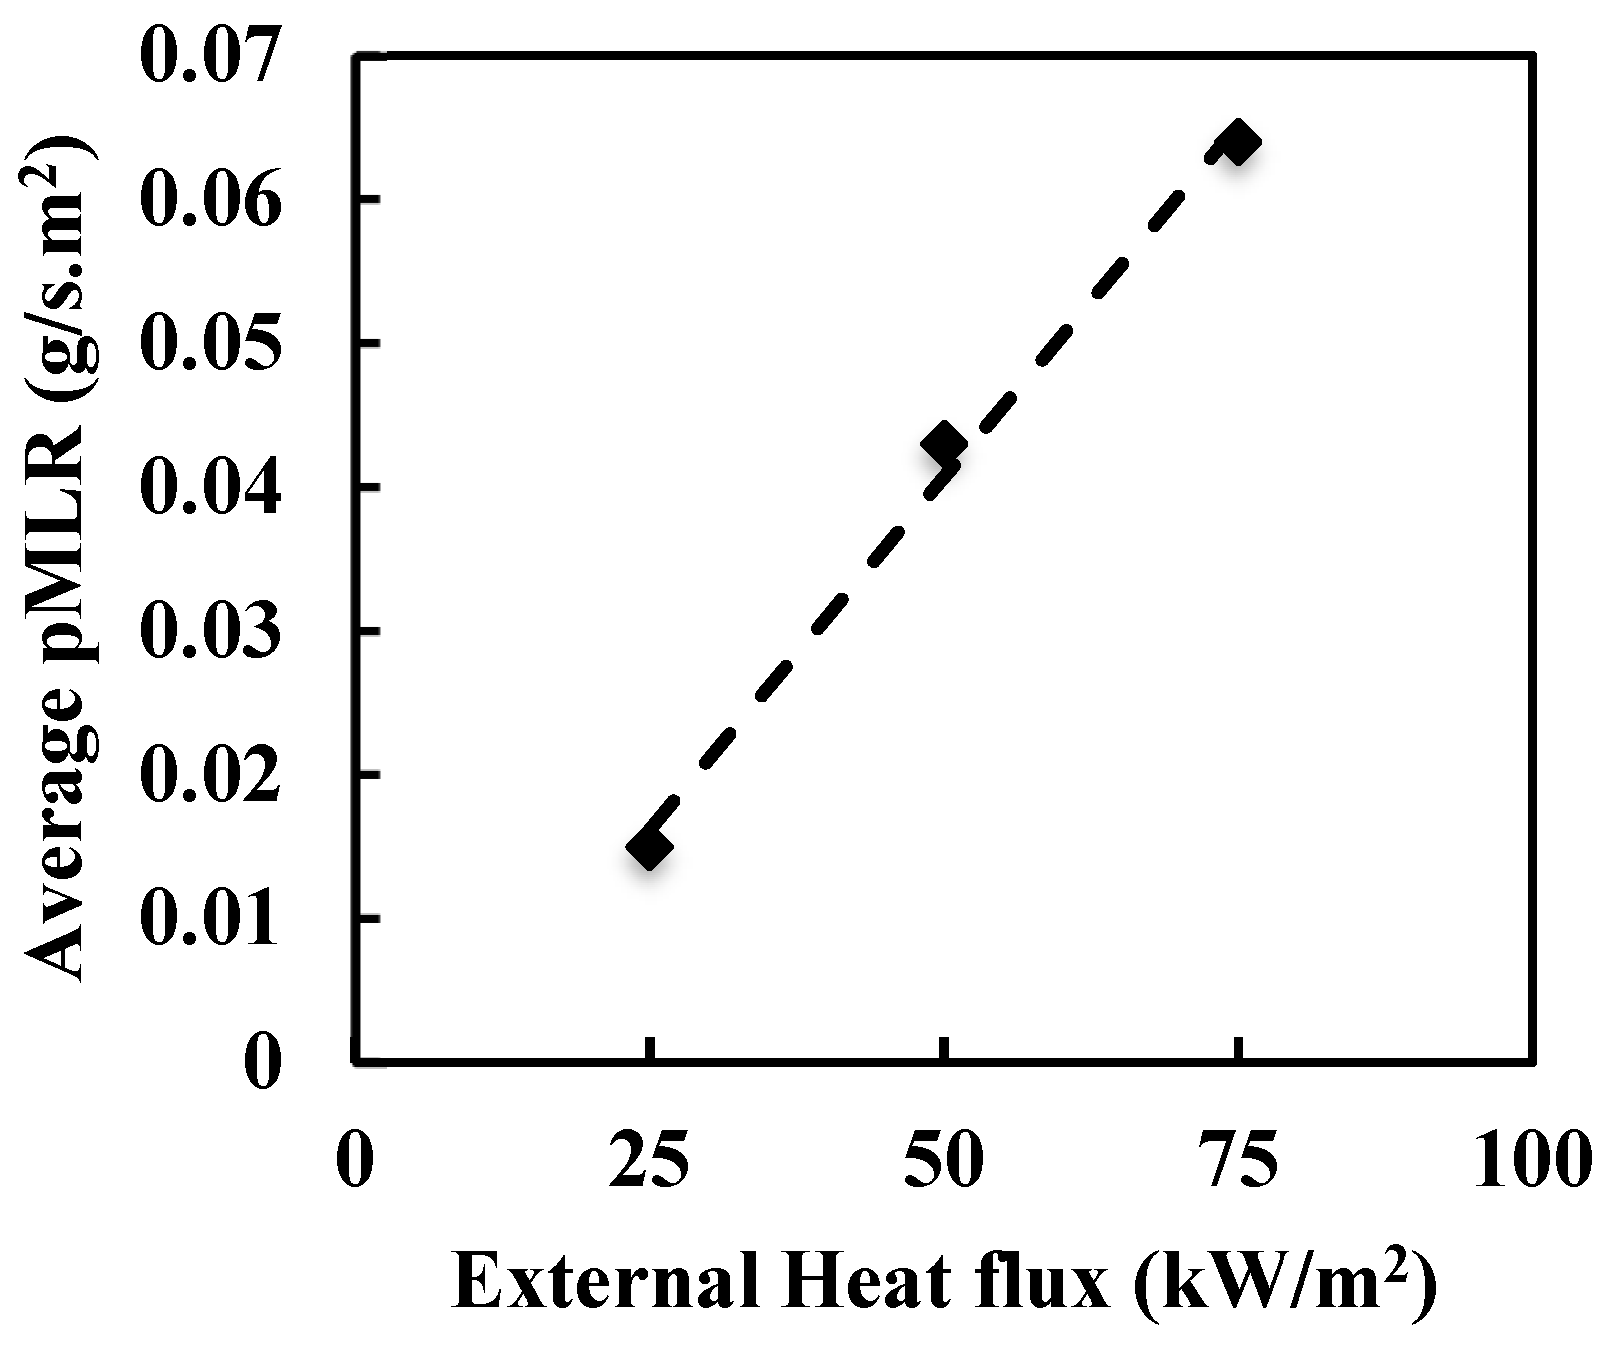
The mass loss rate (MLR) obtained during the testing of each sample at the heat flux of 50 kW/m2 is shown in Table 3. It can be seen from Figure 12a,b that the MLR value of 6 mm laminated glass with 0.38 mm PVB interlayer was higher than that of 10 mm laminated glass with 0.38 mm PVB interlayer. The average MLR for 6 mm laminated glass was 0.063 g/s·m2, whereas it was 0.043 g/s·m2 for 10 mm laminated glass (see Table 3). It can be seen from Figure 12d that the maximum MLR was observed for 12 mm laminated glass with 1.52 mm SGP interlayer compared to other 12 mm PVB (Figure 12c) and EVA (Figure 12e) laminated glass samples with the same interlayer thickness. The average MLR of 13 mm PVB, SGP and EVA laminated glass samples with 1.52 mm interlayer was 0.100, 0.101, 0.035 g/s·m2, respectively) (see Table 3). It indicates that the fire spread for EVA laminated glass will be less compared to PVB and SGP laminated glass. It can also be seen from Table 3 that the average MLR value of 10 mm PVB laminated glass increases from 0.015 to 0.064 g/s·m2 with an increase in the heat flux from 25 kW/m2 to 75 kW/m2.
pMLR was also greatly influenced by external heat fluxes, as stated in Section 3.2. When the heat flux increased to 50 kW/m2, the mass loss rate (MLR) also increased as the pyrolysis process accelerated with higher heat flux (see Figure 13). Thus, the ignition time rapidly decreases with higher external heat flux, as shown in Figure 6c. At 75 kW/m2, the MLR increased rapidly to 0.064 g/s·m2 for the same reason stated earlier.

3.4.4. Fire Hazard Assessment

Some common fire performance indicators such as fire growth index (FGI), fire performance index (FPI) and maximum average rate of heat emission (MARHE) were calculated based on cone calorimeter test data to assess the fire hazard of PVB, EVA and SGP interlayer laminated glass samples. FGI and FPI values are determined using Equation (5) and Equation (6), respectively, based on the pHRR and time to reach pHRR (tpHRR) of the laminated glass samples.
F GI = pHRR t pHRR
FPI = t ign pHRR
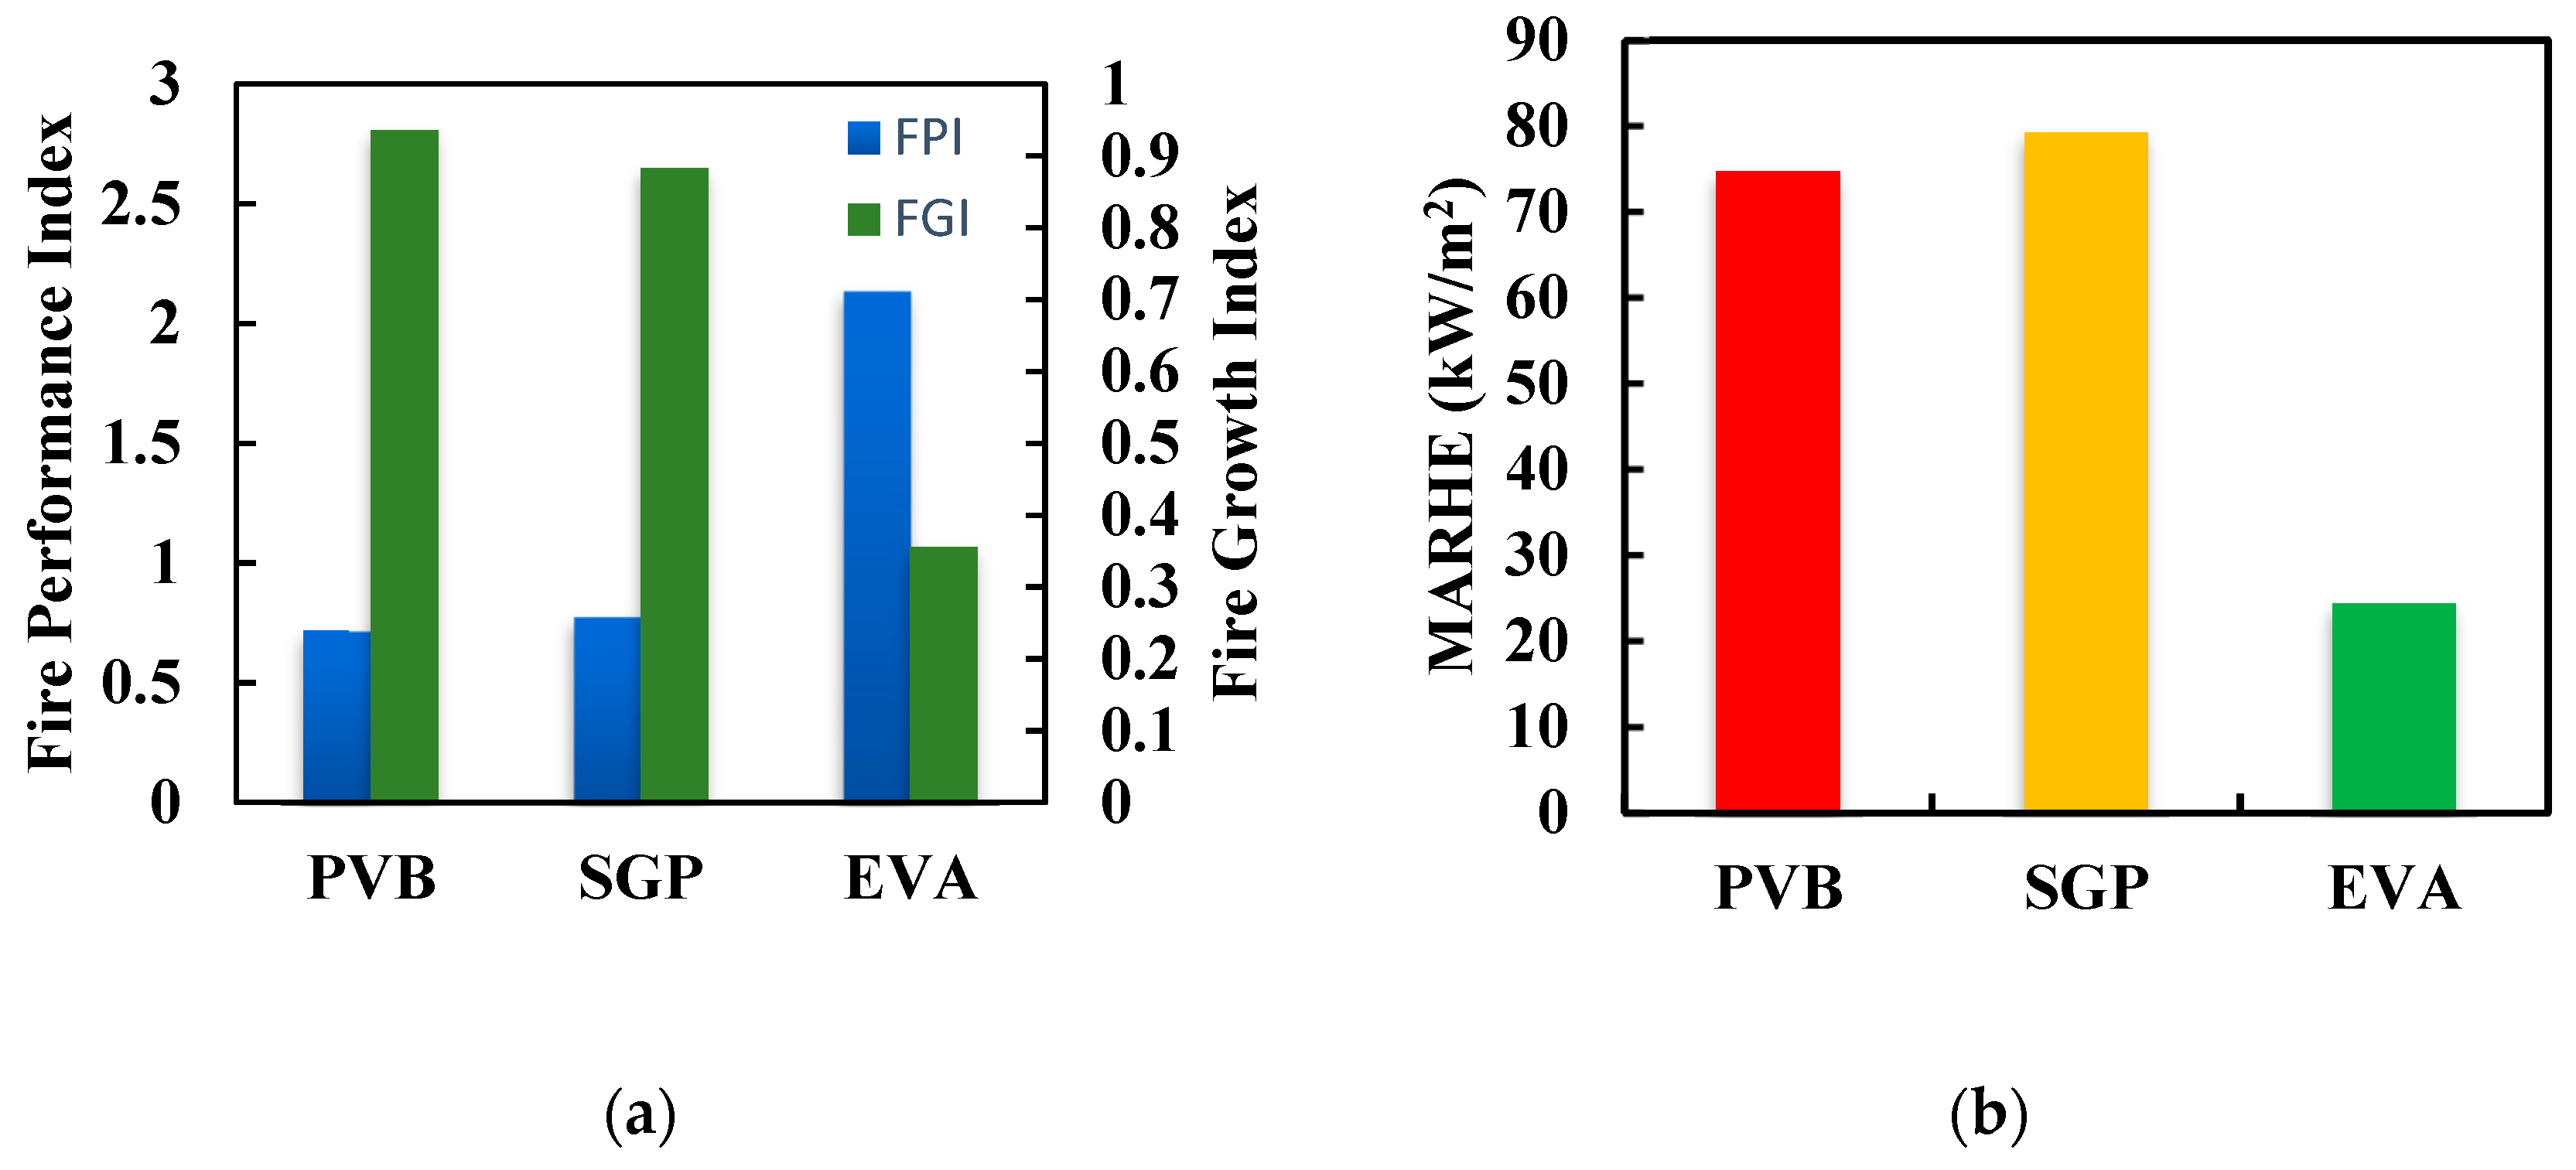
The fire hazard performance assessment properties of tested samples are shown in Figure 14. In fire performance studies, a low FGI rating means excellent fire retardant and the higher the FPI value, the better the flame resistance property [24,25]. It can be seen from Table 4 that the FGI and FPI values of laminated glass change with changes in the glass pane thickness, heat release rate and interlayer materials. Based on the FIGRA and FPI bars shown in Figure 14a, the rank of the fire and flame resistance of the investigated laminated glass samples with the same 1.52 mm interlayer can be ranked as EVA > SGP > PVB. It indicates that the fire hazard of EVA laminated glass is comparatively lower compared to PVB and SGP laminated glasses. PVB laminated glass showed the most fire hazard among the three types of interlayers. However, 5 mm glass pane thickness on both sides of PVB improved the performance of laminated glass compared to 3 mm glass pane thickness. On the other hand, a linear correlation was observed between the external heat-flux exposure and the fire performance of the PVB laminated glass samples.
MARHE is used to determine the average heat generated during each combustion period, which is measured according to Equation (7). This parameter is defined as a maximum value of the cumulative heat release over time (highest average heat release rate). Therefore, it can be regarded as an excellent indicator of fire development in controlled circumstances [26].
MARHE = max | n t n + 1 q ˙ ¯ ( t ) d t t n + 1 t n |
Here, q ˙ ¯   ( t ) is the mean heat release rate at time, t.
The trends of the MARHE ranking seem akin to those of FGI ranking, as shown in Table 4. The MARHE value of PVB and SGP laminated glass is more than three (03) times higher compared to EVA laminated glass with 1.52 mm interlayer (see Figure 14b). The MARHE values of PVB, SGP and EVA laminated glass samples tested at the heat flux of 50 kW/m2 are 74.71, 79.20 and 24.37 kW/m2, respectively.

3.4.5. Smoke Hazard

Total smoke production (TSP) and specific extinction area (SEA) are determined to investigate the smoke hazard potential of the different interlayer samples with varying thicknesses and heat flux. The time-averaged values of the SEA of the samples were considered the peak values of SEA, which are sensitive to mass changing of the sample. Hence, the average SEA indicates a better understanding of the overall smoking behaviour of the samples. The values of TSP and average SEA were reduced by almost 50% when the thickness of the glass pane was increased from 3 mm to 5 mm (Table 5).
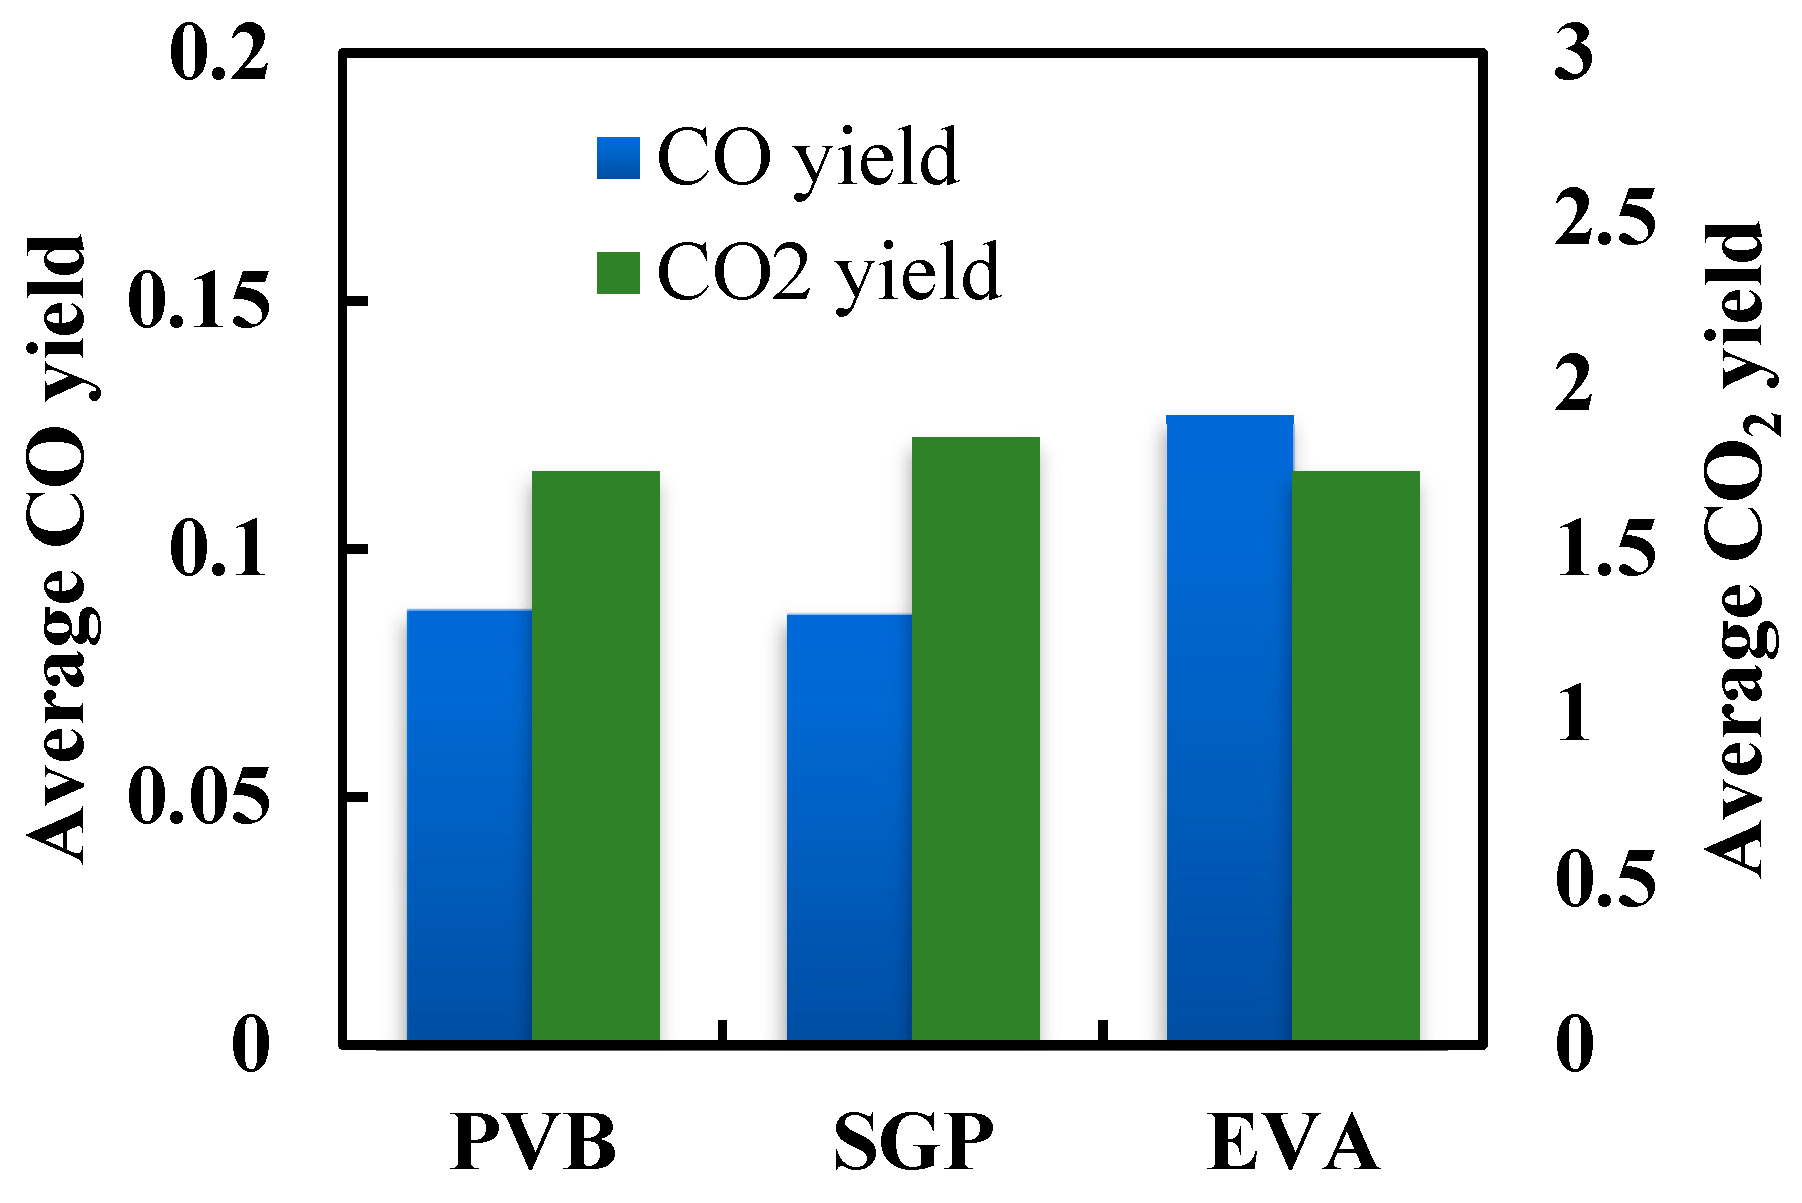
For the same glass thickness and interlayer material, the TSP and avg. SEA values were significantly reduced at 50 kW/m2 though slightly increased at 75 kW/m2 heat flux. This result implies that there was remarkable smoke generation at 25 kW/m2 heat flux, and it became lowest at 50 kW/m2. Considering three interlayer samples with the same thickness from Table 5, it is identified that there was higher total smoke production in the case of the SGP interlayer laminated glass sample 3.898 m2, whereas only 0.401 m2 smoke was generated in total for the EVA interlayer sample. The same trend also followed in the case of avg. SEA values. The CO yield values were changed with thickness increase, whereas it was gradually increased with heat flux increase, as shown in Table 5. However, it was the same for SGP and PVB samples but increased for EVA samples (Figure 15). In the case of CO2 yield, the value was the same for PVB and EVA samples but slightly increased for SGP samples.
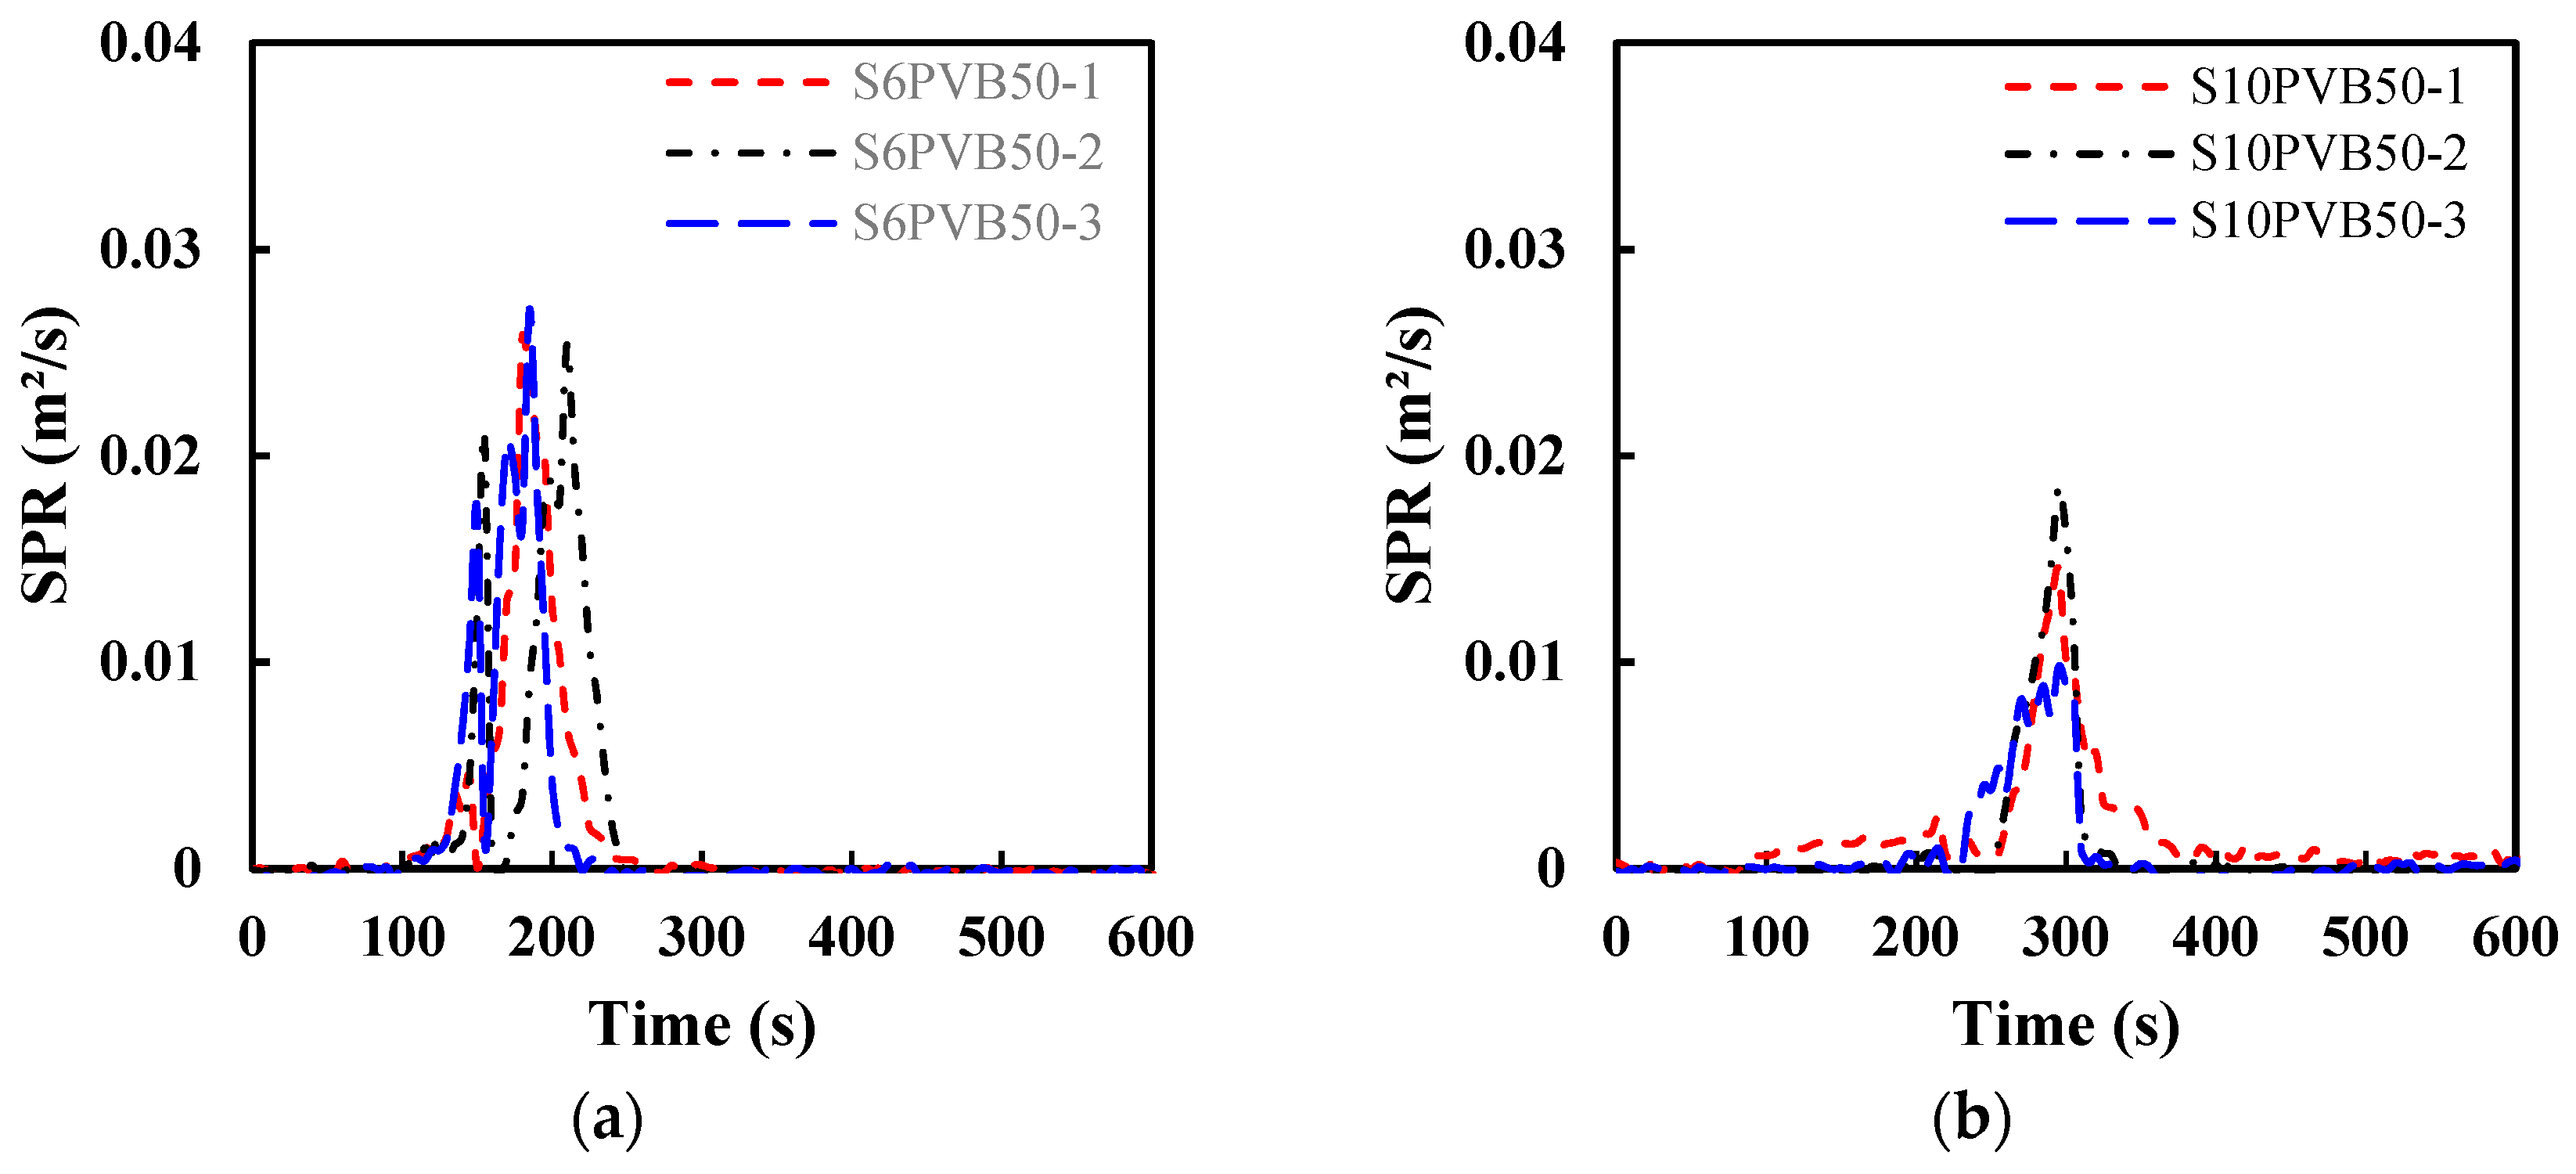
It can be seen from Figure 16a,b that the smoke production rate (SPR) values were decreased with an increase in the glass pane thickness. The SPR values were almost the same for both PVB and SGP interlayers, whereas the SPR values for EVA samples were significantly reduced (less than 0.01 m2/s), as shown in Figure 16c–e.
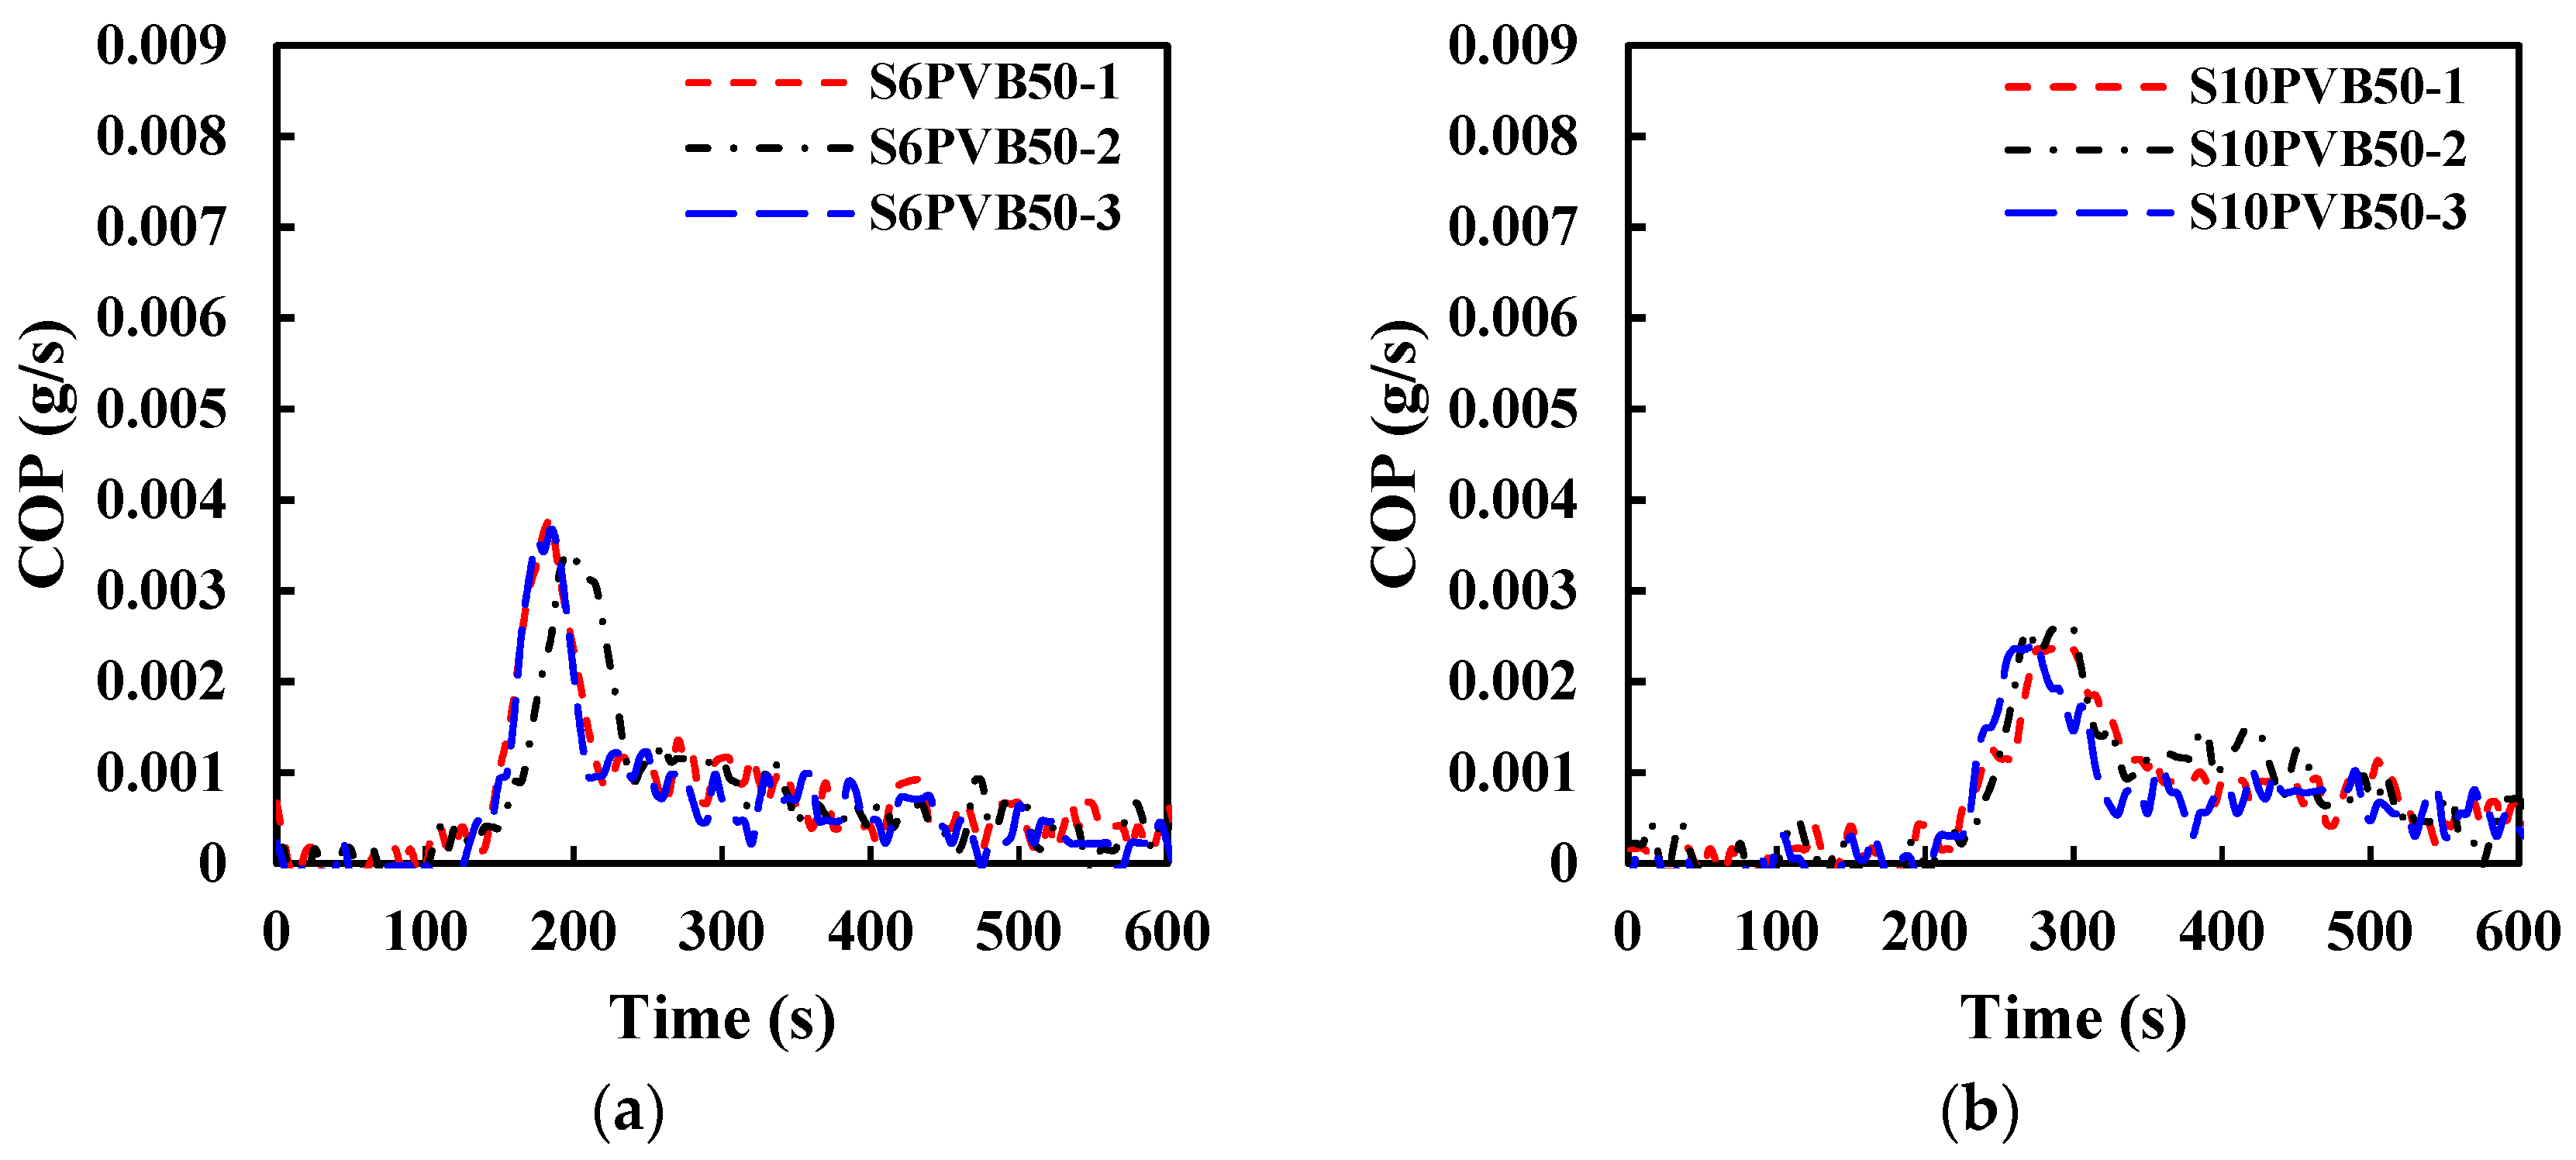
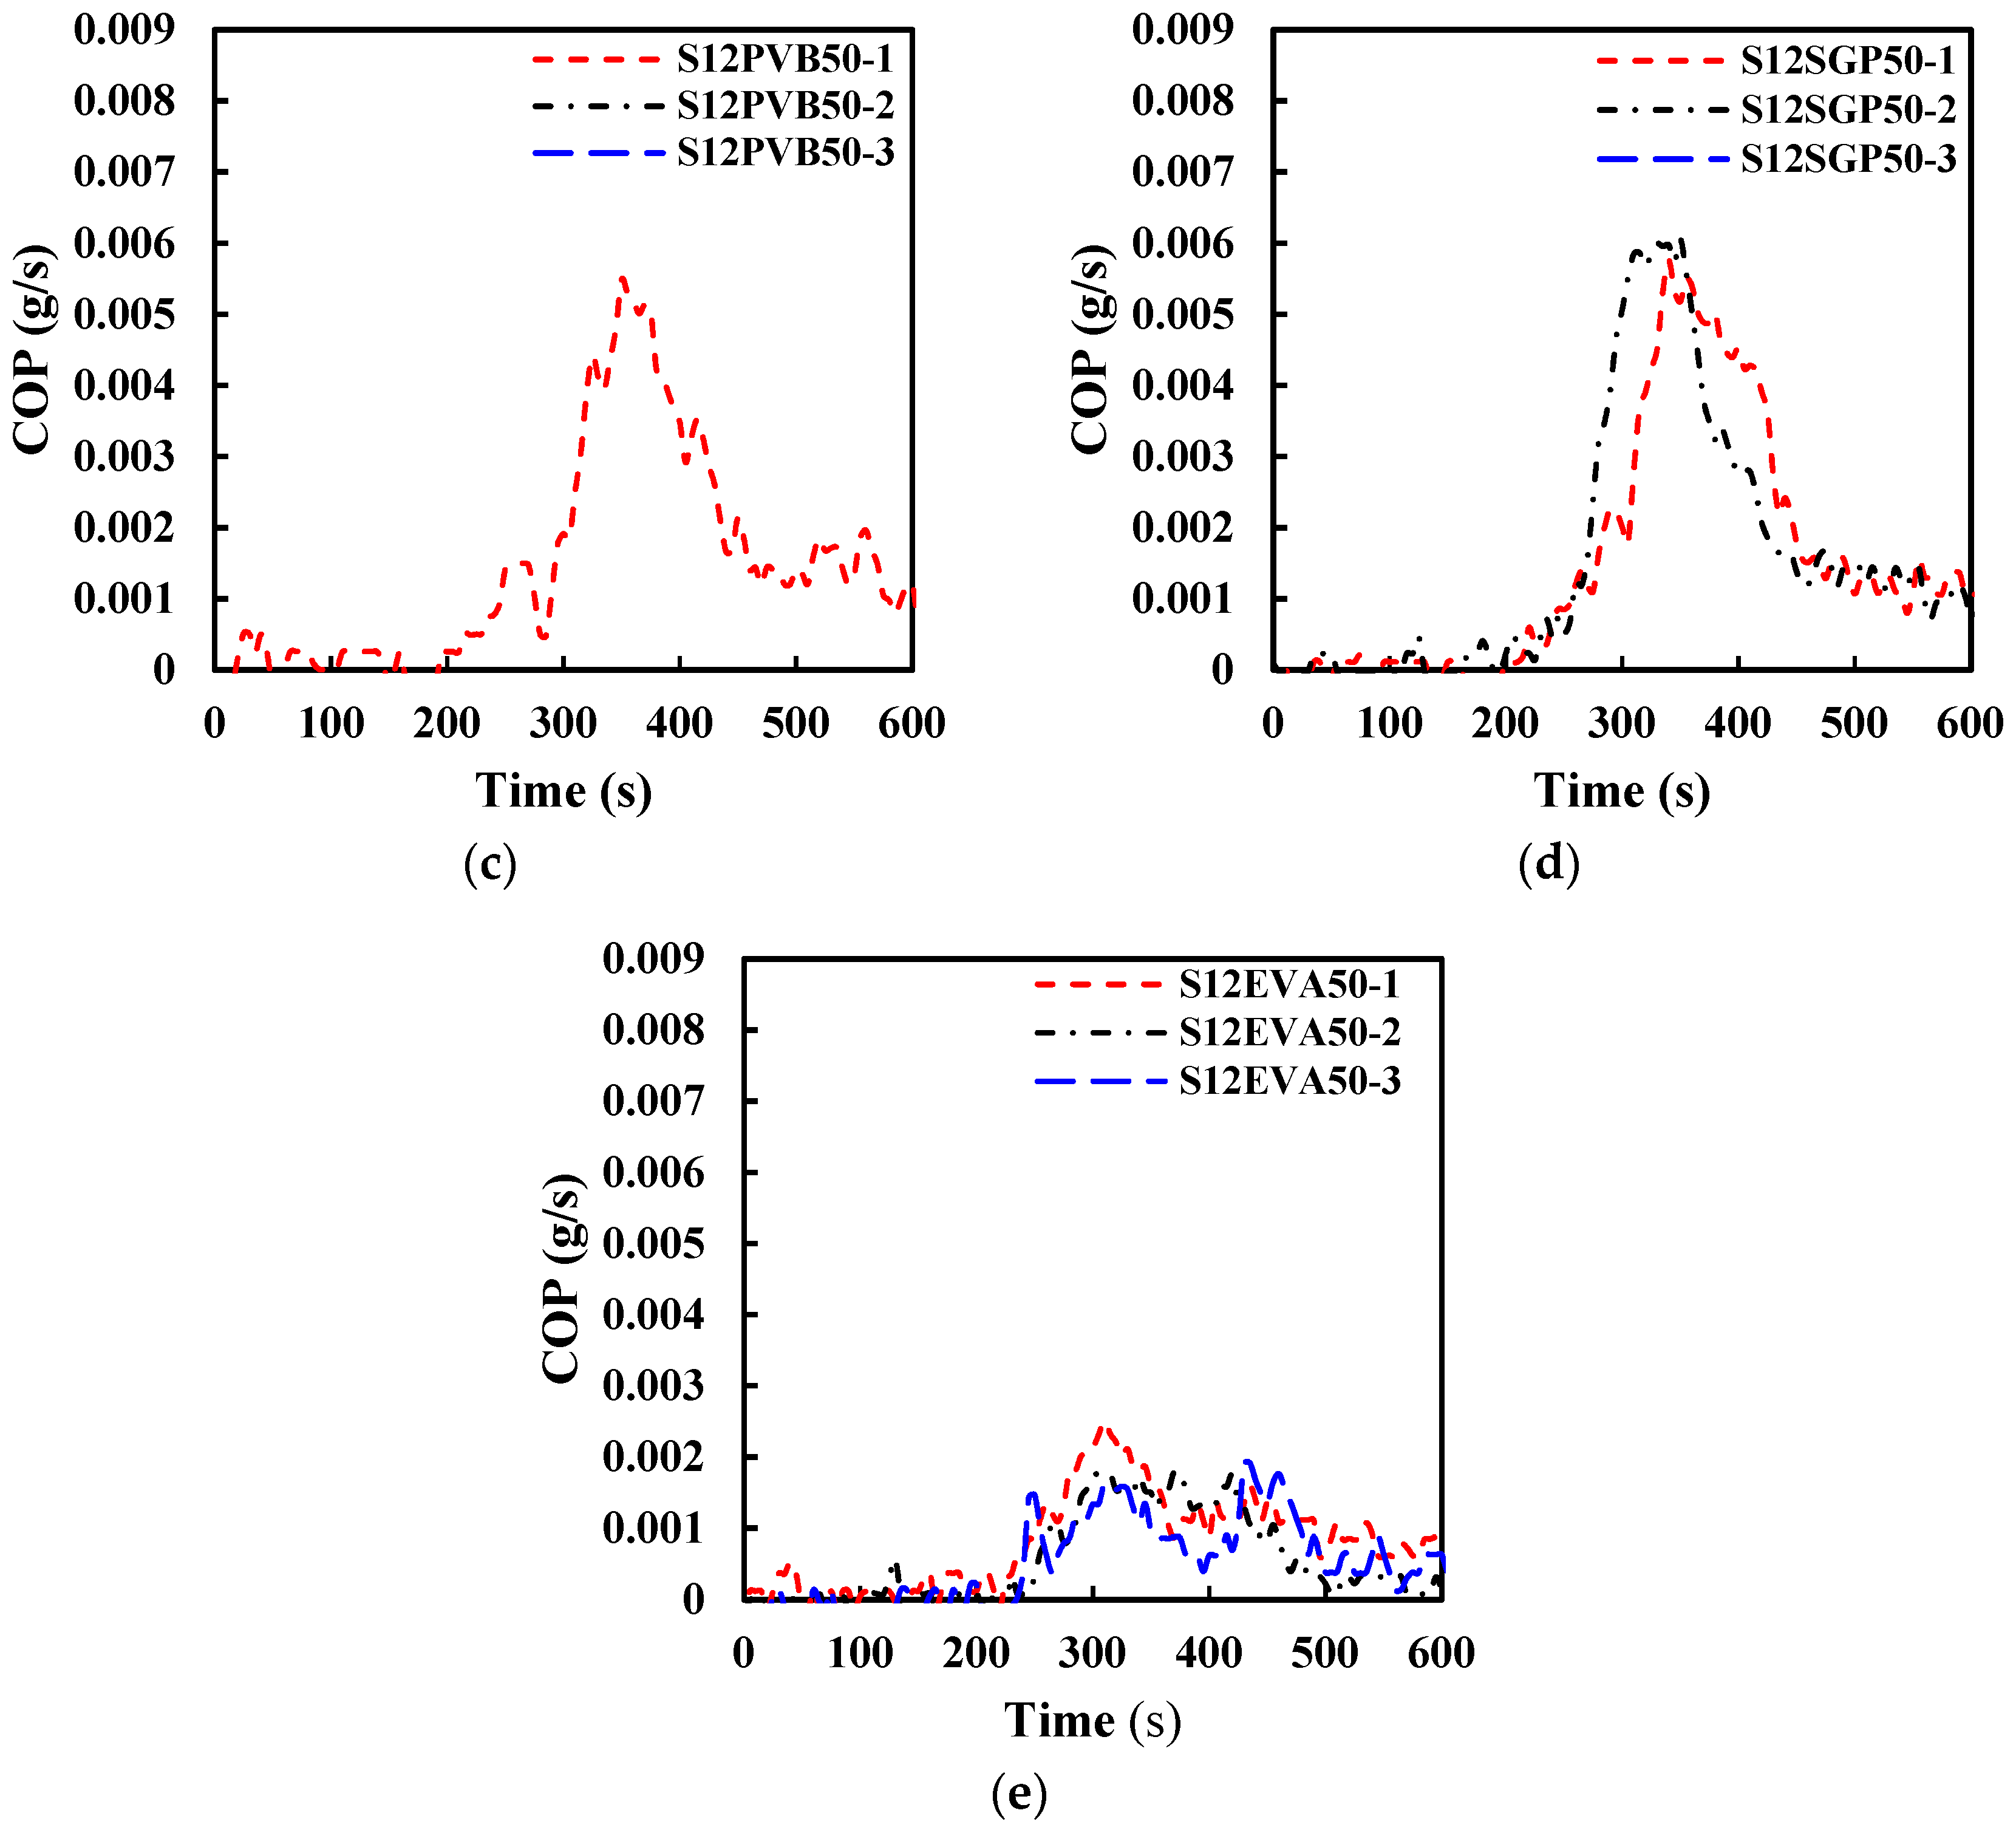
The carbon monoxide production (COP) decreased with the glass thickness increase presented in Figure 17a,b from 0.004 g/s to less than 0.003 g/s. With the same thickness and heat flux of 50 kW/m2, the values of COP were maximum for SGP (0.006 g/s), whereas it was significantly reduced to around 0.002 g/s for EVA samples, as presented in Figure 17c–e. These results indicate the fire hazard potential of three types of interlayers containing laminated glass with varying thickness and heat flux. EVA interlayer samples exhibited less hazard potential than the others.

4. Phenomenological Modelling

A phenomenological model is developed in this study based on the test data and using regression analysis to predict the pHRR values of the laminated glass samples. The pHRR value of a material is considered as one of the main flammability parameters for fire hazard [22]. Fire hazard assessment of material is very important for construction applications. By predicting the pHRR values, it will be possible to identify the fire hazard status of the material. The researchers have developed several models to predict pHRR for flame retardancy identification [22,27]. In this research, a simplified equation (Equation (8)) is developed based on the mass loss, effective heat of combustion and external heat flux. The predicted pHRR is determined using Equation (8). It can be seen from Table 3 that the pHRR value depends on the mass loss rate, which is also dependent on the external heat flux and type of materials. It is worth noting that EHC is greatly influenced by the type of materials than the heat flux.
pHRR = 2.2 e 0.076 A
where A is the correlating factor determined using Equation (9), developed based on the regression analysis by considering the effect of mass loss, effective heat of combustion, external heat flux and type of interlayer material, as shown in Figure 18.
A = 3.54 × B × q ext × EHC 0.1 MLR 0.17   e 0.02 q ex
where B is a factor for interlayer materials (Equation (10)), EHC is effective heat of combustion, MLR is mass loss rate, and qext is external heat flux.
B = { 0.95                             for   PVB   interlayer 0.95                           for   SGP   interlayer 0.90                           for   EVA   interlayer
The calculated value of pHRR determined using Equation (8) is plotted in Figure 19 against the experimental values of 21 test data. It can be seen that the predicted value is very close to the test data. The average value is 1.025 and stadandard deviation is 0.079. The average prediction error is 7.7%. It is worth noting that the prediction error of 1 datum out of 21 tested samples is 17% and the prediction error of the remaining test samples is within the limit of 10%, which indicates a very good prediction accuracy.

5. Conclusions

This study investigated the reaction-to-fire performance of laminated glass by considering different thicknesses of the glass pane, heat fluxes, and types of interlayer materials. The effects of the interlayer thickness on the fire hazard properties of the laminated glass were also investigated. The reaction-to-fire properties, fire hazard and smoke hazard were analysed. The following conclusion can be drawn based on the test results of the current study.
The ignition time of laminated glass is increased to 200 s for 10 mm thick laminated glass, which was 130 s in the case of the 6 mm glass sample. The ignition time is significantly dropped in the case of higher heat exposures (130 s at 75 kW/m2), while it was 570 s at 25 kW/m2 heat flux. The interlayer materials (PVB, SGP, EVA) do not influence the ignition time of the laminated glass, as in all cases with 50 kW/m2 heat flux, the ignition time was 225 s.
The peak heat release rate (pHRR) of laminated glass decreases with the increase in the thickness of the glass pane, and early cracks are observed for thinner glass pane compared to thicker glass panes. The higher pHRR is observed for PVB laminated glass (313.5 kW/m2) and the lower pHRR is observed for EVA laminated glass (105 kW/m2). This variation mainly depends on the glass pane thickness and interlayer materials.
The average total heat release (THR) of EVA laminated glass is significantly low (10.26 MJ/m2) compared to PVB and SGP laminated glasses (42.28 MJ/m2 for PVB interlayer and 42.79 MJ/m2 for SGP interlayer). This could be due to the lower MLR of EVA laminated glass compared to PVB and SGP laminated glass. It indicates that the fire spread for EVA laminated glass will be less compared to PVB and SGP laminated glass.
The cracking time is higher for low-thickness glass panes. A thinner glass pane exposed to a higher heat irradiance can crack earlier than a thicker glass pane. The early cracking exposes the interlayer to heat irradiance so that fire hazards can be increased. EVA samples provide greater stress crack resistance (at 154 s) than the other interlayer samples (87 s and 127 s for SGP and PVB interlayer laminated glass samples respectively). This longer cracking time may be due to EVA’s higher thermal inertia than PVB and SGP.
The values of total smoke production (TSP) and specific extinction area (SEA) were reduced by almost half of the total value when the thickness of the glass panes was increased from 3 mm to 5 mm. EVA laminated glass produced less smoke and exhibited less smoke hazard potential than PVB and SGP laminated glass.
Further research can be conducted to investigate the high temperature properties, char formation of burning materials and material characterisation of interlayer materials and glass materials. The proposed model to predict the value pHRR of laminated glass can be validated further with more test data such as thickness.

Author Contributions

Conceptualisation, M.K.H. and P.R.; formal analysis, M.K.H. and M.R.H.; investigation, K.P.L.; methodology, M.K.H.; supervision, P.R.; writing—original draft, M.K.H. and M.R.H.; writing—review and editing, K.P.L., M.D.H., P.R., G.D. and S.S. All authors have read and agreed to the published version of the manuscript.

Funding

This research received no external funding.

Institutional Review Board Statement

Not applicable.

Informed Consent Statement

Not applicable.

Data Availability Statement

Data is available upon the request.

Acknowledgments

The authors would like to acknowledge the support provided by the fire testing lab of Warringtonfire to perform all tests. The authors sincerely appreciate all financial and technical support by Western Sydney University and Warringtonfire.

Conflicts of Interest

The authors declare no conflict of interest.

References

  1. Debuyser, M.; Sjöström, J.; Lange, D.; Honfi, D.; Sonck, D.; Belis, J. Behaviour of monolithic and laminated glass exposed to radiant heating. Constr. Build. Mater. 2017, 130, 212–229. [Google Scholar] [CrossRef]
  2. Bedon, C.; Zhang, X.; Santos, F.; Honfi, D.; Kozłowski, M.; Arrigoni, M.; Figuli, L.; Lange, D. Performance of structural glass facades under extreme loads–Design methods, existing research, current issues and trends. Constr. Build. Mater. 2018, 163, 921–937. [Google Scholar] [CrossRef]
  3. Martin, M.; Centelles, X.; Sole, A.; Barreneche, C.; Fernández, A.; Cabeza, L. Polymeric interlayer materials for laminated glass: A review. Constr. Build. Mater. 2020, 230, 116897. [Google Scholar] [CrossRef]
  4. Emmons, H. The needed fire science. In Proceedings of the Fire Safety Science-Proceedings of the First International Symposium; IAFSS: Berkeley, CA, USA, 1986; pp. 33–53. Available online: https://publications.iafss.org/publications/fss/1/33/view/fss_1-33.pdf (accessed on 28 January 2023).
  5. Babrauskas, V. Glass Breakage in Fires; Fire Science and Technology Inc.: Issaquah, WA, USA, 2011. [Google Scholar]
  6. Wang, Y.; Hu, J. Performance of laminated glazing under fire conditions. Compos. Struct. 2019, 223, 110903. [Google Scholar] [CrossRef]
  7. Harada, K.; Enomoto, A.; Uede, K.; Wakamatsu, T. An experimental study on glass cracking and fallout by radiant heat exposure. Fire Saf. Sci. 2000, 6, 1063–1074. [Google Scholar] [CrossRef] [Green Version]
  8. Shields, T.J.; Silcock, G.; Flood, M. Performance of a single glazing assembly exposed to a fire in the centre of an enclosure. Fire Mater. 2002, 26, 51–75. [Google Scholar] [CrossRef]
  9. Shields, T.; Silcock, G.; Flood, M. Performance of a single glazing assembly exposed to enclosure corner fires of increasing severity. Fire Mater. 2001, 25, 123–152. [Google Scholar] [CrossRef]
  10. Wang, Y.; Wang, Q.; Wen, J.; Sun, J.; Liew, K. Investigation of thermal breakage and heat transfer in single, insulated and laminated glazing under fire conditions. Appl. Therm. Eng. 2017, 125, 662–672. [Google Scholar] [CrossRef] [Green Version]
  11. Rickard, I.; Spearpoint, M.; Lay, S. The performance of laminated glass subjected to constant heat fluxes related to building fires. Fire Mater. 2021, 45, 283–295. [Google Scholar] [CrossRef]
  12. MHossain, D.; Hassan, M.; Akl, M.; Pathirana, S.; Rahnamayiezekavat, P.; Douglas, G.; Bhat, T.; Saha, S. Fire Behaviour of Insulation Panels Commonly Used in High-Rise Buildings. Fire 2022, 5, 81. [Google Scholar] [CrossRef]
  13. Hossain, M.; Hassan, M.; Yuen, A.; He, Y.; Saha, S.; Hittini, W. Flame behaviour, fire hazard and fire testing approach for lightweight composite claddings—A review. J. Struct. Fire Eng. 2021, 12, 257–292. [Google Scholar] [CrossRef]
  14. Hossain, D.; Hassan, K.; Yuen, A.C.Y.; Wang, C.; Hittini, W. Influencing factors in small-scale fire testing of aluminium composite panels. In Proceedings of the 12th Asia-Oceania Symposium on Fire Science and Technology (AOSFST 2021), Virtual, 7–9 December 2021; The University of Queensland: Brisbane, Australia, 2021. [Google Scholar]
  15. Hossain, M.D.; Saha, S.; Hassan, M.K.; Yuen, A.C.Y.; Wang, C.; Hittini, W.; George, L.; Wuhrer, R. Testing of aluminium composite panels in a cone calorimeter: A new specimen preparation method. Polym. Test. 2022, 106, 107454. [Google Scholar] [CrossRef]
  16. ISO 5660-2:3025; Reaction-to-Fire Tests—Heat Release, Smoke Production and Mass Loss Rate. BSI Standards Publication: London, UK, 2019.
  17. Babrauskas, V. Comparative Rates of Heat Release from Five Different Types of Test Apparatuses. J. Fire Sci. 1986, 4, 148–159. [Google Scholar] [CrossRef]
  18. Ostman, B.; Nussbaum, R.M. Correlation between small-scale rate of heat release and full-scale room flashover for surface linings. Fire Saf. Sci. 1989, 2, 823–832. [Google Scholar] [CrossRef] [Green Version]
  19. Paul, K.T. Cone calorimeter: Initial experiences of calibration and use. Fire Saf. J. 1994, 22, 67–87. [Google Scholar] [CrossRef]
  20. An, W.; Jiang, L.; Sun, J.; Liew, K. Correlation analysis of sample thickness, heat flux, and cone calorimetry test data of polystyrene foam. J. Therm. Anal. Calorim. 2015, 119, 229–238. [Google Scholar] [CrossRef]
  21. El Gazi, M.; Sonnier, R.; Giraud, S.; Batistella, M.; Basak, S.; Dumazert, L.; Hajj, R.; El Hage, R. Fire behavior of thermally thin materials in cone calorimeter. Polymers 2021, 13, 1297. [Google Scholar] [CrossRef]
  22. Klassen, M.S.; Sutula, J.A.; Holton, M.M.; Roby, R.J.; Izbicki, T. Transmission through and breakage of multi-pane glazing due to radiant exposure. Fire Technol. 2006, 42, 79–107. [Google Scholar] [CrossRef]
  23. Schartel, B.; Hull, T.R. Development of fire-retarded materials—Interpretation of cone calorimeter data. Fire Mater. Int. J. 2007, 31, 327–354. [Google Scholar] [CrossRef]
  24. Xu, Q.; Jin, C.; Jiang, Y. Compare the flammability of two extruded polystyrene foams with micro-scale combustion calorimeter and cone calorimeter tests. J. Therm. Anal. Calorim. 2017, 127, 2359–2366. [Google Scholar] [CrossRef]
  25. Hirschler, M.M. Flame retardants and heat release: Review of data on individual polymers. Fire Mater. 2015, 39, 232–258. [Google Scholar] [CrossRef] [Green Version]
  26. Sacristán, M.; Hull, T.R.; Stec, A.A.; Ronda, J.C.; Galià, M.; Cádiz, V. Cone calorimetry studies of fire retardant soybean-oil-based copolymers containing silicon or boron: Comparison of additive and reactive approaches. Polym. Degrad. Stab. 2010, 95, 1269–1274. [Google Scholar] [CrossRef] [Green Version]
  27. Thompson, S.L.; Apostolakis, G.E. A response surface approximation for the bench-scale peak heat release rate from upholstered furniture exposed to a radiant heat source. Fire Saf. J. 1994, 22, 1–24. [Google Scholar] [CrossRef]
Figure 1. A typical laminated glass with interlayer materials.
Fire 06 00084 g001
Figure 2. Various samples of laminated glass with different interlayers used in the test: (a) 10 mm glass with 0.38 PVB interlayer (b) 12 mm glass with 1.52 PVB interlayer (c) 12 mm glass with 1.52 SGP interlayer (d) 12 mm glass with 1.52 EVA interlayer.
Fire 06 00084 g002aFire 06 00084 g002b
Figure 3. Schematic diagram of cone calorimeter test set-up used for laminated glass.
Fire 06 00084 g003
Figure 4. Effect of glass thicknesses on HRR curves for 6 and 10 mm glass with 0.38 PVB interlayer at 50 kW/m2 heat flux: (a) HRR for 6 mm glass pane (b) HRR for10 mm glass pane and (c) average Peak heat release rate (pHRR).
Fire 06 00084 g004
Figure 5. Observation during and after fire of (a) 6 mm and (b) 10 mm glass with 0.38 PVB interlayer at 50 kW/m2 heat flux.
Fire 06 00084 g005
Figure 6. Effect of external heat flux on (a) HRR curves, (b) pHRR and (c) time to ignition of 10 mm PVB laminated glass samples.
Fire 06 00084 g006
Figure 7. Observation during and after fire of 10 mm glass with 0.38 PVB interlayer with different heat fluxes: (a) 25 kW/m2 (b) 50 kW/m2 (c) 75 kW/m2.
Fire 06 00084 g007
Figure 8. Effect of interlayer materials on (ac) HRR curves, (d) average pHRR values and (e) average MLR of 12 mm glass tested at 50 kW/m2 heat flux.
Fire 06 00084 g008aFire 06 00084 g008b
Figure 9. Observation during and after fire of 12 mm glass at 50 kW/m2 heat flux with 1.52 mm thick (a) PVB, (b) SGP and (c) EVA interlayers.
Fire 06 00084 g009
Figure 10. Effect of thickness and interlayer materials on (a) time to ignition (b) time to flameout and (c) time to pHRR of 6, 10 and 12 mm glass tested at 50 kW/m2 heat flux.
Fire 06 00084 g010
Figure 11. THR of different interlayer 12 mm laminated glass at 50 kW/m2.
Fire 06 00084 g011
Figure 12. Mass loss rate at 50 kW/m2: (a) 6 mm glass with 0.38 PVB interlayer (b) 10 mm glass with 0.38 PVB interlayer (c) 12 mm glass with 1.52 PVB interlayer (d) 12 mm glass with 1.52 SGP interlayer and (e) 12 mm glass with 1.52 EVA interlayer.
Fire 06 00084 g012
Figure 13. Effect of external heat fluxes on 10 mm PVB laminated glass.
Fire 06 00084 g013
Figure 14. (a) FPI, FGI and (b) MARHE of different interlayer laminated glass at 50 kW/m2.
Fire 06 00084 g014
Figure 15. CO yield and CO2 yield of different interlayer laminated glass at 50 kW/m2.
Fire 06 00084 g015
Figure 16. Smoke production rate at 50 kW/m2: (a) 6 mm glass with 0.38 PVB interlayer (b) 10 mm glass with 0.38 PVB interlayer (c) 12 mm glass with 1.52 PVB interlayer (d) 12 mm glass with 1.52 SGP interlayer and (e) 12 mm glass with 1.52 EVA interlayer.
Fire 06 00084 g016aFire 06 00084 g016b
Figure 17. CO production rate of laminated glass at 50 kW/m2: (a) 6 mm glass with 0.38 PVB interlayer (b) 10 mm glass with 0.38 PVB interlayer (c) 12 mm glass with 1.52 PVB interlayer (d) 12 mm glass with 1.52 SGP interlayer and (e) 12 mm glass with 1.52 EVA interlayer.
Fire 06 00084 g017aFire 06 00084 g017b
Figure 18. pHRR vs correlating factor A for the laminated glass samples.
Fire 06 00084 g018
Figure 19. Calculated values vs experimental values of pHRR for laminated glass samples.
Fire 06 00084 g019
Table 1. Test material properties.
PropertiesPVBSGPEVA
Density of interlayer915–1070 kg/m3950 kg/m3945–955 kg/m3
Density of laminated glass227422422402
Thermal conductivity of interlayers0.20 (W/mK)0.25 (W/mK)0.34 (W/mK)
Table 2. Details of test specimens.
Sl NoSample
Label
Glass Pane
Thickness (mm)
Interlayer Thickness (mm)Interlayer Material TypeHeat Flux
(kW/m2)
Sample Size, L × B × t (mm)pHRR (kW/m2)
1S6PVB50-130.38PVB50100 × 100 × 6.38237
2S6PVB50-230.38PVB50100 × 100 × 6.38218
3S6PVB50-330.38PVB50100 × 100 × 6.38222
4S10PVB25-150.38PVB25100 × 100 × 10.3844
5S10PVB25-250.38PVB25100 × 100 × 10.3845
6S10PVB25-350.38PVB25100 × 100 × 10.3850
7S10PVB50-150.38PVB50100 × 100 × 10.38156
8S10PVB50-250.38PVB50100 × 100 × 10.38148
9S10PVB50-350.38PVB50100 × 100 × 10.38153
10S10PVB75-150.38PVB75100 × 100 × 10.38203
11S10PVB75-250.38PVB75100 × 100 × 10.38191
12S10PVB75-350.38PVB75100 × 100 × 10.38197
13S12PVB50-161.52PVB50100 × 100 × 13.52236
14S12PVB50-261.52PVB50100 × 100 × 13.52399
15S12PVB50-361.52PVB50100 × 100 × 13.52318
16S12SGP50-161.52SGP50100 × 100 × 13.52289
17S12SGP50-261.52SGP50100 × 100 × 13.52320
18S12SGP50-361.52SGP50100 × 100 × 13.52293
19S12EVA50-161.52EVA50100 × 100 × 13.52103
20S12EVA50-261.52EVA50100 × 100 × 13.52107
21S12EVA50-361.52EVA50100 × 100 × 13.52106
Table 3. Average reaction-to-fire properties of laminated glass samples.
Test SpecimensS6PVB50S10PVB50S10PVB25S10PVB75S12PVB50S12SGP50S12EVA50
Time to ignition (s)130200570130225225225
Time to flameout (s)142219598143261243250
Total burning time (s)43555114134081208783510
pHRR (kW/m2)194.4515340.52197313.5289.5105.2
Time to pHRR (s)171268646185335328296
Average THR (MJ/m2)11.2711.218.4811.1942.2842.7910.26
Average mass loss rate (g/s·m2)0.0630.0430.0150.0640.1000.1010.035
Table 4. Fire hazard performance assessment properties of laminated glass samples.
Test SpecimensS6PVB50S10PVB25S10PVB50S10PVB75S12PVB50S12SGP50S12EVA50
FGI1.2900.0720.5751.0630.9360.8830.355
FPI0.57612.2841.3110.6610.7180.7772.138
MARHE (kW/m2)44.128.4729.4842.7974.7179.2024.37
Table 5. Smoke hazard properties of laminated glass samples.
Test SpecimensS6PVB50S10PVB25S10PVB50S10PVB75S12PVB50S12SGP50S12EVA50
TSP (m2)0.8212.3640.5451.0093.1463.8980.401
Avg. SEA (m2/kg)175.395710.0776.63175.913221.93254.8456.073
CO yield (kg/kg)0.0970.0510.1040.1260.0880.0870.127
CO2 yield (kg/kg)1.5631.6001.7291.6061.7341.8361.735
Disclaimer/Publisher’s Note: The statements, opinions and data contained in all publications are solely those of the individual author(s) and contributor(s) and not of MDPI and/or the editor(s). MDPI and/or the editor(s) disclaim responsibility for any injury to people or property resulting from any ideas, methods, instructions or products referred to in the content.