Article

A Quantitative Analysis of Fuel Break Effectiveness Drivers in Southern California National Forests

1
USDA Forest Service, National Office, Fire and Aviation Management, Fort Collins, CO 80526, USA
2
Department of Forest and Rangeland Stewardship, Colorado State University, Fort Collins, CO 80523, USA
3
USDA Forest Service, Rocky Mountain Research Station, Fort Collins, CO 80526, USA
4
USDA Forest Service, Rocky Mountain Research Station, Missoula, MT 59801, USA
5
Department of Forest Engineering, Resources & Management, Oregon State University, Corvallis, OR 97331, USA
*
Author to whom correspondence should be addressed.
Fire 2023, 6(3), 104; https://doi.org/10.3390/fire6030104
Submission received: 20 November 2022 / Revised: 21 January 2023 / Accepted: 28 February 2023 / Published: 7 March 2023
(This article belongs to the Special Issue Advances in the Measurement of Fuels and Fuel Properties)

Abstract

:
Fuel and wildfire management decisions related to fuel break construction, maintenance, and use in fire suppression suffer from limited information on fuel break success rates and drivers of effectiveness. We built a dataset of fuel break encounters with recent large wildfires in Southern California and their associated biophysical, suppression, weather, and fire behavior characteristics to develop statistical models of fuel break effectiveness with boosted regression. Our results suggest that the dominant influences on fuel break effectiveness are suppression, weather, and fire behavior. Variables related to fuel break placement, design, and maintenance were less important but aligned with manager expectations for higher success with wider and better maintained fuel breaks, and prior research findings that fuel break success increases with accessibility. Fuel breaks also held more often if burned by a wildfire during the previous decade, supporting the idea that fuel breaks may be most effective if combined with broader fuel reduction efforts.

1. Introduction

In response to escalating wildfire damage to natural resources and human assets in the Western US, there is pressure for land and fire managers to increase their investment in pre-fire fuels reduction, including linear fuel breaks intended to help firefighters safely control fires at smaller sizes ([1]; Infrastructure Investment and Jobs Act, 117-58 U.S.C. § Section 40806, 2021). As with any pre-fire fuels treatment, fuel breaks have uncertain benefits owing to imperfect knowledge of if, when, and under what conditions they will be used for fire suppression. Various forms of historical fire frequency analysis and simulation modeling of fire occurrence and spread already exist to help managers construct or prioritize the maintenance of fuel breaks in locations with the highest likelihood of intercepting damaging fires [2,3,4,5], but there are few quantitative models to estimate the probability of an engaged fuel break holding based on characteristics of the fuel break, fire, and suppression response [2,6,7,8], making it difficult to assess the potential benefit of existing and planned fuel breaks and fuel break systems.
Fuel breaks are roughly linear features designed to improve firefighting access, safety, and effectiveness by reducing fuel loads or altering fuel type or arrangement [7,9]. Fuel breaks are often associated with fire breaks, which are narrower strips with no fuel, such as a road or a dozer line specifically maintained for fire control [10,11]. Fuel break construction and maintenance methods and anticipated benefits to suppression can vary based on ecosystem and fire management system contexts. The desired effects on fire behavior may include reduced fire intensity, crown fire potential, spotting, ignition probability, and fire residence times [7,9]. Commonly sought-after benefits for suppression include: improved access, visibility, and safety; reduced resistance to control (greater fireline production); reduced mop up effort; better aerial retardant function; and improved conditions for suppression firing [7,9,10,12,13]. Ultimately, the purpose of constructing a fuel break or fire break is to improve control likelihood, so effectiveness is usually judged by whether the feature holds when engaged by fire [2,8,14,15].
Our current understanding of fuel break effectiveness comes from a mix of field experiments, physical modeling, and observational studies. Case studies, anecdotal observations, and professional experience document how fuel breaks improve control potential and the conditions that may cause them to fail, such as exposure to wind-driven head fires with spotting [7,9,13,16]. The pioneering fire break experiments of Wilson [6] provide empirical evidence that increasing fire break width and decreasing fireline intensity and ember sources in adjacent fuels (i.e., by creating a fuel break) should increase control probability. Physical modeling of fire propagation across grassland fuel breaks confirms that the optimal fuel break width increases with fireline intensity [17]. Unplanned observations of wildfires engaging with fuel treatments are commonly plagued by incomplete data to characterize the fuel treatment, fire environment, and suppression response [15,18,19], but they still provide useful insights about the effects of fuel break treatment methods, age, width, and size inferred from visible indicators of fire intensity [20,21], remotely sensed burn severity [22,23], or control outcomes [2,8,24].
Here, we build on the fuel break effectiveness research of Syphard et al. [2,8] with multivariate statistical techniques that are increasingly used to model fire control likelihood from large observational datasets of fire extents [25,26,27,28]. We investigate a variety of predictor variables including suppression effort and daily fire weather and behavior metrics to identify key controls on fuel break effectiveness.

2. Materials and Methods

We focused our analysis on the portions of fuel breaks that engaged with wildfires larger than 200 ha during the period 2017–2020 and within a 1 km buffer around the administrative boundaries of the Angeles, Cleveland, Los Padres, and San Bernardino National Forests in Southern California (Figure 1). The 200 ha minimum size was chosen to concentrate on fires that resisted an initial attack and were mapped with sufficient accuracy for evaluating if fuel breaks held or burned over. We limited our study to the period 2017–2020 so that we could account for suppression influences using spatial datasets of ground and aerial firefighting operations. We focused on fuel breaks associated with National Forest System lands in Southern California because of fuel break location data availability and the presence of fuel treatment records to characterize maintenance history. Southern California is unique among the mountainous regions of the Western US for its deep history of linear fuel break use [16] and its current fuel break abundance.
The four Southern California National Forests cross three ecoregions, including the Southern California Mountains, the Southern California/Northern Baja Coast, and the Central California Foothills and Coastal Mountains (level III ecoregions from [29]). The climate of the region is Mediterranean with hot dry summers and comparatively cooler and wetter winters. The region has two distinct fire seasons—a summer fire season characterized by high aridity and many ignitions, and a fall fire season with fewer ignitions but larger fires driven primarily by downslope gravity winds such as the Santa Ana and Sundowner winds [30,31]. Vegetation type varies by elevation and aspect with chaparral dominating the lowest elevations and south facing slopes, grading into mixed oak and evergreen woodlands at middle elevations, and transitioning into conifer forests at the highest elevations and north facing slopes (biophysical setting from [32]).

2.1. Wildfires

We compiled a GIS polygon dataset of final fire extents from multiple sources, including Monitoring Trends in Burn Severity ([33], years 2017–2018), the Geospatial Multi-Agency Coordination Group ([34], GeoMAC, years 2017–2019), the Wildland Fire Decision Support System ([35], WFDSS, years 2017–2020), and Wildland Fire Interagency Geospatial Services ([36], only 2020). For each fire, we selected the polygon that best aligned with the burned area visible in post-fire National Agriculture Imagery Program ([37], NAIP) aerial photography. All 22 fires that were subsequently identified to have fuel break interactions (Table 1) came from either GeoMAC or WFDSS, which are typically derived from high-resolution aerial infrared mapping or field-based mapping by local managers. Start and end dates for each fire were compiled from the previously mentioned spatial data sources, incident status summary reports (also known as “ICS-209s”) for all years [38], and the Fire Program Analysis Fire Occurrence Dataset [39] for the period of overlapping coverage (years 2017–2018).

2.2. Fuel Break Polylines

We developed a GIS polyline dataset representing fuel break centerlines by acquiring and cleaning a previous fuel break dataset for the entire study area, then intersecting these fuel break polylines with candidate wildfires, followed by the manual review and editing of the fuel breaks that interacted with wildfires. The fuel break dataset we started from represents the approximate centerlines of fuel breaks originally developed by Brennan and Keeley [40]. It was updated in 2015 by the USDA Forest Service (USFS) for a fuel break evaluation project [41] to include planned and potential fuel break locations and to remove legacy features from the original dataset that had not been maintained in recent decades. Some features added by the USFS did not conform to our spatial data standards or fuel break definition. We simplified any fuel break perimeters to centerlines and removed lines associated with the boundaries of several area-wide prescribed fires.
We then iteratively intersected the cleaned fuel break polylines with each candidate wildfire extent buffered by 400 m to identify fuel breaks with potential wildfire interactions. Potential fuel break–wildfire interactions were then manually reviewed using the most recent NAIP aerial photography prior to the wildfire to correct gross spatial alignment issues and digitize any missing fuel breaks. Fuel breaks were split into segments if the width, condition, or fire break status varied for more than 800 m in length (see the predictor variables section for definitions). We removed any features that were not visible in the pre-fire aerial photography, including legacy fuel breaks from the Brennan and Keeley data set [40] that reverted to natural vegetation and any potential or planned fuel breaks from the USFS that were not implemented before the fire.

2.3. Data Model

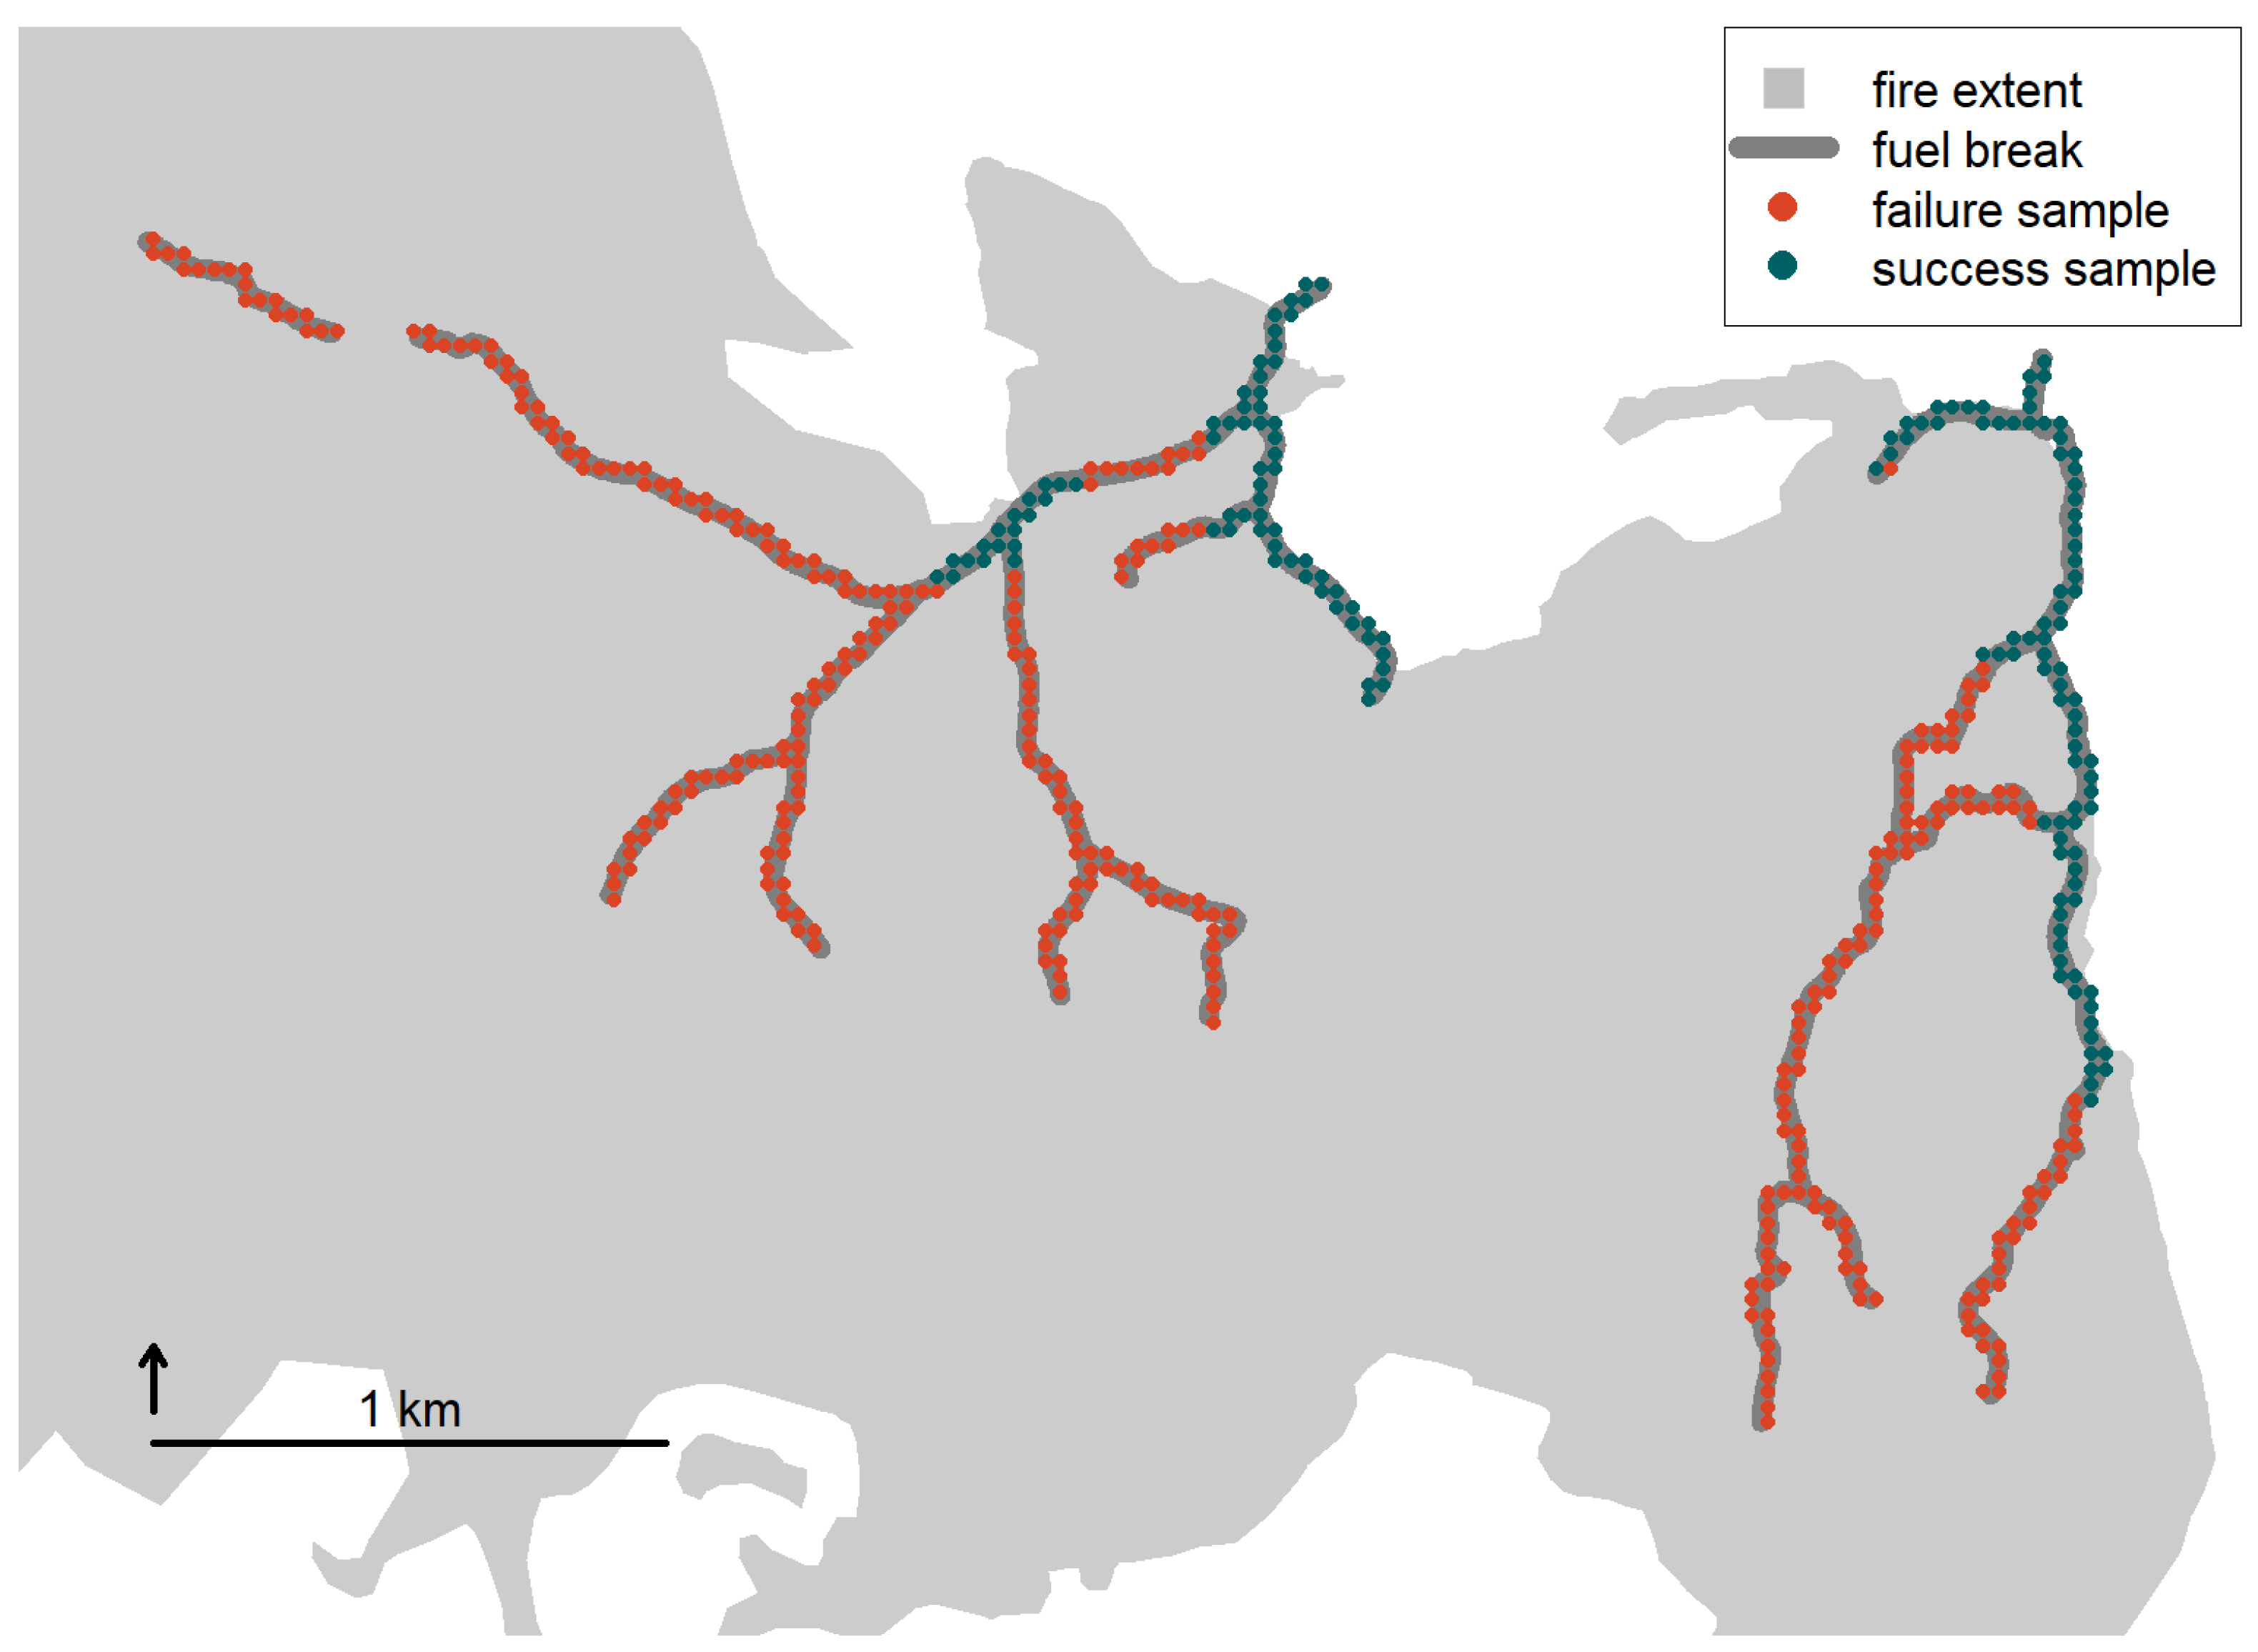
We used a dense sampling approach to generate observations of fuel break–wildfire interaction outcomes and associated predictor variables (Figure 2). By fire, the cleaned fuel break polylines were first rasterized at 30 m resolution to match the scale of our fuel and topography predictor variables, and then converted to points representing the cell centers. Fuel break sample points were considered held (success) if they fell within 100 m of the final fire perimeter plus half the fuel break width. The 100 m distance is to account for imprecision in the fuel break and fire perimeter mapping. The additional distance of half the fuel break width is to deal with situations where the fire stopped at the leading edge of a wide fuel break. The remaining samples that intersected the fire were considered burned over (failure).
The gridded sampling strategy was chosen to avoid generalizations that are required to analyze outcomes for the original polylines. Several challenges of working with the polylines as the observation units include: (1) deciding where one fuel break starts and the other begins; (2) dealing with length-dependent influences on exposure to fire and outcomes; (3) deciding how to attribute outcomes for lines that only partially engage with the fire; and (4) designing appropriate summary metrics for predictor variables that differ along the length of the fuel break. Our sampling approach captures the diversity of conditions along held and burned-over fuel breaks while avoiding difficult scale-related decisions necessary to attribute polylines with outcomes and representative predictor variables.

2.4. Predictor Variables

We considered a wide range of predictor variables related to fuel break accessibility, fire behavior, condition and design, suppression, topography, surrounding vegetation/fuels, and weather (Table 2; Figure S1). Predictor variables were selected to capture key drivers identified by previous studies [2,8] and to address manager questions about fuel break placement, design, and maintenance.

2.4.1. Accessibility

An earlier analysis of fuel break outcomes in this same region [2,8] found that fuel breaks were more likely to hold if accessible to firefighters. We represented accessibility in our model using a relative metric of road proximity. First, we calculated the Euclidean distance from the nearest road [42,43] in meters. Second, we converted to a relative measure of road proximity that declines linearly from a value for 1 on a road to a value of 0 at a distance of 1000 m. This reflects our expectation that roads will have a stronger positive influence on probability of control at shorter distances and it prevents models from identifying spurious statistical relationships at very long road distances.

2.4.2. Fire Behavior

Fire managers understand that fuel break success declines with increasing fire behavior whether represented by rate of spread, intensity, transition to crown fire, or initiation of spotting [7,9,16], but quantitative relationships have only been developed experimentally in limited settings [6]. Given the difficulty of characterizing fire behavior after an event, previous research used final fire size as a proxy for fire behavior, finding a strong negative relationship between fire size and fuel break success [2,8]. Here, we make use of satellite fire detections and final fire perimeters to characterize fire growth, intensity, and spread patterns.
We estimated the daily area burned (ha) by applying the Parks [44] raster interpolation method at 30 m resolution to fire detection points from MODIS and VIIRS [45] that occurred within 1000 m and +/− 5 days of the reported date range of each fire (Figure 3a). The estimated date of burning from this analysis was also extracted to the sample points to make associations with daily weather data (described in the weather section). Three of our study fires (2017 Lake, 2018 Charlie, and 2020 Rowher) did not have enough fire detections to model the date of burning. We assumed that these fires had sparse detections because most of the area burned quickly, so the final fire sizes (262–1356 ha) were assigned as the daily area burned for the earliest reported date for each fire.
We also attributed each sample point with the total fire radiative power (FRP) in MW from MODIS and VIIRS fire detections summed within a 1 km radius neighborhood of the point over the entire duration of the incident (Figure 3b). FRP represents the rate of radiative energy release detected within each satellite pixel extent. The 1 km neighborhood size allowed us to attribute most of our samples with FRP values (94.1%) while preserving much of the spatial variability in FRP across the larger fires.
Finally, we estimated the spread type associated with the fuel break encounters in categories of backing, flanking, and heading by first approximating the final fire shape as an ellipse and then dividing the ellipse into fireline intensity zones using Scott’s proportion of head fireline intensity equation [46] based on [47]. To accomplish this, we first identified the centroid of the fire detections from the first day of each fire to approximate the ignition point. If this ignition point fell outside the final fire extent, it was moved to the closest point along the perimeter. We then identified the centroid of the final fire extent. A minimum bounding rectangle of the final fire extent was then developed in alignment with the axis between the ignition point and final centroid. The ellipse major and minor axis lengths in Scott’s equation were estimated as one half the minimum bounding rectangle’s length and width, respectively. We then divided the ellipse into zones of backing (<25% of head fire intensity), flanking (25–50% of head fire intensity), and heading (≥50% of head fire intensity) radiating from the ignition point (Figure 3c).

2.4.3. Condition and Design

We manually attributed fuel break condition and design attributes based on the most recent NAIP aerial photography prior to each fire [37]. Fuel break condition was assigned an ordinal rating in five classes, ranging from one for barely discernable from the surrounding vegetation to five for freshly cleared. We treated the fuel break condition as a continuous variable in our statistical analysis. We assigned a separate binary indicator for fuel break association with a fire break (0 = no, 1 = yes), which we expect to increase fuel break success (roads were considered fire breaks). Each fuel break was attributed with its average width in meters in 5 m increments for widths up to 50 m and 10 m increments for widths greater than 50 m. The increasing width increment beyond 50 m is to reflect the difficulty of precisely measuring a representative segment width from aerial imagery for fuel breaks in poor condition or with irregular shapes. Fuel break width includes the width of the fire break if present. If a fuel break was recently burned by a wildfire, its condition was judged relative to the pre-fire vegetation, and we referenced earlier imagery for width indicators if needed; this accounts for the maintenance benefit of wildfire while not overstating the width of the fuel break. In some cases, the original data sources mapped fuel breaks along roads without recent evidence of adjacent fuels management. We opted to retain these roads as fuel breaks because they often serve as important links between maintained fuel breaks and their inclusion in the earlier datasets implies a perceived importance for fire management. We attributed these roads as fuel breaks with a high condition rating, narrow width, and fire break present.

2.4.4. Suppression

Fuel breaks are tools for suppression, not features expected to passively stop wildfires [2,9,16]. We captured fuel break use in suppression with operational data on aerial drop and fireline locations. Aerial drop data representing individual drop paths as polylines were initially collected and cleaned to support Aviation Use Summaries [48]. Stonesifer [49] provided us an aggregated dataset that includes all the aerial drops made by the fleet of federal fixed-wing aircraft during years 2017–2020. This dataset does not include drops made by state or local aircraft, so we may underestimate the fuel breaks that received aerial drops on some fires. We attributed a binary indicator for association with an aerial retardant or water drop (0 = no, 1 = yes) if a sample fell within 100 m of an aerial drop line during the year of the fire. Fireline data came from the National Incident Feature Service (NIFS) event line dataset for the years 2017–2020 [50]. The event line dataset was filtered to feature categories indicating fireline construction or use during the incident. Data gaps in the 2017 NIFS data were minimized by adding fireline data extracted from incident geospatial databases on the National Interagency Fire Center (NIFC) server [51]. We attributed a binary indicator for association with a fireline (0 = no, 1 = yes) if a sample fell within 100 m of a fireline during the year of the fire. The fireline status for samples from fires without NIFS data were attributed with null values instead of zeros.

2.4.5. Topography

Fuel breaks in Southern California are often located along major ridges or valleys to take advantage of moderated fire behavior from reduced slope and aspect changes [10,16]. We characterized topography using terrain analysis of the 30 m National Digital Elevation Model [52] to calculate the percent slope and Topographic Position Index (TPI [53]). TPI is calculated as the difference in meters between each pixel’s elevation and the neighborhood mean elevation. We calculated TPI using a 200 m circular neighborhood based on previous success characterizing landform influence on control probability at this scale [26]. Highly positive TPI values indicate ridges and highly negative values indicate valleys.

2.4.6. Vegetation/Fuels

Fuel conditions around fuel breaks may influence the likelihood of control through their effects on fire behavior and suppression difficulty. We used two LANDFIRE [32] layers to characterize pre-fire fuel conditions within a 100 m circular neighborhood around each sample. The first is the mean forest canopy cover in percent. The second is the modal fire behavior fuel model (hereafter “fuel model”) in the Anderson [54] thirteen class system, which provides an indication of surface fuel load and type. Samples without a clear mode (i.e., multiple fuel models tied for most abundant) were assigned a null value. We also assigned each sample a binary indicator of burning (0 = no, 1 = yes) in a recent wildfire (≤10 yrs) based on spatial intersection with the same interagency historical records described in the previous wildfire section (years 2007–2020). Finally, we assigned a binary indicator of recent (≤10 yrs) fuel treatment (0 = no, 1 = yes) within 100 m of the sample, as reported in the hazardous fuel treatment polygon layer from the Forest Service Activity Tracking System [55].

2.4.7. Weather

We associated each sample with daily gridded weather estimates from gridMET ([56]; https://www.climatologylab.org/gridmet.html accessed on 10 September 2021) for the previously described estimated date of burning. The gridMET spatial resolution is approximately 4 km, and all weather metrics are daily averages except where otherwise noted. The variables we investigated include the Burning Index (BI), Energy Release Component (ERC), fuel moisture for the 100 h fuel size class (FM100; percent), maximum relative humidity (RH; percent), Vapor Pressure Deficit (VPD), and wind speed at 10 m above ground level (m/s). We considered this wide selection of weather variables because of varying manager preference for basic and derived weather indices, but several of these weather variables are highly correlated (e.g., ERC and 100 h fuel moisture, BI and wind speed, etc.). Instead of constructing models from the best performing subsets, we tested the performance of three commonly used weather variables sets: (1) the basic variables including maximum RH, FM100, and wind speed; (2) the National Fire Danger Rating System [57] components BI and ERC; and (3) the Hot-Dry-Windy Index [58] components VPD and wind speed.

2.5. Statistical Model of Fuel Break Effectiveness

We used the Elith et al. [59] gbm.step routine with gbm package version 2.1.8 [60] in R version 4.1.0 [61] to model the relationship between predictor variables and fuel break outcome (failed or held) with gradient boosted regression trees. The final dataset had 38,953 observations of fuel break pixel encounters with wildfire, consisting of 10,886 held observations (27.9%) and 28,067 failed observations (72.1%). Our core models were developed using 3-fold cross-validation, a bagging fraction of 0.5, a learning rate of 0.005, a tree complexity of 10, and a maximum tree limit of 2500 to standardize comparisons and avoid excessive overfitting. The tree limit was informed by an additional cross-validation procedure described below.
We tested five models constructed from the full training dataset (Table 2) to evaluate model performance with different weather variable sets and fire behavior variables that are difficult to predict and potentially conflated with outcomes (e.g., daily area burned and FRP). Model 1 includes all fire behavior variables and the three primary weather variables—100 h fuel moisture, maximum relative humidity, and wind speed. Model 2 includes the same variables except FRP because it is not currently well known to managers nor easily predicted. Model 3 also excludes FRP and represents weather with BI and ERC. Model 4 excludes FRP and represents weather with VPD and wind speed. Model 5 excludes all fire behavior variables and represents weather with the three primary variables.
We conducted two additional analyses to characterize Model 2 performance sensitivity to varied training data. For the first analysis, we iteratively trained Model 2 with the gbm function, withholding one fire at a time (i.e., cross-validation by fire) for tree numbers of 500 to 10,000. We used the results to estimate the predictive performance of the model with independent data and to identify an appropriate tree number to avoid overfitting. For the second analysis, we trained Model 2 with the gbm function on 20 random subsets of the full training dataset with minimum spacing distances of 50, 100, 200, and 500 m. Tree number was fixed at 2500. We used the second analysis to estimate the effect of sample point spacing and sample size on model performance. For both analyses, performance was evaluated for each model with all withheld observations using the receiver operating characteristics diagram area under the curve (AUC) and overall accuracy (classifying probabilities ≥ 0.5 as predicted successes). We also evaluated model consistency by examining variation in variable importance and the predicted probabilities between Model 2 trained with the full and subset data.

3. Results

Our five candidate models achieved similarly high levels of predictive performance (Table 3) with a slight decline in AUC and overall accuracy from Model 1 with all variables to Model 5 with no fire behavior variables. There were no meaningful differences in performance among models constructed with the three different weather variable sets (Models 2–4; Table 3) due to their similar representations of dryness and wind speed. Across all models, the most important variables were consistently related to suppression, weather, and fire behavior, if included (Table 3), and most models captured comparable relationships between the predictor variables and the probability of control (Figure 4 and Figures S2–S5). We focus on Model 2 as the preferred model for the remainder of the paper because it performed almost as well as Model 1 but without the need for managers to estimate FRP to make predictions.
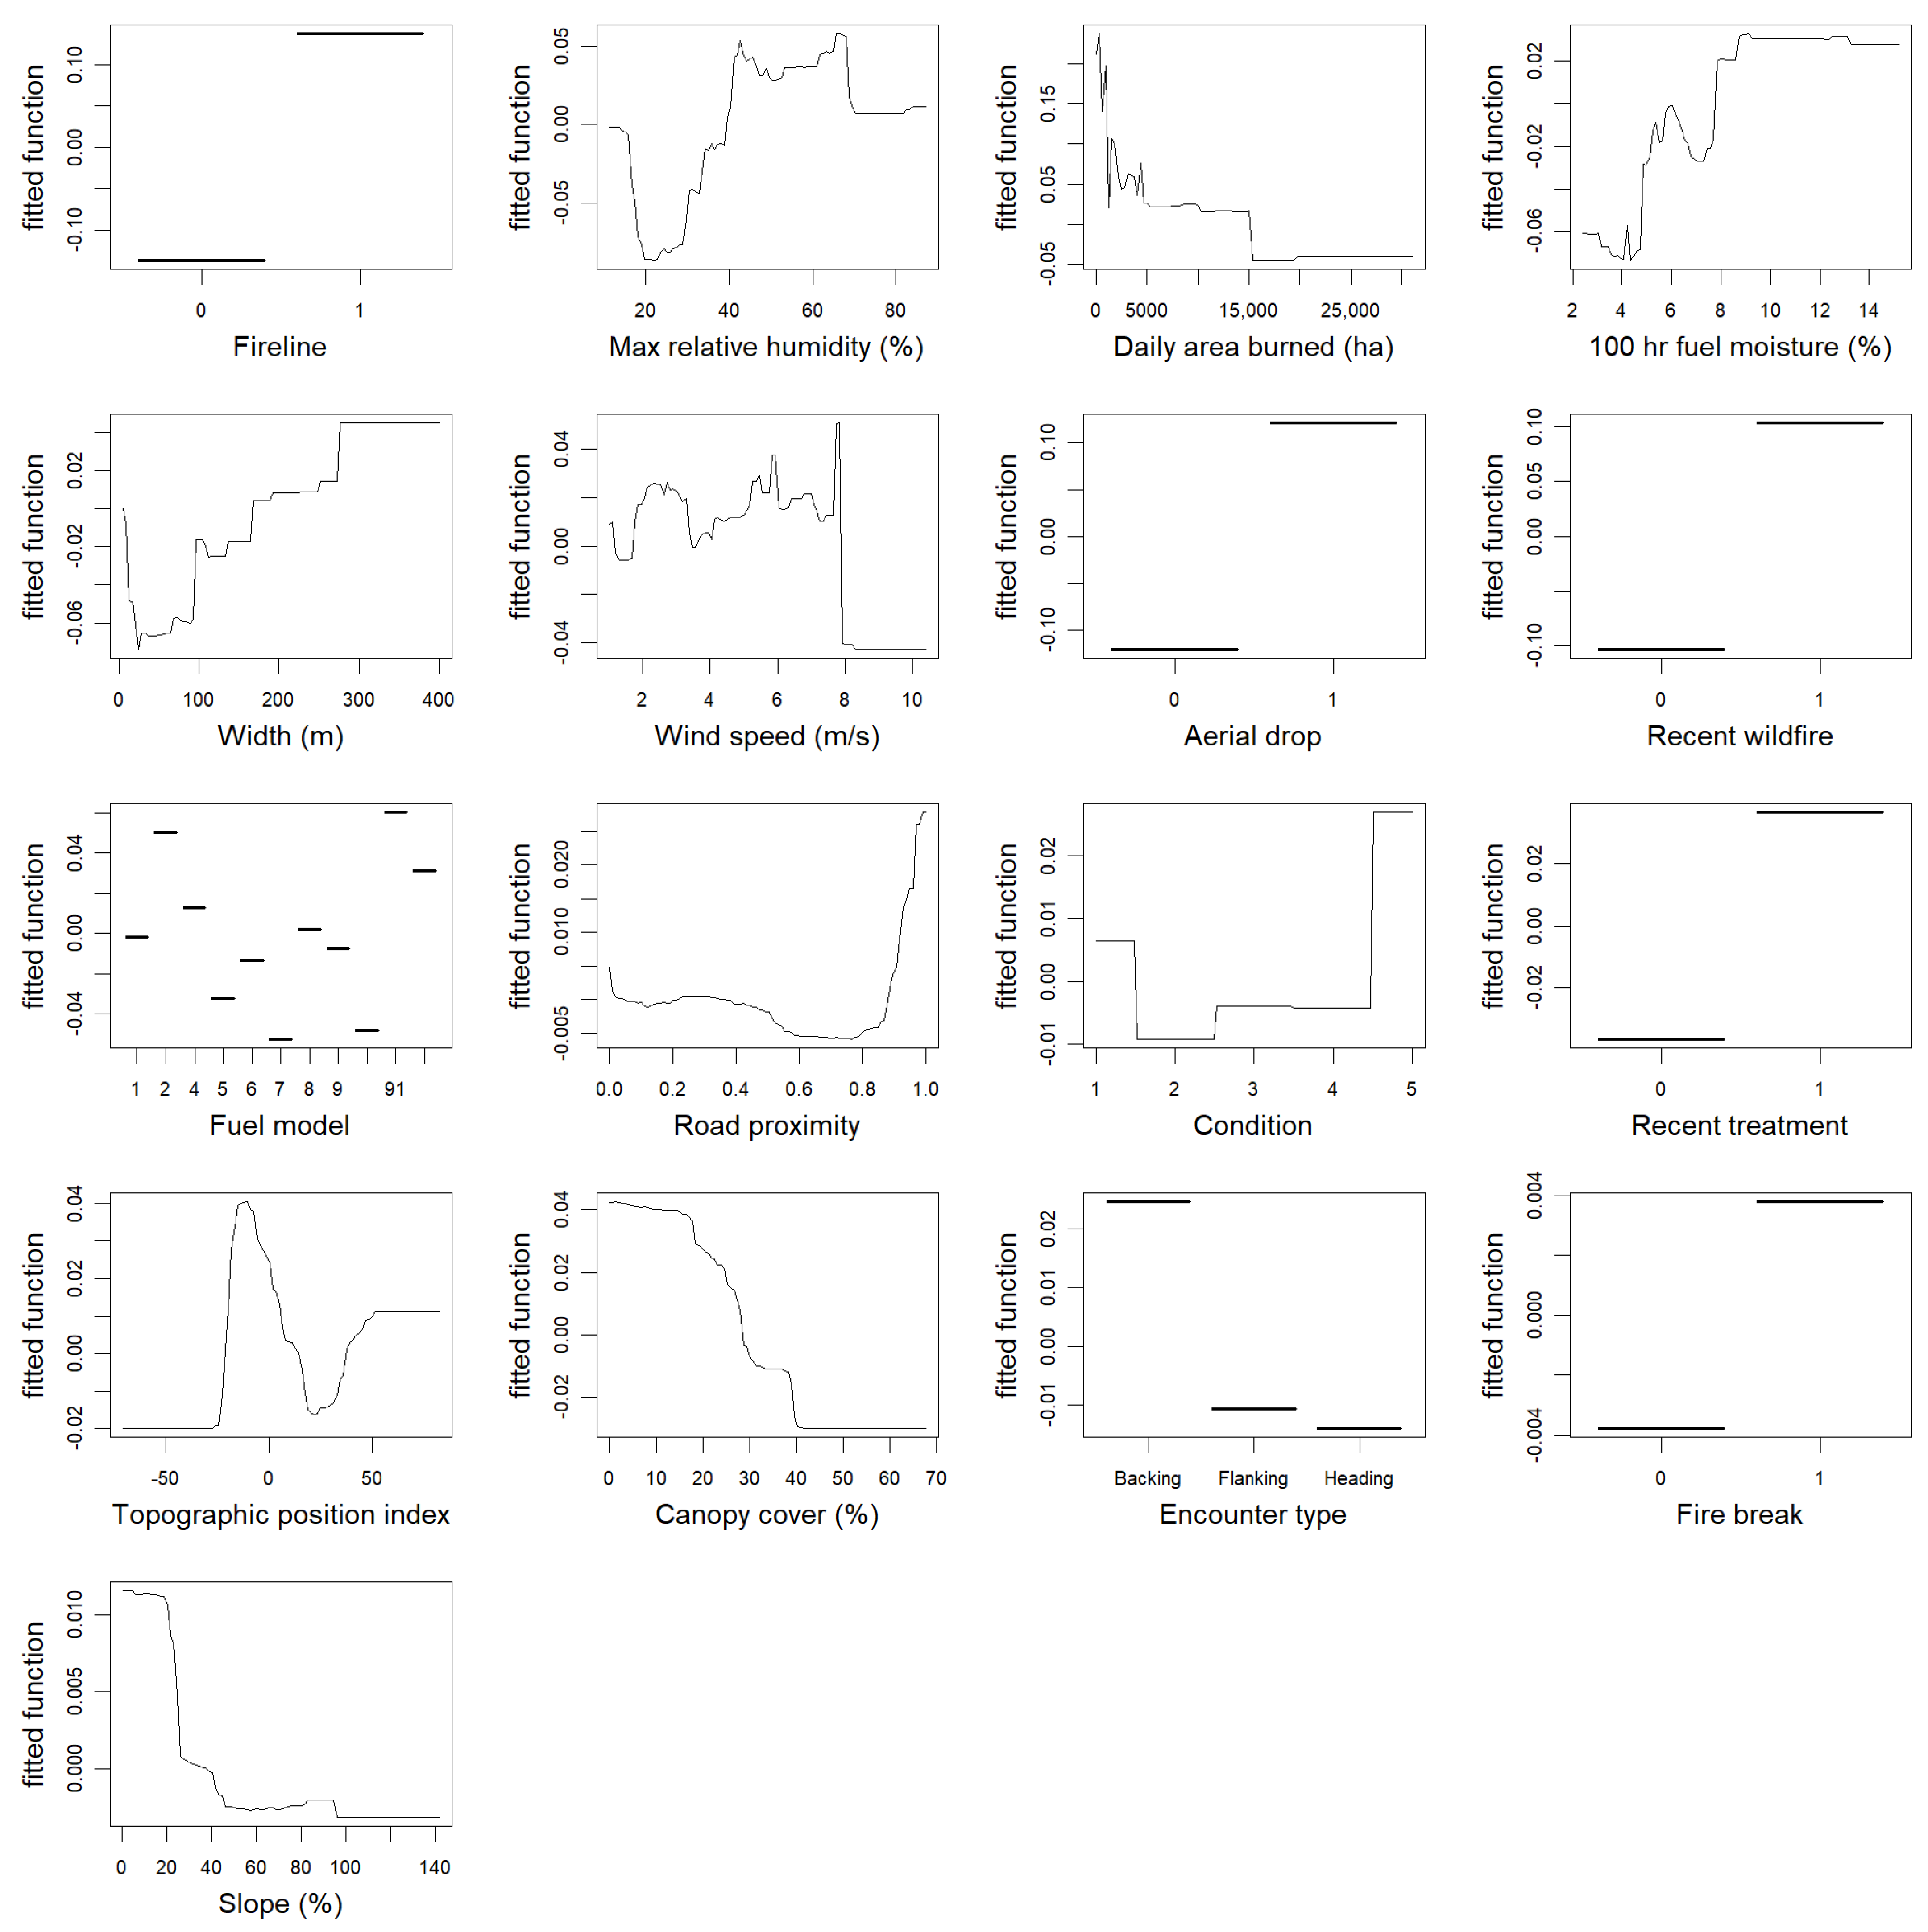
The most important predictor variables in the preferred model are dynamic characteristics like suppression, weather, and fire behavior (Figure 5). Among the remaining variables, fuel break width, recent wildfire, fuel model, road proximity, and fuel break condition are the most important. Partial dependence plots (Figure 4) demonstrate that the model aligns well with the current understanding of fuel break effectiveness drivers. Fuel break success is positively associated with fireline and aerial drop indicators of suppression effort. Effectiveness is expected to increase with increasing maximum relative humidity and 100 h fuel moisture and decrease with increasing wind speed. The likelihood of control declines with increasing daily area burned. Fuel break success is highest when fire is backing and much lower with flanking or heading spread. Fuel break width and condition are both positively associated with control. Both fire break presence and high road proximity are associated with improved success. Despite their lesser importance, the veg/fuel and topography variables align with expectations. Fuel break success is higher if recently burned or treated, or canopy cover is lower. Fuel break effectiveness is highest at middle and higher topographic positions and lower slopes.
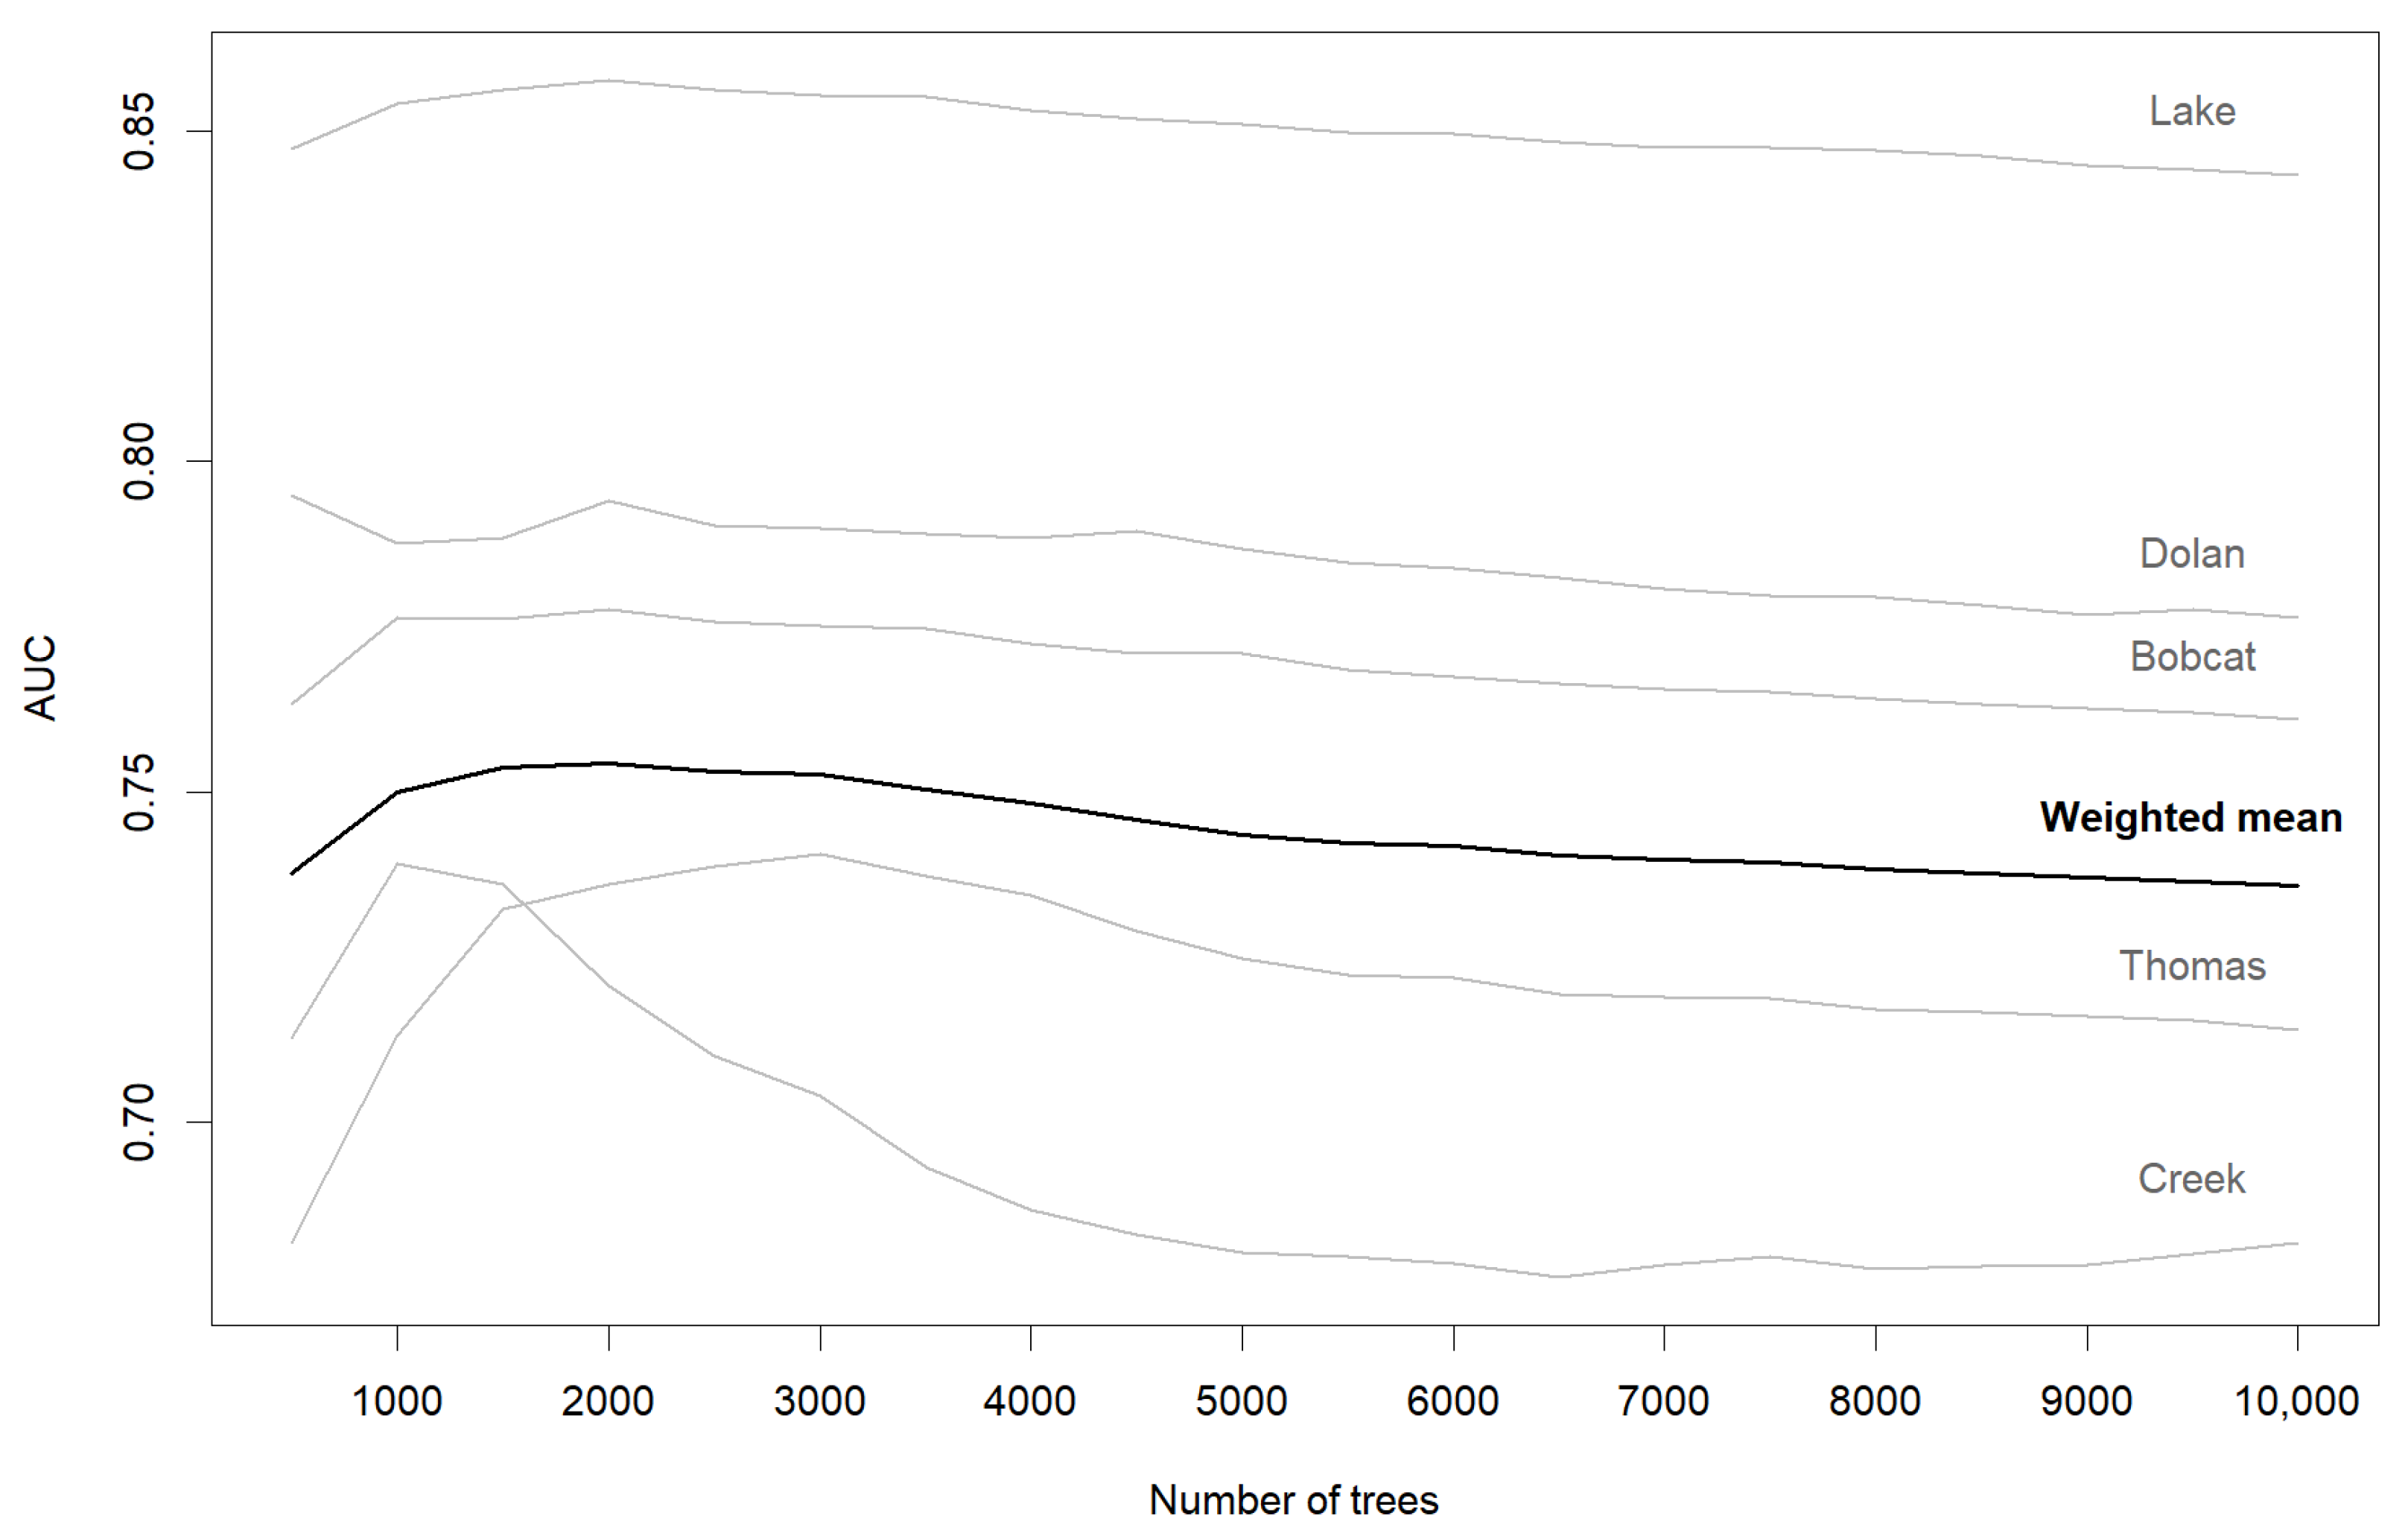
The additional cross-validation by fire for Model 2 showed that AUC peaks when models are fit with between 1500 and 3000 trees and then slowly declines with an increasing number of trees (indicating overfitting [59]), although the exact response varies based on the fire withheld from the model (Figure 6). In contrast, the gbm.step procedure suggested that the optimal number of trees for Model 2 is above 10,000. AUC assessed with the training data for the full model increases unimodally from 0.913 at 500 trees to 0.993 at 10,000 trees. For the 2500-tree model, the validation AUCs vary between 0.275 and 0.954 with a simple mean of 0.732 and an observation-weighted mean of 0.753. The validation AUCs are all above 0.7 for the six fires with more than 2000 observations that collectively account for 74.6% of the total observations. The validation overall accuracies range between 19.1 and 92.0% with a simple mean of 66.1% and an observation-weighted mean of 75.8%.
The models created in the cross-validation by fire procedure retain the core characteristics of the full model. The variable importance measures do not differ drastically from those of the full model, suggesting that the core drivers of effectiveness are consistent across fires (Figure 5). The predicted probabilities from the validation models are also close to those of the full model. The mean difference in the predicted probabilities for the full observation set vary between less than 0.001 to 0.062, and the Spearman’s rank correlations are all high, ranging between 0.81 and 0.99. The most influential fire on the final model (highest mean difference and lowest Spearman rank correlation) is the 2017 Thomas Fire, which accounts for approximately a third of all the sample points. The predicted probabilities for the validation models have fair alignment with the spatial patterns of outcomes for the fires with the most wildfire–fuel break observations (Figure 7).
The predictive performance of Model 2 remained high when trained on subsets of the full training dataset with minimum spacing distances of 50 to 500 m and sample sizes that include between 32.1 and 2.9% of the full training dataset (Table 4). Compared to Model 2 trained with the full training dataset, which has a cross validated AUC of 0.962 and an overall accuracy of 91.9, the subset model performance declines slightly with increasing minimum spacing and shrinking sample size. Models trained on subsets with 50 and 100 m minimum spacings have the largest sample sizes and perform almost as well as the full model with AUCs of 0.963 and 0.959 and overall accuracies of 91.2 and 90.7%, respectively. Subset model structure and predictions are also similar to the full model; variable importance measures of the subset models are close to those of the full model (Figure S6) and Spearman rank correlations between the full and subset data predictions average 0.994 and 0.984 for 50 and 100 m spacings, respectively. Performance declines more for models trained on the subsets with 200 and 500 m minimum spacing distances (Table 4), but AUCs are still above 0.9 and overall accuracies are above 87%. The 200 and 500 m spacing model predictions remain similar to those of the full model (Spearman rank correlation > 0.9), but the underlying model structure has several differences from the full model. Suppression, weather, and fire behavior variables are still the most important predictor variables, but there is a shift towards higher importance of fuels, topography, and road proximity variables (Figure S6).

4. Discussion

Our analysis reaffirms previous work on fuel break success rates and drivers of effectiveness. The 27.9% success rate by length for our training data falls in the 22–47% range reported for these same National Forests by Syphard et al. [2] for the period 1980–2007. The high importance of suppression, weather, and fire behavior variables in our model also agrees with the Syphard et al. [2] findings that fuel break accessibility, suppression resource availability, and fire size (proxy for weather and fire behavior) are key drivers of fuel break effectiveness. Our accounting of daily weather and fire behavior helps better define the range of conditions that fuel breaks perform well in (Figure 4) compared to the more qualitative observations that fuel breaks often fail in dry, windy weather or extreme fire behavior with spotting [16]. Despite their lesser importance in the model, variables related to fuel break design and maintenance function as expected; wider fuel breaks kept in better condition with frequent fuel treatments should improve fuel break outcomes. Our model approaches the level of realism and predictive performance necessary to inform suppression decisions, and it can also be used in a pre-fire context to assess the effects of fuel break design choices.

4.1. Progress, Limitations, and Future Directions for Modeling Fuel Break Effectiveness

Our dense point sampling design and the associated determination of fuel break outcomes (Figure 2) provides a flexible data model for linking fuel break segments and their outcomes to predictor variables with different spatial and temporal resolutions. We opted to generate samples at the resolution of our most detailed spatial data, but the tight spacing of points may cause pseudo-replication issues as fuel break outcomes and several of our predictor variables may have dependencies at coarser spatial and temporal scales, like most observational fire data [23,62]. Higher resolution data streams for dynamic variables like weather, fire behavior, and suppression should mitigate much of this issue in the future, but fuel break control outcomes will always suffer from some degree of spatial autocorrelation. Figure 2 and Figure 7 illustrate representative spatial patterns of fuel break outcomes on large fires with successes and failures clustering at scales ranging from several hundred meters to several kilometers (see Supplementary Materials for additional analysis of spatial autocorrelation). Our sensitivity analysis shows that Model 2 trained with wider spaced random subsets (minimum 50–500 m) of the full training dataset perform almost as well as the same model trained with the full training dataset and captured similar relationships between predictor variables and fuel break outcomes. Future work with larger datasets could focus on decoupling sample point spacing and sample size impacts and testing sensitivity to even wider minimum sample spacings. Sampling designs could also be informed by surveying fuels managers and firefighters on what they view as the appropriate spatial scale to characterize fuel break attributes and outcomes.
Despite our accounting of many weather, fire behavior, and suppression factors, the lower AUC from the cross-validation by fire procedure also suggests that there are unique fire characteristics that are not accounted for by our predictor variables. Cross-validation by fire indicates that the actual predictive performance of our model (~0.75 AUC) is substantially lower than assessed with random fold cross-validation (~0.96; Table 3), but is still high enough to make useful predictions. We suspect that suppression strategy may further explain fuel break outcomes across fires, as fuel breaks may lose their strategic purpose, despite their potential to hold, based on neighboring fire spread that forces managers to identify a bigger box and use suppression firing to tie distant lines together. Suppression firing is currently poorly documented, but anecdotal reports from the United States [63] and reconstructions of its use in Australia suggest it may contribute considerably to the area burned by large wildfires [64]. Long range spotting may also dramatically alter the fuel break outcomes on some fires with little to no influence of the fuel break characteristics. Spotting is likely captured indirectly in our model through its association with weather variables, daily area burned, and FRP. Our simplified accounting of suppression with binary indicators of activity does not account for potentially important characteristics like fireline type, width, quality, timing of construction, and whether it was used for suppression firing or staffed for holding operations.
Fuel break control outcomes evaluated using the final fire perimeter are relevant for evaluating fuel break strategies aimed at reducing fire sizes and impacts across broad landscapes, but there are other relevant fuel break outcomes that we did not consider in this study. For example, we did not address whether fuel breaks altered fire behavior, delayed spread, increased suppression efficiency, facilitated access, or provided safer working environments for firefighters. We also did not address the role of fuel breaks in protecting community assets or controlling small fires. Presumably, fuel breaks should be more effective when they are engaged by small fires because they will cover proportionally more of the fire perimeter. Accounting for the benefits of controlling small fires at fuel breaks is challenging because the counterfactual outcome is difficult to accurately define (i.e., where the fire would have spread if not controlled at the fuel break).
Daily area burned (Models 1–4) and FRP (only Model 1) were strong predictors of fuel break success, but it is important to recognize that both can be conflated with control outcomes as fuel break failures lead to increased area burned and radiation as fuels behind the fuel break combust. Conflation between predictor variables and observed outcomes can lead to overestimated model performance. We think that area burned and FRP are reasonable to include as predictor variables given that faster spreading and more intense fires should be more challenging to safely control due to the need to access, prepare, fire, hold, and mop up more line. We opted to include daily area burned in our preferred model because most fire organizations are already making the necessary fire growth predictions to apply the model and it is consistent with previous fuel break effectiveness models for the region [2,8] except for the improved temporal resolution (daily vs. incident). In contrast, FRP is a relatively new metric that few managers can translate into practical terms, and it is not an output of well-established fire models. The real-world application of our model should also account for uncertainty from the associated fire behavior modeling.
Major issues facing future empirical fuel break research are defining consistent criteria of what qualifies as a fuel break and maintaining datasets on fuel break location and characteristics. The Brennan and Keeley [40] fuel break dataset we leveraged in our analysis includes diverse features that may not all align with the modern vision of a strategic pre-fire fuel break. Some fuel breaks were constructed opportunistically during fire suppression and may persist long enough to be useful on subsequent fires, even if they were not planned land management actions. Similarly, many of the original fuel break features appear to be roads with varying levels of shoulder maintenance, which may function like fuel breaks despite different funding sources and motivations. Only 19.6% of our samples had evidence of hazardous fuel treatment activities in the ten years before engaging with the study fires. Thus, we considered attributes reflective of treatment in our model to contrast fuel breaks of varying qualities. Fuel breaks with recent treatment held 38.5% of the time compared to 25.4% without recent treatment, confirming that either the maintenance or correlated characteristics of these fuel breaks boosts effectiveness. Our post hoc evaluation of fuel break width and condition with aerial imagery seems to have captured useful information (Figure 4 and Figure 5), but field inventories would improve their accuracy and allow for more detailed description of fuel type, amount, and arrangement.

4.2. Management Implications

The strong influence of weather and fire behavior factors on our model make it potentially useful for identifying when and where to allocate suppression effort. Fuel break effectiveness has a threshold-like response to several of the weather and fire behavior variables, suggesting that control likelihood substantially declines when fuel breaks are exposed to fast-growing head fire under dry and windy weather (Figure 4). Staffing fuel breaks under these conditions also risks firefighter safety [65], so it may make sense to delay suppression efforts until the weather moderates, or to focus on fuel breaks near the heel of the fire where lower intensity backing fire improves the likelihood of control (Figure 4 [10,66]). Suppression greatly increases the odds of fuel break success; the mean success rate for our observations without fireline and aerial drops was only 12.7% compared to 68.1% for observations with both fireline and aerial drops. Suppression clearly has strong effects, but some of this difference is likely due to the strategic use of suppression under more favorable weather conditions, which is captured through the variable interactions in our boosted regression model. Still, our estimated success rate for fuel breaks with fireline and aerial drops is close to the probability of success reported for halting fire advance with airtanker drops [67].
Wider and better maintained fuel breaks should perform better than narrow and overgrown ones, but fuel break width, condition, and prior treatment only account for 13.5% of the variable importance in our preferred model (Figure 5), so improved fuel break design and maintenance are not expected to drastically improve fuel break outcomes on the types of large fires we studied. The highest success is expected for fuel breaks freshly cleared of native vegetation to greater than 300 m wide (Figure 4). Firefighters in Southern California are highly proficient at constructing ridgetop dozer lines, so the pre-fire condition of the fuel break may not be critical on larger fires as long as firefighters have the time and resources to improve them during the incident. Like Syphard et al. [2], we found greater success for fuel breaks close to roads, so it makes sense to prioritize fuel break construction and maintenance where they are most accessible to firefighters. Additionally, the presence of a road or other fire break should further improve fuel break effectiveness by aiding suppression firing [24,64,68]. We also found evidence that fuel breaks are more effective if associated with areas recently burned by a wildfire (Figure 4 and Figure 5) consistent with reports from the Whittier Fire of moderated fire behavior in previously burned areas that improved suppression effectiveness and dramatically reduced suppression needs [13], and post hoc evaluation of the Las Conchas Fire in New Mexico that found improved fireline effectiveness in areas previously burned by the Cerro Grande Fire [69]. This finding is in line with earlier suggestions to maximize the effectiveness of fuel breaks by combining them with broader landscape fuel treatments, especially prescribed fire [7].

Supplementary Materials

The following supporting information can be downloaded at: https://www.mdpi.com/article/10.3390/fire6030104/s1, Figure S1: Predictor variable distributions for fuel break failures and successes; Figure S2: Partial dependence plots for Model 1 with the full training data showing the mean effect of each variable sorted in order of descending relative variable importance; Figure S3: Partial dependence plots for Model 3 with the full training data showing the mean effect of each variable sorted in order of descending relative variable importance; Figure S4: Partial dependence plots for Model 4 with the full training data showing the mean effect of each variable sorted in order of descending relative variable importance; Figure S5: Partial dependence plots for Model 5 with the full training data showing the mean effect of each variable sorted in order of descending relative variable importance; Figure S6: Relative variable importance for Model 2 with the full training data (red dots) and variation in relative variable importance for Model 2 from training the model with 20 random subsets with minimum spacings of 50, 100, 200, and 500 m; Figure S7: Observed minus expected success-success joins by distance class.

Author Contributions

Conceptualization, E.B., Y.W., B.G., C.O., M.T., D.C. and C.D.; methodology, B.G., J.Y., E.B. and Y.W.; validation, B.G. and J.Y.; formal analysis, B.G.; investigation, B.G. and J.Y.; resources, Y.W. and D.C.; data curation, B.G.; writing—original draft preparation, B.G.; writing—review and editing, B.G., Y.W., E.B., J.Y., M.T., C.O., D.C. and C.D.; visualization, B.G.; supervision, Y.W. and D.C.; project administration, Y.W. and E.B.; funding acquisition, Y.W. and E.B. All authors have read and agreed to the published version of the manuscript.

Funding

This research was funded by the Joint Fire Science Program, project number 20-2-01-12 and joint venture agreement 19-JV-11221636-170 between the USDA Forest Service Rocky Mountain Research Station and Colorado State University. The APC was funded by a publishing voucher awarded to one of the authors for their editorial contributions.

Institutional Review Board Statement

Not applicable.

Informed Consent Statement

Not applicable.

Data Availability Statement

Spatial and tabular data used in this paper are available from the USDA Forest Service research data archive (https://doi.org/10.2737/RDS-2022-0098 accessed on 12 December 2022).

Acknowledgments

We thank Stephen Fillmore, Chris Clervi, Diane Travis, and Brandon Stephens for providing background information on fuel break maintenance and use in Southern California and for help with data access and interpretation. We also thank Ryley Gross and Eliot Hutchinson for GIS support. Special thanks to Sean Parks for sharing the day of burning interpolation code. We also thank Jeff Morisette and Patrick Doyle for suggesting improvements to an early draft of this manuscript.

Conflicts of Interest

The authors declare no conflict of interest. The funders had no role in the design of the study; in the collection, analyses, or interpretation of data; in the writing of the manuscript; or in the decision to publish the results.

Disclaimer

The findings and conclusions in this report are those of the author(s) and should not be construed to represent any official USDA or U.S. Government determination or policy. This research was supported by the U.S. Department of Agriculture, Forest Service. Any use of trade, firm, or product names is for descriptive purposes only and does not imply endorsement by the U.S. government.

References

  1. U.S.D.A. Forest Service. Confronting the Wildfire Crisis: A Strategy for Protecting Communities and Improving Resilience in America’s Forests; Report FS-1187a; U.S. Department of Agriculture, Forest Service: Washington, DC, USA, 2022.
  2. Syphard, A.D.; Keeley, J.E.; Brennan, T.J. Comparing the role of fuel breaks across southern California national forests. For. Ecol. Manag. 2011, 261, 2038–2048. [Google Scholar] [CrossRef]
  3. Oliviera, T.M.; Barros, A.M.G.; Ager, A.A. Assessing the effect of a fuel break network to reduce burnt area and wildfire risk transmission. Int. J. Wildland Fire 2016, 25, 619–632. [Google Scholar] [CrossRef]
  4. Ager, A.A.; Palaiologou, P.; Evers, C.R.; Day, M.A.; Barros, A.M.G. Assessing transboundary wildfire exposure in the Southwestern United States. Risk Anal. 2018, 38, 2105–2127. [Google Scholar] [CrossRef] [Green Version]
  5. Parisien, M.-A.; Dawe, D.A.; Miller, C.; Stockdale, C.A.; Armitage, B.A. Applications of simulation-based burn probability modelling: A review. Int. J. Wildland Fire 2019, 28, 913–926. [Google Scholar] [CrossRef] [Green Version]
  6. Wilson, A.A.G. Width of firebreak that is necessary to stop grass fires: Some field experiments. Can. J. For. Res. 1988, 18, 682–687. [Google Scholar] [CrossRef]
  7. Agee, J.K.; Berni, B.; Finney, M.A.; Omi, P.N.; Sapsis, D.B.; Skinner, C.N.; van Wagtendonk, J.W.; Weatherspoon, C.P. The use of shaded fuelbreaks in landscape fire management. For. Ecol. Manag. 2000, 127, 55–66. [Google Scholar] [CrossRef]
  8. Syphard, A.D.; Keeley, J.E.; Brennan, T.J. Factors affecting fuel break effectiveness in the control of large fires on the Los Padres National Forest, California. Int. J. Wildland Fire 2011, 20, 764–775. [Google Scholar] [CrossRef]
  9. Wollstein, K.; O’Connor, C.; Gear, J.; Hoagland, R. Minimize the bad days: Wildland fire response and suppression success. Rangelands 2022, 44, 187–193. [Google Scholar] [CrossRef]
  10. Murphy, J.L.; Green, L.R.; Bentley, J.R. Fuelbreaks—Effective aids, not cure-alls. Fire Control Notes 1967, 28, 4–5. [Google Scholar]
  11. Omi, P.N. Planning future fuelbreak strategies using mathematical modeling techniques. Environ. Manag. 1979, 3, 73–80. [Google Scholar] [CrossRef]
  12. Moghaddas, J.J.; Craggs, L. A fuel treatment reduces fire severity and increases suppression efficiency in a mixed conifer forest. Int. J. Wildland Fire 2007, 16, 673–678. [Google Scholar] [CrossRef]
  13. California Department of Forestry & Fire Protection. Cal Fire Fuel Breaks and Use during Fire Suppression; California Department of Forestry & Fire Protection: Sacramento, CA, USA, 2019. Available online: https://www.fire.ca.gov/media/5585/fuel_break_case_studies_03212019.pdf (accessed on 1 September 2021).
  14. Thompson, M.P.; Lauer, C.J.; Calkin, D.E.; Rieck, J.D.; Stonesifer, C.S.; Hand, M.S. Wildfire response performance measurement: Current and future directions. Fire 2018, 1, 21. [Google Scholar] [CrossRef] [Green Version]
  15. Plucinski, M.P. Contain and control: Wildfire suppression effectiveness at incidents and across landscapes. Curr. For. Rep. 2019, 5, 20–40. [Google Scholar] [CrossRef]
  16. Green, L.R. Fuelbreaks and Other Fuel Modification for Wildland Fire Control; Agriculture Handbook No. 499; U.S. Department of Agriculture, Forest Service: Washington, DC, USA, 1977.
  17. Frangieh, N.; Accary, G.; Rossi, J.-L.; Morvan, D.; Meradji, S.; Marcelli, T.; Chatelon, F.-J. Fuelbreak effectiveness against wind-driven and plume-dominated fires: A 3D numerical study. Fire Saf. J. 2021, 124, 103383. [Google Scholar] [CrossRef]
  18. Martinson, E.J.; Omi, P.N. Fuel Treatments and Fire Severity: A Meta-Analysis; Research Paper RMRS-RP-103WWW; U.S. Department of Agriculture, Forest Service, Rocky Mountain Research Station: Fort Collins, CO, USA, 2013.
  19. Kalies, E.L.; Kent, L.J.Y. Tamm review: Are fuel treatments effective at achieving ecological and social objectives? A systematic review. For. Ecol. Manag. 2016, 375, 84–95. [Google Scholar] [CrossRef] [Green Version]
  20. Kennedy, M.C.; Johnson, M.C. Fuel treatment prescriptions alter spatial patterns of fire severity around the wildland-urban interface during the Wallow Fire, Arizona, USA. For. Ecol. Manag. 2014, 318, 122–132. [Google Scholar] [CrossRef]
  21. Kennedy, M.C.; Johnson, M.C.; Fallon, K.; Mayer, D. How big is enough? Vegetation structure impacts effective fuel treatment width and forest resiliency. Ecosphere 2019, 10, e02573. [Google Scholar] [CrossRef] [Green Version]
  22. Finney, M.A.; McHugh, C.W.; Grenfell, I.C. Stand- and landscape-level effects of prescribed burning on two Arizona wildfires. Can. J. For. Res. 2005, 35, 1714–1722. [Google Scholar] [CrossRef]
  23. Wimberly, M.C.; Cochrane, M.A.; Baer, A.D.; Pabst, K. Assessing fuel treatment effectiveness using satellite imagery and spatial statistics. Ecol. Appl. 2009, 19, 1377–1384. [Google Scholar] [CrossRef]
  24. Price, O.F.; Bradstock, R.A. The effect of fuel age on the spread of fire in sclerophyll forest in the Sydney region of Australia. Int. J. Wildland Fire 2010, 19, 35–45. [Google Scholar] [CrossRef] [Green Version]
  25. Narayanaraj, G.; Wimberly, M.C. Influences of forest roads on the spatial pattern of wildfire boundaries. Int. J. Wildland Fire 2011, 20, 792–803. [Google Scholar] [CrossRef]
  26. O’Connor, C.D.; Calkin, D.E.; Thompson, M.P. An empirical machine learning method for predicting potential fire control locations for pre-fire planning and operational fire management. Int. J. Wildland Fire 2017, 26, 587–597. [Google Scholar] [CrossRef]
  27. Rodrigues, M.; Alcasena, F.; Gelabert, P.; Vega-García, C. Geospatial modeling of containment probability for escaped wildfires in a mediterraean region. Risk Anal. 2020, 40, 1762–1779. [Google Scholar] [CrossRef]
  28. Macauley, K.A.P.; McLoughlin, N.; Beverly, J.L. Modelling fire perimeter formation in the Canadian Rocky Mountains. For. Ecol. Manag. 2022, 506, 119958. [Google Scholar] [CrossRef]
  29. U.S. Environmental Protection Agency. Level III Ecoregions; U.S. Environmental Protection Agency: Washington, DC, USA, 2013. Available online: https://www.epa.gov/eco-research/level-iii-and-iv-ecoregions-continental-united-states (accessed on 1 October 2022).
  30. Keeley, J.E.; Fotheringham, C.J. Historic fire regime in Southern California shrublands. Conserv. Biol. 2001, 15, 1536–1548. [Google Scholar] [CrossRef]
  31. Kolden, C.A.; Abatzoglou, J.T. Spatial distribution of wildfires ignited under katabatic versus non-katabatic winds in Mediterranean Southern California USA. Fire 2018, 1, 19. [Google Scholar] [CrossRef] [Green Version]
  32. LANDFIRE. Biophysical Setting, Fire Behavior Fuel Model (Anderson 13), and Fuel Canopy Cover; U.S. Department of Agriculture and U.S. Department of the Interior. 2016. Available online: https://landfire.gov/index.php (accessed on 1 August 2021).
  33. Monitoring Trends in Burn Severity. National—Burned area boundaries dataset; U.S. Geological Survey and U.S. Department of Agriculture Forest Service. Available online: https://www.mtbs.gov/ (accessed on 1 September 2021).
  34. Geospatial Multiagency Coordination Center. Historic GeoMAC Perimeters; National Interagency Fire Center: Boise, ID, USA. Available online: https://data-nifc.opendata.arcgis.com/ (accessed on 1 September 2021).
  35. Wildland Fire Decision Support System. Interagency Fire Perimeter History All Years. National Interagency Fire Center: Boise, ID, USA. Available online: https://data-nifc.opendata.arcgis.com/ (accessed on 1 September 2021).
  36. Wildland Fire Interagency Geospatial Services. WFIGS—Wildland Fire Perimeters Full History. National Interagency Fire Center: Boise, ID, USA. Available online: https://data-nifc.opendata.arcgis.com/ (accessed on 1 September 2021).
  37. National Agriculture Imagery Program. National Agriculture Imagery Program (NAIP) Orthophoto County Mosaics. Available online: https://datagateway.nrcs.usda.gov/GDGHome_DirectDownLoad.aspx (accessed on 1 September 2021).
  38. U.S.D.A. Forest Service. Historical SIT Data; U.S.D.A. Forest Service, Fire and Aviation Management Information Technology. Available online: https://famit.nwcg.gov/applications/SIT209/historicalSITdata (accessed on 1 September 2021).
  39. Short, K.C. Spatial Wildfire Occurrence Data for the United States, 1992–2018, 5th ed.; U.S.D.A. Forest Service, Research Data Archive: Fort Collins, CO, USA, 2021. [CrossRef]
  40. Brennan, T.; Keeley, J. SoCal Fire Roads, Fuelbreaks, & Dozer Lines Dataset; U.S. Geological Survey, Western Ecological Research Center: Three Rivers, CA, USA, 2011.
  41. Clervi, C.; (U.S.D.A. Forest Service, Fort Collins, CO, USA). Personal communication, 2021.
  42. HERE. Roads Polyline Data; HERE: Washington, DC, USA, 2020; Available online: https://www.here.com/ (accessed on 15 January 2021).
  43. U.S.D.A. Forest Service. National Forest System Roads; U.S. Department of Agriculture, Forest Service, Enterprise Data Warehouse. Available online: https://data.fs.usda.gov/geodata/edw/datasets.php (accessed on 1 September 2021).
  44. Parks, S.A. Mapping day-of-burning with coarse-resolution satellite fire-detection data. Int. J. Wildland Fire 2014, 23, 215–223. [Google Scholar] [CrossRef]
  45. National Aeronautics and Space Administration. Fire Information for Resource Management System (FIRMS) Satellite Fire Detections. 2021. Available online: https://firms.modaps.eosdis.nasa.gov/download/ (accessed on 11 May 2021).
  46. Scott, J.H. A deterministic method for generating flame-length probabilities. In Proceedings of the Fire Continuum Conference; Missoula, MT, USA, 21–24 May 2018, Hood, S., Drury, S., Steelman, T., Steffens, R., Eds.; U.S.D.A. Forest Service, Rocky Mountain Research Station: Fort Collins, CO, USA, 2020; pp. 195–205. [Google Scholar]
  47. Catchpole, E.A.; Alexander, M.E.; Gill, A.M. Elliptical-fire perimeter- and area-intensity distributions. Can. J. For. Res. 1992, 22, 968–972. [Google Scholar] [CrossRef]
  48. Stonesifer, C.S.; Calkin, D.E.; Thompson, M.P.; Belval, E.J. Is this flight necessary? The Aviation Use Summary (AUS): A framework for strategic, risk-informed aviation decision support. Forests 2021, 12, 1078. [Google Scholar] [CrossRef]
  49. Stonesifer, C.S.; (U.S.D.A. Forest Service, Missoula, MT, USA). Personal communication, 2021.
  50. National Interagency Fire Center. National Incident Feature Service, Incident Firelines 2017–2018; National Interagency Fire Center: Boise, ID, USA, 2021. Available online: https://data-nifc.opendata.arcgis.com/ (accessed on 15 September 2021).
  51. National Interagency Fire Center. NIFC FTP Server, Incident Specific Data; National Interagency Fire Center: Boise, ID, USA, 2021. Available online: https://ftp.wildfire.gov/ (accessed on 15 September 2021).
  52. U.S. Geological Survey. 3D Elevation Program 30-Meter Resolution Digital Elevation Model; U.S. Geological Survey: Reston, VA, USA, 2021. Available online: https://www.usgs.gov/the-national-map-data-delivery (accessed on 28 July 2021).
  53. Weiss, A. Topographic Position and Landforms Analysis. Presented at the ESRI User Conference, San Diego, CA, USA, 9–13 July 2001. Available online: http://www.jennessent.com/downloads/tpi-poster-tnc_18x22.pdf (accessed on 24 September 2022).
  54. Anderson, H.A. Aids to Determining Fuel Models for Estimating Fire Behavior; General Technical Report INT-122; U.S. Department of Agriculture, Forest Service: Ogden, UT, USA, 1982.
  55. U.S.D.A. Forest Service. Hazardous Fuel Treatment Reduction: Polygon; U.S. Department of Agriculture, Forest Service, Enterprise Data Warehouse. Available online: https://data.fs.usda.gov/geodata/edw/datasets.php (accessed on 1 September 2021).
  56. Abatzoglou, J.T. Development of gridded surface meteorological data for ecological applications and modelling. Int. J. Climatol. 2013, 33, 121–131. [Google Scholar] [CrossRef]
  57. Deeming, J.E.; Burgan, R.E.; Cohen, J.D. The National Fire-Danger Rating System—1978. Revisions to the 1978 National Fire-Danger Rating System; General Technical Report INT-39; U.S. Department of Agriculture, Forest Service, Intermountain Forest and Range Experiment Station: Ogden, UT, USA, 1977.
  58. Srock, A.F.; Charney, J.J.; Potter, B.E.; Goodrick, S.L. The Hot-Dry-Windy Index: A new fire weather index. Atmosphere 2018, 9, 279. [Google Scholar] [CrossRef] [Green Version]
  59. Elith, J.; Leathwick, J.R.; Hastie, T. A working guide to boosted regression trees. J. Anim. Ecol. 2008, 77, 802–813. [Google Scholar] [CrossRef] [PubMed]
  60. Greenwell, B.; Boehmke, B.; Cunningham, J.; GBM Developers. gbm: Generalized Boosted Regression Models, R Package Version 2.1.8. GBM Developers; 2020. Available online: https://CRAN.R-project.org/package=gbm (accessed on 15 November 2021).
  61. R Core Team. R: A Language and Environment for Statistical Computing; R Foundation for Statistical Computing: Vienna, Austria, 2021; Available online: https://www.R-project.org/ (accessed on 19 July 2021).
  62. Bataineh, A.L.; Oswald, B.P.; Bataineh, M.; Unger, D.; Hung, I.-K.; Scognamillo, D. Spatial autocorrelation and pseudoreplication in fire ecology. Fire Ecol. 2006, 2, 107–118. [Google Scholar] [CrossRef]
  63. Ingalsbee, T. Ecological fire use for ecological fire management: Managing large wildfires by design. In Proceedings of the Large Wildland Fires Conference, Missoula, MT, USA, 9–23 May 2014; Keane, R.E., Jolly, M., Parsons, R., Riley, K., Eds.; U.S.D.A. Forest Service, Rocky Mountain Research Station: Fort Collins, CO, USA, 2015; pp. 120–127. [Google Scholar]
  64. Simpson, H.; Bradstock, R.; Price, O. Quantifying the prevalence and practice of suppression firing with operational data from large fires in Victoria, Australia. Fire 2021, 4, 63. [Google Scholar] [CrossRef]
  65. Jolly, W.M.; Freeborn, P.H.; Page, W.G.; Butler, B.W. Severe Fire Danger Index: A forecastable metric to inform firefighter and community wildfire risk management. Fire 2019, 2, 47. [Google Scholar] [CrossRef] [Green Version]
  66. Andrews, P.L.; Heinsch, F.A.; Schelvan, L. How to Generate and Interpret Fire Characteristics Charts for Surface and Crown Fire Behavior; General Technical Report RMRS-GTR-253; U.S. Department of Agriculture, Forest Service: Fort Collins, CO, USA, 2011.
  67. U.S.D.A. Forest Service. Aerial Firefighting Use and Effectiveness (AFUE) Report; U.S. Department of Agriculture, Forest Service: Washington, DC, USA, 2020.
  68. Yocom, L.L.; Jenness, J.; Fulé, P.Z.; Thode, A.E. Previous fires and roads limit wildfire growth in Arizona and New Mexico, U.S.A. For. Ecol. Manag. 2019, 449, 117440. [Google Scholar] [CrossRef]
  69. Thompson, M.P.; Freeborn, P.; Rieck, J.D.; Calkin, D.E.; Gilbertson-Day, J.W.; Cochrane, M.A.; Hand, M.S. Quantifying the influence of previously burned areas on suppression effectiveness and avoided exposure: A chase study of the Las Conchas Fire. Int. J. Wildland Fire 2016, 25, 167–181. [Google Scholar] [CrossRef]
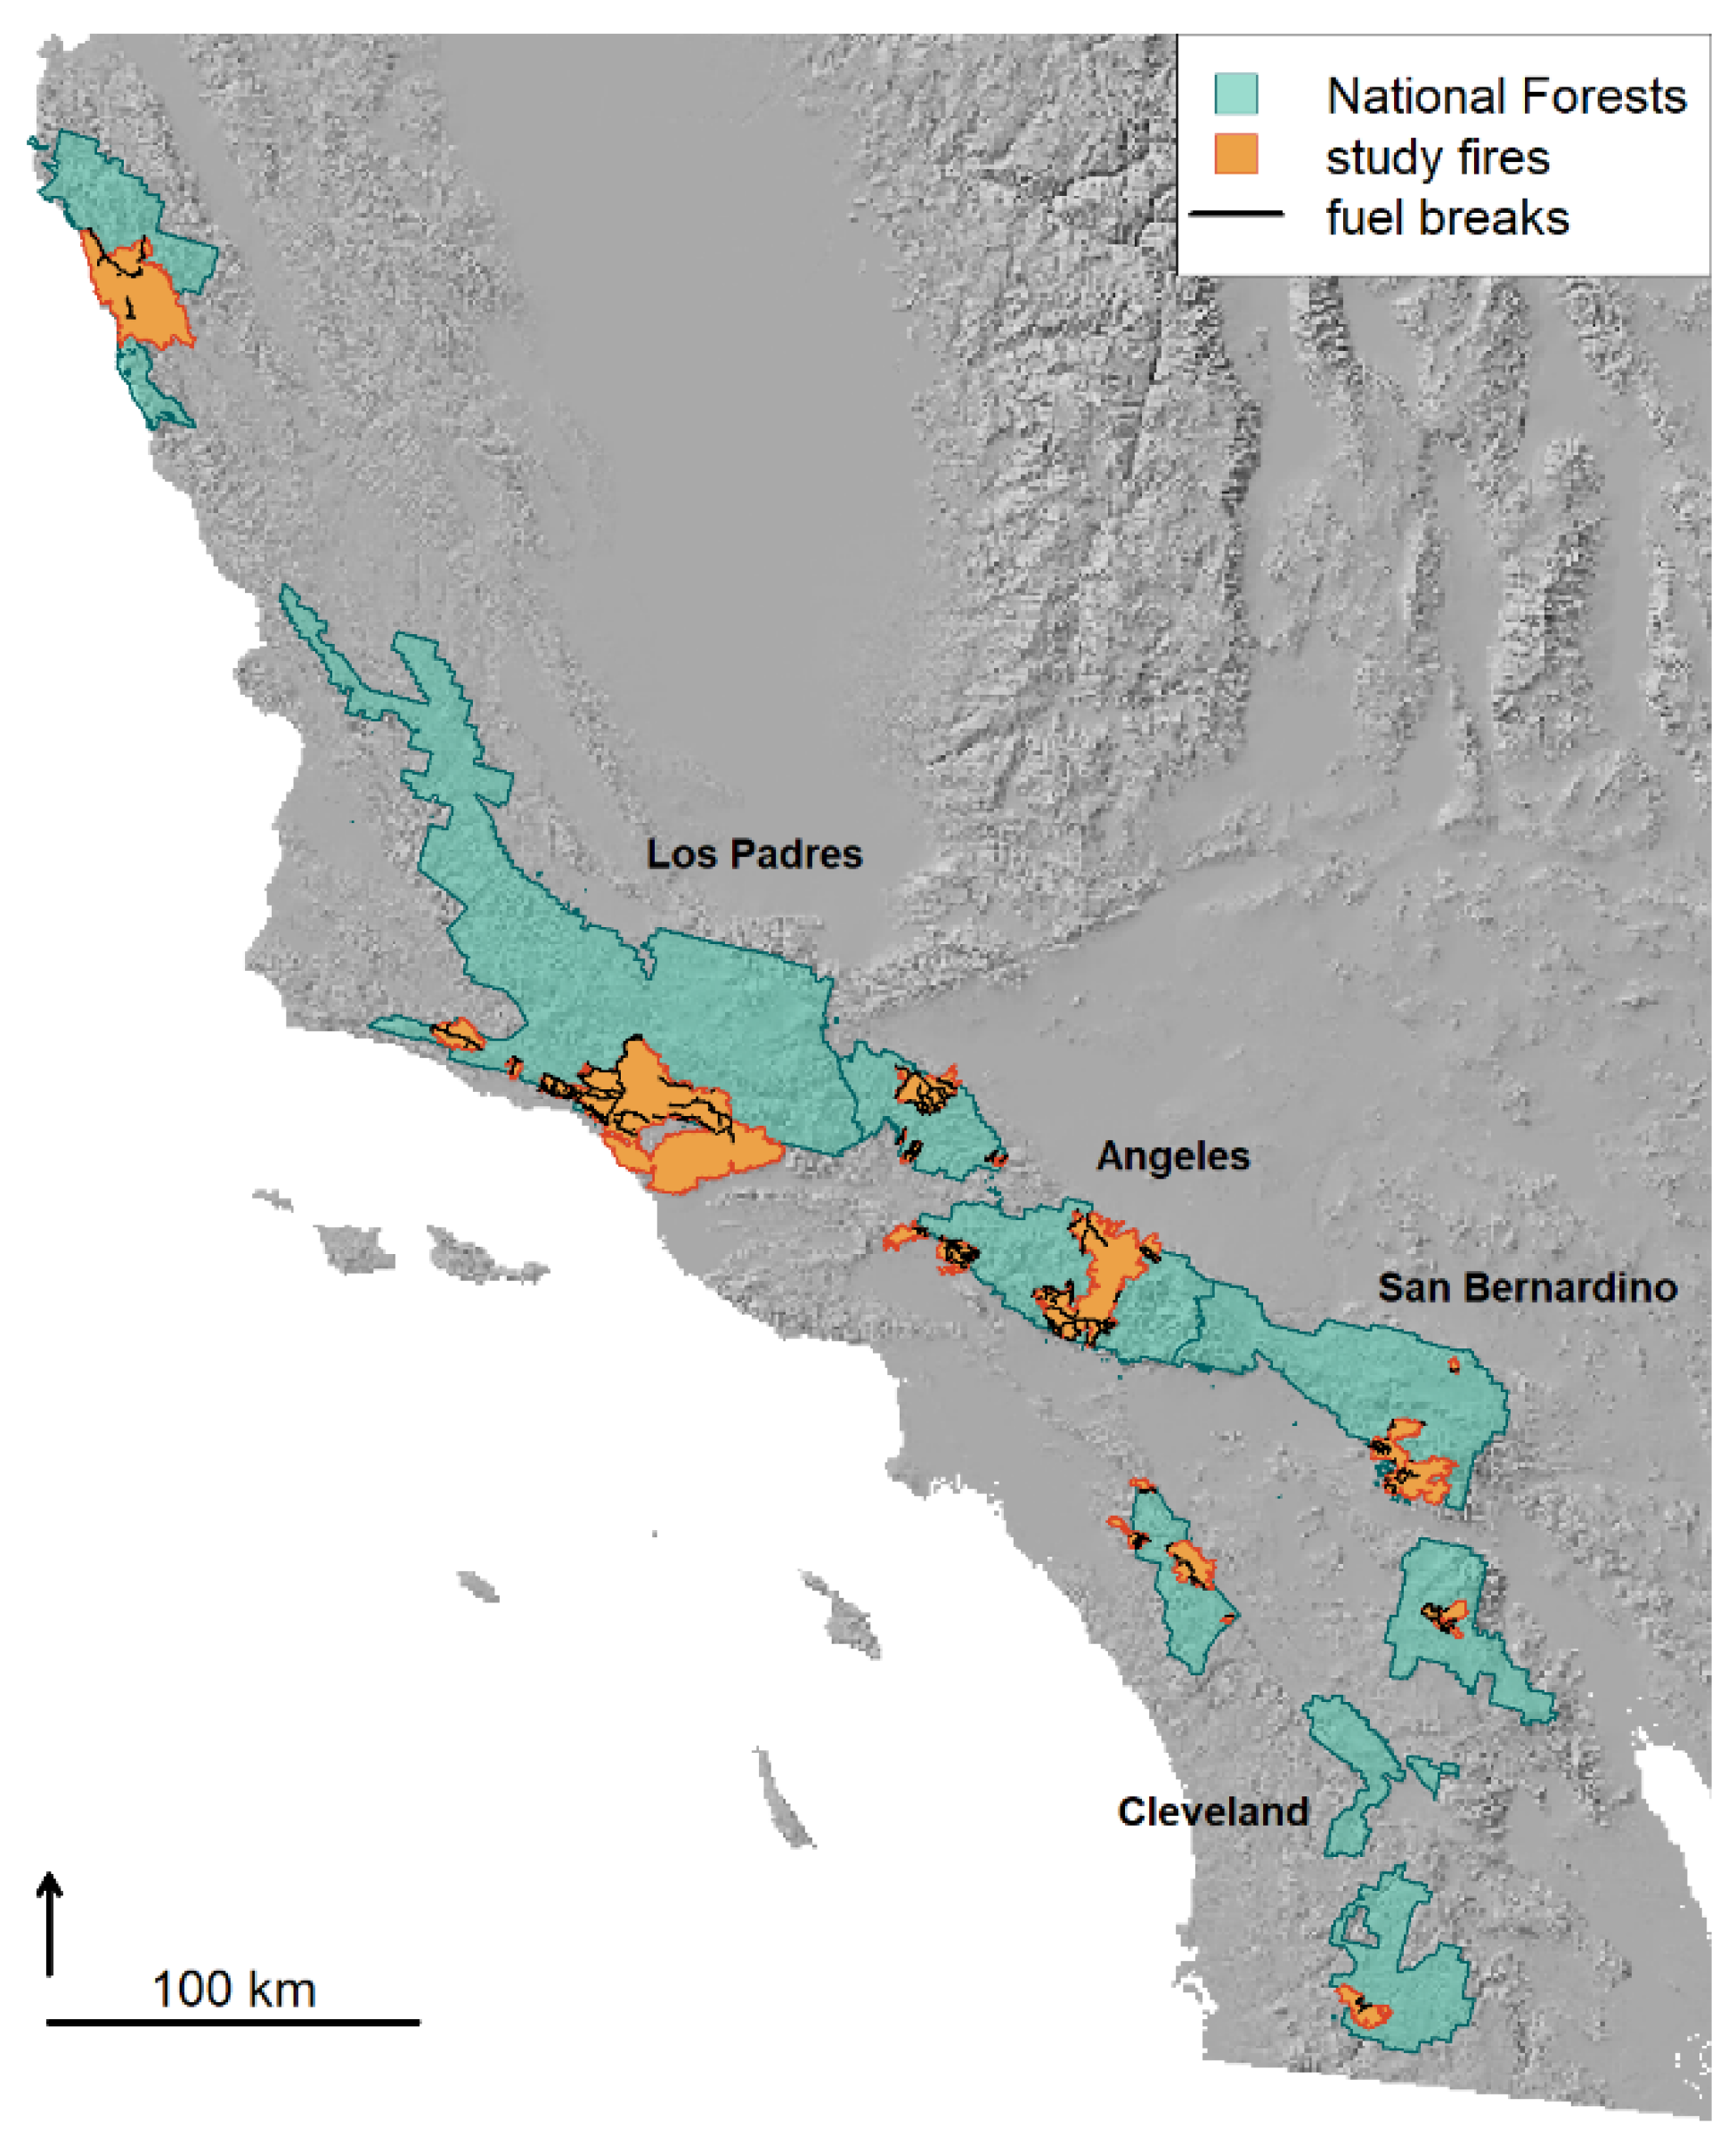
Figure 1. The study area includes the Angeles, Cleveland, Los Padres, and San Bernardino National Forests in Southern California. This map also shows the study wildfires and fuel breaks.
Fire 06 00104 g001
Figure 2. Example of fuel break samples and outcomes for the 2019 Saddle Ridge Fire. Samples were generated by rasterizing the fuel break polylines and converting the cell centers into points. Samples were considered successfully held if they fell within 100 m plus half the fuel break width of the final fire perimeter.
Fire 06 00104 g002
Figure 3. Example fire behavior variables for the 2018 Cranston Fire showing: (a) estimated date of burning in day of the year, (b) FRP from MODIS and VIIRS, and (c) spread encounter type.
Fire 06 00104 g003
Figure 4. Partial dependence plots for Model 2 with the full training data showing the mean effect of each variable, sorted in order of descending relative variable importance.
Fire 06 00104 g004
Figure 5. Relative variable importance for Model 2 with the full training data (red dots) and variation in relative variable importance for Model 2 from iteratively withholding each fire from the training data (boxplots).
Fire 06 00104 g005
Figure 6. Area under the receiver operating characteristics curve (AUC) results from the cross-validation by fire procedure. A weighted mean was calculated based on the number of observations in each validation set. The results for the five fires with the greatest number of observations are also shown.
Fire 06 00104 g006
Figure 7. Predicted probability of fuel break success overlaid on the final fire footprints for the (a) 2017 Thomas, (b) 2020 Bobcat, and (c) 2020 Lake Fires from Model 2, constructed by iteratively withholding each fire from the training data (cross-validation by fire).
Fire 06 00104 g007
Table 1. Characteristics of the large wildfires in our analysis of fuel break effectiveness, including fire year, name, area, the number of point samples of fuel break–wildfire interactions, fuel break success rate (% of point samples that held), availability of fireline data (see suppression section), and availability of fire detection data (see fire behavior section).
YearNameArea (ha)Sample PointsSuccess Rate (%)FirelineFire Detections
2017Canyon 110772770.51YesYes
2017Creek632126850.09YesYes
2017Holcomb609840.37YesYes
2017Lake2973070.74YesNo
2017Thomas114,07911,8020.20YesYes
2017Whittier74519710.16YesYes
2017Wildomar3511000.60YesYes
2018Charlie135610730.46NoNo
2018Cranston539520060.47YesYes
2018Holy93189350.32YesYes
2018Stone5471100.19NoYes
2019Cave12653710.36NoYes
2019Saddle Ridge35614930.32YesYes
2020Apple13,45011420.15YesYes
2020Bobcat46,94364370.34YesYes
2020Bond27038680.08YesYes
2020Dolan50,39522010.17YesYes
2020El Dorado920416350.30YesYes
2020Lake12,54539180.31YesYes
2020Ranch 216677800.82NoYes
2020Rowher2623070.72YesNo
2020Valley66334510.44YesYes
Table 2. Predictors of fuel break effectiveness sorted by data category (see text for complete descriptions and data sources) and specification of models evaluated in this paper (* for inclusion in model).
Model
CategoryPredictor VariableUnits12345
AccessibilityRoad proximityContinuous: 1 on road declining to 0 at 1000 m*****
Fire behaviorDaily area burnedHectare (ha)****
Encounter typeCategorical: heading, flanking, and backing****
Fire radiative powerMegawatt (MW)*
Fuel breakConditionOrdinal: 1 for poor to 5 for excellent*****
Fire breakBinary: 0/1 for absent/present*****
WidthMeters (m)*****
SuppressionAerial dropBinary: 0/1 for absent/present*****
FirelineBinary: 0/1 for absent/present*****
TopographySlopePercent*****
Topographic Position IndexMeters (m) above or below neighborhood mean*****
Veg/fuelsCanopy coverPercent*****
Fire Behavior Fuel ModelCategorical: Anderson 13 + non-burnable*****
Recent wildfireBinary: 0/1 for absent/present in prior 10 years*****
Recent treatmentBinary: 0/1 for absent/present in prior 10 years*****
WeatherBurning IndexContinuous: positively associated with fire *
Energy Release ComponentContinuous: positively associated with fire *
100 h fuel moisturePercent** *
Maximum relative humidityPercent** *
Vapor Pressure DeficitContinuous: positively associated with fire *
Wind speedMeters per second (m/s)** **
Table 3. Relative variable importance by model for included variables (top). The three most important variables in each model are in bold. Excluded variables are marked with X. Model performance metrics (bottom). * denotes accuracy metrics based on success predicted for probabilities ≥ 0.5 with the full model training data.
CategoryPredictor VariableModel 1Model 2Model 3Model 4Model 5
AccessibilityRoad proximity3.53.73.63.63.9
Fire behaviorDaily area burned8.810.620.320.6X
Encounter type1.41.31.42.1X
Fire radiative power14.4XXXX
Fuel breakCondition2.53.73.43.24.0
Fire break0.41.21.31.51.4
Width5.86.57.97.98.1
SuppressionAerial drop5.75.86.46.46.5
Fireline17.318.718.818.919.6
TopographySlope0.40.50.50.60.6
Topographic Position Index2.12.62.92.82.8
Veg/fuelsCanopy cover1.52.02.12.12.4
Fire Behavior Fuel Model3.03.83.53.14.0
Recent wildfire2.84.24.24.74.4
Recent treatment3.13.34.35.13.5
WeatherBurning IndexXX7.4XX
Energy Release ComponentXX11.9XX
100 h fuel moisture6.48.6XX11.3
Maximum relative humidity15.517.4XX19.4
Vapor Pressure DeficitXXX7.8X
Wind speed5.56.1X9.57.9
PerformanceAUC (training)0.9760.9670.9660.9650.963
metricsAUC (3-fold)0.9710.9620.9610.9600.958
Overall accuracy (%) *92.991.991.791.691.5
Obs. failure & Pred. failure (n) *27,27527,18827,19127,25727,167
Obs. failure & Pred. success (n) *792879876810900
Obs. success & Pred. failure (n) *19692263234024772418
Obs. success & Pred. success (n) *89178623854684098468
Table 4. Mean results for Model 2 trained with 20 random subsets of the full training dataset with minimum spacing distances of 50 to 500 m. AUC and overall accuracy were calculated with all samples not used for model training. The Spearman rank correlation is calculated by comparing the full and subset model predictions for the entire training dataset.
Minimum Spacing (m)Sample PointsPercent of Full Sample PointsAUCOverall Accuracy (%)Spearman Corr. with Full Model Predictions
5012,50032.10.96391.20.994
100615215.80.95990.70.984
20031148.00.95089.70.963
50011462.90.92587.20.909
Disclaimer/Publisher’s Note: The statements, opinions and data contained in all publications are solely those of the individual author(s) and contributor(s) and not of MDPI and/or the editor(s). MDPI and/or the editor(s) disclaim responsibility for any injury to people or property resulting from any ideas, methods, instructions or products referred to in the content.