Article

Sensitivity Analysis of Influencing Factors of Fire Smoke Transport on Subway Station Platforms

1
College of Building Environment Engineering, Zhengzhou University of Light Industry, Zhengzhou 450001, China
2
Zhengzhou Key Laboratory of Electric Power Fire Safety, Zhengzhou 450001, China
*
Author to whom correspondence should be addressed.
Fire 2023, 6(12), 448; https://doi.org/10.3390/fire6120448
Submission received: 23 September 2023 / Revised: 21 November 2023 / Accepted: 22 November 2023 / Published: 23 November 2023
(This article belongs to the Special Issue Fire Numerical Simulation)

Abstract

:
This paper investigates the sensitivity of factors influencing the transport of smoke in subway station fires by developing a three-dimensional physical model of a subway station using Building Information Modeling (BIM) technology and importing it into Fire Dynamics Simulator (FDS) software for numerical simulation. The orthogonal test method analyzes the effects of four common factors on temperature, CO concentration, and visibility. These factors are the mode of opening the screen door, the number of smoke vents opened, the number of smoke barriers, and the wind speed of the smoke vents. The results show that the smoke control system and the building structure influence smoke transport in subway stations, while the temperature and CO concentration gradually decrease as the distance from the fire source increases. In addition, the mode of opening the screen door is the most significant factor influencing temperature, CO concentration, and visibility using range and variance analysis. Moreover, the sensitivity analysis indicates that the optimal combination of all factors can significantly enhance the smoke exhaust efficiency. Compared with the average, the temperature optimal combination increases the smoke exhaust efficiency by 20.8%, CO concentration by 56.59%, and visibility by about 13.41%. This study provides a foundation for optimizing smoke control systems and formulating personnel evacuation strategies in subway stations.

1. Introduction

A subway has a large passenger capacity, short travel time, and high cost-effectiveness, making it a crucial mode of transportation in modern cities [1]. However, there are usually limited exits connecting the subway station to the outside world. Once a fire accident occurs, the intense heat and toxic smoke will rapidly propagate outward through the limited exits due to the thermal buoyancy, posing a grave threat to the safety of passengers [2]. According to statistics [3], fire accidents account for about 30% of the total number of subway accidents. For example, in 2003, a major fire accident occurred at the Daegu Central Subway Station in South Korea, resulting in 192 deaths and 148 injuries [4]. In 2017, an arson case took place in the Hong Kong subway, causing one person to be seriously injured and eighteen people to be lightly injured [5]. Hence, systematically studying the migration pattern of fire smoke in subway stations has a significant practical significance in effectively curbing fire spread and minimizing casualties.
Scholars have studied the transportation pattern of fire smoke in subway stations using field tests, model experiments, and numerical simulations [6]. Regarding field tests, the Institute of Public Safety at Tsinghua University conducted full-scale fire tests in Nanchang and Guangzhou, which involved an island-side subway station. These tests studied the principles that govern smoke behavior under different smoke exhaust modes [7]. A full-scale fire test on a cross-transfer subway station was conducted by Tian et al. [8], revealing the substantial influence of the ventilation and smoke exhaust system on the velocity, range, and height of smoke diffusion. Pan et al. [9] adopted a full-scale experimental approach to investigate the impact of water mist on smoke temperature and toxic substances in subway station fires.
Regarding model experiments, Shi et al. [10,11,12] built a compact experimental platform to study the law of smoke propagation in scenarios such as subway platform fire, train fire, and tunnel fire, and proposed the corresponding smoke control strategies. Gao et al. [13] proposed a buoyancy frequency method based on the vertical distribution of tunnel temperature in a scaled experiment to determine the height of the smoke layer. The results demonstrated the high accuracy of this approach. Mei et al. [14] conducted several combustion experiments using a scaled 1:20 model and employed the integral ratio and within-class variance methods to calculate the thickness of the smoke layer. The results indicated that both methods had high calculation accuracy. Luo et al. [15] built a small (1:50) subway station model and analyzed the influence of natural, mechanical, and mixed ventilation on subway station fire smoke transport law. Meng et al. [16] used a scaled (1:10) model to investigate the maximum smoke temperature and the longitudinal temperature distribution beneath the tunnel roof. Long et al. [17] constructed a 1:8 scaled experimental platform to investigate the attenuation pattern of the maximum temperature of the ceiling jet. Furthermore, Liu et al. [18], Chen et al. [19], and Long et al. [20] conducted experiments using a 1:10 scaled model test platform to investigate the migration pattern of fire smoke in large transfer stations of varying designs, including T-shaped, cross-shaped, and L-shaped configurations. Drysdale et al. [21] established a reduced-scale test bench at a 1:15 ratio to simulate the conditions of King’s Cross underground station in London and revealed that the trench effect significantly affected the propagation of fire smoke.
Nevertheless, numerical simulation methods have gained widespread popularity due to their convenience, flexibility, repeatability, and cost-effectiveness compared to field tests and model experiments. For instance, Tavakolian et al. [22] conducted numerical simulations to compare smoke exhaust systems between the island platform station and two-sided platform stations and found that the former station type presented greater challenges in smoke control. Liu et al. [23] compared staircases with and without side slabs to analyze the critical velocity for preventing smoke transmission from the platform to the station hall floor. Meng et al. [24] numerically analyzed the performance of ventilation modes between the fully sealed screen doors and the semi-high security doors in subway stations. By numerical simulation, Zheng et al. [25] concluded that the smoke control effect in subway stations was positively correlated with the smoke baffle wall height within the design specification. Zhang et al. [26] and Li et al. [27] simulated a subway station fire by numerical simulation, determined the time required for CO concentration, smoke temperature, and visibility to reach the critical value, and concluded that under fire conditions, visibility in the station would take the shortest time to reach the critical value and pose the greatest threat to safety evacuation. Meng et al. [28] used numerical simulation to study the smoke aspiration phenomenon during the operation of lateral mechanical smoke extraction systems in subway stations. They concluded that the probability of the smoke aspiration phenomenon could be effectively reduced, and the effect of mechanical smoke extraction could be improved by setting up a smoke exhaust baffle. Tsukahara et al. [29] studied the smoke distribution, smoke concentration, and toxic gas distribution of evacuation stairs in Daegu subway station, South Korea, and found that downward evacuation was more effective than upward evacuation after the fire occurred.
In summary, numerous studies have studied the law of fire smoke transport in subway stations worldwide. However, most studies employed the single-factor analysis method, which has obvious limitations as it assumes that other factors remain constant, making it unable to indicate the magnitude of the impact of a specific factor on the effectiveness of a smoke control system. This work introduces the orthogonal experiment multi-factor method to conduct the sensitivity analysis and discuss primary and secondary orders of key factors. The aim is to provide a theoretical basis for the design of subway smoke control and exhaust systems.

2. Modeling and Numerical Calculation

2.1. Fire Simulation Process

Figure 1 illustrates the specific processes: ① Using BIM technology, a three-dimensional physical model for the island-type subway station was constructed. According to the Industry Foundation Classes (IFC) standard, the model was exported from the BIM as a DXF file and imported into the FDS. ② Four factors were considered as the research objects for studying the effectiveness of the smoke extraction system on subway platforms: the mode of opening the screen door, the number of smoke vents opened, the number of smoke barriers, and the wind speed of the smoke vent. Moreover, the orthogonal experimental analysis method was employed to systematically analyze the significance of different factors on smoke temperature, CO concentration, and visibility. ③ Based on these findings, the optimal operation mode for the smoke control and exhaust system was determined, and performance-based fire protection design recommendations were proposed.

2.2. Physical Model

The subway station has a total length of 192 m, with a standard cross-section width of 18.7 m. The negative second floor is an island platform with a width of 10 m. The main building occupies an area of 7420 m2, while the auxiliary building covers 3317 m2. Additionally, the public area on the platform floor spans 1176 m2. Each subway train carriage has 4 shield doors on one side, and each shielding door is 1.3 m wide. The distance from the center of the shield door to both ends of the train body is 2.45 m, and the distance between the centers of adjacent shield doors is 4.7 m.
As depicted in Figure 2, the station has 4 entrances/exits labeled as NO.1~NO.4. The smoke extraction system ducts are evenly distributed along both sides of the escalator, with 12 smoke vents installed. The smoke extraction fan equipment rooms are located at each end of the subway. During the experiment, the ignition source was placed in the middle of the platform level, and multiple indicator detectors were installed every 1 m on both sides of the ignition source.

2.3. Mathematical Model

FDS (Fire Dynamics Simulator) is fire dynamics simulation software developed by the National Institute of Standards and Technology (NIST) of the United States. This software is based on mass, momentum, and energy conservation [30], and is one of the most commonly used pieces of software for studying fire development patterns.
Mass conservation equation:
ρ t + · ρ u = 0
Momentum conservation equation:
t ( ρ u ) + · ρ u u + p = ρ g + f + · τ i j
Energy conservation equation:
t ( ρ h ) + · ρ h u = D p D t + q · q r + Φ
Equation of state of an ideal gas:
p = ρ R T W
where ρ is density (kg/m3), t is time (s), u is velocity (m/s), g is acceleration of gravity (9.8 m/s2), f is the external force vector (N), τij is the viscous stress tensor of a Newtonian fluid (m2/s), h is enthalpy (J/kg), p is pressure (Pa), q′ is the heat release rate per unit volume (W/m3), qr is the heat flow vector per unit area (W/m2), T is temperature (K), Φ is the dissipation function, R is the gas constant (8.314 J/ (mol · K)), W is the relative molecular mass (1), and Dp/Dt is the rate of change in pressure over time.

2.4. Grid Division

Properly setting the mesh parameters can enhance the calculation precision and save time. According to the FDS User Guide [31], the cell size is determined by adopting the characteristic diameter of the fire source.
D = ( Q ρ C p T g ) 2 5
where D* is the characteristic diameter of the fire source (m), Q is the fire source power (kW), ρ is air density (kg/m3), Cp is the specific heat capacity of constant pressure air (J/(kg·°C)), and T is the ambient temperature, which is set to 20 °C.
A subway station fire is a typical example of a confined space fire. The development of a confined space fire comprises the ignition phase, growth phase, fully developed phase, and decay phase. To evaluate the effectiveness of smoke control systems, this paper primarily focused on the fully developed phase of the fire scenario. The ignition point was located in the central area of the station with a fixed load. In the subway platform area, the main type of fire at the platform level is a conventional fire caused by luggage, clothing, and other items, and the maximum heat release rate of such fires generally does not exceed 2 MW [32]. Therefore, the fire source was modeled using the volume heat source method, with a combustion area size of 1 × 1 m and a heat release rate of 2 MW.
Typically, when the cell size δx ranges between 0.06 D* and 0.25 D* [33], the accuracy of the calculation results can be ensured. Therefore, the characteristic diameter D* was 1.27 m, and the range of the cell size δx was 0.08 m~0.32 m.
In order to balance computer hardware resources, a step-by-step shrinking method was adopted to discuss the sensitivity of the grid. Thus, an appropriate simulation accuracy was determined. Figure 3 shows that this paper compares the calculation results of four cell sizes, ranging from 0.15 m to 0.5 m. It can be seen that when the cell size varies between 0.15 m and 0.3 m, the temperature difference is very small. Gao et al. [34] and Zhang et al. [35] proposed that the area far from the fire source should generally be twice the cell size in the fire source area. Therefore, in this calculation, the cell size in the fire source area was defined as 0.15 m, and the cell size in other areas was 0.3 m.

2.5. Initial and Boundary Conditions

For the initial conditions, the initial ambient temperature inside the station was 20 °C, and the initial pressure was 1 standard atmosphere. For the boundary conditions, the wall boundaries were considered adiabatic with no-slip conditions, the station entrances and exits had free boundaries with pressure and temperature equal to the external environment, and each ventilation outlet had a velocity boundary condition.
The fire material used in this study is polyurethane, with its element composition reported in Table 1. The entire simulation was conducted under ventilation conditions, and the CO generation rate from the fire was 0.1 (kg/kg).

3. Orthogonal Experiment

3.1. Orthogonal Design

The orthogonal experimental design was a comprehensive and efficient test design method that selected representative experimental combinations from a design of multiple factors and levels for analysis [36] and ultimately identified the optimal experimental combination scheme.
The orthogonal experiment involves the following steps [37]: clarify the experimental purpose and establish the evaluation criteria; select each factor and determine the number of levels; choose an orthogonal table and design the table header; clarify the experimental plan; conduct the experimental investigation and obtain the data; perform statistical analysis on the experimental data.

3.2. Factor Levels

The key to optimizing the design of the smoke exhaust system in subway stations is to maximize the evacuation time. In this paper, four common factors that affect the spread of fire smoke in subway stations were examined, i.e., (A) mode of opening the screen door, (B) number of smoke vents opened, (C) number of smoke barriers, and (D) wind speed of the smoke vents.
(A) Mode of opening the screen door
The spread of fire smoke on subway platforms is influenced by both the platform smoke exhaust system and the tunnel smoke exhaust system. When a fire occurs, the platform screen doors block the smoke from spreading into the tunnel, and their opening and closing significantly impact both systems’ performance [38]. Therefore, this paper sets three operation modes for the platform screen doors: fully open on both sides, one side open and the other closed, and fully closed.
(B) Number of smoke vents opened
The quantity and position of smoke vents vary significantly depending on the location of the fire source. In [39], the authors pointed out that opening smoke vents far from the fire source can create adverse disturbances to the smoke flow, reducing the smoke extraction efficiency. Therefore, this paper defines every two smoke vents on each side of the fire source as a group (e.g., 5–6 and 7–8 are individual groups), as depicted in Figure 1. Moreover, three scenarios of opening smoke vents are studied: two groups (5–8), four groups (3–10), or six groups (1–12) are opened simultaneously.
(C) Number of smoke barriers
When designing smoke control systems, the smoke barriers can effectively limit the initial spread of fire smoke within a certain range for a short period. This measure effectively hinders the horizontal propagation of smoke and increases the time for safely evacuating people and firefighters [40]. However, the control effectiveness of smoke barriers diminishes in the later stages of the fire [41]. Therefore, this paper examines three arrangements of smoke barriers, as illustrated in Figure 1: installing two smoke barriers, a single smoke barrier, and no smoke barriers.
(D) Wind speed of the smoke vents
The airflow rate at the smoke vent can affect the smoke extraction volume per unit of time. If the airflow rate is too high, more air will be incorporated into the extracted smoke. Conversely, if the airflow rate is too low, it may result in the accumulation of smoke within the subway station in a short period, increasing the risk of accidents [42]. Therefore, according to subway design specifications [43], the airflow rate at smoke vents should not exceed 10 m/s. This study considers three scenarios for the airflow rate at the smoke vent: 1 m/s, 5 m/s, and 10 m/s.
Furthermore, an orthogonal array was constructed based on the above analysis without considering the interaction of the factors. Table 2 presents the orthogonal array of factor levels, and Table 3 reports the L9(34) orthogonal experimental working conditions.

3.3. Test Index

According to the fire protection standards for subway design presented in Section 5.1.1 [43], a subway station should ensure that all passengers on the platform can be evacuated within 6 min. To ensure the consistency of each test index under different fire scenarios, it is stipulated that the numerical simulation time of each test scheme is 6 min. As reported in Table 4, within the range of human eye characteristics, the critical conditions for fire hazard refer to the minimum values of temperature, CO concentration, and visibility that affect the safe evacuation of people.

4. Results and Discussion

4.1. Fire Smoke Distribution in the Subway Station Platform

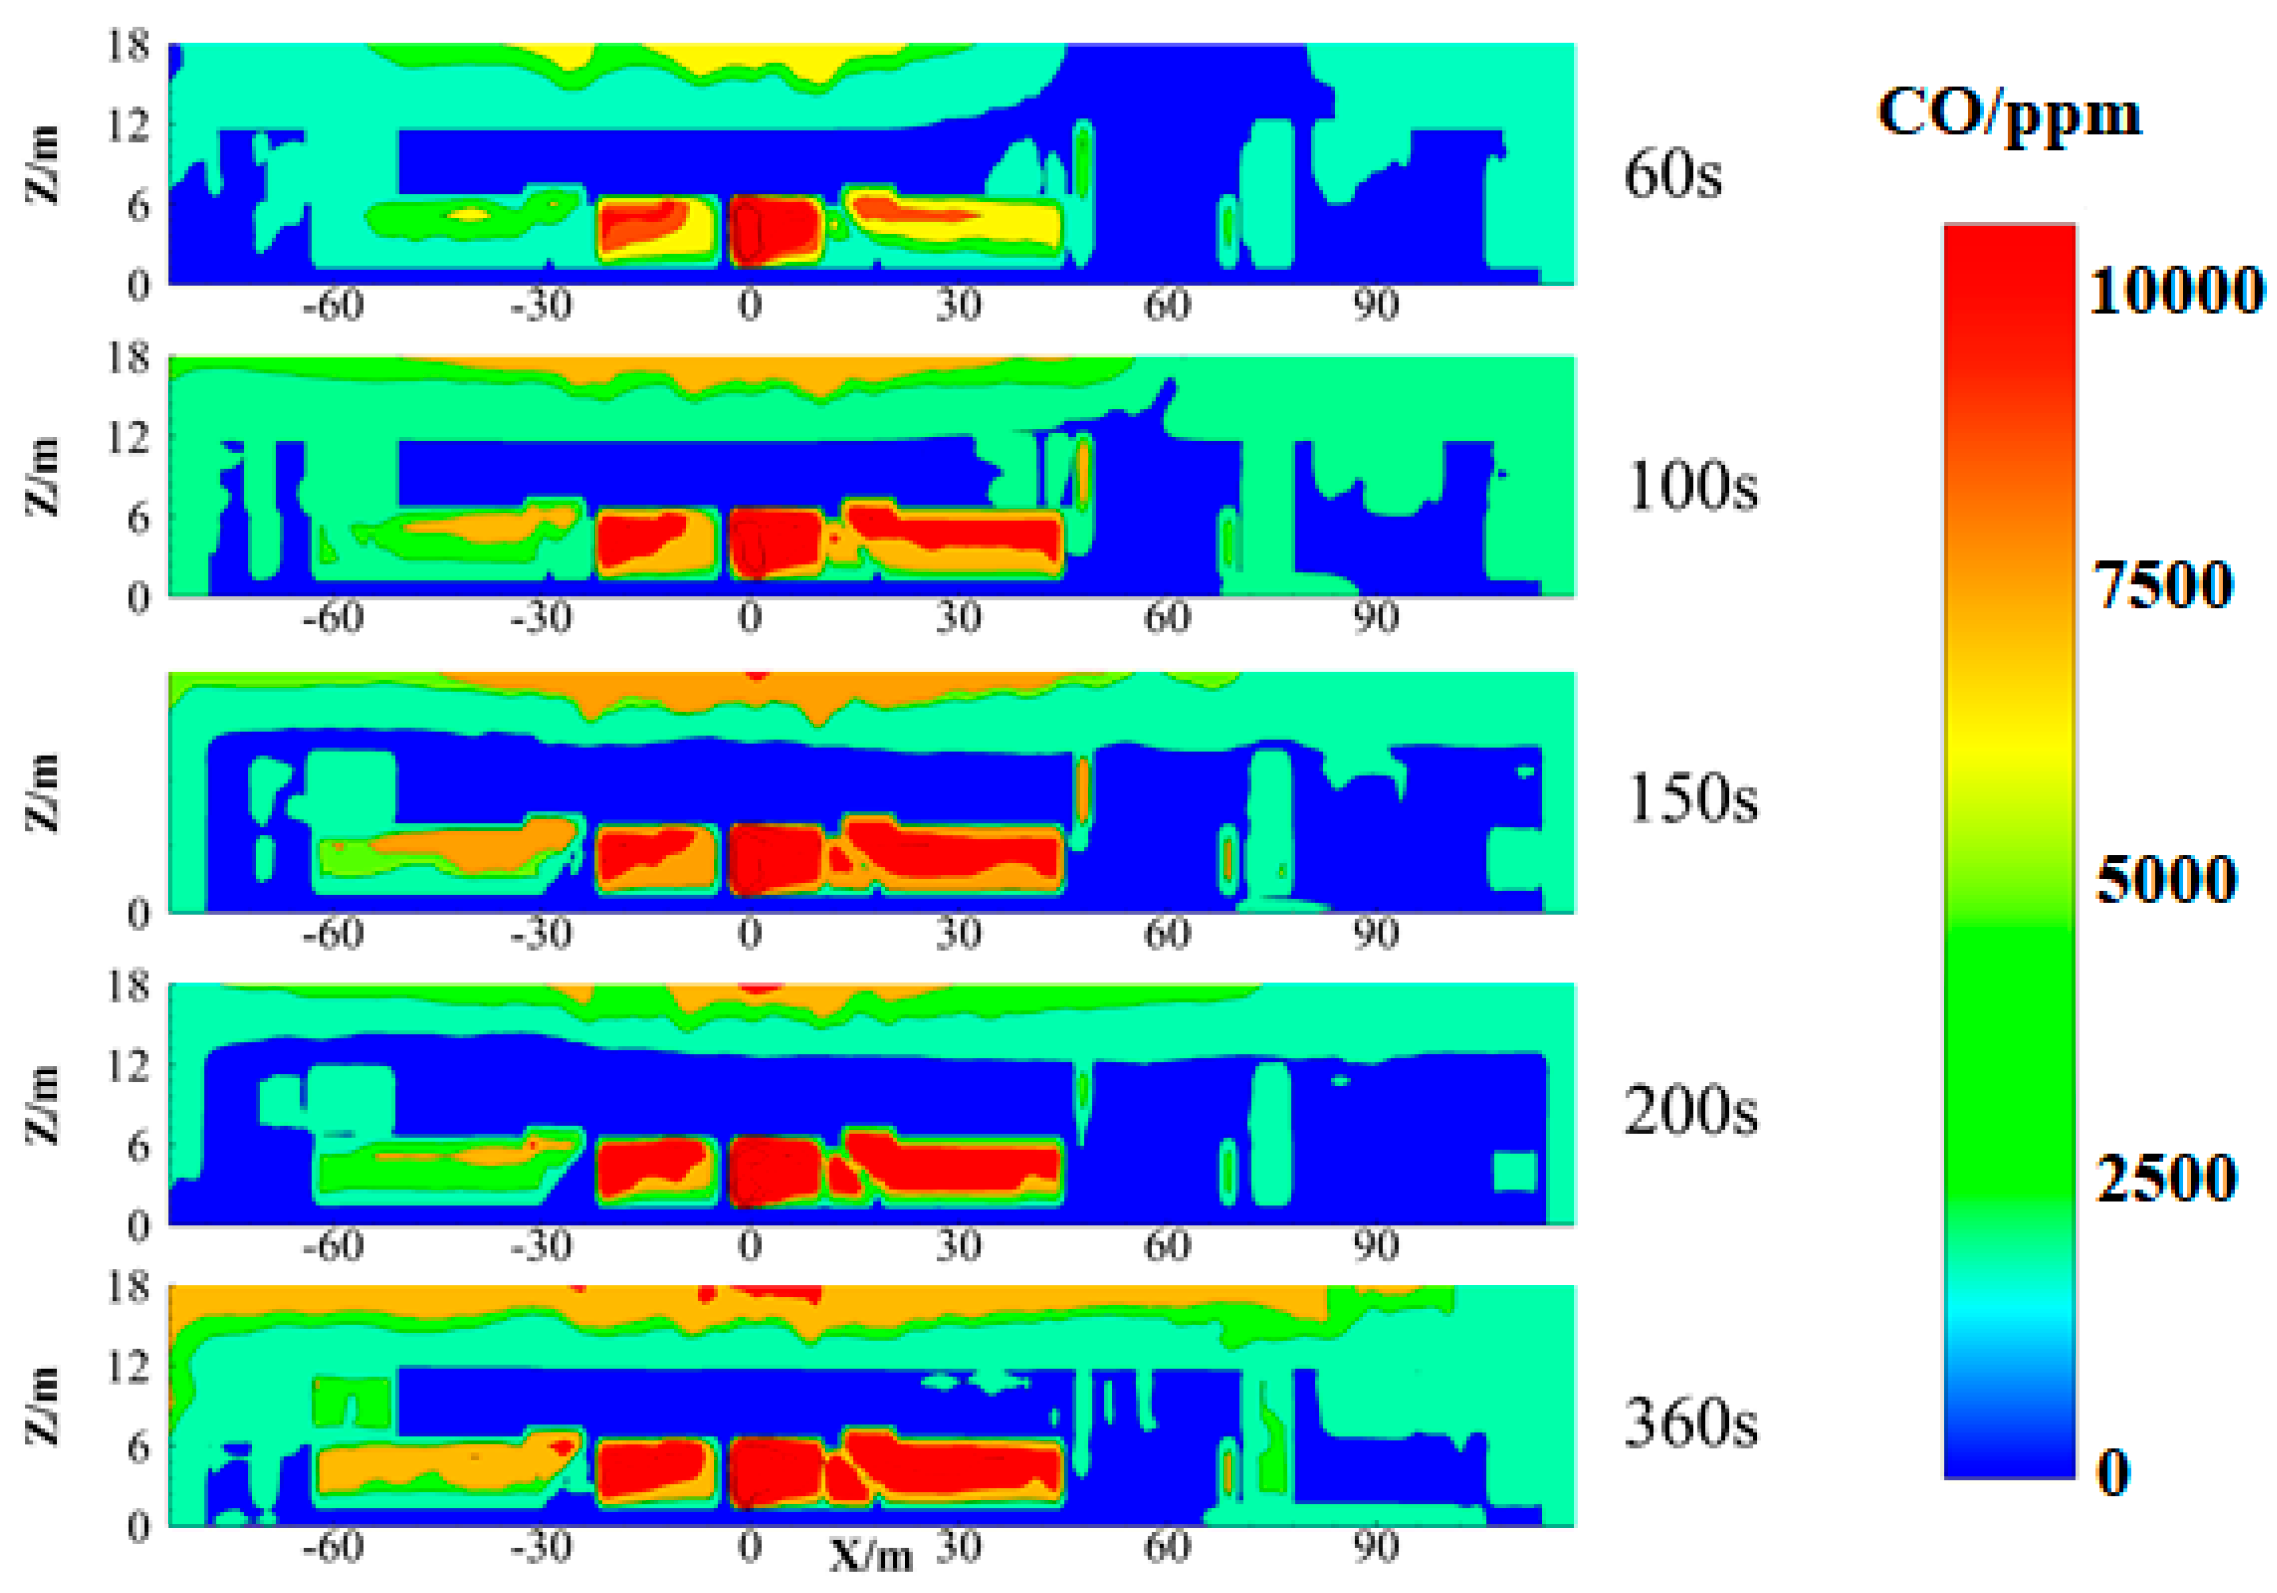
Taking the 5# level as an example, we captured the cloud maps of temperature, CO concentration, and visibility at the time when the fire developed to 60 s, 100 s, 150 s, 200 s, and 360 s and arranged them in chronological order from top to bottom.
Figure 4 and Figure 5 illustrate the distributions of ambient temperature and CO concentration at different moments in the vertical center line (Y = −15 m). The results reveal that the ambient temperature and CO concentration around the fire source rapidly increase after the occurrence of a fire. Under the influence of the thermal buoyancy and fire plume, the smoke moves upward and then spreads when blocked by the roof. As the fire develops, the horizontal movement of the fire smoke causes an increase in the surrounding temperature and CO concentration. However, the further away from the source of the fire, the lower the concentration of CO and temperature. Furthermore, the horizontal movement of the fire smoke is influenced by the obstruction of barriers and escalators, resulting in significant differences in smoke temperature and CO concentration on both sides of the escalators. However, as time progresses, when the fire reaches 360 s, the temperature and CO concentration in most areas, although not reaching the critical value, are generally high and still have a greater impact on the evacuation of personnel.
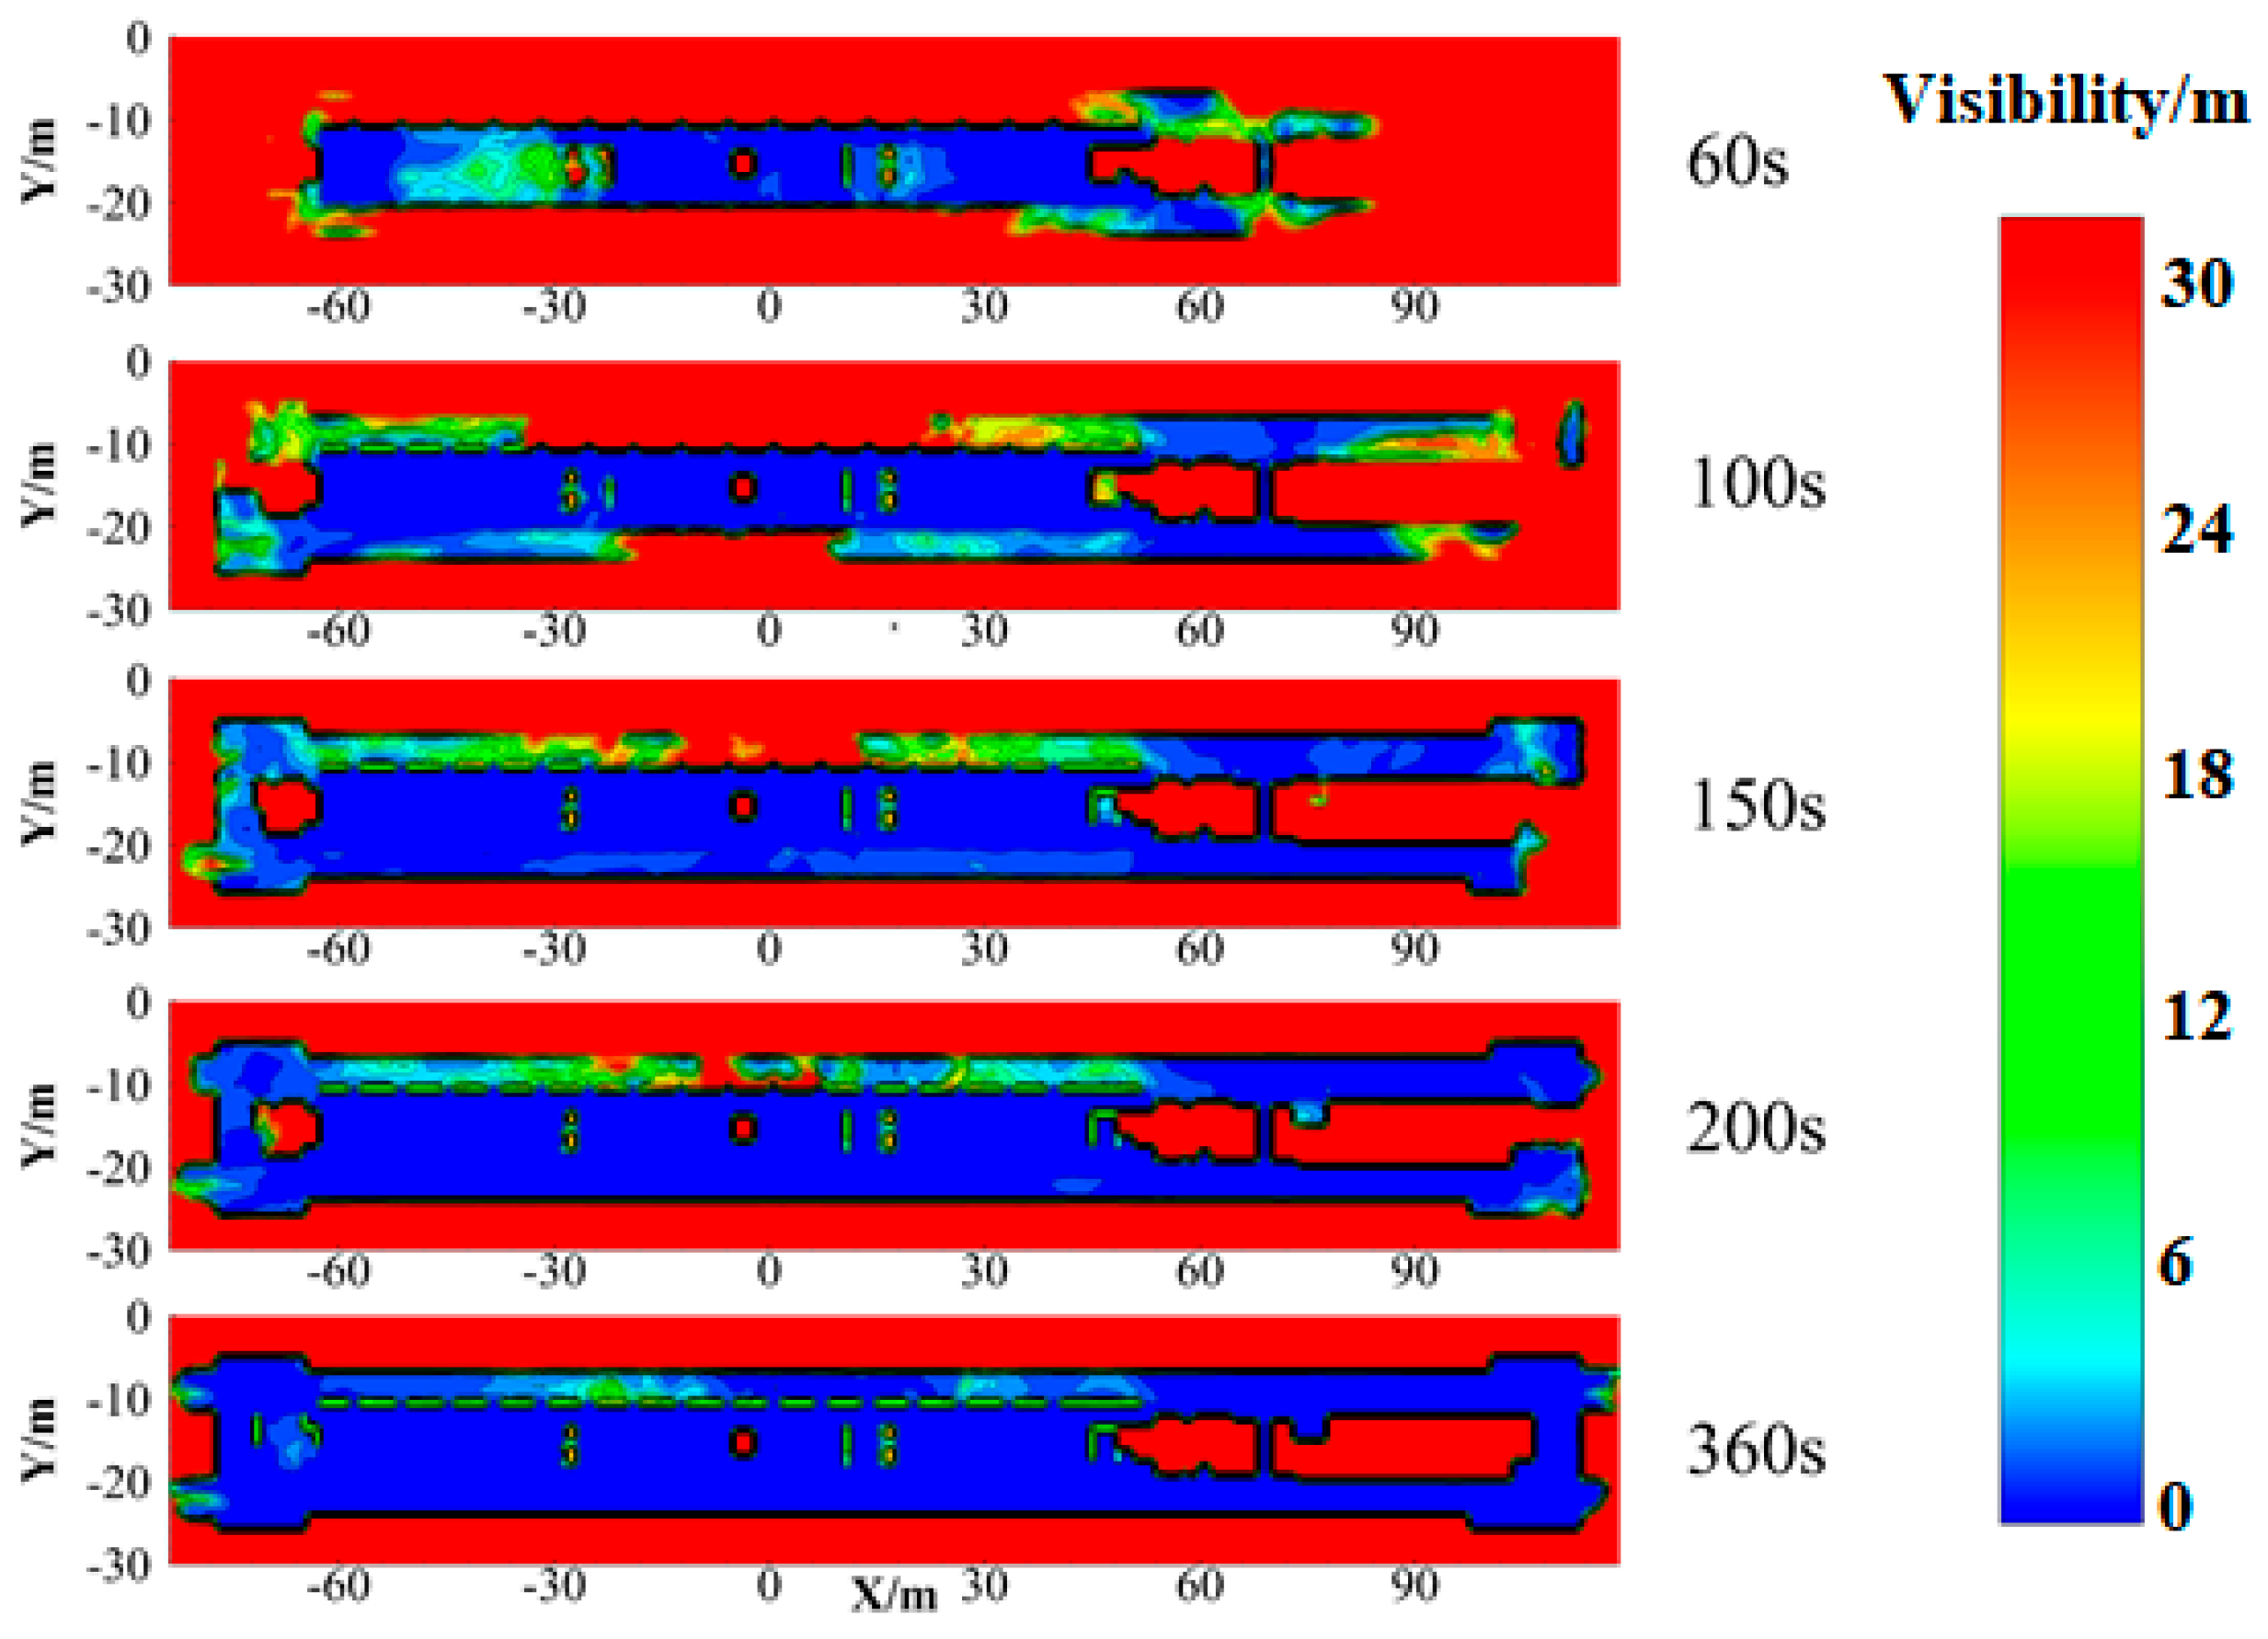
The smoke produced by the fire can block light, and the greater the concentration of smoke, the more it will affect the normal evacuation of personnel [45]. Therefore, visibility is one of the most important factors affecting the speed of personnel evacuation and escape after a subway fire. Figure 6 presents the visibility distribution at different times based on the human eye feature height (Z = 1.6 m). It can be seen that a large amount of smoke appears on the platform floor at 60 s, and the visibility of the environment around the fire source decreases significantly. When the fire reaches 100 s, the visibility near the escalator is significantly lower than the critical value of 10 m. When it reaches 150 s, the visibility of the entire platform floor has dropped to only 4 m, far below the dangerous threshold. By the time it reaches 360 s, the visibility throughout the entire subway station has significantly dropped below 10 m, and some smoke escapes from the subway platform. Therefore, the safe evacuation of the crowd will be greatly threatened at this time.

4.2. Fire Smoke Migration Curves under Different Working Conditions
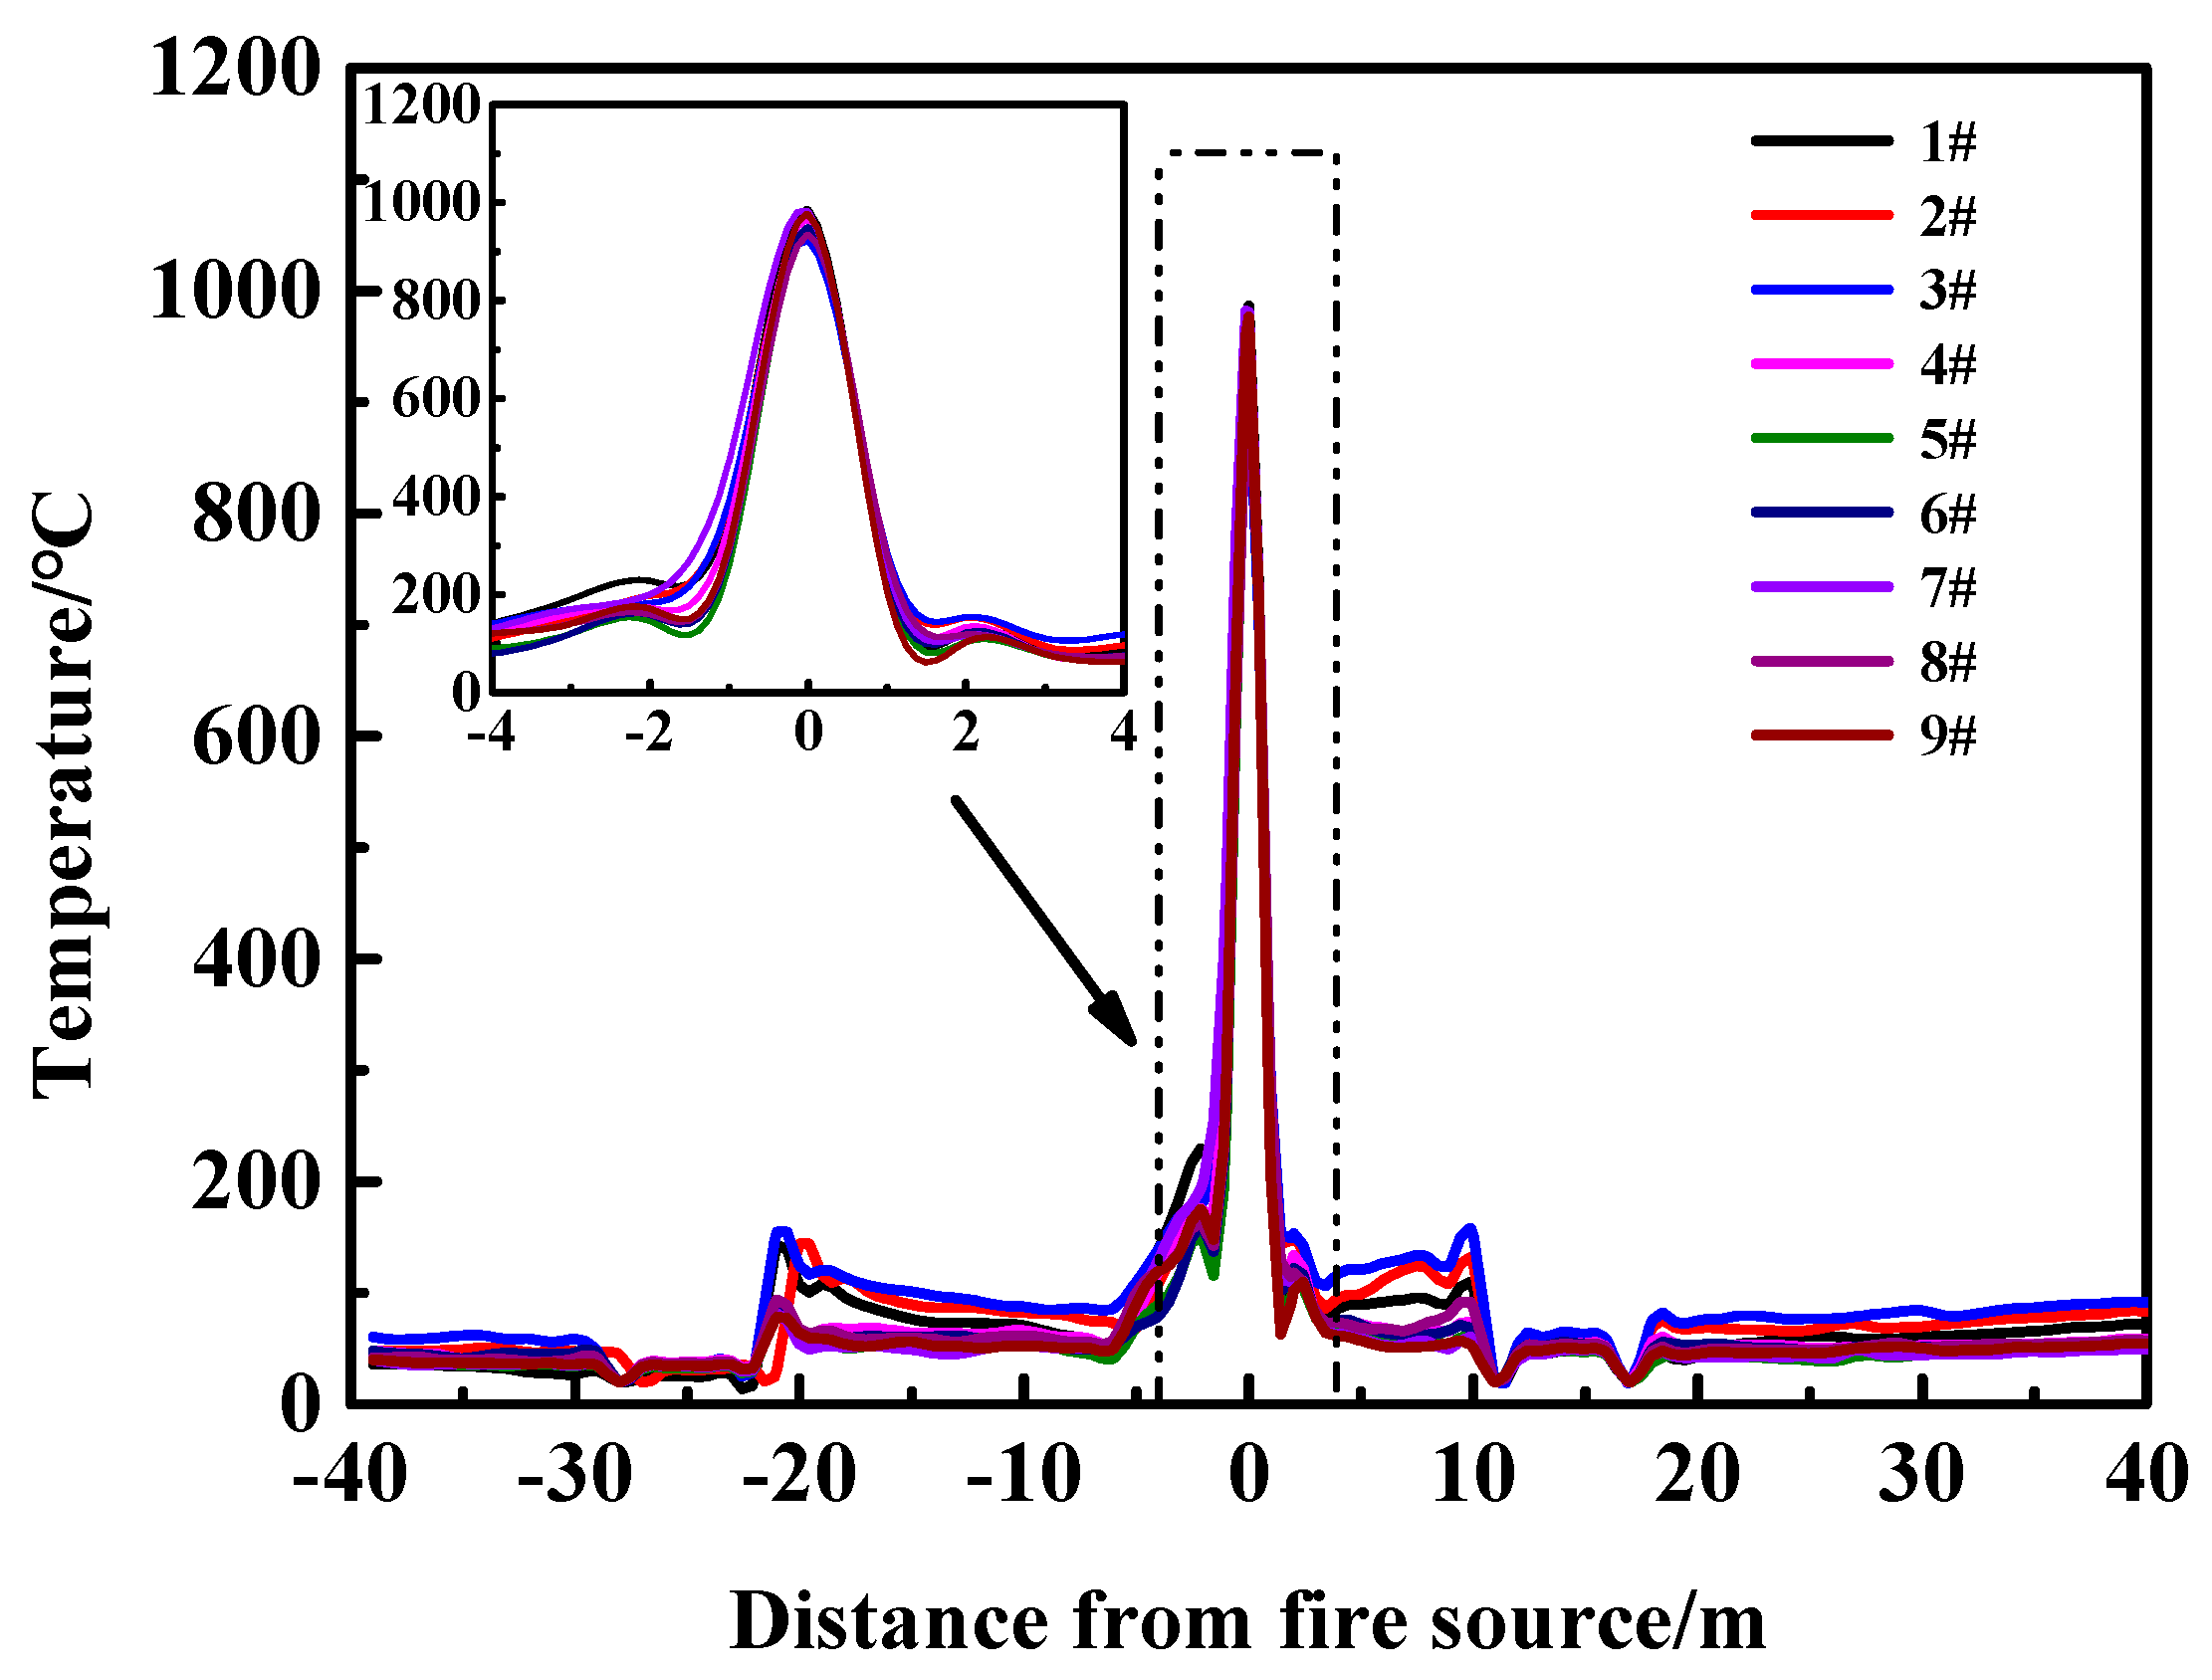
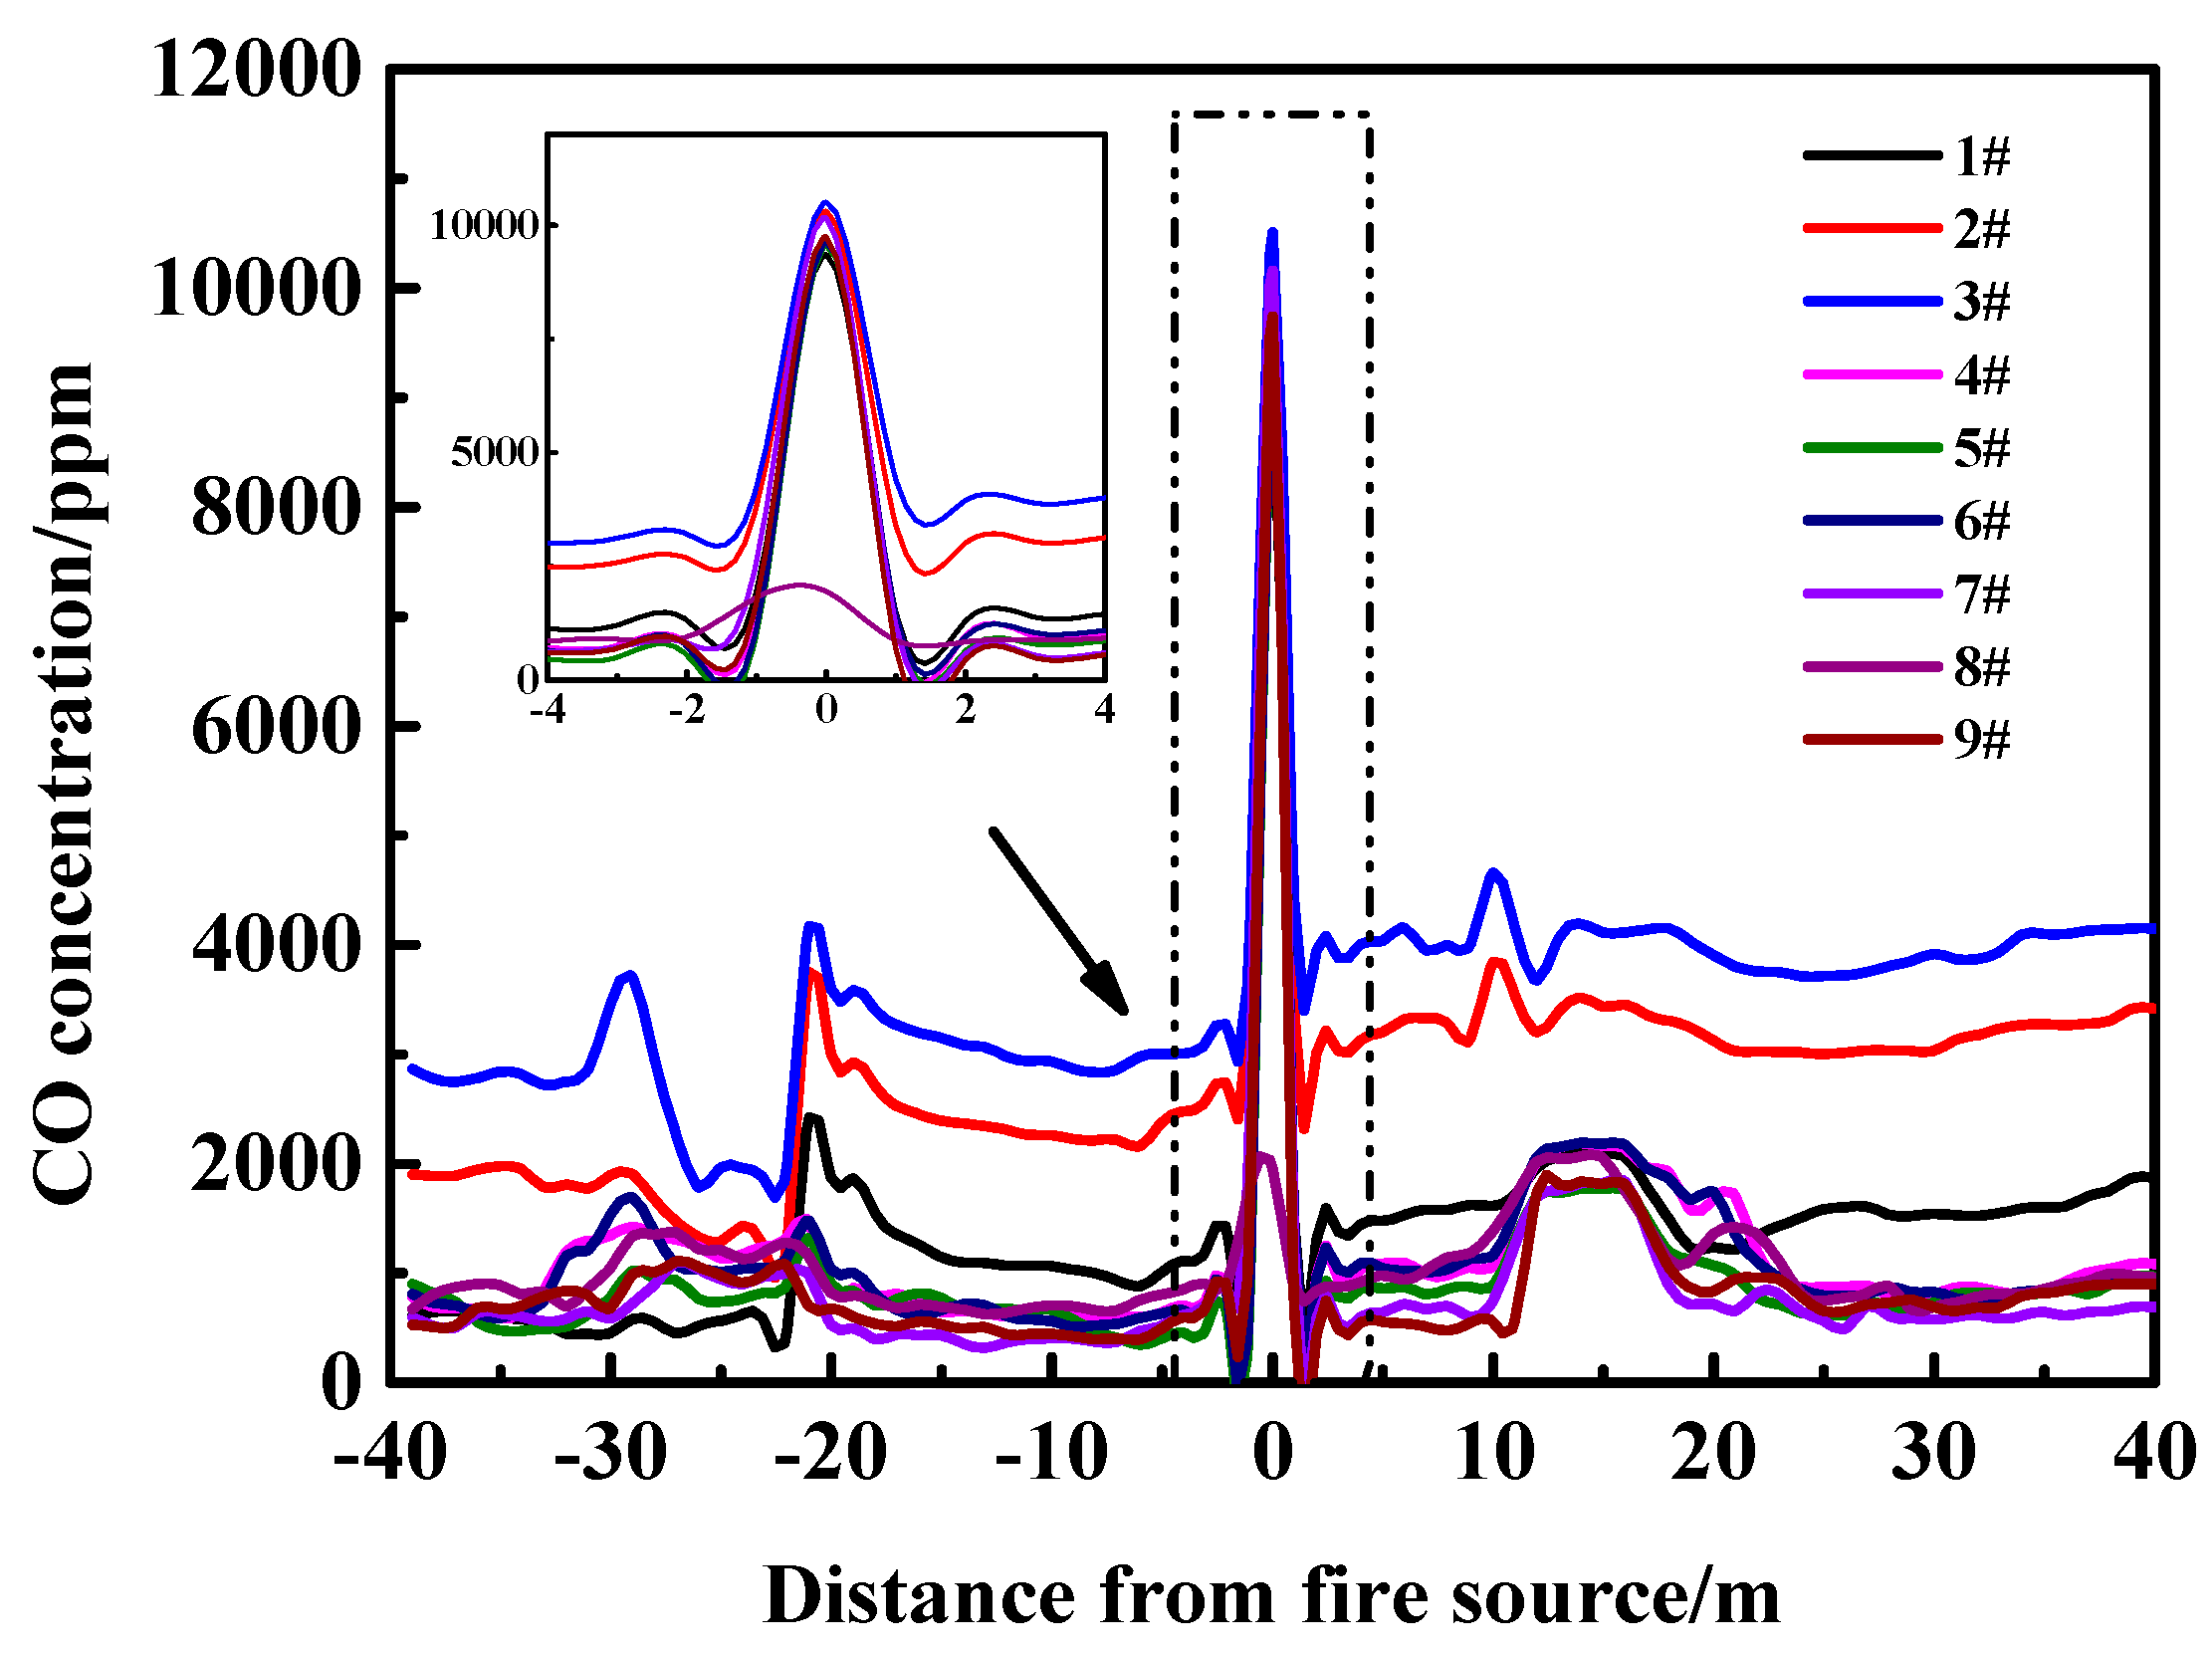
Figure 7 and Figure 8 present the relationship between temperature, CO concentration, and distance from the fire source under different working conditions when the fire reaches 360 s. It can be observed that the spatial trends of temperature and CO concentration are generally consistent. The temperature and CO concentration show significant decreases within a distance of 4 m from the fire source. The temperature sharply drops from a peak of 1000 °C to below 100 °C, while the CO concentration also drops from a peak of 10,000 ppm to approximately 3000 ppm. When the distance exceeds 4 m, the temperature and CO concentration decrease significantly and slow down. However, when the distance exceeds 25 m, the temperature and CO concentration tend to stabilize. Additionally, there is a sharp and sudden descent at a distance of 20 m on the left and 12 m on the right. This is due to the obstruction caused by the escalator during the horizontal movement of the fire smoke, resulting in a sharp change in temperature and CO concentration.
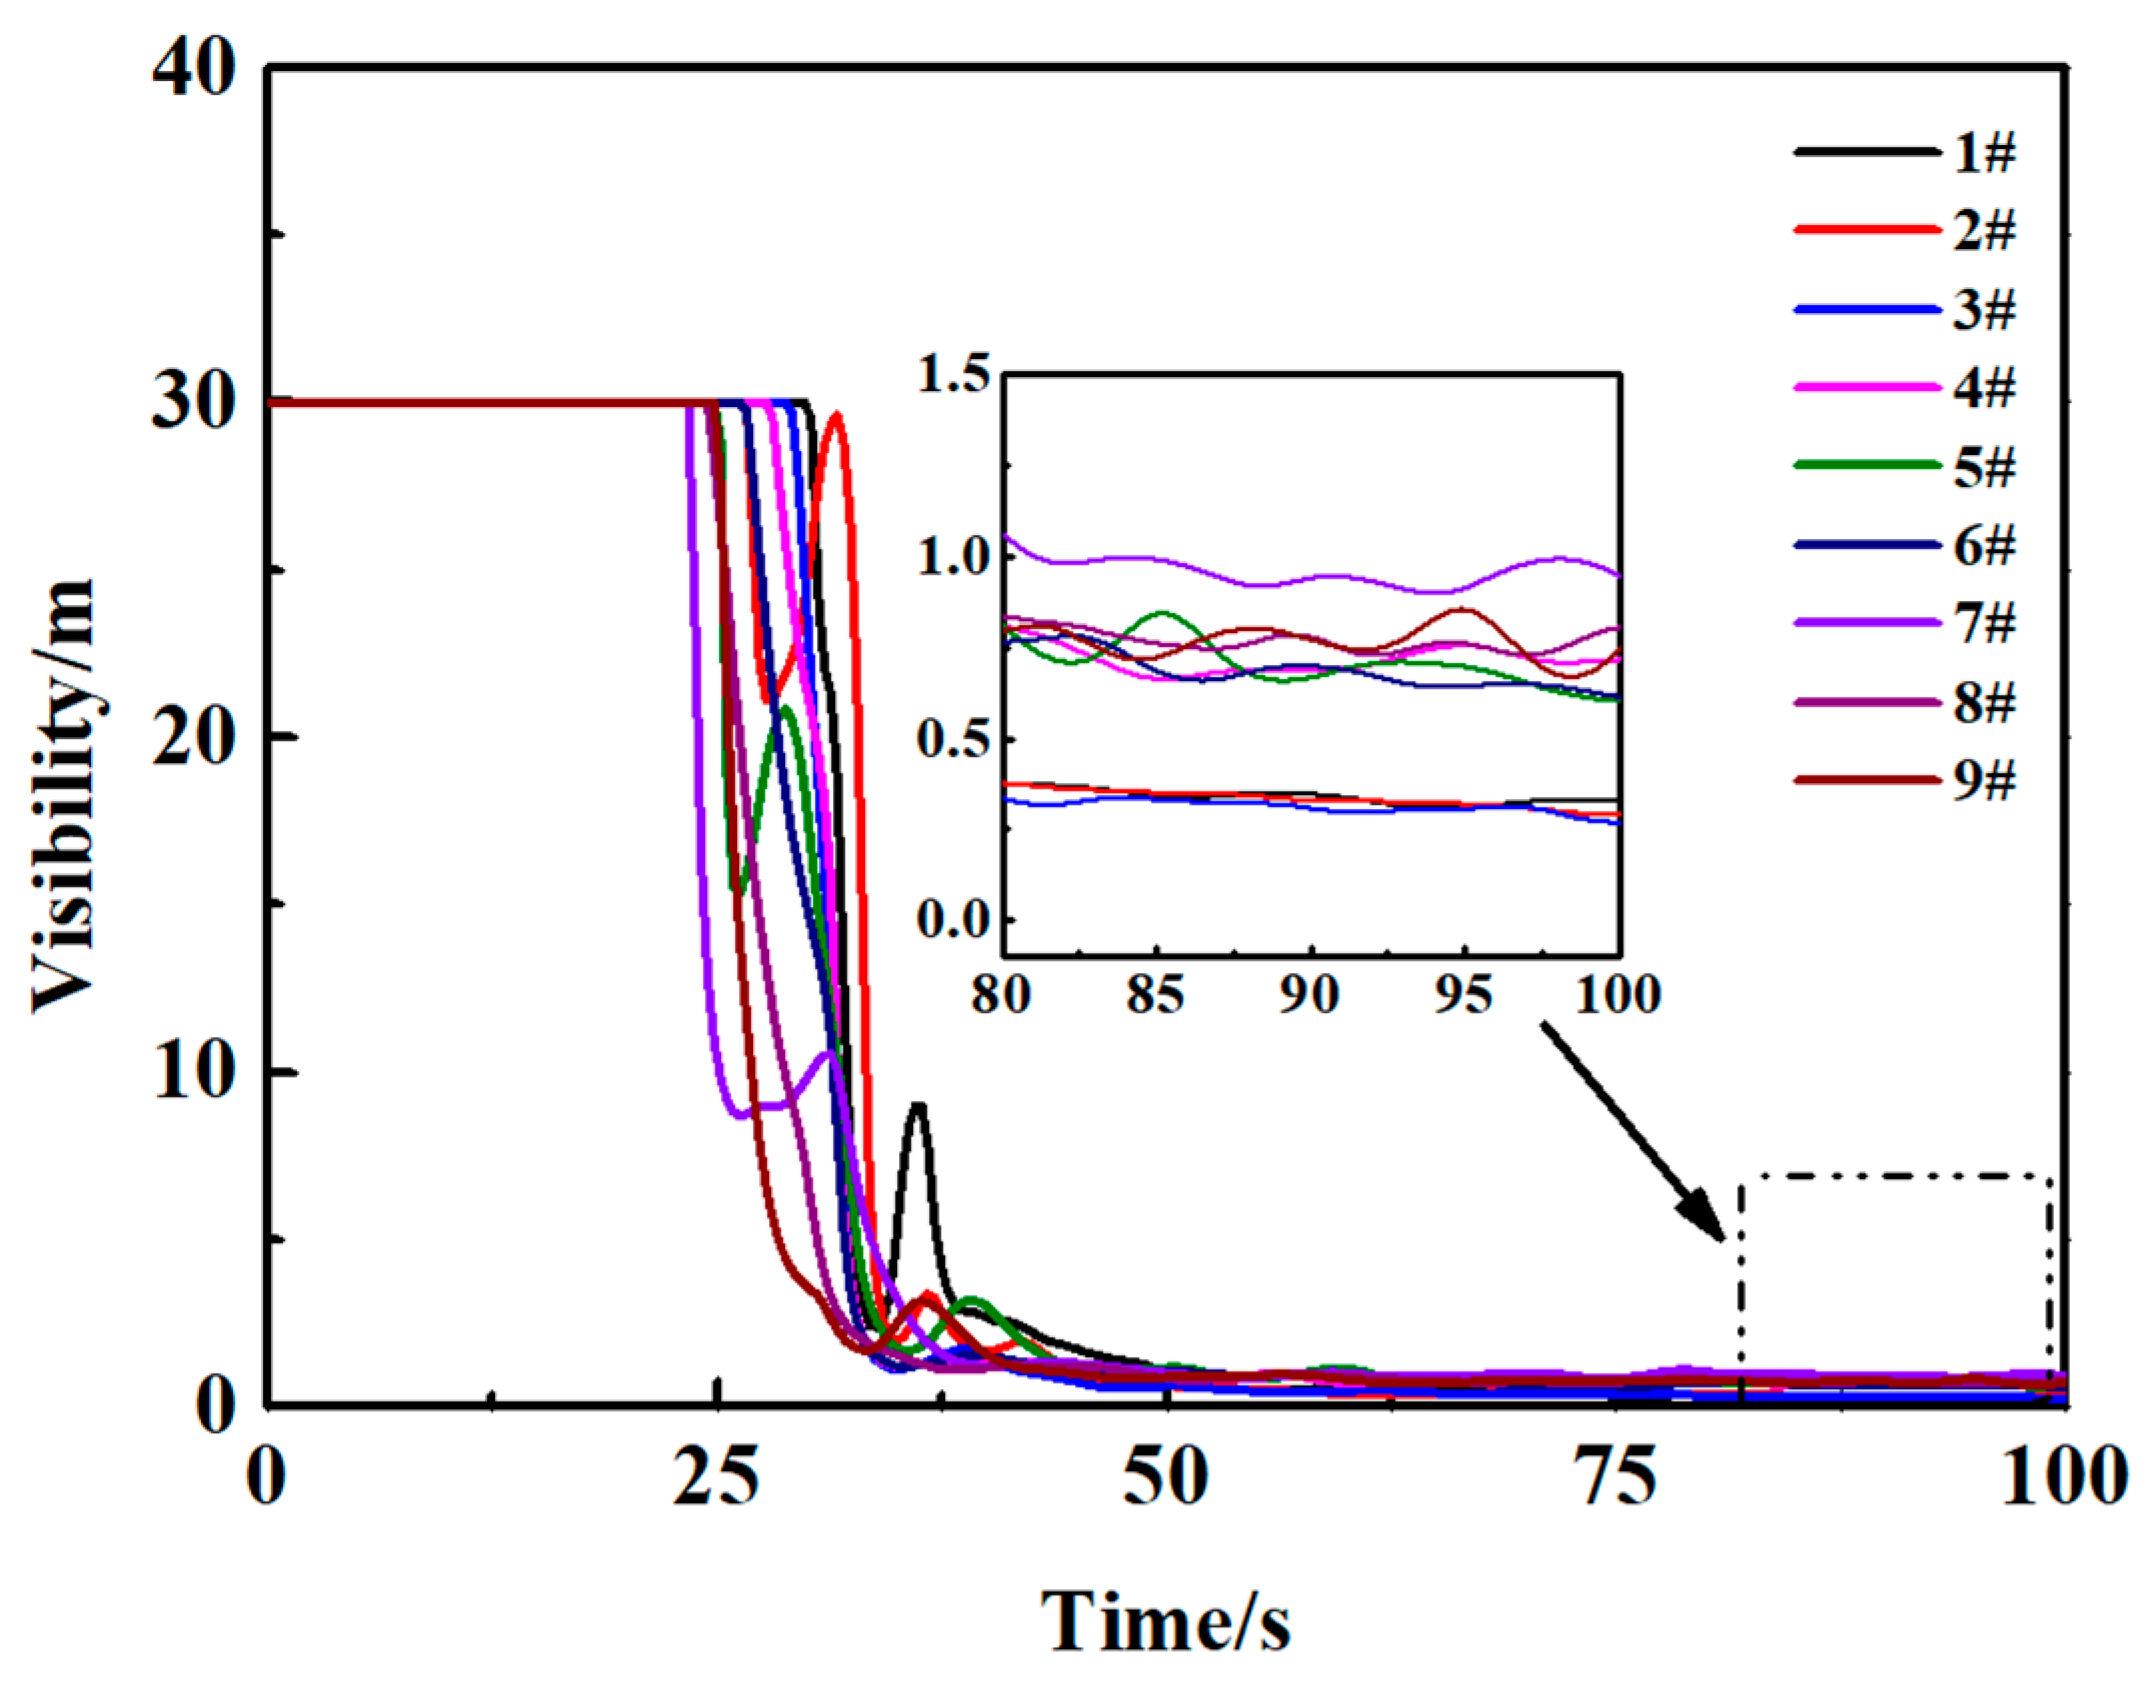
Figure 9 illustrates the visibility curve at monitoring point P (as presented in Figure 2) over time under different operating conditions. It can be seen that the visibility under different operating conditions may suddenly and sharply decline at a certain moment. This is because once a fire occurs, the hot smoke gases, driven by the action of the thermal buoyancy and the smoke control system, continuously spread and diffuse in all directions. After some time, they reached monitoring point P. At this moment, the hot smoke gases mix with the ambient cold air, causing downdraft motion and resulting in a sudden and significant change in visibility at that location. However, there are differences in the timing of the sudden decrease in visibility under different operating conditions, and these differences are related to the speed at which smoke gases migrate. The faster the movement of the smoke gases, the earlier the visibility decreases, and vice versa. In addition, when the fire develops for more than 50 s, the visibility is reduced to less than 5 m.

4.3. Sensitivity Analysis of Influencing Factors of Fire Smoke

Sensitivity is primarily used to assess the degree to which selected factors influence experimental results, and it is commonly evaluated using the range analysis. Table 5 presents the range analysis of the influence of different factors on the smoke temperature, CO concentration, and visibility of subway station fires. The results indicate that the optimal combination of different factors significantly improves the smoke exhaust efficiency.
Regarding smoke temperature, the sensitivity of the influencing factors is ranked as follows: the mode of opening the screen door, the wind speed of the smoke vents, the number of smoke vents opened, and the number of smoke barriers. The optimal operation mode of the smoke control system is A3B1C1D1, which results in a temperature value of 59.10 °C. This represents an improvement of approximately 20.8% compared to the average temperature of 74.68 °C under various conditions. For the CO concentration, the primary and secondary sequence of sensitivity for the influencing factors is the mode of opening the screen door, the wind speed of the smoke vents, the number of smoke vents opened, and the number of smoke barriers. The optimal operation mode of the smoke control system is A3B1C1D1, resulting in a CO concentration of 612.37 ppm. This represents an improvement of approximately 56.59% compared to the average CO concentration of 1410.6 ppm under various conditions. For visibility, the primary and secondary order of each influencing factor is the mode of opening the screen door, the wind speed of the smoke vents, the number of smoke vents opened, and the number of smoke barriers. The optimal operation mode of the smoke prevention and exhaust system is A3B1C1D1, and the visibility is 2.95 m, which is about 13.41% less than the average of 2.6 m in each working condition.

4.4. Significance Analysis of Influencing Factors of Fire Smoke

Unlike sensitivity, significance analysis is primarily used for statistical hypothesis testing to assess the important differences between hypotheses in sample data. Such an analysis typically relies on analysis of variance (ANOVA) or t-tests.
Table 6, Table 7 and Table 8 present the significance of different factors in relation to smoke temperature, CO concentration, and visibility, respectively. Regarding temperature, Table 6 shows that the mode of opening the screen door and the wind speed of the smoke vents have a highly significant impact on the temperature, and the number of smoke vents opened has a certain impact on the temperature, while the number of smoke barriers has no significant impact on the temperature. Concerning CO concentration, Table 7 reveals that the mode of opening the screen door and the wind speed of the smoke vents have a significant influence on the CO concentration, and the number of smoke vents opened has a certain impact on the CO concentration, while the number of smoke barriers has no significant influence on the CO concentration. Regarding visibility, Table 8 shows that the number of smoke vents opened, the number of smoke vents opened, and the wind speed of the smoke vents have a highly significant impact on visibility, while the number of smoke barriers has no significant impact on visibility.

5. Conclusions

This paper constructs a three-dimensional physical model of a subway station using BIM technology and FDS software. The orthogonal experimental method was employed to systematically discuss the effects of the mode of opening the screen door, the number of smoke vents opened, the number of smoke barriers, and the wind speed of the smoke vents on the fire smoke temperature, CO concentration, and visibility. The main conclusions of this paper are as follows:
(1) At the initial stage of the fire, the horizontal movement of smoke was influenced by obstacles such as smoke barriers and escalators. As the fire continued to develop, the temperature and CO concentration of the surrounding environment increased, and the impact of these obstacles gradually weakened. In the fire’s later stages, smoke filled the entire subway station.
(2) For the spatial distribution, the fire smoke’s temperature and CO concentration decreased as the distance from the fire source increased. The most significant decrease occurred nearly 2 m from the fire source. At this stage, the visibility of the surrounding environment was related to the speed of smoke movement. The faster the smoke moved, the earlier the environmental visibility decreased.
(3) Regarding sensitivity analysis, the range analysis method was used to determine the significant influence of the selected factors on the efficiency of smoke control and exhaust. For temperature, CO concentration, and visibility, the optimal combination of the smoke control system is A3B1C1D1. Compared to the average values, the temperature optimization combination improved the smoke extraction efficiency by 20.8%, increased the CO concentration by 56.59%, and improved the visibility by approximately 13.41%.
(4) In terms of significance, the analysis of variance (ANOVA) method was used to determine whether the mode of opening the screen door significantly impacted the smoke in subway station fires. Therefore, in the design of smoke control and exhaust systems, particular emphasis should be placed on optimizing the design of the opening mode of the shielding doors.
(5) When a fire occurs on the platform level, it is recommended first to activate the mechanical smoke exhaust system and open the screen door system in coordination to reduce the consistency of smoke flow with the direction of personnel evacuation. In addition, the opening and closing of platform screen doors significantly impacted the smoke control effect of subway stations.
In future, systematic research will be conducted on the relationship between the wind speed of the smoke vents, the opening size and position of the platform screen doors, and the location of the fire.

Author Contributions

Conceptualization, H.S. and Q.C.; Methodology, H.S., Q.C. and Z.W.; Software, H.S., Q.C. and Z.W.; Validation, H.S., H.Y. and Z.L.; Formal analysis, H.S., Z.L. and Z.B.; Investigation, H.S., Q.C. and J.L.; Resources, H.S. and Y.Y.; Writing—original draft, Q.C., J.L. and Y.Y.; Writing—review and editing, H.S. and Q.C.; Funding acquisition, H.S., Z.W. and H.Y. All authors have read and agreed to the published version of the manuscript.

Funding

This research was funded by the National Natural Science Foundation of China, grant number 52004255; the Henan Provincial Science and Technology Research Project, grant numbers 222102320347, 232102320046, 232102320235, 232102320232; the Henan Province Key R&D Special Project, grant number 231111322200.

Institutional Review Board Statement

Not applicable.

Informed Consent Statement

Not applicable.

Data Availability Statement

The data used to support the findings of this study are available from the corresponding author upon request.

Acknowledgments

The authors would like to express their gratitude to EditSprings (https://www.editsprings.cn, accessed on 19 November 2023) for the expert linguistic services provided.

Conflicts of Interest

The authors declare no conflict of interest.

References

  1. Chen, H.; Liu, J.; Guo, Z. Evolution History and Development Direction of Subway Design Concept in China. Railw. Stan. Design 2023, 67, 124–130. [Google Scholar] [CrossRef]
  2. Chen, J.; Long, Z.; Liu, C.; Cai, S.; Xu, B.; Cheng, H.; Zhong, M. Investigation of the Performance of Lateral Ventilation in Subway Station Fires. J. Wind. Eng. Ind. Aerodyn. 2022, 228, 105133. [Google Scholar] [CrossRef]
  3. Wu, J.; Hu, Z.; Chen, J.; Li, Z. Risk Assessment of Underground Subway Stations to Fire Disasters Using Bayesian Network. Sustainability 2018, 10, 3810. [Google Scholar] [CrossRef]
  4. Zhang, L.; Wu, X.; Liu, M.; Liu, W.; Ashuri, B. Discovering Worst Fire Scenarios in Subway Stations: A Simulation Approach. Automat. Constr. 2019, 99, 183–196. [Google Scholar] [CrossRef]
  5. Wang, K.; Cai, W.; Zhang, Y.; Hao, H.; Wang, Z. Numerical Simulation of Fire Smoke Control Methods in Subway Stations and Collaborative Control System for Emergency Rescue. Process Safety Environ. 2021, 147, 146–161. [Google Scholar] [CrossRef]
  6. Xing, Z.; Zhang, Y.; Qian, H.; Zhang, S.; Wang, L.; Gu, H. New Ideas to Develop the Simulating Technology of Fire and Personnel Evacuation in Subway Station. Safety Environ. Eng. 2018, 25, 130–135. [Google Scholar] [CrossRef]
  7. Zhong, M.; Liu, C.; Shi, C. Progress of Full-scale Experimental Study on Metro Fire. J. China Safety Sci. 2019, 29, 51–63. [Google Scholar] [CrossRef]
  8. Tian, X.; Zhong, M.; Chen, J.; Liu, C.; Qiu, P. Full-scale Experimental Study on Cross Transfer Metro Station: I. Station Hall Fire. J. Safety Sci. Technol. 2019, 15, 11–18. [Google Scholar]
  9. Pan, L.; Lo, S.M.; Liao, G.; Cong, B. Experimental Study of Smoke Control in Subway Station for Tunnel Area Fire by Water Mist System. Proce. Eng. 2011, 11, 335–342. [Google Scholar] [CrossRef]
  10. Shi, C.; Zhong, M.; He, L.; Shi, J.; Feng, G.; Wang, L. Investigation of Full-scale Fire Experiments in Metro Station and Tunnel (1)—Experimental Setup. J. Safety Sci. Technol. 2012, 8, 22–28. [Google Scholar]
  11. Shi, C.; Zhong, M.; Wang, L.; He, L.; Shi, J.; Xu, X. Investigation of Full-scale Burning Experiments in Metro Station and Tunnel (2)—Interval Tunnel Fires. J. Safety Sci. Technol. 2012, 8, 28–34. [Google Scholar] [CrossRef]
  12. Shi, C.; Zhong, M.; Wang, L.; He, L.; Shi, J.; Xu, X. Investigation of Full-scale Burning Experiments in Metro Station and Tunnel (3)—Station Tunnel Fires. J. Safety Sci. Technol. 2013, 9, 26–33. [Google Scholar] [CrossRef]
  13. Gao, Z.; Ji, J.; Fan, C.; Li, L.; Sun, J. Determination of Smoke Layer Interface Height of Medium Scale Tunnel Fire Scenarios. Tunn. Undergr. Space Technol. 2016, 56, 118–124. [Google Scholar] [CrossRef]
  14. Mei, F.; Tang, F.; Ling, X.; Yu, J. Evolution Characteristics of Fire Smoke Layer Thickness in a Mechanical Ventilation Tunnel with Multiple Point Extraction. Appl. Therm. Eng. 2017, 111, 248–256. [Google Scholar] [CrossRef]
  15. Luo, N.; Li, A.; Gao, R.; Song, T.; Zhang, W.; Hu, Z. Performance of Smoke Elimination and Confinement with Modified Hybrid Ventilation for Subway Station. Tunn. Undergr. Space Technol. 2014, 43, 140–147. [Google Scholar] [CrossRef]
  16. Meng, N.; Wang, Q.; Liu, Z.; Li, X.; Yang, H. Smoke Flow Temperature Beneath Tunnel Ceiling for Train Fire at Subway Station: Reduced-Scale Experiments and Correlations. Appl. Therm. Eng. 2017, 115, 995–1003. [Google Scholar] [CrossRef]
  17. Long, Z.; Zhong, M.; Chen, J.; Cheng, H. Study on Emergency Ventilation Strategies for Various Fire Scenarios in a Double-island Subway Station. J. Wind Eng. Ind. Aerod. 2023, 235, 105364. [Google Scholar] [CrossRef]
  18. Liu, C.; Zhong, M.; Tian, X.; Mei, Q.; Xiao, Y. Model Experimental Study on Fire in Metro Multi-line Transfer Station: (1) Design of Model Device. J. Safety Sci. Technol. 2020, 16, 775–777. [Google Scholar] [CrossRef]
  19. Chen, J.; Zhong, M.; Cheng, H.; Long, Z.; Yang, Y. Model Experimental Study on Fire in Metro Multi-line Transfer Station: (2) Fire in Cross-Transfer Station. J. Safety Sci. Technol. 2020, 16, 5–11. [Google Scholar] [CrossRef]
  20. Long, Z.; Zhong, M.; Yang, Y.; Chen, J.; Cheng, H.; Tian, X. Model Experimental Study on Fire in Metro Multi-line Transfer Station: (3) Fire in Parallel Transfer Station. J. Safety Sci. Technol. 2020, 16, 12–19. [Google Scholar] [CrossRef]
  21. Drysdale, D.D.; Macmillan, A.J.R.; Shilitto, D. The King’s Cross fire: Experimental Verification of the ‘Trench effect’. Fire Safety J. 1992, 18, 75–82. [Google Scholar] [CrossRef]
  22. Tavakolian, Z.; Abouali, O.; Yaghoubi, M. 3D Simulations of Smoke Exhaust System in Two Types of Subway Station Platforms. Int. J. Vent. 2021, 20, 65–81. [Google Scholar] [CrossRef]
  23. Liu, Y.; Li, Y.Z.; Ingason, H.; Liu, F. Control of Thermal-driven Smoke Flow at Stairways in a Subway Platform Fire. Int. J. Therm. Sci. 2021, 165, 106937. [Google Scholar] [CrossRef]
  24. Meng, N.; Hu, L.; Wu, L.; Yang, L.; Zhu, S.; Chen, L.; Tang, W. Numerical Study on the Optimization of Smoke Ventilation Mode at the Conjunction Area Between Tunnel Track and Platform in Emergency of a Train Fire at Subway Station. Tunn. Undergr. Sp. Technol. 2014, 40, 151–159. [Google Scholar] [CrossRef]
  25. Zheng, F.; Xiao, J.; Hu, N.; Wang, Y. Simulation Study on Fire Smoke Spread of an Stacked-isl and Type Subway Station. J. Lanzhou Inst. Technol. 2021, 28, 43–48. [Google Scholar] [CrossRef]
  26. Zhang, W.; Liu, G.; Ren, F.; Li, J. Study on Fire Smoke Spread in Deep Buried Subway Station (1): Influence of Mechanical Air Supplement at Entrance and Exit. J. Safety Sci. Technol. 2021, 17, 12–17. [Google Scholar]
  27. Li, L.; Ren, F.; Luo, H.; Li, J. Study on Fire Smoke Movement in Deep Buried Subway Station (2): Influence of Air Leakage from Platform Door. J. Safety Sci. Technol. 2021, 17, 18–22. [Google Scholar]
  28. Meng, H.; Zhao, L.; Deng, B.; Shu, X. Numerical Analysis on the Effect of Smoke Exhaust Baffle on Lateral Mechanical Smoke Exhaust System of Planform Fire. Build. Energy Environ. Div. 2022, 41, 88–92. [Google Scholar]
  29. Tsukahara, M.; Koshiba, Y.; Ohtani, H. Effectiveness of Downward Evacuation in a Large-scale Subway Fire Using Fire Dynamics Simulator. Tunn. Undergr. Space Technol. 2011, 26, 573–581. [Google Scholar] [CrossRef]
  30. Wu, W.; You, S. Wave Motion of Smoke in Subway Fire Environment. Trans. Tianjin Univ. 2009, 15, 206–209. [Google Scholar] [CrossRef]
  31. McGrattan, K.; McDermott, R.; Hostikka, S. Fire Dynamics Simulator (Version 5) User’s Guide. Natl. Inst. Stand. Technol. 2007, 29–30. [Google Scholar] [CrossRef]
  32. Hu, L.; Wu, L.; Lu, K.; Zhang, X.; Liu, S.; Qiu, Z. Optimization of Emergency Ventilation Mode for a Train on Fire Stopping Beside Platform of a Metro Station. Build Simul. China 2014, 7, 137–146. [Google Scholar] [CrossRef]
  33. Chen, Z.; Liu, Z.; Huang, L.; Niu, G.; Yan, J.; Wang, J. Research on the Effect of Ceiling Centralized Smoke Exhaust System with Air Curtains on Heat Confinement and Plug-holing Phenomenon in Tunnel Fires. Process Safety Environ. 2023, 169, 646–659. [Google Scholar] [CrossRef]
  34. Gao, R.; Li, A.; Zhang, Y.; Luo, N. How Domes Improve Fire Safety in Subway Stations. Safety Sci. 2015, 80, 94–104. [Google Scholar] [CrossRef]
  35. Zhang, N.; Liang, Y.; Zhou, C.; Niu, M.; Wan, F. Study on Fire Smoke Distribution and Safety Evacuation of Subway Station Based on BIM. Appl. Sci. 2022, 12, 12808. [Google Scholar] [CrossRef]
  36. Jin, L. Orthogonal Design and Multi-Index Analysis; China Railway Publishing House: Beijing, China, 1988; pp. 1–40. [Google Scholar]
  37. Chen, S.; Guan, X.; Wu, Z. Optimization Analysis of Express Package Recycling Based on Orthogonal Experiment. Pick. Eng. 2022, 43, 279–285. [Google Scholar] [CrossRef]
  38. Zhong, W.; Tu, R.; Yang, J.; Liang, T. Numerical Simulation on the Characteristics of Smoke Flow under Piston Wind in Subway Station Hall Fire. China Railw. Sci. 2013, 34, 118–124. [Google Scholar] [CrossRef]
  39. Ji, J. Studies on Smoke Movement and Ventilation Control Mode in Subway Station Fire. Ph.D. Thesis, University of Science and Technology of China, Hefei, China, 2008. [Google Scholar]
  40. Fan, H.; Yin, Z.; Zhang, D.; Li, Y. Analysis of Subway Station Smoke Screen Effect on Fire Smoke Movement. J. Disaster Prev. Mitig. 2011, 31, 80–84. [Google Scholar] [CrossRef]
  41. Luo, N.; Gao, L.; Liu, X. Smoke Control by Hung Wall and Hybrid Ventilation for Subway Station. Fire Sci. Technol. 2019, 38, 1084–1086. [Google Scholar]
  42. Zhong, W.; Ji, J.; Yang, J.; Huo, R.; Wang, H. Experimental and Simulation Study on the Influence of Smoke Vent Arrangement on Smoke Control Effect in Subway Station. J. Eng. Mech. 2010, 27, 163–168. [Google Scholar]
  43. GB51298-2013; Standard for Fire Protection Design of Metro. Beijing Planning Press: Beijing, China, 2013.
  44. Yang, Z.; Deng, L.; Kong, L. Research on Fire Simulation and Safety Evacuation of a Subway Station Based on BIM. J. Guangxi Univ. Sci. Technol. 2022, 33, 23–30. [Google Scholar] [CrossRef]
  45. Ding, H.; Zhu, Q.; Guo, S.; Hu, Y. Numerical Simulation of the Influence of Fire Smoke Flow Characteristics on Personnel Evacuation in Subway Interval Tunnel. Safety Environ. Eng. 2019, 26, 162–168. [Google Scholar] [CrossRef]
Figure 1. Fire simulation process based on BIM and FDS.
Fire 06 00448 g001
Figure 2. Physical model of the subway station (a) Top view, (b) Front view.
Fire 06 00448 g002
Figure 3. Grid sensitivity analysis.
Fire 06 00448 g003
Figure 4. Temperature field distributions of the subway station platform for the 5# test.
Fire 06 00448 g004
Figure 5. CO concentration distributions of the subway station platform for the 5# test.
Fire 06 00448 g005
Figure 6. Plot of visibility change with time in working condition 5#.
Fire 06 00448 g006
Figure 7. Relationship between temperature and distance from the fire source.
Fire 06 00448 g007
Figure 8. Relationship between CO concentration and distance from the fire source.
Fire 06 00448 g008
Figure 9. Visibility over time under different working conditions.
Fire 06 00448 g009
Table 1. Composition of various elements in polyurethane combustion products.
Type of ElementCHON
Component coefficient6.37.12.11.0
Table 2. Experimental factor levels.
Factor LevelsABCD
The Number of Smoke Vents OpenedThe Number of Smoke Vents Opened (Group)The Number of Smoke Barriers (Number)The Wind Speed of the Smoke Vents (m/s)
1Not open6010
2Semi-open415
3Fully open221
Table 3. Operating conditions.
NumbersTest Schemes
ABCD
1#1111
2#1222
3#1333
4#2123
5#2231
6#2312
7#3132
8#3213
9#3321
Table 4. Critical conditions of subway fire hazard [44].
CategoriesCritical Value
Human eye characteristic height (m)1.6
Temperature (°C)60
Concentration of CO (ppm)500
Visibility (m)10
Table 5. Sensitivity level per factor.
Test SchemesABCDXYZ
Temperature (°C)Co Concentration (ppm)Visibility (m)
1#111177.771182.762.60
2#122288.672590.232.41
3#133396.983297.522.38
4#212372.861083.342.61
5#223163.79890.822.67
6#231269.451059.422.62
7#313266.94807.052.76
8#321370.45944.722.64
9#332165.18839.532.72
Ri20.284.683.3511.18///
Sequence (i) *ADBC///
Optimum assembly (i) *A3B1C1D159.10612.372.95
Rj1493.07707.77602.83804.16///
Sequence (j) *ADBC///
Optimum assembly (j) *A3B1C1D159.10612.372.95
Rk0.2440.0840.0420.122///
Sequence (k) *ADBC///
Optimum assembly (k) *A3B1C1D159.10612.372.95
* i represents smoke temperature, j represents CO concentration, and k represents visibility.
Table 6. Variance analysis for smoke temperature.
Source of ErrorDeviation Sum of SquaresDegree of FreedomMean SquareF ValueSignificance Level
A777.482388.74 114.28***
B33.49216.75 4.92*
C20.41210.21 3.00
D187.99294.00 27.63***
Error20.416///
Summation1019.36////
“—” indicates no significant effect; “*” indicates a certain impact; “***” indicates a highly significant effect. The F distribution is F0.10 (2,6) = 3.46, F0.05 (2,6) = 5.14, and F0.01 (2,6) = 10.92.
Table 7. Variance analysis for CO concentration.
Source of ErrorDeviation Sum of SquaresDegree of FreedomMean SquareF ValueSignificance Level
A4,061,755.93 22,030,877.97 20.84***
B770,227.70 2385,113.85 3.95*
C584,674.35 2292,337.18 3.00
D995,299.33 2497,649.67 5.10***
Error584,674.35 6///
Summation6,411,957.31////
“—” indicates no significant effect; “*” indicates a certain impact; “***” indicates a highly significant effect. The F distribution is F0.10 (2,6) = 3.46, F0.05 (2,6) = 5.14, and F0.01 (2,6) = 10.92.
Table 8. Variance analysis for visibility.
Source of ErrorDeviation Sum of SquaresDegree of FreedomMean SquareF ValueSignificance Level
A0.09420.04794.0***
B0.01420.00714.0***
C0.00320.00153.0
D0.02220.01122.0***
Error0.0036///
Summation0.132////
“—” indicates no significant effect; “***” indicates a highly significant effect. The F distribution is F0.10 (2,6) = 3.46, F0.05 (2,6) = 5.14, and F0.01 (2,6) = 10.92.
Disclaimer/Publisher’s Note: The statements, opinions and data contained in all publications are solely those of the individual author(s) and contributor(s) and not of MDPI and/or the editor(s). MDPI and/or the editor(s) disclaim responsibility for any injury to people or property resulting from any ideas, methods, instructions or products referred to in the content.

