


An FDS Simulation to Predict the Kerosene Pool Fire Results at Rocket Launchpad Basement Facilities in the Republic of Korea

 ,
,
Abstract
:1. Introduction
- (1)
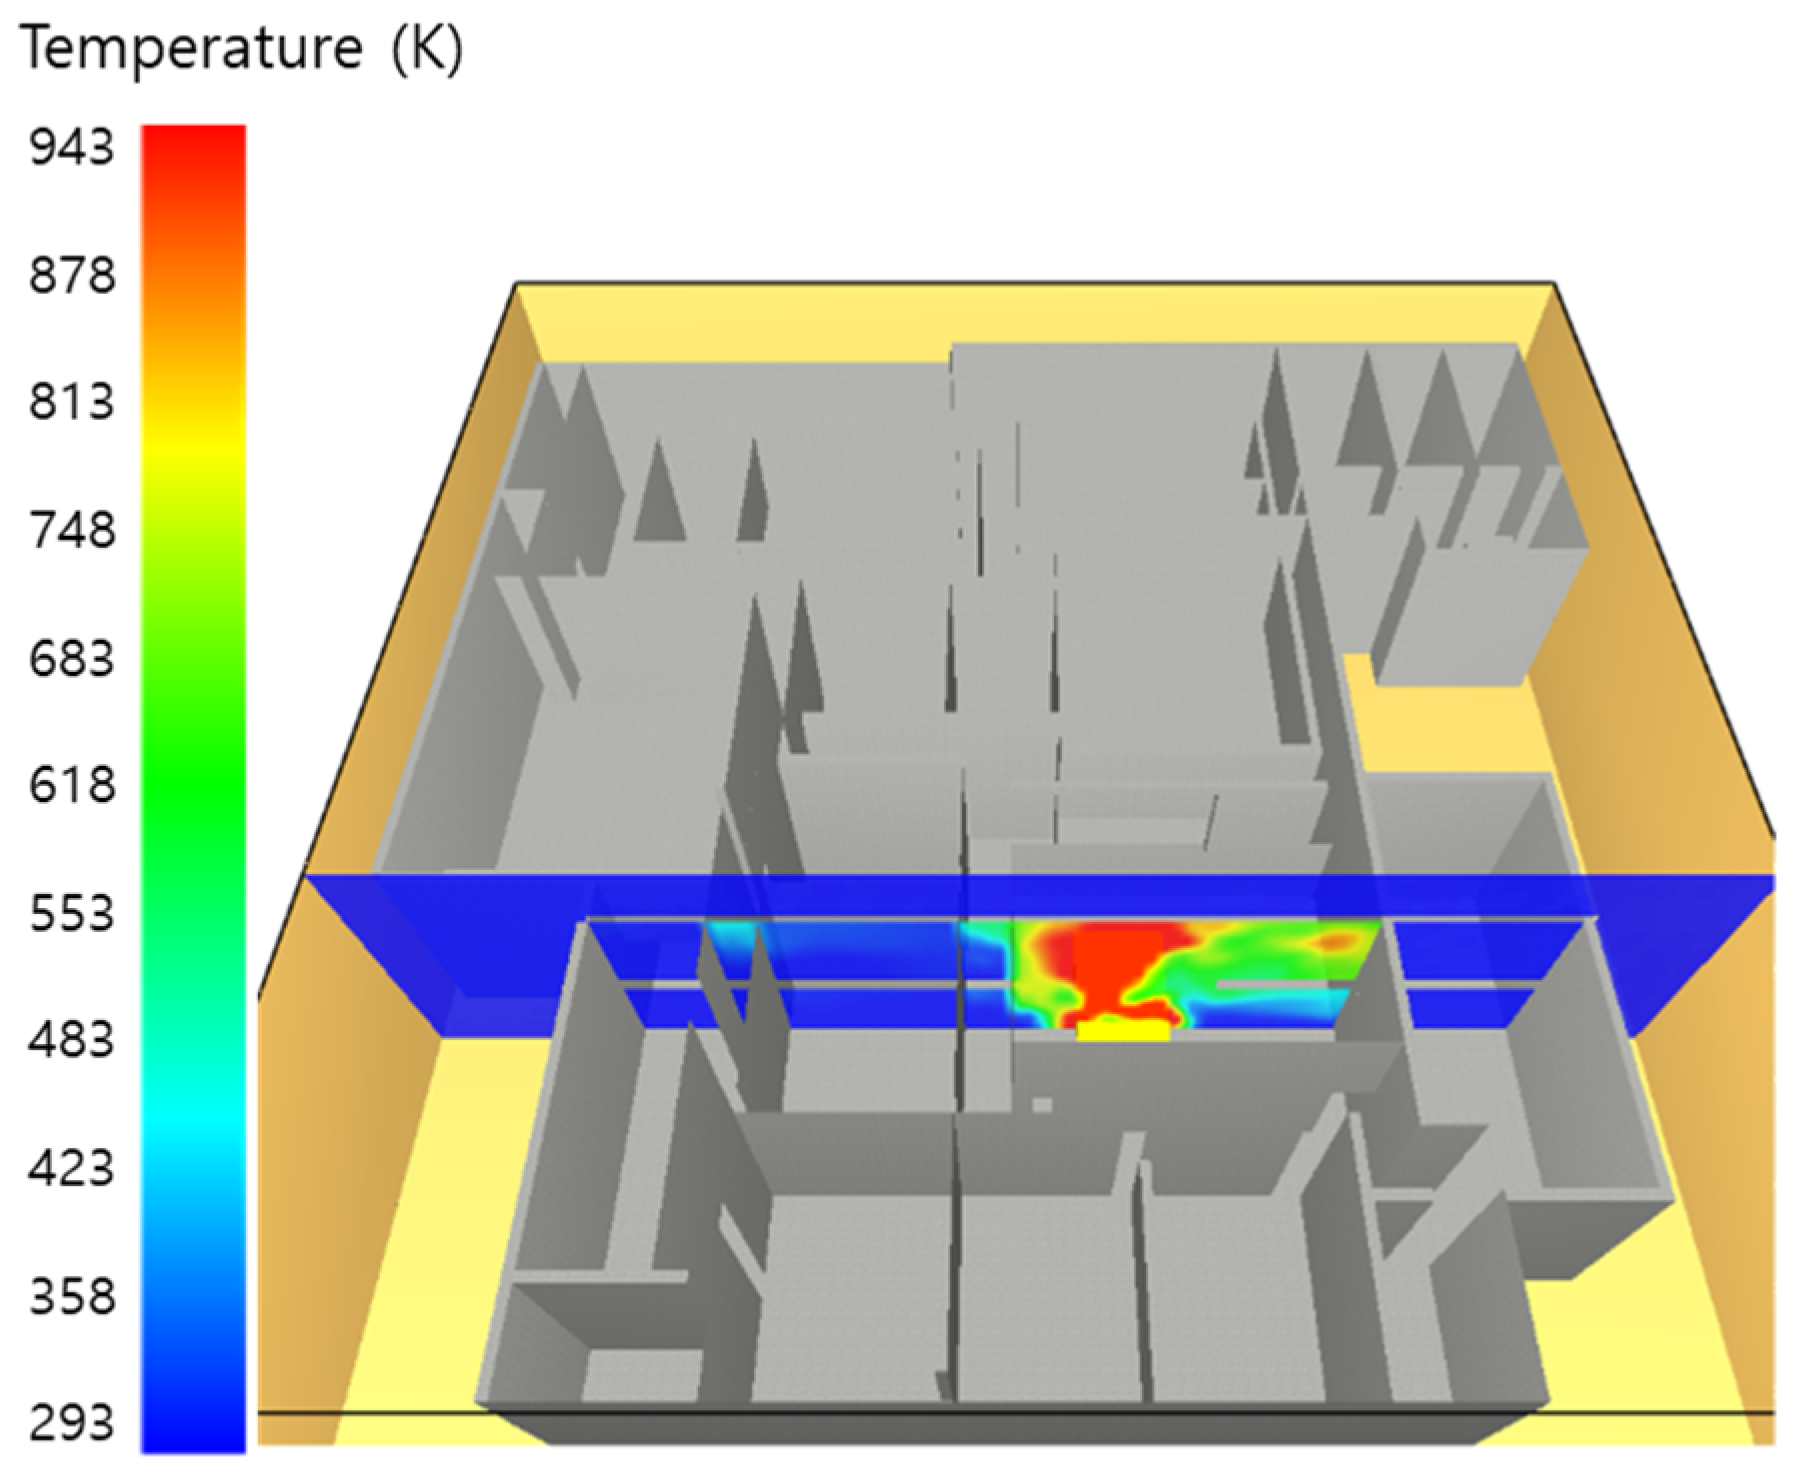
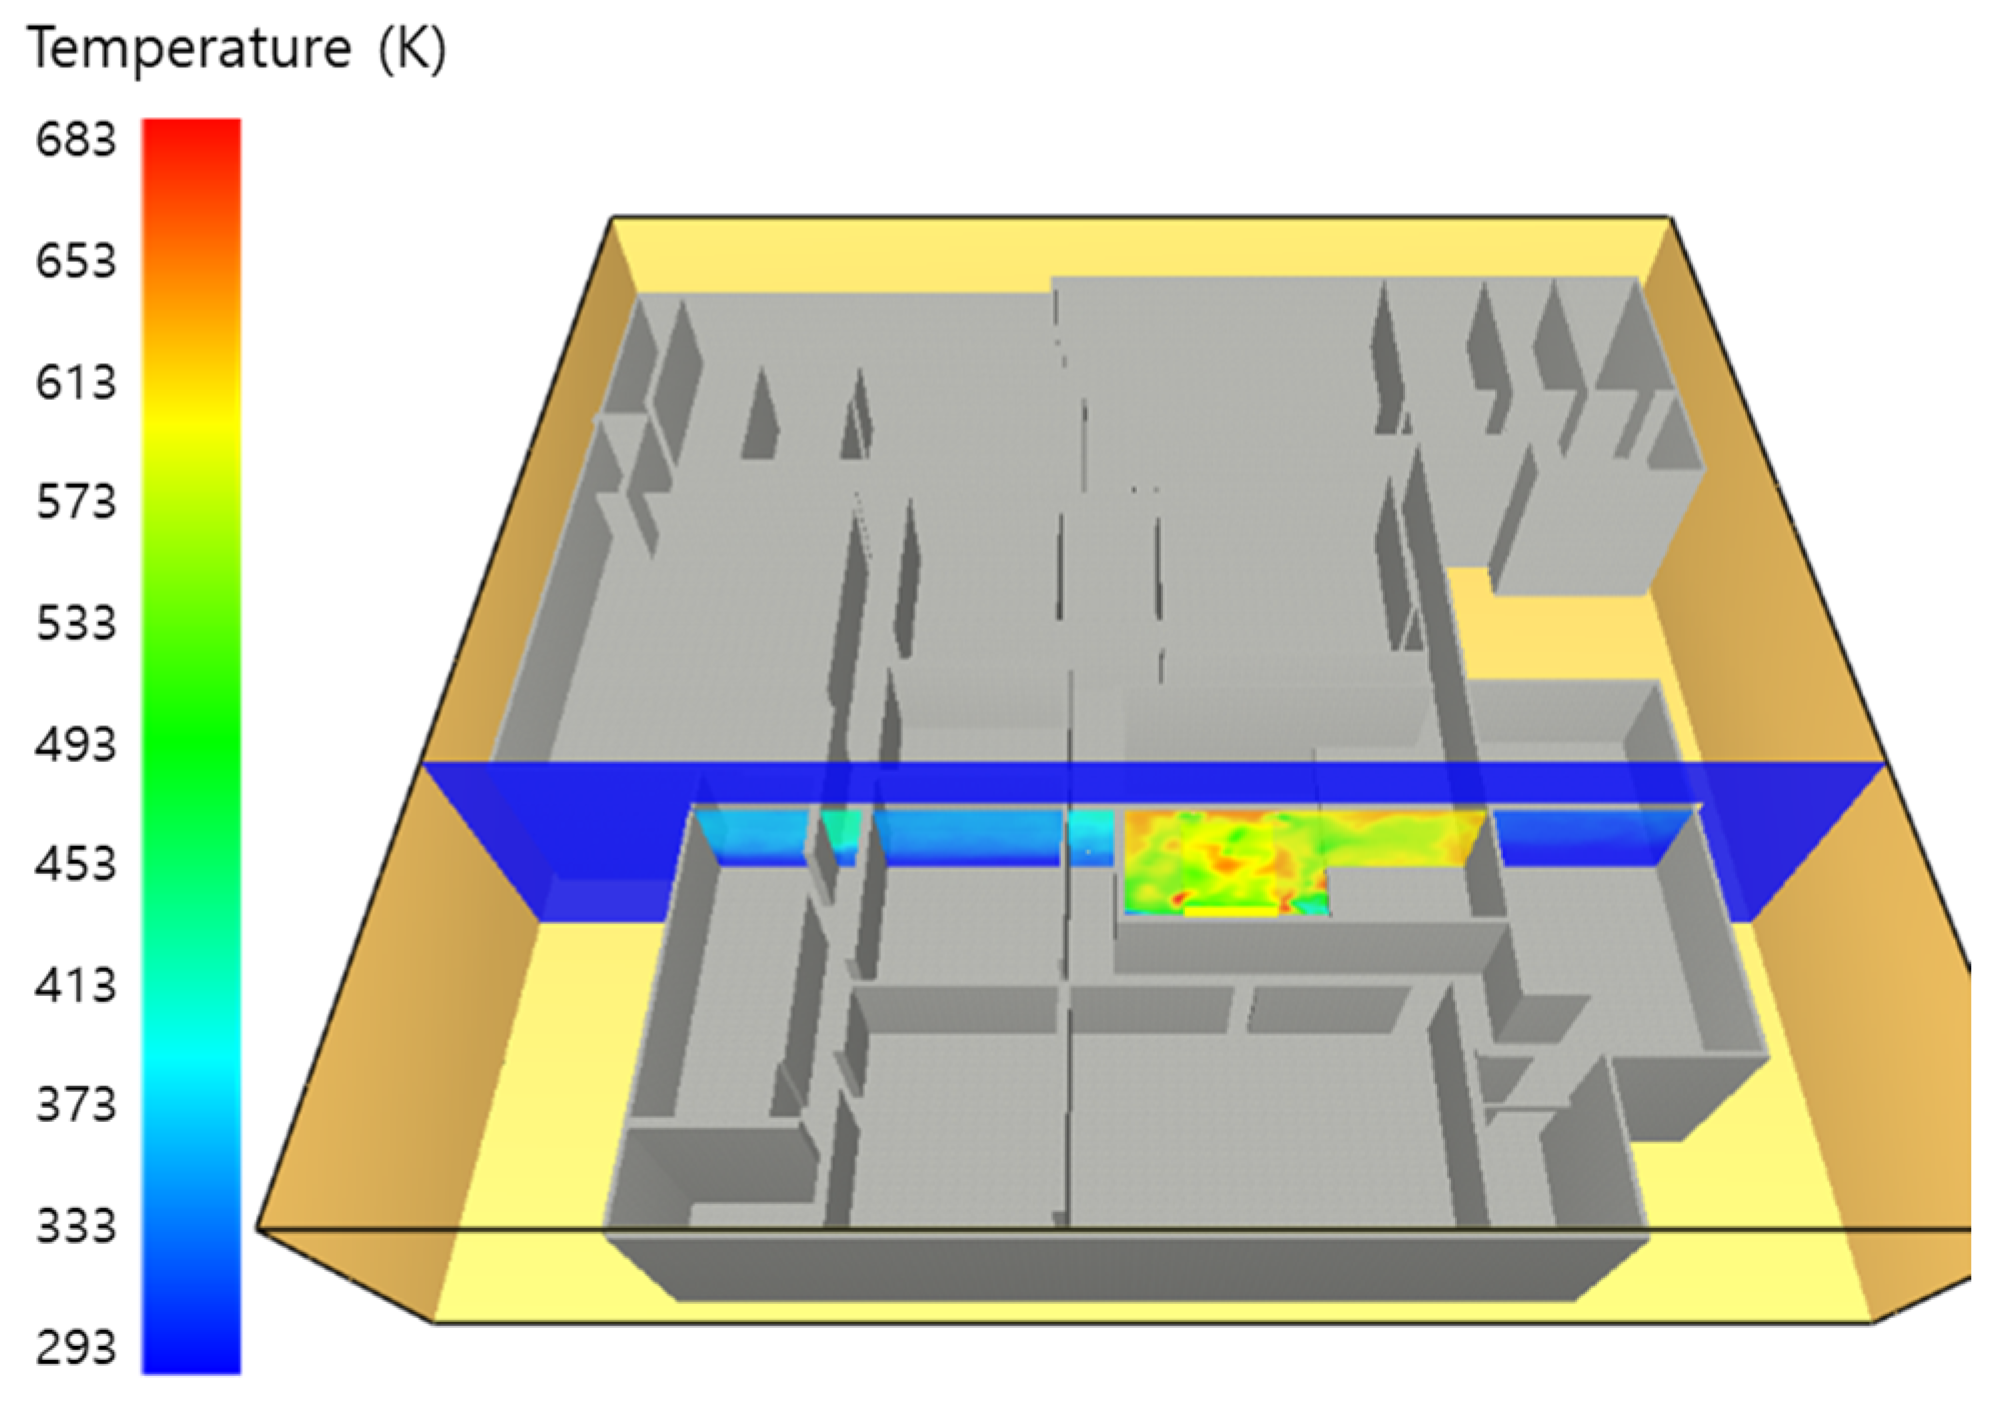
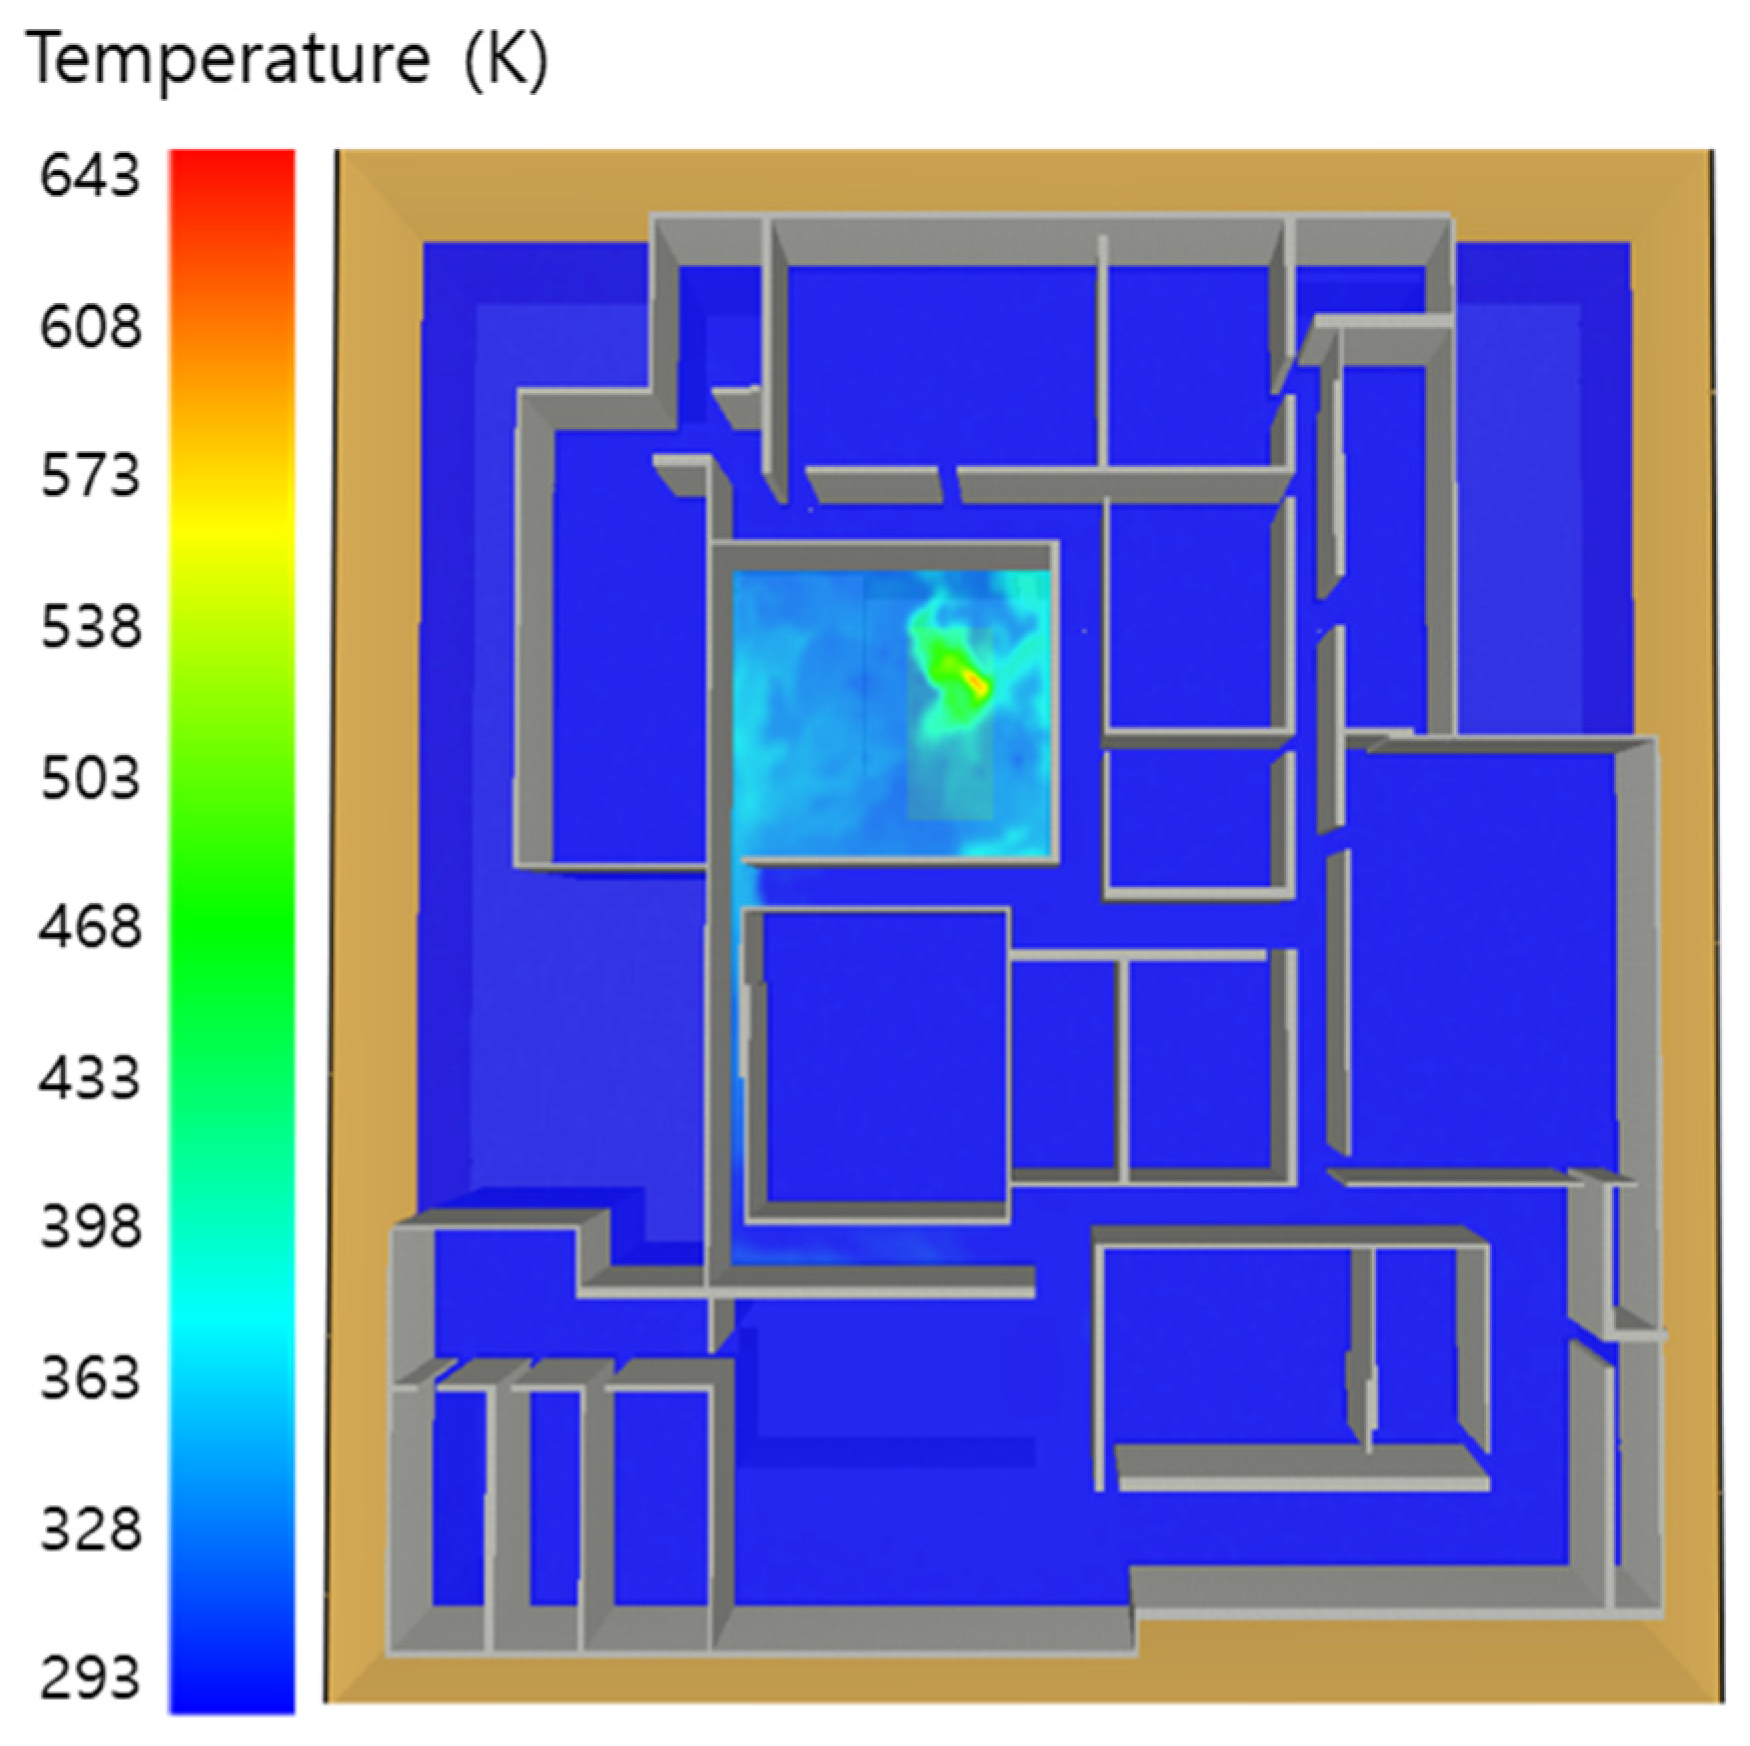
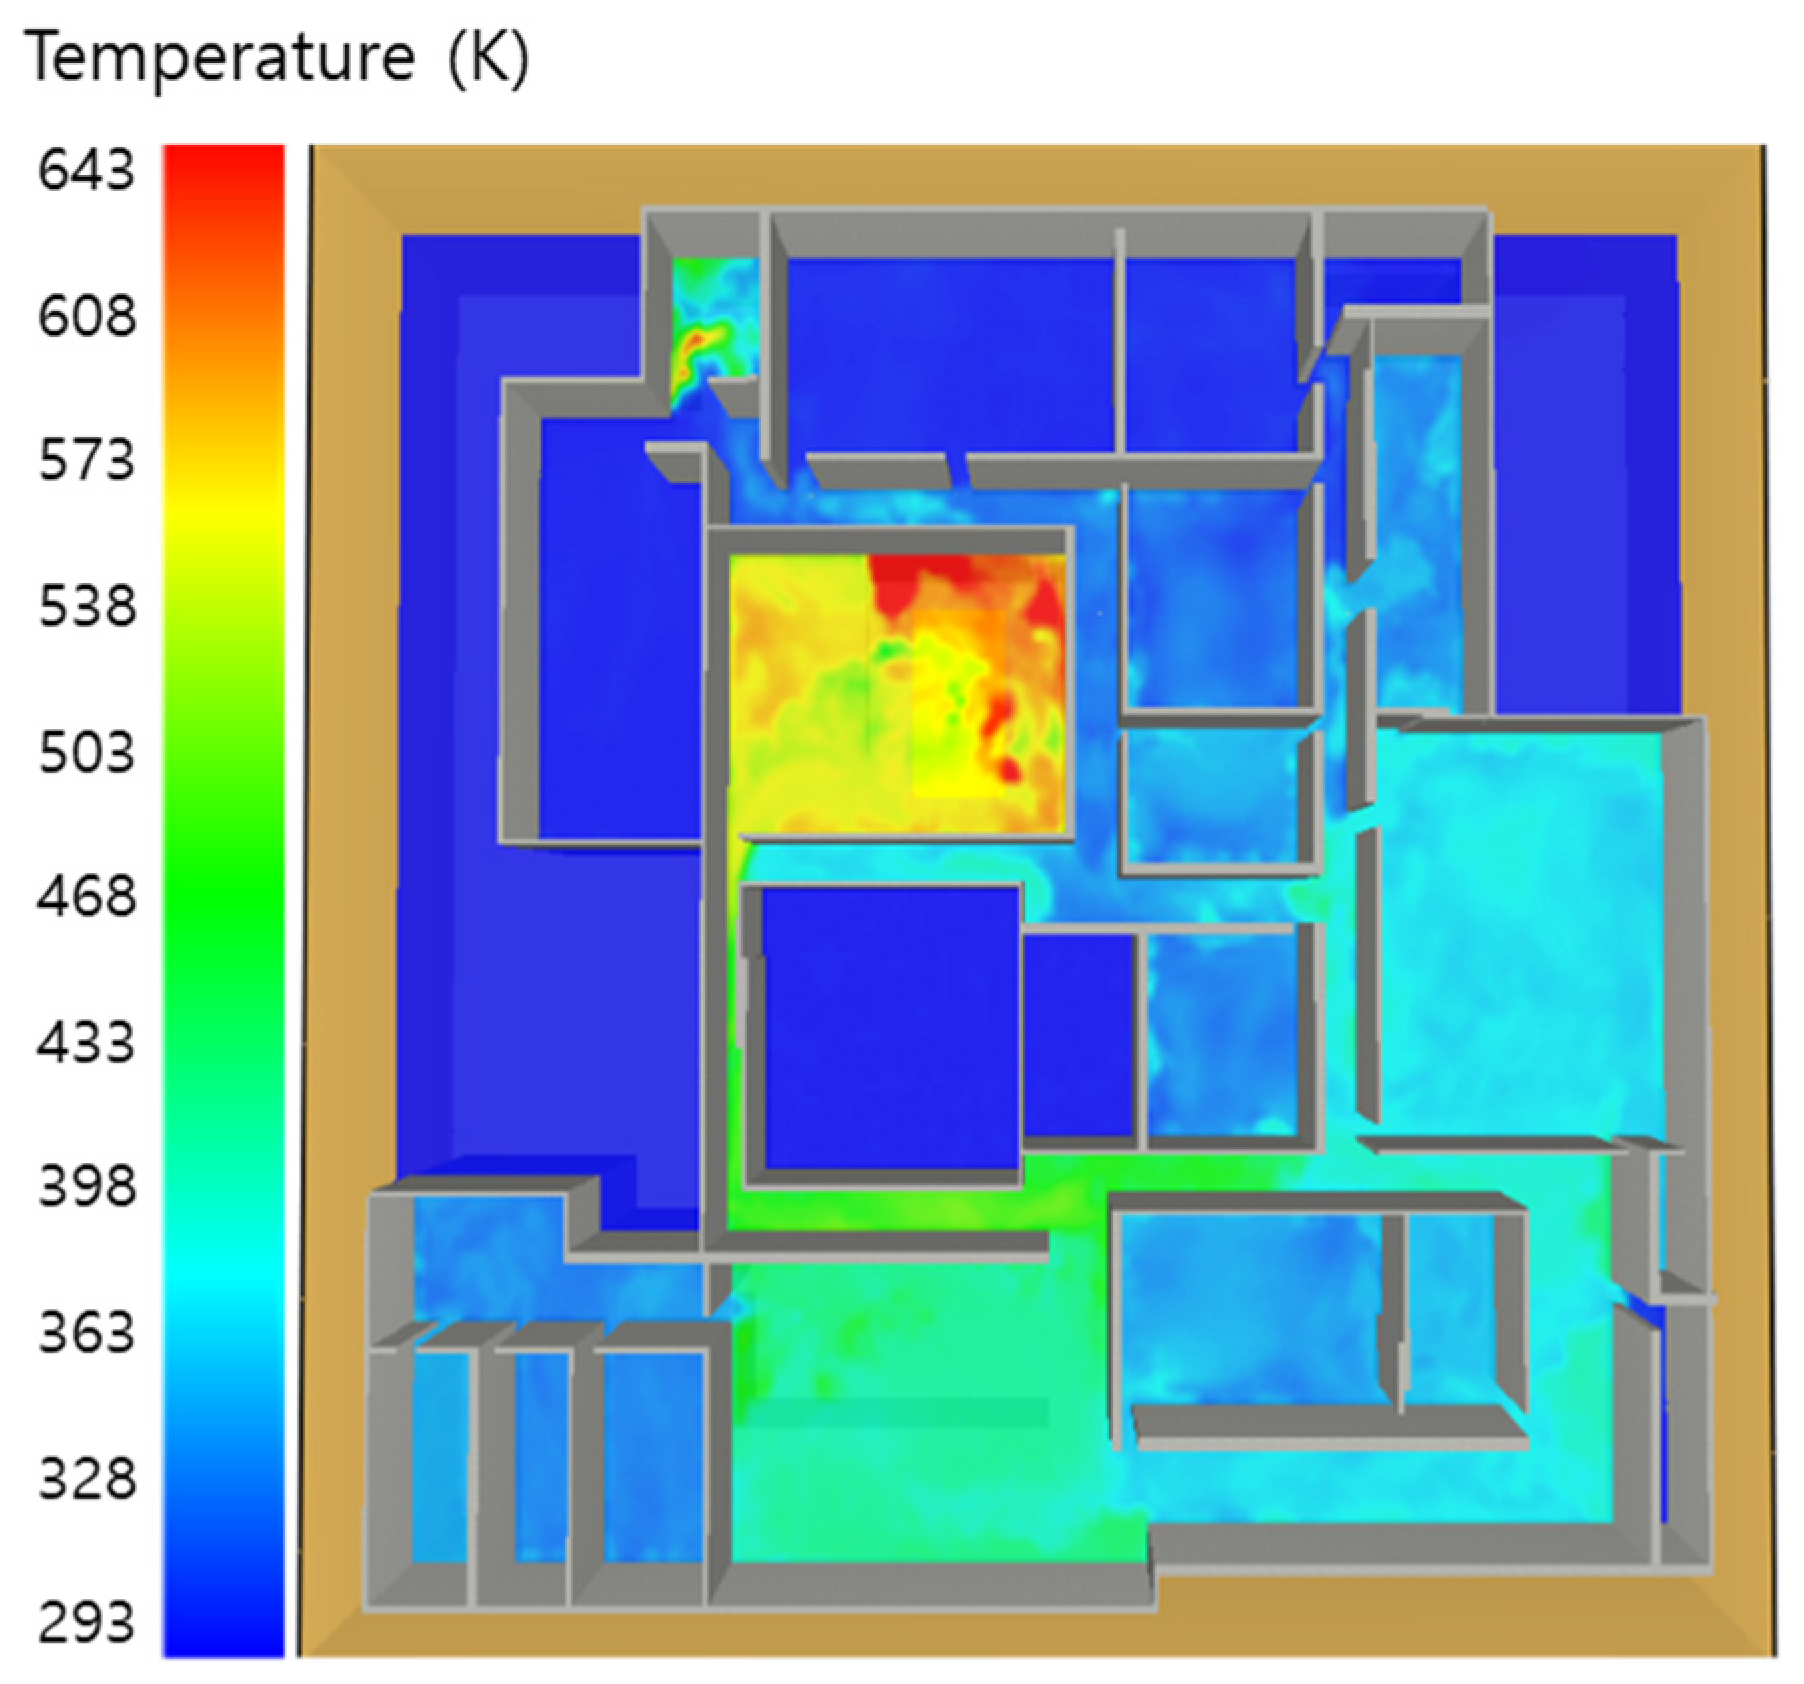
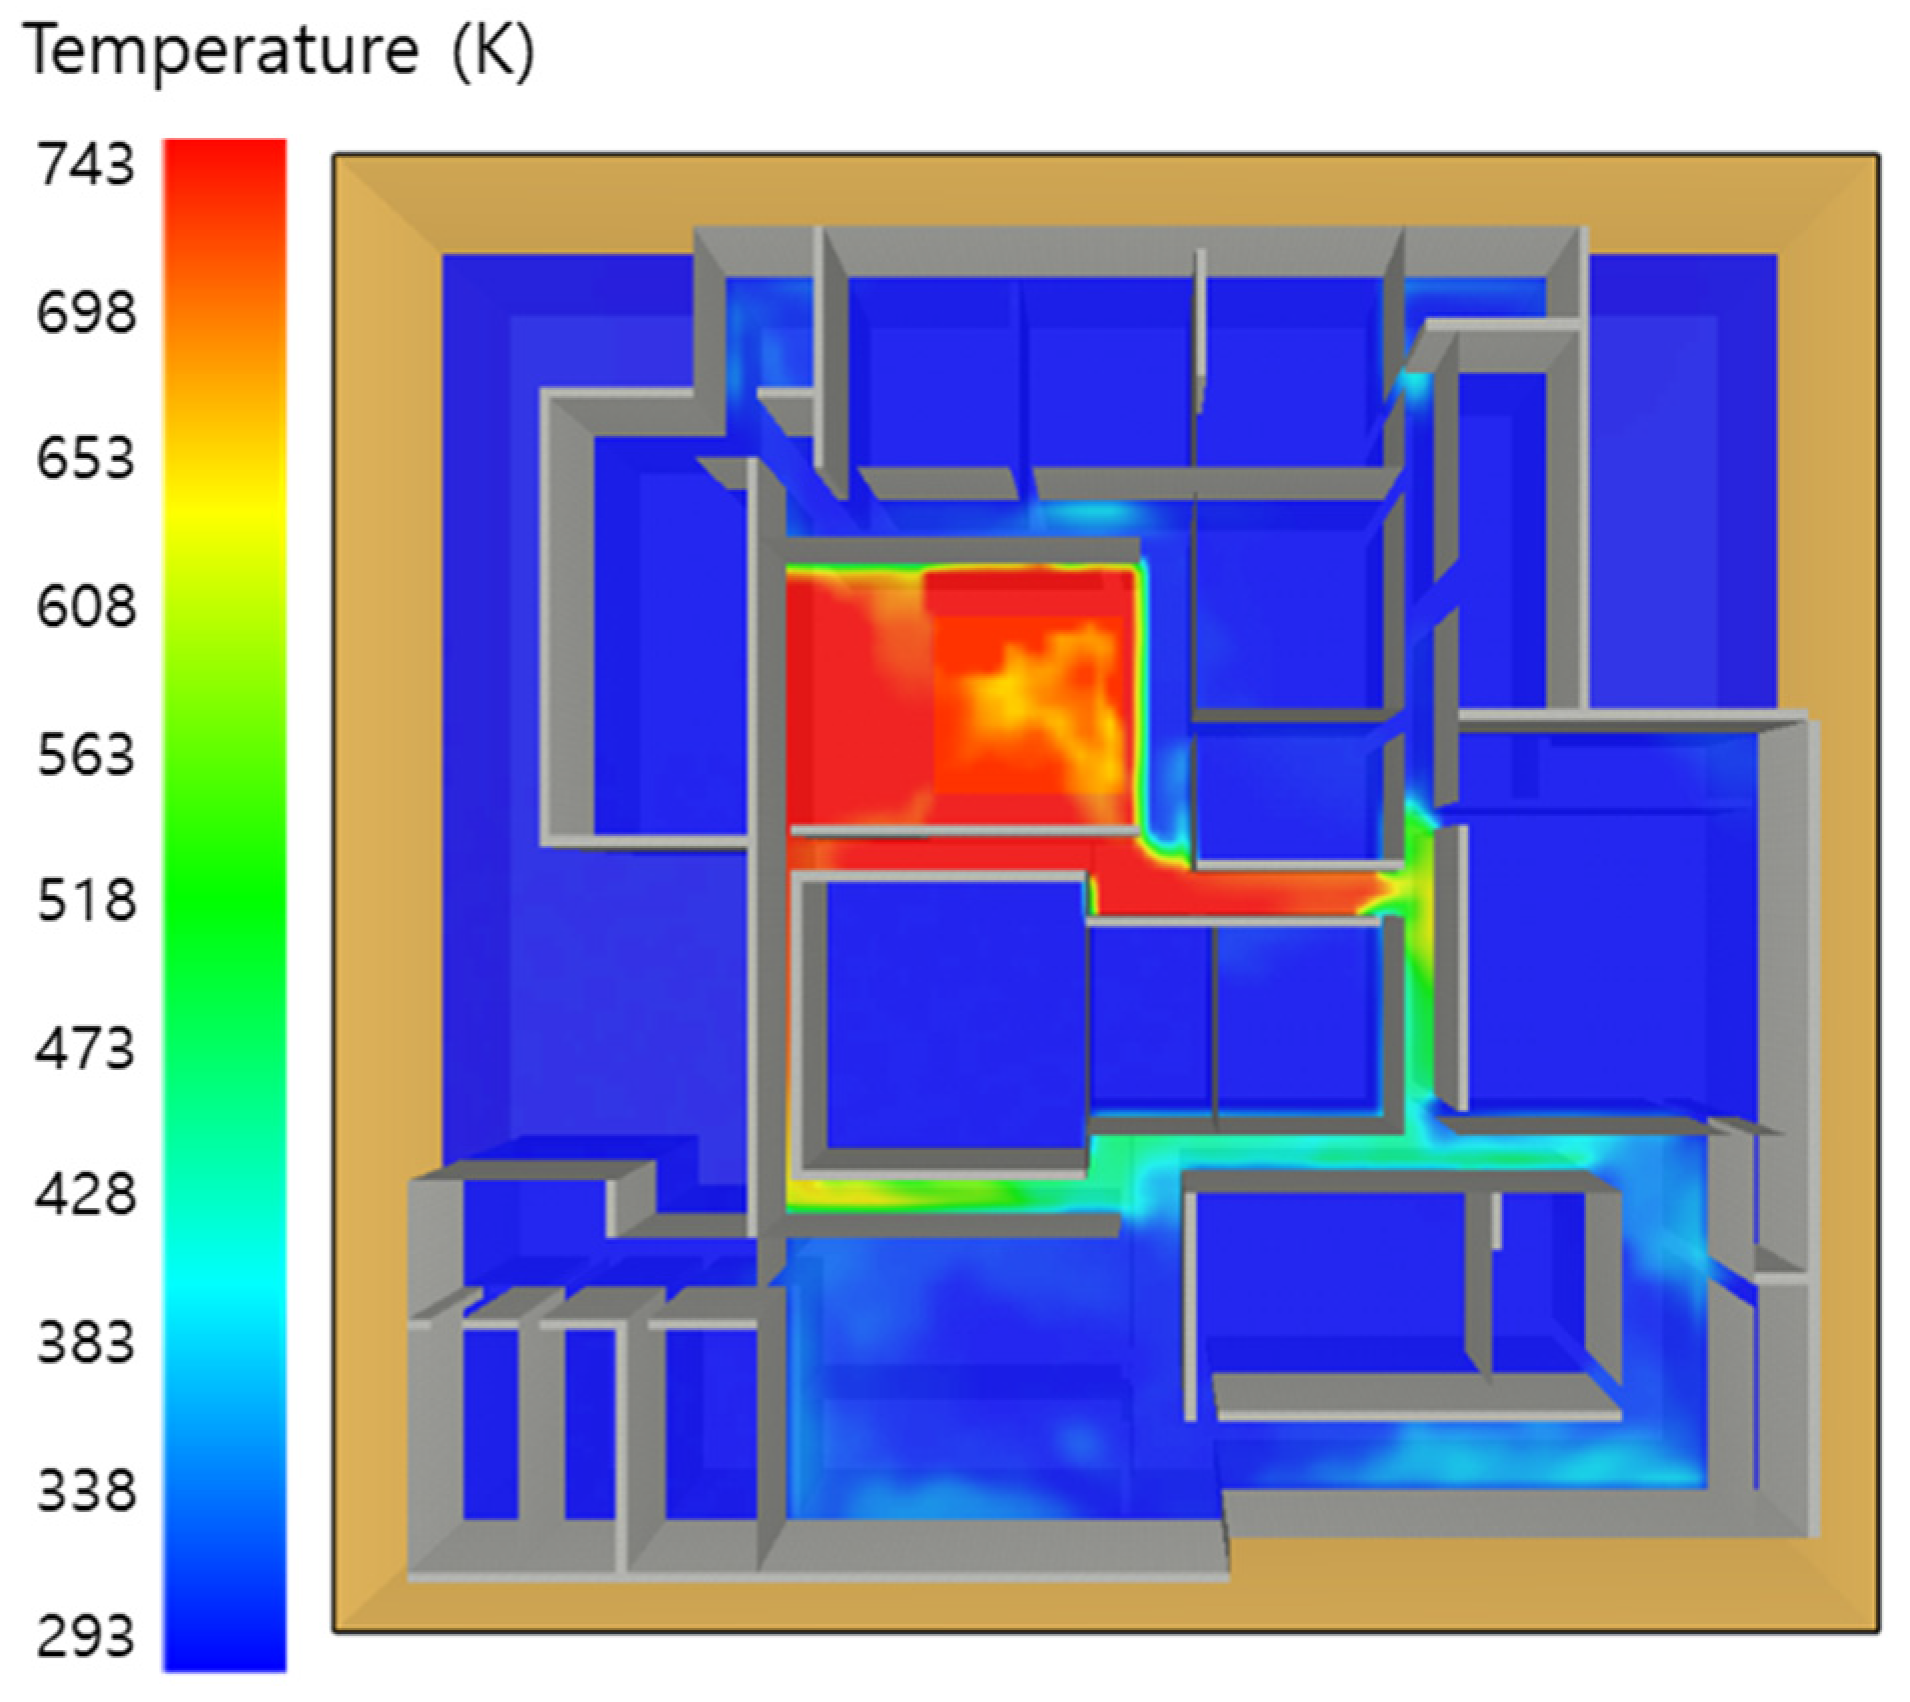
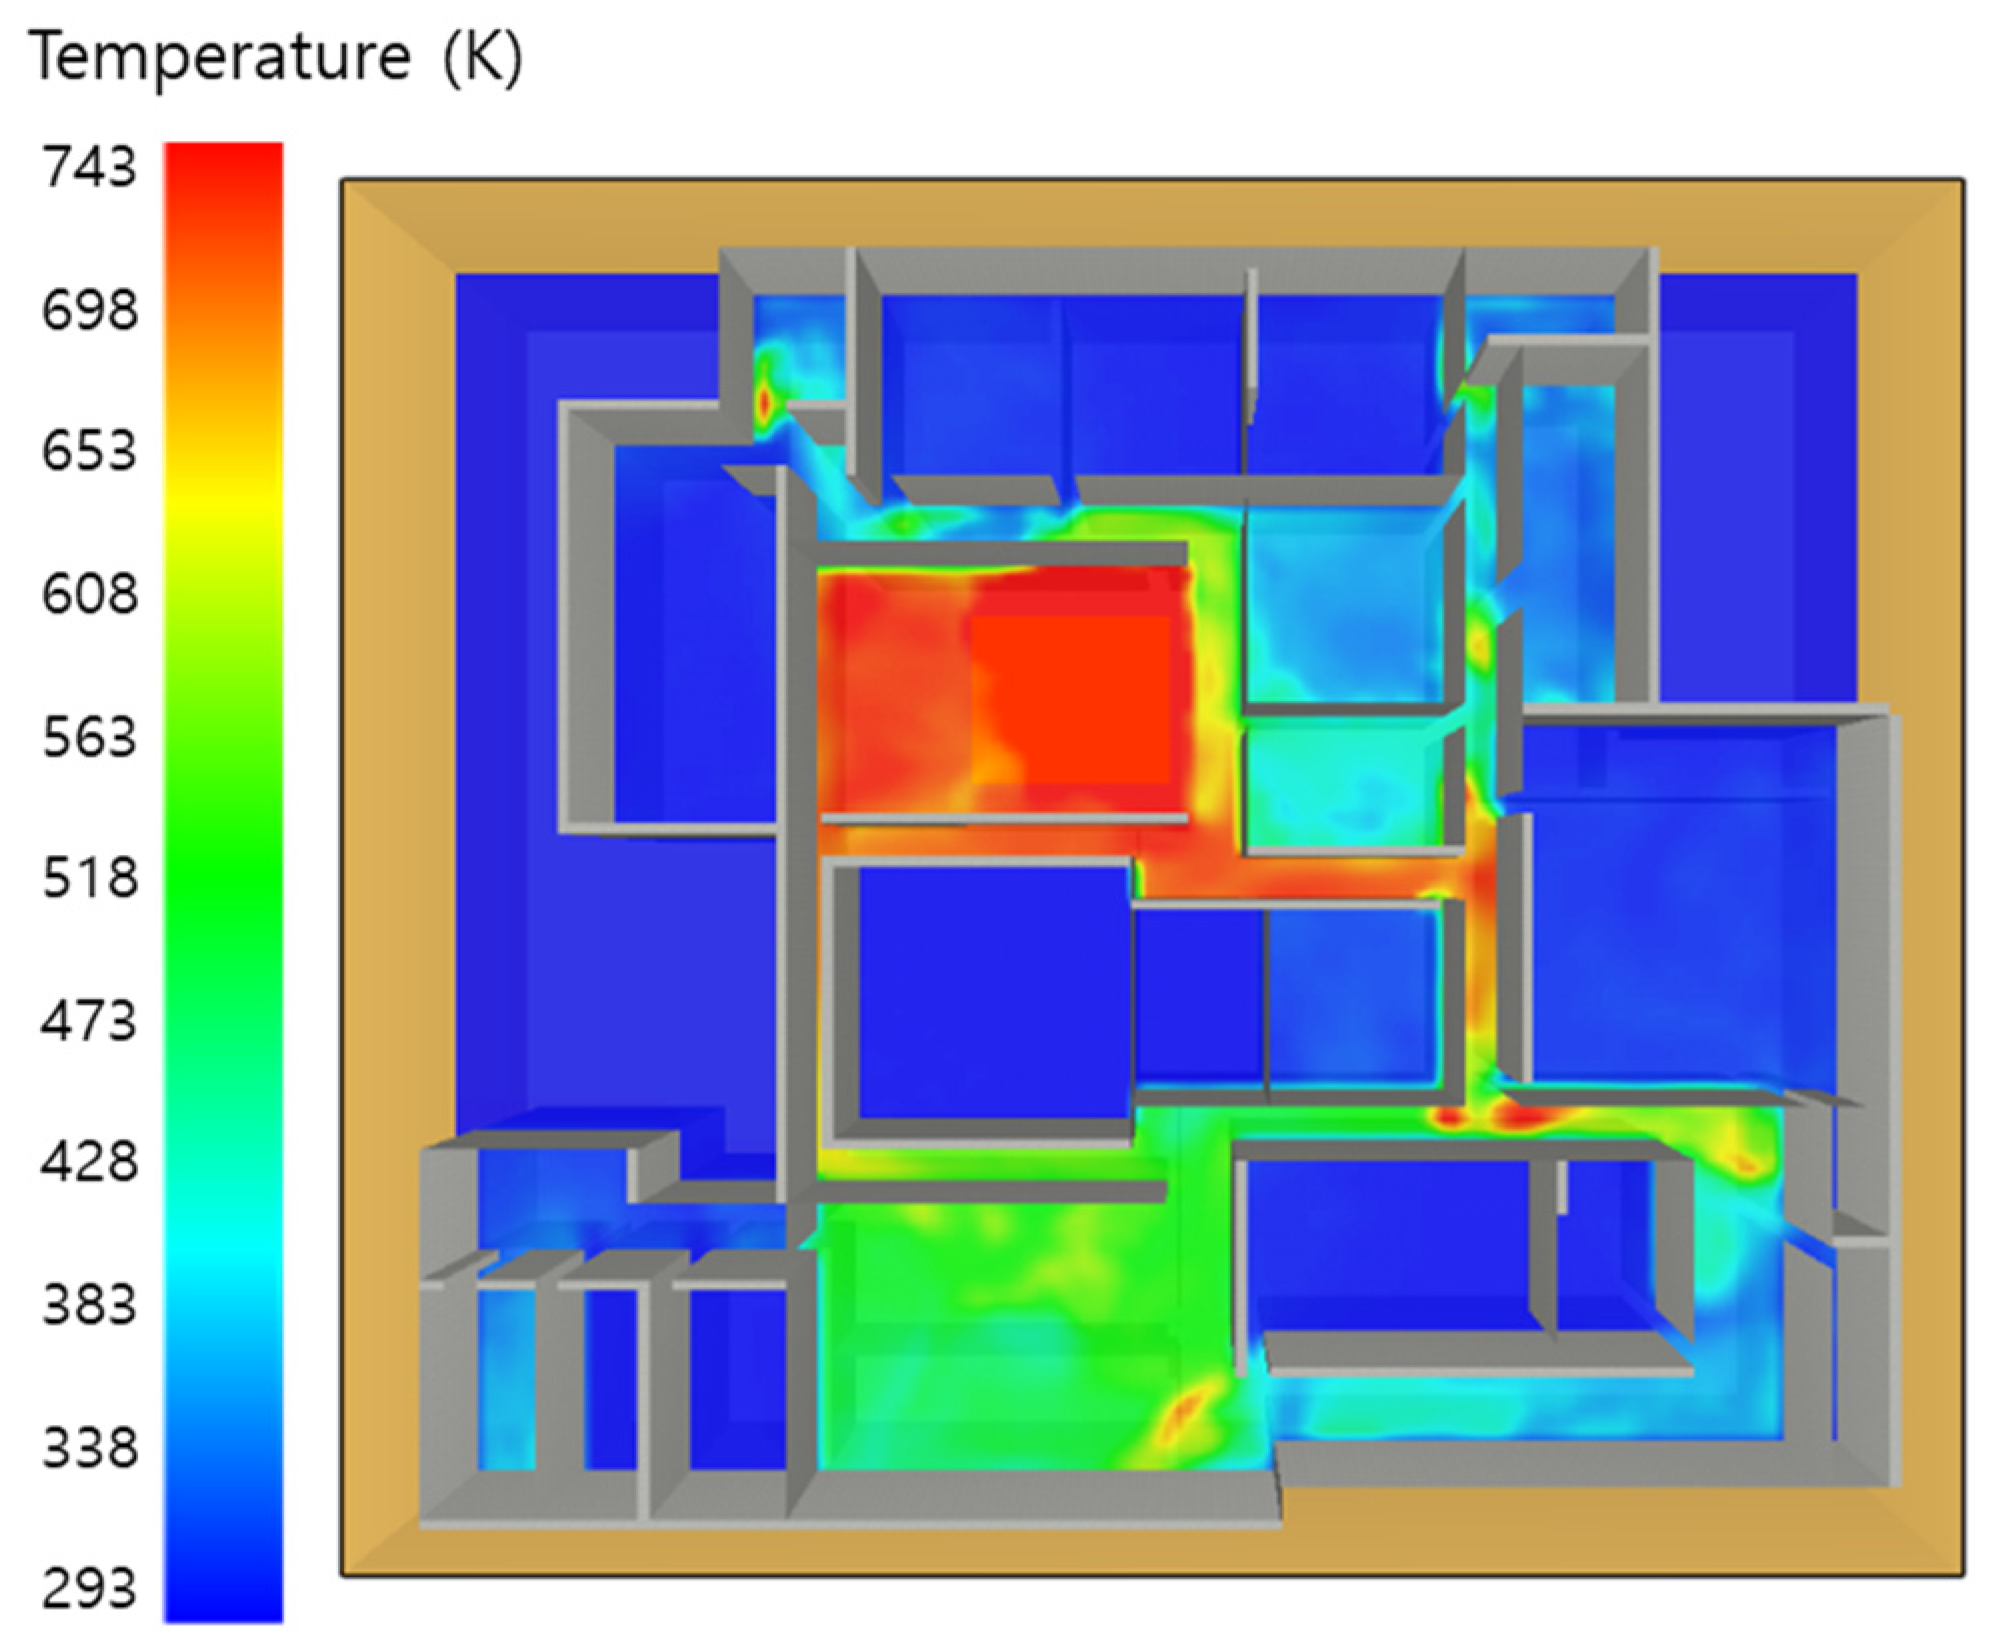
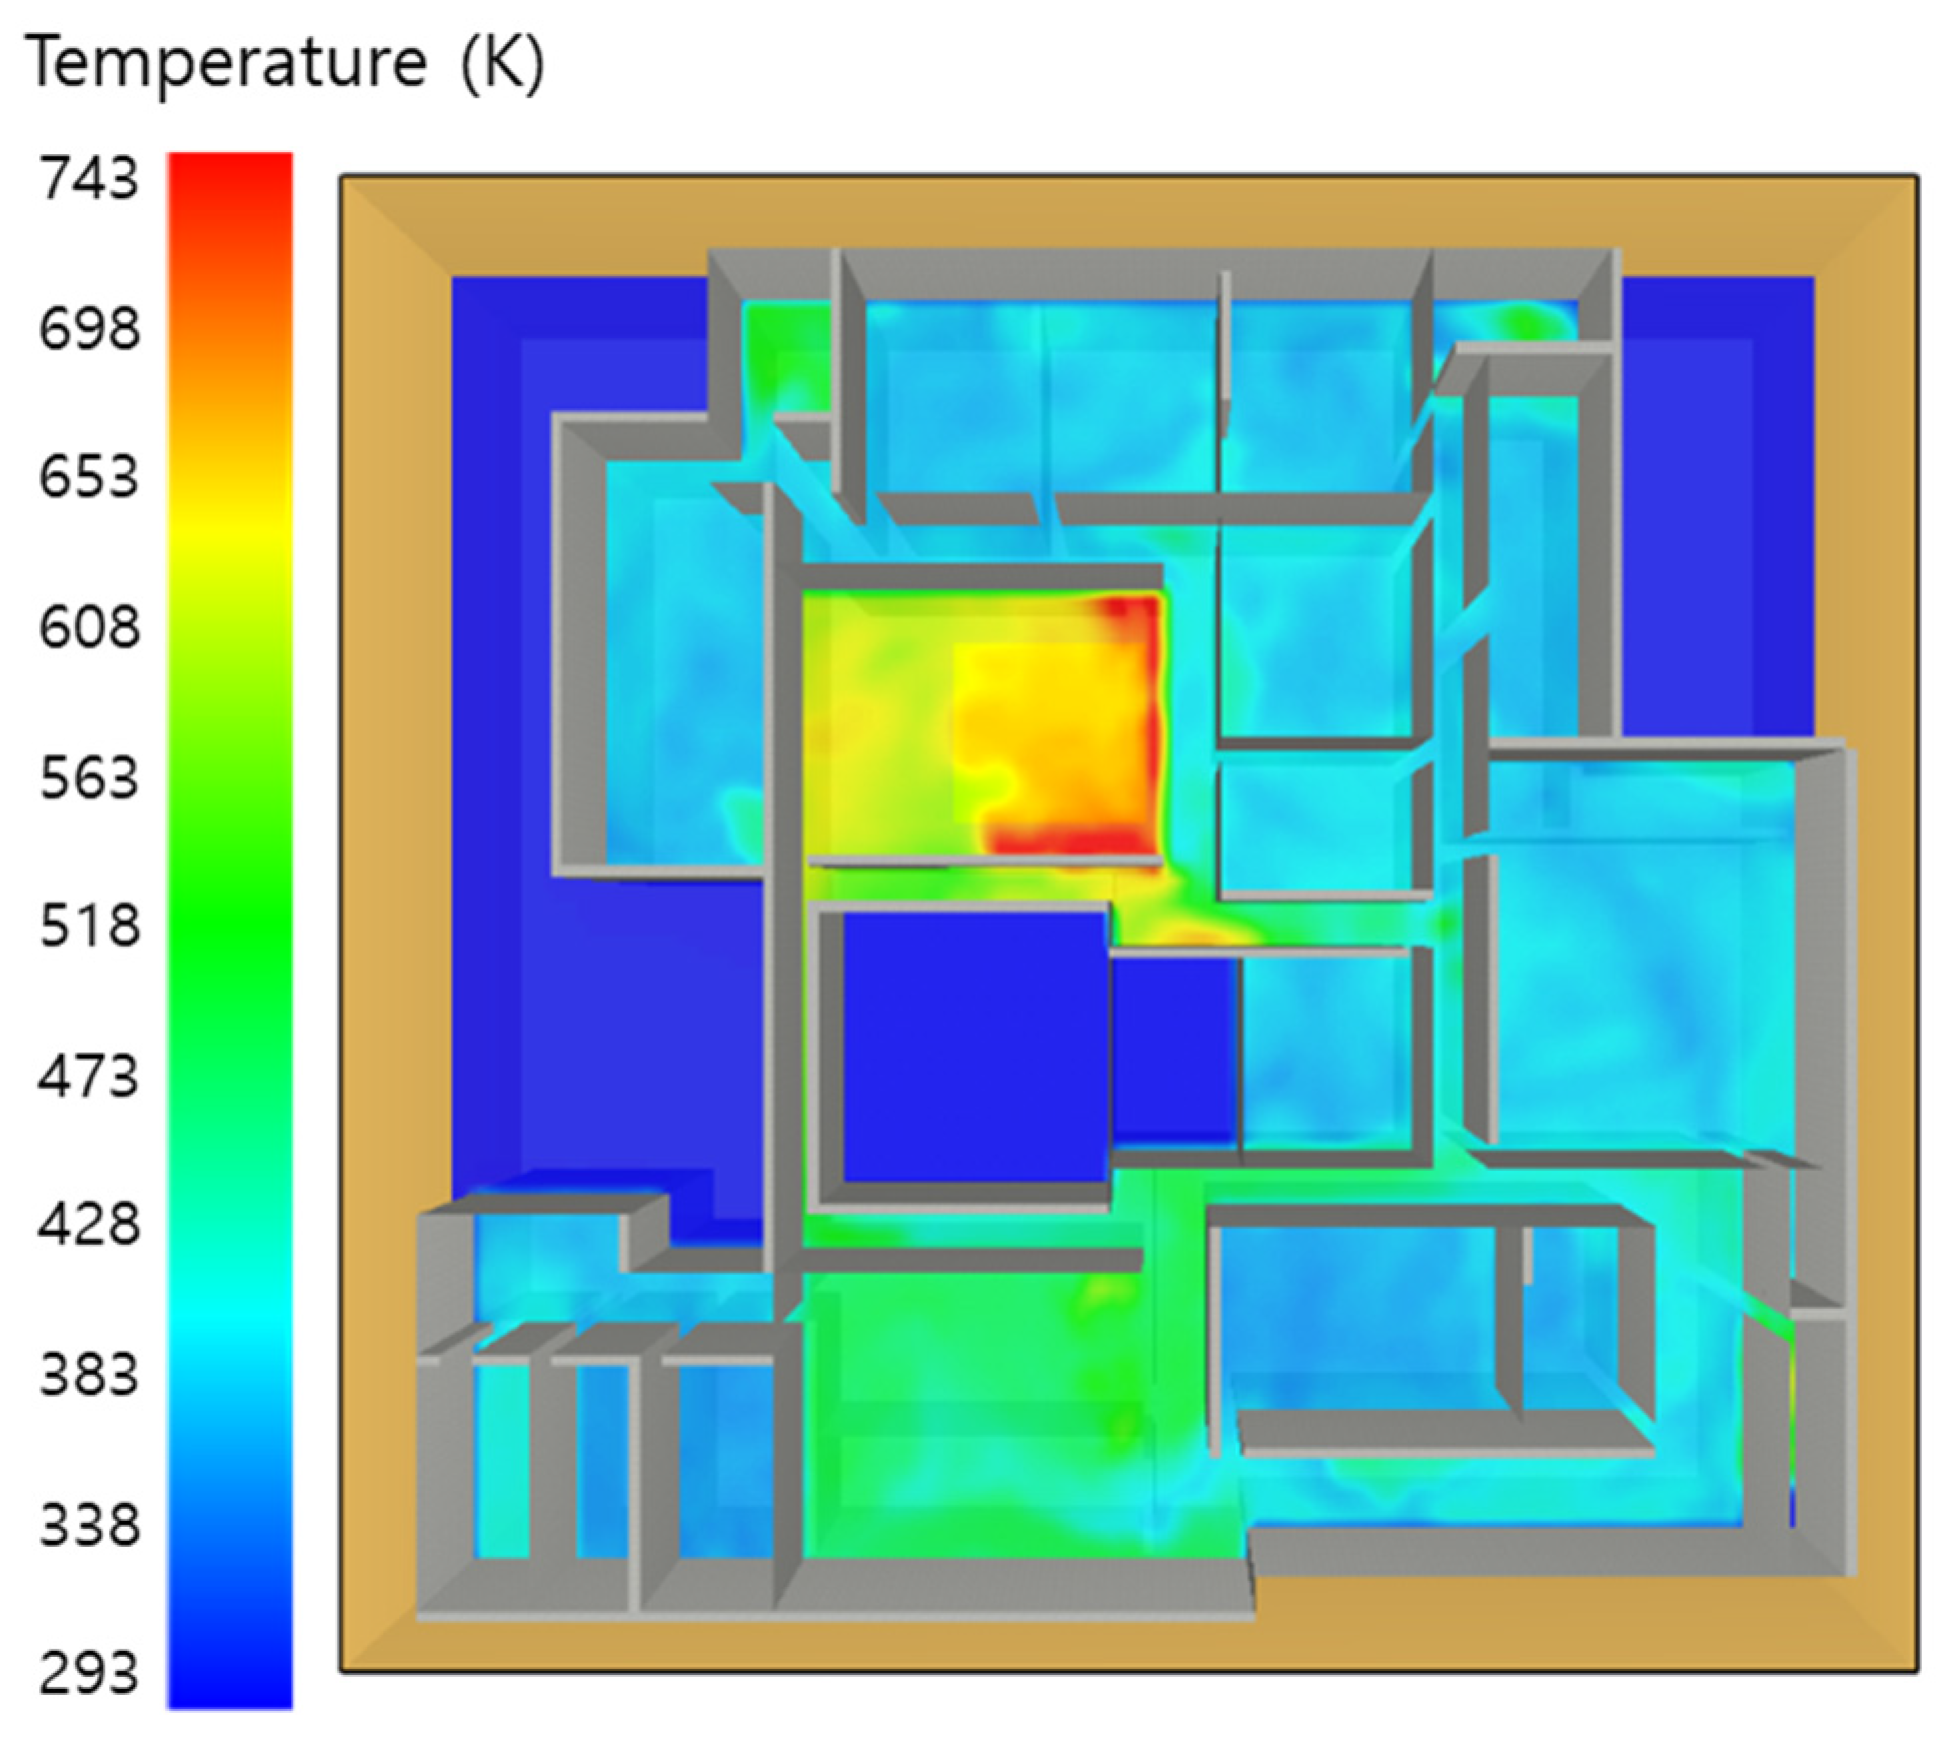
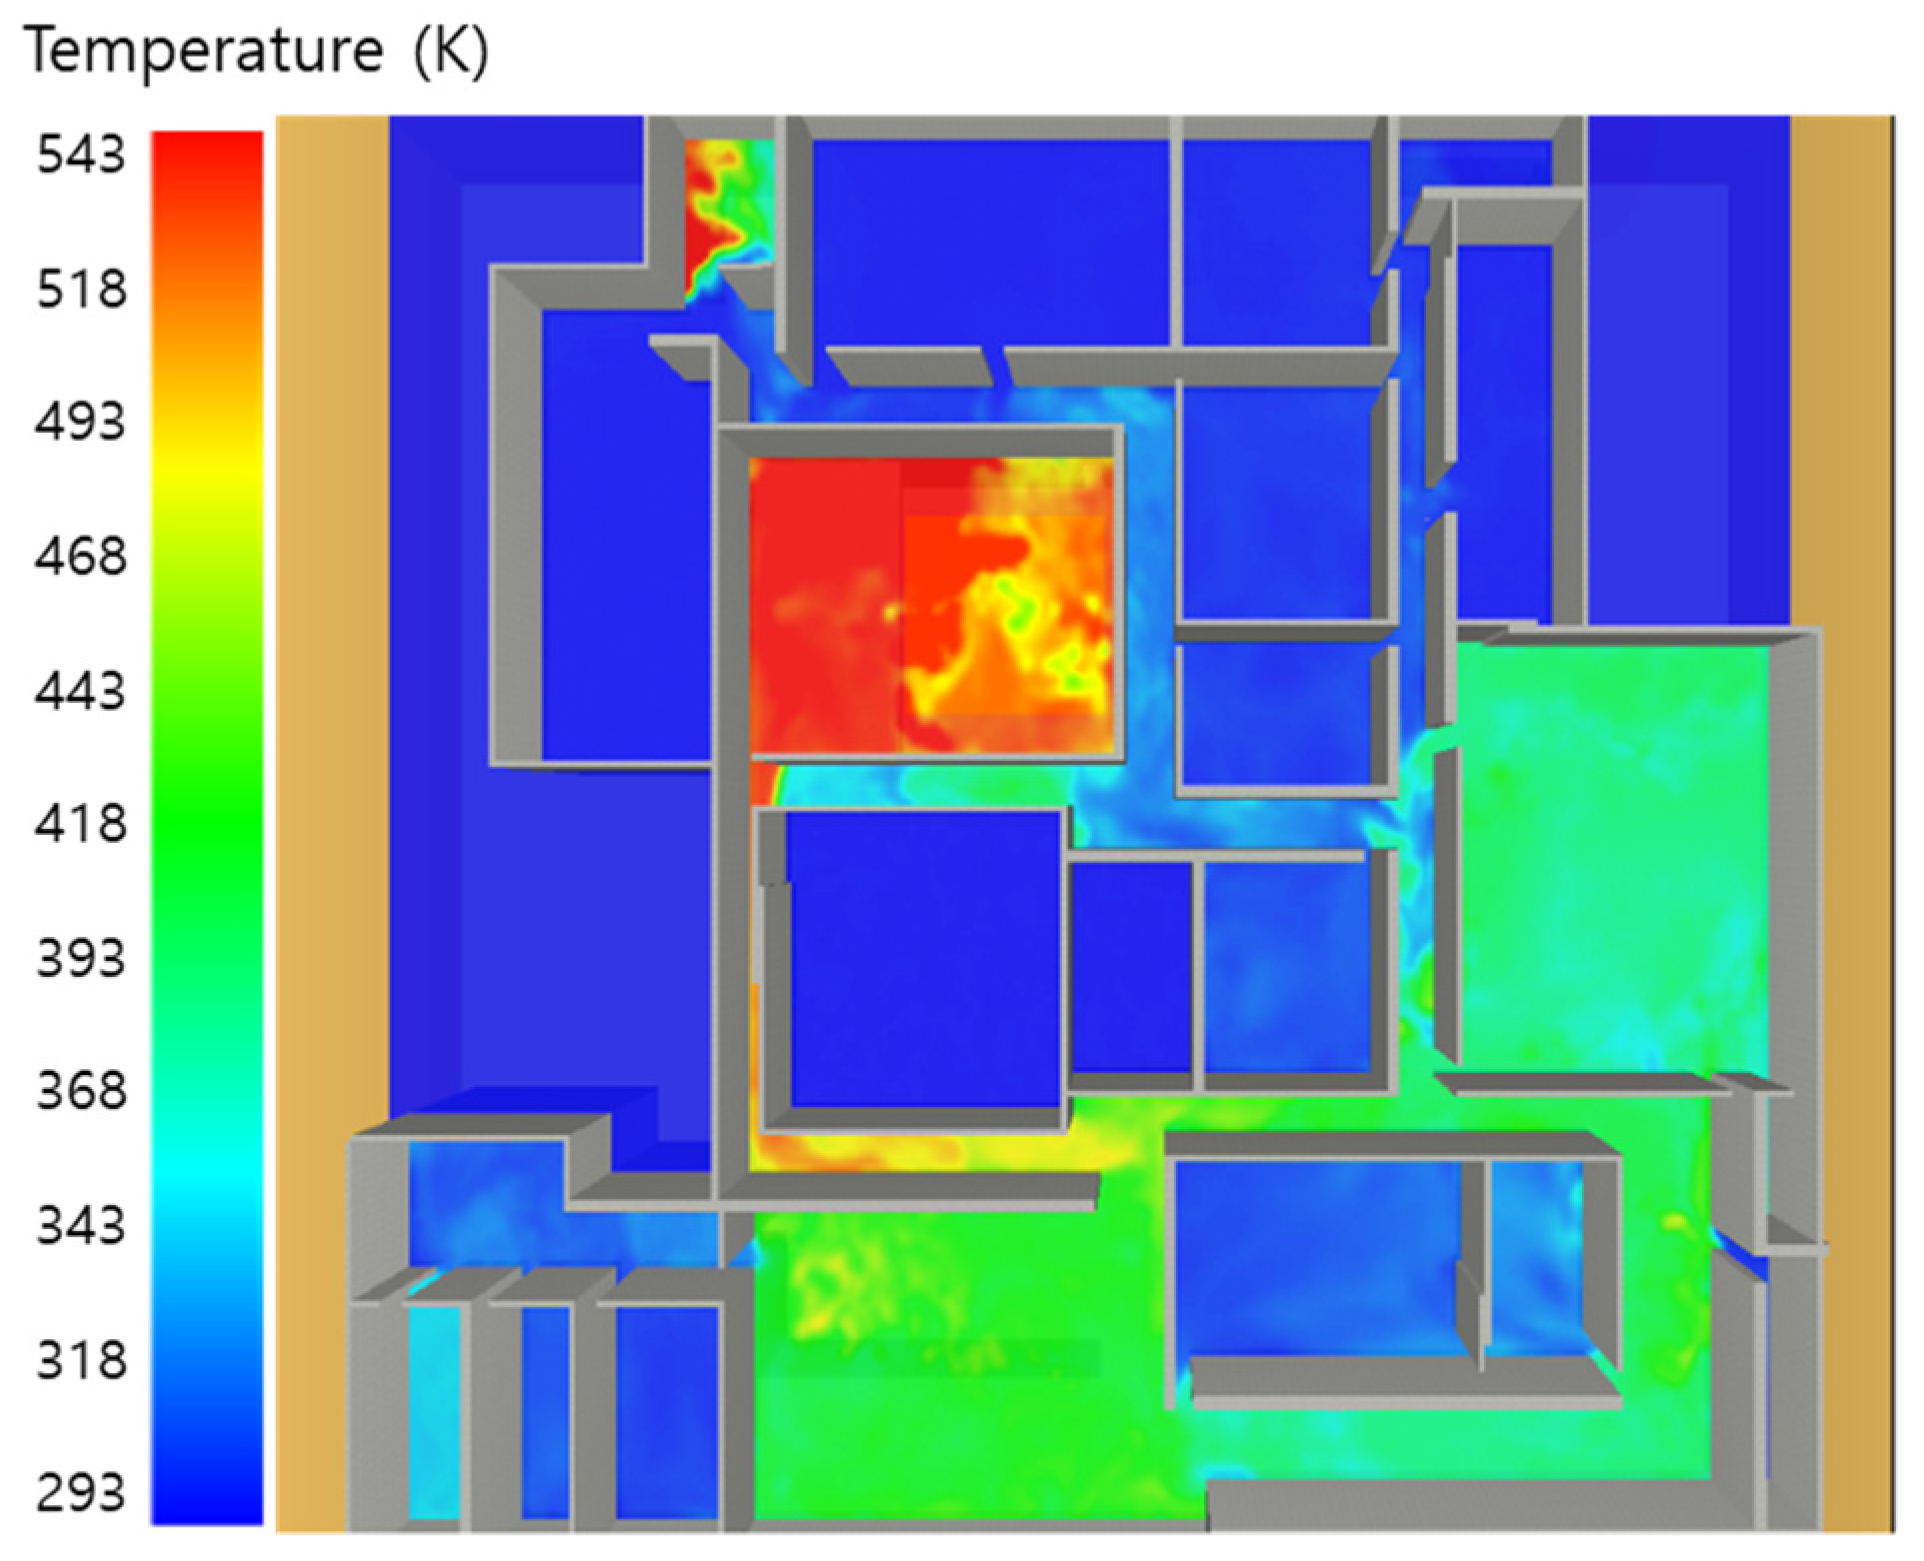
- Temperature
- (2)
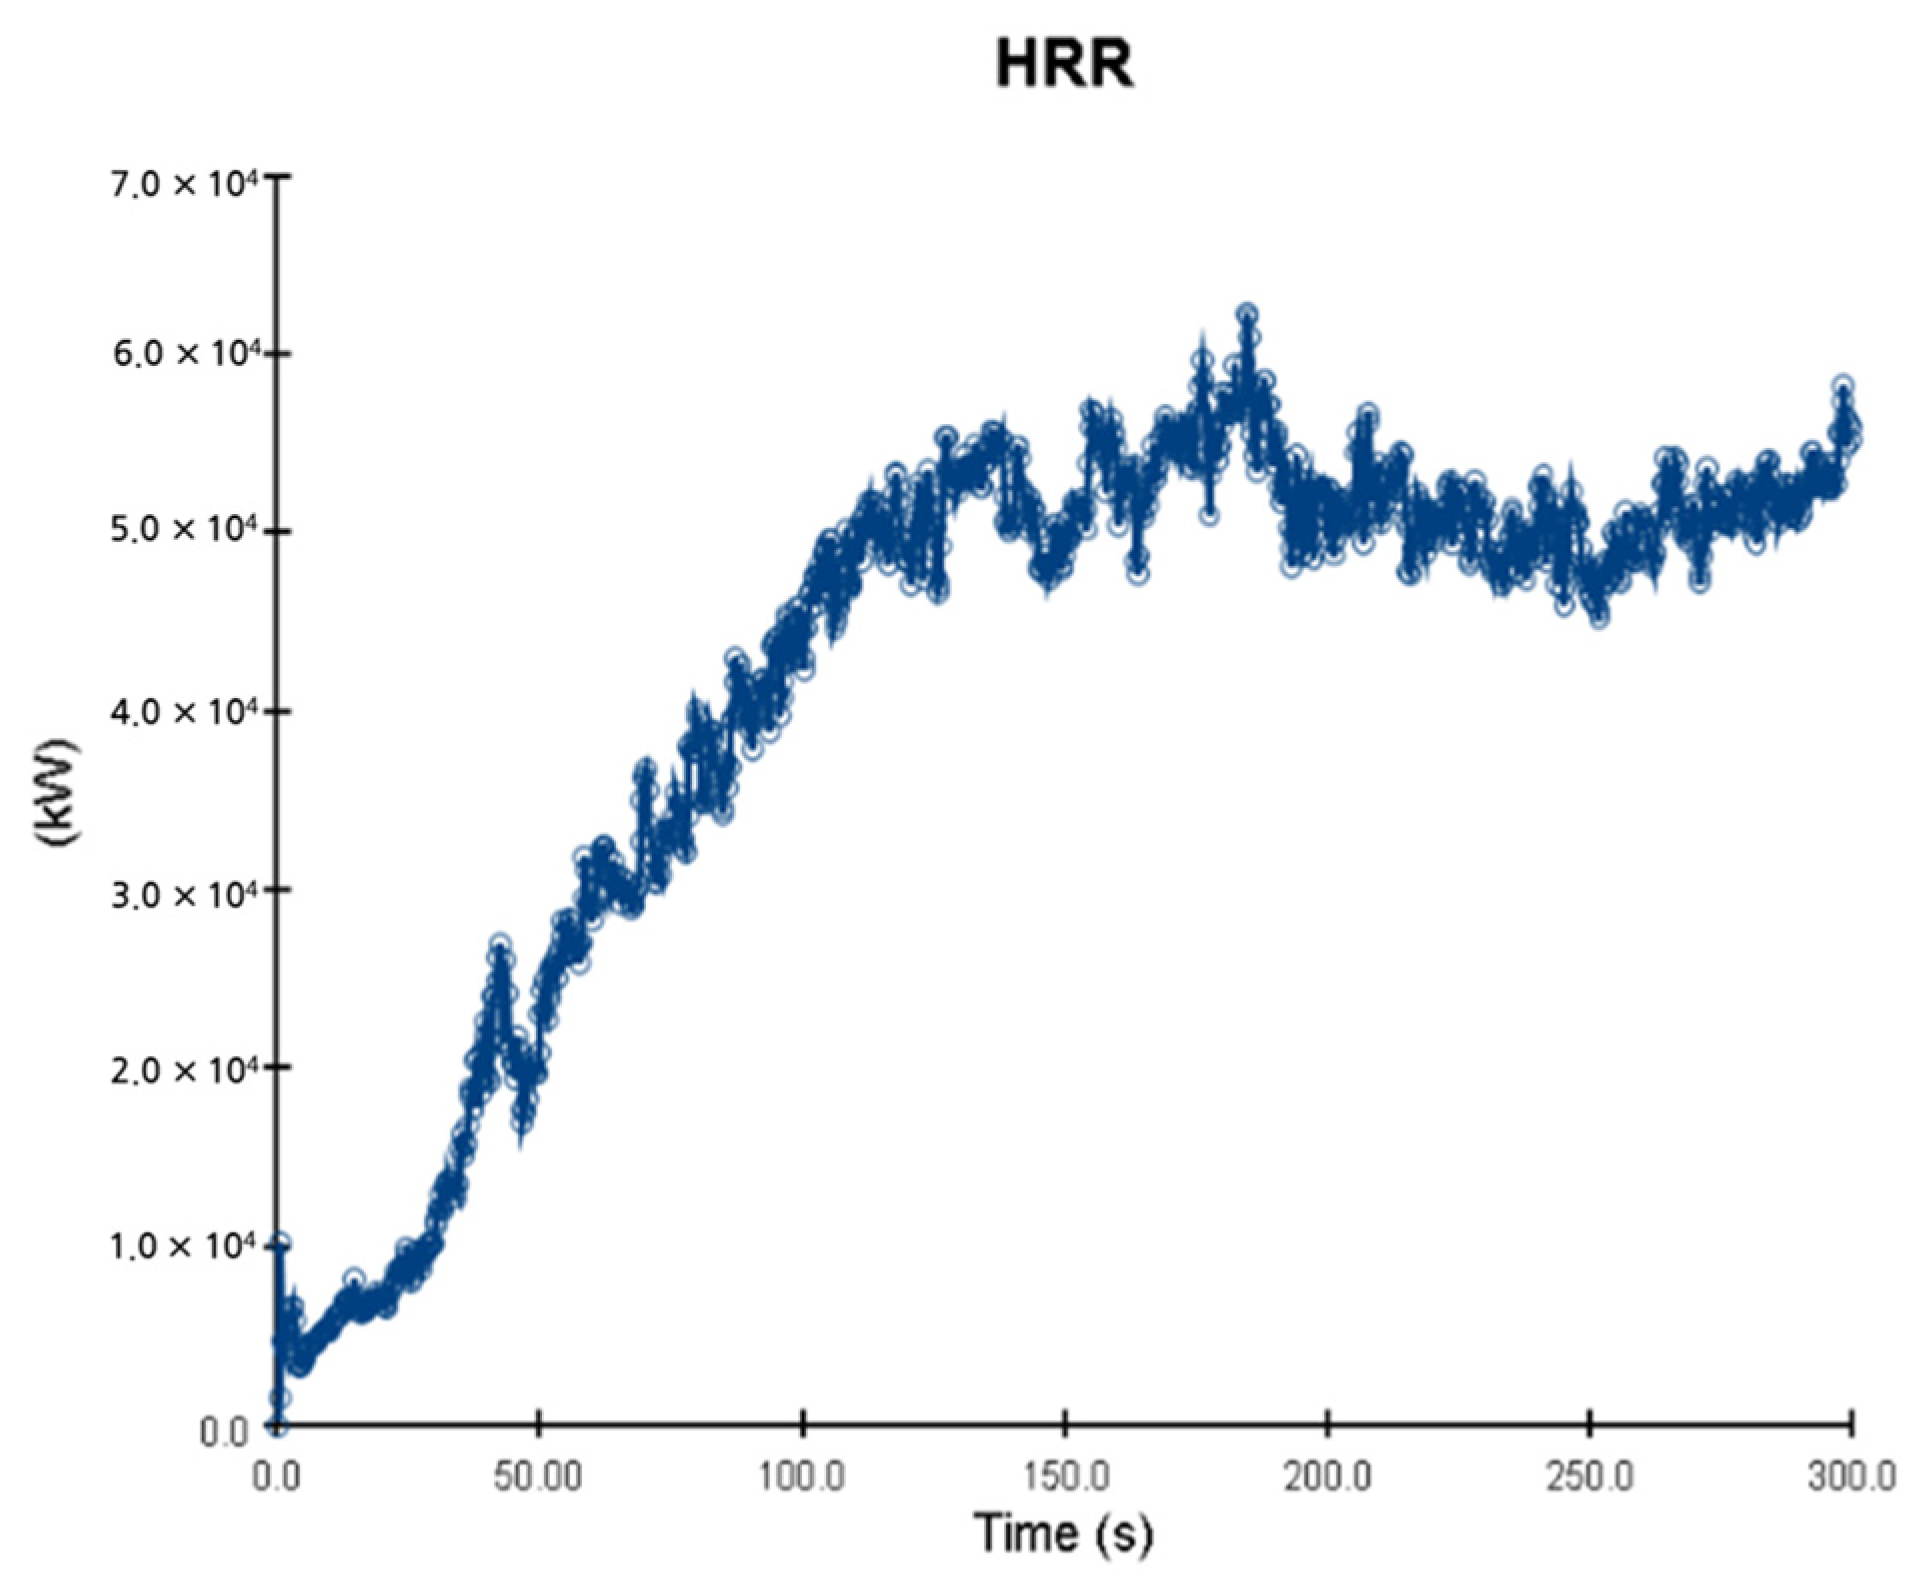
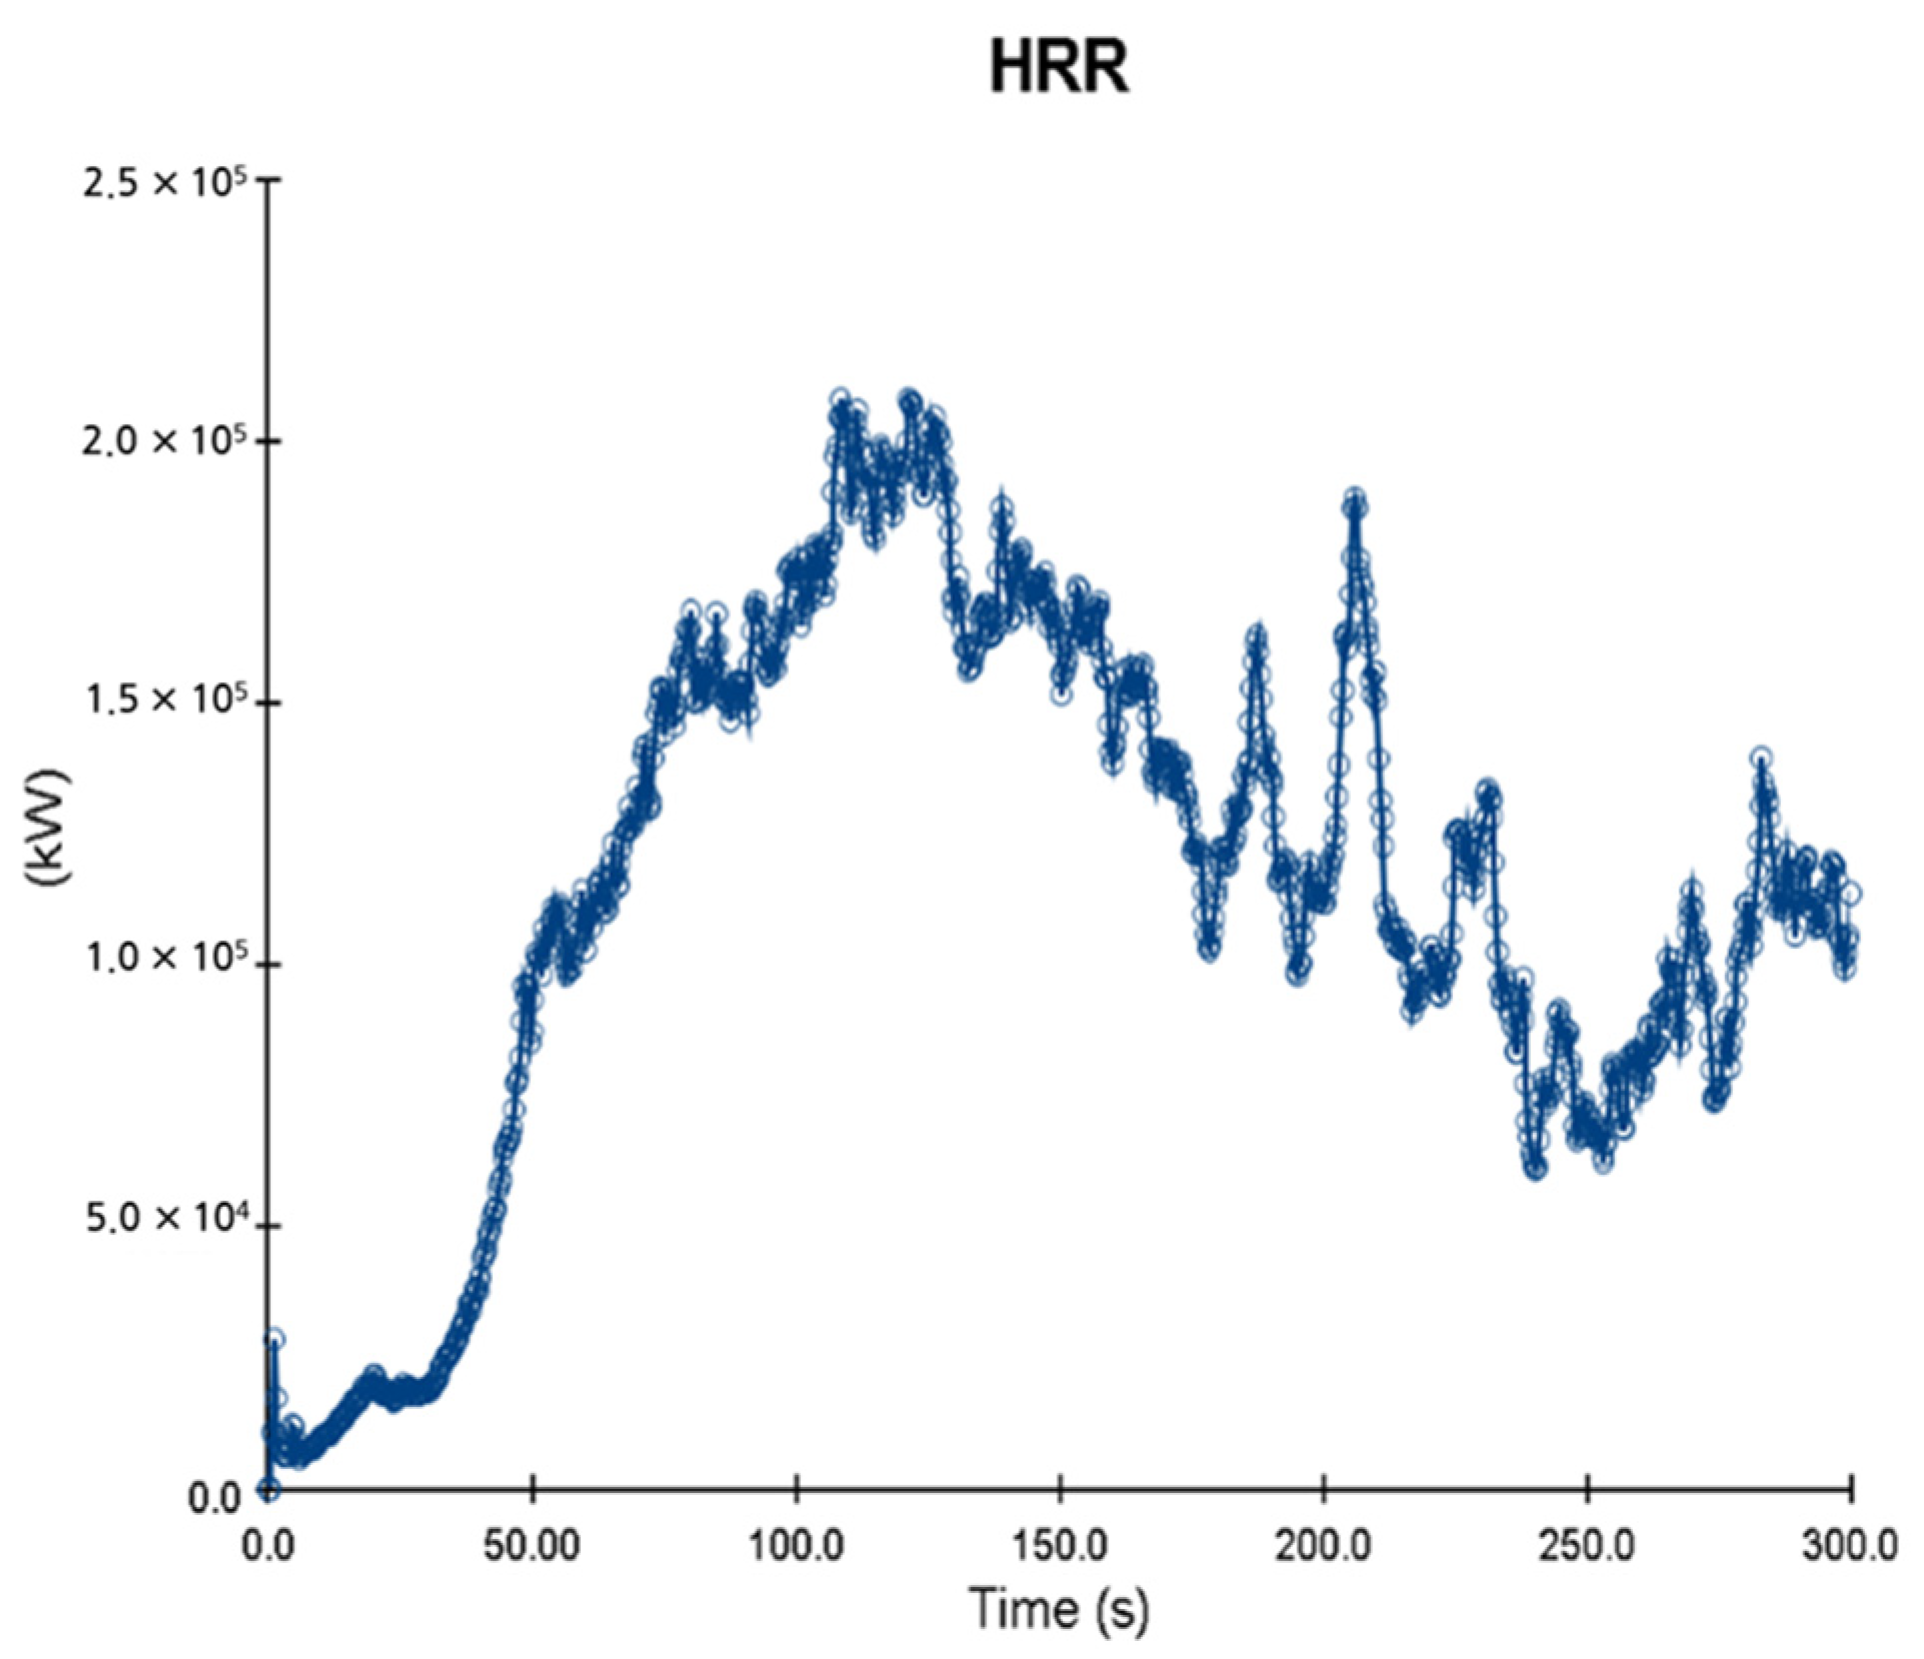
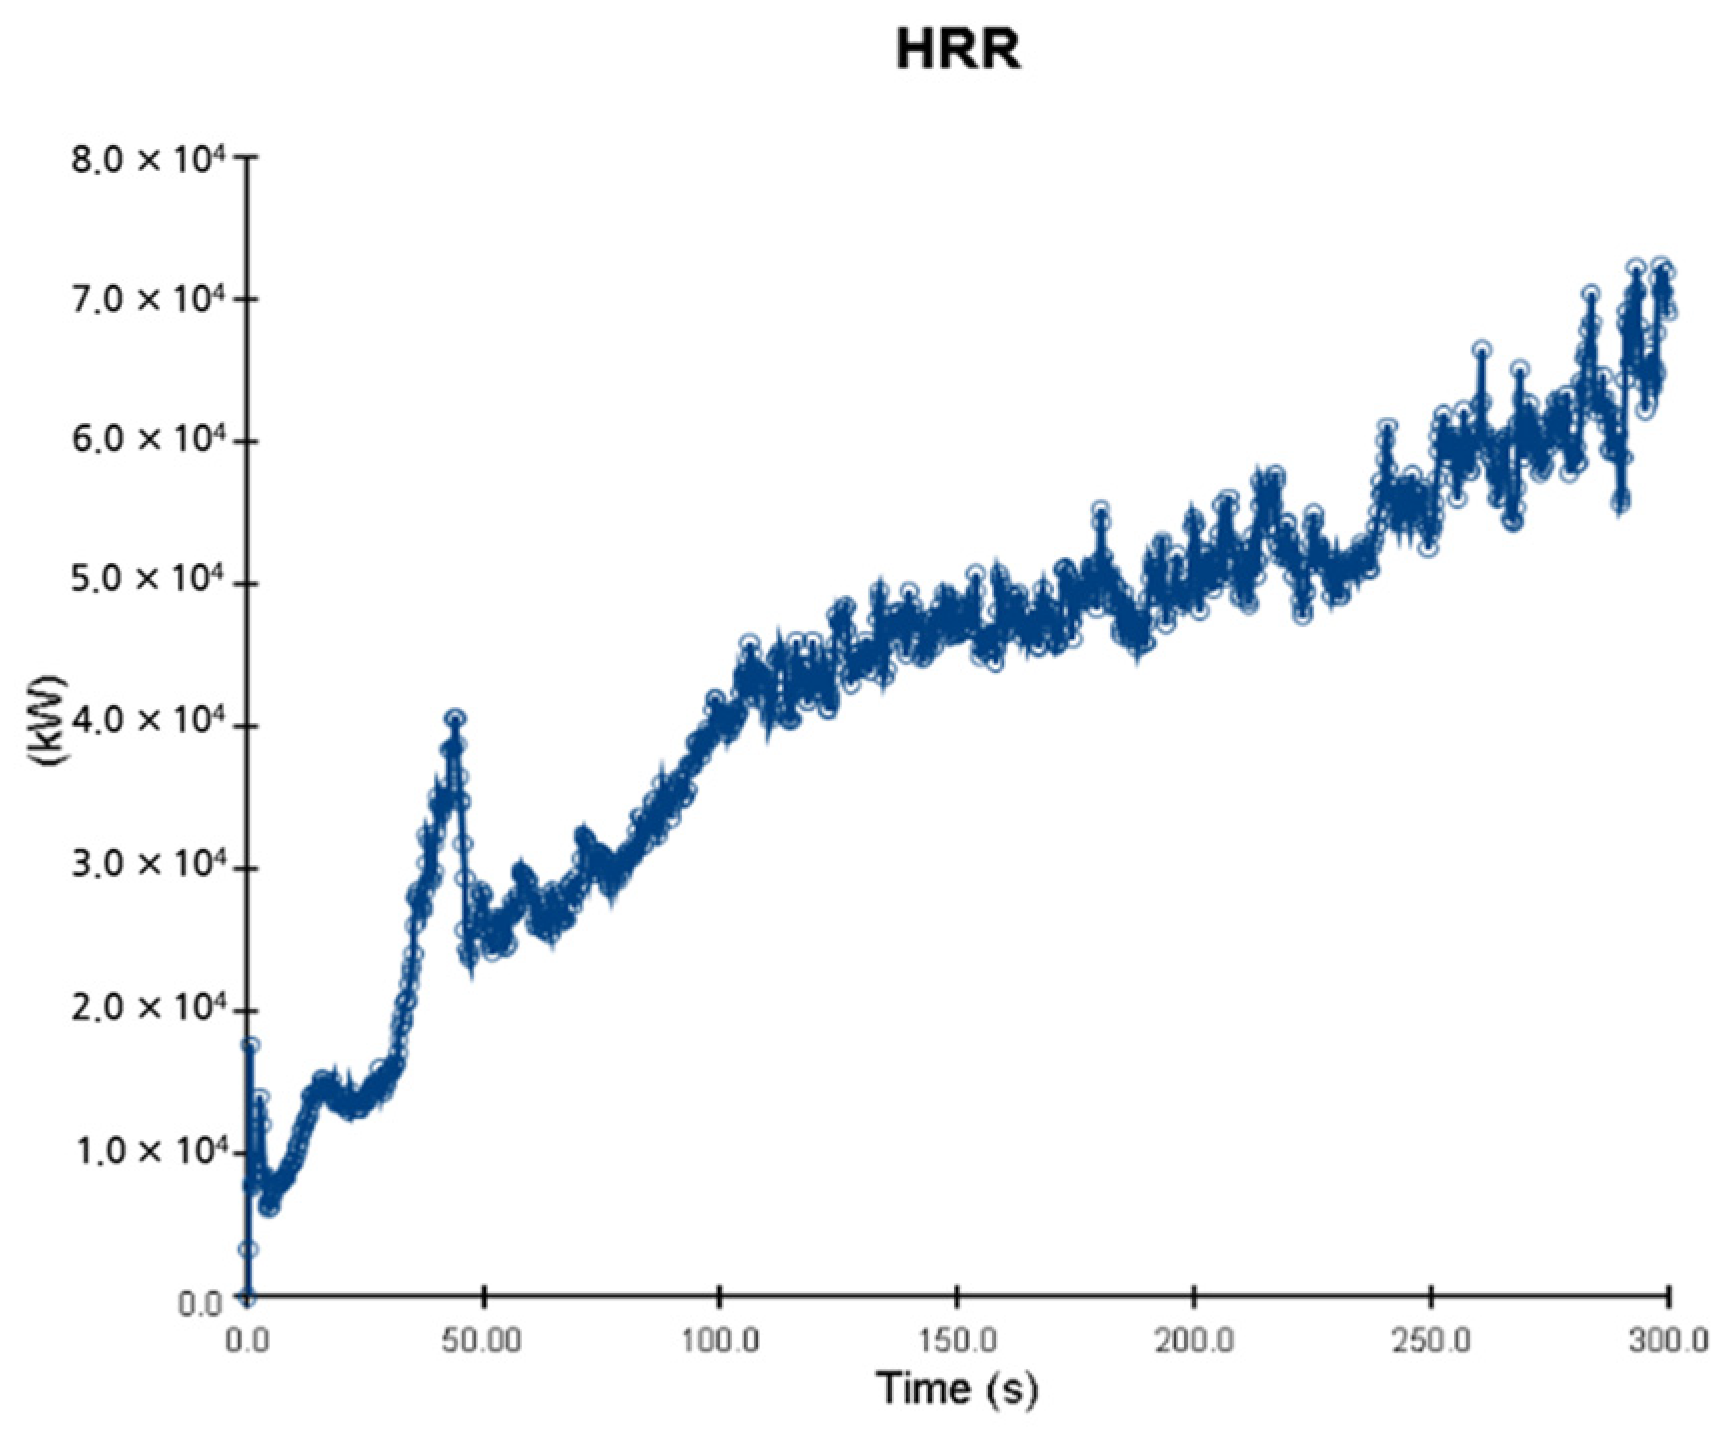
- HRR (heat release rate per unit volume)
2. Numerical Modeling
2.1. Validation Approach
2.2. Hydrodynamic and Combustion Model
2.3. Governing Equations
2.4. Sprinkle Model
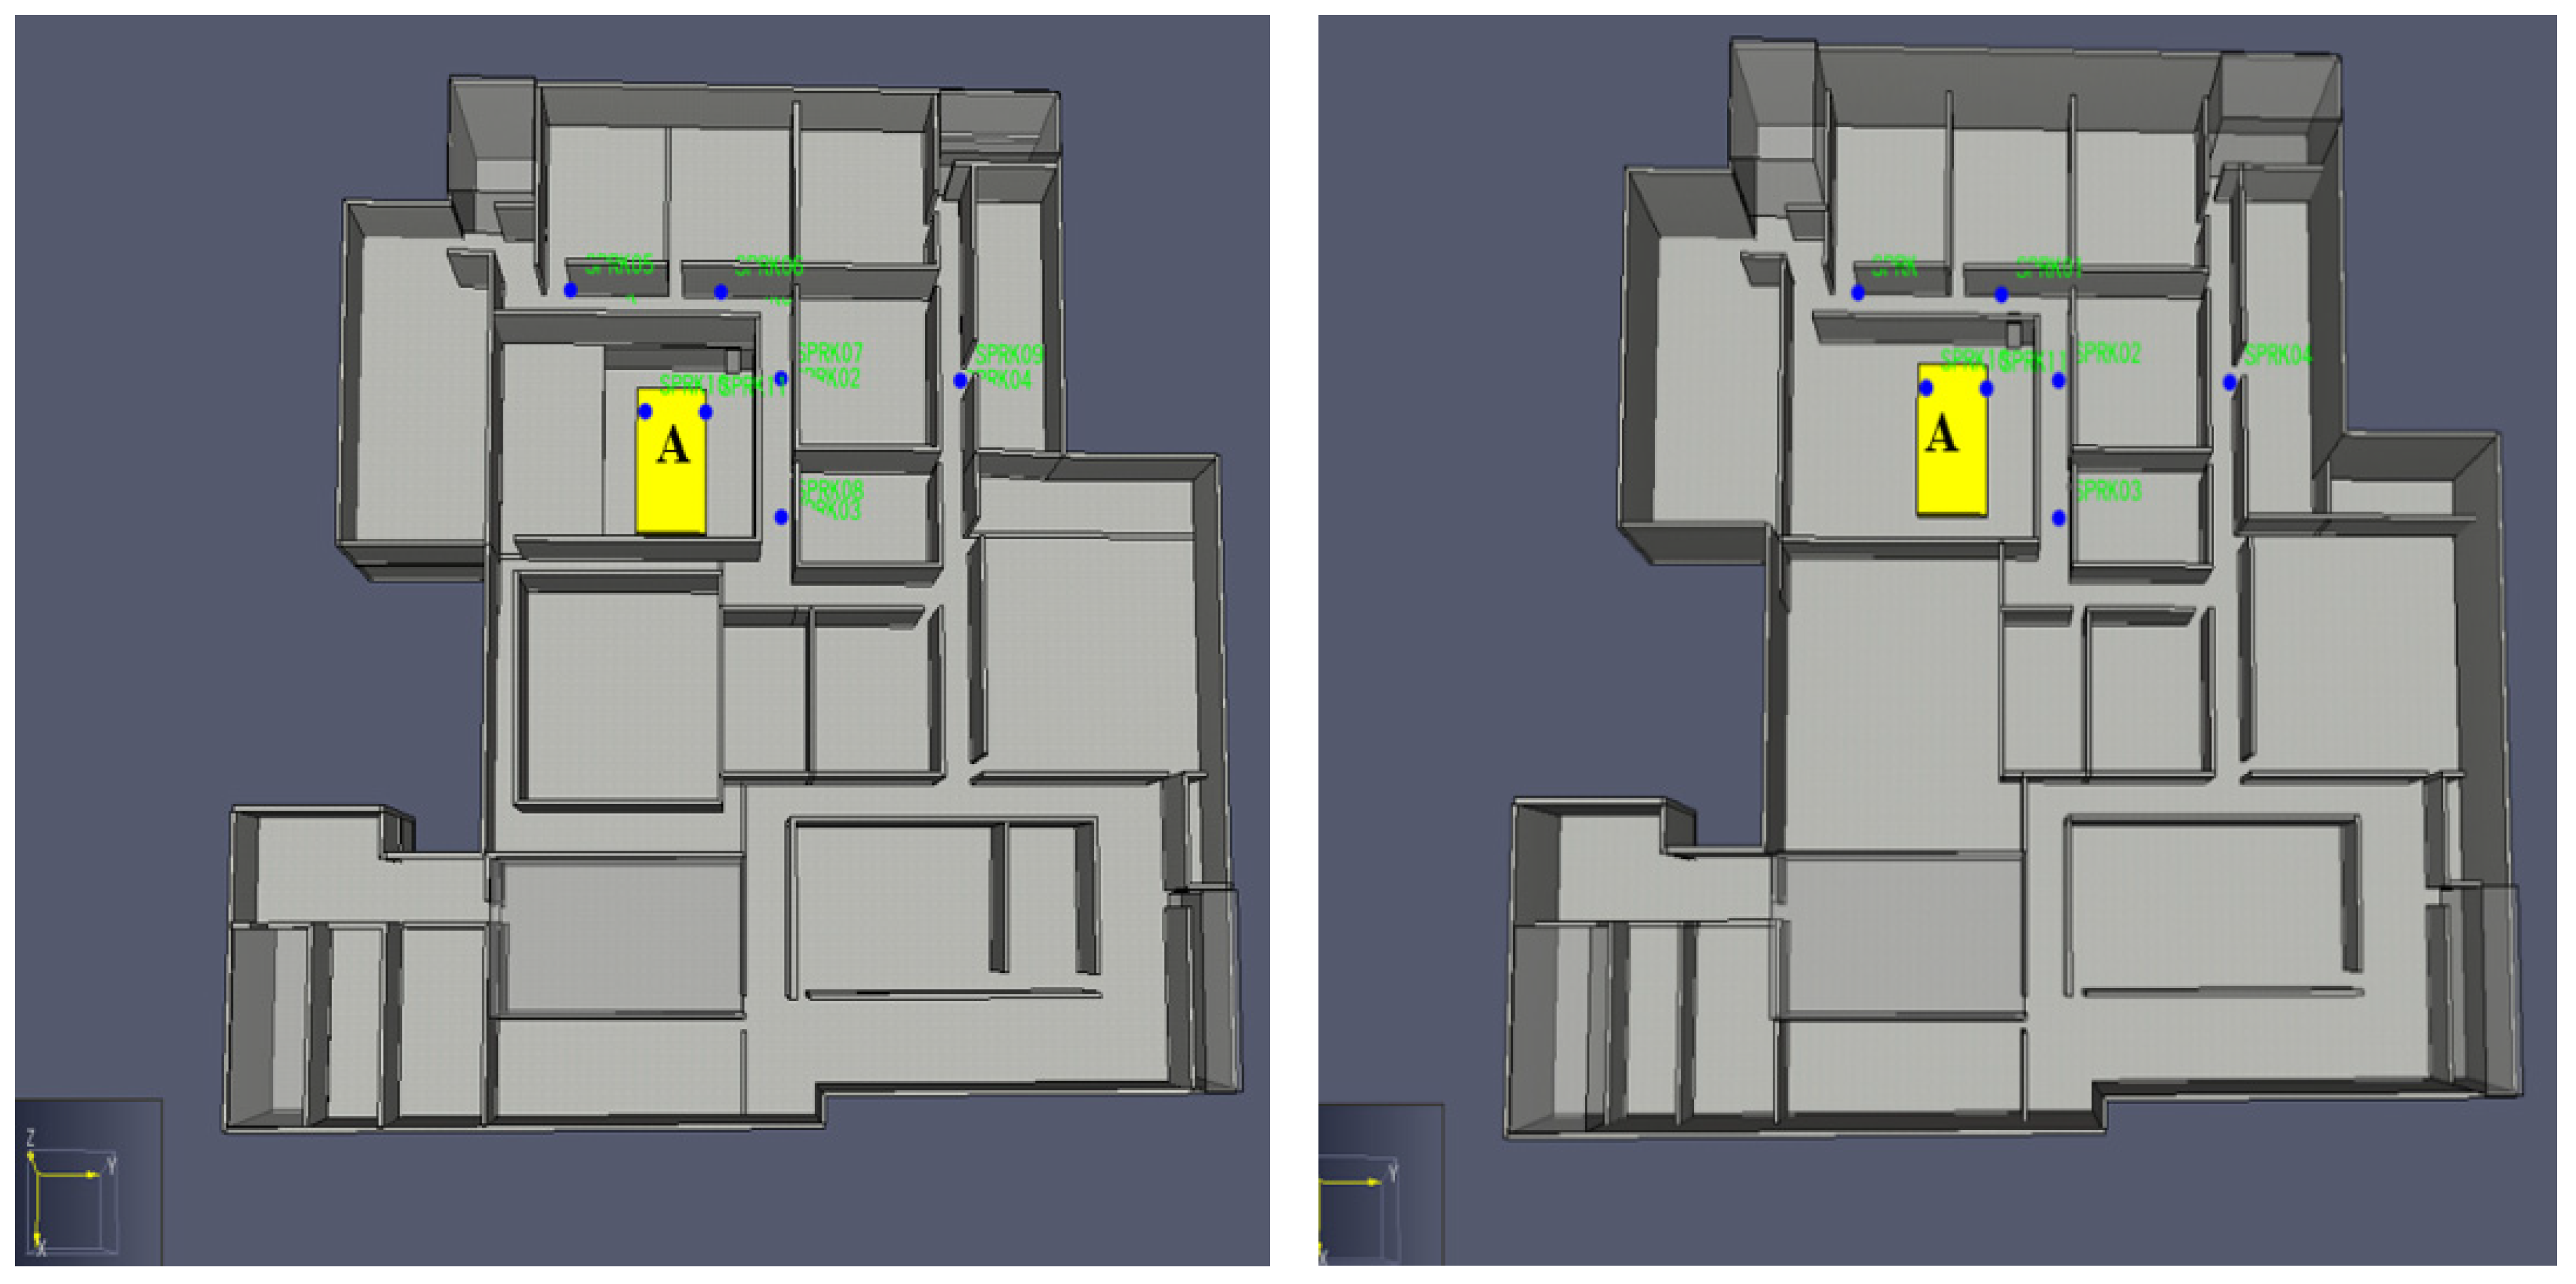
3. Analysis Factors
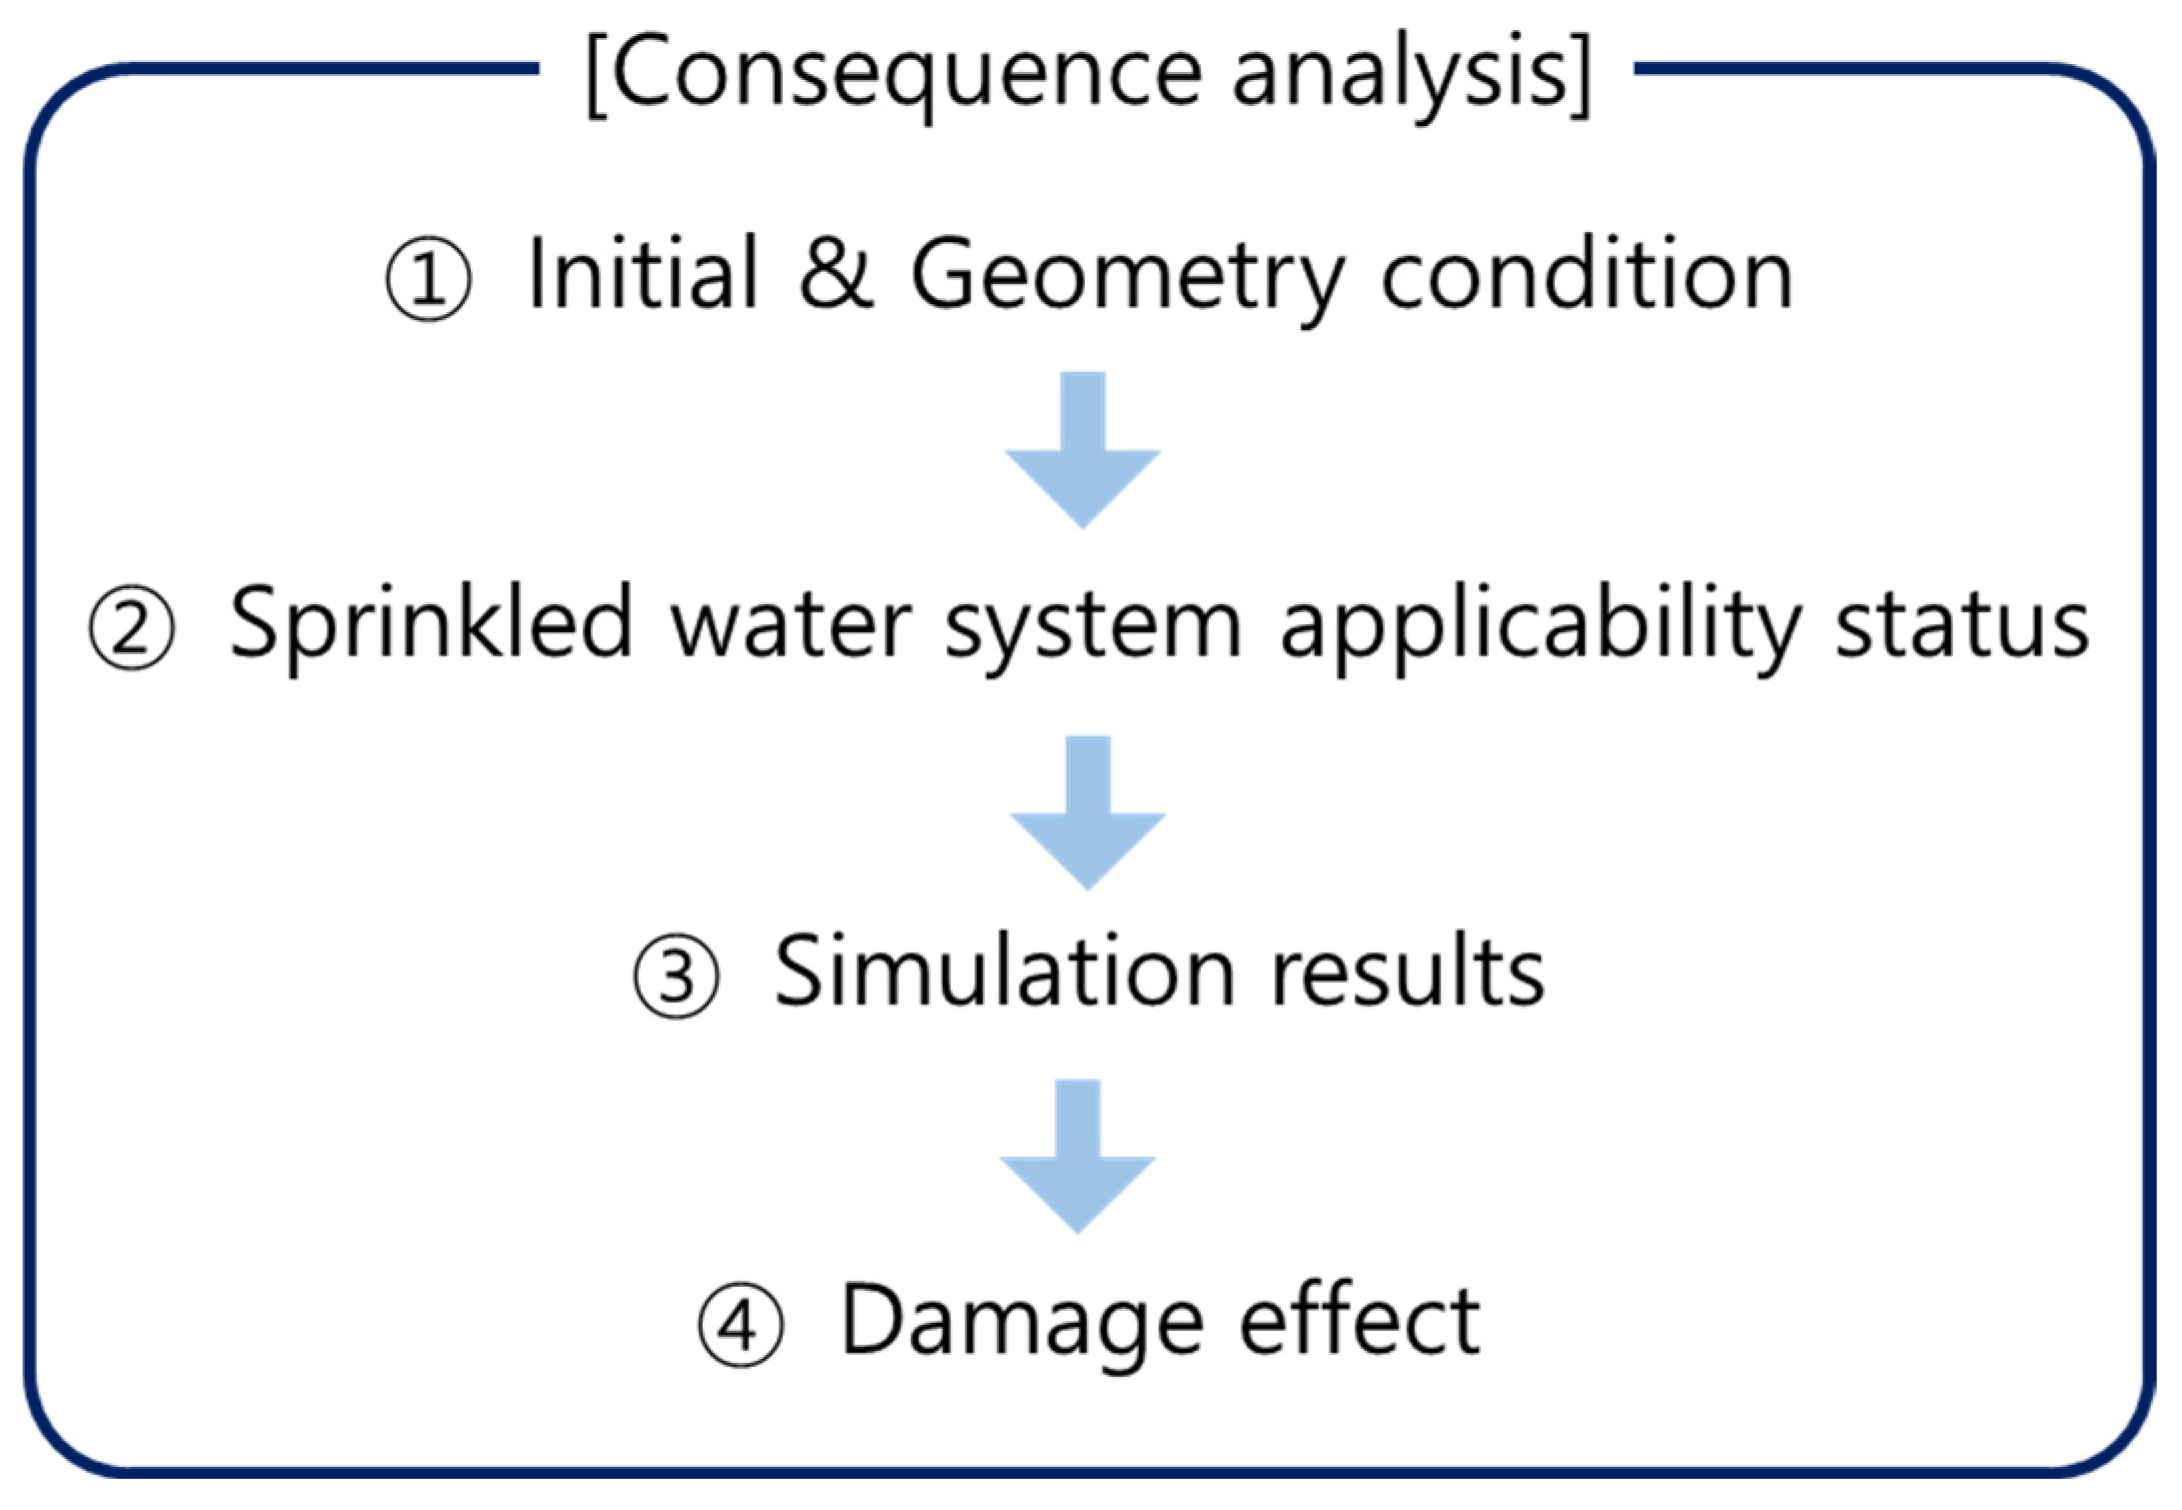
4. Consequence Analysis Simulation Definitions
- (1)
- 3 of kerosene released without sprinkler
- (2)
- 3 of kerosene released with sprinkler
- (3)
- 10 of kerosene released without sprinkler
- (4)
- 10 of kerosene released with sprinkler
5. Simulation Results
5.1. 3 of Kerosene Released without Sprinkler
5.2. 3 of Kerosene Is Released with Sprinkler
5.3. 10 of Kerosene Released without Sprinkler
5.4. 10 Kerosene Release with Sprinkler
6. Conclusions and Discussion
Author Contributions
Funding
Institutional Review Board Statement
Informed Consent Statement
Data Availability Statement
Acknowledgments
Conflicts of Interest
Nomenclature
| Water flow rate coefficient | |
| Kerosene density | |
| External force | |
| Stress Tensor | |
| Gravitational force | |
| Water Volume Fraction | |
| Enthalpy | |
| Fuel Constant | |
| Pressure | |
| Water Impining Coefficient | |
| Total Heat Release Rate | |
| Viscosity | |
| Water Flow Rate Coefficient | |
| HRR from combustion | |
| Temperature | |
| Heat of Vaporization | |
| Gas Temperature | |
| Conductive and Radiative Heat Transfer | |
| Link Temperature | |
| Prandtl Number | |
| Sprinkler tip temperature | |
| Schmidt Number | |
| Velocity | |
| Grid Cell Coefficient |
References
- Altavilla, A.; Garbellini, L. Risk assessment in the aerospace industry. Saf. Sci. 2002, 40, 271–298. [Google Scholar] [CrossRef]
- Padiha, D.; Butt, C.; Tisato, J.; Wilson, S. The Australian approach to ground population modelling and risk assessment. In Proceedings of the 4th IAASS Workshop on Launch and Re-Entry Safety, Chincoteague, VA, USA, 18 September 2012; pp. 1–6. Available online: https://www.semanticscholar.org/paper/THE-AUSTRALIAN-APPROACH-TO-GROUND-POPULATION-AND-Padilha-Butt/0f3042cca8f4363ba0179a3eaeb7e440198fd656 (accessed on 13 March 2022).
- Lariviere, M.; Kezirian, M.T. Preliminary safety assessment of the DLR SpaceLiner vehicle. J. Space Saf. Eng. 2019, 6, 15–23. [Google Scholar] [CrossRef]
- Jeon, G.Y.; Na, W.J.; Hong, W.H. A study on the prediction of evacuation behavior through virtual-reality simulation for an evacuation simulation in underground spaces. Korea Inst. Archit. Sustain. Environ. Build. Syst. 2007, 1, 36–42. [Google Scholar]
- Park, J.K.; Roh, S.K.; Seo, Y.M. A Study on the Risk Assessment System of the Underground Space. J. Korean Inst. Fire Sci. Eng. 2002, 16, 70–74. [Google Scholar]
- Ronchi, E.; Alvear, D.; Berloco, N.; Capote, J.; Colonna, P.; Cuesta, A. Human Behavior In Road Tunnel Fires: Comparison Between Egress Models (FDS+Evac, STEPS, Pathfinder). In Proceedings of the 12th International Interflam 2010 Conference, Nottingham, UK, 5–7 July 2010. [Google Scholar]
- Nakakuki, A. Heat transfer in hot-zone-forming pool fires. Combust. Flame 1997, 109, 353–369. [Google Scholar] [CrossRef]
- Park, H.-J.; Cha, J.-H. Combustion Characteristics of Pool Fire by Height of Fire Source. J. Korea Acad. Ind. Coop. Soc. 2010, 11, 4671–4676. [Google Scholar]
- Ministry of Public Administration and Security. The Framework Act on Firefighting Services, 2022. Available online: https://elaw.klri.re.kr/kor_service/lawView.do?hseq=60700&lang=ENG (accessed on 20 November 2022).
- Chi, J.-H.; Wu, S.-H.; Shu, C.-M. Using Fire Dynamics Simulator to Reconstruct a Hydroelectric Power Plant Fire Accident. J. Forensic Sci. 2011, 56, 1639–1644. [Google Scholar] [CrossRef]
- McGrattan, K.; McDermott, R.; Weinschenk, C.; Forney, G. Fire Dynamics Simulator, Technical Reference Guide; National Institute of Standards and Technology: Gaithersburg, MD, USA, 2013.
- McGrattan, K.; McDermott, R.; Weinschenk, C.; Overholt, K. Fire Dynamics Simulator User’s Guide; National Institute of Standards and Technology: Gaithersburg, MD, USA, 2013.
- Kim, S.-C. A Numerical Study of the Effect of Sprinkler Spray on the Flow Characteristics Induced by Fire. J. Korean Inst. Fire Sci. Eng. 2012, 26, 105–110. [Google Scholar] [CrossRef]
- Ko, G.H. Estimation of FDS Prediction Performance on the Operation of Water-Mist. J. Korea Acad. Coop. Soc. 2014, 15, 4809–4814. [Google Scholar]
- Kim, J.H.; Kim, W.H.; Lee, S.K. A comparison of the prediction of sprinkler response time applying fire models. Korean Inst. Fire Sci. Eng. 2001, 15, 46–52. [Google Scholar]
- Kim, S.-C. Activation Conditions of Sprinkler Head Considering Fire Growth Scenario. Fire Sci. Eng. 2020, 34, 45–51. [Google Scholar] [CrossRef]
- Lee, S.; Landucci, G.; Reniers, G.; Paltrinieri, N. Validation of Dynamic Risk Analysis Supporting Integrated Operations Across Systems. Sustainability 2019, 11, 6745. [Google Scholar] [CrossRef]
- Goerlandt, F.; Khakzad, N.; Reniers, G. Validity and validation of safety-related quantitative risk analysis: A review. Saf. Sci. 2017, 99, 127–139. [Google Scholar] [CrossRef]
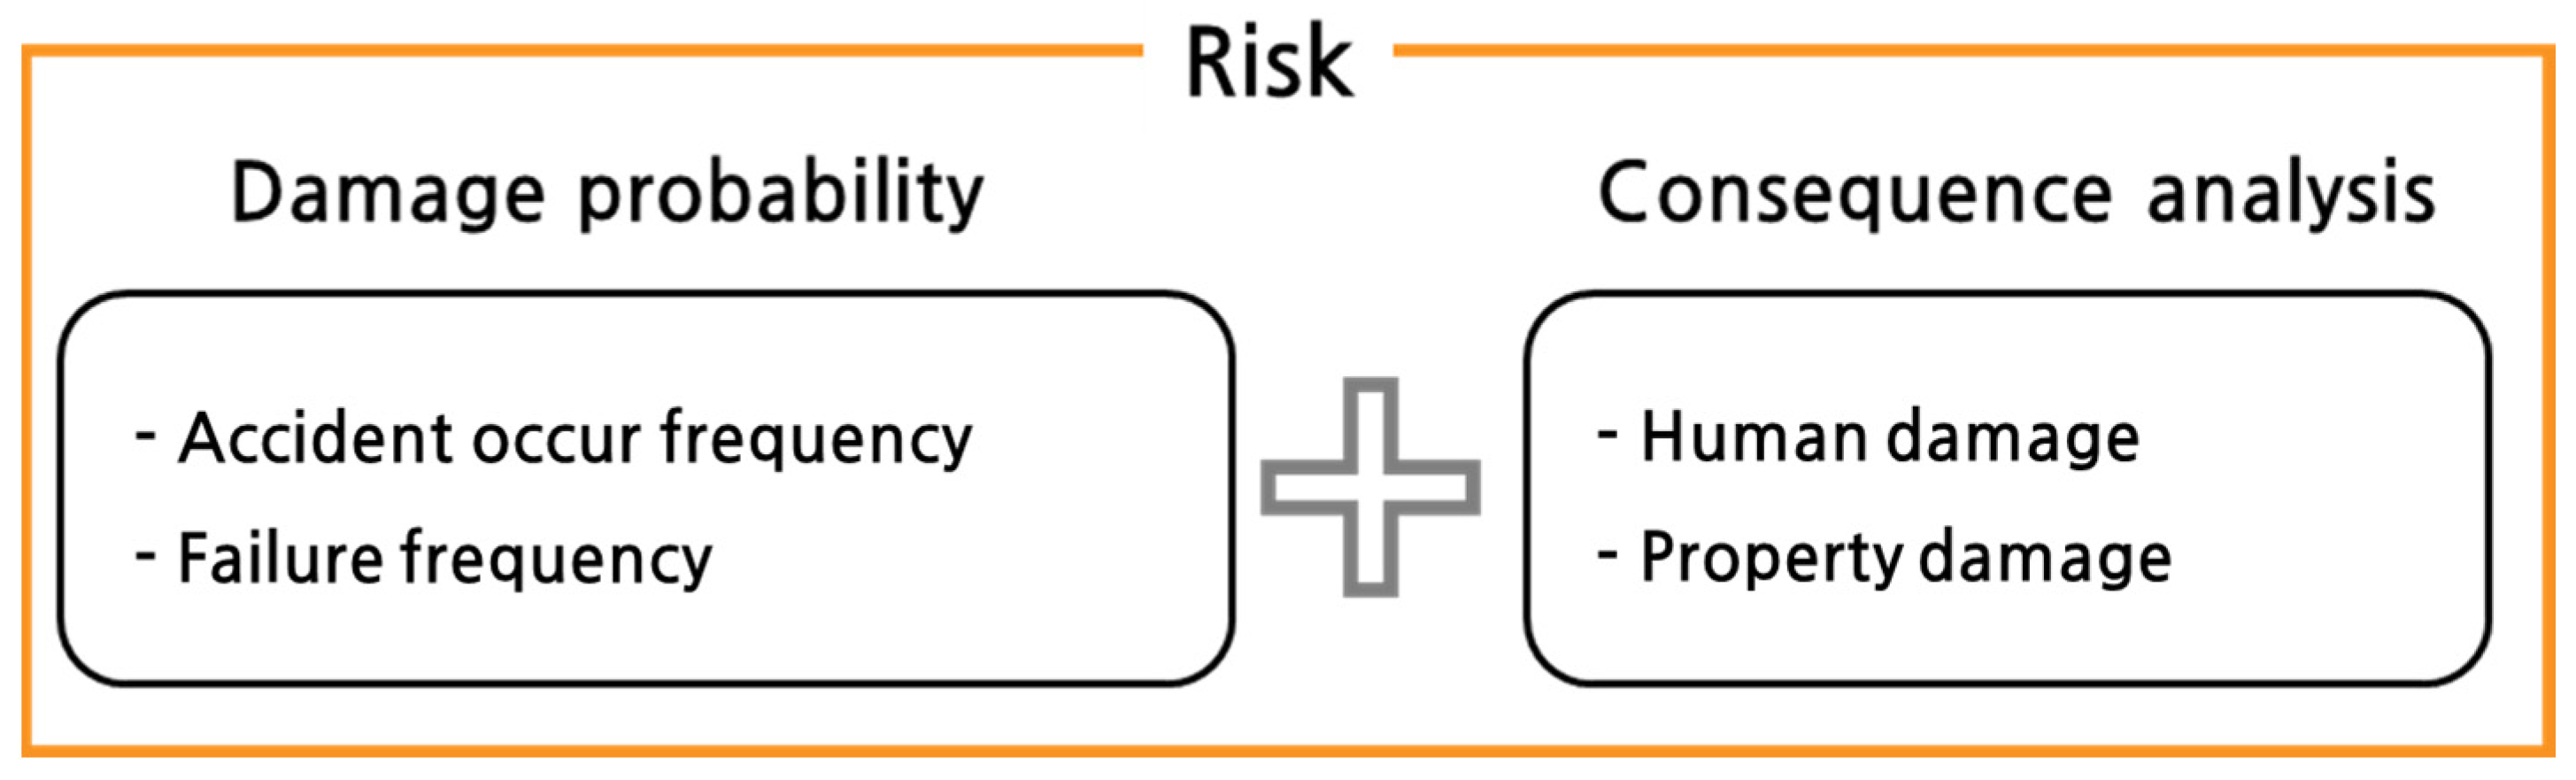
- Burt, B.A. Definitions of risk. J. Dent. Educ. 2001, 65, 1007–1008. [Google Scholar] [CrossRef] [PubMed]
- Kaplan, S.; Garrick, B.J. On the quantitative definition of risk. Risk Anal. 1981, 1, 11–27. [Google Scholar] [CrossRef]
- Korea Safety and Health Corporation: Occupational Safety and Health Act 2020. Available online: https://elaw.klri.re.kr/kor_service/lawView.do?hseq=55395&lang=ENG (accessed on 12 August 2021).
- Vasanth, S.; Tauseef, S.; Abbasi, T.; Abbasi, S. Assessment of four turbulence models in simulation of large-scale pool fires in the presence of wind using computational fluid dynamics (CFD). J. Loss Prev. Process. Ind. 2013, 26, 1071–1084. [Google Scholar] [CrossRef]
- Kim, S.-C. Predicting the Mass Burning Flux of Methanol Pool Fires by Using FDS Model. Fire Sci. Eng. 2017, 31, 12–18. [Google Scholar] [CrossRef]
- Jaebum, K.; Jaemoon, L.; Sehong, M. Study of the Reliability of the FDS Fire Model by Verification Experiments. J. Korean Soc. Hazard Mitig. 2019, 19, 197–203. [Google Scholar]
- Liu, Z.; Kim, A.K.; Carpenter, D. A study of portable water mist fire extinguishers used for extinguishment of multiple fire types. Fire Saf. J. 2007, 42, 25–42. [Google Scholar] [CrossRef]
- Sun, B.; Guo, K.; Pareek, V.K. Computational fluid dynamics simulation of LNG pool fire radiation for hazard analysis. J. Loss Prev. Process. Ind. 2014, 29, 92–102. [Google Scholar] [CrossRef]
- Kim, M.B.; Jang, Y.J.; O Yoon, M. Extinction limit of a pool fire with a water mist. Fire Saf. J. 1997, 28, 295–306. [Google Scholar] [CrossRef]
- Mishra, K.B. Experimental Investigation and CFD Simulation for Organic Peroxide Pool Fires (TBPB and TBPEH); BAM: Berlin, Germany, 2010. [Google Scholar]
- Roh, J.S.; Ryou, H.S.; Park, W.H.; Jang, Y.J. CFD simulation and assessment of life safety in a subway train fire. Tunn. Undergr. Space Technol. 2009, 24, 447–453. [Google Scholar] [CrossRef]
- Yoo, J.H.; Kim, B.S.; Lee, H.S.; Ko, E.S.; Lee, G.B. A study on consequence analysis of LNG/LPG/Gasoline station. J. Korean Inst. Gas 2009, 13, 54–60. [Google Scholar]
- Yang, P.; Tan, X.; Xin, W. Experimental study and numerical simulation for a storehouse fire accident. Build. Environ. 2011, 46, 1445–1459. [Google Scholar] [CrossRef]
- Wen, J.; Kang, K.; Donchev, T.; Karwatzki, J. Validation of FDS for the prediction of medium-scale pool fires. Fire Saf. J. 2007, 42, 127–138. [Google Scholar] [CrossRef]
- Hong, T.-K.; Roh, B.-S.; Park, S.-H. A Study on the Characteristics of FDS Heat Release Rate Predictions for Fire involving Solid Combustible Materials in a Closed Compartment. J. Korea Acad.-Ind. Coop. Soc. 2020, 21, 349–356. [Google Scholar]
- Magee, J.W.; Bruno, T.J.; Friend, D.G.; Huber, M.L.; Laesecke, A.; Lemmon, E.W.; McLinden, M.O.; Perkins, R.A.; Baranski, J.; Widegren, J.A. Thermophysical Properties Measurements and Models for Rocket Propellant RP-1: Phase I. National Institute of Standards and Technology (NIST), USA. 2007. Available online: https://nvlpubs.nist.gov/nistpubs/Legacy/IR/nistir6646.pdf/ (accessed on 27 December 2021).
- Vukadinovic, V.; Habisreuther, P.; Zarzalis, N. Influence of pressure and temperature on laminar burning velocity and Markstein number of kerosene Jet A-1: Experimental and numerical study. Fuel 2013, 111, 401–410. [Google Scholar] [CrossRef]
- Zhang, M.; Hu, Z.; He, G.; Liu, P. Large-eddy simulation of kerosene spray combustion in a model scramjet chamber. J. Aerosp. Eng. 2010, 224, 949–960. [Google Scholar] [CrossRef]
- Hautman, D.J.; Dryer, F.L.; Schug, K.P.; Glassman, I. A multiple-step overall kinetic mechanism for the oxidation of hydrocarbons. Combust. Sci. Technol. 1981, 25, 219–235. [Google Scholar]


| Physical Properties | Value | Physical Properties | Value |
|---|---|---|---|
| Critical temperature (°C) | 321.45 | Viscosity (N·s/m2 | 0.00164 |
| Boiling point (°C) | 150.82 | Critical pressure (bar) | 22.9 |
| Flammable/toxic | Flammable | Surface tension (N/m) | 0.0275 |
| Molecular weight (g/mol) | 154.74 | Upper flammable limit (%) | 5.6 |
| Lower flammable limit (%) | 0.7 | Density (kg/m3) | 820 |
| Heat of combustion (kJ/kg) | 43,200 | Burning velocity (mm/s) | 0.07 |
Disclaimer/Publisher’s Note: The statements, opinions and data contained in all publications are solely those of the individual author(s) and contributor(s) and not of MDPI and/or the editor(s). MDPI and/or the editor(s) disclaim responsibility for any injury to people or property resulting from any ideas, methods, instructions or products referred to in the content. |
© 2023 by the authors. Licensee MDPI, Basel, Switzerland. This article is an open access article distributed under the terms and conditions of the Creative Commons Attribution (CC BY) license (https://creativecommons.org/licenses/by/4.0/).
Share and Cite
Kim, H.J.; Jang, K.M.; Yeo, I.S.; Oh, H.Y.; Kang, S.I.; Jung, E.S. An FDS Simulation to Predict the Kerosene Pool Fire Results at Rocket Launchpad Basement Facilities in the Republic of Korea. Fire 2023, 6, 385. https://doi.org/10.3390/fire6100385
Kim HJ, Jang KM, Yeo IS, Oh HY, Kang SI, Jung ES. An FDS Simulation to Predict the Kerosene Pool Fire Results at Rocket Launchpad Basement Facilities in the Republic of Korea. Fire. 2023; 6(10):385. https://doi.org/10.3390/fire6100385
Chicago/Turabian StyleKim, Hee Jin, Kyeong Min Jang, In Seok Yeo, Hwa Young Oh, Sun Il Kang, and Eun Sang Jung. 2023. "An FDS Simulation to Predict the Kerosene Pool Fire Results at Rocket Launchpad Basement Facilities in the Republic of Korea" Fire 6, no. 10: 385. https://doi.org/10.3390/fire6100385
APA StyleKim, H. J., Jang, K. M., Yeo, I. S., Oh, H. Y., Kang, S. I., & Jung, E. S. (2023). An FDS Simulation to Predict the Kerosene Pool Fire Results at Rocket Launchpad Basement Facilities in the Republic of Korea. Fire, 6(10), 385. https://doi.org/10.3390/fire6100385